Exhibit 99.2
PennyMac Mortgage Investment Trust Third Quarter 2010 Earnings Report November 3, 2010 |
Forward-Looking Statements This presentation contains forward-looking statements within the meaning of Section 21E of the Securities Exchange Act of 1934, as amended, regarding management’s beliefs, estimates, projections and assumptions with respect to, among other things, the Company’s financial results, future operations, business plans and investment strategies, as well as industry and market conditions, all of which are subject to change. Words like “believe,” “expect,” “anticipate,” “promise,” “plan,” and other expressions or words of similar meanings, as well as future or conditional verbs such as “will,” “would,” “should,” “could,” or “may” are generally intended to identify forward-looking statements. Actual results and operations for any future period may vary materially from those projected herein and from past results discussed herein. Factors which could cause actual results to differ materially from historical results or those anticipated include, but are not limited to: changes in general business, economic, market and employment conditions from those expected; continued declines in residential real estate and disruption in the U.S. housing market; the availability of, and level of competition for, attractive risk-adjusted investment opportunities in residential mortgage loans and mortgage-related assets that satisfy our investment objectives and investment strategies; changes in our investment or operational objectives and strategies, including any new lines of business; the concentration of credit risks to which we are exposed; the availability, terms and deployment of short-term and long-term capital; unanticipated increases in financing and other costs, including a rise in interest rates; the performance, financial condition and liquidity of borrowers; increased rates of delinquency or decreased recovery rates on our investments; increased prepayments of the mortgage and other loans underlying our investments; changes in regulations or the occurrence of other events that impact the business, operation or prospects of government sponsored enterprises; changes in government support of homeownership; changes in governmental regulations, accounting treatment, tax rates and similar matters; and our ability to satisfy complex rules in order to qualify as a REIT for U.S. federal income tax purposes. You should not place undue reliance on any forward-looking statement and should consider all of the uncertainties and risks described above, as well as those more fully discussed in reports and other documents filed by the Company with the Securities and Exchange Commission from time to time. The Company undertakes no obligation to publicly update or revise any forward-looking statements or any other information contained herein, and the statements made in this presentation are current as of the date of this presentation only. 1 |
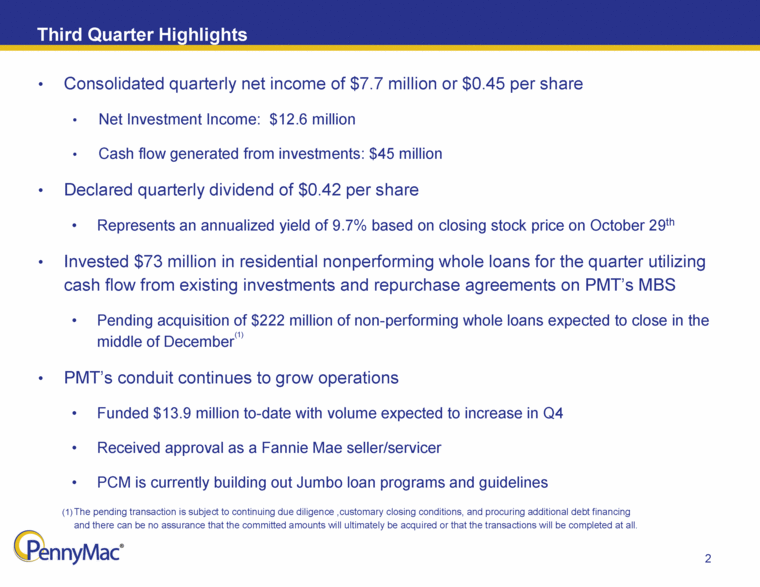
Third Quarter Highlights 2 Consolidated quarterly net income of $7.7 million or $0.45 per share Net Investment Income: $12.6 million Cash flow generated from investments: $45 million Declared quarterly dividend of $0.42 per share Represents an annualized yield of 9.7% based on closing stock price on October 29th Invested $73 million in residential nonperforming whole loans for the quarter utilizing cash flow from existing investments and repurchase agreements on PMT’s MBS Pending acquisition of $222 million of non-performing whole loans expected to close in the middle of December(1) PMT’s conduit continues to grow operations Funded $13.9 million to-date with volume expected to increase in Q4 Received approval as a Fannie Mae seller/servicer PCM is currently building out Jumbo loan programs and guidelines The pending transaction is subject to continuing due diligence, customary closing conditions, and procuring additional debt financing and there can be no assurance that the committed amounts will ultimately be acquired or that the transactions will be completed at all. |
PMT’s Investment Activity & Strategy |
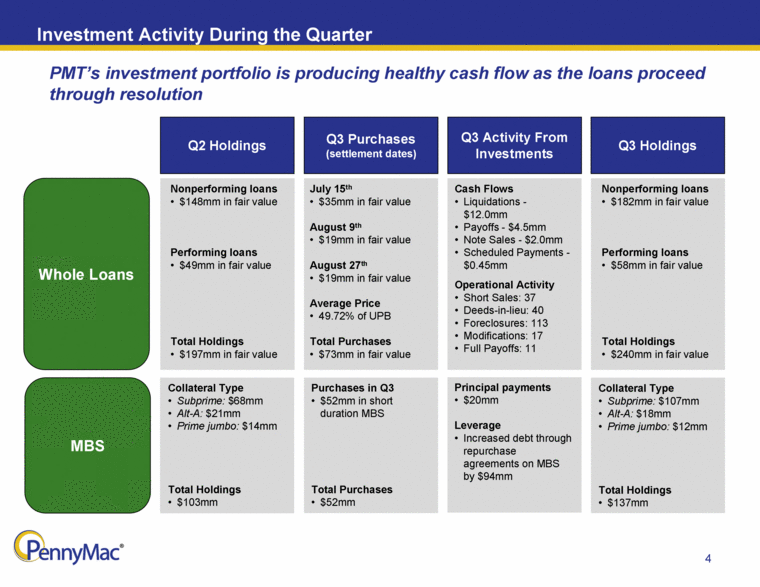
Collateral Type Subprime: $68mm Alt-A: $21mm Prime jumbo: $14mm Total Holdings $103mm Investment Activity During the Quarter 4 Q2 Holdings Q3 Activity From Investments Q3 Purchases (settlement dates) Q3 Holdings Whole Loans MBS Nonperforming loans $148mm in fair value Performing loans $49mm in fair value Total Holdings $197mm in fair value Cash Flows Liquidations - $12.0mm Payoffs - $4.5mm Note Sales - $2.0mm Scheduled Payments - $0.45mm Operational Activity Short Sales: 37 Deeds-in-lieu: 40 Foreclosures: 113 Modifications: 17 Full Payoffs: 11 July 15th $35mm in fair value August 9th $19mm in fair value August 27th $19mm in fair value Average Price 49.72% of UPB Total Purchases $73mm in fair value Nonperforming loans $182mm in fair value Performing loans $58mm in fair value Total Holdings $240mm in fair value Principal payments $20mm Leverage Increased debt through repurchase agreements on MBS by $94mm Purchases in Q3 $52mm in short duration MBS Total Purchases $52mm Collateral Type Subprime: $107mm Alt-A: $18mm Prime jumbo: $12mm Total Holdings $137mm PMT’s investment portfolio is producing healthy cash flow as the loans proceed through resolution |
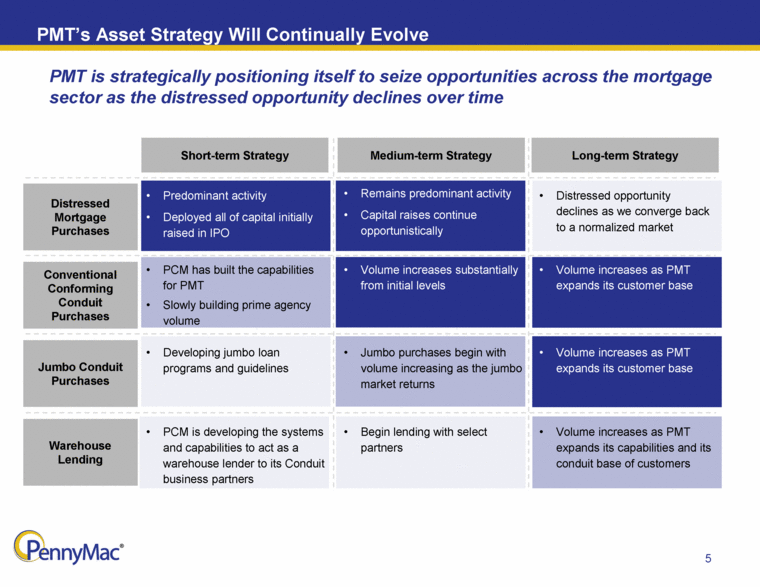
PMT’s Asset Strategy Will Continually Evolve 5 Short-term Strategy Medium-term Strategy Long-term Strategy Distressed Mortgage Purchases Conventional Conforming Conduit Purchases Predominant activity Deployed all of capital initially raised in IPO PCM has built the capabilities for PMT Slowly building prime agency volume Remains predominant activity Capital raises continue opportunistically Volume increases substantially from initial levels Distressed opportunity declines as we converge back to a normalized market Volume increases as PMT expands its customer base Jumbo Conduit Purchases Warehouse Lending Developing jumbo loan programs and guidelines Jumbo purchases begin with volume increasing as the jumbo market returns Volume increases as PMT expands its customer base PCM is developing the systems and capabilities to act as a warehouse lender to its Conduit business partners Begin lending with select partners Volume increases as PMT expands its capabilities and its conduit base of customers PMT is strategically positioning itself to seize opportunities across the mortgage sector as the distressed opportunity declines over time |
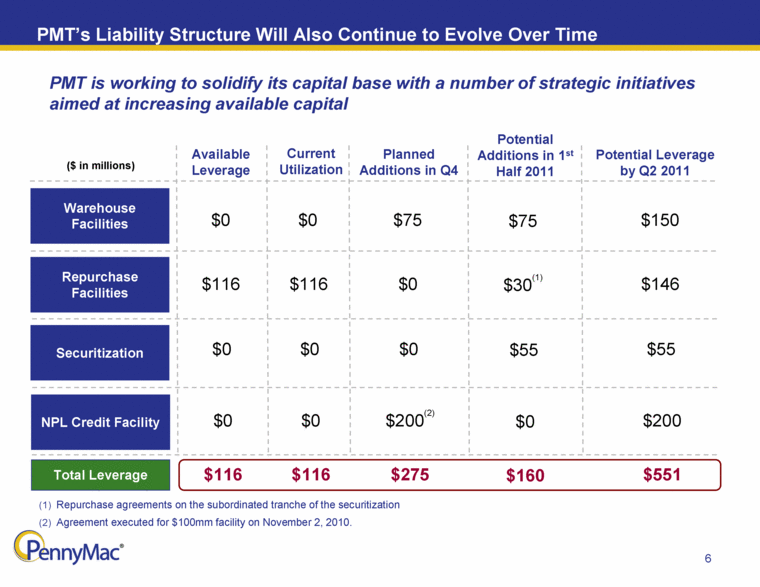
PMT’s Liability Structure Will Also Continue to Evolve Over Time 6 Securitization Repurchase Facilities Warehouse Facilities NPL Credit Facility Available Leverage Current Utilization Planned Additions in Q4 Potential Leverage by Q2 2011 $0 $0 $75 $150 $116 $116 $0 $146 $0 $0 $0 $55 $0 $0 $200(2) $200 $75 $30(1) $55 $0 Potential Additions in 1st Half 2011 Repurchase agreements on the subordinated tranche of the securitization Agreement executed for $100mm facility on November 2, 2010. ($ in millions) PMT is working to solidify its capital base with a number of strategic initiatives aimed at increasing available capital Total Leverage $116 $116 $275 $551 $160 |
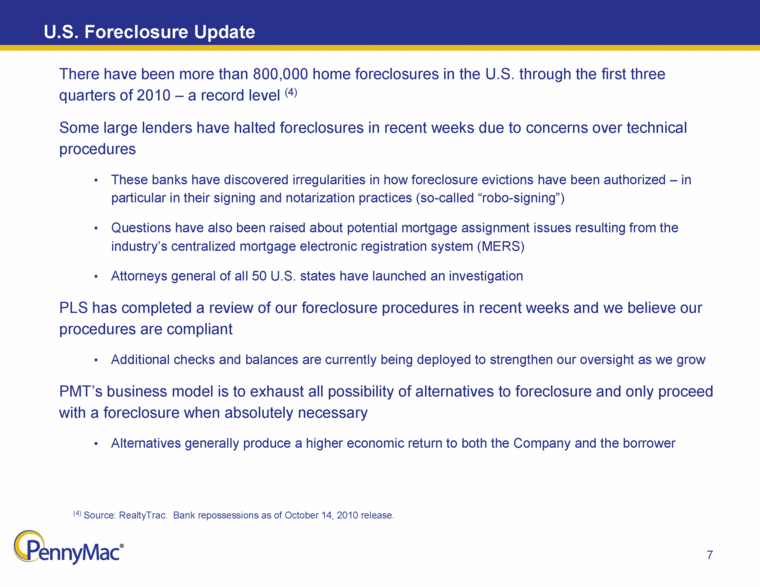
U.S. Foreclosure Update 7 (4) Source: RealtyTrac. Bank repossessions as of October 14, 2010 release. There have been more than 800,000 home foreclosures in the U.S. through the first three quarters of 2010 – a record level (4) Some large lenders have halted foreclosures in recent weeks due to concerns over technical procedures These banks have discovered irregularities in how foreclosure evictions have been authorized – in particular in their signing and notarization practices (so-called “robo-signing”) Questions have also been raised about potential mortgage assignment issues resulting from the industry’s centralized mortgage electronic registration system (MERS) Attorneys general of all 50 U.S. states have launched an investigation PLS has completed a review of our foreclosure procedures in recent weeks and we believe our procedures are compliant Additional checks and balances are currently being deployed to strengthen our oversight as we grow PMT’s business model is to exhaust all possibility of alternatives to foreclosure and only proceed with a foreclosure when absolutely necessary Alternatives generally produce a higher economic return to both the Company and the borrower |
Distressed Whole Loan Opportunity |
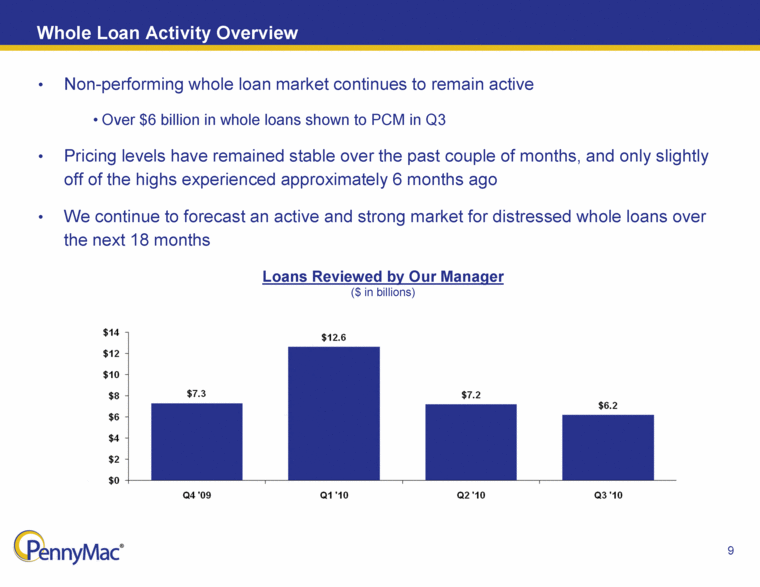
Whole Loan Activity Overview 9 Non-performing whole loan market continues to remain active Over $6 billion in whole loans shown to PCM in Q3 Pricing levels have remained stable over the past couple of months, and only slightly off of the highs experienced approximately 6 months ago We continue to forecast an active and strong market for distressed whole loans over the next 18 months Loans Reviewed by Our Manager ($ in billions) |
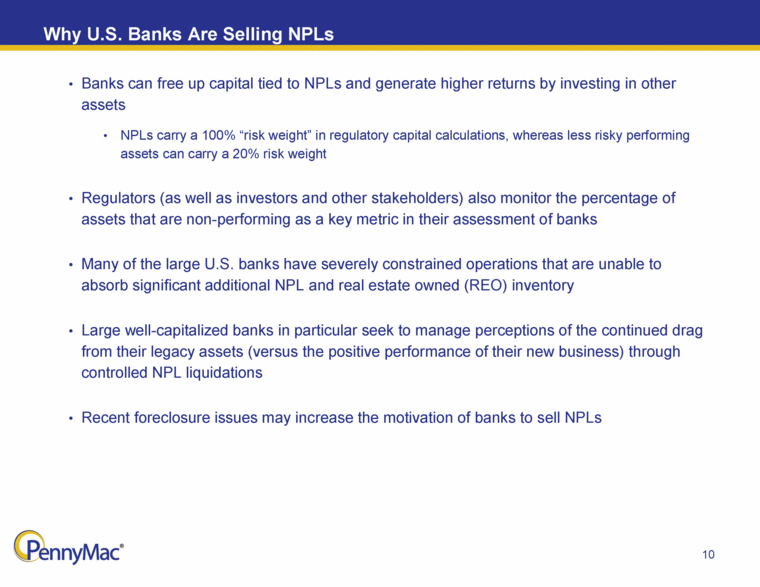
Why U.S. Banks Are Selling NPLs 10 Banks can free up capital tied to NPLs and generate higher returns by investing in other assets NPLs carry a 100% “risk weight” in regulatory capital calculations, whereas less risky performing assets can carry a 20% risk weight Regulators (as well as investors and other stakeholders) also monitor the percentage of assets that are non-performing as a key metric in their assessment of banks Many of the large U.S. banks have severely constrained operations that are unable to absorb significant additional NPL and real estate owned (REO) inventory Large well-capitalized banks in particular seek to manage perceptions of the continued drag from their legacy assets (versus the positive performance of their new business) through controlled NPL liquidations Recent foreclosure issues may increase the motivation of banks to sell NPLs |
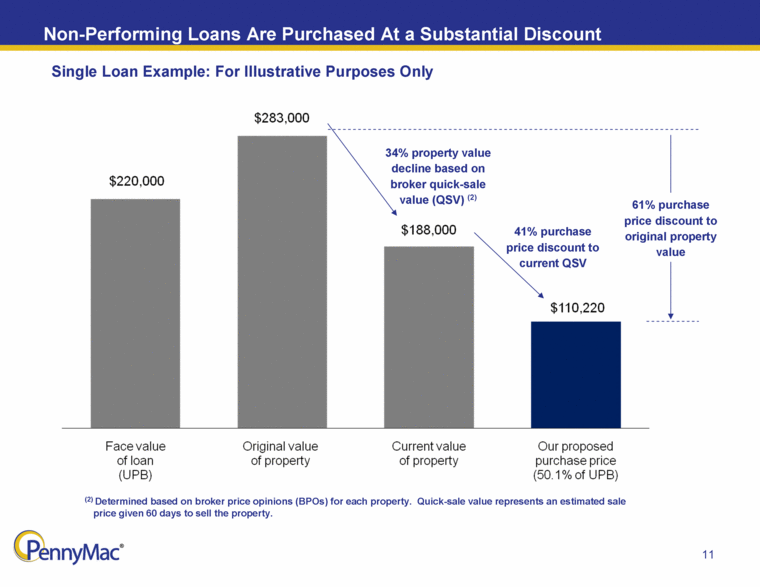
Non-Performing Loans Are Purchased At a Substantial Discount 11 34% property value decline based on broker quick-sale value (QSV) (2) 41% purchase price discount to current QSV 61% purchase price discount to original property value (2) Determined based on broker price opinions (BPOs) for each property. Quick-sale value represents an estimated sale price given 60 days to sell the property. Single Loan Example: For Illustrative Purposes Only |
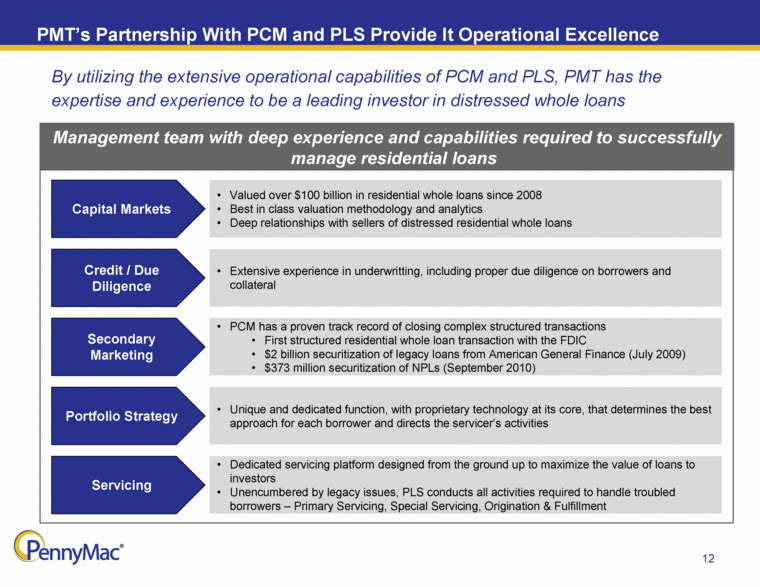
Valued over $100 billion in residential whole loans since 2008 Best in class valuation methodology and analytics Deep relationships with sellers of distressed residential whole loans PMT’s Partnership With PCM and PLS Provide It Operational Excellence 12 By utilizing the extensive operational capabilities of PCM and PLS, PMT has the expertise and experience to be a leading investor in distressed whole loans Credit / Due Diligence Secondary Marketing Portfolio Strategy Servicing Capital Markets Extensive experience in underwritting, including proper due diligence on borrowers and collateral PCM has a proven track record of closing complex structured transactions First structured residential whole loan transaction with the FDIC $2 billion securitization of legacy loans from American General Finance (July 2009) $373 million securitization of NPLs (September 2010) Unique and dedicated function, with proprietary technology at its core, that determines the best approach for each borrower and directs the servicer’s activities Dedicated servicing platform designed from the ground up to maximize the value of loans to investors Unencumbered by legacy issues, PLS conducts all activities required to handle troubled borrowers – Primary Servicing, Special Servicing, Origination & Fulfillment Management team with deep experience and capabilities required to successfully manage residential loans |
Financials |
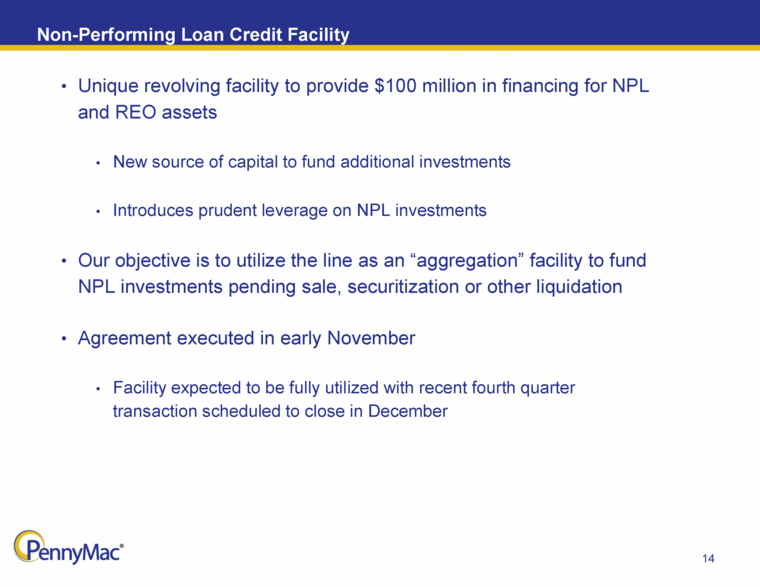
Non-Performing Loan Credit Facility 14 Unique revolving facility to provide $100 million in financing for NPL and REO assets New source of capital to fund additional investments Introduces prudent leverage on NPL investments Our objective is to utilize the line as an “aggregation” facility to fund NPL investments pending sale, securitization or other liquidation Agreement executed in early November Facility expected to be fully utilized with recent fourth quarter transaction scheduled to close in December |
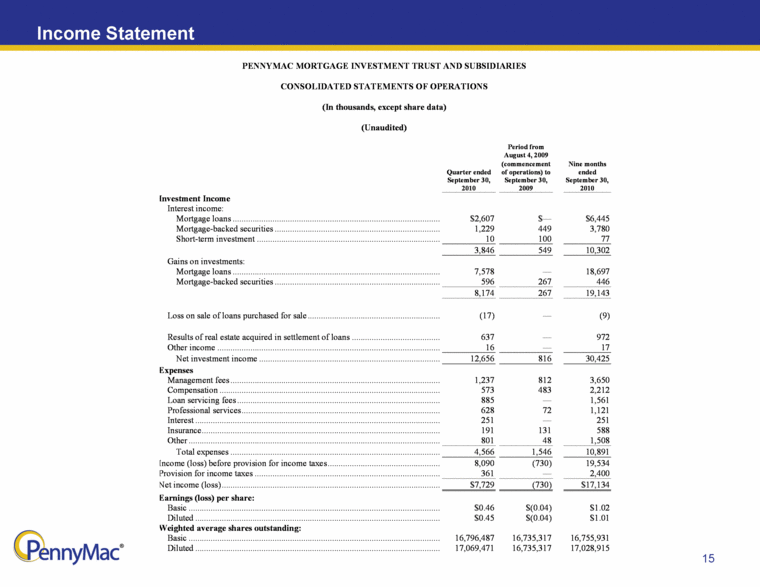
Income Statement 15 PENNYMAC MORTGAGE INVESTMENT TRUST AND SUBSIDIARIES CONSOLIDATED STATEMENTS OF OPERATIONS (In thousands, except share data) (Unaudited) Quarter ended September 30, 2010 Period from August 4, 2009 (commencement of operations) to September 30, 2009 Nine months ended September 30, 2010 Investment Income Interest income: Mortgage loans $2,607 $— $6,445 Mortgage-backed securities 1,229 449 3,780 Short-term investment 10 100 77 3,846 549 10,302 Gains on investments: Mortgage loans 7,578 — 18,697 Mortgage-backed securities 596 267 446 8,174 267 19,143 Loss on sale of loans purchased for sale (17) — (9) Results of real estate acquired in settlement of loans 637 — 972 Other income 16 — 17 Net investment income 12,656 816 30,425 Expenses Management fees 1,237 812 3,650 Compensation 573 483 2,212 Loan servicing fees 885 — 1,561 Professional services 628 72 1,121 Interest 251 — 251 Insurance 191 131 588 Other 801 48 1,508 Total expenses 4,566 1,546 10,891 Income (loss) before provision for income taxes 8,090 (730) 19,534 Provision for income taxes 361 — 2,400 Net income (loss) $7,729 (730) $17,134 Earnings (loss) per share: Basic $0.46 $(0.04) $1.02 Diluted $0.45 $(0.04) $1.01 Weighted average shares outstanding: Basic 16,796,487 16,735,317 16,755,931 Diluted 17,069,471 16,735,317 17,028,915 |
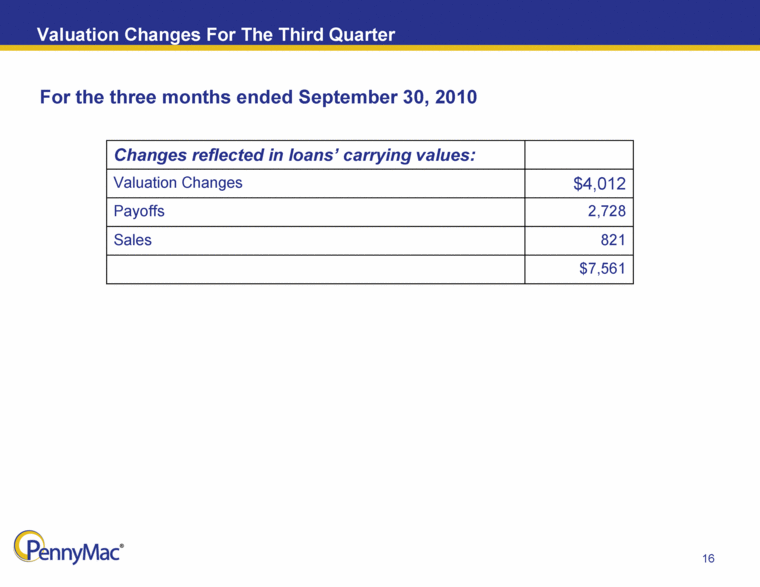
Valuation Changes For The Third Quarter 16 For the three months ended September 30, 2010 Changes reflected in loans’ carrying values: Valuation Changes $4,012 Payoffs 2,728 Sales 821 $7,561 |
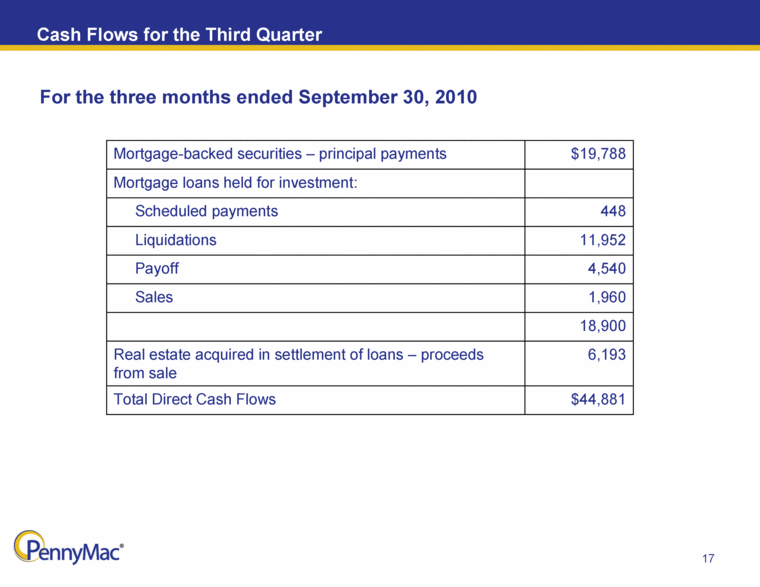
Cash Flows for the Third Quarter 17 For the three months ended September 30, 2010 Mortgage-backed securities – principal payments $19,788 Mortgage loans held for investment: Scheduled payments 448 Liquidations 11,952 Payoff 4,540 Sales 1,960 18,900 Real estate acquired in settlement of loans – proceeds from sale 6,193 Total Direct Cash Flows $44,881 |
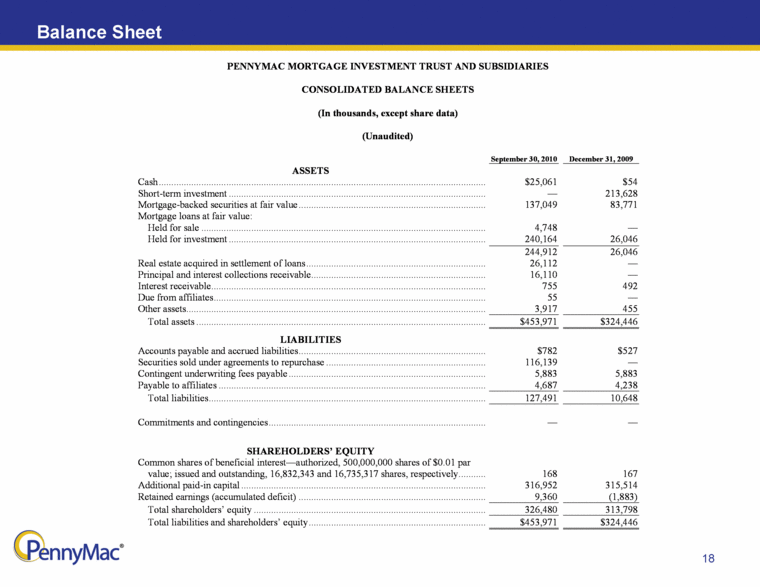
Balance Sheet 18 PENNYMAC MORTGAGE INVESTMENT TRUST AND SUBSIDIARIES CONSOLIDATED BALANCE SHEETS (In thousands, except share data) (Unaudited) September 30, 2010 December 31, 2009 ASSETS Cash $25,061 $54 Short-term investment — 213,628 Mortgage-backed securities at fair value 137,049 83,771 Mortgage loans at fair value: Held for sale 4,748 — Held for investment 240,164 26,046 244,912 26,046 Real estate acquired in settlement of loans 26,112 — Principal and interest collections receivable 16,110 — Interest receivable 755 492 Due from affiliates 55 — Other assets 3,917 455 Total assets $453,971 $324,446 LIABILITIES Accounts payable and accrued liabilities $782 $527 Securities sold under agreements to repurchase 116,139 — Contingent underwriting fees payable 5,883 5,883 Payable to affiliates 4,687 4,238 Total liabilities 127,491 10,648 Commitments and contingencies — — SHAREHOLDERS’ EQUITY Common shares of beneficial interest—authorized, 500,000,000 shares of $0.01 par value; issued and outstanding, 16,832,343 and 16,735,317 shares, respectively 168 167 Additional paid-in capital 316,952 315,514 Retained earnings (accumulated deficit) 9,360 (1,883) Total shareholders’ equity 326,480 313,798 Total liabilities and shareholders’ equity $453,971 $324,446 |
PennyMac Mortgage Investment Trust Third Quarter 2010 Earnings Report November 3, 2010 |