Exhibit 99.2
| PennyMac Mortgage Investment Trust Fourth Quarter 2010 Earnings Report February 2, 2011 |

| Forward-Looking Statements This presentation contains forward-looking statements within the meaning of Section 21E of the Securities Exchange Act of 1934, as amended, regarding management’s beliefs, estimates, projections and assumptions with respect to, among other things, the Company’s financial results, future operations, business plans and investment strategies, as well as industry and market conditions, all of which are subject to change. Words like “believe,” “expect,” “anticipate,” “promise,” “plan,” and other expressions or words of similar meanings, as well as future or conditional verbs such as “will,” “would,” “should,” “could,” or “may” are generally intended to identify forward-looking statements. Actual results and operations for any future period may vary materially from those projected herein, from past results discussed herein, or illustrative examples provided herein. Factors which could cause actual results to differ materially from historical results or those anticipated include, but are not limited to: changes in general business, economic, market and employment conditions from those expected; continued declines in residential real estate and disruption in the U.S. housing market; the availability of, and level of competition for, attractive risk-adjusted investment opportunities in residential mortgage loans and mortgage-related assets that satisfy our investment objectives and investment strategies; changes in our investment or operational objectives and strategies, including any new lines of business; the concentration of credit risks to which we are exposed; the availability, terms and deployment of short-term and long-term capital; unanticipated increases in financing and other costs, including a rise in interest rates; the performance, financial condition and liquidity of borrowers; increased rates of delinquency or decreased recovery rates on our investments; increased prepayments of the mortgage and other loans underlying our investments; changes in regulations or the occurrence of other events that impact the business, operation or prospects of government sponsored enterprises; changes in government support of homeownership; changes in governmental regulations, accounting treatment, tax rates and similar matters; and our ability to satisfy complex rules in order to qualify as a REIT for U.S. federal income tax purposes. You should not place undue reliance on any forward-looking statement and should consider all of the uncertainties and risks described above, as well as those more fully discussed in reports and other documents filed by the Company with the Securities and Exchange Commission from time to time. The Company undertakes no obligation to publicly update or revise any forward-looking statements or any other information contained herein, and the statements made in this presentation are current as of the date of this presentation only. 1 |
| Fourth Quarter Highlights 2 Earned consolidated quarterly net income of $7.3 million, or $0.43 per share Net Investment Income: $13.6 million Cash flow generated from investments: $49 million Significant increase in professional services expenses resulting from a variety of strategic initiatives On December 27th declared quarterly dividend of $0.42 per share Represents an annualized yield of 9.3% based on closing stock price on December 31, 2010 Purchased $148 million in distressed mortgage assets Increased available capital for further asset acquisition Established two NPL credit facilities totaling $225 million in aggregate capacity Established a warehouse facility for PMT’s conduit of $75 million Revenue & Net Income Earnings Per Share & Dividends* (per share) $3.9 $13.9 $12.7 $13.6 *Dividend declared with respect to quarterly earnings. |

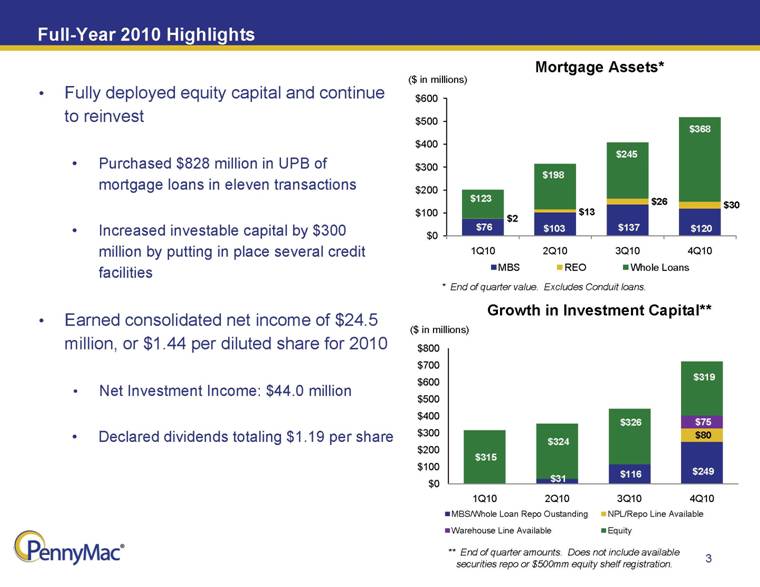
| Full-Year 2010 Highlights 3 Fully deployed equity capital and continue to reinvest Purchased $828 million in UPB of mortgage loans in eleven transactions Increased investable capital by $300 million by putting in place several credit facilities Earned consolidated net income of $24.5 million, or $1.44 per diluted share for 2010 Net Investment Income: $44.0 million Declared dividends totaling $1.19 per share Mortgage Assets* Growth in Investment Capital** ** End of quarter amounts. Does not include available securities repo or $500mm equity shelf registration. * End of quarter value. Excludes Conduit loans. |
| Outlook For 2011 4 Distressed Whole Loans Opportunities to acquire distressed whole loans expected to continue throughout the year Banks continue improving their ratios through strategic sales of whole loans Re-performing whole loans may become more attractive investments PMT’s capital and operating structures provide it an advantage in purchasing whole loans PMT is aiming to complete its first term-financing of non-performing loans in the 1st half of 2011 Mortgage-Backed Securities PMT’s purchases of unique, cash flowing, front-pay bonds continue opportunistically Conduit Expect to continue rolling out PMT’s Jumbo loan offering through the conduit as we continue to sign up correspondent partners and work with investors Leverage PMT will attempt to utilize prudent leverage throughout the year |

| PMT’s Investment Activity & Strategy |

| Investment Activity Overview 6 Mortgage Whole Loans Completed transaction of $146 million of non-performing whole loans in the fourth quarter Reduced volume of mortgage loans reviewed in the fourth quarter, as expected Increased volume expected in the first quarter Operationalized two credit facilities to finance NPLs and REO Pending investment of $69 million in non-performing whole loans expected to close in the middle of February(1) Mortgage-Backed Securities Acquired $2 million of front pay bonds opportunistically in the fourth quarter Conduit 53 client applications in process, 14 approved to-date Continue to purchase conventional conforming loans Key focus is on the Jumbo product offering Technical and personnel resources in place to offer a full array of products (1) The pending transaction is subject to continuing due diligence, customary closing conditions, and procuring additional debt financing and there can be no assurance that the committed amount will ultimately be acquired or that the transaction will be completed at all. |

| Investment Activity During the Quarter 7 Q3 Holdings Q4 Activity From Investments Q4 Purchases Q4 Holdings Whole Loans Nonperforming Loans $182mm in fair value Performing Loans $58mm in fair value Total Holdings $240mm in fair value Cash Flows Scheduled Payments - $0.2mm Payoffs - $2.8mm Liquidations - $10.9mm Note Sales - $2.4mm Interest - $1.1mm Operational Activity* Full Payoffs: $2.8mm Modifications: $3.9mm Short Sales: $13.9mm Deeds-in-lieu: $2.1mm Foreclosures: $26.4mm REO Sale: $17.3mm December 17th $146mm in fair value Average Price 52.7% of UPB Total Purchases $147mm in fair value Nonperforming Loans $278mm in fair value Performing Loans $86mm in fair value Total Holdings $364mm in fair value PMT’s investment portfolio is producing steady cash flow as the loans proceed through resolution MBS Collateral Type Subprime: $107mm Alt-A: $18mm Prime jumbo: $12mm Total Holdings $137mm Principal payments $19.9mm Interest payments $0.4mm Purchases in Q4 $2mm in front pay bonds Total Purchases $2mm Collateral Type Subprime: $94mm Alt-A: $16mm Prime jumbo: $10mm Total Holdings $120mm *Operational activity represented as unpaid principal balance |
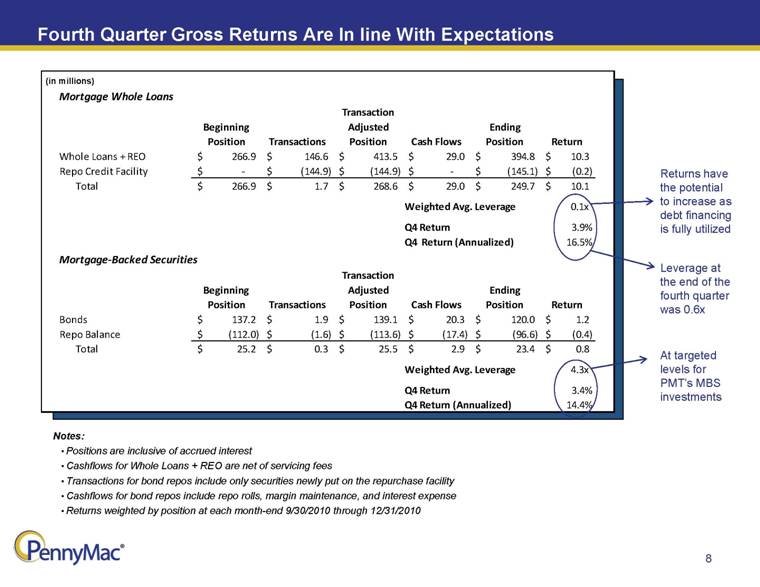
| Fourth Quarter Gross Returns Are In line With Expectations 8 Returns have the potential to increase as debt financing is fully utilized Notes: Positions are inclusive of accrued interest Cashflows for Whole Loans + REO are net of servicing fees Transactions for bond repos include only securities newly put on the repurchase facility Cashflows for bond repos include repo rolls, margin maintenance, and interest expense Returns weighted by position at each month-end 9/30/2010 through 12/31/2010 At targeted levels for PMT’s MBS investments (in millions) Leverage at the end of the fourth quarter was 0.6x Mortgage Whole Loans Beginning Position Transactions Transaction Adjusted Position Cash Flows Ending Position Return Whole Loans + REO 266.9 $ 146.6 $ 413.5 $ 29.0 $ 394.8 $ 10.3 $ Repo Credit Facility - $ (144.9) $ (144.9) $ - $ (145.1) $ (0.2) $ Total 266.9 $ 1.7 $ 268.6 $ 29.0 $ 249.7 $ 10.1 $ Weighted Avg. Leverage 0.1x Q4 Return 3.9% Q4 Return (Annualized) 16.5% Mortgage-Backed Securities Beginning Position Transactions Transaction Adjusted Position Cash Flows Ending Position Return Bonds 137.2 $ 1.9 $ 139.1 $ 20.3 $ 120.0 $ 1.2 $ Repo Balance (112.0) $ (1.6) $ (113.6) $ (17.4) $ (96.6) $ (0.4) $ Total 25.2 $ 0.3 $ 25.5 $ 2.9 $ 23.4 $ 0.8 $ Weighted Avg. Leverage 4.3x Q4 Return 3.4% Q4 Return (Annualized) 14.4% |
| Example: Illustrative Returns Based on PMT’s Assumptions* 9 ($ in millions) Targeted Unlevered Return1 Targeted Leverage 12% - 17% Illustrative Return2 3% - 5% 25bps – 30bps on origination volume 0.5x - 1.0x 4.0x - 6.0x 6.0x - 9.0x 20% - 26% 14% - 20% 21% - 29% Target Cost of Funds LIBOR + 200bps to 400bps LIBOR + 75bps to 150bps LIBOR + 150bps to 250bps 1. Gross returns, net of estimated servicing and new loan fulfillment expenses (Calculated using mid-point of targeted unlevered return and mid-point of target cost of funds, at each targeted leverage point) 2. Illustrative returns before corporate operating and other administrative expenses 3. Subject to taxes associated with the taxable REIT subsidiary Average holding period of 20 days *This is an example for illustrative purposes only. Actual results may differ materially. Please refer to the disclaimer on slide 1. |
| Financials |

| Income Statement 11 PENNYMAC MORTGAGE INVESTMENT TRUST AND SUBSIDIARIES CONSOLIDATED STATEMENT S OF OPERATIONS (In thousands, except share data) (unaudited) Quarter ended December 31, 2010 Year ended December 31, 2010 Investment Income Gains (losses) on investments: Mortgage loans ................................ ................................ ................................ ............. $8,518 $27,215 Mortgage - backed securities ................................ ................................ .......................... (213) 233 8,305 27,448 Interest income: Mortgage loans ................................ ................................ ................................ ............. 2,857 9,302 Mortgage - backed securities ................................ ................................ .......................... 1,406 5,186 Short - term investment ................................ ................................ ................................ .. 9 86 4,272 14,574 (Loss) gain on sale of correspondent lending mortgage loans ................................ .......... 7 (2) Results of real estate acquired in settlement of loans ................................ ....................... 1,030 2,002 Other income ................................ ................................ ................................ .................... 15 32 Net i nvestment income ................................ ................................ ................................ . 13,629 44,054 Expenses Management fees ................................ ................................ ................................ .............. 1,228 4,878 Compensation ................................ ................................ ................................ ................... 415 2,627 Loan servicing fees ................................ ................................ ................................ ........... 1,426 2,987 Professional services ................................ ................................ ................................ ........ 1,460 2,581 Interest ................................ ................................ ................................ .............................. 575 826 Insurance ................................ ................................ ................................ .......................... 188 776 Other ................................ ................................ ................................ ................................ . 845 2,353 Total expenses ................................ ................................ ................................ .............. 6,137 17,028 Income before provision for income taxes ................................ ................................ ........... 7,492 27,026 Provision for income taxes ................................ ................................ ................................ ... 143 2,543 Net income ................................ ................................ ................................ ........................... $7,349 $24,483 Earnings per share Basic ................................ ................................ ................................ ................................ . $0.44 $1.46 Diluted ................................ ................................ ................................ .............................. $0.43 $1.44 Weighted average shares outstanding Basic ................................ ................................ ................................ ................................ . 16,832,343 16,775,191 Diluted ................................ ................................ ................................ .............................. 17,105,327 17,048,175 |
| Increased Operational Expenses Impacted Fourth Quarter Profitability 12 The largest expense associated with professional services was the due diligence costs incurred on the large acquisition completed during the quarter Operational expenses increased as a result of due diligence costs associated with pledging PMT’s whole loans on the new credit facilities Some of the legal fees associated with tthe at-the-market equity offering also increased the expense load for the quarter Description Amount(000’s) Due Diligence Costs for Acquisition $328 Legal and Due Diligence Fees for Equity and Credit Facilities $319 TOTAL $647 Professional Services |
| Cash Flows for the Fourth Quarter 13 For the three months ended December 31, 2010 Mortgage-backed securities Principal Payments $19,857 Interest Received $456 Mortgage loans held for investment: Scheduled payments 217 Liquidations 10,934 Payoff 2,799 Sales 2,377 Interest (net of servicing fee of $1,472) 1,109 17,436 Proceeds from the settlement of REO loans 11,575 Total Direct Cash Flows $49,324 |
| Balance Sheet 14 PENNYMAC MORTGAGE INVESTMENT TRUST AND SUBSIDIARIES CONSOLIDATED BALANCE SHEETS (In thousands, except share data) (unaudited) December 31, 2010 2009 ASSETS Cash ................................ ................................ ................................ ................................ ................................ .......... $45,447 $54 Short-term investment ................................ ................................ ................................ ................................ .............. — 213,628 Mortgage-backed securities at fair value ................................ ................................ ................................ .................. 119,872 83,771 Mortgage loans at fair value ................................ ................................ ................................ ................................ ..... 368,216 26,046 Real estate acquired in settlement of loans ................................ ................................ ................................ ............... 29,685 — Principal and interest collections receivable ................................ ................................ ................................ ............. 8,249 — Interest receivable ................................ ................................ ................................ ................................ ..................... 978 492 Due from affiliates ................................ ................................ ................................ ................................ .................... 2,115 __ Other assets ................................ ................................ ................................ ................................ ............................... 14,533 455 Total assets ................................ ................................ ................................ ................................ ........................... $589,095 $324,446 LIABILITIES Accounts payable and accrued liabilities ................................ ................................ ................................ .................. 9,080 $527 Loans and securities sold under agreements to repurchase ................................ ................................ ...................... 248,624 __ Contingent underwriting fees payable ................................ ................................ ................................ ...................... 5,883 5,883 Payable to affiliates ................................ ................................ ................................ ................................ .................. 5,595 4,238 Total liabilities ................................ ................................ ................................ ................................ ...................... 269,182 10,648 Commitments and contingencies SHAREHOLDERS’ EQUITY Common shares of beneficial interest — authorized, 500,000,000 shares of $0.01 par value; issued and outstanding, 16,832,343 and 16,735,317 shares, respectively ................................ ............................ 168 167 Additional paid-in capital ................................ ................................ ................................ ................................ ......... 317,175 315,514 Retained earnings (accumulated deficit) ................................ ................................ ................................ .................. 2,570 (1,883) Total shareholders’ equity ................................ ................................ ................................ ................................ .... 319,913 313,798 Total liabilities and shareholders’ equity ................................ ................................ ................................ .............. $589,095 $324,446 |
| PennyMac Mortgage Investment Trust Fourth Quarter 2010 Earnings Report February 2, 2011 |