
Exhibit 99.2 3Q24 EARNINGS REPORT PennyMac Mortgage Investment Trust October 2024
FORWARD LOOKING STATEMENTS This presentation contains forward-looking statements within the meaning of Section 21E of the Securities Exchange Act of 1934, as amended, regarding management’s beliefs, estimates, projections and assumptions with respect to, among other things, the Company’s financial results, future operations, business plans and investment strategies, as well as industry and market conditions, all of which are subject to change. Words like “believe,” “expect,” “anticipate,” “promise,” “plan,” and other expressions or words of similar meanings, as well as future or conditional verbs such as “will,” “would,” “should,” “could,” or “may” are generally intended to identify forward-looking statements. Actual results and operations for any future period may vary materially from those projected herein and from past results discussed herein. These forward-looking statements include, but are not limited to, statements regarding future changes in interest rates, housing, and prepayment rates; future loan originations and production; future loan delinquencies, defaults and forbearances; future investment and hedge expenses; future investment strategies, future earnings and return on equity as well as other business and financial expectations. Factors which could cause actual results to differ materially from historical results or those anticipated include, but are not limited to: changes in interest rates; the Company’s ability to comply with various federal, state and local laws and regulations that govern its business; the general economy or the real estate finance and real estate markets; events or circumstances which undermine confidence in the financial and housing markets or otherwise have a broad impact on financial and housing markets; changes in real estate values, housing prices and housing sales; changes in macroeconomic, consumer and real estate market conditions; the degree and nature of the Company’s competition; the availability of, and level of competition for, attractive risk adjusted investment opportunities in mortgage loans and mortgage related assets that satisfy the Company’s investment objectives; the inherent difficulty in winning bids to acquire mortgage loans, and the Company’s success in doing so; the concentration of credit risks to which the Company is exposed; the Company’s dependence on its manager and servicer, potential conflicts of interest with such entities and their affiliates, and the performance of such entities; changes in personnel and lack of availability of qualified personnel at its manager, servicer or their affiliates; our ability to mitigate cybersecurity risks, cybersecurity incidents and technology disruptions; the availability, terms and deployment of short term and long term capital; the adequacy of the Company’s cash reserves and working capital; the Company’s ability to maintain the desired relationship between its financing and the interest rates and maturities of its assets; the timing and amount of cash flows, if any, from the Company’ s investments; our substantial amount of indebtedness; the performance, financial condition and liquidity of borrowers; our exposure to risks of loss and disruptions in operations resulting from severe weather events, man-made or other natural conditions, including climate change and pandemics; the ability of the Company’s servicer, which also provides the Company with fulfillment services, to approve and monitor correspondent sellers and underwrite loans to investor standards; incomplete or inaccurate information or documentation provided by customers or counterparties, or adverse changes in the financial condition of the Company’s customers and counterparties; the Company’s indemnification and repurchase obligations in connection with mortgage loans it purchases and later sells or securitizes; the quality and enforceability of the collateral documentation evidencing the Company’ s ownership and rights in the assets in which it invests; increased rates of delinquency, defaults and forbearances and/or decreased recovery rates on the Company’s investments; the performance of mortgage loans underlying mortgage backed securities in which the Company retains credit risk; the Company’s ability to foreclose on its investments in a timely manner or at all; increased prepayments of the mortgages and other loans underlying the Company’s mortgage backed securities or relating to the Company’s mortgage servicing rights and other investments; the degree to which the Company’s hedging strategies may or may not protect it from interest rate volatility; the effect of the accuracy of or changes in the estimates the Company makes about uncertainties, contingencies and asset and liability valuations when measuring and reporting upon the Company’s financial condition and results of operations; the Company’s ability to maintain appropriate internal control over financial reporting; the Company’s ability to detect misconduct and fraud; developments in the secondary markets for the Company’s mortgage loan products; legislative and regulatory changes that impact the mortgage loan industry or housing market regulatory or other changes that impact government agencies or government sponsored entities, or such changes that increase the cost of doing business with such agencies or entities; the Consumer Financial Protection Bureau and its issued and future rules and the enforcement thereof; changes in government support of homeownership; changes in government or government sponsored home affordability programs; changes in the Company’s investment objectives or investment or operational strategies, including any new lines of business or new products and services that may subject it to additional risks volatility in the Company’s industry, the debt or equity markets; limitations imposed on the Company’s business and its ability to satisfy complex rules for it to qualify as a REIT for U.S. federal income tax purposes and qualify for an exclusion from the Investment Company Act of 1940 and the ability of certain of the Company’s subsidiaries to qualify as REITs or as taxable REIT subsidiaries for U.S. federal income tax purposes; changes in governmental regulations, accounting treatment, tax rates and similar matters; the Company’s ability to make distributions to its shareholders in the future; the Company’s failure to deal appropriately with issues that may give rise to reputational risk; and the Company’s organizational structure and certain requirements in its charter documents. You should not place undue reliance on any forward-looking statement and should consider all of the uncertainties and risks described above, as well as those more fully discussed in reports and other documents filed by the Company with the Securities and Exchange Commission from time to time. The Company undertakes no obligation to publicly update or revise any forward-looking statements or any other information contained herein, and the statements made in this presentation are current as of the date of this presentation only. This presentation contains financial information calculated other than in accordance with U.S. generally accepted accounting principles (“GAAP”), such as income excluding market driven value changes that provide a meaningful perspective on the Company’s business results since the Company utilizes this information to evaluate and manage the business. Non-GAAP disclosures have limitations as an analytical tool and should not be viewed as a substitute for financial information determined in accordance with GAAP. 2
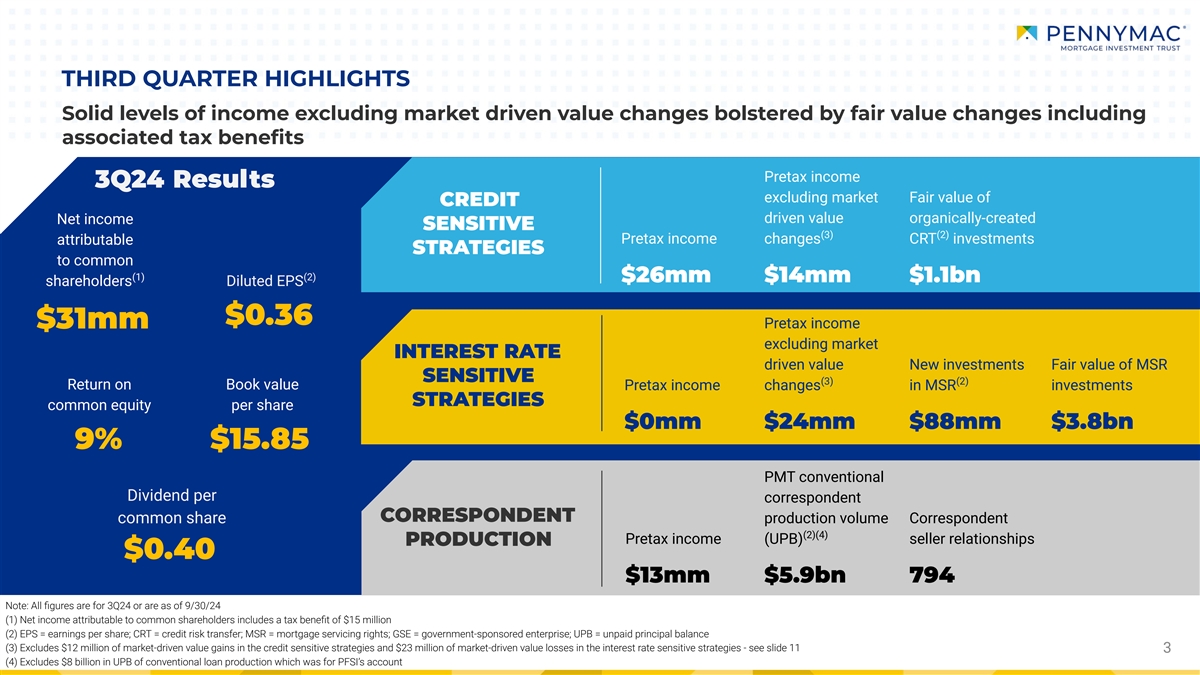
THIRD QUARTER HIGHLIGHTS Solid levels of income excluding market driven value changes bolstered by fair value changes including associated tax benefits Pretax income 3Q24 Results excluding market Fair value of CREDIT driven value organically-created Net income SENSITIVE (3) (2) Pretax income changes CRT investments attributable STRATEGIES to common (1) (2) $26mm $14mm $1.1bn shareholders Diluted EPS $0.36 $31mm Pretax income excluding market INTEREST RATE driven value New investments Fair value of MSR SENSITIVE (3) (2) Return on Book value Pretax income changes in MSR investments STRATEGIES common equity per share $0mm $24mm $88mm $3.8bn 9% $15.85 PMT conventional Dividend per correspondent CORRESPONDENT common share production volume Correspondent (2)(4) Pretax income (UPB) seller relationships PRODUCTION $0.40 $13mm $5.9bn 794 Note: All figures are for 3Q24 or are as of 9/30/24 (1) Net income attributable to common shareholders includes a tax benefit of $15 million (2) EPS = earnings per share; CRT = credit risk transfer; MSR = mortgage servicing rights; GSE = government-sponsored enterprise; UPB = unpaid principal balance (3) Excludes $12 million of market-driven value gains in the credit sensitive strategies and $23 million of market-driven value losses in the interest rate sensitive strategies - see slide 11 3 3 (4) Excludes $8 billion in UPB of conventional loan production which was for PFSI’s account
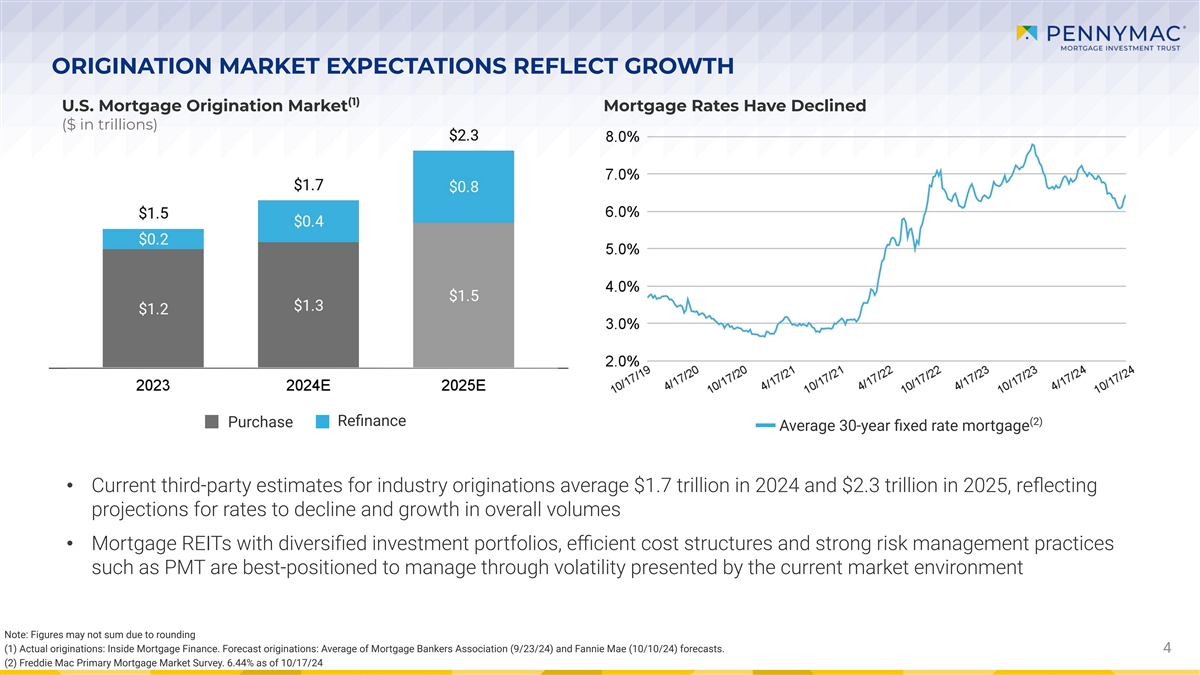
ORIGINATION MARKET EXPECTATIONS REFLECT GROWTH (1) U.S. Mortgage Origination Market Mortgage Rates Have Declined ($ in trillions) (2) Refinance Purchase Average 30-year fixed rate mortgage • Current third-party estimates for industry originations average $1.7 trillion in 2024 and $2.3 trillion in 2025, reflecting projections for rates to decline and growth in overall volumes • Mortgage REITs with diversified investment portfolios, efficient cost structures and strong risk management practices such as PMT are best-positioned to manage through volatility presented by the current market environment Note: Figures may not sum due to rounding (1) Actual originations: Inside Mortgage Finance. Forecast originations: Average of Mortgage Bankers Association (9/23/24) and Fannie Mae (10/10/24) forecasts. 4 (2) Freddie Mac Primary Mortgage Market Survey. 6.44% as of 10/17/24
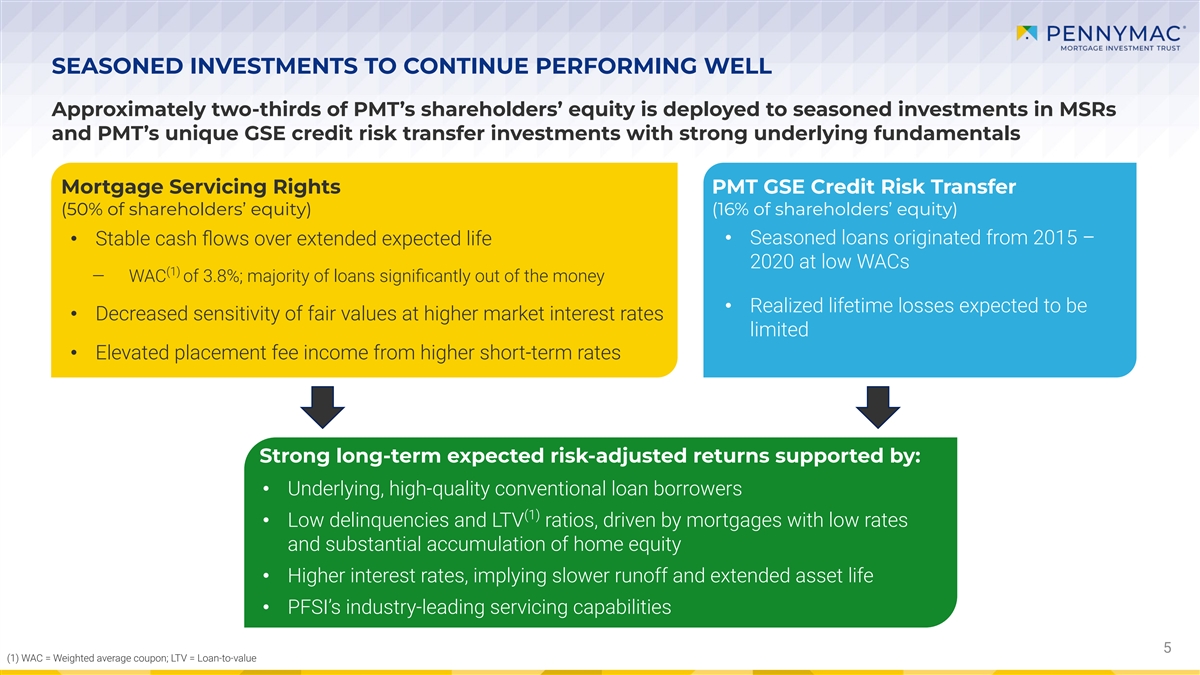
SEASONED INVESTMENTS TO CONTINUE PERFORMING WELL Approximately two-thirds of PMT’s shareholders’ equity is deployed to seasoned investments in MSRs and PMT’s unique GSE credit risk transfer investments with strong underlying fundamentals Mortgage Servicing Rights PMT GSE Credit Risk Transfer (50% of shareholders’ equity) (16% of shareholders’ equity) • Stable cash flows over extended expected life • Seasoned loans originated from 2015 – 2020 at low WACs (1) ‒ WAC of 3.8%; majority of loans significantly out of the money • Realized lifetime losses expected to be • Decreased sensitivity of fair values at higher market interest rates limited • Elevated placement fee income from higher short-term rates Strong long-term expected risk-adjusted returns supported by: • Underlying, high-quality conventional loan borrowers (1) • Low delinquencies and LTV ratios, driven by mortgages with low rates and substantial accumulation of home equity • Higher interest rates, implying slower runoff and extended asset life • PFSI’s industry-leading servicing capabilities 5 (1) WAC = Weighted average coupon; LTV = Loan-to-value
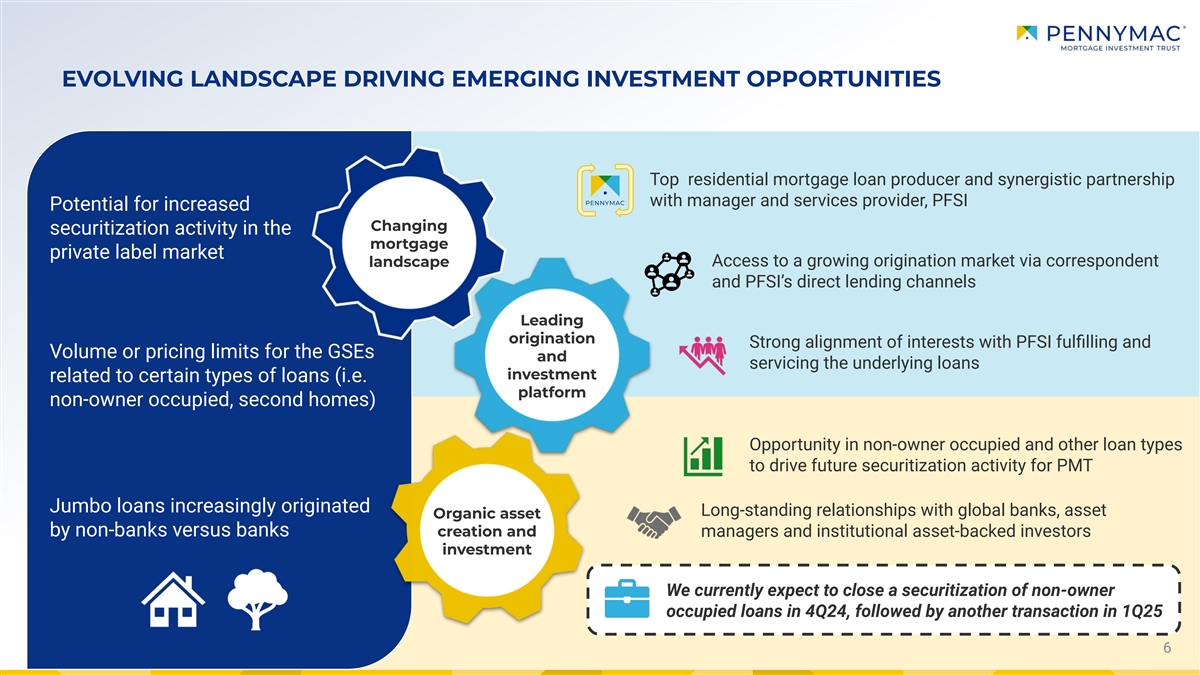
EVOLVING LANDSCAPE DRIVING EMERGING INVESTMENT OPPORTUNITIES Top residential mortgage loan producer and synergistic partnership with manager and services provider, PFSI Potential for increased Changing securitization activity in the mortgage private label market Access to a growing origination market via correspondent landscape and PFSI’s direct lending channels Leading origination Strong alignment of interests with PFSI fulfilling and Volume or pricing limits for the GSEs and servicing the underlying loans investment related to certain types of loans (i.e. platform non-owner occupied, second homes) Opportunity in non-owner occupied and other loan types to drive future securitization activity for PMT Jumbo loans increasingly originated Long-standing relationships with global banks, asset Organic asset by non-banks versus banks creation and managers and institutional asset-backed investors investment We currently expect to close a securitization of non-owner occupied loans in 4Q24, followed by another transaction in 1Q25 6 6
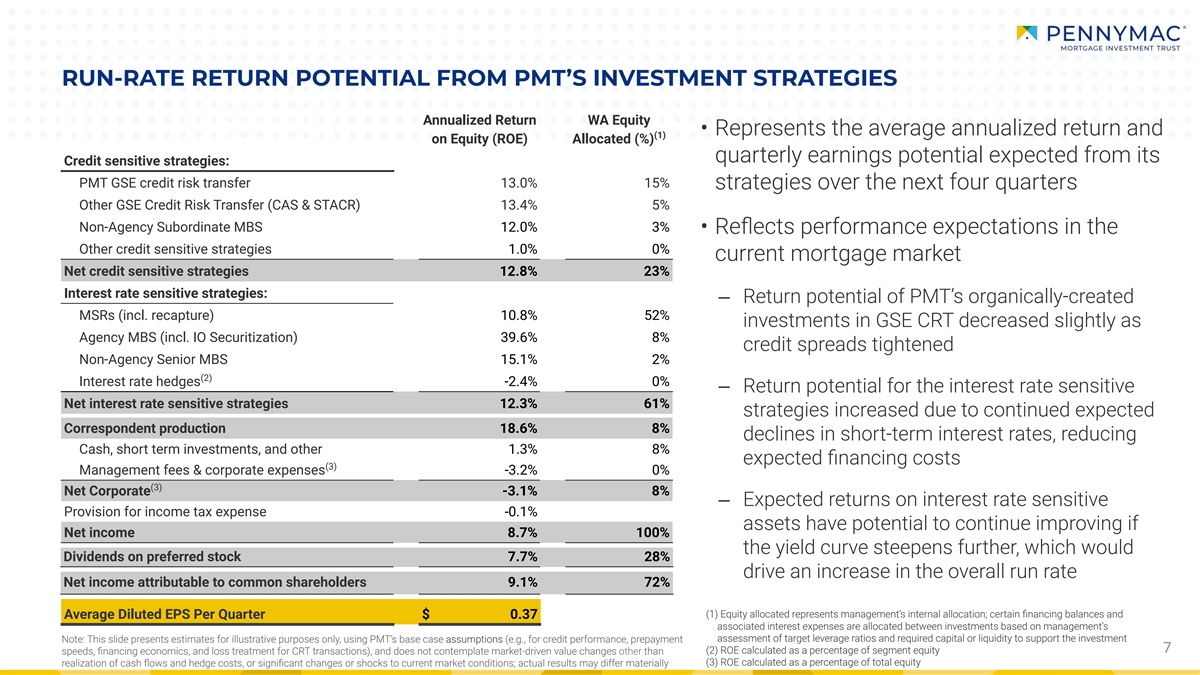
RUN-RATE RETURN POTENTIAL FROM PMT’S INVESTMENT STRATEGIES Annualized Return WA Equity • Represents the average annualized return and (1) on Equity (ROE) Allocated (%) quarterly earnings potential expected from its Credit sensitive strategies: PMT GSE credit risk transfer 13.0% 15% strategies over the next four quarters Other GSE Credit Risk Transfer (CAS & STACR) 13.4% 5% Non-Agency Subordinate MBS 12.0% 3% • Reflects performance expectations in the Other credit sensitive strategies 1.0% 0% current mortgage market Net credit sensitive strategies 12.8% 23% Interest rate sensitive strategies: ‒ Return potential of PMT’s organically-created MSRs (incl. recapture) 10.8% 52% investments in GSE CRT decreased slightly as Agency MBS (incl. IO Securitization) 39.6% 8% credit spreads tightened Non-Agency Senior MBS 15.1% 2% (2) Interest rate hedges -2.4% 0% ‒ Return potential for the interest rate sensitive Net interest rate sensitive strategies 12.3% 61% strategies increased due to continued expected Correspondent production 18.6% 8% declines in short-term interest rates, reducing Cash, short term investments, and other 1.3% 8% expected financing costs (3) Management fees & corporate expenses -3.2% 0% (3) Net Corporate -3.1% 8% ‒ Expected returns on interest rate sensitive Provision for income tax expense -0.1% assets have potential to continue improving if Net income 8.7% 100% the yield curve steepens further, which would Dividends on preferred stock 7.7% 28% drive an increase in the overall run rate Net income attributable to common shareholders 9.1% 72% (1) Equity allocated represents management’s internal allocation; certain financing balances and Average Diluted EPS Per Quarter $ 0.37 associated interest expenses are allocated between investments based on management’s assessment of target leverage ratios and required capital or liquidity to support the investment Note: This slide presents estimates for illustrative purposes only, using PMT’s base case assumptions (e.g., for credit performance, prepayment 7 (2) ROE calculated as a percentage of segment equity speeds, financing economics, and loss treatment for CRT transactions), and does not contemplate market-driven value changes other than (3) ROE calculated as a percentage of total equity realization of cash flows and hedge costs, or significant changes or shocks to current market conditions; actual results may differ materially

CORRESPONDENT PRODUCTION HIGHLIGHTS Correspondent Acquisition Volume and Mix Key Financial Metrics (UPB in billions) 2Q24 3Q24 Segment pretax income as a percentage of 0.35% 0.17% (2) interest rate lock commitments Fulfillment fee as a percentage of 0.20% 0.19% (3) acquisitions funded Selected Operational Metrics 2Q24 3Q24 Correspondent seller relationships 797 794 Purchase money loans as a percentage of 92% 91% (1) Conventional loans for PMT total acquisitions Government loans for PFSI (1) Conventional loans for PFSI Total locks ● Pennymac remains the largest correspondent aggregator in the U.S. with market share substantially greater than the next largest channel participant ● Profitability in recent periods has benefited from the release of liabilities related to representations and warranties provided at the time of securitization as the high volumes of loans produced from 2020 to 2022 pass the three-year window for violations with minimal repurchase-related losses ● To optimize PMT’s capital allocation, PMT expects to retain approximately 15 - 25% of total conventional correspondent production in 4Q24, a decrease from 42% in 3Q24 Note: May not sum due to rounding (1) For all government loans and conventional loans sourced for PFSI, PMT earns a sourcing fee and interest income for its holding period and does not pay a fulfillment fee to PFSI (2) Conventional conforming interest rate lock commitments for PMT’s own account 8 (3) Based on funded loans subject to fulfillment fees
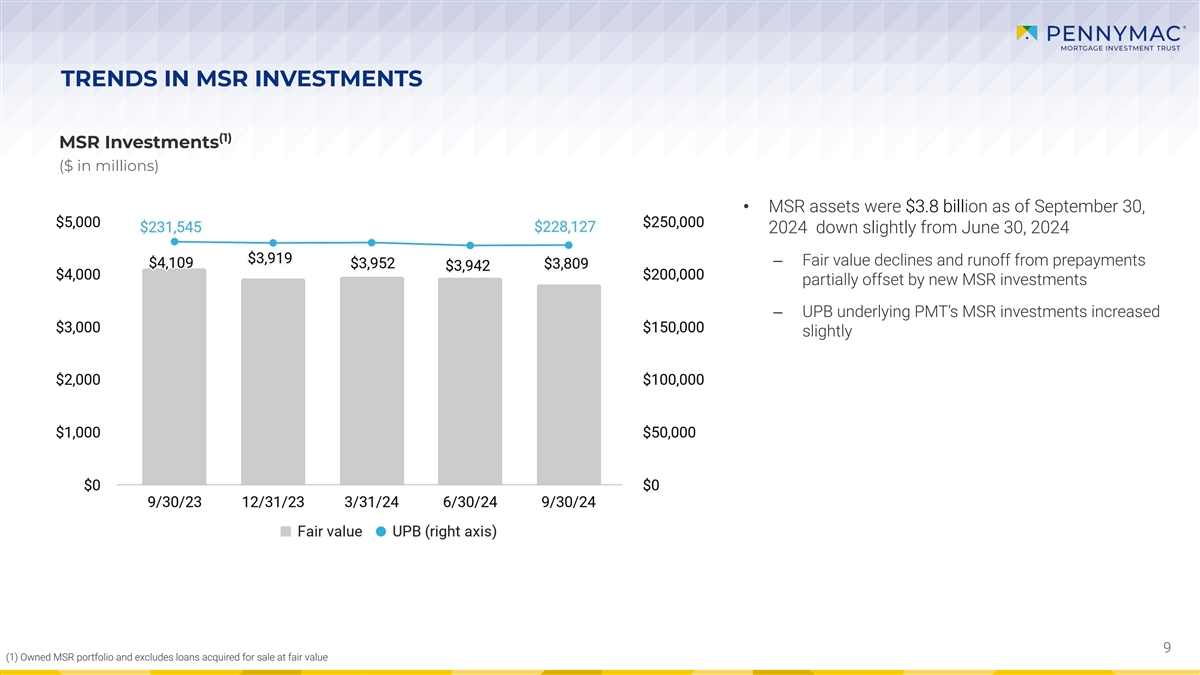
TRENDS IN MSR INVESTMENTS (1) MSR Investments ($ in millions) • MSR assets were $3.8 billion as of September 30, 2024 down slightly from June 30, 2024 ‒ Fair value declines and runoff from prepayments partially offset by new MSR investments ‒ UPB underlying PMT’s MSR investments increased slightly 9 (1) Owned MSR portfolio and excludes loans acquired for sale at fair value
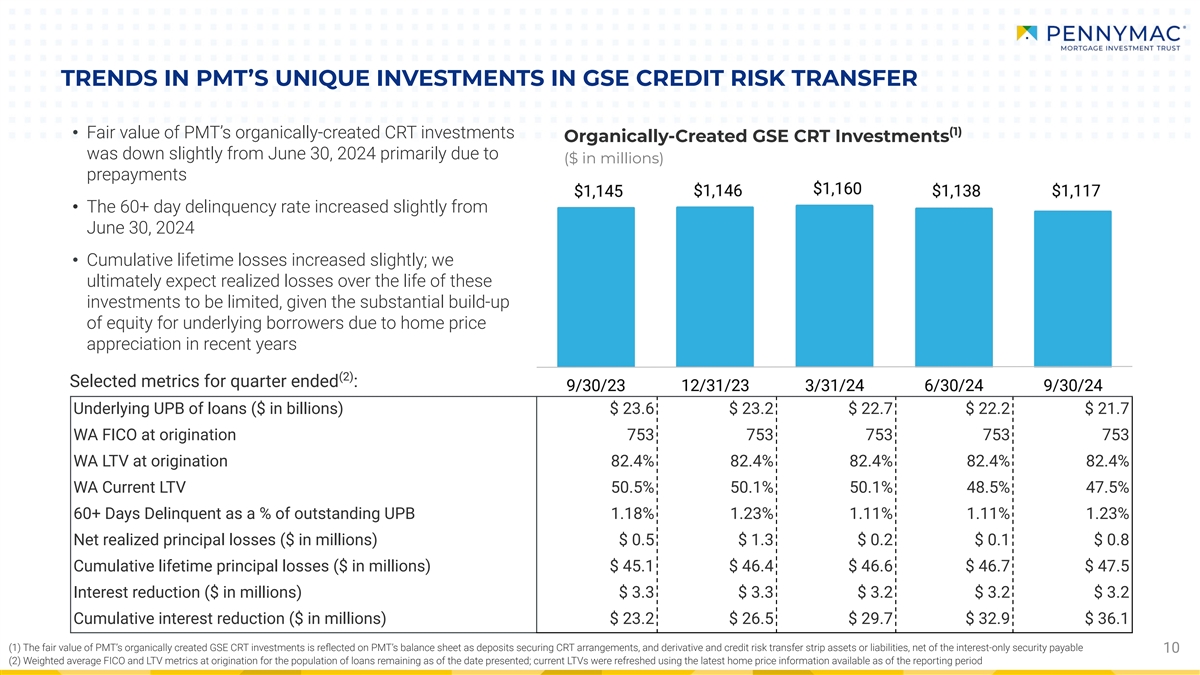
TRENDS IN PMT’S UNIQUE INVESTMENTS IN GSE CREDIT RISK TRANSFER (1) • Fair value of PMT’s organically-created CRT investments Organically-Created GSE CRT Investments was down slightly from June 30, 2024 primarily due to ($ in millions) prepayments • The 60+ day delinquency rate increased slightly from June 30, 2024 • Cumulative lifetime losses increased slightly; we ultimately expect realized losses over the life of these investments to be limited, given the substantial build-up of equity for underlying borrowers due to home price appreciation in recent years (2) Selected metrics for quarter ended : Underlying UPB of loans ($ in billions) $ 23.6 $ 23.2 $ 22.7 $ 22.2 $ 21.7 WA FICO at origination 753 753 753 753 753 WA LTV at origination 82.4% 82.4% 82.4% 82.4% 82.4% WA Current LTV 50.5% 50.1% 50.1% 48.5% 47.5% 60+ Days Delinquent as a % of outstanding UPB 1.18% 1.23% 1.11% 1.11% 1.23% Net realized principal losses ($ in millions) $ 0.5 $ 1.3 $ 0.2 $ 0.1 $ 0.8 Cumulative lifetime principal losses ($ in millions) $ 45.1 $ 46.4 $ 46.6 $ 46.7 $ 47.5 Interest reduction ($ in millions) $ 3.3 $ 3.3 $ 3.2 $ 3.2 $ 3.2 Cumulative interest reduction ($ in millions) $ 23.2 $ 26.5 $ 29.7 $ 32.9 $ 36.1 (1) The fair value of PMT’s organically created GSE CRT investments is reflected on PMT’s balance sheet as deposits securing CRT arrangements, and derivative and credit risk transfer strip assets or liabilities, net of the interest-only security payable 10 (2) Weighted average FICO and LTV metrics at origination for the population of loans remaining as of the date presented; current LTVs were refreshed using the latest home price information available as of the reporting period
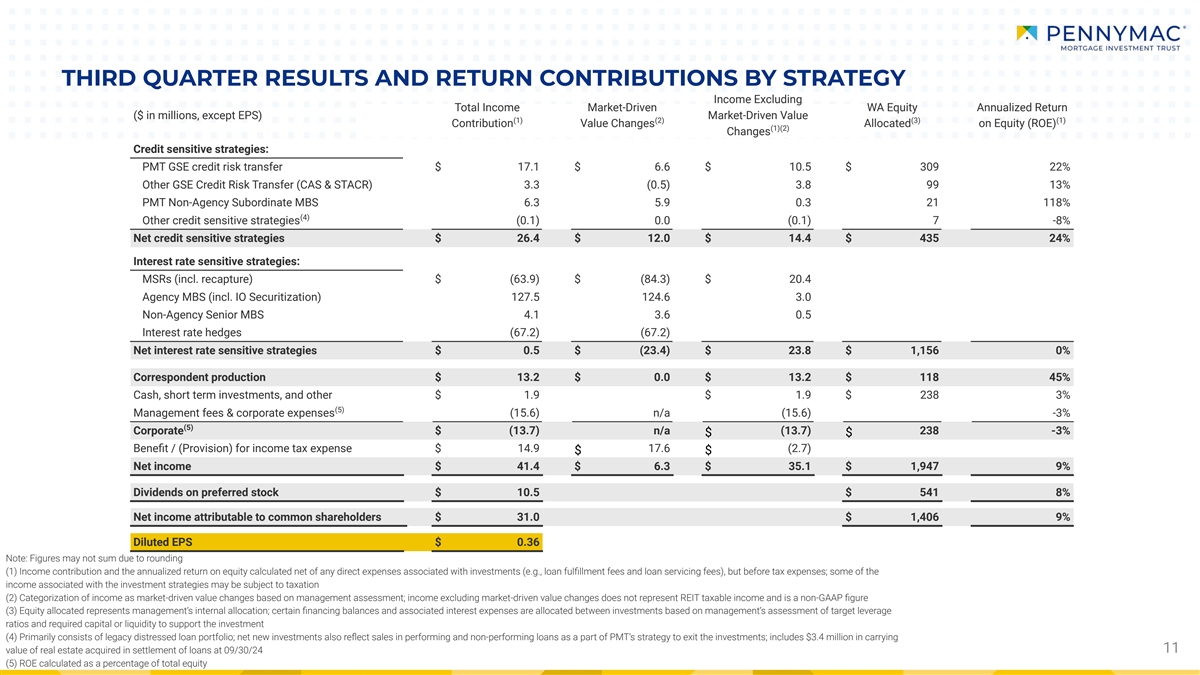
THIRD QUARTER RESULTS AND RETURN CONTRIBUTIONS BY STRATEGY Income Excluding Total Income Market-Driven WA Equity Annualized Return ($ in millions, except EPS) Market-Driven Value (1) (2) (3) (1) Contribution Value Changes Allocated on Equity (ROE) (1)(2) Changes Credit sensitive strategies: PMT GSE credit risk transfer $ 17.1 $ 6.6 $ 10.5 $ 309 22% Other GSE Credit Risk Transfer (CAS & STACR) 3.3 (0.5) 3.8 99 13% PMT Non-Agency Subordinate MBS 6.3 5.9 0.3 21 118% (4) Other credit sensitive strategies (0.1) 0.0 (0.1) 7 -8% Net credit sensitive strategies $ 26.4 $ 12.0 $ 14.4 $ 435 24% Interest rate sensitive strategies: MSRs (incl. recapture) $ (63.9) $ (84.3) $ 20.4 Agency MBS (incl. IO Securitization) 127.5 124.6 3.0 Non-Agency Senior MBS 4.1 3.6 0.5 Interest rate hedges (67.2) (67.2) Net interest rate sensitive strategies $ 0.5 $ (23.4) $ 23.8 $ 1,156 0% Correspondent production $ 13.2 $ 0.0 $ 13.2 $ 118 45% Cash, short term investments, and other $ 1.9 $ 1.9 $ 238 3% (5) Management fees & corporate expenses (15.6) n/a (15.6) -3% (5) Corporate $ (13.7) n/a (13.7) 238 -3% $ $ Benefit / (Provision) for income tax expense $ 14.9 17.6 (2.7) $ $ Net income $ 41.4 $ 6.3 $ 35.1 $ 1,947 9% Dividends on preferred stock $ 10.5 $ 541 8% Net income attributable to common shareholders $ 31.0 $ 1,406 9% Diluted EPS $ 0.36 Note: Figures may not sum due to rounding (1) Income contribution and the annualized return on equity calculated net of any direct expenses associated with investments (e.g., loan fulfillment fees and loan servicing fees), but before tax expenses; some of the income associated with the investment strategies may be subject to taxation (2) Categorization of income as market-driven value changes based on management assessment; income excluding market-driven value changes does not represent REIT taxable income and is a non-GAAP figure (3) Equity allocated represents management’s internal allocation; certain financing balances and associated interest expenses are allocated between investments based on management’s assessment of target leverage ratios and required capital or liquidity to support the investment (4) Primarily consists of legacy distressed loan portfolio; net new investments also reflect sales in performing and non-performing loans as a part of PMT’s strategy to exit the investments; includes $3.4 million in carrying 11 value of real estate acquired in settlement of loans at 09/30/24 (5) ROE calculated as a percentage of total equity
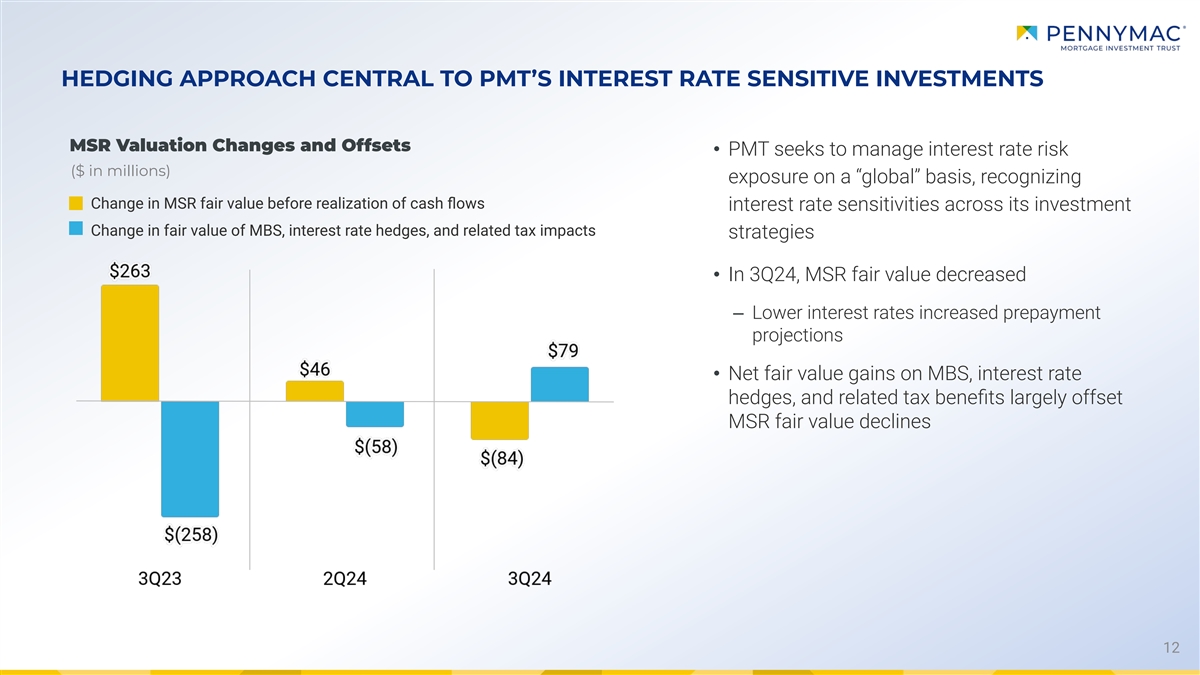
HEDGING APPROACH CENTRAL TO PMT’S INTEREST RATE SENSITIVE INVESTMENTS MSR Valuation Changes and Offsets • PMT seeks to manage interest rate risk ($ in millions) exposure on a “global” basis, recognizing Change in MSR fair value before realization of cash flows interest rate sensitivities across its investment Change in fair value of MBS, interest rate hedges, and related tax impacts strategies • In 3Q24, MSR fair value decreased ‒ Lower interest rates increased prepayment projections • Net fair value gains on MBS, interest rate hedges, and related tax benefits largely offset MSR fair value declines 12

FLEXIBLE AND SOPHISTICATED FINANCING STRUCTURES (1) Debt Schedule by Year of Maturity (in millions) Financing Unsecured and Exchangeable Senior Notes capacity across multiple banks / MSR Term Notes and Loans flexibility to CRT Term Notes finance fluctuating MSR and advance balances $1,147mm drawn Unsecured and MSR Financing CRT Financing Exchangeable Senior Notes ● Vast majority of our CRT financing is in the ● Maturity of MSR term notes and loans aligns ● Provides flexibility and complements form of term notes, which do not contain more closely with the expected life of the asset-backed structures mark-to-market (margin call) provisions MSR asset than short-term borrowings ● Issued $159 million of new, 4-year CRT term ● Liquidity in place for repayment in full of ● Refinanced $305 million of previously-issued notes, which refinanced $152 million of notes $210 million of exchangeable senior notes that were due to mature in 2025 term notes due in 2027 with a cost of SOFR+ due in November 2024 4.19% with new term notes at a cost of ● Investments currently financed by term notes SOFR+2.75% due this year will be financed by securities repurchase agreements until additional term notes are issued due to limited remaining asset balance 13 13 Note: All figures are as of September 30, 2024 (1) By principal amount. CRT term notes amortize with principal paydowns. Excludes securities repurchase agreements financing our investments in MBS and a small portion of our investments in CRT.

APPENDIX
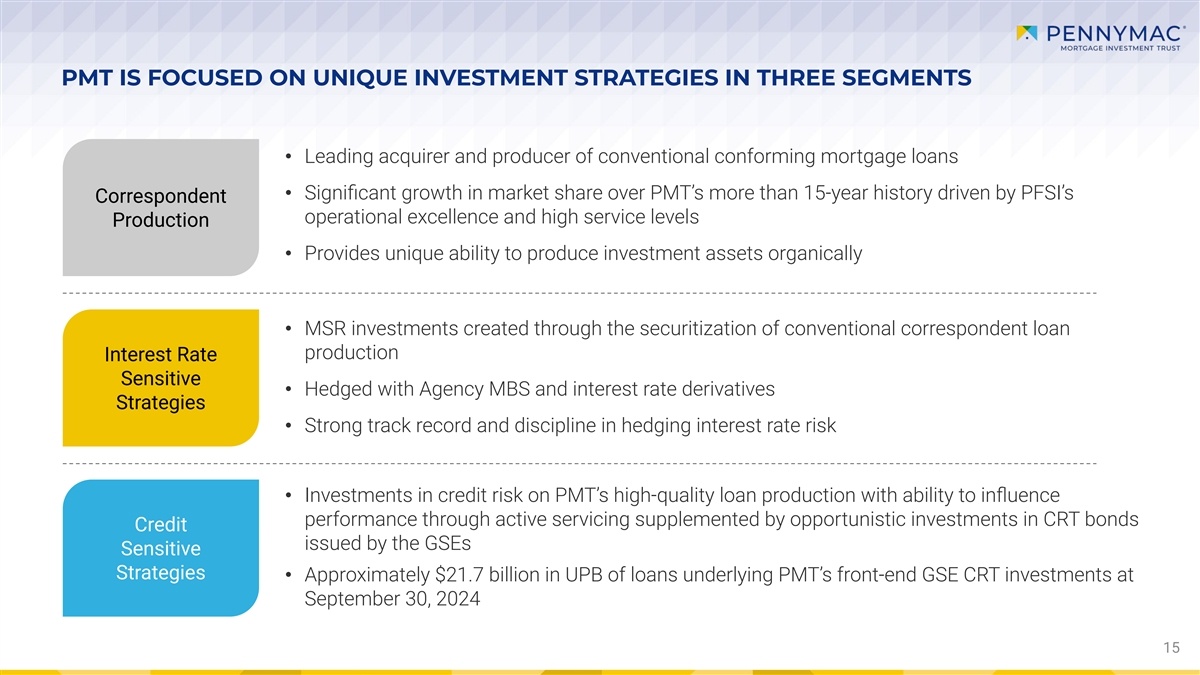
PMT IS FOCUSED ON UNIQUE INVESTMENT STRATEGIES IN THREE SEGMENTS • Leading acquirer and producer of conventional conforming mortgage loans • Significant growth in market share over PMT’s more than 15-year history driven by PFSI’s Correspondent operational excellence and high service levels Production • Provides unique ability to produce investment assets organically • MSR investments created through the securitization of conventional correspondent loan production Interest Rate Sensitive • Hedged with Agency MBS and interest rate derivatives Strategies • Strong track record and discipline in hedging interest rate risk • Investments in credit risk on PMT’s high-quality loan production with ability to influence performance through active servicing supplemented by opportunistic investments in CRT bonds Credit issued by the GSEs Sensitive Strategies • Approximately $21.7 billion in UPB of loans underlying PMT’s front-end GSE CRT investments at September 30, 2024 15
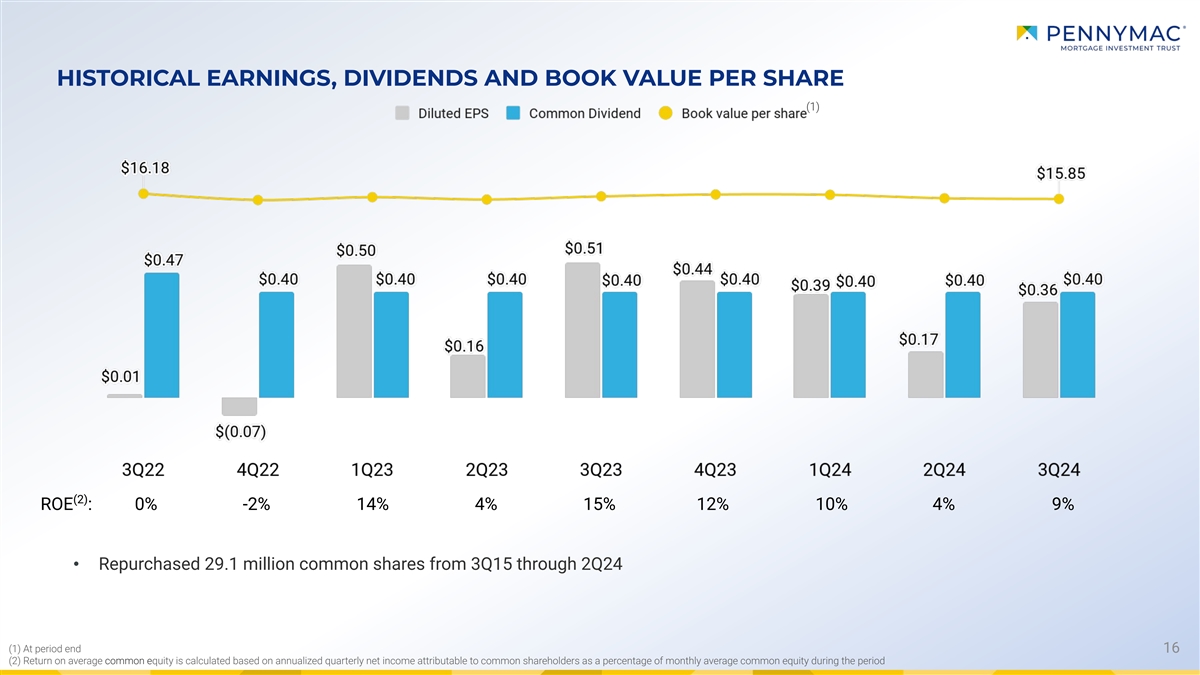
(1) At period end (2) Return on average common equity is calculated based on annualized quarterly net income attributable to common shareholders as a percentage of monthly average common equity during the period HISTORICAL EARNINGS, DIVIDENDS AND BOOK VALUE PER SHARE (1) (2) ROE : 0% -2% 14% 4% 15% 12% 10% 4% 9% • Repurchased 29.1 million common shares from 3Q15 through 2Q24 16
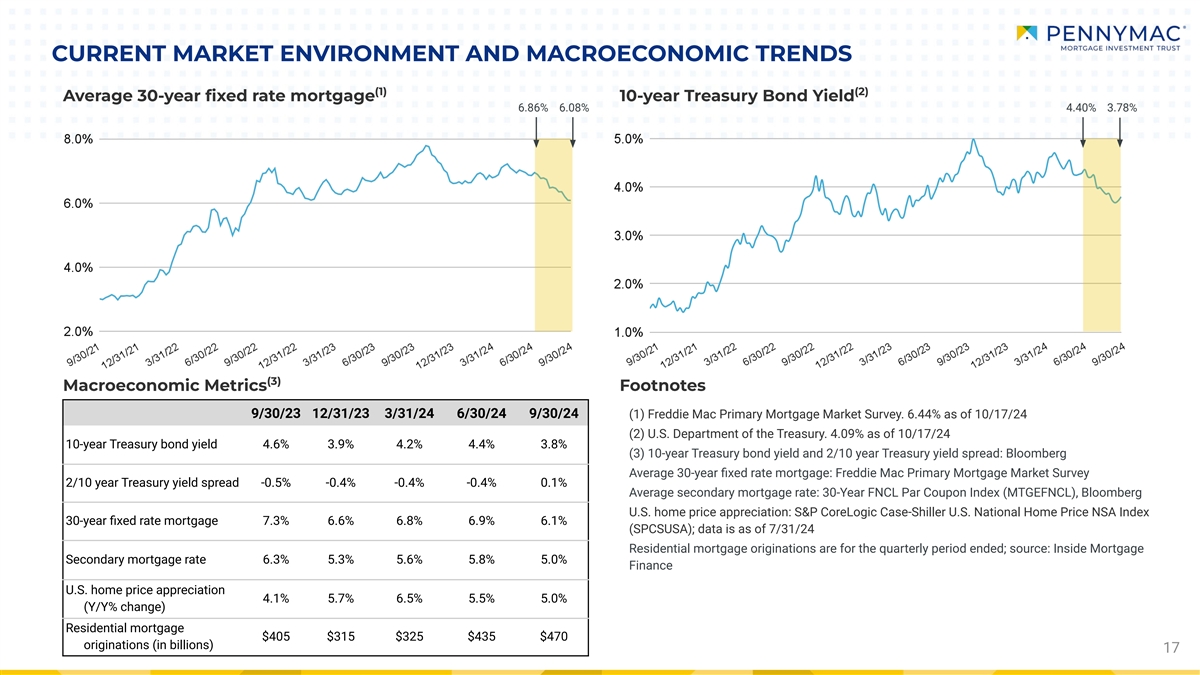
CURRENT MARKET ENVIRONMENT AND MACROECONOMIC TRENDS (1) (2) Average 30-year fixed rate mortgage 10-year Treasury Bond Yield 6.86% 6.08% 4.40% 3.78% (3) Macroeconomic Metrics Footnotes 9/30/23 12/31/23 3/31/24 6/30/24 9/30/24 (1) Freddie Mac Primary Mortgage Market Survey. 6.44% as of 10/17/24 (2) U.S. Department of the Treasury. 4.09% as of 10/17/24 10-year Treasury bond yield 4.6% 3.9% 4.2% 4.4% 3.8% (3) 10-year Treasury bond yield and 2/10 year Treasury yield spread: Bloomberg Average 30-year fixed rate mortgage: Freddie Mac Primary Mortgage Market Survey 2/10 year Treasury yield spread -0.5% -0.4% -0.4% -0.4% 0.1% Average secondary mortgage rate: 30-Year FNCL Par Coupon Index (MTGEFNCL), Bloomberg U.S. home price appreciation: S&P CoreLogic Case-Shiller U.S. National Home Price NSA Index 30-year fixed rate mortgage 7.3% 6.6% 6.8% 6.9% 6.1% (SPCSUSA); data is as of 7/31/24 Residential mortgage originations are for the quarterly period ended; source: Inside Mortgage Secondary mortgage rate 6.3% 5.3% 5.6% 5.8% 5.0% Finance U.S. home price appreciation 4.1% 5.7% 6.5% 5.5% 5.0% (Y/Y% change) Residential mortgage $405 $315 $325 $435 $470 originations (in billions) 17
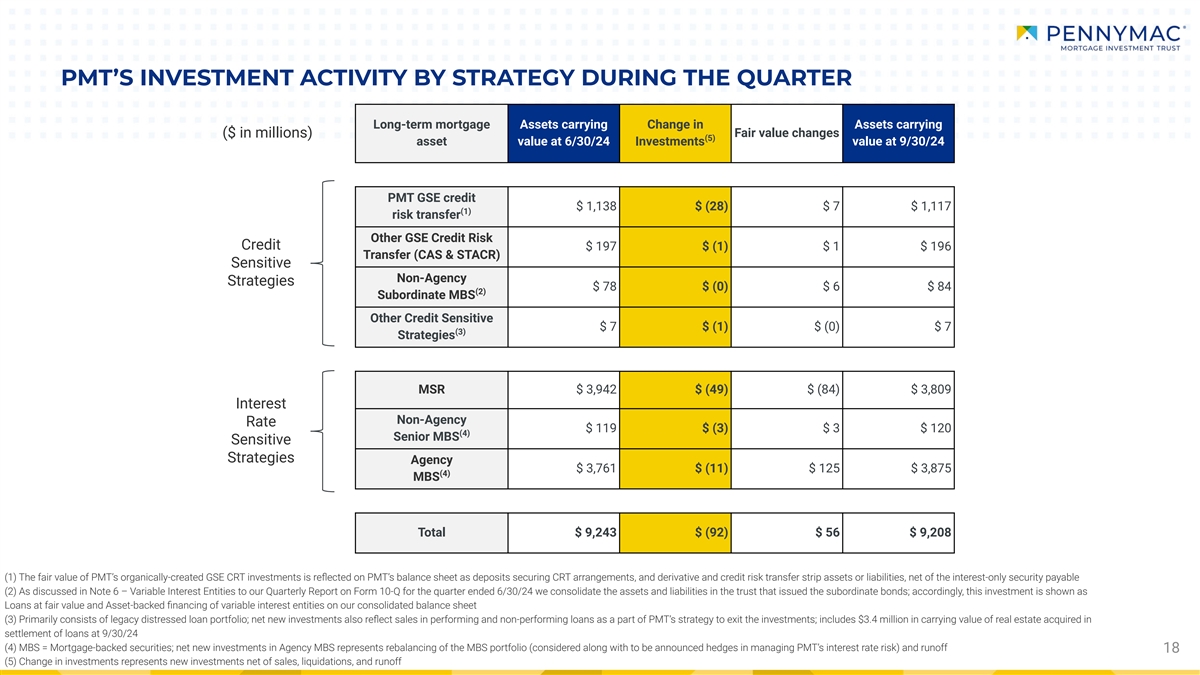
PMT’S INVESTMENT ACTIVITY BY STRATEGY DURING THE QUARTER Long-term mortgage Assets carrying Change in Assets carrying ($ in millions) Fair value changes (5) asset value at 6/30/24 Investments value at 9/30/24 PMT GSE credit $ 1,138 $ (28) $ 7 $ 1,117 (1) risk transfer Other GSE Credit Risk Credit $ 197 $ (1) $ 1 $ 196 Transfer (CAS & STACR) Sensitive Non-Agency Strategies $ 78 $ (0) $ 6 $ 84 (2) Subordinate MBS Other Credit Sensitive $ 7 $ (1) $ (0) $ 7 (3) Strategies MSR $ 3,942 $ (49) $ (84) $ 3,809 Interest Non-Agency Rate $ 119 $ (3) $ 3 $ 120 (4) Senior MBS Sensitive Strategies Agency $ 3,761 $ (11) $ 125 $ 3,875 (4) MBS Total $ 9,243 $ (92) $ 56 $ 9,208 (1) The fair value of PMT’s organically-created GSE CRT investments is reflected on PMT’s balance sheet as deposits securing CRT arrangements, and derivative and credit risk transfer strip assets or liabilities, net of the interest-only security payable (2) As discussed in Note 6 – Variable Interest Entities to our Quarterly Report on Form 10-Q for the quarter ended 6/30/24 we consolidate the assets and liabilities in the trust that issued the subordinate bonds; accordingly, this investment is shown as Loans at fair value and Asset-backed financing of variable interest entities on our consolidated balance sheet (3) Primarily consists of legacy distressed loan portfolio; net new investments also reflect sales in performing and non-performing loans as a part of PMT’s strategy to exit the investments; includes $3.4 million in carrying value of real estate acquired in settlement of loans at 9/30/24 (4) MBS = Mortgage-backed securities; net new investments in Agency MBS represents rebalancing of the MBS portfolio (considered along with to be announced hedges in managing PMT’s interest rate risk) and runoff 18 (5) Change in investments represents new investments net of sales, liquidations, and runoff
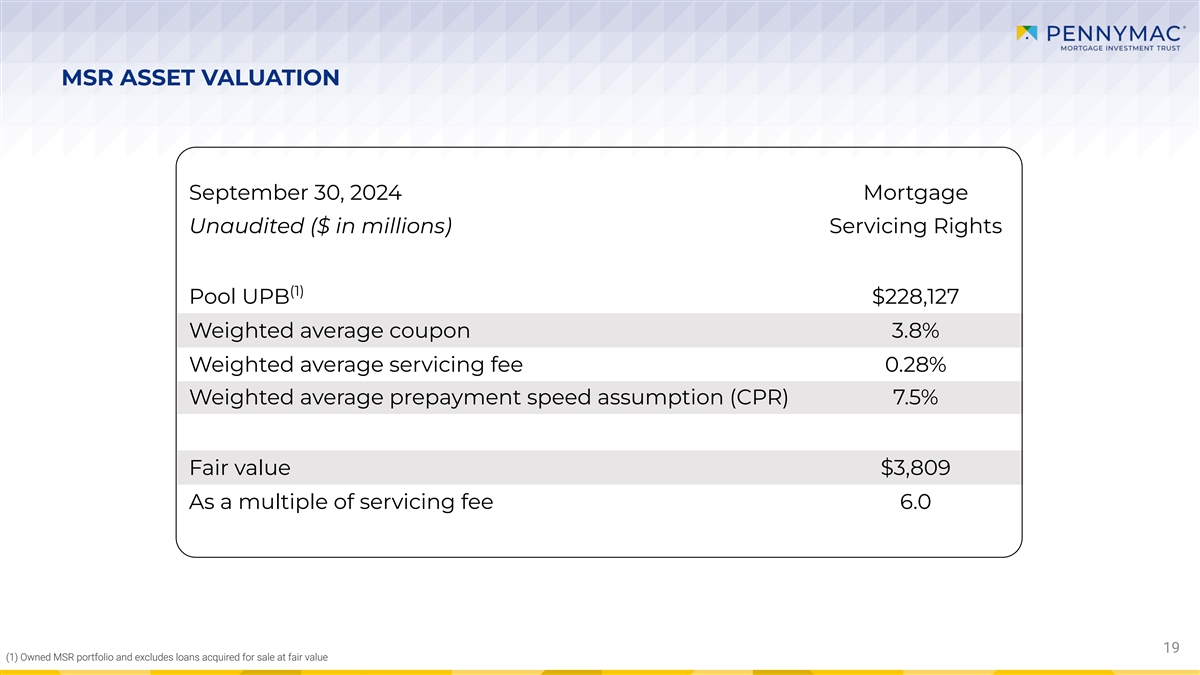
MSR ASSET VALUATION September 30, 2024 Mortgage Unaudited ($ in millions) Servicing Rights (1) Pool UPB $228,127 Weighted average coupon 3.8% Weighted average servicing fee 0.28% Weighted average prepayment speed assumption (CPR) 7.5% Fair value $3,809 As a multiple of servicing fee 6.0 19 (1) Owned MSR portfolio and excludes loans acquired for sale at fair value
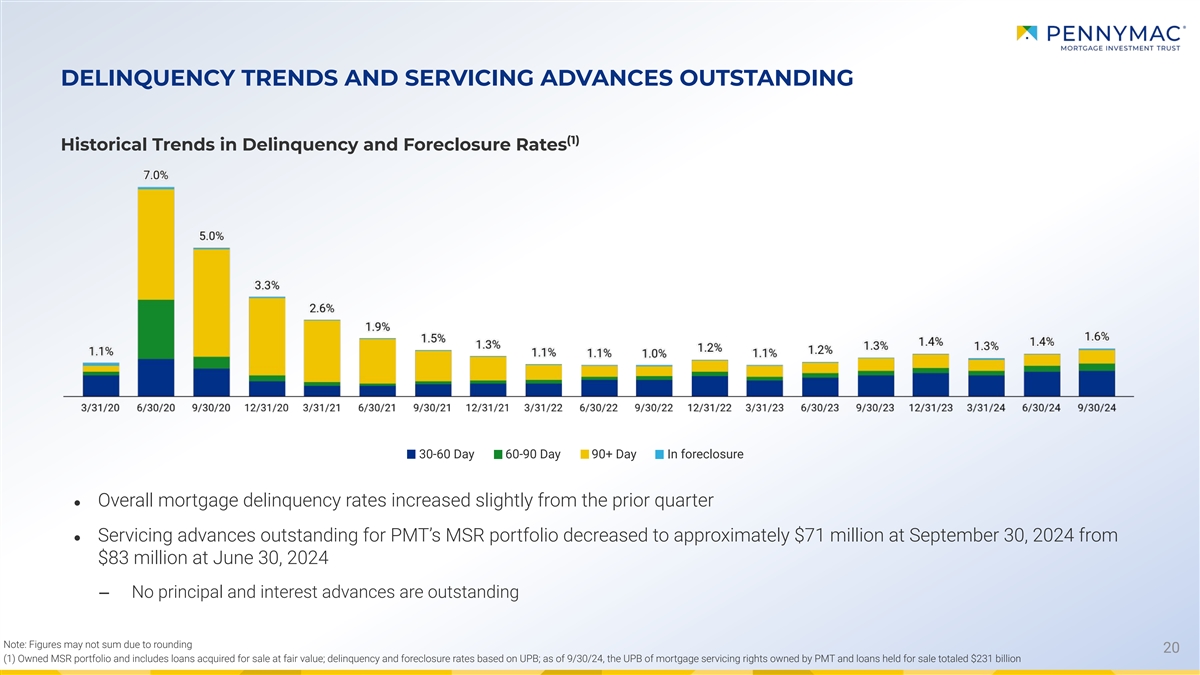
DELINQUENCY TRENDS AND SERVICING ADVANCES OUTSTANDING (1) Historical Trends in Delinquency and Foreclosure Rates 30-60 Day 60-90 Day 90+ Day In foreclosure ● Overall mortgage delinquency rates increased slightly from the prior quarter ● Servicing advances outstanding for PMT’s MSR portfolio decreased to approximately $71 million at September 30, 2024 from $83 million at June 30, 2024 ‒ No principal and interest advances are outstanding Note: Figures may not sum due to rounding 20 (1) Owned MSR portfolio and includes loans acquired for sale at fair value; delinquency and foreclosure rates based on UPB; as of 9/30/24, the UPB of mortgage servicing rights owned by PMT and loans held for sale totaled $231 billion
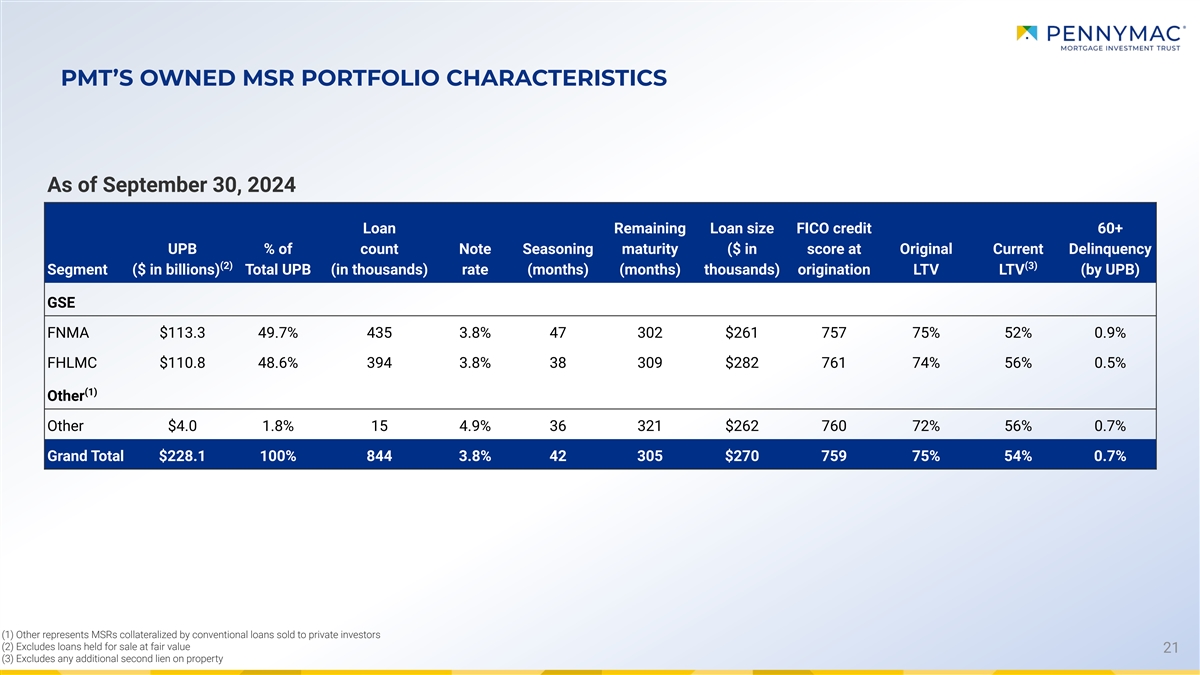
PMT’S OWNED MSR PORTFOLIO CHARACTERISTICS As of September 30, 2024 Loan Remaining Loan size FICO credit 60+ UPB % of count Note Seasoning maturity ($ in score at Original Current Delinquency (2) (3) Segment ($ in billions) Total UPB (in thousands) rate (months) (months) thousands) origination LTV LTV (by UPB) GSE FNMA $113.3 49.7% 435 3.8% 47 302 $261 757 75% 52% 0.9% FHLMC $110.8 48.6% 394 3.8% 38 309 $282 761 74% 56% 0.5% (1) Other Other $4.0 1.8% 15 4.9% 36 321 $262 760 72% 56% 0.7% Grand Total $228.1 100% 844 3.8% 42 305 $270 759 75% 54% 0.7% (1) Other represents MSRs collateralized by conventional loans sold to private investors (2) Excludes loans held for sale at fair value 21 (3) Excludes any additional second lien on property
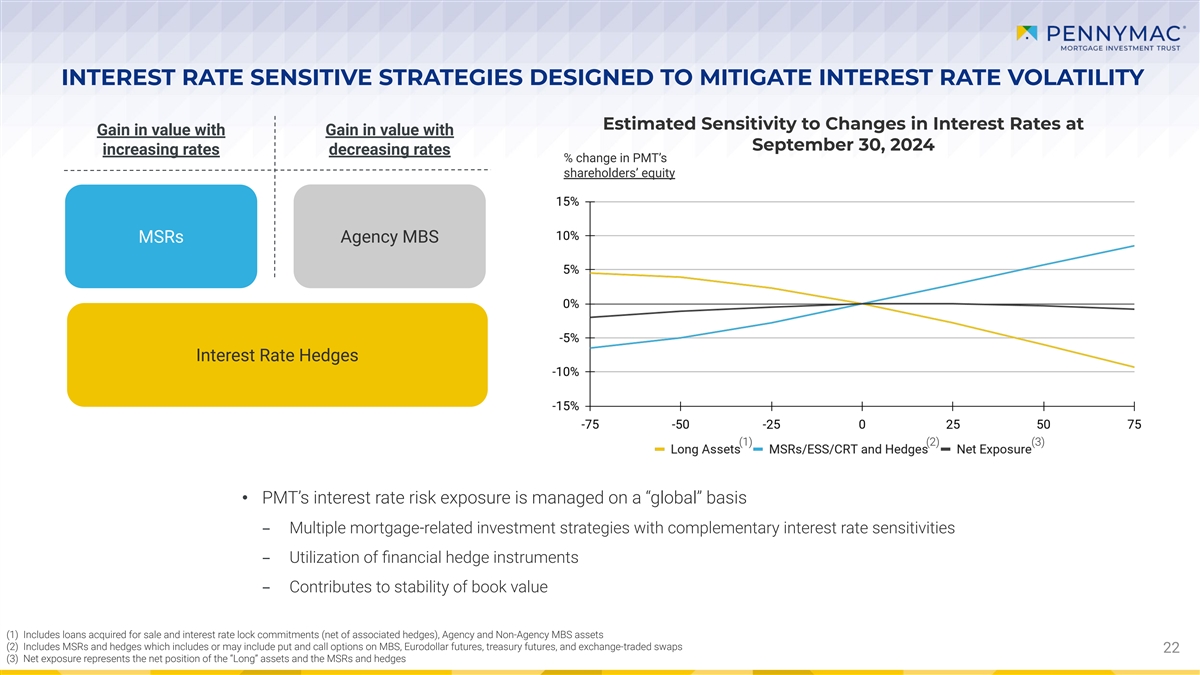
INTEREST RATE SENSITIVE STRATEGIES DESIGNED TO MITIGATE INTEREST RATE VOLATILITY Estimated Sensitivity to Changes in Interest Rates at Gain in value with Gain in value with September 30, 2024 increasing rates decreasing rates % change in PMT’s shareholders’ equity MSRs Agency MBS Interest Rate Hedges (1) (2) (3) • PMT’s interest rate risk exposure is managed on a “global” basis – Multiple mortgage-related investment strategies with complementary interest rate sensitivities – Utilization of financial hedge instruments – Contributes to stability of book value (1) Includes loans acquired for sale and interest rate lock commitments (net of associated hedges), Agency and Non-Agency MBS assets (2) Includes MSRs and hedges which includes or may include put and call options on MBS, Eurodollar futures, treasury futures, and exchange-traded swaps 22 (3) Net exposure represents the net position of the “Long” assets and the MSRs and hedges
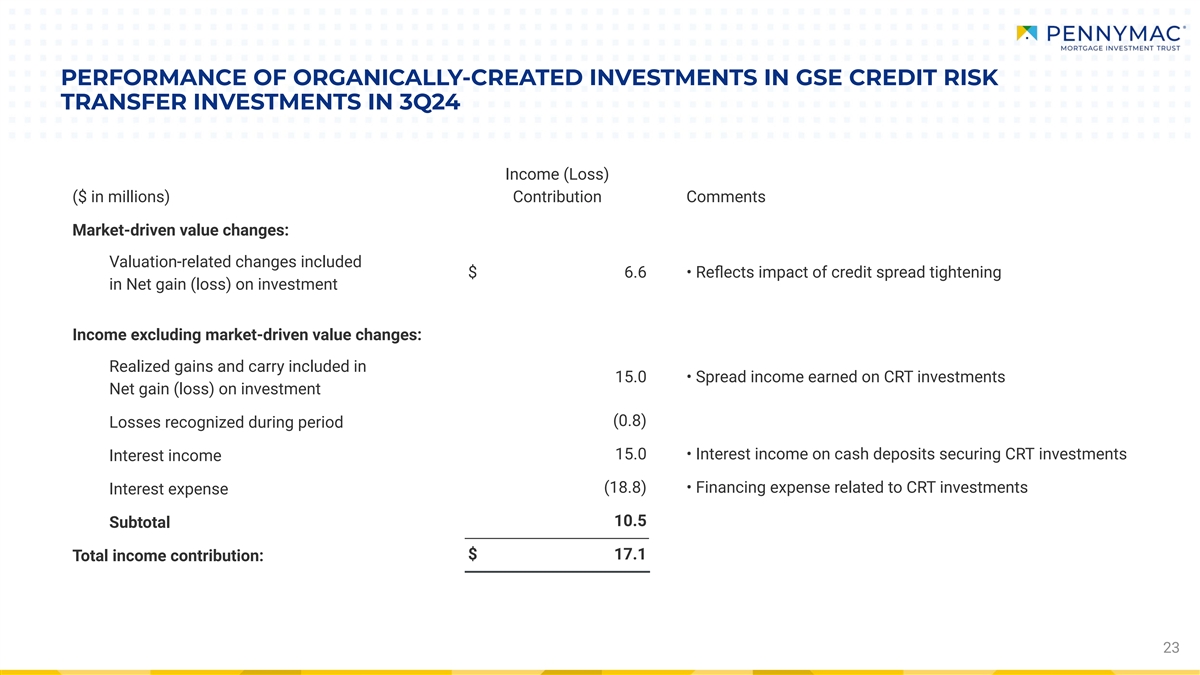
PERFORMANCE OF ORGANICALLY-CREATED INVESTMENTS IN GSE CREDIT RISK TRANSFER INVESTMENTS IN 3Q24 Income (Loss) ($ in millions) Contribution Comments Market-driven value changes: Valuation-related changes included $ 6.6 • Reflects impact of credit spread tightening in Net gain (loss) on investment Income excluding market-driven value changes: Realized gains and carry included in 15.0 • Spread income earned on CRT investments Net gain (loss) on investment (0.8) Losses recognized during period 15.0 • Interest income on cash deposits securing CRT investments Interest income (18.8) • Financing expense related to CRT investments Interest expense 10.5 Subtotal $ 17.1 Total income contribution: 23
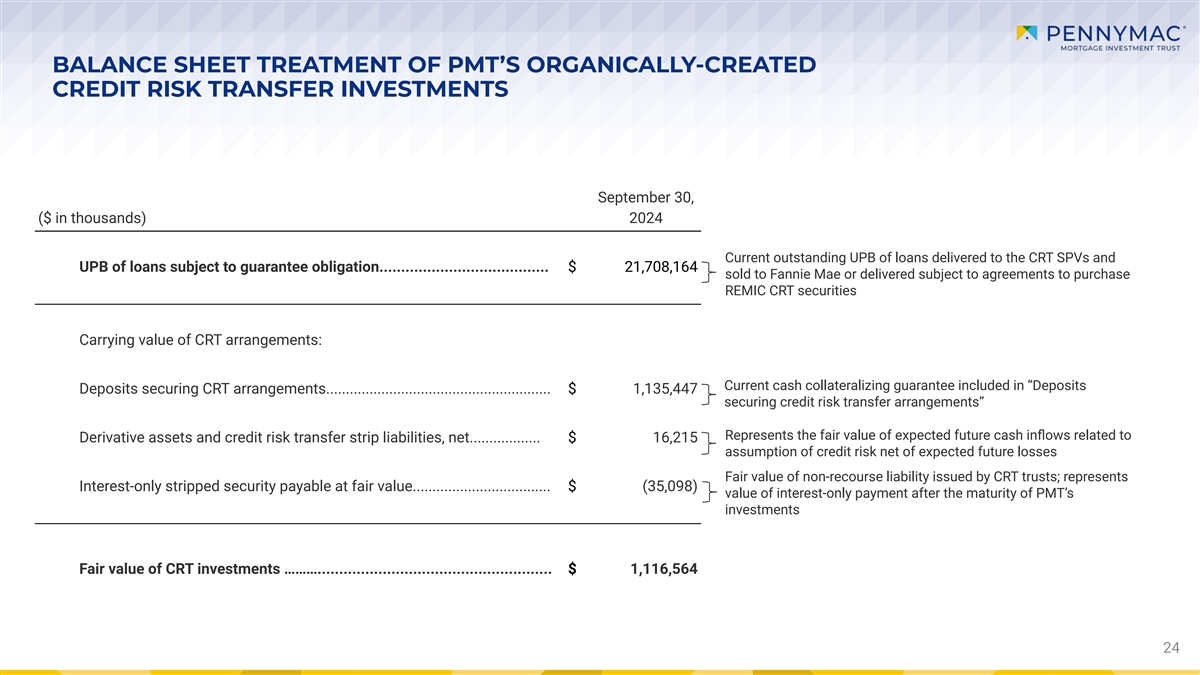
BALANCE SHEET TREATMENT OF PMT’S ORGANICALLY-CREATED CREDIT RISK TRANSFER INVESTMENTS September 30, ($ in thousands) 2024 Current outstanding UPB of loans delivered to the CRT SPVs and UPB of loans subject to guarantee obligation....................................... $ 21,708,164 sold to Fannie Mae or delivered subject to agreements to purchase REMIC CRT securities Carrying value of CRT arrangements: Current cash collateralizing guarantee included in “Deposits Deposits securing CRT arrangements......................................................... $ 1,135,447 securing credit risk transfer arrangements” Represents the fair value of expected future cash inflows related to Derivative assets and credit risk transfer strip liabilities, net.................. $ 16,215 assumption of credit risk net of expected future losses Fair value of non-recourse liability issued by CRT trusts; represents Interest-only stripped security payable at fair value................................... $ (35,098) value of interest-only payment after the maturity of PMT’s investments Fair value of CRT investments ………...................................................... $ 1,116,564 24

PMT’S ORGANICALLY-CREATED INVESTMENTS IN CREDIT RISK TRANSFER L Street Securities L Street Securities L Street Securities PMTT1 PMTT2 PMTT3 2017-PM1 2019-PMT1 2020-PMT1 Total (May 2015 - Jul 2015) (Aug 2015 - Feb 2016) (Feb 2016 - Aug 2016) (Aug 2016 - May 2018) (Jun 2018 - Mar 2019) (Apr 2019 - Sep 2020) At At At At At At At 9/30/24 9/30/24 9/30/24 9/30/24 9/30/24 9/30/24 9/30/24 Inception Inception Inception Inception Inception Inception Inception UPB in billions $1.2 $0.1 $4.2 $0.5 $6.5 $1.0 $22.8 $3.5 $23.6 $2.6 $58.3 $14.0 $116.5 $21.7 Loan Count 4,113 704 15,146 2,583 21,467 4,433 82,086 17,087 84,521 12,158 193,310 58,619 400,643 95,584 % Purchase 67.6% 67.8% 71.4% 71.9% 68.6% 70.6% 73.6% 73.1% 81.7% 79.9% 61.6% 61.2% 69.1% 66.0% (1) WA FICO 742 744 742 743 749 750 746 745 746 736 758 758 752 753 (1) WA LTV 81.3% 80.6% 81.8% 80.9% 81.4% 80.8% 82.5% 81.9% 83.8% 84.1% 82.5% 82.4% 82.7% 82.4% 60+ Days Delinquent 5 13 32 135 290 510 985 by Loan Count 60+ Days Delinquent 0.587% 0.607% 0.917% 0.906% 3.067% 1.021% 1.232% by UPB 180+ Days Delinquent - 1 - 8 84 118 211 Loan Count Actual and Principal $2,109 $6,060 $9,091 $28,831 $648 $781 $47,519 (2) Losses ($k) Interest Reduction $18,237 $17,872 $36,110 (3) ($k) (1) FICO and LTV metrics at origination (2) Losses due to liquidation of reference pool collateral 25 (3) Interest reduction due to modification of reference pool collateral
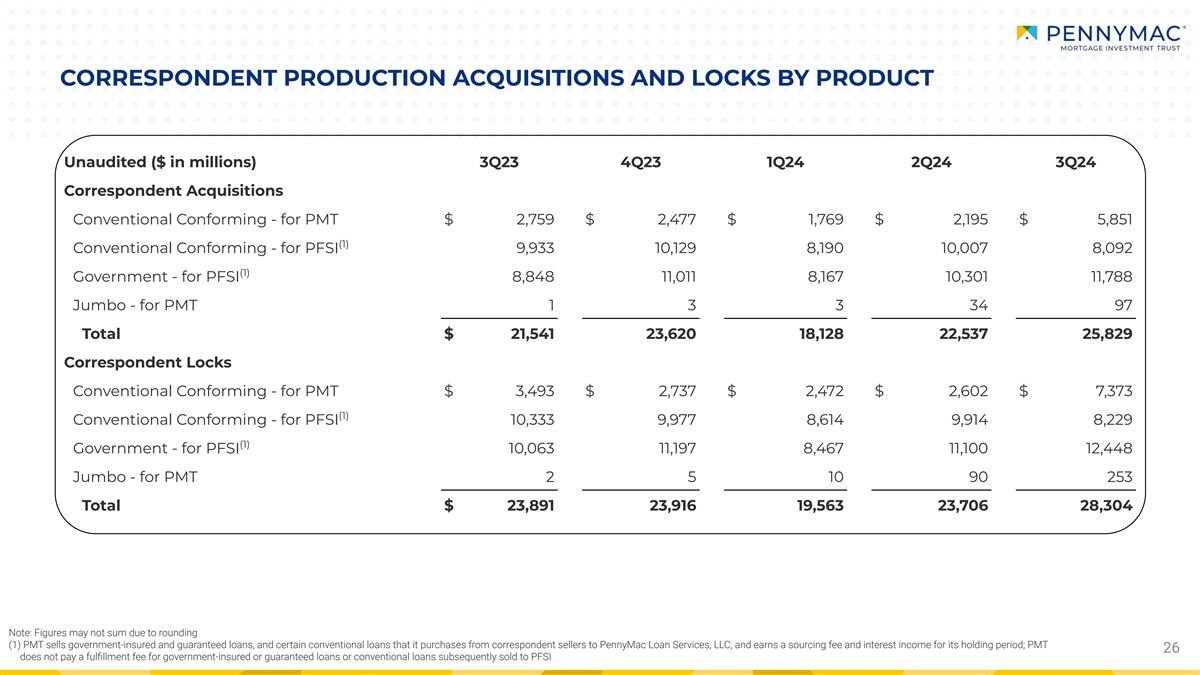
CORRESPONDENT PRODUCTION ACQUISITIONS AND LOCKS BY PRODUCT Unaudited ($ in millions) 3Q23 4Q23 1Q24 2Q24 3Q24 Correspondent Acquisitions Conventional Conforming - for PMT $ 2,759 $ 2,477 $ 1,769 $ 2,195 $ 5,851 (1) Conventional Conforming - for PFSI 9,933 10,129 8,190 10,007 8,092 (1) Government - for PFSI 8,848 11,011 8,167 10,301 11,788 Jumbo - for PMT 1 3 3 34 97 Total $ 21,541 23,620 18,128 22,537 25,829 Correspondent Locks Conventional Conforming - for PMT $ 3,493 $ 2,737 $ 2,472 $ 2,602 $ 7,373 (1) Conventional Conforming - for PFSI 10,333 9,977 8,614 9,914 8,229 (1) Government - for PFSI 10,063 11,197 8,467 11,100 12,448 Jumbo - for PMT 2 5 10 90 253 Total $ 23,891 23,916 19,563 23,706 28,304 Note: Figures may not sum due to rounding (1) PMT sells government-insured and guaranteed loans, and certain conventional loans that it purchases from correspondent sellers to PennyMac Loan Services, LLC, and earns a sourcing fee and interest income for its holding period; PMT 26 does not pay a fulfillment fee for government-insured or guaranteed loans or conventional loans subsequently sold to PFSI

27