UNITED STATES
SECURITIES AND EXCHANGE COMMISSION
Washington, D.C. 20549
FORM 6-K
REPORT OF FOREIGN PRIVATE ISSUER PURSUANT TO RULE 13a-16 OR 15d-16 UNDER THE SECURITIES EXCHANGE ACT OF 1934
For the month of November 2020
Commission File Number: 001-36298
GeoPark Limited
(Exact name of registrant as specified in its charter)
Calle 94 N° 11-30 8° piso
Bogota, Colombia
(Address of principal executive office)
Indicate by check mark whether the registrant files or will file annual reports under cover of Form 20-F or Form 40-F:
Form 20-F | X |
| Form 40-F |
Indicate by check mark if the registrant is submitting the Form 6-K in paper as permitted by Regulation S-T Rule 101(b)(1):
Yes |
| No | X |
Indicate by check mark if the registrant is submitting the Form 6-K in paper as permitted by Regulation S-T Rule 101(b)(7):
Yes |
| No | X |
GEOPARK LIMITED
TABLE OF CONTENTS
ITEM
| |
1. | Interim Condensed Consolidated Financial Statements and Explanatory Notes for the three-months and nine-months period ended September 30, 2019 and 2020. |
Item 1
GEOPARK LIMITED
INTERIM CONDENSED CONSOLIDATED
FINANCIAL STATEMENTS
AND EXPLANATORY NOTES
For the three-months and nine-months period ended September 30, 2019 and 2020
CONDENSED CONSOLIDATED STATEMENT OF INCOME
| | | | | | | | | | |
|
| |
| Three-months |
| Three-months | | Nine-months | | Nine-months |
| | |
| period ended |
| period ended | | period ended | | period ended |
| | | | September 30, | | September 30, | | September 30, | | September 30, |
| | | | 2020 |
| 2019 | | 2020 |
| 2019 |
Amounts in US$ ´000 | | Note |
| (Unaudited) |
| (Unaudited) | | (Unaudited) | | (Unaudited) |
REVENUE |
| 3 |
| 98,147 |
| 151,202 | | 287,036 | | 470,851 |
Commodity risk management contracts |
| 4 |
| 2,722 |
| 4,438 | | 25,602 | | (16,015) |
Production and operating costs |
| 5 |
| (28,404) |
| (41,734) | | (90,193) | | (126,666) |
Geological and geophysical expenses |
| 6 |
| (2,777) |
| (4,256) | | (10,186) | | (12,861) |
Administrative expenses |
| 7 |
| (10,361) |
| (14,467) | | (34,364) | | (39,526) |
Selling expenses |
| 8 |
| (1,294) |
| (2,412) | | (4,894) | | (11,271) |
Depreciation |
|
|
| (26,695) |
| (26,544) | | (89,318) | | (76,816) |
Write-off of unsuccessful exploration efforts |
| 10 |
| (575) |
| (8,405) | | (3,780) | | (9,268) |
Impairment loss recognized for non-financial assets | | 19 | | (1,007) | | — | | (98,488) | | — |
Other (expenses) income |
|
|
| (1,278) |
| (1,437) | | (8,939) | | 578 |
OPERATING PROFIT (LOSS) |
|
|
| 28,478 |
| 56,385 | | (27,524) | | 179,006 |
Financial expenses |
| 9 |
| (16,637) |
| (9,341) | | (47,936) | | (28,690) |
Financial income |
| 9 |
| 814 |
| 700 | | 2,911 | | 2,140 |
Foreign exchange (loss) gain |
| 9 |
| (674) |
| 770 | | (6,735) | | (671) |
PROFIT (LOSS) BEFORE INCOME TAX |
|
|
| 11,981 |
| 48,514 | | (79,284) | | 151,785 |
Income tax expense |
|
|
| (16,332) |
| (41,757) | | (34,463) | | (93,859) |
(LOSS) PROFIT FOR THE PERIOD |
|
|
| (4,351) | | 6,757 | | (113,747) | | 57,926 |
(Losses) Earnings per share (in US$) for (loss) profit attributable to owners of the Company. Basic |
|
|
| (0.07) |
| 0.11 | | (1.88) | | 0.96 |
(Losses) Earnings per share (in US$) for (loss) profit attributable to owners of the Company. Diluted |
|
|
| (0.07) |
| 0.11 | | (1.88) | | 0.93 |
The above condensed consolidated statement of income should be read in conjunction with the accompanying notes.
3
CONDENSED CONSOLIDATED STATEMENT OF COMPREHENSIVE INCOME
| | | | | | | | |
|
| Three-months |
| Three-months | | Nine-months |
| Nine-months |
|
| period ended |
| period ended | | period ended |
| period ended |
| | September 30, | | September 30, | | September 30, | | September 30, |
|
| 2020 |
| 2019 | | 2020 |
| 2019 |
Amounts in US$ ´000 |
| (Unaudited) |
| (Unaudited) | | (Unaudited) |
| (Unaudited) |
(Loss) Profit for the period |
| (4,351) |
| 6,757 | | (113,747) |
| 57,926 |
Other comprehensive income |
|
|
| | |
|
| |
Items that may be subsequently reclassified to profit or loss: |
|
|
| | |
|
| |
Currency translation differences |
| (778) |
| (2,455) | | (10,960) |
| (2,104) |
Losses on cash flow hedges |
| — | | — | | (6,770) |
| — |
Income tax relating to losses on cash flow hedges |
| — |
| — | | 2,166 |
| — |
Other comprehensive loss for the period |
| (778) |
| (2,455) | | (15,564) |
| (2,104) |
Total comprehensive (loss) profit for the period |
| (5,129) |
| 4,302 | | (129,311) |
| 55,822 |
The above condensed consolidated statement of comprehensive income should be read in conjunction with the accompanying notes.
4
CONDENSED CONSOLIDATED STATEMENT OF FINANCIAL POSITION
| | | | | | |
|
| Note |
| At September 30, 2020 |
| Year ended |
Amounts in US$ ´000 | | |
| (Unaudited) |
| December 31, 2019 |
ASSETS |
|
|
|
|
|
|
NON CURRENT ASSETS |
|
|
|
|
|
|
Property, plant and equipment |
| 10 |
| 716,850 |
| 567,788 |
Right-of-use assets |
|
|
| 20,368 |
| 13,462 |
Prepayments and other receivables |
|
|
| 1,142 |
| 7,031 |
Other financial assets |
|
|
| 11,130 |
| 10,985 |
Deferred income tax asset |
|
|
| 27,723 |
| 26,934 |
TOTAL NON CURRENT ASSETS |
|
|
| 777,213 |
| 626,200 |
CURRENT ASSETS |
|
|
|
|
|
|
Inventories |
|
|
| 11,920 |
| 11,447 |
Trade receivables |
|
|
| 37,064 |
| 44,178 |
Prepayments and other receivables |
|
|
| 42,750 |
| 51,016 |
Derivative financial instrument assets |
| 15 |
| 11,807 |
| 8,097 |
Other financial assets |
|
|
| 5,765 |
| 14 |
Cash and cash equivalents |
|
|
| 163,747 |
| 111,180 |
Asset held for sale | | 17 | | 1,862 | | — |
TOTAL CURRENT ASSETS |
|
|
| 274,915 |
| 225,932 |
TOTAL ASSETS |
|
|
| 1,052,128 |
| 852,132 |
EQUITY |
|
|
|
|
|
|
Equity attributable to owners of the Company |
|
|
|
|
|
|
Share capital |
| 11 |
| 61 |
| 59 |
Share premium |
|
|
| 175,816 |
| 173,716 |
Reserves |
|
|
| 92,221 |
| 112,471 |
Accumulated losses |
|
|
| (264,099) |
| (153,361) |
TOTAL EQUITY |
|
|
| 3,999 |
| 132,885 |
LIABILITIES |
|
|
|
|
|
|
NON CURRENT LIABILITIES |
|
|
|
|
|
|
Borrowings |
| 12 |
| 767,392 |
| 420,138 |
Lease liabilities |
|
|
| 10,501 |
| 5,801 |
Provisions and other long-term liabilities |
| 13 |
| 76,727 |
| 62,062 |
Deferred income tax liability |
|
|
| 26,852 |
| 10,850 |
Trade and other payables |
| 14 |
| 5,251 |
| 5,475 |
TOTAL NON CURRENT LIABILITIES |
|
|
| 886,723 |
| 504,326 |
CURRENT LIABILITIES |
|
|
|
|
|
|
Borrowings |
| 12 |
| 4,782 |
| 17,281 |
Lease liabilities |
|
|
| 11,019 |
| 7,442 |
Derivative financial instrument liabilities |
| 15 |
| 1,328 |
| 952 |
Current income tax liability |
|
|
| 52,007 |
| 57,901 |
Trade and other payables |
| 14 |
| 92,218 |
| 131,345 |
Liabilities associated with assets held for sale | | 17 | | 52 | | — |
TOTAL CURRENT LIABILITIES |
|
|
| 161,406 |
| 214,921 |
TOTAL LIABILITIES |
|
|
| 1,048,129 |
| 719,247 |
TOTAL EQUITY AND LIABILITIES |
|
|
| 1,052,128 |
| 852,132 |
The above condensed consolidated statement of financial position should be read in conjunction with the accompanying notes.
5
CONDENSED CONSOLIDATED STATEMENT OF CHANGES IN EQUITY
| | | | | | | | | | | | |
|
| Attributable to owners of the Company | ||||||||||
|
| Share |
| Share |
| Other |
| Translation |
| Accumulated |
| |
Amount in US$ '000 |
| Capital |
| Premium |
| Reserve |
| Reserve |
| losses | | Total |
Equity at January 1, 2019 |
| 60 |
| 237,840 |
| 114,131 |
| (2,322) |
| (206,688) |
| 143,021 |
Comprehensive income: |
|
|
|
|
|
|
|
|
|
|
|
|
Profit for the nine-months period |
| — |
| — |
| — |
| — |
| 57,926 |
| 57,926 |
Other comprehensive loss for the period |
| — |
| — |
| — |
| (2,104) |
| — |
| (2,104) |
Total comprehensive income for the period ended September 30, 2019 |
| — |
| — |
| — |
| (2,104) |
| 57,926 |
| 55,822 |
Transactions with owners: |
|
|
|
|
|
|
|
|
|
|
|
|
Share-based payment |
| 3 | | 7,020 | | — |
| — |
| (5,581) |
| 1,442 |
Repurchase of shares |
| (4) | | (68,996) |
| — |
| — |
| — |
| (69,000) |
Total transactions with owners for the period ended September 30, 2019 |
| (1) |
| (61,976) |
| — |
| — |
| (5,581) |
| (67,558) |
Balance at September 30, 2019 (Unaudited) |
| 59 |
| 175,864 |
| 114,131 |
| (4,426) |
| (154,343) |
| 131,285 |
| | | | | | | | | | | | |
Balance at January 1, 2020 |
| 59 |
| 173,716 |
| 116,291 |
| (3,820) |
| (153,361) |
| 132,885 |
Comprehensive income: |
|
|
|
|
|
|
|
|
|
|
|
|
Loss for the nine-months period |
| — |
| — |
| — |
| — |
| (113,747) |
| (113,747) |
Other comprehensive loss for the period |
| — |
| — |
| (4,604) |
| (10,960) |
| — |
| (15,564) |
Total comprehensive income for the period ended September 30, 2020 |
| — |
| — |
| (4,604) |
| (10,960) |
| (113,747) |
| (129,311) |
Transactions with owners: |
|
|
|
|
|
|
|
|
|
|
|
|
Share-based payment |
| 2 |
| 2,828 |
| — |
| — |
| 3,009 |
| 5,839 |
Repurchase of shares |
| (1) |
| (3,070) |
| — |
| — |
| — |
| (3,071) |
Stock distribution | | 1 | | 2,342 | | (2,343) | | — | | — | | — |
Cash distribution | | — | | — | | (2,343) | | — | | — | | (2,343) |
Total transactions with owners for the period ended September 30, 2020 |
| 2 |
| 2,100 |
| (4,686) |
| — |
| 3,009 |
| 425 |
Balance at September 30, 2020 (Unaudited) |
| 61 | | 175,816 |
| 107,001 |
| (14,780) |
| (264,099) |
| 3,999 |
The above condensed consolidated statement of changes in equity should be read in conjunction with the accompanying notes.
6
CONDENSED CONSOLIDATED STATEMENT OF CASH FLOW
| | | | |
|
| Nine-months |
| Nine-months |
|
| period ended |
| period ended |
| | September 30, | | September 30, |
|
| 2020 |
| 2019 |
Amounts in US$ ’000 |
| (Unaudited) |
| (Unaudited) |
Cash flows from operating activities |
|
|
|
|
(Loss) Profit for the period |
| (113,747) |
| 57,926 |
Adjustments for: |
|
|
| |
Income tax expense |
| 34,463 |
| 93,859 |
Depreciation |
| 89,318 |
| 76,816 |
Loss on disposal of property, plant and equipment | | 229 | | 7 |
Write-off of unsuccessful exploration efforts |
| 3,780 |
| 9,268 |
Impairment loss for non-financial assets | | 98,488 | | — |
Amortization of other long-term liabilities |
| (319) |
| (428) |
Accrual of borrowing interests |
| 36,251 |
| 22,541 |
Unwinding of long-term liabilities |
| 4,424 |
| 3,492 |
Accrual of share-based payment |
| 5,839 |
| 1,442 |
Foreign exchange (gain) loss |
| (2,679) |
| 3,514 |
Unrealized (gain) loss on commodity risk management contracts |
| (9,862) |
| 19,902 |
Income tax paid |
| (22,857) |
| (88,638) |
Change in working capital |
| (31,702) |
| (42,813) |
Cash flows from operating activities – net |
| 91,626 |
| 156,888 |
Cash flows from investing activities |
|
|
|
|
Purchase of property, plant and equipment |
| (49,289) |
| (88,162) |
Proceeds from disposal of long-term assets | | — | | 7,066 |
Acquisition of business, net of cash acquired (Note 17) |
| (272,335) |
| — |
Cash flows used in investing activities – net |
| (321,624) |
| (81,096) |
Cash flows from financing activities |
|
|
|
|
Proceeds from borrowings |
| 350,000 |
| — |
Debt issuance costs paid |
| (7,507) |
| — |
Principal paid |
| (3,575) |
| (4,932) |
Interest paid |
| (37,483) |
| (28,483) |
Lease payments |
| (7,319) |
| (4,317) |
Repurchase of shares |
| (3,071) |
| (69,000) |
Cash distribution | | (2,343) | | — |
Payments for transactions with former non-controlling interest | | (4,500) | | (15,000) |
Cash flows from (used in) financing activities - net |
| 284,202 |
| (121,732) |
Net increase in cash and cash equivalents |
| 54,204 |
| (45,940) |
Cash and cash equivalents at January 1 |
| 111,180 |
| 127,727 |
Currency translation differences |
| (1,637) |
| (188) |
Cash and cash equivalents at the end of the period |
| 163,747 |
| 81,599 |
Ending Cash and cash equivalents are specified as follows: |
|
|
|
|
Cash at bank and bank deposits |
| 163,725 |
| 81,575 |
Cash in hand |
| 22 |
| 24 |
Cash and cash equivalents |
| 163,747 |
| 81,599 |
The above condensed consolidated statement of cash flow should be read in conjunction with the accompanying notes.
7
EXPLANATORY NOTES TO THE INTERIM CONDENSED CONSOLIDATED FINANCIAL STATEMENTS
Note 1
General information
GeoPark Limited (the “Company”) is a company incorporated under the law of Bermuda. The Registered Office address is Clarendon House, 2 Church Street, Hamilton HM11, Bermuda.
The principal activity of the Company and its subsidiaries (the “Group” or “GeoPark”) is the exploration, development and production for oil and gas reserves in Colombia, Chile, Brazil, Argentina, Peru and Ecuador.
This condensed consolidated interim financial statements were authorized for issue by the Board of Directors on November 4, 2020.
Basis of Preparation
The condensed consolidated interim financial statements of GeoPark Limited are presented in accordance with IAS 34 “Interim Financial Reporting”. They do not include all of the information required for full annual financial statements, and should be read in conjunction with the annual consolidated financial statements as of and for the year ended December 31, 2019, which have been prepared in accordance with IFRS.
The condensed consolidated interim financial statements have been prepared in accordance with the accounting policies applied in the most recent annual consolidated financial statements. The Group has not early adopted any standard, interpretation or amendment that has been issued but is not yet effective. Several amendments and interpretations apply for the first time in 2020, but do not have an impact on the condensed consolidated interim financial statements of the Group.
Whenever necessary, certain comparative amounts have been reclassified to conform to changes in presentation in the current period.
Taxes on income in the interim periods are accrued using the tax rate that would be applicable to expected total annual profit or loss.
The activities of the Group are not subject to significant seasonal changes.
Estimates
The preparation of interim financial information requires the use of certain critical accounting estimates. It also requires management to exercise its judgement in the process of applying the Group’s accounting policies. Actual results may differ from these estimates.
In preparing these condensed consolidated interim financial statements, the significant judgements made by management in applying the Group’s accounting policies and the key sources of estimation uncertainty were the same as those that applied to the annual consolidated financial statements as of and for the year ended December 31, 2019.
8
Note 1 (Continued)
Financial risk management
The Group’s activities expose it to a variety of financial risks: currency risk, price risk, credit risk- concentration, funding and liquidity risk, interest risk and capital risk. The condensed consolidated interim financial statements do not include all financial risk management information and disclosures required in the annual consolidated financial statements, and should be read in conjunction with the Group’s annual consolidated financial statements as of and for the year ended December 31, 2019.
The 2019 coronavirus (“COVID 19”) outbreak is currently having an indeterminable adverse impact on the world economy. While the COVID 19 has begun to have numerous worldwide effects on general commercial activity, one such effect is that the price of crude oil dropped. At this time, given the uncertainty of the lasting effect of the COVID 19 outbreak, its impact on the Group’s business cannot be completely determined.
The Group is continually reviewing its exposure to the current market conditions and adjusting the 2020 capital expenditures program which remains flexible, quickly adaptable and expandable if prices recover. The Group also continues to add new oil hedges, increasing its price risk protection within the next fifteen months. GeoPark maintained a strong cash position of US$ 163,747,000, has signed a prepayment agreement with Trafigura for up to US$ 75,000,000 and has available US$ 132,933,000 in uncommitted credit lines as of September 30, 2020. For more detailed information, see Note 18.
Subsidiary undertakings
The following chart illustrates the main companies of the Group structure as of September 30, 2020:
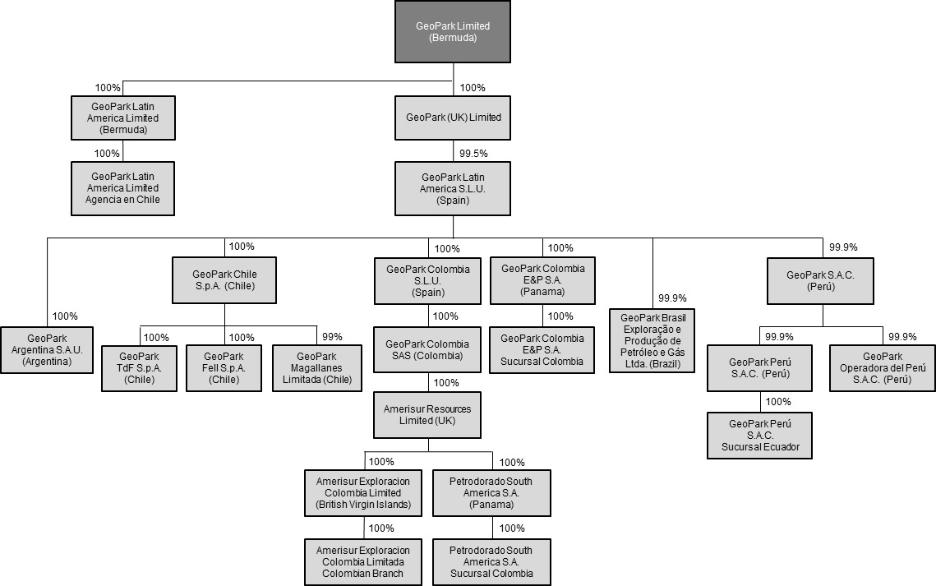
In January 2020, Amerisur Resources Limited and its subsidiaries were acquired by GeoPark Colombia S.A.S. Also during 2020, GeoPark Chile S.p.A. and GeoPark Argentina S.A.U. were contributed to GeoPark Latin America S.L.U.
9
Note 1 (Continued)
Subsidiary undertakings (Continued)
Details of the subsidiaries and joint operations of the Group are set out below:
| | | | |
|
| Name and registered office |
| Ownership interest |
Subsidiaries |
| GeoPark Argentina S.A.U. (Argentina) |
| 100% (a) |
|
| GeoPark Latin America Limited (Bermuda) |
| 100% |
|
| GeoPark Latin America Limited – Agencia en Chile (Chile) |
| 100% (a) |
|
| GeoPark Brasil Exploração y Produção de Petróleo e Gás Ltda. (Brazil) |
| 100% (a) |
|
| GeoPark Chile S.p.A. (Chile) |
| 100% (a) |
|
| GeoPark Fell S.p.A. (Chile) |
| 100% (a) |
|
| GeoPark Magallanes Limitada (Chile) |
| 100% (a) |
|
| GeoPark TdF S.p.A. (Chile) |
| 100% (a) |
|
| GeoPark Colombia S.A.S. (Colombia) |
| 100% (a) |
|
| GeoPark Latin America S.L.U. (Spain) |
| 100% (a) |
|
| GeoPark Colombia S.L.U. (Spain) |
| 100% (a) |
|
| GeoPark S.A.C. (Peru) |
| 100% (a) |
|
| GeoPark Perú S.A.C. (Peru) |
| 100% (a) |
|
| GeoPark Operadora del Perú S.A.C. (Peru) |
| 100% (a) |
|
| GeoPark Colombia E&P S.A. (Panama) |
| 100% (a) |
|
| GeoPark Colombia E&P Sucursal Colombia (Colombia) |
| 100% (a) |
|
| GeoPark Mexico S.A.P.I. de C.V. (Mexico) |
| 100% (a) (b) |
|
| GeoPark E&P S.A.P.I. de C.V. (Mexico) |
| 100% (a) (b) |
|
| GeoPark (UK) Limited (United Kingdom) |
| 100% |
|
| GeoPark Perú S.A.C. Sucursal Ecuador (Ecuador) |
| 100% (a) |
|
| Amerisur Resources Limited (United Kingdom) |
| 100% (a) |
|
| Amerisur Exploración Colombia Limited (British Virgin Islands) |
| 100% (a) |
|
| Amerisur Exploración Colombia Limited Colombian Branch (Colombia) |
| 100% (a) |
|
| Yarumal S.A.S. (Colombia) |
| 100% (a) (b) |
|
| Petrodorado South America S.A. (Panama) |
| 100% (a) |
|
| Petrodorado South America S.A. Sucursal Colombia (Colombia) |
| 100% (a) |
|
| Fenix Oil & Gas Limited (British Virgin Islands) |
| 100% (a) (b) |
|
| Fenix Oil & Gas Limited Sucursal Colombia (Colombia) |
| 100% (a) (b) |
|
| Amerisurexplor Ecuador S.A. (Ecuador) |
| 100% (a) (b) |
|
| Amerisur S.A. (Paraguay) |
| 100% (a) (b) |
| (a) | Indirectly owned. |
| (b) | Dormant companies. |
10
Note 1 (Continued)
Subsidiary undertakings (Continued)
| | | | |
|
| Name and registered office |
| Ownership interest |
Joint operations |
| Flamenco Block (Chile) |
| 50% (a) |
|
| Campanario Block (Chile) |
| 50% (a) |
|
| Isla Norte Block (Chile) |
| 60% (a) |
|
| Llanos 34 Block (Colombia) |
| 45% (a) |
|
| Llanos 32 Block (Colombia) |
| 12.5% |
|
| Puelen Block (Argentina) |
| 18% (b) |
|
| Sierra del Nevado Block (Argentina) |
| 18% (b) |
|
| CN-V Block (Argentina) |
| 50% |
|
| Los Parlamentos (Argentina) |
| 50% |
|
| Manati Field (Brazil) |
| 10% |
|
| REC-T-128 Block (Brazil) |
| 70% (a) (c) |
|
| POT-T-785 Block (Brazil) |
| 70% (a) |
|
| Morona Block (Peru) |
| 75% (a) (c) |
|
| Espejo Block (Ecuador) |
| 50% (a) |
|
| Perico Block (Ecuador) |
| 50% |
|
| Llanos 86 Block (Colombia) |
| 50% (a) |
|
| Llanos 87 Block (Colombia) |
| 50% (a) |
|
| Llanos 104 Block (Colombia) |
| 50% (a) |
|
| Llanos 123 Block (Colombia) |
| 50% (a) |
|
| Llanos 124 Block (Colombia) |
| 50% (a) |
|
| CPO-5 Block (Colombia) |
| 30% |
|
| Coati Block (Colombia) |
| 60% (a) |
|
| Mecaya Block (Colombia) |
| 50% (a) |
|
| PUT-8 Block (Colombia) |
| 50% (a) |
|
| PUT-9 Block (Colombia) |
| 50% (a) |
|
| PUT-12 Block (Colombia) |
| 60% (a) |
|
| Tacacho Block (Colombia) |
| 50% (a) |
| | Terecay Block (Colombia) |
| 50% (a) |
| | Llanos 94 Block (Colombia) |
| 50% |
|
| PUT-36 Block (Colombia) |
| 50% (a) |
| (a) | GeoPark is the operator. |
| (b) | In process of relinquishment. |
| (c) | See Note 17. |
Note 2
Segment Information
Operating segments are reported in a manner consistent with the internal reporting provided to the chief operating decision-maker. The chief operating decision-maker, who is responsible for allocating resources and assessing performance of the operating segments, has been identified as the Executive Committee. This committee is integrated by the CEO, COO, CFO and managers in charge of the Geoscience, Operations, Legal and Corporate Governance, People and Sustainability departments. This committee reviews the Group’s internal reporting in order to assess performance and allocate resources. Management has determined the operating segments based on these reports. The committee considers the business from a geographic perspective.
11
Note 2 (Continued)
Segment Information (Continued)
The Executive Committee assesses the performance of the operating segments based on a measure of Adjusted EBITDA. Adjusted EBITDA is defined as profit for the period (determined as if IFRS 16 Leases had not been adopted), before net finance cost, income tax, depreciation, amortization, certain non-cash items such as impairments and write-offs of unsuccessful exploration efforts, accrual of share-based payment, unrealized result on commodity risk management contracts and other items (such as geological and geophysical expenses allocated to capitalized projects and other expenses). Operating Netback is equivalent to Adjusted EBITDA before cash expenses included in Administrative, Geological and Geophysical and Other operating expenses. Other information provided to the Executive Committee is measured in a manner consistent with that in the financial statements.
Nine-months period ended September 30, 2020:
| | | | | | | | | | | | | | | | |
Amounts in US$ '000 |
| Total |
| Colombia |
| Chile |
| Brazil |
| Argentina |
| Peru |
| Ecuador |
| Corporate |
Revenue |
| 287,036 |
| 242,409 |
| 16,895 |
| 8,194 |
| 19,538 |
| — |
| — |
| — |
Sale of crude oil |
| 262,163 |
| 240,855 |
| 3,770 |
| 774 |
| 16,764 |
| — |
| — |
| — |
Sale of gas |
| 24,873 |
| 1,554 |
| 13,125 |
| 7,420 |
| 2,774 |
| — |
| — |
| — |
Production and operating costs |
| (90,193) |
| (65,384) |
| (7,440) |
| (2,639) |
| (14,730) |
| — |
| — |
| — |
Royalties |
| (24,312) |
| (20,195) |
| (582) |
| (686) |
| (2,849) |
| — |
| — |
| — |
Share-based payment |
| (192) |
| (130) |
| (34) |
| — |
| (28) |
| — |
| — |
| — |
Operating costs |
| (65,689) |
| (45,059) |
| (6,824) |
| (1,953) |
| (11,853) |
| — |
| — |
| — |
Depreciation |
| (89,318) |
| (47,885) |
| (25,228) |
| (2,533) |
| (13,253) |
| (336) |
| (21) |
| (62) |
Operating (loss) profit |
| (27,524) |
| 124,626 |
| (71,273) |
| (219) |
| (27,858) |
| (39,273) |
| (567) |
| (12,960) |
Operating Netback |
| 201,750 |
| 184,834 | | 9,268 | | 3,998 | | 3,650 | | — | | — | | — |
Adjusted EBITDA |
| 161,557 |
| 158,083 | | 7,890 | | 2,544 | | 2,883 | | (1,864) | | (521) | | (7,458) |
Nine-months period ended September 30, 2019:
| | | | | | | | | | | | | | |
Amounts in US$ '000 |
| Total |
| Colombia |
| Chile |
| Brazil |
| Argentina |
| Peru |
| Corporate |
Revenue |
| 470,851 |
| 403,839 |
| 24,499 |
| 15,533 |
| 26,980 |
| — |
| — |
Sale of crude oil |
| 434,634 |
| 402,406 | | 8,076 | | 663 | | 23,489 |
| — |
| — |
Sale of gas |
| 36,217 |
| 1,433 | | 16,423 | | 14,870 | | 3,491 |
| — |
| — |
Production and operating costs |
| (126,666) |
| (86,917) |
| (15,546) |
| (4,015) |
| (20,188) |
| — |
| — |
Royalties |
| (47,943) |
| (41,879) | | (897) | | (1,193) | | (3,974) |
| — |
| — |
Share-based payment |
| (329) |
| (231) | | (31) | | (29) | | (38) |
| — |
| — |
Operating costs |
| (78,394) |
| (44,807) | | (14,618) | | (2,793) | | (16,176) |
| — |
| — |
Depreciation |
| (76,816) |
| (34,270) | | (25,737) | | (5,097) | | (11,163) | | (436) | | (113) |
Operating profit (loss) |
| 179,006 |
| 230,892 | | (20,747) | | 4,463 | | (16,615) | | (3,888) | | (15,099) |
Operating Netback |
| 334,558 |
| 310,364 | | 8,705 | | 9,993 | | 5,496 | | — | | — |
Adjusted EBITDA |
| 277,679 |
| 281,519 | | 5,780 | | 7,496 | | 2,813 | | (5,323) | | (14,606) |
| | | | | | | | | | | | | | | | |
Total Assets |
| Total |
| Colombia |
| Chile |
| Brazil |
| Argentina |
| Peru |
| Ecuador |
| Corporate |
September 30, 2020 |
| 1,052,128 |
| 747,750 |
| 184,124 |
| 45,709 |
| 51,060 |
| 8,164 |
| 1,096 |
| 14,225 |
December 31, 2019 |
| 852,132 |
| 357,125 |
| 249,207 |
| 68,480 |
| 79,062 |
| 53,993 |
| 1,119 |
| 43,146 |
12
Note 2 (Continued)
Segment Information (Continued)
A reconciliation of total Operating Netback to total profit (loss) before income tax is provided as follows:
| | | | | | | | |
|
| Three-months |
| Three-months | | Nine-months |
| Nine-months |
|
| period ended |
| period ended | | period ended |
| period ended |
| | September 30, | | September 30, | | September 30, | | September 30, |
| | 2020 | | 2019 | | 2020 |
| 2019 |
Operating Netback |
| 67,674 |
| 107,498 | | 201,750 |
| 334,558 |
Geological and geophysical expenses |
| (2,834) |
| (6,290) | | (10,450) |
| (16,831) |
Administrative expenses |
| (8,737) |
| (14,490) | | (29,743) |
| (40,048) |
Adjusted EBITDA for reportable segments |
| 56,103 |
| 86,718 | | 161,557 |
| 277,679 |
Unrealized gain (loss) on commodity risk management contracts |
| 1,290 |
| 3,038 | | 9,862 |
| (19,902) |
Depreciation (a) |
| (26,695) |
| (26,544) | | (89,318) |
| (76,816) |
Write-off of unsuccessful exploration efforts |
| (575) |
| (8,405) | | (3,780) |
| (9,268) |
Impairment loss recognized for non-financial assets | | (1,007) | | — | | (98,488) | | — |
Share-based payment |
| (1,904) |
| (325) | | (5,839) |
| (1,442) |
Lease accounting - IFRS 16 |
| 2,544 |
| 1,480 | | 7,319 |
| 4,317 |
Others (b) |
| (1,278) |
| 423 | | (8,837) |
| 4,438 |
Operating profit (loss) |
| 28,478 |
| 56,385 | | (27,524) |
| 179,006 |
Financial expenses |
| (16,637) |
| (9,341) | | (47,936) |
| (28,690) |
Financial income |
| 814 |
| 700 | | 2,911 |
| 2,140 |
Foreign exchange (loss) gain |
| (674) |
| 770 | | (6,735) |
| (671) |
Profit (Loss) before tax |
| 11,981 |
| 48,514 | | (79,284) |
| 151,785 |
| (a) | Net of capitalized costs for oil stock included in Inventories. Depreciation includes US$ 2,114,000 (US$ 2,238,000 in 2019) generated by assets not related to production activities. For the three-months period ended September 30, 2020 the amount included in depreciation is US$ 708,000 (US$ 774,000 in 2019). |
| (b) | Includes allocation to capitalized projects, termination costs (see Note 18) and write-down of VAT credits in Peru (see Note 17). |
13
Note 2 (Continued)
Segment Information (Continued)
The following table presents a reconciliation of Adjusted EBITDA to operating profit (loss) for the nine-month periods ended September 30, 2020 and 2019:
| | | | | | | | | | | | |
|
| Nine-months period ended September 30, 2020 | ||||||||||
|
| Colombia |
| Chile |
| Brazil |
| Argentina |
| Other (a) |
| Total |
Adjusted EBITDA for reportable segments |
| 158,083 | | 7,890 | | 2,544 | | 2,883 | | (9,843) | | 161,557 |
Depreciation |
| (47,885) | | (25,228) | | (2,533) | | (13,253) | | (419) | | (89,318) |
Unrealized gain on commodity risk management contracts |
| 9,862 | | — | | — | | — | | — | | 9,862 |
Write-off of unsuccessful exploration efforts |
| — | | (3,205) | | (575) | | — | | — | | (3,780) |
Impairment loss recognized for non-financial assets | | — | | (50,281) | | (1,007) | | (16,205) | | (30,995) | | (98,488) |
Share-based payment |
| (261) | | (65) | | (10) | | (117) | | (5,386) | | (5,839) |
Lease accounting - IFRS 16 |
| 4,589 | | 78 | | 1,647 | | 682 | | 323 | | 7,319 |
Others |
| 238 | | (462) | | (285) | | (1,848) | | (6,480) | | (8,837) |
Operating profit (loss) |
| 124,626 |
| (71,273) |
| (219) |
| (27,858) |
| (52,800) |
| (27,524) |
| | | | | | | | | | | | |
|
| Nine-months period ended September 30, 2019 | ||||||||||
|
| Colombia |
| Chile |
| Brazil |
| Argentina |
| Other (a) |
| Total |
Adjusted EBITDA for reportable segments |
| 281,519 | | 5,780 | | 7,496 | | 2,813 | | (19,929) |
| 277,679 |
Depreciation |
| (34,270) | | (25,737) | | (5,097) | | (11,163) | | (549) |
| (76,816) |
Unrealized loss on commodity risk management contracts |
| (19,902) | | — | | — | | — | | — |
| (19,902) |
Write-off of unsuccessful exploration efforts |
| (241) | | — | | — | | (9,027) | | — |
| (9,268) |
Share-based payment |
| (433) | | (46) | | (51) | | (50) | | (862) |
| (1,442) |
Lease accounting - IFRS 16 |
| 1,463 | | 126 | | 1,643 | | 710 | | 375 |
| 4,317 |
Others |
| 2,756 | | (870) | | 472 | | 102 | | 1,978 |
| 4,438 |
Operating profit (loss) |
| 230,892 |
| (20,747) |
| 4,463 |
| (16,615) |
| (18,987) |
| 179,006 |
| (a) | Includes Peru, Ecuador and Corporate. |
Note 3
Revenue
| | | | | | | | |
|
| Three-months |
| Three-months | | Nine-months |
| Nine-months |
| | period ended |
| period ended | | period ended |
| period ended |
|
| September 30, |
| September 30, | | September 30, |
| September 30, |
Amounts in US$ '000 |
| 2020 |
| 2019 | | 2020 |
| 2019 |
Sale of crude oil |
| 89,326 |
| 138,245 | | 262,163 |
| 434,634 |
Sale of gas |
| 8,821 |
| 12,957 | | 24,873 |
| 36,217 |
| | 98,147 |
| 151,202 | | 287,036 |
| 470,851 |
14
Note 4
Commodity risk management contracts
The Group entered into derivative financial instruments to manage its exposure to oil price risk. These derivatives are zero-premium collars, fixed price or zero-premium 3 ways (put spread plus call), and were placed with major financial institutions and commodity traders. The Group entered into the derivatives under ISDA Master Agreements and Credit Support Annexes, which provide credit lines for collateral posting thus alleviating possible liquidity needs under the instruments and protect the Group from potential non-performance risk by its counterparties. The Group’s derivatives are accounted for as non-hedge derivatives and therefore all changes in the fair values of its derivative contracts are recognized as gains or losses in the results of the periods in which they occur.
The following table summarizes the Group’s production hedged during the nine-months period ending September 30, 2020 and for the following periods as a consequence of the derivative contracts in force as of September 30, 2020:
| | | | | | | | |
|
| |
| |
| Volume |
| Average |
Period | | Reference | | Type | | bbl/d | | price US$/bbl |
January 1, 2020 - March 31, 2020 | | ICE BRENT | | Zero Premium 3 Ways | | 18,000 | | 45.00-55.00 Put 74.45 Call |
| | | | | | 18,000 | | |
April 1, 2020 - June 30, 2020 | | ICE BRENT | | Zero Premium 3 Ways | | 11,000 | | 45.00-55.00 Put 70.00 Call |
April 1, 2020 - June 30, 2020 | | ICE BRENT | | Zero Premium Collars | | 7,500 | | 32.33 Put 34.54 Call |
April 1, 2020 - June 30, 2020 | | ICE BRENT | | Fixed Price | | 7,500 | | 31.67 |
| | | | | | 26,000 | | |
July 1, 2020 - September 30, 2020 | | ICE BRENT | | Zero Premium 3 Ways | | 11,000 | | 45.00-55.00 Put 70.00 Call |
July 1, 2020 - September 30, 2020 | | ICE BRENT | | Zero Premium Collars | | 14,500 | | 31.34 Put 38.66 Call |
July 1, 2020 - September 30, 2020 | | ICE BRENT | | Fixed Price | | 2,000 | | 32.00 |
| | | | | | 27,500 | | |
October 1, 2020 - December 31, 2020 | | ICE BRENT | | Zero Premium 3 Ways | | 11,000 | | 45.00-55.00 Put 70.00 Call |
October 1, 2020 - December 31, 2020 | | ICE BRENT | | Zero Premium Collars | | 12,500 | | 33.76 Put 45.38 Call |
October 1, 2020 - December 31, 2020 | | VASCONIA CRUDE (ICE BRENT – VASCONIA DIFFERENTIAL) | | Zero Premium Collars | | 2,000 | | 30.00 Put 44.25 Call |
| | | | | | 25,500 | | |
January 1, 2021 - March 31, 2021 | | ICE BRENT | | Zero Premium Collars | | 15,500 | | 36.90 Put 51.35 Call |
| | | | | | 15,500 | | |
April 1, 2021 - June 30, 2021 | | ICE BRENT | | Zero Premium Collars | | 13,000 | | 37.54 Put 52.07 Call |
| | | | | | 13,000 | | |
July 1, 2021 - September 30, 2021 | | ICE BRENT | | Zero Premium Collars | | 2,000 | | 40.00 Put 56.00 Call |
| | | | | | 2,000 | | |
October 1, 2021 - December 31, 2021 | | ICE BRENT | | Zero Premium Collars | | 2,000 | | 40.00 Put 56.00 Call |
| | | | | | 2,000 | | |
Since July 1, 2020, the Group entered into a new instrument within its hedging portfolio, adding 2,000 bbl/d of Vasconia-based derivative contract for the three-months period ending December 31, 2020. This derivative protects both the overall crude price exposure to ICE Brent as well as the Vasconia diferential, which reflects the quality adjustment for the GeoPark’s Llanos Basin crude production in Colombia.
15
Note 4 (Continued)
Commodity risk management contracts (Continued)
The table below summarizes the gain (loss) on the commodity risk management contracts:
| | | | | | | | |
|
| Three-months |
| Three-months | | Nine-months |
| Nine-months |
|
| period ended |
| period ended | | period ended |
| period ended |
| | September 30, | | September 30, | | September 30, | | September 30, |
|
| 2020 |
| 2019 | | 2020 |
| 2019 |
Realized gain on commodity risk management contracts |
| 1,432 |
| 1,400 | | 15,740 |
| 3,887 |
Unrealized gain (loss) on commodity risk management contracts |
| 1,290 |
| 3,038 | | 9,862 |
| (19,902) |
Total |
| 2,722 |
| 4,438 | | 25,602 |
| (16,015) |
The following table presents the Group’s derivative contracts agreed after the balance sheet date:
| | | | | | | | |
| | | | | | Volume | | |
Period |
| Reference |
| Type |
| bbl/d |
| Price US$/bbl |
July 1, 2021 - December 31, 2021 | | ICE BRENT | | Zero Premium Collars | | 1,000 | | 40.00 Put 50.52 Call |
July 1, 2021 - December 31, 2021 | | ICE BRENT | | Zero Premium Collars | | 1,500 | | 40.00 Put 50.40 Call |
Note 5
Production and operating costs
| | | | | | | | |
|
| Three-months |
| Three-months |
| Nine-months |
| Nine-months |
| | period ended | | period ended | | period ended | | period ended |
| | September 30, | | September 30, | | September 30, | | September 30, |
Amounts in US$ '000 |
| 2020 |
| 2019 |
| 2020 |
| 2019 |
Staff costs |
| 2,678 |
| 3,759 |
| 9,948 |
| 10,909 |
Share-based payment |
| 60 |
| — |
| 192 |
| 329 |
Royalties |
| 8,398 |
| 15,136 |
| 24,312 |
| 47,943 |
Well and facilities maintenance |
| 3,426 |
| 7,752 |
| 11,321 |
| 21,032 |
Operation and maintenance |
| 1,672 |
| 1,643 |
| 5,257 |
| 5,939 |
Consumables |
| 3,685 |
| 3,967 |
| 12,420 |
| 13,481 |
Equipment rental |
| 1,514 |
| 2,568 |
| 5,939 |
| 7,282 |
Transportation costs |
| 560 |
| 585 |
| 4,085 |
| 2,088 |
Gas plant costs |
| 27 |
| 741 |
| 1,021 |
| 2,717 |
Safety and insurance costs |
| 1,139 |
| 1,188 |
| 3,060 |
| 3,019 |
Field camp |
| 787 |
| 527 |
| 2,134 |
| 1,977 |
Non operated blocks costs |
| 739 |
| 371 |
| 2,079 |
| 973 |
Crude oil stock variation |
| 2,363 |
| 220 |
| 2,431 |
| (1) |
Other costs |
| 1,356 |
| 3,277 |
| 5,994 |
| 8,978 |
| | 28,404 |
| 41,734 | | 90,193 |
| 126,666 |
16
Note 6
Geological and geophysical expenses
| | | | | | | | |
|
| Three-months |
| Three-months |
| Nine-months |
| Nine-months |
| | period ended | | period ended | | period ended | | period ended |
| | September 30, | | September 30, | | September 30, | | September 30, |
Amounts in US$ '000 |
| 2020 |
| 2019 |
| 2020 |
| 2019 |
Staff costs |
| 2,527 |
| 4,457 |
| 8,608 |
| 12,332 |
Share-based payment |
| 21 |
| — |
| 87 |
| 136 |
Other services |
| 229 |
| 1,659 |
| 1,593 |
| 4,253 |
Allocation to capitalized project |
| — |
| (1,860) |
| (102) |
| (3,860) |
| | 2,777 |
| 4,256 | | 10,186 |
| 12,861 |
Note 7
Administrative expenses
| | | | | | | | |
|
| Three-months |
| Three-months |
| Nine-months |
| Nine-months |
| | period ended | | period ended | | period ended | | period ended |
| | September 30, | | September 30, | | September 30, | | September 30, |
Amounts in US$ '000 |
| 2020 |
| 2019 |
| 2020 |
| 2019 |
Staff costs |
| 5,676 |
| 6,854 |
| 16,922 |
| 21,803 |
Share-based payment |
| 1,823 |
| 325 |
| 5,560 |
| 977 |
Consultant fees |
| 2,097 |
| 4,435 |
| 6,734 |
| 9,193 |
Travel expenses |
| 17 |
| 1,018 |
| 884 |
| 3,533 |
Director fees and allowance |
| 397 |
| 756 |
| 1,481 |
| 2,435 |
Communication and IT costs |
| 642 |
| 948 |
| 2,080 |
| 2,465 |
Allocation to joint operations |
| (1,317) |
| (1,842) |
| (4,580) |
| (5,689) |
Other administrative expenses |
| 1,026 |
| 1,973 |
| 5,283 |
| 4,809 |
| | 10,361 |
| 14,467 | | 34,364 |
| 39,526 |
Note 8
Selling expenses
| | | | | | | | |
|
| Three-months |
| Three-months |
| Nine-months |
| Nine-months |
|
| period ended |
| period ended |
| period ended |
| period ended |
| | September 30, | | September 30, | | September 30, | | September 30, |
Amounts in US$ '000 |
| 2020 |
| 2019 |
| 2020 |
| 2019 |
Transportation |
| 1,090 |
| 2,132 |
| 4,017 |
| 10,361 |
Selling taxes and other |
| 204 |
| 280 |
| 877 |
| 910 |
| | 1,294 |
| 2,412 | | 4,894 |
| 11,271 |
17
Note 9
Financial results
| | | | | | | | |
|
| Three-months |
| Three-months |
| Nine-months |
| Nine-months |
|
| period ended |
| period ended |
| period ended |
| period ended |
| | September 30, | | September 30, | | September 30, | | September 30, |
Amounts in US$ '000 |
| 2020 |
| 2019 |
| 2020 |
| 2019 |
Financial expenses |
|
|
|
|
|
|
|
|
Bank charges and other financial costs |
| (2,393) |
| (698) |
| (7,157) |
| (2,904) |
Interest and amortization of debt issue costs |
| (12,693) |
| (7,448) |
| (36,355) |
| (22,625) |
Unwinding of long-term liabilities |
| (1,551) |
| (1,259) |
| (4,424) |
| (3,492) |
Less: amounts capitalized on qualifying assets |
| — |
| 64 |
| — |
| 331 |
| | (16,637) |
| (9,341) | | (47,936) |
| (28,690) |
Financial income |
|
|
|
|
|
|
| |
Interest received |
| 814 |
| 700 |
| 2,911 |
| 2,140 |
| | 814 |
| 700 | | 2,911 |
| 2,140 |
Foreign exchange gains and losses |
|
|
|
|
|
|
|
|
Foreign exchange (loss) gain |
| (674) |
| 770 |
| 3,553 |
| (3,514) |
Result on currency risk management contracts (a) |
| �� |
| — |
| (10,288) |
| 2,843 |
| | (674) |
| 770 | | (6,735) |
| (671) |
Total financial results |
| (16,497) |
| (7,871) |
| (51,760) |
| (27,221) |
| (a) | GeoPark manages its exposure to local currency fluctuation with respect to income tax balances in Colombia by entering into derivative financial instruments with local banks in Colombia. The realized result on these contracts was US$ 9,414,000 (loss) and US$ 2,843,000 (gain) for the nine-months period ended September 30, 2020 and 2019, respectively. |
18
Note 10
Property, plant and equipment
| | | | | | | | | | | | | | |
|
| |
| Furniture, |
| |
| |
| |
| Exploration |
| |
| | | | equipment | | Production | | Buildings | | | | and | | |
| | Oil & gas | | and | | facilities and | | and | | Construction | | evaluation | | |
Amounts in US$'000 | | properties |
| vehicles | | machinery | | improvements | | in progress |
| assets | | TOTAL |
Cost at January 1, 2019 |
| 717,510 |
| 17,748 |
| 172,094 |
| 11,554 |
| 60,597 |
| 59,992 |
| 1,039,495 |
Additions |
| 1,763 | (a) | 1,566 | | 362 | | 27 | | 73,629 | | 16,237 |
| 93,584 |
Disposals | | — | | (41) | | — | | — | | — | | — | | (41) |
Write-off of unsuccessful exploration efforts |
| — | | — | | — | | — | | — | | (9,268) | (b) | (9,268) |
Transfers |
| 56,825 | | 255 | | 21,663 | | 65 | | (67,124) | | (11,684) |
| — |
Currency translation differences |
| (4,623) | | (53) | | (158) | | (11) | | — | | (492) |
| (5,337) |
Reclassification | | 26,302 | | — | | (23,489) | | — | | — | | — | | 2,813 |
Cost at September 30, 2019 |
| 797,777 |
| 19,475 |
| 170,472 |
| 11,635 |
| 67,102 |
| 54,785 |
| 1,121,246 |
| | | | | | | | | | | | | | |
Cost at January 1, 2020 |
| 830,937 |
| 19,549 |
| 172,507 |
| 11,770 |
| 69,587 |
| 48,036 |
| 1,152,386 |
Additions |
| (479) | (a) | 918 | | — | | 423 | | 36,155 | | 12,320 | | 49,337 |
Disposals | | — | | (399) | | — | | (115) | | — | | — | | (514) |
Acquisitions |
| 174,984 | | 617 | | 34,613 | | — | | 1,199 | | 79,693 | | 291,106 |
Write-off / Impairment |
| (67,493) | (c) | — | | — | | — | | (30,995) | (c) | (3,780) | (d) | (102,268) |
Transfers |
| 30,069 | | 174 | | 14,078 | | 78 | | (38,798) | | (5,601) | | — |
Currency translation differences |
| (24,191) | | (334) | | (2,293) | | (85) | | (88) | | (80) | | (27,071) |
Assets held for sale (Note 17) | | (1,996) | | — | | — | | — | | — | | — | | (1,996) |
Cost at September 30, 2020 |
| 941,831 | | 20,525 | | 218,905 | | 12,071 | | 37,060 | | 130,588 | | 1,360,980 |
| | | | | | | | | | | | | | |
Depreciation and write-down at January 1, 2019 |
| (359,358) |
| (13,361) |
| (103,704) |
| (5,902) |
| — |
| — |
| (482,325) |
Depreciation |
| (59,066) | | (1,561) | | (13,217) | | (677) | | — | | — |
| (74,521) |
Disposals | | — | | 34 | | — | | — | | — | | — | | 34 |
Currency translation differences |
| 2,292 | | 45 | | 817 | | 12 | | — | | — |
| 3,166 |
Reclassification | | (27,664) | | — | | 24,851 | | — | | — | | — | | (2,813) |
Depreciation and write-down at September 30, 2019 |
| (443,796) |
| (14,843) |
| (91,253) |
| (6,567) |
| — |
| — |
| (556,459) |
| | | | | | | | | | | | | | |
Depreciation and write-down at January 1, 2020 |
| (467,806) |
| (15,149) |
| (95,047) |
| (6,596) |
| — |
| — |
| (584,598) |
Depreciation |
| (66,063) | | (1,743) | | (12,103) | | (371) | | — | | — | | (80,280) |
Disposals | | — | | 213 | | — | | 72 | | — | | — | | 285 |
Currency translation differences |
| 17,193 | | 311 | | 2,802 | | 23 | | — | | — | | 20,329 |
Assets held for sale (Note 17) | | 134 | | — | | — | | — | | — | | — | | 134 |
Depreciation and write-down at September 30, 2020 |
| (516,542) |
| (16,368) |
| (104,348) |
| (6,872) |
| — |
| — |
| (644,130) |
| | | | | | | | | | | | | | |
Carrying amount at September 30, 2019 |
| 353,981 |
| 4,632 |
| 79,219 |
| 5,068 |
| 67,102 |
| 54,785 |
| 564,787 |
Carrying amount at September 30, 2020 |
| 425,289 |
| 4,157 |
| 114,557 |
| 5,199 |
| 37,060 |
| 130,588 |
| 716,850 |
| (a) | Corresponds to the effect of change in estimate of assets retirement obligations. |
| (b) | Corresponds to five unsuccessful exploratory wells drilled and other exploration costs incurred in Argentina (CN-V, Sierra del Nevado and Puelen Blocks) and other exploration costs in Colombia. |
| (c) | See Note 19. |
| (d) | Corresponds to an unsuccessful exploratory well drilled in the Isla Norte Block (Chile) and exploration costs incurred in previous years in the POT-T-619 Block (Brazil) for which no additional work would be performed. |
19
Note 11
Equity
Share capital
| | | | |
|
| At |
| Year ended |
Issued share capital |
| September 30, 2020 |
| December 31, 2019 |
Common stock (US$ ´000) |
| 61 |
| 59 |
The share capital is distributed as follows: |
|
|
|
|
Common shares, of nominal US$ 0.001 |
| 60,612,258 |
| 59,167,584 |
Total common shares in issue |
| 60,612,258 |
| 59,167,584 |
| | | | |
Authorized share capital |
|
|
|
|
US$ per share |
| 0.001 |
| 0.001 |
| | | | |
Number of common shares (US$ 0.001 each) |
| 5,171,949,000 |
| 5,171,949,000 |
Amount in US$ |
| 5,171,949 |
| 5,171,949 |
GeoPark’s share capital only consists of common shares. The authorized share capital consists of 5,171,949,000 common shares of par value US$ 0.001 per share. All of the Company issued and outstanding common shares are fully paid and nonassessable.
Cash distribution
On November 6, 2019, the Company’s Board of Directors declared the initiation of a quarterly cash distribution of US$ 0.0413 per share that was paid on December 10, 2019. On March 4, 2020, declared a quarterly cash distribution of US$ 0.0413 per share that was paid on April 8, 2020.
Buyback Program
On February 10, 2020, the Company’s Board of Directors approved a program to repurchase up to 10% of its shares outstanding or approximately 5,930,000 shares. The repurchase program begun on February 11, 2020 and will expire on December 31, 2020. These transactions have no impact on the Group’s results.
However, both the quarterly cash distribution and the share buyback program were suspended after the April 8, 2020 distribution, as part of the revised work program for 2020 to help address the recent decline in oil prices.
Stock distribution
On February 10, 2020, the Company’s Board of Directors declared a special stock distribution of 0.004 shares per share. Consequently, on March 11, 2020, 242,650 common shares were distributed to the shareholders of record at the close of business on February 25, 2020.
20
Note 12
Borrowings
The outstanding amounts are as follows:
| | | | |
|
| At |
| Year ended |
Amounts in US$ '000 |
| September 30, 2020 |
| December 31, 2019 |
2024 Notes (a) |
| 421,600 |
| 427,812 |
2027 Notes (b) |
| 347,075 |
| — |
Banco Santander (c) |
| 3,499 |
| 9,607 |
| | 772,174 |
| 437,419 |
Classified as follows:
| | | | |
Current |
| 4,782 |
| 17,281 |
Non-Current |
| 767,392 |
| 420,138 |
(a)On September 21, 2017, the Company successfully placed US$ 425,000,000 notes, which were offered to qualified institutional buyers in accordance with Rule 144A under the United States Securities Act, and outside the United States to non-U.S. persons in accordance with Regulation S under the United States Securities Act.
The Notes carry a coupon of 6.50% per annum. Final maturity of the Notes will be September 21, 2024. The Notes are secured with a guarantee granted by GeoPark Colombia S.L.U. and GeoPark Chile S.p.A. The debt issuance cost for this transaction amounted to US$ 6,683,000 (debt issuance effective rate: 6.90%). The indenture governing the Notes due 2024 includes incurrence test covenants that provide, among other things, that during the two-years period between September 22, 2019 and September 21, 2021, the Net Debt to Adjusted EBITDA ratio should not exceed 3.25 times and the Adjusted EBITDA to Interest ratio should exceed 2.25 times. Failure to comply with the incurrence test covenants does not trigger an event of default. However, this situation may limit the Company’s capacity to incur additional indebtedness, as specified in the indenture governing the Notes. Incurrence covenants as opposed to maintenance covenants must be tested by the Company before incurring additional debt or performing certain corporate actions including but not limited to dividend payments, restricted payments and others. As of the date of these interim condensed consolidated financial statements, the Company is in compliance of all the indenture’s provisions and covenants.
(b)On January 17, 2020, the Company successfully placed US$ 350,000,000 Notes, which were offered in a private placement to qualified institutional buyers in accordance with Rule 144A under the Securities Act of 1933, as amended (the “Securities Act”), and outside the United States to non U.S. persons in accordance with Regulation S under the Securities Act. The Notes are fully and unconditionally guaranteed jointly and severally by GeoPark Chile S.p.A. and GeoPark Colombia S.L.U.
21
Note 12 (Continued)
Borrowings (Continued)
The Notes were priced at 99.285% and carry a coupon of 5.50% per annum (yield 5.625% per annum). The debt issuance cost for this transaction amounted to US$ 5,004,000 (debt issuance effective rate: 5.88%). Final maturity of the Notes will be January 17, 2027. The indenture governing the Notes due 2027 includes incurrence test covenants that provides among other things, that, the Net Debt to Adjusted EBITDA ratio should not exceed 3.25 times and the Adjusted EBITDA to Interest ratio should exceed 2.5 times. Failure to comply with the incurrence test covenants does not trigger an event of default. However, this situation may limit the Company’s capacity to incur additional indebtedness, as specified in the indenture governing the Notes. Incurrence covenants as opposed to maintenance covenants must be tested by the Company before incurring additional debt or performing certain corporate actions including but not limited to dividend payments, restricted payments and others. As of the date of these interim condensed consolidated financial statements, the Company is in compliance of all the indenture’s provisions and covenants.
The net proceeds from the Notes were used by the Company (i) to make an intercompany loan to its wholly-owned subsidiary, GeoPark Colombia S.A.S., providing it with sufficient funds to pay the total consideration for the acquisition of Amerisur (see Note 17) and to pay any related fees and expenses, and (ii) for general corporate purposes.
(c)In October 2018, GeoPark Brazil Exploração y Produção de Petróleo e Gás Ltda. executed a loan agreement with Banco Santander for Brazilian Real 77,640,000 (equivalent to US$ 20,000,000 at the moment of the loan execution) to repay an existing US$-denominated intercompany loan to GeoPark Latin America Limited - Agencia en Chile. The interest rate applicable to this loan is CDI plus 2.25% per annum. “CDI” (Interbank certificate of deposit) represents the average rate of all inter-bank overnight transactions in Brazil. The principal and the interest are paid semi-annually, with final maturity in October 2020.
In September 2020, GeoPark Brazil Exploração y Produção de Petróleo e Gás Ltda. executed the refinancing of the outstanding principal loan with Banco Santander for a total amount of Brazilian Real 19,410,000 (equivalent to US$ 3,441,000 as of September 30, 2020). The interest rate applicable is CDI plus 3.55% per annum. Interests will be paid on a monthly basis, and principal will be paid semi-annually in three equal instalments in October 2021, April 2022 and October 2022.
As of the date of these interim condensed consolidated financial statements, the Group has available credit lines for over US$ 132,933,000.
Note 13
Provisions and other long-term liabilities
The outstanding amounts are as follows:
| | | | |
|
| At |
| Year ended |
Amounts in US$ '000 |
| September 30, 2020 |
| December 31, 2019 |
Assets retirement obligation |
| 64,211 |
| 56,113 |
Deferred income |
| 3,682 |
| 2,267 |
Other |
| 8,834 |
| 3,682 |
| | 76,727 |
| 62,062 |
22
Note 14
Trade and other payables
The outstanding amounts are as follows:
| | | | |
|
| At |
| Year ended |
Amounts in US$ '000 |
| September 30, 2020 |
| December 31, 2019 |
Trade payables |
| 57,876 |
| 83,991 |
To be paid to co-venturers |
| 4,464 |
| 4,803 |
Payables to LGI (a) |
| 10,755 |
| 15,000 |
Staff costs to be paid |
| 11,568 |
| 13,219 |
Royalties to be paid |
| 4,696 |
| 6,294 |
V.A.T. |
| 4,150 |
| 6,718 |
Taxes and other debts to be paid |
| 3,960 |
| 6,795 |
| | 97,469 |
| 136,820 |
Classified as follows:
| | | | |
Current |
| 92,218 | | 131,345 |
Non-Current |
| 5,251 | | 5,475 |
| (a) | Payables related to the acquisition of Non-controlling interest in Colombia and Chile’s business from LG International in November 2018 (see Note 36.1 to the annual consolidated financial statements as of and for the year ended December 31, 2019). |
Note 15
Fair value measurement of financial instruments
Fair value hierarchy
The following table presents the Group’s financial assets and financial liabilities measured and recognized at fair value at September 30, 2020 and December 31, 2019 on a recurring basis:
| | | | | | |
|
| |
| |
| At |
Amounts in US$ '000 | | Level 1 | | Level 2 |
| September 30, 2020 |
Assets |
|
|
|
|
|
|
Cash and cash equivalents |
|
|
|
|
| |
Money market funds |
| 73,500 |
| — |
| 73,500 |
Derivative financial instrument assets |
|
|
|
|
| |
Commodity risk management contracts |
| — |
| 11,807 |
| 11,807 |
Total Assets |
| 73,500 |
| 11,807 |
| 85,307 |
23
Note 15 (Continued)
Fair value measurement of financial instruments (Continued)
Fair value hierarchy (Continued)
| | | | | | |
|
| |
| |
| At |
Amounts in US$ '000 | | Level 1 | | Level 2 |
| September 30, 2020 |
Liabilities |
|
|
|
|
|
|
Derivative financial instrument liabilities |
|
|
|
|
| |
Commodity risk management contracts |
| — |
| 1,328 |
| 1,328 |
Total Liabilities |
| — |
| 1,328 |
| 1,328 |
| | | | | | |
|
| |
| |
| Year ended |
Amounts in US$ '000 | | Level 1 | | Level 2 |
| December 31, 2019 |
Assets |
|
|
|
|
|
|
Cash and cash equivalents |
|
|
|
|
|
|
Money market funds |
| 42,212 |
| — |
| 42,212 |
Derivative financial instrument assets |
|
|
|
|
|
|
Commodity risk management contracts |
| — |
| 444 |
| 444 |
Currency risk management contracts |
| — |
| 874 |
| 874 |
Forward contracts relating to forecast transactions |
| — |
| 6,779 |
| 6,779 |
Total Assets |
| 42,212 |
| 8,097 |
| 50,309 |
Liabilities |
|
|
|
|
|
|
Derivative financial instrument liabilities |
|
|
|
|
|
|
Commodity risk management contracts |
| — |
| 952 |
| 952 |
Total Liabilities |
| — |
| 952 |
| 952 |
There were no transfers between Level 2 and 3 during the period.
The Group did not measure any financial assets or financial liabilities at fair value on a non-recurring basis as of September 30, 2020.
Fair values of other financial instruments (unrecognized)
The Group also has a number of financial instruments which are not measured at fair value in the balance sheet. For the majority of these instruments, the fair values are not materially different to their carrying amounts, since the interest receivable/payable is either close to current market rates or the instruments are short-term in nature.
Borrowings are comprised primarily of fixed rate debt and variable rate debt with a short term portion where interest has already been fixed. They are measured at their amortized cost. The Group estimates that the fair value of its main financial liabilities is approximately 93% of its carrying amount including interests accrued as of September 30, 2020. Fair values were calculated based on market price for the Notes and cash flows discounted for other borrowings using a rate based on the borrowing rate and are within Level 1 and Level 2 of the fair value hierarchy, respectively.
24
Note 16
Capital commitments
Capital commitments are detailed in Note 33.2 to the audited Consolidated Financial Statements as of December 31, 2019. The following updates have taken place during the nine-month period ended September 30, 2020:
Colombia
The Colombian National Hydrocarbons Agency (“ANH”) approved the termination of the E&P Contract related to the VIM-3 Block requested by GeoPark in 2018, with a remaining commitment for an amount of US$ 9,290,800, which can be transferred as investment to another block in Colombia.
The Group has committed to drill 2 exploratory wells in the Llanos 32 Block, which amount to US$ 3,350,000 at GeoPark’s working interest, before February 20, 2022.
The investment commitment for the Llanos 94 Block, which is in Preliminary Phase, will be to acquire and reprocess existing 3D seismic and to drill three exploratory wells for US$ 8,048,000, at GeoPark’s working interest, over the three-years term of Phase 1.
The following investment commitments were assumed by the Group, at its working interest, as a consequence of the acquisition of Amerisur (see Note 17):
| ● | CPO-5 Block: 3D seismic acquisition, processing and interpretation (US$ 2,542,000) before July 9, 2021. |
| ● | Coati Block: 3D seismic and 2D seismic acquisition (US$ 4,500,000). The exploratory period is currently suspended. |
| ● | Mecaya Block: 3D seismic or 1 exploratory well (US$ 600,000). The exploratory period is currently suspended. |
| ● | PUT-8 Block: 3D seismic acquisition and 3 exploratory wells (US$ 13,107,000) before March 1, 2022. |
| ● | PUT-9 Block: 3D seismic acquisition and 2 exploratory wells (US$ 4,365,000) before October 14, 2020. On March 18, 2020, GeoPark requested the ANH to suspend the exploratory period. |
| ● | PUT-12 Block: 2D seismic acquisition, reprocessing and interpretation, geochemistry and 1 exploratory well (US$ 17,920,000) before November 29, 2021. On April 7, 2020, GeoPark requested the ANH to suspend the exploratory period. |
| ● | PUT-30 Block: 2D seismic acquisition and 1 exploratory well (US$ 26,929,000) before May 2, 2022. |
| ● | Tacacho Block: 2D seismic acquisition, processing and interpretation (US$ 1,224,000). The exploratory period is currently suspended. |
| ● | Terecay Block: 2D seismic acquisition, processing and interpretation (US$ 2,856,000). The exploratory period is currently suspended. |
| ● | The PUT-14 and PUT-36 Blocks are in Preliminary Phase as of the date of these interim condensed consolidated financial statements. During this Preliminary Phase, GeoPark must request the Ministry of Interior to certify the presence or absence of indigenous communities and engage in a previous consultation process, if applicable. Only when this process has been completed and the corresponding regulatory approvals have been obtained, the blocks will enter into Phase 1, where the exploratory commitments are mandatory. The investment commitments for the blocks over the three-years term of Phase 1 would be up to US$ 16,122,000 and US$ 8,344,000, respectively. |
25
Note 16 (Continued)
Capital commitments (Continued)
Chile
During the three-months period ended March 31, 2020, GeoPark drilled the exploratory well committed in the Flamenco Block and one of the two exploratory wells committed in the Isla Norte Block. Consequently, the capital commitment in the Flamenco Block was fulfilled and the minimum remaining commitment in the Isla Norte Block of drilling one exploratory well amounts to US$ 867,100.
On March 17, 2020, the Chilean Ministry approved the GeoPark’s proposal to modify the outstanding commitments in the Campanario Block to two deeper exploratory wells, for an amount of US$ 5,002,000.
On July 24, 2020, the Chilean Ministry approved the GeoPark’s proposal to suspend the exploratory periods in the Campanario and Isla Norte Blocks due to force majeure in relation with the COVID 19 outbreak.
On October 6, 2020, the Chilean Ministry approved the GeoPark’s proposal to extend the second exploratory phase in the Flamenco Block until November 7, 2021.
Brazil
GeoPark fulfilled the commitments that were remaining as of December 31, 2019 in the REC-T-128 Block.
Note 17
Business transactions
Acquisition of Amerisur Resources Plc
On January 16, 2020, GeoPark acquired the 100% share capital of Amerisur Resources Plc, a company listed on the Alternative Investment Market (“AIM”) of the London Stock Exchange. After the acquisition the company was delisted and the name changed to Amerisur Resources Limited. The principal activities of Amerisur Resources Limited and its subsidiaries (“Amerisur”) are exploration, development and production for oil and gas reserves in Latin America. Amerisur owns thirteen production, development and exploration blocks in Colombia (twelve operated blocks in the Putumayo basin and one non-operated block in the Llanos basin) and an export oil pipeline from Colombia to Ecuador named Oleoducto Binacional Amerisur (“OBA”).
GeoPark paid a cash consideration of British Pound Sterling (“GBP”) 241,682,496 (equivalent to US$ 314,163,077) at closing date.
Before closing the transaction, the Group decided to manage its exposure to GBP fluctuation with respect to the abovementioned cash consideration. Consequently, on November 25, 2019, GeoPark entered into a “Deal Contingent Forward” (DCF) with a UK Bank, in order to anticipate any currency fluctuation in respect to the cash consideration payable in GBP. This forward contract was accounted for as a cash flow hedge and therefore all changes in its fair value until closing date were recognized in Other Reserve within Equity. At closing date, GeoPark removed that amount from the cash flow hedge reserve and included it directly in the initial cost of the acquired business.
26
Note 17 (Continued)
Business transactions (Continued)
Acquisition of Amerisur Resources Plc (Continued)
On January 8, 2020, Amerisur announced that it had received a copy of a claim form issued in the High Court of England and Wales (the “Court”) by Leigh Day solicitors on behalf of a group of claimants (the “Claimants”) described as members of a farming community in the department of Putumayo in Colombia. The claim states that the Claimants seek compensation for economic and non-economic damages said to be caused by alleged environmental contamination and pollution caused by Amerisur’s operations in Colombia. Amerisur stated that the accusations of environmental damage referenced in the claim are being investigated by Colombian authorities and to-date have been deemed to be without merit. Amerisur further stated that it viewed the substance of the claim to be without merit. Following court hearings held in January and February 2020, an interim freezing order was imposed on Amerisur in respect to GBP 4,465,600 (equivalent to US$ 5,738,000 as of September 30, 2020) of its assets located in the United Kingdom. Amerisur has been negotiating with the Claimants in order to file a bank guarantee that will enable the Court to lift the freezing order. On May 7, 2020, Amerisur served a substantive letter of response, responding to Leigh Day´s letter of claim. In June 2020, both parties (Amerisur and Leigh Day) filed their case summaries with the Court. The Court must now schedule the case management hearing, where it will decide on the timetable, disclosure and costs for the proceedings.
In accordance with the acquisition method of accounting, the acquisition cost was allocated to the underlying assets acquired and liabilities assumed based primarily upon their estimated fair values at the date of acquisition. An income approach (being the net present value of expected future cash flows) was adopted to determine the fair values of the mineral interest. Estimates of expected future cash flows reflect estimates of projected future revenues, production costs and capital expenditures based on our business model. The excess of acquisition cost, if any, over the net identifiable assets acquired represents goodwill.
The following table summarises the combined consideration paid for the acquired business, and a preliminary allocation of fair value of the assets acquired and liabilities assumed for this transaction:
| | |
Amounts in US$ '000 |
| Total |
Cash |
| 314,163 |
Total consideration |
| 314,163 |
Property, plant and equipment (including mineral interest) |
| 291,106 |
Right-of-use assets | | 17,360 |
Prepayments and other receivables | | 25,344 |
Trade receivables | | 11,502 |
Other assets |
| 12,189 |
Cash and cash equivalents | | 41,828 |
Lease liabilities | | (17,851) |
Provision for other long-term liabilities |
| (14,284) |
Deferred income tax liabilities |
| (15,975) |
Trade and other payables |
| (37,056) |
Total identifiable net assets |
| 314,163 |
Considering that Amerisur issues financial information on a monthly basis, the Group has considered the identified assets and liabilities as of December 31, 2019. If the purchase price allocation exercise had been carried out as of January 16, 2020, it would not have deferred significantly.
The purchase price allocation detailed above is preliminary, since the valuation process is ongoing. This process will be completed during 2020.
27
Note 17 (Continued)
Business transactions (Continued)
Retirement from Morona Block (Block 64) in Peru
On July 15, 2020, GeoPark notified its irrevocable decision to retire from the non-producing Morona Block (Block 64) in Peru, due to extended force majeure, which allows for the termination of the license contract. On January 10, 2020, Perupetro (the Peruvian petroleum licensing agency) declared the project in force majeure effective retroactively to June 15, 2019. This force majeure has remained for a period exceeding the contract’s terms, entitling GeoPark to legally initiate the formal process to retire from the license contract, as well as from the joint operation agreement executed with Petroperu.
As a result of the abovementioned decision, the Group performed an analysis of the recoverability of its related assets in Peru as of June 30, 2020 and decided to write-down VAT credits for US$ 6,017,000 and Deferred income tax asset for US$ 8,353,000, recognizing those charges within Other expenses and Income tax expenses, respectively, in the Condensed Consolidated Statement of Income.
Farm-out REC-T-128 Block in Brazil
In July 2020, GeoPark initiated a farm-out process to sell its 70% interest in the currently non-producing REC-T-128 Block in Brazil. Various local companies participated in the process during July and August 2020. As of the date of these condensed consolidated interim financial statements, the farm-out process is still ongoing and under negotiations. Consequently, the amount of Property, plant and equipment related to the block was impaired to its fair value less cost to sale (see Note 19) and classified as held for sale as of September 30, 2020.
Note 18
Coronavirus and oil price crisis
Starting in March 2020, the oil market experienced a significant over-supply condition that resulted in a sharp drop in prices, with Brent falling from over US$ 50 per barrel at the beginning of March 2020 up to US$ 16 per barrel in late April 2020. There were two key drivers for this market scenario. On the demand side, the sustained impact of the COVID-19 pandemic across the world and the associated containment measures, resulted in a sharp and sudden drop in fuel demand and hence on crude demand as well. This impact had been felt since early 2020 but accelerated significantly in March and April.
Concurrently, on the supply side, during the first week of March 2020, OPEC and non-OPEC producers (sometimes referred to as OPEC+) met to discuss the prospect of extending or increasing oil production cuts that had been first put in place in late 2016 and had been renewed and expanded ever since. No consensus was reached among the 24 participating countries, effectively eliminating output reduction targets as of April 1, 2020. As a consequence, OPEC+ countries and especially Saudi Arabia, significantly increased production during April 2020.
The combined impact of sharply lower demand and growing supply led the market into an oil significant surplus with inventories building around the world and prices dropping to levels last seen in the early 2000s.
28
Note 18 (Continued)
Coronavirus and oil price crisis (Continued)
In mid-April, in the midst of significant demand destruction, OPEC+ agreed to a historical 9.7 MMbbl/d output cut. They were joined by other G-20 countries, which indicated they would add 3 to 5 MMbbl/d production reductions. Since then, global production has dropped significantly with high compliance from OPEC+ countries and economic-driven shut-ins in other regions, especially the United States of America (U.S.A.) and Canada. Over these months, COVID-19 related restrictions started to be slowly lifted in some key consuming markets such as China, Europe and the U.S.A., generating a slow but steady crude demand recovery and taking the market from that significantly over-supplied condition to a more balanced status with prices rising to trade in the low forties and inventories stabilizing or drawing around the world. During the three-months period ended September 30, 2020, resurgence of COVID-19 cases in key markets, such as the U.S.A and Europe, increased concerns about the demand recovery process.
The crude price trajectory is highly uncertain for the months to come, as the economic impact of COVID-19 materializes and resurgence of the pandemic may hinder energy demand around the globe while, on the supply side, OPEC+ is set to increase production in January 2021 for about ~2 MMbbl/d. Further supply increases are planned for 2021. The relative pace of demand and supply growth will be a key driver of prices in the short term.
Although there are no specific tax benefits granted to the oil and gas sector in the jurisdictions where the Group has its business, in response to the Covid-19 crisis, many governments have granted extensions to file and pay tax duties. The Group has applied and used any extension granted, specifically in Colombia, Brazil, Argentina, Peru and Spain. In Colombia, GeoPark entered into an agreement with the tax authority to cancel the 2019 income tax in twelve instalments from August 2020 to July 2021. Likewise, certain social security charges on payroll have been also allowed to be reduced. Tax audits and procedures before fiscal authorities have been suspended until further governmental notice.
Specifically, GeoPark’s program and strategy are guided by the following principles and priorities:
| ● | Keep Team Healthy: Protect workforce and families from the pandemic and its interruptions |
| ● | Continuity of Field Operations: Ensure backup plans and teams in place to guarantee continuity of operations and business |
| ● | Preserve Cash: Adjust the work program to maintain flexibility and balance sheet strength |
| ● | Capital Allocation Discipline: Prioritize lower-risk, higher netback, and quick cash flow generating projects |
| ● | Do More for Less: Implement operating, administrative and capital cost reduction measures |
| ● | Stay Agile: Continuous monitoring of work programs and adjustment, up or down, as necessary |
| ● | Build for the Long-Term: Protect critical tools and capabilities necessary for the long-term |
29
Note 18 (Continued)
Coronavirus and oil price crisis (Continued)
Examples of the ongoing cost-cutting initiatives already implemented and providing results include:
| ● | Renegotiation of all service contracts, as well as any other type of contract |
| ● | Improvements in operational efficiency |
| ● | Temporary suspension of certain marginal fields |
| ● | Overall reduction of administrative and structure costs, starting with a voluntary salary and bonus reduction by our management team and Board of Directors, as well as a general renegotiation of fees and expenses |
| ● | Temporary suspension of quarterly cash dividends and share buybacks |
Effective immediately, GeoPark adjusted the 2020 capital expenditures program to US$ 65-75 million, approximately a 60% reduction from prior preliminary estimates (approximately US$ 180-200 million including capital expenditures for Amerisur assets). For the whole year 2020, GeoPark has continued to secure oil production, with a minimum price of US$30 per barrel. Also, the current scenario has not impacted the approved credit lines and both Fitch and Standard & Poor’s maintained their credit ratings on our outstanding series of Notes due 2024 and 2027.
During July and August 2020, the Group implemented a plan to reduce its workforce. This reduction streamlined certain internal functions and departments for creating a more efficient workforce in the current economic environment. As a result, the Group achieved cost savings associated with the reduction of full-time and temporary employees, excluding one-time termination costs. Continuous efforts and actions to reduce costs and preserve liquidity have continued throughout the year and will continue in the future.
Note 19
Impairment test on Property, plant and equipment
As of September 30, 2020, there were no new impairment indicators nor enough evidence to reverse the impairment charges previously recorded, except for the farm-out process related to the REC-T-128 Block in Brazil (see Note 17). As of March 31, 2020, considering the scenario described in Note 18, the Group addressed the process of evaluating the recoverability of its property, plant and equipment affected by oil price drop.
The Group’s management considers as Cash Generating Unit (CGU) each of the blocks or group of blocks in which the Group has working or economic interests. The blocks with no material investment on fixed assets or with operations that are not linked to oil prices were not subject to the impairment test.
The main assumptions taken into account for the impairment tests performed as of March 31, 2020 are the ones described in Note 37 of the annual consolidated financial statements as of and for the year ended December 31, 2019. Only the following assumption were revised: i) the future oil prices have been calculated taking into consideration the updated oil price curves available in the market, provided by international advisory companies, weighted through internal estimations; and ii) the production and structure costs were estimated considering the adjusted 2020 approved budget.
30
Note 19 (Continued)
Impairment test on Property, plant and equipment (Continued)
The oil price curves considered Brent of prices of US$ 34.8, US$ 46.0, US$ 53.8 and US$ 59.5 per barrel for 2020 to 2023, respectively.
The following table summarizes the impairment tests performed by the Group as of March 31, 2020:
| | | | |
|
| | | |
Amounts in US$ '000 | | Carrying amount (a) |
| Impairment loss |
Colombia (b) |
| 412,200 |
| — |
Chile |
| 183,822 |
| (50,281) |
Brazil (c) |
| 17,329 |
| — |
Argentina |
| 50,948 |
| (16,205) |
Peru |
| 37,165 |
| (30,995) |
|
| 701,464 |
| (97,481) |
| (a) | Before recognition of impairment loss. |
| (b) | Includes Property, plant and equipment related to the recently acquired business of Amerisur (see Note 17), which valuation process is ongoing. |
| (c) | Mainly includes Property, plant and equipment related to the Manati Block, which did not present any impairment indicator as it produces mainly gas, which price is established by a supply agreement. |
If the weighted market oil prices used for the impairment test had been 5% lower in each of the future years, with all other variables held constant, the impairment loss would have been higher by approximately US$ 21,986,000.
In addition to that, as of September 30, 2020, the Group recognized an impairment loss in the REC-T-128 Block in Brazil of US$ 1,007,000, due to the fair value less cost to sale determined in the context of the farm-out process described in Note 17.
Note 20
Subsequent events
Cash distributions
On November 4, 2020, the Company’s Board of Directors declared an extraordinary cash distribution of US$ 0.0206 per share for 2020 and a quarterly cash distribution of US$ 0.0206 per share, both payable on December 9, 2020 to the shareholders of record at the close of business on November 20, 2020.
Buyback program
On November 4, 2020, the Company’s Board of Directors approved a program to repurchase up to 10% of its shares outstanding or approximately 6,062,000 shares. The repurchase program will begin on November 5, 2020 and will expire on November 15, 2021.
These transactions have no impact on the Group’s results.
31
SIGNATURE
Pursuant to the requirements of the Securities Exchange Act of 1934, the registrant has duly caused this report to be signed on its behalf by the undersigned, thereunto duly authorized.
| | |
| GeoPark Limited | |
| | |
| | |
| By: | /s/ Andrés Ocampo |
| | Name: Andrés Ocampo |
| | Title: Chief Financial Officer |
Date: November 4, 2020
32