UNITED STATES
SECURITIES AND EXCHANGE COMMISSION
Washington, D.C. 20549
FORM 6-K
REPORT OF FOREIGN PRIVATE ISSUER PURSUANT TO RULE 13a-16 OR 15d-16 UNDER THE SECURITIES EXCHANGE ACT OF 1934
For the month of May 2021
Commission File Number: 001-36298
GeoPark Limited
(Exact name of registrant as specified in its charter)
Calle 94 N° 11-30 8° piso
Bogota, Colombia
(Address of principal executive office)
Indicate by check mark whether the registrant files or will file annual reports under cover of Form 20-F or Form 40-F:
Form 20-F | X |
| Form 40-F |
Indicate by check mark if the registrant is submitting the Form 6-K in paper as permitted by Regulation S-T Rule 101(b)(1):
Yes |
| No | X |
Indicate by check mark if the registrant is submitting the Form 6-K in paper as permitted by Regulation S-T Rule 101(b)(7):
Yes |
| No | X |
GEOPARK LIMITED
TABLE OF CONTENTS
ITEM
| |
1. | Interim Condensed Consolidated Financial Statements and Explanatory Notes for the three-months period ended March 31, 2020 and 2021. |
Item 1
GEOPARK LIMITED
INTERIM CONDENSED CONSOLIDATED
FINANCIAL STATEMENTS
AND EXPLANATORY NOTES
For the three-months period ended March 31, 2020 and 2021
CONTENTS
2
CONDENSED CONSOLIDATED STATEMENT OF INCOME
| | | | | | |
|
| |
| Three-months |
| Three-months |
| | |
| period ended |
| period ended |
| | | | March 31, 2021 |
| March 31, 2020 |
Amounts in US$ '000 | | Note |
| (Unaudited) |
| (Unaudited) |
REVENUE |
| 3 |
| 146,595 |
| 133,239 |
Commodity risk management contracts |
| 4 |
| (47,291) |
| 32,011 |
Production and operating costs |
| 5 |
| (44,277) |
| (41,075) |
Geological and geophysical expenses |
| 6 |
| (3,075) |
| (4,458) |
Administrative expenses |
| 7 |
| (11,333) |
| (12,685) |
Selling expenses |
| 8 |
| (398) |
| (1,962) |
Depreciation |
|
|
| (22,567) |
| (39,301) |
Write-off of unsuccessful exploration efforts |
| 10 |
| — |
| (3,205) |
Impairment loss recognized for non-financial assets | | | | — | | (97,481) |
Other expenses |
|
|
| (1,754) |
| (232) |
OPERATING PROFIT (LOSS) |
|
|
| 15,900 |
| (35,149) |
Financial expenses |
| 9 |
| (15,974) |
| (14,754) |
Financial income |
| 9 |
| 463 |
| 1,423 |
Foreign exchange gain (loss) |
| 9 |
| 2,694 |
| (10,787) |
PROFIT (LOSS) BEFORE INCOME TAX |
|
|
| 3,083 |
| (59,267) |
Income tax expense |
|
|
| (13,420) |
| (30,275) |
LOSS FOR THE PERIOD |
|
|
| (10,337) |
| (89,542) |
Losses per share (in US$) for loss attributable to owners of the Company. Basic |
|
|
| (0.17) |
| (1.48) |
Losses per share (in US$) for loss attributable to owners of the Company. Diluted |
|
|
| (0.17) |
| (1.48) |
The above condensed consolidated statement of income should be read in conjunction with the accompanying notes.
3
CONDENSED CONSOLIDATED STATEMENT OF COMPREHENSIVE INCOME
| | | | |
|
| Three-months |
| Three-months |
|
| period ended |
| period ended |
|
| March 31, 2021 |
| March 31, 2020 |
Amounts in US$ '000 |
| (Unaudited) |
| (Unaudited) |
Loss for the period |
| (10,337) |
| (89,542) |
Other comprehensive income |
|
|
|
|
Items that may be subsequently reclassified to profit or loss: |
|
|
|
|
Currency translation differences |
| (649) |
| (8,500) |
Losses on cash flow hedges |
| — |
| (6,770) |
Income tax relating to losses on cash flow hedges |
| — |
| 2,166 |
Other comprehensive loss for the period |
| (649) |
| (13,104) |
Total comprehensive loss for the period |
| (10,986) |
| (102,646) |
The above condensed consolidated statement of comprehensive income should be read in conjunction with the accompanying notes.
4
CONDENSED CONSOLIDATED STATEMENT OF FINANCIAL POSITION
| | | | | | |
|
| Note |
| At March 31, 2021 |
| Year ended |
Amounts in US$ '000 | | |
| (Unaudited) |
| December 31, 2020 |
ASSETS |
|
|
|
|
|
|
NON CURRENT ASSETS |
|
|
|
|
|
|
Property, plant and equipment |
| 10 |
| 611,154 |
| 614,665 |
Right-of-use assets |
|
|
| 20,251 |
| 21,402 |
Prepayments and other receivables |
|
|
| 1,035 |
| 1,060 |
Other financial assets |
|
|
| 12,849 |
| 13,364 |
Deferred income tax asset |
|
|
| 17,852 |
| 18,168 |
TOTAL NON CURRENT ASSETS |
|
|
| 663,141 |
| 668,659 |
CURRENT ASSETS |
|
|
|
|
|
|
Inventories |
|
|
| 13,589 |
| 13,326 |
Trade receivables |
|
|
| 56,810 |
| 46,918 |
Prepayments and other receivables |
|
|
| 21,760 |
| 27,263 |
Derivative financial instrument assets |
| 15 |
| — |
| 1,013 |
Other financial assets |
|
|
| 13 |
| 28 |
Cash and cash equivalents |
|
|
| 187,568 |
| 201,907 |
Assets held for sale | | | | 1,152 | | 1,152 |
TOTAL CURRENT ASSETS |
|
|
| 280,892 |
| 291,607 |
TOTAL ASSETS |
|
|
| 944,033 |
| 960,266 |
EQUITY |
|
|
|
|
|
|
Equity attributable to owners of the Company |
|
|
|
|
|
|
Share capital |
| 11 |
| 61 |
| 61 |
Share premium |
|
|
| 179,395 |
| 179,399 |
Reserves |
|
|
| 90,434 |
| 92,216 |
Accumulated losses |
|
|
| (389,366) |
| (380,866) |
TOTAL EQUITY |
|
|
| (119,476) |
| (109,190) |
LIABILITIES |
|
|
|
|
|
|
NON CURRENT LIABILITIES |
|
|
|
|
|
|
Borrowings |
| 12 |
| 767,148 |
| 766,897 |
Lease liabilities |
|
|
| 12,056 |
| 11,457 |
Provisions and other long-term liabilities |
| 13 |
| 80,501 |
| 82,370 |
Deferred income tax liability |
|
|
| 3,976 |
| 7,190 |
Trade and other payables |
| 14 |
| 4,951 |
| 4,886 |
TOTAL NON CURRENT LIABILITIES |
|
|
| 868,632 |
| 872,800 |
CURRENT LIABILITIES |
|
|
|
|
|
|
Borrowings |
| 12 |
| 5,861 |
| 17,689 |
Lease liabilities |
|
|
| 7,871 |
| 10,890 |
Derivative financial instrument liabilities |
| 15 |
| 50,816 |
| 15,094 |
Current income tax liability |
|
|
| 39,314 |
| 52,775 |
Trade and other payables |
| 14 |
| 90,963 |
| 100,156 |
Liabilities associated with assets held for sale | | | | 52 | | 52 |
TOTAL CURRENT LIABILITIES |
|
|
| 194,877 |
| 196,656 |
TOTAL LIABILITIES |
|
|
| 1,063,509 |
| 1,069,456 |
TOTAL EQUITY AND LIABILITIES |
|
|
| 944,033 |
| 960,266 |
The above condensed consolidated statement of financial position should be read in conjunction with the accompanying notes.
5
CONDENSED CONSOLIDATED STATEMENT OF CHANGES IN EQUITY
| | | | | | | | | | | | |
|
| Attributable to owners of the Company | ||||||||||
|
| Share |
| Share |
| Other |
| Translation |
| Accumulated |
| |
Amount in US$ '000 |
| Capital |
| Premium |
| Reserve |
| Reserve |
| losses | | Total |
Equity at January 1, 2020 |
| 59 | | 173,716 |
| 116,291 |
| (3,820) | | (153,361) |
| 132,885 |
Comprehensive income: |
|
|
|
|
|
|
|
|
|
|
|
|
Loss for the three-months period |
| — |
| — |
| — |
| — |
| (89,542) |
| (89,542) |
Other comprehensive loss for the period |
| — |
| — |
| (4,604) |
| (8,500) |
| — |
| (13,104) |
Total comprehensive income for the period ended March 31, 2020 |
| — |
| — |
| (4,604) |
| (8,500) |
| (89,542) |
| (102,646) |
Transactions with owners: |
|
|
|
|
|
|
|
|
|
|
|
|
Share-based payment |
| 2 |
| 2,458 |
| — |
| — |
| (540) |
| 1,920 |
Repurchase of shares |
| — |
| (2,678) |
| — |
| — |
| — |
| (2,678) |
Stock distribution | | — | | 2,445 | | (2,445) | | — | | — | | — |
Cash distribution | | — | | — | | (2,447) | | — | | — | | (2,447) |
Total transactions with owners for the period ended March 31, 2020 |
| 2 |
| 2,225 |
| (4,892) |
| — |
| (540) |
| (3,205) |
Balance at March 31, 2020 (Unaudited) |
| 61 |
| 175,941 |
| 106,795 |
| (12,320) |
| (243,443) |
| 27,034 |
Balance at January 1, 2021 |
| 61 |
| 179,399 |
| 104,485 |
| (12,269) |
| (380,866) |
| (109,190) |
Comprehensive income: |
|
|
|
|
|
|
|
|
|
|
|
|
Loss for the three-months period |
| — |
| — |
| — |
| — |
| (10,337) |
| (10,337) |
Other comprehensive loss for the period |
| — |
| — |
| — | | (649) | | — |
| (649) |
Total comprehensive income for the period ended March 31, 2021 |
| — |
| — |
| — |
| (649) |
| (10,337) |
| (10,986) |
Transactions with owners: |
|
|
|
|
|
|
|
|
|
|
|
|
Share-based payment |
| — | | 217 | | — | | — | | 1,837 |
| 2,054 |
Repurchase of shares |
| — | | (221) | | — | | — | | — |
| (221) |
Cash distribution | | — | | — | | (1,133) | | — | | — | | (1,133) |
Total transactions with owners for the period ended March 31, 2021 |
| — |
| (4) |
| (1,133) |
| — |
| 1,837 |
| 700 |
Balance at March 31, 2021 (Unaudited) |
| 61 | | 179,395 | | 103,352 | | (12,918) |
| (389,366) |
| (119,476) |
The above condensed consolidated statement of changes in equity should be read in conjunction with the accompanying notes.
6
CONDENSED CONSOLIDATED STATEMENT OF CASH FLOW
| | | | |
|
| Three-months |
| Three-months |
|
| period ended |
| period ended |
|
| March 31, 2021 |
| March 31, 2020 |
Amounts in US$ '000 |
| (Unaudited) |
| (Unaudited) |
Cash flows from operating activities |
|
|
|
|
Loss for the period |
| (10,337) |
| (89,542) |
Adjustments for: |
|
|
|
|
Income tax expense |
| 13,420 |
| 30,275 |
Depreciation |
| 22,567 |
| 39,301 |
Write-off of unsuccessful exploration efforts |
| — |
| 3,205 |
Impairment loss for non-financial assets | | — | | 97,481 |
Loss on disposal of property, plant and equipment | | 122 | | — |
Amortization of other long-term liabilities |
| (63) |
| — |
Accrual of borrowing interests |
| 12,288 |
| 11,419 |
Unwinding of long-term liabilities |
| 1,185 |
| 1,540 |
Accrual of share-based payment |
| 2,054 |
| 1,920 |
Foreign exchange (gain) loss |
| (2,694) |
| 10,787 |
Unrealized loss (gain) on commodity risk management contracts |
| 26,655 |
| (26,431) |
Income tax paid |
| (20,507) |
| (16,970) |
Change in working capital |
| (8,294) |
| (24,976) |
Cash flows from operating activities – net |
| 36,396 |
| 38,009 |
Cash flows from investing activities |
|
|
|
|
Purchase of property, plant and equipment |
| (20,332) |
| (33,673) |
Acquisition of business, net of cash acquired |
| — |
| (272,335) |
Cash flows used in investing activities – net |
| (20,332) |
| (306,008) |
Cash flows from financing activities |
|
|
|
|
Proceeds from borrowings |
| — |
| 350,000 |
Debt issuance costs paid |
| — |
| (7,506) |
Interest paid |
| (23,484) |
| (13,813) |
Lease payments |
| (2,461) |
| (2,784) |
Repurchase of shares |
| (221) |
| (2,678) |
Payments for transactions with former non-controlling interest |
| (3,580) |
| — |
Cash flows (used in) from financing activities - net |
| (29,746) |
| 323,219 |
Net (decrease) increase in cash and cash equivalents |
| (13,682) |
| 55,220 |
| | | | |
Cash and cash equivalents at January 1 |
| 201,907 |
| 111,180 |
Currency translation differences |
| (657) |
| (852) |
Cash and cash equivalents at the end of the period |
| 187,568 |
| 165,548 |
| | | | |
Ending Cash and cash equivalents are specified as follows: |
|
|
|
|
Cash at bank and bank deposits |
| 187,550 |
| 165,525 |
Cash in hand |
| 18 |
| 23 |
Cash and cash equivalents |
| 187,568 |
| 165,548 |
The above condensed consolidated statement of cash flow should be read in conjunction with the accompanying notes.
7
EXPLANATORY NOTES TO THE INTERIM CONDENSED CONSOLIDATED FINANCIAL STATEMENTS
Note 1
General information
GeoPark Limited (the “Company”) is a company incorporated under the laws of Bermuda. The Registered Office address is Clarendon House, 2 Church Street, Hamilton HM11, Bermuda.
The principal activity of the Company and its subsidiaries (the “Group” or “GeoPark”) is the exploration, development and production for oil and gas reserves in Colombia, Chile, Brazil, Argentina and Ecuador.
This condensed consolidated interim financial statements were authorized for issue by the Board of Directors on May 5, 2021.
Basis of Preparation
The condensed consolidated interim financial statements of GeoPark Limited are presented in accordance with IAS 34 “Interim Financial Reporting”. They do not include all of the information required for full annual financial statements, and should be read in conjunction with the annual consolidated financial statements as of and for the year ended December 31, 2020, which have been prepared in accordance with IFRS.
The condensed consolidated interim financial statements have been prepared in accordance with the accounting policies applied in the most recent annual consolidated financial statements. The Group has not early adopted any standard, interpretation or amendment that has been issued but is not yet effective. Several amendments and interpretations apply for the first time in 2021, but do not have an impact on the condensed consolidated interim financial statements of the Group.
Whenever necessary, certain comparative amounts have been reclassified to conform to changes in presentation in the current period.
Taxes on income in the interim periods are accrued using the tax rate that would be applicable to expected total annual profit or loss.
The activities of the Group are not subject to significant seasonal changes.
Estimates
The preparation of interim financial information requires the use of certain critical accounting estimates. It also requires management to exercise its judgement in the process of applying the Group’s accounting policies. Actual results may differ from these estimates.
In preparing these condensed consolidated interim financial statements, the significant judgements made by management in applying the Group’s accounting policies and the key sources of estimation uncertainty were the same as those that applied to the annual consolidated financial statements as of and for the year ended December 31, 2020.
8
Note 1 (Continued)
Financial risk management
The Group’s activities expose it to a variety of financial risks: currency risk, price risk, credit risk- concentration, funding and liquidity risk, interest risk and capital risk. The condensed consolidated interim financial statements do not include all financial risk management information and disclosures required in the annual consolidated financial statements, and should be read in conjunction with the Group’s annual consolidated financial statements as of and for the year ended December 31, 2020.
The 2019 coronavirus (“COVID-19”) outbreak continues to have an indeterminable adverse impact on the world economy. While the COVID-19 has numerous worldwide effects on general commercial activity, one such effect is that the price of crude oil dropped dramatically during 2020. By the end of 2020 and the beginning of 2021, the gradual crude demand recovery is resulting in some improvements in the market conditions. At this time, given the uncertainty of the lasting effect of the COVID-19 outbreak, its impact on the Group’s business cannot be completely determined.
The Group is continually reviewing its exposure to the current market conditions and adjusting the 2021 capital expenditures program which remains flexible, quickly adaptable and expandable if prices recover. The Group also continues to add new oil hedges, increasing its price risk protection within the next twelve months. GeoPark maintained a strong cash position of US$ 187,568,000 and has available US$ 106,223,000 in uncommitted credit lines as of March 31, 2021.
Subsidiary undertakings
The following chart illustrates the main companies of the Group structure as of March 31, 2021:
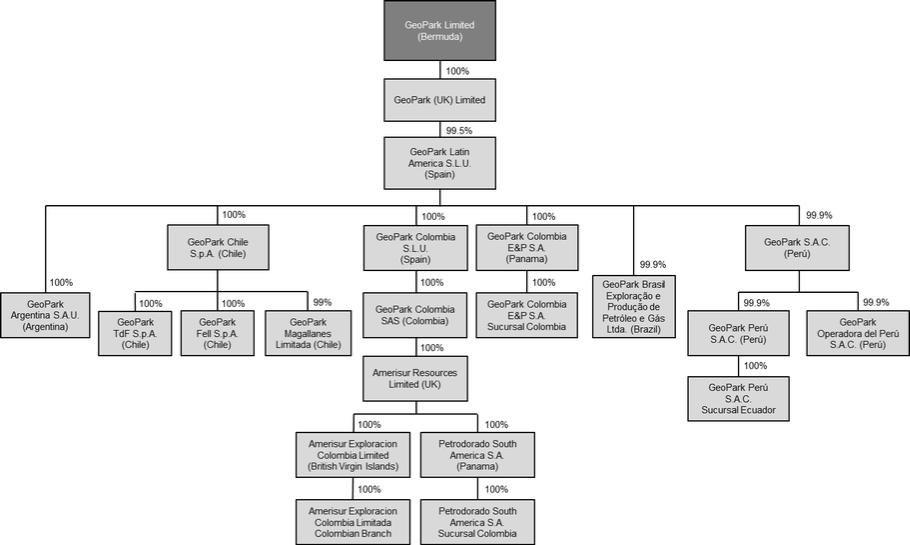
Details of the subsidiaries and joint operations of the Group are set out in Note 21 to the annual consolidated financial statements as of and for the year ended December 31, 2020.
On March 13, 2021, the Company incorporated a subsidiary in the United States named Market Access LLP (ownership interest: 9%), which is in start-up phase.
9
Note 2
Segment Information
Operating segments are reported in a manner consistent with the internal reporting provided to the chief operating decision-maker. The chief operating decision-maker, who is responsible for allocating resources and assessing performance of the operating segments, has been identified as the Executive Committee. This committee is integrated by the CEO, COO, CFO and managers in charge of the Geoscience, Operations, Legal and Corporate Governance, People and Sustainability departments. This committee reviews the Group’s internal reporting in order to assess performance and allocate resources. Management has determined the operating segments based on these reports. The committee considers the business from a geographic perspective.
The Executive Committee assesses the performance of the operating segments based on a measure of Adjusted EBITDA. Adjusted EBITDA is defined as profit (loss) for the period (determined as if IFRS 16 Leases had not been adopted), before net finance cost, income tax, depreciation, amortization, certain non-cash items such as impairments and write-offs of unsuccessful exploration efforts, accrual of share-based payment, unrealized result on commodity risk management contracts, geological and geophysical expenses allocated to capitalized projects and other items. Operating Netback is equivalent to Adjusted EBITDA before cash expenses included in Administrative and Geological and Geophysical expenses. Other information provided to the Executive Committee is measured in a manner consistent with that in the financial statements.
Three-months period ended March 31, 2021:
| | | | | | | | | | | | | | |
Amounts in US$ '000 |
| Total |
| Colombia |
| Chile |
| Brazil |
| Argentina |
| Ecuador |
| Corporate |
Revenue |
| 146,595 |
| 130,562 |
| 4,567 |
| 4,853 |
| 6,613 |
| — |
| — |
Sale of crude oil |
| 137,318 |
| 130,058 |
| 1,362 |
| 131 |
| 5,767 |
| — |
| — |
Sale of gas |
| 9,277 |
| 504 |
| 3,205 |
| 4,722 |
| 846 |
| — |
| — |
Production and operating costs |
| (44,277) |
| (37,048) |
| (2,130) |
| (899) |
| (4,200) |
| — |
| — |
Royalties |
| (19,804) |
| (18,266) |
| (164) |
| (389) |
| (985) |
| — |
| — |
Share-based payment |
| (18) |
| (26) |
| (5) |
| — |
| 13 |
| — |
| — |
Operating costs |
| (24,455) |
| (18,756) |
| (1,961) |
| (510) |
| (3,228) |
| — |
| — |
Depreciation |
| (22,567) |
| (14,828) |
| (3,341) |
| (1,012) |
| (3,323) |
| (61) |
| (2) |
Operating profit (loss) |
| 15,900 |
| 23,240 |
| (1,558) |
| 2,516 |
| (1,801) |
| (608) |
| (5,889) |
Operating Netback |
| 79,372 |
| 71,483 |
| 2,359 |
| 3,491 |
| 2,039 |
| — |
| — |
Adjusted EBITDA |
| 66,469 |
| 64,258 |
| 1,727 |
| 3,153 |
| 1,109 |
| (552) |
| (3,226) |
Three-months period ended March 31, 2020:
| | | | | | | | | | | | | | | | |
Amounts in US$ '000 |
| Total |
| Colombia |
| Chile |
| Brazil |
| Argentina |
| Peru (a) |
| Ecuador |
| Corporate |
Revenue |
| 133,239 |
| 114,076 |
| 6,996 |
| 3,260 |
| 8,907 |
| — |
| — |
| — |
Sale of crude oil |
| 123,835 |
| 113,476 |
| 2,106 |
| 488 |
| 7,765 |
| — |
| — |
| — |
Sale of gas |
| 9,404 |
| 600 |
| 4,890 |
| 2,772 |
| 1,142 |
| — |
| — |
| — |
Production and operating costs |
| (41,075) |
| (29,263) |
| (3,583) |
| (1,271) |
| (6,958) |
| — |
| — |
| — |
Royalties |
| (12,709) |
| (10,926) |
| (252) |
| (325) |
| (1,206) |
| — |
| — |
| — |
Share-based payment |
| (68) |
| (43) |
| (14) |
| (1) |
| (10) |
| — |
| — |
| — |
Operating costs |
| (28,298) |
| (18,294) |
| (3,317) |
| (945) |
| (5,742) |
| — |
| — |
| — |
Depreciation |
| (39,301) |
| (24,064) |
| (8,797) |
| (994) |
| (5,279) |
| (136) |
| — |
| (31) |
Operating profit (loss) |
| (35,149) |
| 80,490 |
| (59,402) |
| 367 |
| (19,209) |
| (32,016) |
| (241) |
| (5,138) |
Operating Netback |
| 93,422 |
| 87,021 |
| 3,346 |
| 1,469 |
| 1,584 |
| 2 |
| — |
| — |
Adjusted EBITDA |
| 77,702 |
| 76,316 |
| 2,928 |
| 828 |
| 2,106 |
| (987) |
| (227) |
| (3,262) |
| (a) | As of the date of these interim condensed consolidated financial statements, Peru is no longer an operating segment due to the decision to retire from the Morona Block. |
10
Note 2 (Continued)
Segment Information (Continued)
| | | | | | | | | | | | | | | | |
Total Assets |
| Total |
| Colombia |
| Chile |
| Brazil |
| Argentina |
| Peru (a) |
| Ecuador |
| Corporate |
March 31, 2021 |
| 944,033 |
| 645,229 |
| 100,770 |
| 37,100 |
| 34,938 |
| 4,495 |
| 1,301 |
| 120,200 |
December 31, 2020 |
| 960,266 |
| 680,828 | | 101,742 | | 38,172 | | 36,803 | | 4,656 | | 1,127 | | 96,938 |
| (a) | The remaining assets in Peru are expected to be transferred to Petroperu in May 2021. |
A reconciliation of total Operating Netback to total profit (loss) before income tax is provided as follows:
| | | | |
|
| Three-months |
| Three-months |
|
| period ended |
| period ended |
|
| March 31, 2021 |
| March 31, 2020 |
Operating Netback |
| 79,372 |
| 93,422 |
Geological and geophysical expenses |
| (3,108) |
| (4,551) |
Administrative expenses |
| (9,795) |
| (11,169) |
Adjusted EBITDA for reportable segments |
| 66,469 |
| 77,702 |
Unrealized (loss) gain on commodity risk management contracts |
| (26,655) |
| 26,431 |
Depreciation (a) |
| (22,567) |
| (39,301) |
Write-off of unsuccessful exploration efforts |
| — |
| (3,205) |
Impairment loss recognized for non-financial assets | | — | | (97,481) |
Share-based payment |
| (2,054) |
| (1,920) |
Lease accounting - IFRS 16 |
| 2,461 |
| 2,784 |
Others (b) |
| (1,754) |
| (159) |
Operating profit (loss) |
| 15,900 |
| (35,149) |
Financial expenses |
| (15,974) |
| (14,754) |
Financial income |
| 463 |
| 1,423 |
Foreign exchange gain (loss) |
| 2,694 |
| (10,787) |
Profit (Loss) before tax |
| 3,083 |
| (59,267) |
| (a) | Net of capitalized costs for oil stock included in Inventories. Depreciation includes US$ 700,000 (US$ 700,000 in 2020) generated by assets not related to production activities. |
| (b) | Includes allocation to capitalized projects. |
The following table presents a reconciliation of Adjusted EBITDA to operating profit (loss) for the three-month periods ended March 31, 2021 and 2020:
| | | | | | | | | | | | |
|
| Three-months period ended March 31, 2021 | ||||||||||
|
| Colombia |
| Chile |
| Brazil |
| Argentina |
| Other (a) |
| Total |
Adjusted EBITDA for reportable segments |
| 64,258 | | 1,727 | | 3,153 | | 1,109 | | (3,778) | | 66,469 |
Depreciation |
| (14,828) | | (3,341) | | (1,012) | | (3,323) | | (63) | | (22,567) |
Unrealized loss on commodity risk management contracts |
| (26,655) | | — | | — | | — | | — | | (26,655) |
Share-based payment |
| (185) | | (12) | | — | | (8) | | (1,849) | | (2,054) |
Lease accounting - IFRS 16 |
| 1,521 | | 127 | | 530 | | 225 | | 58 | | 2,461 |
Others |
| (871) | | (59) | | (155) | | 196 | | (865) | | (1,754) |
Operating profit / (loss) |
| 23,240 |
| (1,558) |
| 2,516 |
| (1,801) |
| (6,497) |
| 15,900 |
| (a) | Includes Ecuador and Corporate. |
11
Note 2 (Continued)
Segment Information (Continued)
| | | | | | | | | | | | |
|
| Three-months period ended March 31, 2020 | ||||||||||
|
| Colombia |
| Chile |
| Brazil |
| Argentina |
| Other (a) |
| Total |
Adjusted EBITDA for reportable segments |
| 76,316 | | 2,928 | | 828 | | 2,106 | | (4,476) | | 77,702 |
Depreciation |
| (24,064) | | (8,797) | | (994) | | (5,279) | | (167) | | (39,301) |
Unrealized gain on commodity risk management contracts |
| 26,431 | | — | | — | | — | | — | | 26,431 |
Write-off of unsuccessful exploration efforts |
| — | | (3,205) | | — | | — | | — | | (3,205) |
Impairment loss recognized for non-financial assets | | — | | (50,281) | | — | | (16,205) | | (30,995) | | (97,481) |
Share-based payment |
| (87) | | (23) | | (6) | | (43) | | (1,761) | | (1,920) |
Lease accounting - IFRS 16 |
| 1,799 | | 35 | | 566 | | 251 | | 133 | | 2,784 |
Others |
| 95 | | (59) | | (27) | | (39) | | (129) | | (159) |
Operating profit / (loss) |
| 80,490 |
| (59,402) |
| 367 |
| (19,209) |
| (37,395) |
| (35,149) |
| (a) | Includes Peru, Ecuador and Corporate. |
Note 3
Revenue
| | | | |
|
| Three-months |
| Three-months |
|
| period ended |
| period ended |
Amounts in US$ '000 |
| March 31, 2021 |
| March 31, 2020 |
Sale of crude oil |
| 137,318 |
| 123,835 |
Sale of gas |
| 9,277 |
| 9,404 |
| | 146,595 |
| 133,239 |
12
Note 4
Commodity risk management contracts
The Group entered into derivative financial instruments to manage its exposure to oil price risk. These derivatives are zero-premium collars, fixed price or zero-premium 3 ways (put spread plus call), and were placed with major financial institutions and commodity traders. The Group entered into the derivatives under ISDA Master Agreements and Credit Support Annexes, which provide credit lines for collateral posting thus alleviating possible liquidity needs under the instruments and protect the Group from potential non-performance risk by its counterparties. The Group’s derivatives are accounted for as non-hedge derivatives and therefore all changes in the fair values of its derivative contracts are recognized as gains or losses in the results of the periods in which they occur.
The following table summarizes the Group’s production hedged during the three-month period ending March 31, 2021 and for the following periods as a consequence of the derivative contracts in force as of March 31, 2021:
| | | | | | | | |
|
| |
| |
| Volume |
| Average |
Period | | Reference | | Type | | bbl/d | | price US$/bbl |
January 1, 2021 - March 31, 2021 | | ICE BRENT | | Zero Premium Collars | | 23,500 | | 38.91 Put 52.72 Call |
January 1, 2021 - March 31, 2021 | | VASCONIA(a) | | Zero Premium Collars | | 2,000 | | 35.00 Put 43.01 Call |
| | | | | | 25,500 | | |
April 1, 2021 - June 30, 2021 | | ICE BRENT | | Zero Premium Collars | | 25,500 | | 40.61 Put 53.59 Call |
| | | | | | 25,500 | | |
July 1, 2021 - September 30, 2021 | | ICE BRENT | | Zero Premium Collars | | 18,000 | | 43.19 Put 60.64 Call |
July 1, 2021 - September 30, 2021 | | VASCONIA(a) | | Zero Premium Collars | | 2,000 | | 41.50 Put 68.57 Call |
| | | | | | 20,000 | | |
October 1, 2021 - December 31, 2021 | | ICE BRENT | | Zero Premium Collars | | 19,500 | | 43.72 Put 62.65 Call |
| | | | | | 19,500 | | |
January 1, 2022 - March 31, 2022 | | ICE BRENT | | Zero Premium Collars | | 6,500 | | 46.54 Put 69.97 Call |
| | | | | | 6,500 | | |
| (a) | Vasconia Crude (Ice Brent minus Vasconia Differential). |
The table below summarizes the (loss) gain on the commodity risk management contracts:
| | | | |
|
| Three-months |
| Three-months |
|
| period ended |
| period ended |
|
| March 31, 2021 |
| March 31, 2020 |
Realized (loss) gain on commodity risk management contracts |
| (20,636) |
| 5,580 |
Unrealized (loss) gain on commodity risk management contracts |
| (26,655) |
| 26,431 |
Total |
| (47,291) |
| 32,011 |
The following table presents the Group’s derivative contracts agreed after the balance sheet date:
| | | | | | | | |
| | | | | | Volume | | |
Period |
| Reference |
| Type |
| bbl/d |
| Price US$/bbl |
January 1, 2022 - March 31, 2022 | | ICE BRENT | | Zero Premium Collars | | 2,000 | | 50.00 Put 74.40 Call |
April 1, 2022 - June 30, 2022 | | ICE BRENT | | Zero Premium Collars | | 2,000 | | 50.00 Put 72.30 Call |
13
Note 5
Production and operating costs
| | | | |
|
| Three-months period |
| Three-months period |
Amounts in US$ '000 |
| ended March 31, 2021 |
| ended March 31, 2020 |
Staff costs |
| 4,009 |
| 3,699 |
Share-based payment |
| 18 |
| 68 |
Royalties |
| 19,804 |
| 12,709 |
Well and facilities maintenance |
| 4,942 |
| 5,397 |
Operation and maintenance |
| 1,929 |
| 1,896 |
Consumables |
| 4,664 |
| 5,105 |
Equipment rental |
| 1,790 |
| 2,415 |
Transportation costs |
| 2,002 |
| 1,080 |
Gas plant costs |
| 558 |
| 568 |
Safety and insurance costs |
| 947 |
| 1,118 |
Field camp |
| 1,310 |
| 760 |
Non-operated blocks costs |
| 941 |
| 364 |
Crude oil stock variation |
| (381) |
| 3,142 |
Other costs |
| 1,744 |
| 2,754 |
| | 44,277 |
| 41,075 |
Note 6
Geological and geophysical expenses
| | | | |
|
| Three-months period |
| Three-months period |
Amounts in US$ '000 |
| ended March 31, 2021 |
| ended March 31, 2020 |
Staff costs |
| 1,957 |
| 3,335 |
Share-based payment |
| 47 |
| 69 |
Other services |
| 1,071 |
| 1,127 |
Allocation to capitalized project |
| — |
| (73) |
| | 3,075 |
| 4,458 |
Note 7
Administrative expenses
| | | | |
|
| Three-months period |
| Three-months period |
Amounts in US$ '000 |
| ended March 31, 2021 |
| ended March 31, 2020 |
Staff costs |
| 6,269 |
| 5,890 |
Share-based payment |
| 1,989 |
| 1,783 |
Consultant fees |
| 1,563 |
| 2,209 |
Travel expenses |
| 55 |
| 807 |
Director fees and allowance |
| 894 |
| 653 |
Communication and IT costs |
| 879 |
| 606 |
Allocation to joint operations |
| (1,975) |
| (2,504) |
Other administrative expenses |
| 1,659 |
| 3,241 |
| | 11,333 |
| 12,685 |
14
Note 8
Selling expenses
| | | | |
|
| Three-months |
| Three-months |
|
| period ended |
| period ended |
Amounts in US$ '000 |
| March 31, 2021 |
| March 31, 2020 |
Transportation |
| 181 |
| 1,653 |
Selling taxes and other |
| 217 |
| 309 |
| | 398 |
| 1,962 |
Note 9
Financial results
| | | | |
|
| Three-months |
| Three-months |
|
| period ended |
| period ended |
Amounts in US$ '000 |
| March 31, 2021 |
| March 31, 2020 |
Financial expenses |
|
|
|
|
Bank charges and other financial costs |
| (2,458) |
| (1,862) |
Interest and amortization of debt issue costs |
| (12,331) |
| (11,352) |
Unwinding of long-term liabilities |
| (1,185) |
| (1,540) |
| | (15,974) |
| (14,754) |
Financial income |
|
|
|
|
Interest received |
| 463 |
| 1,423 |
| | 463 |
| 1,423 |
Foreign exchange gains and losses |
|
|
|
|
Foreign exchange gain |
| 2,694 |
| 2,919 |
Realized loss on currency risk management contracts (a) |
| — |
| (472) |
Unrealized loss on currency risk management contracts (a) |
| — |
| (13,234) |
| | 2,694 |
| (10,787) |
Total financial results |
| (12,817) |
| (24,118) |
| (a) | GeoPark manages its exposure to local currency fluctuation with respect to income tax balances in Colombia. As of December 31, 2019, the Group entered into derivative financial instruments with local banks in Colombia for an amount equivalent to US$ 83,700,000 in order to anticipate any currency fluctuation with respect to income taxes payable in February, April and June 2020. As of March 31, 2021, there were no currency risk management contracts in place. |
15
Note 10
Property, plant and equipment
| | | | | | | | | | | | | | |
|
| |
| Furniture, |
| |
| |
| |
| Exploration |
| |
| | | | equipment | | Production | | Buildings | | | | and | | |
| | Oil & gas | | and | | facilities and | | and | | Construction | | evaluation | | |
Amounts in US$ '000 | | properties |
| vehicles | | machinery | | improvements | | in progress |
| assets | | TOTAL |
Cost at January 1, 2020 |
| 830,937 |
| 19,549 |
| 172,507 |
| 11,770 |
| 69,587 |
| 48,036 |
| 1,152,386 |
Additions |
| (654) | (a) | 520 |
| 4 |
| 423 |
| 23,215 |
| 9,555 |
| 33,063 |
Acquisitions | | 165,954 | | 616 |
| 37,073 |
| — |
| 1,221 |
| 78,773 | | 283,637 |
Write-off / Impairment |
| (66,486) | (b) | — |
| — |
| — |
| (30,995) | (b) | (3,205) | (c) | (100,686) |
Transfers |
| 22,626 |
| — |
| 2,239 |
| 78 |
| (19,976) |
| (4,967) |
| — |
Currency translation differences |
| (17,480) |
| (176) |
| (3,141) |
| (68) |
| (47) |
| (511) |
| (21,423) |
Cost at March 31, 2020 |
| 934,897 |
| 20,509 |
| 208,682 |
| 12,203 |
| 43,005 |
| 127,681 |
| 1,346,977 |
| | | | | | | | | | | | | | |
Cost at January 1, 2021 |
| 968,617 | | 20,707 | | 197,829 | | 12,442 | | 18,848 | | 78,614 | | 1,297,057 |
Additions |
| (1,437) | (a) | 357 | | — | | — | | 14,764 | | 5,211 | | 18,895 |
Transfers |
| 8,156 | | — | | 3,983 | | 64 | | (12,235) | | 32 | | — |
Currency translation differences |
| (4,194) | | (58) | | (315) | | (21) | | (22) | | (38) | | (4,648) |
Disposals | | — | | (130) | | — | | (8) | | — | | — | | (138) |
Cost at March 31, 2021 |
| 971,142 |
| 20,876 |
| 201,497 |
| 12,477 | | 21,355 |
| 83,819 |
| 1,311,166 |
| | | | | | | | | | | | | | |
Depreciation and write-down at January 1, 2020 |
| (467,806) |
| (15,149) |
| (95,047) |
| (6,596) |
| — |
| — |
| (584,598) |
Depreciation |
| (30,181) |
| (572) |
| (5,345) |
| (128) |
| — |
| — |
| (36,226) |
Currency translation differences |
| 12,461 |
| 155 |
| 3,317 |
| 38 |
| — |
| — |
| 15,971 |
Depreciation and write-down at March 31, 2020 |
| (485,526) |
| (15,566) |
| (97,075) |
| (6,686) |
| — |
| — |
| (604,853) |
| | | | | | | | | | | | | | |
Depreciation and write-down at January 1, 2021 |
| (548,445) | | (16,985) | | (109,987) | | (6,975) | | — | | — |
| (682,392) |
Depreciation |
| (16,641) | | (547) | | (3,561) | | (153) | | — | | — | | (20,902) |
Currency translation differences |
| 2,617 | | 47 | | 589 | | 13 | | — | | — | | 3,266 |
Disposals | | — | | 16 | | — | | — | | — | | — | | 16 |
Depreciation and write-down at March 31, 2021 |
| (562,469) |
| (17,469) |
| (112,959) |
| (7,115) |
| — |
| — |
| (700,012) |
| | | | | | | | | | | | | | |
Carrying amount at March 31, 2020 |
| 449,371 |
| 4,943 |
| 111,607 |
| 5,517 |
| 43,005 |
| 127,681 |
| 742,124 |
Carrying amount at March 31, 2021 |
| 408,673 |
| 3,407 |
| 88,538 |
| 5,362 |
| 21,355 |
| 83,819 |
| 611,154 |
| (a) | Corresponds to the effect of change in estimate of assets retirement obligations. |
| (b) | Corresponds to impairment losses recognized in the Fell Block (Chile), the Aguada Baguales and El Porvenir Blocks (Argentina) and the Morona Block (Peru) for US$ 50,281,000, US$ 16,205,000 and US$ 30,995,000, respectively. |
| (c) | Corresponds to an unsuccessful exploratory well drilled in the Isla Norte Block (Chile). |
16
Note 11
Equity
Share capital
| | | | |
|
| At |
| Year ended |
Issued share capital |
| March 31, 2021 |
| December 31, 2020 |
Common stock (US$ '000) |
| 61 |
| 61 |
The share capital is distributed as follows: |
|
|
| |
Common shares, of nominal US$ 0.001 |
| 61,032,028 |
| 61,029,772 |
Total common shares in issue |
| 61,032,028 |
| 61,029,772 |
| | | | |
Authorized share capital |
|
|
|
|
US$ per share |
| 0.001 |
| 0.001 |
| | | | |
Number of common shares (US$ 0.001 each) |
| 5,171,949,000 |
| 5,171,949,000 |
Amount in US$ |
| 5,171,949 |
| 5,171,949 |
GeoPark’s share capital only consists of common shares. The authorized share capital consists of 5,171,949,000 common shares of par value US$ 0.001 per share. All of the Company issued and outstanding common shares are fully paid and nonassessable.
Cash distribution
On March 10, 2021, the Company’s Board of Directors declared a quarterly cash distribution of US$ 0.0205 per share that was paid on April 13, 2021.
Buyback Program
On November 4, 2020, the Company’s Board of Directors approved a program to repurchase up to 10% of its shares outstanding or approximately 6,062,000 shares. The repurchase program began on November 5, 2020 and will expire on November 15, 2021. During the three-month period ended March 31, 2021, the Company purchased 17,303 common shares for a total amount of US$ 221,000. These transactions have no impact on the Group’s results.
17
Note 12
Borrowings
The outstanding amounts are as follows:
| | | | |
|
| At |
| Year ended |
Amounts in US$ '000 |
| March 31, 2021 |
| December 31, 2020 |
2024 Notes (a) |
| 422,064 |
| 428,737 |
2027 Notes (b) |
| 347,537 |
| 352,113 |
Banco Santander (c) |
| 3,408 |
| 3,736 |
| | 773,009 |
| 784,586 |
Classified as follows:
| | | | |
Current |
| 5,861 |
| 17,689 |
Non-Current |
| 767,148 |
| 766,897 |
(a)On September 21, 2017, the Company successfully placed US$ 425,000,000 notes, which were offered to qualified institutional buyers in accordance with Rule 144A under the United States Securities Act, and outside the United States to non-U.S. persons in accordance with Regulation S under the United States Securities Act.
The Notes carry a coupon of 6.50% per annum. Final maturity of the Notes will be September 21, 2024. The Notes are secured with a guarantee granted by GeoPark Colombia S.L.U. and GeoPark Chile S.p.A. The debt issuance cost for this transaction amounted to US$ 6,683,000 (debt issuance effective rate: 6.90%). The indenture governing the Notes due 2024 includes incurrence test covenants that provide, among other things, that during the two-years period between September 22, 2019 and September 21, 2021, the Net Debt to Adjusted EBITDA ratio should not exceed 3.25 times and the Adjusted EBITDA to Interest ratio should exceed 2.25 times. Failure to comply with the incurrence test covenants does not trigger an event of default. However, this situation may limit the Company’s capacity to incur additional indebtedness, as specified in the indenture governing the Notes. Incurrence covenants as opposed to maintenance covenants must be tested by the Company before incurring additional debt or performing certain corporate actions including but not limited to dividend payments, restricted payments and others. As of the date of these interim condensed consolidated financial statements, the Company is in compliance of all the indenture’s provisions and covenants.
(b)On January 17, 2020, the Company successfully placed US$ 350,000,000 Notes, which were offered in a private placement to qualified institutional buyers in accordance with Rule 144A under the Securities Act of 1933, as amended (the “Securities Act”), and outside the United States to non U.S. persons in accordance with Regulation S under the Securities Act. The Notes are fully and unconditionally guaranteed jointly and severally by GeoPark Chile S.p.A. and GeoPark Colombia S.L.U.
18
Note 12 (Continued)
Borrowings (Continued)
The Notes were priced at 99.285% and carry a coupon of 5.50% per annum (yield 5.625% per annum). The debt issuance cost for this transaction amounted to US$ 5,004,000 (debt issuance effective rate: 5.88%). Final maturity of the Notes will be January 17, 2027. The indenture governing the Notes due 2027 includes incurrence test covenants that provides among other things, that, the Net Debt to Adjusted EBITDA ratio should not exceed 3.25 times and the Adjusted EBITDA to Interest ratio should exceed 2.5 times. Failure to comply with the incurrence test covenants does not trigger an event of default. However, this situation may limit the Company’s capacity to incur additional indebtedness, as specified in the indenture governing the Notes. Incurrence covenants as opposed to maintenance covenants must be tested by the Company before incurring additional debt or performing certain corporate actions including but not limited to dividend payments, restricted payments and others. As of the date of these interim condensed consolidated financial statements, the Company is in compliance of all the indenture’s provisions and covenants.
The net proceeds from the Notes were used by the Company (i) to make an intercompany loan to its wholly-owned subsidiary, GeoPark Colombia S.A.S., providing it with sufficient funds to pay the total consideration for the acquisition of Amerisur and to pay any related fees and expenses, and (ii) for general corporate purposes.
(c)In October 2018, GeoPark Brasil Exploração y Produção de Petróleo e Gás Ltda. executed a loan agreement with Banco Santander for Brazilian Real 77,640,000 (equivalent to US$ 20,000,000 at the moment of the loan execution) to repay an existing US$-denominated intercompany loan to GeoPark Latin America Limited - Agencia en Chile. The interest rate applicable to this loan is CDI plus 2.25% per annum. “CDI” (Interbank certificate of deposit) represents the average rate of all inter-bank overnight transactions in Brazil. The principal and the interest are paid semi-annually, with final maturity in October 2020.
In September 2020, GeoPark Brasil Exploração y Produção de Petróleo e Gás Ltda. executed the refinancing of the outstanding principal loan with Banco Santander for a total amount of Brazilian Real 19,410,000 (equivalent to US$ 3,441,000 as of September 30, 2020). The interest rate applicable is CDI plus 3.55% per annum. Interests are being paid on a monthly basis, and principal will be paid semi-annually in three equal instalments in October 2021, April 2022 and October 2022.
As of the date of these interim condensed consolidated financial statements, the Group has available credit lines for US$ 106,223,000.
Note 13
Provisions and other long-term liabilities
The outstanding amounts are as follows:
| | | | |
|
| At |
| Year ended |
Amounts in US$ '000 |
| March 31, 2021 |
| December 31, 2020 |
Assets retirement obligation |
| 62,886 |
| 64,040 |
Deferred income |
| 3,611 |
| 3,828 |
Other |
| 14,004 |
| 14,502 |
| | 80,501 |
| 82,370 |
19
Note 14
Trade and other payables
The outstanding amounts are as follows:
| | | | |
|
| At |
| Year ended |
Amounts in US$ '000 |
| March 31, 2021 |
| December 31, 2020 |
Trade payables |
| 60,920 |
| 63,528 |
To be paid to co-venturers |
| 5,591 |
| 5,760 |
Payables to LGI (a) |
| — |
| 3,528 |
Short-term advance payments (b) | | 216 | | — |
Staff costs to be paid |
| 14,746 |
| 13,752 |
Cash distribution to be paid | | 1,219 | | — |
Royalties to be paid |
| 6,483 |
| 5,287 |
V.A.T |
| 2,364 |
| 3,453 |
Taxes and other debts to be paid |
| 4,375 |
| 9,734 |
| | 95,914 |
| 105,042 |
Classified as follows:
| | | | |
Current |
| 90,963 | | 100,156 |
Non-Current |
| 4,951 | | 4,886 |
| (b) | Advance payment collected in relation with the farm-out process of the REC-T-128 Block in Brazil (see Note 36.3.2 to the annual consolidated financial statements as of and for the year ended December 31, 2020). |
Note 15
Fair value measurement of financial instruments
Fair value hierarchy
The following table presents the Group’s financial assets and financial liabilities measured and recognized at fair value at March 31, 2021 and December 31, 2020 on a recurring basis:
| | | | | | |
|
| |
| |
| At |
Amounts in US$ '000 | | Level 1 | | Level 2 |
| March 31, 2021 |
Assets |
|
|
|
|
|
|
Cash and cash equivalents |
|
|
|
|
| |
Money market funds |
| 1,152 |
| — |
| 1,152 |
Total Assets |
| 1,152 |
| — |
| 1,152 |
Liabilities |
|
|
|
|
|
|
Derivative financial instrument liabilities |
|
|
|
|
| |
Commodity risk management contracts |
| — |
| 50,816 |
| 50,816 |
Total Liabilities |
| — |
| 50,816 |
| 50,816 |
20
Note 15 (Continued)
Fair value measurement of financial instruments (Continued)
Fair value hierarchy (Continued)
| | | | | | |
|
| |
| |
| Year ended |
Amounts in US$ '000 | | Level 1 | | Level 2 |
| December 31, 2020 |
Assets |
|
|
|
|
|
|
Cash and cash equivalents |
|
|
|
|
|
|
Money market funds |
| 823 |
| — |
| 823 |
Derivative financial instrument assets |
|
|
|
|
|
|
Commodity risk management contracts |
| — |
| 1,013 |
| 1,013 |
Total Assets |
| 823 |
| 1,013 |
| 1,836 |
Liabilities |
|
|
|
|
|
|
Derivative financial instrument liabilities |
|
|
|
|
|
|
Commodity risk management contracts |
| — |
| 15,094 |
| 15,094 |
Total Liabilities |
| — |
| 15,094 |
| 15,094 |
There were no transfers between Level 2 and 3 during the period. The Group did not measure any financial assets or financial liabilities at fair value on a non-recurring basis as of March 31, 2021.
Fair values of other financial instruments (unrecognized)
The Group also has a number of financial instruments which are not measured at fair value in the balance sheet. For the majority of these instruments, the fair values are not materially different to their carrying amounts, since the interest receivable/payable is either close to current market rates or the instruments are short-term in nature.
Borrowings are comprised primarily of fixed rate debt and variable rate debt with a short term portion where interest has already been fixed. They are measured at their amortized cost. The Group estimates that the fair value of its main financial liabilities is approximately 103.5% of its carrying amount including interests accrued as of March 31, 2021. Fair values were calculated based on market price for the Notes and cash flows discounted for other borrowings using a rate based on the borrowing rate and are within Level 1 and Level 2 of the fair value hierarchy, respectively.
Note 16
Subsequent events
Borrowings
In April 2021, the Company executed a series of transactions that included a successful tender to purchase US$ 255,000,000 of the 2024 Notes that was funded with a combination of cash in hand and a US$ 150,000,000 new issuance from the reopening of the 2027 Notes. The tender included a consent solicitation to align the covenants of the 2024 Notes to those of the 2027 Notes. The new notes offering and the tender offer closed on April 23 and April 26, respectively.
The reopening of the 2027 Notes was priced above par at 101.875%, representing a yield to maturity of 5.117%. The Notes were offered in a private placement to qualified institutional buyers in accordance with Rule 144A under the Securities Act of 1933, as amended, and outside the United States to non-U.S. persons in accordance with Regulation S under the Securities Act. The Notes are fully and unconditionally guaranteed jointly and severally by GeoPark Chile SpA and GeoPark Colombia S.L.U.
Resulting from these transactions, the Company reduced its total indebtedness and interest costs and improved its financial profile by extending its debt maturities.
21
SIGNATURE
Pursuant to the requirements of the Securities Exchange Act of 1934, the registrant has duly caused this report to be signed on its behalf by the undersigned, thereunto duly authorized.
| | |
| GeoPark Limited | |
| | |
| | |
| By: | /s/ Andrés Ocampo |
| | Name: Andrés Ocampo |
| | Title: Chief Financial Officer |
Date: May 5, 2021
22