UNITED STATES
SECURITIES AND EXCHANGE COMMISSION
Washington, D.C. 20549
FORM 6-K
REPORT OF FOREIGN PRIVATE ISSUER PURSUANT TO RULE 13a-16 OR 15d-16 UNDER THE SECURITIES EXCHANGE ACT OF 1934
For the month of November 2022
Commission File Number: 001-36298
GeoPark Limited
(Exact name of registrant as specified in its charter)
Calle 94 N° 11-30 8° piso
Bogota, Colombia
(Address of principal executive office)
Indicate by check mark whether the registrant files or will file annual reports under cover of Form 20-F or Form 40-F:
Form 20-F | X |
| Form 40-F |
Indicate by check mark if the registrant is submitting the Form 6-K in paper as permitted by Regulation S-T Rule 101(b)(1):
Yes |
| No | X |
Indicate by check mark if the registrant is submitting the Form 6-K in paper as permitted by Regulation S-T Rule 101(b)(7):
Yes |
| No | X |
GEOPARK LIMITED
TABLE OF CONTENTS
ITEM
| |
1. | Interim Condensed Consolidated Financial Statements and Explanatory Notes for the three-months and nine-months periods ended September 30, 2021 and 2022. |
Item 1
GEOPARK LIMITED
INTERIM CONDENSED CONSOLIDATED
FINANCIAL STATEMENTS
AND EXPLANATORY NOTES
For the three-months and nine-months periods ended September 30, 2021 and 2022
2
CONDENSED CONSOLIDATED STATEMENT OF INCOME
| | | | | | | | | | |
| | | | Three-months | | Three-months | | Nine-months | | Nine-months |
| | | | period ended | | period ended | | period ended | | period ended |
| | | | September 30, | | September 30, | | September 30, | | September 30, |
| | | | 2022 | | 2021 | | 2022 | | 2021 |
Amounts in US$ ´000 | | Note | | (Unaudited) | | (Unaudited) | | (Unaudited) | | (Unaudited) |
REVENUE | | 3 | | 258,249 | | 173,972 | | 818,629 | | 486,165 |
Commodity risk management contracts | | 4 | | 22,993 | | (11,733) | | (70,683) | | (106,693) |
Production and operating costs | | 5 | | (87,134) | | (49,232) | | (282,800) | | (145,204) |
Geological and geophysical expenses | | 6 | | (2,322) | | (2,065) | | (8,019) | | (7,268) |
Administrative expenses | | 7 | | (14,348) | | (11,782) | | (35,128) | | (35,809) |
Selling expenses | | 8 | | (2,049) | | (1,792) | | (5,217) | | (5,344) |
Depreciation | |
| | (21,416) | | (23,641) | | (66,200) | | (66,802) |
Write-off of unsuccessful exploration efforts | | 10 | | (5,935) | | (4,201) | | (5,935) | | (12,262) |
Impairment loss reversed for non-financial assets | | 10 | | — | | 13,307 | | — | | 13,307 |
Other (expenses) income | |
| | (2,657) | | (1,555) | | 2,737 | | (3,703) |
OPERATING PROFIT | |
| | 145,381 | | 81,278 | | 347,384 | | 116,387 |
Financial expenses | | 9 | | (14,126) | | (13,994) | | (46,192) | | (50,703) |
Financial income | | 9 | | 783 | | 699 | | 2,223 | | 1,297 |
Foreign exchange gain | | 9 | | 11,516 | | 936 | | 11,970 | | 5,440 |
PROFIT BEFORE INCOME TAX | |
| | 143,554 | | 68,919 | | 315,385 | | 72,421 |
Income tax expense | |
| | (70,172) | | (31,907) | | (143,138) | | (48,214) |
PROFIT FOR THE PERIOD | |
| | 73,382 | | 37,012 | | 172,247 | | 24,207 |
Earnings per share (in US$). Basic | |
| | 1.24 | | 0.61 | | 2.89 | | 0.40 |
Earnings per share (in US$). Diluted | |
| | 1.23 | | 0.60 | | 2.85 | | 0.39 |
The above condensed consolidated statement of income should be read in conjunction with the accompanying notes.
3
CONDENSED CONSOLIDATED STATEMENT OF COMPREHENSIVE INCOME
| | | | | | | | |
| | Three-months | | Three-months | | Nine-months | | Nine-months |
| | period ended | | period ended | | period ended | | period ended |
| | September 30, | | September 30, | | September 30, | | September 30, |
| | 2022 | | 2021 | | 2022 | | 2021 |
Amounts in US$ ´000 | | (Unaudited) | | (Unaudited) | | (Unaudited) | | (Unaudited) |
Profit for the period | | 73,382 | | 37,012 | | 172,247 | | 24,207 |
Other comprehensive income | |
| |
| |
| |
|
Items that may be subsequently reclassified to profit or loss: | |
| |
| |
| |
|
Currency translation differences | | 243 | | (2,226) | | 1,442 | | (414) |
Gain on cash flow hedges | | 9,304 | | — | | 5,057 | | — |
Income tax expense relating to cash flow hedges | | (3,256) | | — | | (1,770) | | — |
Other comprehensive profit (loss) for the period | | 6,291 | | (2,226) | | 4,729 | | (414) |
Total comprehensive profit for the period | | 79,673 | | 34,786 | | 176,976 | | 23,793 |
The above condensed consolidated statement of comprehensive income should be read in conjunction with the accompanying notes.
4
CONDENSED CONSOLIDATED STATEMENT OF FINANCIAL POSITION
| | | | | | |
| | Note | | At September 30, 2022 | | Year ended |
Amounts in US$ ´000 | | | | (Unaudited) | | December 31, 2021 |
ASSETS | |
| |
| |
|
NON CURRENT ASSETS | |
| |
| |
|
Property, plant and equipment | | 10 | | 658,608 | | 614,047 |
Right-of-use assets | |
| | 36,088 | | 21,014 |
Prepayments and other receivables | |
| | 129 | | 148 |
Other financial assets | |
| | 12,180 | | 13,883 |
Deferred income tax asset | |
| | 7,183 | | 14,072 |
TOTAL NON CURRENT ASSETS | |
| | 714,188 | | 663,164 |
CURRENT ASSETS | |
| |
| |
|
Inventories | |
| | 12,486 | | 10,915 |
Trade receivables | |
| | 59,016 | | 70,531 |
Prepayments and other receivables | |
| | 18,902 | | 22,650 |
Derivative financial instrument assets | | 15 | | 5,057 | | 126 |
Other financial assets | |
| | — | | 864 |
Cash and cash equivalents | |
| | 93,036 | | 100,604 |
Assets held for sale | | | | — | | 26,887 |
TOTAL CURRENT ASSETS | |
| | 188,497 | | 232,577 |
TOTAL ASSETS | |
| | 902,685 | | 895,741 |
EQUITY | |
| |
| |
|
Share capital | | 11 | | 59 | | 60 |
Share premium | |
| | 147,723 | | 169,220 |
Reserves | |
| | 71,282 | | 83,554 |
Accumulated losses | |
| | (136,522) | | (314,779) |
TOTAL EQUITY | |
| | 82,542 | | (61,945) |
LIABILITIES | |
| |
| |
|
NON CURRENT LIABILITIES | |
| |
| |
|
Borrowings | | 12 | | 484,296 | | 656,176 |
Lease liabilities | |
| | 21,317 | | 12,513 |
Provisions and other long-term liabilities | | 13 | | 55,768 | | 62,848 |
Deferred income tax liability | |
| | 54,001 | | 20,947 |
Trade and other payables | | 14 | | — | | 1,540 |
TOTAL NON CURRENT LIABILITIES | |
| | 615,382 | | 754,024 |
CURRENT LIABILITIES | |
| |
| |
|
Borrowings | | 12 | | 6,849 | | 17,916 |
Lease liabilities | |
| | 10,516 | | 8,231 |
Derivative financial instrument liabilities | | 15 | | 4,655 | | 20,757 |
Current income tax liability | |
| | 55,169 | | 8,801 |
Trade and other payables | | 14 | | 127,572 | | 127,513 |
Liabilities associated with assets held for sale | | | | — | | 20,444 |
TOTAL CURRENT LIABILITIES | |
| | 204,761 | | 203,662 |
TOTAL LIABILITIES | |
| | 820,143 | | 957,686 |
TOTAL EQUITY AND LIABILITIES | |
| | 902,685 | | 895,741 |
The above condensed consolidated statement of financial position should be read in conjunction with the accompanying notes.
5
CONDENSED CONSOLIDATED STATEMENT OF CHANGES IN EQUITY
| | | | | | | | | | | | |
| | Share | | Share | | Other | | Translation | | Accumulated | | |
Amount in US$ '000 | | Capital | | Premium | | Reserve | | Reserve | | losses | | Total |
Equity at January 1, 2021 | | 61 | | 179,399 | | 104,485 | | (12,269) | | (380,866) | | (109,190) |
Comprehensive income: | |
| |
| |
| |
| |
| |
|
Profit for the nine-months period | | — | | — | | — | | — | | 24,207 | | 24,207 |
Other comprehensive loss for the period | | — | | — | | — | | (414) | | — | | (414) |
Total comprehensive loss for the period ended September 30, 2021 | | — | | — | | — | | (414) | | 24,207 | | 23,793 |
Transactions with owners: | |
| |
| |
| |
| |
| |
|
Share-based payment | | 1 | | 1,535 | | — | | — | | 4,145 | | 5,681 |
Repurchase of shares | | (1) | | (5,409) | | — | | — | | — | | (5,410) |
Cash distribution | | — | | — | | (4,795) | | — | | — | | (4,795) |
Total transactions with owners for the period ended September 30, 2021 | | — | | (3,874) | | (4,795) | | — | | 4,145 | | (4,524) |
Balance at September 30, 2021 (Unaudited) | | 61 | | 175,525 | | 99,690 | | (12,683) | | (352,514) | | (89,921) |
| | | | | | | | | | | | |
Balance at January 1, 2022 | | 60 | | 169,220 | | 97,261 | | (13,707) | | (314,779) | | (61,945) |
Comprehensive income: | |
| |
| |
| |
| |
| |
|
Profit for the nine-months period | | — | | — | | — | | — | | 172,247 | | 172,247 |
Other comprehensive profit for the period | | — | | — | | 3,287 | | 1,442 | | — | | 4,729 |
Total comprehensive profit for the period ended September 30, 2022 | | — | | — | | 3,287 | | 1,442 | | 172,247 | | 176,976 |
Transactions with owners: | |
| |
| |
| |
| |
| |
|
Share-based payment | | 1 | | 1,565 | | — | | — | | 6,010 | | 7,576 |
Repurchase of shares | | (2) | | (23,062) | | — | | — | | — | | (23,064) |
Cash distribution | | — | | — | | (17,001) | | — | | — | | (17,001) |
Total transactions with owners for the period ended September 30, 2022 | | (1) | | (21,497) | | (17,001) | | — | | 6,010 | | (32,489) |
Balance at September 30, 2022 (Unaudited) | | 59 | | 147,723 | | 83,547 | | (12,265) | | (136,522) | | 82,542 |
The above condensed consolidated statement of changes in equity should be read in conjunction with the accompanying notes.
6
CONDENSED CONSOLIDATED STATEMENT OF CASH FLOW
| | | | |
| | Nine-months | | Nine-months |
| | period ended | | period ended |
| | September 30, | | September 30, |
| | 2022 | | 2021 |
Amounts in US$ ’000 | | (Unaudited) | | (Unaudited) |
Cash flows from operating activities | |
| |
|
Profit for the period | | 172,247 | | 24,207 |
Adjustments for: | |
| |
|
Income tax expense | | 143,138 | | 48,214 |
Depreciation | | 66,200 | | 66,802 |
Loss on disposal of property, plant and equipment | | 18 | | 307 |
Write-off of unsuccessful exploration efforts | | 5,935 | | 12,262 |
Impairment loss reversed for non-financial assets | | — | | (13,307) |
Amortization of other long-term liabilities | | (124) | | (171) |
Accrual of borrowing interests | | 28,650 | | 34,043 |
Borrowings cancellation costs | | 5,141 | | 6,308 |
Unwinding of long-term liabilities | | 4,697 | | 3,528 |
Accrual of share-based payment | | 7,576 | | 5,681 |
Foreign exchange gain | | (11,970) | | (5,440) |
Unrealized (gain) loss on commodity risk management contracts | | (10,302) | | 27,993 |
Income tax paid | | (28,205) | | (65,091) |
Change in working capital | | (28,920) | | (16,546) |
Cash flows from operating activities – net | | 354,081 | | 128,790 |
Cash flows from investing activities | |
| |
|
Purchase of property, plant and equipment | | (115,202) | | (85,365) |
Proceeds from disposal of long-term assets (Note 17) | | 15,135 | | 1,100 |
Cash flows used in investing activities – net | | (100,067) | | (84,265) |
Cash flows from financing activities | |
| |
|
Proceeds from borrowings | | — | | 172,174 |
Debt issuance costs paid | | — | | (2,019) |
Principal paid | | (171,291) | | (264,388) |
Interest paid | | (36,498) | | (42,477) |
Borrowings cancellation and other costs paid | | (9,118) | | (12,908) |
Lease payments | | (5,398) | | (5,551) |
Repurchase of shares | | (23,064) | | (5,410) |
Cash distribution | | (17,001) | | (4,795) |
Payments for transactions with former non-controlling interest | | — | | (3,580) |
Cash flows used in financing activities - net | | (262,370) | | (168,954) |
Net decrease in cash and cash equivalents | | (8,356) | | (124,429) |
Cash and cash equivalents at January 1 | | 100,604 | | 201,907 |
Currency translation differences | | 788 | | (633) |
Cash and cash equivalents at the end of the period | | 93,036 | | 76,845 |
Ending Cash and cash equivalents are specified as follows: | |
| |
|
Cash at bank and bank deposits | | 93,026 | | 76,828 |
Cash in hand | | 10 | | 17 |
Cash and cash equivalents | | 93,036 | | 76,845 |
The above condensed consolidated statement of cash flow should be read in conjunction with the accompanying notes.
7
EXPLANATORY NOTES TO THE INTERIM CONDENSED CONSOLIDATED FINANCIAL STATEMENTS
Note 1
General information
GeoPark Limited (the “Company”) is a company incorporated under the laws of Bermuda. The Registered Office address is Clarendon House, 2 Church Street, Hamilton HM11, Bermuda.
The principal activity of the Company and its subsidiaries (the “Group” or “GeoPark”) is the exploration, development and production for oil and gas reserves in Colombia, Chile, Brazil, Argentina and Ecuador.
These condensed consolidated interim financial statements were authorized for issue by the Board of Directors on November 8, 2022.
Basis of Preparation
The interim condensed consolidated financial statements of GeoPark Limited are presented in accordance with IAS 34 “Interim Financial Reporting”. They do not include all of the information required for full annual financial statements, and should be read in conjunction with the annual consolidated financial statements as of and for the year ended December 31, 2021, which have been prepared in accordance with IFRS.
The interim condensed consolidated financial statements have been prepared in accordance with the accounting policies applied in the most recent annual consolidated financial statements. The Group has not early adopted any standard, interpretation or amendment that has been issued but is not yet effective. Several amendments and interpretations apply for the first time in 2022, but do not have an impact on the condensed consolidated interim financial statements of the Group.
Whenever necessary, certain comparative amounts have been reclassified to conform to changes in presentation in the current period.
Taxes on income in the interim periods are accrued using the tax rate that would be applicable to expected total annual profit or loss.
The activities of the Group are not subject to significant seasonal changes.
Estimates
The preparation of interim financial information requires the use of certain critical accounting estimates. It also requires management to exercise its judgement in the process of applying the Group’s accounting policies. Actual results may differ from these estimates.
In preparing these condensed consolidated interim financial statements, the significant judgements made by management in applying the Group’s accounting policies and the key sources of estimation uncertainty were the same as those that applied to the annual consolidated financial statements as of and for the year ended December 31, 2021.
Financial risk management
The Group’s activities expose it to a variety of financial risks: currency risk, price risk, credit risk concentration, funding and liquidity risk, interest risk and capital risk. The condensed consolidated interim financial statements do not include all the financial risk management information and disclosures required in the annual consolidated financial statements, and should be read in conjunction with the Group’s annual consolidated financial statements as of and for the year ended December 31, 2021.
8
Note 1 (Continued)
Financial risk management (Continued)
The ongoing conflict involving Russia and Ukraine has disrupted markets and resulted in volatility in commodities prices. The impact of this situation is uncertain.
The Group is continually reviewing its exposure to the current market conditions and adjusting the capital expenditures program which remains flexible, quickly adaptable and expandable as oil and gas prices increase. The Group also continues to add new oil hedges, increasing its price risk protection within the upcoming four quarters. GeoPark maintained a cash position of US$ 93,036,000 and has available US$ 127,700,000 in uncommitted credit lines as of September 30, 2022.
Subsidiary undertakings
The following chart illustrates the main companies of the Group structure as of September 30, 2022:
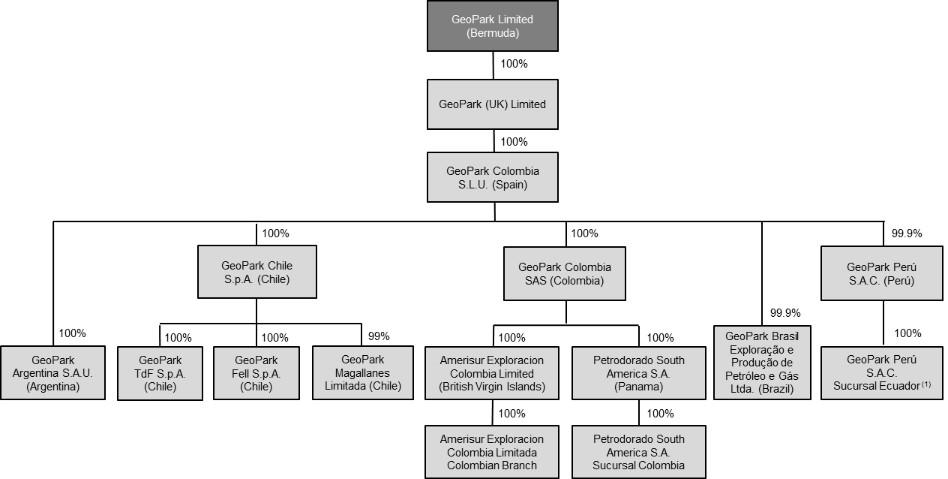
| (1) | GeoPark Peru S.A.C. Sucursal Ecuador holds 50% working interest in the consortiums that operate the Espejo and Perico Blocks. |
Details of the subsidiaries and joint operations of the Group are set out in Note 21 to the annual consolidated financial statements as of and for the year ended December 31, 2021.
During the nine-months period ended September 30, 2022, the following changes have taken place:
| ● | GeoPark Colombia S.A.S. acquired the shares of GeoPark Colombia E&P previously owned by GeoPark Latin America S.L.U. |
| ● | GeoPark Colombia S.A.S was assigned a 50% non-operated working interest in the CPO-4-1 Block. |
| ● | The Spanish subsidiaries finalized a merger process by which GeoPark Latin America S.L.U. merged with and into GeoPark Colombia S.L.U., with the latter being the surviving company. |
9
Note 2
Segment Information
Operating segments are reported in a manner consistent with the internal reporting provided to the chief operating decision-maker. The chief operating decision-maker, who is responsible for allocating resources and assessing performance of the operating segments, has been identified as the Executive Committee. This committee is integrated by the CEO, COO, CFO and managers in charge of the Geoscience, Operations, Legal and Corporate Governance, People and Sustainability departments. This committee reviews the Group’s internal reporting in order to assess performance and allocate resources. Management has determined the operating segments based on these reports. The committee considers the business from a geographic perspective.
The Executive Committee assesses the performance of the operating segments based on a measure of Adjusted EBITDA. Adjusted EBITDA is defined as profit (loss) for the period (determined as if IFRS 16 Leases had not been adopted), before net finance cost, income tax, depreciation, amortization, certain non-cash items such as impairments and write-offs of unsuccessful exploration efforts, accrual of share-based payment, unrealized result on commodity risk management contracts, geological and geophysical expenses allocated to capitalized projects and other items. Other information provided to the Executive Committee is measured in a manner consistent with that in the financial statements.
Nine-months period ended September 30, 2022:
| | | | | | | | | | | | | | |
Amounts in US$ '000 | | Total | | Colombia | | Chile | | Brazil | | Argentina | | Ecuador | | Corporate |
Revenue | | 818,629 | | 766,642 | | 22,472 | | 16,201 | | 1,962 | | 5,024 | | 6,328 |
Sale of crude oil | | 784,093 | | 765,482 | | 11,260 | | 663 | | 1,664 | | 5,024 | | — |
Sale of purchased crude oil | | 6,328 | | — | | — | | — | | — | | — | | 6,328 |
Sale of gas | | 28,208 | | 1,160 | | 11,212 | | 15,538 | | 298 | | — | | — |
Production and operating costs | | (282,800) | | (258,621) | | (11,677) | | (4,054) | | (1,579) | | (1,567) | | (5,302) |
Royalties | | (49,098) | | (46,660) | | (899) | | (1,266) | | (273) | | — | | — |
Economic rights | | (154,285) | | (154,285) | | — | | — | | — | | — | | — |
Share-based payment | | (785) | | (699) | | (87) | | — | | 1 | | — | | — |
Operating costs | | (78,632) | | (56,977) | | (10,691) | | (2,788) | | (1,307) | | (1,567) | | (5,302) |
Depreciation | | (66,200) | | (52,870) | | (10,871) | | (2,185) | | (237) | | (35) | | (2) |
Adjusted EBITDA | | 408,657 | | 401,089 | | 9,065 | | 9,967 | | (5,428) | | 1,559 | | (7,595) |
Nine-months period ended September 30, 2021:
| | | | | | | | | | | | | | |
Amounts in US$ '000 | | Total | | Colombia | | Chile | | Brazil | | Argentina | | Ecuador | | Corporate |
Revenue | | 486,165 | | 433,671 | | 15,757 | | 15,402 | | 21,335 | | — | | — |
Sale of crude oil | | 454,639 | | 432,059 | | 4,039 | | 477 | | 18,064 | | — | | — |
Sale of gas | | 31,526 | | 1,612 | | 11,718 | | 14,925 | | 3,271 | | — | | — |
Production and operating costs | | (145,204) | | (120,765) | | (8,036) | | (3,479) | | (12,924) | | — | | — |
Royalties | | (28,511) | | (23,473) | | (553) | | (1,232) | | (3,253) | | — | | — |
Economic rights | | (46,789) | | (46,712) | | — | | (77) | | — | | — | | — |
Share-based payment | | (278) | | (238) | | (37) | | — | | (3) | | — | | — |
Operating costs | | (69,626) | | (50,342) | | (7,446) | | (2,170) | | (9,668) | | — | | — |
Depreciation | | (66,802) | | (44,063) | | (10,706) | | (3,060) | | (8,803) | | (167) | | (3) |
Adjusted EBITDA | | 213,684 | | 204,701 | | 5,812 | | 9,700 | | 4,891 | | (1,415) | | (10,005) |
| | | | | | | | | | | | | | |
Total Assets | | Total | | Colombia | | Chile | | Brazil | | Argentina | | Ecuador | | Corporate |
September 30, 2022 | | 902,685 | | 757,837 | | 69,776 | | 34,624 | | 1,700 | | 29,820 | | 8,928 |
December 31, 2021 | | 895,741 | | 689,401 | | 71,515 | | 38,846 | | 38,111 | | 7,782 | | 50,086 |
10
Note 2 (Continued)
Segment Information (Continued)
A reconciliation of total Adjusted EBITDA to total Profit before income tax is provided as follows:
| | | | | | | | |
| | Three-months | | Three-months | | Nine-months | | Nine-months |
| | period ended | | period ended | | period ended | | period ended |
| | September 30, | | September 30, | | September 30, | | September 30, |
| | 2022 | | 2021 | | 2022 | | 2021 |
Adjusted EBITDA | | 141,299 | | 86,764 | | 408,657 | | 213,684 |
Unrealized gain (loss) on commodity risk management contracts | | 36,831 | | 10,626 | | 10,302 | | (27,993) |
Depreciation (a) | | (21,416) | | (23,641) | | (66,200) | | (66,802) |
Write-off of unsuccessful exploration efforts | | (5,935) | | (4,201) | | (5,935) | | (12,262) |
Impairment loss reversed for non-financial assets | | — | | 13,307 | | — | | 13,307 |
Share-based payment | | (4,183) | | (1,911) | | (7,576) | | (5,681) |
Lease accounting - IFRS 16 | | 1,442 | | 1,603 | | 5,398 | | 5,551 |
Others (b) | | (2,657) | | (1,269) | | 2,738 | | (3,417) |
Operating profit | | 145,381 | | 81,278 | | 347,384 | | 116,387 |
Financial expenses | | (14,126) | | (13,994) | | (46,192) | | (50,703) |
Financial income | | 783 | | 699 | | 2,223 | | 1,297 |
Foreign exchange gain | | 11,516 | | 936 | | 11,970 | | 5,440 |
Profit before tax | | 143,554 | | 68,919 | | 315,385 | | 72,421 |
| (a) | Net of capitalized costs for oil stock included in Inventories. Depreciation for the nine-months period ended September 30, 2022 includes US$ 1,494,000 (US$ 2,081,000 in 2021) generated by assets not related to production activities. For the three-months period ended September 30, 2022, the amount included in depreciation is US$ 471,000 (US$ 657,000 in 2021). |
| (b) | Includes allocation to capitalized projects. |
Note 3
Revenue
| | | | | | | | |
| | Three-months | | Three-months | | Nine-months | | Nine-months |
| | period ended | | period ended | | period ended | | period ended |
| | September 30, | | September 30, | | September 30, | | September 30, |
Amounts in US$ '000 | | 2022 | | 2021 | | 2022 | | 2021 |
Sale of crude oil | | 248,677 | | 163,472 | | 784,093 | | 454,639 |
Sale of purchased crude oil | | 965 | | — | | 6,328 | | — |
Sale of gas | | 8,607 | | 10,500 | | 28,208 | | 31,526 |
| | 258,249 | | 173,972 | | 818,629 | | 486,165 |
11
Note 4
Commodity risk management contracts
The Group has entered into derivative financial instruments to manage its exposure to oil price risk. These derivatives are zero-premium collars and were placed with major financial institutions and commodity traders. The Group entered into the derivatives under ISDA Master Agreements and Credit Support Annexes, which provide credit lines for collateral posting thus alleviating possible liquidity needs under the instruments and protect the Group from potential non-performance risk by its counterparties.
The Group’s derivatives that hedge cash flows from the sales of crude oil for periods through December 31, 2022 are accounted for as non-hedge derivatives and therefore all changes in the fair values of these derivative contracts are recognized immediately as gains or losses in the results of the periods in which they occur.
The Group’s derivatives that hedge cash flows from the sales of crude oil for periods from January 1, 2023 onwards are designated and qualify as cash flow hedges. The effective portion of changes in the fair values of these derivative contracts are recognized in Other Reserve within Equity. The gain or loss relating to the ineffective portion, if any, is recognized immediately as gains or losses in the results of the periods in which they occur. The amount accumulated in Other Reserves is reclassified to profit or loss as a reclassification adjustment in the same period or periods during which the hedged cash flows affect profit or loss.
The following table summarizes the Group’s production hedged during the nine-months period ended September 30, 2022 and for the following periods as a consequence of the derivative contracts in force as of September 30, 2022:
| | | | | | | | |
| | | | | | Volume | | Average |
Period | | Reference | | Type | | bbl/d | | price US$/bbl |
January 1, 2022 - March 31, 2022 | | ICE BRENT | | Zero Premium Collars | | 14,500 | | 49.10 Put 74.81 Call |
April 1, 2022 - June 30, 2022 | | ICE BRENT | | Zero Premium Collars | | 12,500 | | 53.35 Put 79.38 Call |
July 1, 2022 - September 30, 2022 | | ICE BRENT | | Zero Premium Collars | | 13,000 | | 58.63 Put 86.50 Call |
October 1, 2022 - December 31, 2022 | | ICE BRENT | | Zero Premium Collars | | 12,000 | | 60.63 Put 92.55 Call |
January 1, 2023 - March 31, 2023 | | ICE BRENT | | Zero Premium Collars | | 9,500 | | 66.05 Put 112.59 Call |
April 1, 2023 - June 30, 2023 | | ICE BRENT | | Zero Premium Collars | | 6,500 | | 68.85 Put 115.87 Call |
July 1, 2023 - September 30, 2023 | | ICE BRENT | | Zero Premium Collars | | 1,000 | | 70.00 Put 100.00 Call |
The table below summarizes the loss on the commodity risk management contracts:
| | | | | | | | |
| | Three-months | | Three-months | | Nine-months | | Nine-months |
| | period ended | | period ended | | period ended | | period ended |
| | September 30, | | September 30, | | September 30, | | September 30, |
| | 2022 | | 2021 | | 2022 | | 2021 |
Realized loss on commodity risk management contracts | | (13,838) | | (22,359) | | (80,985) | | (78,700) |
Unrealized gain (loss) on commodity risk management contracts | | 36,831 | | 10,626 | | 10,302 | | (27,993) |
Total | | 22,993 | | (11,733) | | (70,683) | | (106,693) |
12
Note 5
Production and operating costs
| | | | | | | | |
| | Three-months | | Three-months | | Nine-months | | Nine-months |
| | period ended | | period ended | | period ended | | period ended |
| | September 30, | | September 30, | | September 30, | | September 30, |
Amounts in US$ '000 | | 2022 | | 2021 | | 2022 | | 2021 |
Staff costs | | 3,158 | | 3,970 | | 10,108 | | 11,995 |
Share-based payment | | 256 | | 145 | | 785 | | 278 |
Royalties | | 15,543 | | 10,905 | | 49,098 | | 28,511 |
Economic rights | | 47,030 | | 19,966 | | 154,285 | | 46,789 |
Well and facilities maintenance | | 5,605 | | 3,721 | | 15,558 | | 13,265 |
Operation and maintenance | | 1,489 | | 2,127 | | 4,921 | | 5,692 |
Consumables | | 5,501 | | 5,078 | | 15,582 | | 13,873 |
Equipment rental | | 2,271 | | 2,379 | | 6,539 | | 5,956 |
Transportation costs | | 1,117 | | 581 | | 3,092 | | 2,131 |
Gas plant costs | | 310 | | 619 | | 1,408 | | 1,885 |
Personnel transportation | | 635 | | 559 | | 1,866 | | 1,616 |
Consultant fees | | 337 | | 307 | | 1,412 | | 1,252 |
Safety and insurance costs | | 748 | | 772 | | 2,848 | | 2,789 |
Field camp | | 1,014 | | 1,015 | | 2,913 | | 3,119 |
Non-operated blocks costs | | 3,777 | | 1,240 | | 8,482 | | 3,617 |
Crude oil stock variation | | (3,114) | | (5,117) | | (4,403) | | (394) |
Purchased crude oil | | 685 | | — | | 5,302 | | — |
Other costs | | 772 | | 965 | | 3,004 | | 2,830 |
| | 87,134 | | 49,232 | | 282,800 | | 145,204 |
Note 6
Geological and geophysical expenses
| | | | | | | | |
| | Three-months | | Three-months | | Nine-months | | Nine-months |
| | period ended | | period ended | | period ended | | period ended |
| | September 30, | | September 30, | | September 30, | | September 30, |
Amounts in US$ '000 | | 2022 | | 2021 | | 2022 | | 2021 |
Staff costs | | 1,799 | | 1,960 | | 5,658 | | 5,705 |
Share-based payment | | (142) | | 41 | | 264 | | 141 |
Other services | | 665 | | 350 | | 2,098 | | 1,708 |
Allocation to capitalized project | | — | | (286) | | (1) | | (286) |
| | 2,322 | | 2,065 | | 8,019 | | 7,268 |
13
Note 7
Administrative expenses
| | | | | | | | |
| | Three-months | | Three-months | | Nine-months | | Nine-months |
| | period ended | | period ended | | period ended | | period ended |
| | September 30, | | September 30, | | September 30, | | September 30, |
Amounts in US$ '000 | | 2022 | | 2021 | | 2022 | | 2021 |
Staff costs | | 5,127 | | 5,514 | | 16,944 | | 18,151 |
Share-based payment | | 4,069 | | 1,725 | | 6,527 | | 5,262 |
Consultant fees | | 2,374 | | 2,882 | | 6,365 | | 7,456 |
Safety and insurance costs | | 973 | | 889 | | 2,949 | | 2,163 |
Travel expenses | | 734 | | 79 | | 1,305 | | 193 |
Director fees and allowance | | 145 | | 508 | | 982 | | 2,074 |
Communication and IT costs | | 1,070 | | 869 | | 2,120 | | 2,798 |
Allocation to joint operations | | (2,410) | | (1,962) | | (6,803) | | (5,887) |
Other administrative expenses | | 2,266 | | 1,278 | | 4,739 | | 3,599 |
| | 14,348 | | 11,782 | | 35,128 | | 35,809 |
Note 8
Selling expenses
| | | | | | | | |
| | Three-months | | Three-months | | Nine-months | | Nine-months |
| | period ended | | period ended | | period ended | | period ended |
| | September 30, | | September 30, | | September 30, | | September 30, |
Amounts in US$ '000 | | 2022 | | 2021 | | 2022 | | 2021 |
Transportation | | 848 | | 1,359 | | 3,086 | | 3,125 |
Selling taxes and other | | 1,201 | | 433 | | 2,131 | | 2,219 |
| | 2,049 | | 1,792 | | 5,217 | | 5,344 |
Note 9
Financial results
| | | | | | | | |
| | Three-months | | Three-months | | Nine-months | | Nine-months |
| | period ended | | period ended | | period ended | | period ended |
| | September 30, | | September 30, | | September 30, | | September 30, |
Amounts in US$ '000 | | 2022 | | 2021 | | 2022 | | 2021 |
Financial expenses | |
| |
| |
| |
|
Bank charges and other financial costs | | (1,722) | | (2,274) | | (7,674) | | (6,584) |
Interest and amortization of debt issue costs | | (8,849) | | (10,643) | | (28,680) | | (34,283) |
Borrowings cancellation costs | | (2,104) | | — | | (5,141) | | (6,308) |
Unwinding of long-term liabilities | | (1,451) | | (1,077) | | (4,697) | | (3,528) |
| | (14,126) | | (13,994) | | (46,192) | | (50,703) |
Financial income | |
| |
| |
| |
|
Interest received | | 783 | | 699 | | 2,223 | | 1,297 |
| | 783 | | 699 | | 2,223 | | 1,297 |
Foreign exchange gains and losses | |
| |
| |
| |
|
Foreign exchange gain | | 11,516 | | 936 | | 11,970 | | 5,440 |
| | 11,516 | | 936 | | 11,970 | | 5,440 |
Total financial results | | (1,827) | | (12,359) | | (31,999) | | (43,966) |
14
Note 10
Property, plant and equipment
| | | | | | | | | | | | | | |
| | | | Furniture, | | | | | | | | Exploration | | |
| | | | equipment | | Production | | Buildings | | | | and | | |
| | Oil & gas | | and | | facilities and | | and | | Construction | | evaluation | | |
Amounts in US$ '000 | | properties | | vehicles | | machinery | | improvements | | in progress | | assets | | Total |
Cost at January 1, 2021 | | 968,617 | | 20,707 | | 197,829 | | 12,442 | | 18,848 | | 78,614 | | 1,297,057 |
Additions | | (1,688) | (a) | 826 | | 9 | | — | | 50,707 | | 33,823 | | 83,677 |
Disposals | | — | | (825) | | (900) | | (543) | | (3,371) | (b) | — | | (5,639) |
Write-off / Impairment | | 13,307 | (c) | — | | — | | — | | — | | (12,262) | (d) | 1,045 |
Transfers | | 41,758 | | — | | 13,202 | | 387 | | (45,728) | | (9,619) | | — |
Currency translation differences | | (2,276) | | (31) | | (159) | | (10) | | (11) | | (89) | | (2,576) |
Assets held for sale | | (73,047) | | (1,178) | | (6,052) | | (177) | | (27) | | — | | (80,481) |
Cost at September 30, 2021 | | 946,671 | | 19,499 | | 203,929 | | 12,099 | | 20,418 | | 90,467 | | 1,293,083 |
| | | | | | | | | | | | | | |
Cost at January 1, 2022 | | 957,932 | | 18,421 | | 201,177 | | 11,662 | | 27,204 | | 100,470 | | 1,316,866 |
Additions | | (6,161) | (a) | 879 | | — | | (10) | | 84,262 | | 33,319 | | 112,289 |
Disposals | | — | | (381) | | (26) | | — | | — | | — | | (407) |
Write-off | | — | | — | | — | | — | | — | | (5,935) | (e) | (5,935) |
Transfers | | 85,475 | | 13 | | 16,159 | | 43 | | (90,485) | | (11,205) | | — |
Currency translation differences | | 1,351 | | 18 | | 107 | | 3 | | 8 | | 9 | | 1,496 |
Cost at September 30, 2022 | | 1,038,597 | | 18,950 | | 217,417 | | 11,698 | | 20,989 | | 116,658 | | 1,424,309 |
| | | | | | | | | | | | | | |
Depreciation and write-down at January 1, 2021 | | (548,445) | | (16,985) | | (109,987) | | (6,975) | | — | | — | | (682,392) |
Depreciation | | (50,208) | | (1,556) | | (9,421) | | (525) | | — | | — | | (61,710) |
Disposals | | — | | 500 | | 900 | | 436 | | — | | — | | 1,836 |
Currency translation differences | | 1,548 | | 23 | | 158 | | 9 | | — | | — | | 1,738 |
Assets held for sale |
| 49,080 | | 915 | | 4,692 | | 153 | | — | | — | | 54,840 |
Depreciation and write-down at September 30, 2021 | | (548,025) | | (17,103) | | (113,658) | | (6,902) | | — | | — | | (685,688) |
| | | | | | | | | | | | | | |
Depreciation and write-down at January 1, 2022 | | (563,157) | | (16,377) | | (116,617) | | (6,668) | | — | | — | | (702,819) |
Depreciation | | (51,727) | | (997) | | (8,881) | | (497) | | — | | — | | (62,102) |
Disposals | | — | | 370 | | 19 | | — | | — | | — | | 389 |
Currency translation differences | | (1,044) | | (15) | | (107) | | (3) | | — | | — | | (1,169) |
Depreciation and write-down at September 30, 2022 | | (615,928) | | (17,019) | | (125,586) | | (7,168) | | — | | — | | (765,701) |
| | | | | | | | | | | | | | |
Carrying amount at September 30, 2021 | | 398,646 | | 2,396 | | 90,271 | | 5,197 | | 20,418 | | 90,467 | | 607,395 |
Carrying amount at September 30, 2022 | | 422,669 | | 1,931 | | 91,831 | | 4,530 | | 20,989 | | 116,658 | | 658,608 |
| (a) | Corresponds to the effect of the change in the estimate of assets retirement obligations. |
| (b) | Corresponds to assets related to the operationship of the non-producing Morona Block (Block 64) in Peru, that were transferred to Petroperu in May 2021. |
| (c) | Corresponds to an impairment loss reversed in the Aguada Baguales and El Porvenir Blocks (Argentina) in accordance with their fair value less cost to sale. |
| (d) | Corresponds to two unsuccessful exploratory wells drilled in the Llanos 32 Block (Colombia), other exploration costs incurred in the Fell Block (Chile), an exploratory well drilled in previous years in the CPO-5 Block (Colombia) and other exploration costs incurred in previous years in the PUT-30 Block (Colombia) for which no additional work would be performed. |
| (e) | Corresponds to exploration costs incurred in previous years in the Tacacho and Terecay Blocks (Colombia) for which no additional work would be performed and an exploratory well drilled in the CPO-5 Block (Colombia). |
15
Note 11
Equity
Share capital
| | | | |
| | At | | Year ended |
Issued share capital | | September 30, 2022 | | December 31, 2021 |
Common stock (US$ ´000) | | 59 | | 60 |
The share capital is distributed as follows: | |
| | |
Common shares, of nominal US$ 0.001 | | 58,542,850 | | 60,238,026 |
Total common shares in issue | | 58,542,850 | | 60,238,026 |
| | | | |
Authorized share capital | |
| |
|
US$ per share | | 0.001 | | 0.001 |
| | | | |
Number of common shares (US$ 0.001 each) | | 5,171,949,000 | | 5,171,949,000 |
Amount in US$ | | 5,171,949 | | 5,171,949 |
GeoPark’s share capital only consists of common shares. The authorized share capital consists of 5,171,949,000 common shares, par value US$ 0.001 per share. All of the Company issued and outstanding common shares are fully paid and nonassessable.
Cash distributions
On March 9, 2022, May 11, 2022, and August 10, 2022, the Company’s Board of Directors declared quarterly cash distributions of US$ 0.082, US$ 0.082 and US$ 0.127 per share that were paid on March 31, 2022, June 10, 2022, and September 8, 2022, respectively.
Buyback program
On November 4, 2020, the Company’s Board of Directors approved a program to repurchase up to 10% of its shares outstanding or approximately 6,062,000 shares. The repurchase program began on November 5, 2020, and was set to expire on November 15, 2021. On November 10, 2021, the Company’s Board of Directors approved the renewal of this repurchase program until November 10, 2022. During the nine-months period ended September 30, 2022, the Company purchased 1,801,735 common shares for a total amount of US$ 23,064,000. These transactions have no impact on the Group’s results.
Beginning in 2022, GeoPark applies hedge accounting for the derivative financial instruments entered to manage its exposure to oil price risk. Consequently, the Group’s derivatives that hedge cash flows from the sales of crude oil for periods from January 1, 2023 onwards are designated and qualify as cash flow hedges and therefore the effective portion of changes in the fair values of these derivative contracts and the income tax relating to those results are recognized in Other Reserve within Equity. The amount accumulated in Other Reserves is reclassified to profit or loss as a reclassification adjustment in the same period or periods during which the hedged cash flows affect profit or loss.
16
Note 12
Borrowings
The outstanding amounts are as follows:
| | | | |
| | At | | Year ended |
Amounts in US$ '000 | | September 30, 2022 | | December 31, 2021 |
2024 Notes | | — | | 171,880 |
2027 Notes | | 489,948 | | 499,893 |
Banco Santander | | 1,197 | | 2,319 |
| | 491,145 | | 674,092 |
Classified as follows:
| | | | |
Current | | 6,849 | | 17,916 |
Non-Current | | 484,296 | | 656,176 |
On September 21, 2017, the Company successfully placed US$ 425,000,000 aggregate principal amount of 6.500% Senior Secured Notes due 2024 (the “2024 Notes”), which were offered to qualified institutional buyers in accordance with Rule 144A under the United States Securities Act (the “Securities Act”), and outside the United States to non-U.S. persons in accordance with Regulation S under the Securities Act. The 2024 Notes carry a coupon of 6.50% per annum. The debt issuance cost for this transaction amounted to US$ 6,683,000 (debt issuance effective rate: 6.90%).
On January 17, 2020, the Company successfully placed US$ 350,000,000 aggregate principal amount of 5.500% Senior Secured Notes due 2027 (the “2027 Notes”), which were offered in a private placement to qualified institutional buyers in accordance with Rule 144A under the Securities Act, and outside the United States to non U.S. persons in accordance with Regulation S under the Securities Act. The 2027 Notes were priced at 99.285% and carry a coupon of 5.50% per annum (yield 5.625% per annum). The debt issuance cost for this transaction amounted to US$ 5,004,000 (debt issuance effective rate: 5.88%). Final maturity of the 2027 Notes will be January 17, 2027.
In April 2021, the Company executed a series of transactions that included a successful tender to purchase US$ 255,000,000 of the 2024 Notes that was funded with a combination of cash in hand and a US$ 150,000,000 aggregate principal amount new issuance from the reopening of the 2027 Notes. The new notes offering and the tender offer closed on April 23, 2021, and April 26, 2021, respectively.
The tender total consideration included the tender offer consideration of US$ 1,000 for each US$ 1,000 principal amount of the 2024 Notes plus the early tender payment of US$ 50 for each US$ 1,000 principal amount of the 2024 Notes. The tender also included a consent solicitation to align the covenants of the 2024 Notes to those of the 2027 Notes.
The reopening of the 2027 Notes was priced above par at 101.875%, representing a yield to maturity of 5.117%. The debt issuance cost for this transaction amounted to US$ 2,019,000. The 2027 Notes were offered in a private placement to qualified institutional buyers in accordance with Rule 144A under the Securities Act, and outside the United States to non-U.S. persons in accordance with Regulation S under the Securities Act. The 2027 Notes are fully and unconditionally guaranteed jointly and severally by two principal subsidiaries of the Company.
17
Note 12 (Continued)
Borrowings (Continued)
Between March and July 2022, the Company continued its deleveraging process, by repurchasing and cancelling, with the Trustee, a total nominal amount of US$ 102,876,000 of its 2024 Notes. Of this total amount, US$ 57,876,000 were repurchased in open market transactions at prices below the call option level and US$ 45,000,000 were redeemed at a redemption price stated in the indenture governing the 2024 Notes. On September 21, 2022, GeoPark fully redeemed its 2024 Notes by redeeming the remaining aggregate principal amount of US$ 67,124,000. Pursuant to the terms of the Indenture, the Notes were redeemed at a redemption price equal to 101.625% of the principal amount of the Notes redeemed, plus accrued and unpaid interests. The difference between the carrying amount of debt that was repurchased or redeemed and the consideration paid was recognized within financial expenses in the condensed consolidated statement of income.
The indenture governing the 2027 Notes includes incurrence test covenants that provide, among other things, that the Net Debt to Adjusted EBITDA ratio should not exceed 3.25 times and the Adjusted EBITDA to Interest ratio should exceed 2.5 times. Failure to comply with the incurrence test covenants does not trigger an event of default. However, this situation may limit the Company’s capacity to incur additional indebtedness, as specified in the indentures governing the Notes. Incurrence covenants, as opposed to maintenance covenants, must be tested by the Company before incurring additional debt or performing certain corporate actions including but not limited to dividend payments, restricted payments and others. As of the date of these interim condensed consolidated financial statements, the Company is in compliance of all the indentures’ provisions and covenants.
On June 17, 2022, the Company received requisite consents from holders of the 2027 Notes for certain amendments to the indenture governing the 2027 Notes. The amendments intended to (i) address the impact of adverse market conditions and related drop in the price of crude oil during 2020 on the Company’s results, which in turn negatively impacted the restricted payments builder basket, and (ii) increase and reset the general restricted payments basket in the indenture to provide the Company additional restricted payments capacity, giving the Company additional financial flexibility. Consequently, on June 27, 2022, the Company paid a consent fee equal to $10.00 per $1,000 to holders of the 2027 Notes that delivered their consents for the abovementioned amendments to the indenture governing the 2027 Notes. The consent fee and other related fees were deducted from the carrying value of the 2027 Notes and will be amortized over its term.
Note 13
Provisions and other long-term liabilities
The outstanding amounts are as follows:
| | | | |
| | At | | Year ended |
Amounts in US$ '000 | | September 30, 2022 | | December 31, 2021 |
Assets retirement obligation | | 43,324 | | 45,842 |
Deferred income | | 3,079 | | 3,331 |
Other | | 9,365 | | 13,675 |
| | 55,768 | | 62,848 |
18
Note 14
Trade and other payables
The outstanding amounts are as follows:
| | | | |
| | At | | Year ended |
Amounts in US$ '000 | | September 30, 2022 | | December 31, 2021 |
Trade payables | | 94,474 | | 86,672 |
To be paid to co-venturers | | 2,704 | | 953 |
Customer advance payments | | 160 | | 426 |
Other short-term advance payments (a) | | — | | 1,558 |
Staff costs to be paid | | 8,929 | | 17,973 |
Royalties to be paid | | 10,666 | | 7,347 |
Taxes and other debts to be paid | | 10,639 | | 14,124 |
| | 127,572 | | 129,053 |
Classified as follows:
| | | | |
Current | | 127,572 | | 127,513 |
Non-Current | | — | | 1,540 |
| (a) | Advance payment collected in relation with the sale of the Aguada Baguales, El Porvenir and Puesto Touquet Blocks (see Note 17). |
Note 15
Fair value measurement of financial instruments
Fair value hierarchy
The following table presents the Group’s financial assets and financial liabilities measured and recognized at fair value at September 30, 2022, and December 31, 2021, on a recurring basis:
| | | | | | |
| | | | | | At |
Amounts in US$ '000 | | Level 1 | | Level 2 | | September 30, 2022 |
Assets | |
| |
| |
|
Cash and cash equivalents | |
| |
| | |
Money market funds | | 60,660 | | — | | 60,660 |
Derivative financial instrument assets | | | | | | |
Commodity risk management contracts | | — | | 5,057 | | 5,057 |
Total Assets | | 60,660 | | 5,057 | | 65,717 |
Liabilities | |
| |
| |
|
Derivative financial instrument liabilities | |
| |
| | |
Commodity risk management contracts | | — | | 4,655 | | 4,655 |
Total Liabilities | | — | | 4,655 | | 4,655 |
| | | | | | |
| | | | | | At |
Amounts in US$ '000 | | Level 1 | | Level 2 | | December 31, 2021 |
Assets | |
| |
| |
|
Cash and cash equivalents | |
| |
| |
|
Money market funds | | 427 | | — | | 427 |
Derivative financial instrument assets | |
| |
| |
|
Commodity risk management contracts | | — | | 126 | | 126 |
Total Assets | | 427 | | 126 | | 553 |
Liabilities | |
| |
| |
|
Derivative financial instrument liabilities | |
| |
| |
|
Commodity risk management contracts | | — | | 20,757 | | 20,757 |
Total Liabilities | | — | | 20,757 | | 20,757 |
19
Note 15 (Continued)
Fair value measurement of financial instruments (Continued)
Fair value hierarchy (Continued)
There were no transfers between Level 2 and 3 during the period. The Group did not measure any financial assets or financial liabilities at fair value on a non-recurring basis as of September 30, 2022.
Fair values of other financial instruments (unrecognized)
The Group also has a number of financial instruments which are not measured at fair value in the balance sheet. For the majority of these instruments, the fair values are not materially different to their carrying amounts, since the interest receivable/payable is either close to current market rates or the instruments are short-term in nature.
Borrowings are comprised primarily of fixed rate debt and variable rate debt with a short term portion where the interest has already been fixed and are measured at their amortized cost. The Group estimates that the fair value of its main financial liabilities is approximately 81% of its carrying amount, including interests accrued as of September 30, 2022. Fair values were calculated based on market price for the Notes and cash flows discounted for other borrowings using a rate based on the borrowing rate and are within Level 1 and Level 2 of the fair value hierarchy, respectively.
Capital commitments
Capital commitments are detailed in Note 33.2 to the audited Consolidated Financial Statements as of December 31, 2021. The following updates have taken place during the nine-months period ended September 30, 2022:
The Group invested US$ 27,504,000 to fulfil its working interest commitments.
Colombia
GeoPark drilled the 2 exploratory wells committed in the Platanillo Block. These investments require the approval from the Colombian National Hydrocarbons Agency (“ANH”) to fulfil the Group’s commitment.
On March 10, 2022, GeoPark submitted to the ANH a request to withdraw from the PUT-14 E&P contract and transfer the pending commitments to other E&P contracts. As of the date of these interim condensed consolidated financial statements, transfer of investment is being carried out by GeoPark. Once total investment is reached through such transfers, ANH will continue with the contract’s termination.
On March 15, 2022, the E&P contracts related to the Llanos 86 and Llanos 104 Blocks entered into exploratory phase 1. The investment commitments for these blocks, at GeoPark’s working interest, over the three-years term of this first phase are:
| ● | Llanos 86 Block: 3D seismic, 2D seismic reprocessing and 1 exploratory well (US$ 10,494,000) |
| ● | Llanos 104 Block: 3D seismic, 2D seismic reprocessing and 1 exploratory well (US$ 9,325,000) |
On March 25, 2022, the ANH approved the assignment of a 50% non-operated working interest in the CPO-4-1 Block to GeoPark. On September 20, 2022, the E&P contract related to the block entered into exploratory phase 1. The investment commitment over the three-year term of Phase 1 is one exploratory well for a total amount of US$ 2,922,000, at GeoPark’s working interest.
20
Note 16 (Continued)
Capital commitments (Continued)
Colombia (Continued)
On September 21, 2022, GeoPark submitted to the ANH requests for termination of the E&P contracts related to the Tacacho and Terecay Blocks. As of the date of these interim condensed consolidated financial statements, the requests are under review by the ANH.
On September 23, 2022, the ANH approved the request to extend the exploratory period in the Llanos 87 Block until March 9, 2023.
Brazil
On September 14, 2022, the Brazilian National Agency of Petroleum, Natural Gas and Biofuels (“ANP”) extended the exploratory period in the POT-T-785 Block until October 29, 2023.
Business transactions
Aguada Baguales, El Porvenir and Puesto Touquet Blocks (Argentina)
In August 2021, the Company’s Board of Directors approved the decision to evaluate farm-out or divestment opportunities to sell its 100% working interest and operatorship in the Aguada Baguales, El Porvenir and Puesto Touquet Blocks in Argentina, including the associated gas transportation license through the Puesto Touquet pipeline.
On November 3, 2021, GeoPark signed a sale and purchase and assignment agreement for a total consideration of US$ 16,000,000, subject to working capital adjustment. At that moment, GeoPark collected an advance payment of US$ 1,600,000.
The closing of the transaction took place on January 31, 2022, after the corresponding regulatory approvals were granted and GeoPark received the remaining outstanding payment from the purchaser. In April 2022, GeoPark paid a working capital adjustment amounting to US$ 370,000. As a consequence of this transaction, GeoPark recognized a gain of US$ 3,983,000 within Other income (expenses).
Manati Block (Brazil)
On November 22, 2020, GeoPark signed an agreement to sell its 10% non-operated working interest in the Manati Block in Brazil. The total consideration amounted to Brazilian reais 144,400,000 (equivalent to US$ 30,478,000 as of March 31, 2022), including a fixed payment of Brazilian reais 124,400,000 plus an earn-out of Brazilian reais 20,000,000, which was subject to obtaining certain regulatory approvals. The transaction was subject to certain conditions that should have been met before March 31, 2022. As of March 31, 2022, the required conditions were not met and GeoPark decided not to extend this deadline. As a result, GeoPark will continue to own its 10% interest in the block.
Farm-out REC-T-128 Block (Brazil)
In 2021, GeoPark performed a farm-out transaction to sell its 70% interest in the REC-T-128 Block in Brazil. The total consideration was US$ 1,100,000, which was collected at closing in 2021, plus a contingent payment of up to US$ 710,000, subject to international oil price and field production performance. On August 1, 2022, GeoPark collected the contingent payment of US$ 710,000.
21
Note 18
In November 2022, the Colombian Congress approved a tax reform which contemplates an increase in the government take for the oil and gas industry.
The main impacts for the oil and gas industry include provisions that prevent the deduction of royalties paid to the government from the income tax calculation and the establishment of a surcharge linked to Brent oil price.
The new tax provisions will go into effect in 2023 and do not affect current tax bases or tax rate for fiscal year 2022. Nevertheless, the surcharge shall be considered for deferred income tax purposes at year-end.
22
SIGNATURE
Pursuant to the requirements of the Securities Exchange Act of 1934, the registrant has duly caused this report to be signed on its behalf by the undersigned, thereunto duly authorized.
| | |
| GeoPark Limited | |
| | |
| | |
| | |
| By: | /s/ Verónica Dávila |
| | Name: Verónica Dávila |
| | Title: Chief Financial Officer |
Date: November 9, 2022
23