Exhibit 99.2

1 NASDAQ: RILY First Quarter 2020 Supplemental Financial Data May 11, 2020

2 2 Reconciliation of U.S. GAAP to Non - GAAP Measures Three Months Ended (Dollars in thousands) Q1 2020 Q4 2019 Q3 2019 Q2 2019 Q1 2019 Adjusted EBITDA and Operating Adjusted EBITDA Reconciliation: Net (loss) income $(98,665) $17,129 $34,302 $22,157 $8,023 EBITDA Adjustments: (Benefit) provision for income taxes (37,539) 7,842 14,409 9,289 3,104 Interest expense 15,654 15,075 12,772 11,588 10,770 Interest income (246) (248) (361) (331) (637) Share based payments 5,322 5,640 4,728 2,934 2,614 Depreciation and amortization 4,956 4,831 4,473 4,831 4,913 Restructuring costs — — — 1,552 147 Impairment of tradenames 4,000 — — — — Transactions related costs and other 10,454 — 7 836 5,496 Total EBITDA Adjustments 2,601 33,140 36,028 30,699 26,407 Adjusted EBITDA $(96,064) $50,269 $70,330 $52,856 $34,430 Operating EBITDA Adjustments: Trading losses (income) and fair value adjustments on loans 182,442 (34,733) (40,268) (5,595) (25,867) Other investment related expenses (15,470) 858 5,138 (4,110) 10,295 Total Operating EBITDA Adjustments 166,972 (33,875) (35,130) (9,705) (15,572) Operating Adjusted EBITDA $70,908 $16,394 $35,200 $43,151 $18,858 (Unaudited)
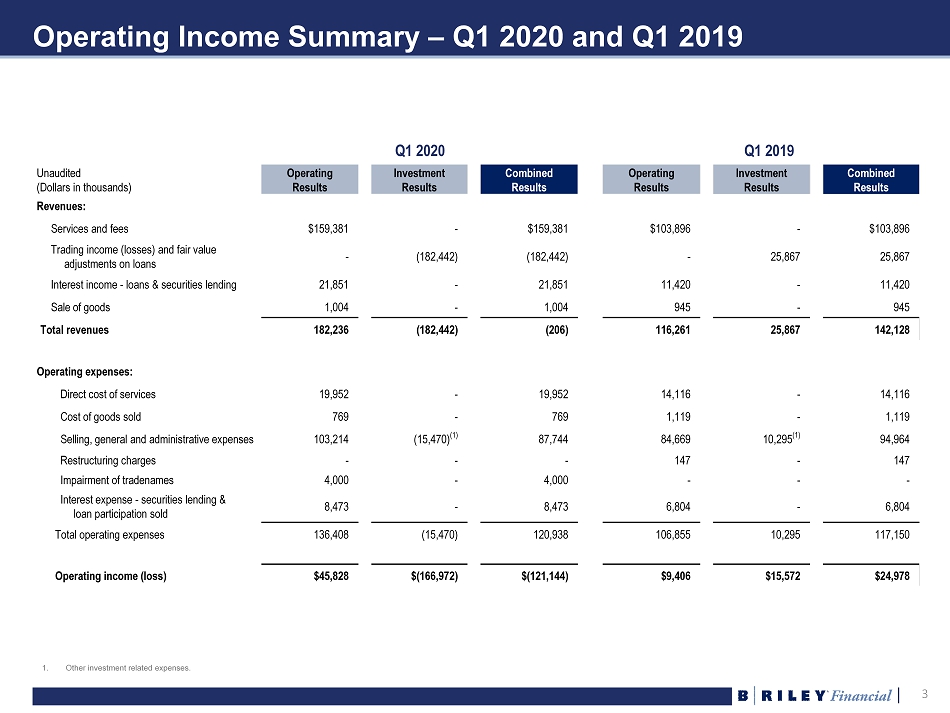
3 3 Operating Income Summary – Q1 2020 and Q1 2019 Unaudited (Dollars in thousands) Operating Results Investment Results Combined Results Operating Results Investment Results Combined Results Revenues: Services and fees $159,381 - $159,381 $103,896 - $103,896 Trading income (losses) and fair value adjustments on loans - (182,442) (182,442) - 25,867 25,867 Interest income - loans & securities lending 21,851 - 21,851 11,420 - 11,420 Sale of goods 1,004 - 1,004 945 - 945 Total revenues 182,236 (182,442) (206) 116,261 25,867 142,128 Operating expenses: Direct cost of services 19,952 - 19,952 14,116 - 14,116 Cost of goods sold 769 - 769 1,119 - 1,119 Selling, general and administrative expenses 103,214 (15,470) (1) 87,744 84,669 10,295 (1) 94,964 Restructuring charges - - - 147 - 147 Impairment of tradenames 4,000 - 4,000 - - - Interest expense - securities lending & loan participation sold 8,473 - 8,473 6,804 - 6,804 Total operating expenses 136,408 (15,470) 120,938 106,855 10,295 117,150 Operating income (loss) $45,828 $(166,972) $(121,144) $9,406 $15,572 $24,978 Q1 2020 Q1 2019 1. Other investment related expenses.
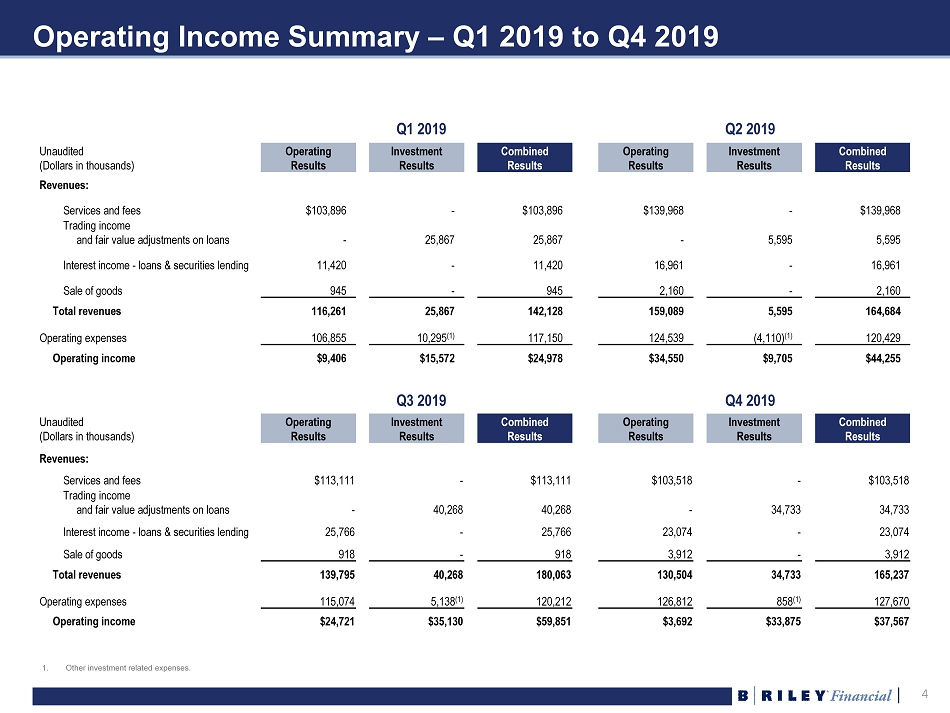
4 4 Operating Income Summary – Q1 2019 to Q4 2019 Q1 2019 Q2 2019 Unaudited (Dollars in thousands) Operating Results Investment Results Combined Results Operating Results Investment Results Combined Results Revenues: Services and fees $103,896 - $103,896 $139,968 - $139,968 Trading income and fair value adjustments on loans - 25,867 25,867 - 5,595 5,595 Interest income - loans & securities lending 11,420 - 11,420 16,961 - 16,961 Sale of goods 945 - 945 2,160 - 2,160 Total revenues 116,261 25,867 142,128 159,089 5,595 164,684 Operating expenses 106,855 10,295 (1) 117,150 124,539 (4,110) (1) 120,429 Operating income $9,406 $15,572 $24,978 $34,550 $9,705 $44,255 Unaudited (Dollars in thousands) Operating Results Investment Results Combined Results Operating Results Investment Results Combined Results Revenues: Services and fees $113,111 - $113,111 $103,518 - $103,518 Trading income and fair value adjustments on loans - 40,268 40,268 - 34,733 34,733 Interest income - loans & securities lending 25,766 - 25,766 23,074 - 23,074 Sale of goods 918 - 918 3,912 - 3,912 Total revenues 139,795 40,268 180,063 130,504 34,733 165,237 Operating expenses 115,074 5,138 (1) 120,212 126,812 858 (1) 127,670 Operating income $24,721 $35,130 $59,851 $3,692 $33,875 $37,567 Q3 2019 Q4 2019 1. Other investment related expenses.

5 5 Quarterly Operating Revenue and Operating Adjusted EBITDA Operating Business Revenue and Adjusted EBITDA (1)(2)(3)(4) $18.9M $43.2M $35.2M $16.4M $70.9M $116.3M $159.1M $139.8M $130.5M $182.2M Q1 2019 Q2 2019 Q3 2019 Q4 2019 Q1 2020 Adj. EBITDA Revenue 1. Operating Revenue is defined as the sum of revenues from ( i ) Service and Fees, (ii) Interest Income - Loans and Securities Lending and (iii) Sales of Goods. 2. Operating Adjusted EBITDA is defined as Adjusted EBITDA excluding ( i ) Trading Income (losses) and Fair Value Adjustments on Loans and (ii) other investment related expenses. 3. Adjusted EBITDA includes earnings before interest, taxes, depreciation, amortization, restructuring costs, share - based payments, impairment of tradenames, and transaction related and other costs. 4. For a reconciliation to GAAP financial measures, please see slide 2.

6 6 Quarterly Revenue and Adjusted EBITDA (Dollars in thousands) Q1 2020 Q4 2019 Q3 2019 Q2 2019 Q1 2019 Operating Revenue (1) $182,236 $130,504 $139,795 $159,089 $116,261 Investment (Loss) Gains (2) (182,442) 34,733 40,268 5,595 25,867 Total Revenue $(206) $165,237 $180,063 $164,684 $142,128 Q1 2020 Q4 2019 Q3 2019 Q2 2019 Q1 2019 Operating Adjusted EBITDA (3) $70,908 $16,394 $35,200 $43,151 $18,858 Investment Adjusted EBITDA (4) (166,972) 33,875 35,130 9,705 15,572 Adjusted EBITDA (5)(6) $(96,064) $50,269 $70,330 $52,856 $34,430 1. Operating Revenue is defined as the sum of revenues from ( i ) Service and Fees, (ii) Interest Income - Loans and Securities Lending and (iii) Sales of Goods. 2. Investment (Loss) Gains is defined as Trading Income (losses) and Fair Value Adjustments on Loans. 3. Operating Adjusted EBITDA is defined as Adjusted EBITDA excluding ( i ) Trading Income (losses) and Fair Value Adjustments on Loans and (ii) other investment related expenses. 4. Investment Adjusted EBITDA is defined as Trading Income (losses) and Fair Value Adjustments on Loans, less other investment r ela ted expenses. 5. Adjusted EBITDA includes earnings before interest, taxes, depreciation, amortization, restructuring costs, share - based payments, impairment of tradenames, and transaction related and other costs. 6. For a reconciliation to GAAP financial measures, please see slide 2.

7 7 Cash and Investments Summary Cash and Investment Q1 2020 Q4 2019 Q3 2019 Q2 2019 Q1 2019 (Dollars in thousands) Cash and Cash Equivalents $124,231 $104,268 $170,587 $55,609 $163,462 Restricted Cash 471 471 471 2,635 7,491 Due from Clearing Brokers, net 5,753 23,818 27,791 29,245 22,418 Advances Against Customer Contracts 11,121 27,347 - 5,322 - Securities and Other Investments Owned: Equity Securities 234,867 353,162 244,556 180,089 189,165 Corporate bonds 18,429 19,020 21,580 23,170 28,740 Other fixed income securities 5,243 8,414 4,816 5,767 13,365 Partnership interests and other 29,247 27,617 20,153 19,417 23,491 Securities Sold Not Yet Purchased (14,298) (41,820) (29,092) (42,754) (35,948) Loans Receivable, net of Loan Participation Sold 313,894 256,708 302,537 292,368 87,489 Other equity investments and deposits (1) 48,765 54,855 81,194 106,904 52,161 Total Cash, Net Securities, and Other $777,723 $833,860 $844,593 $677,772 $551,834 Debt Q1 2020 Q4 2019 Q3 2019 Q2 2019 Q1 2019 Term Loan $61,932 $66,666 $71,393 $80,916 $89,138 Notes Payable 714 38,167 1,193 1,193 1,193 Senior Notes Payable 853,523 688,112 701,278 582,482 465,040 Total Debt 916,169 792,945 773,864 664,591 555,371 Total Cash and Investments, Net of Debt $(138,446) $40,915 $70,729 $13,181 $(3,537) 1. Other equity investments and investment related deposits reported in prepaid and other assets.

8 8 U.S. GAAP – Consolidated Balance Sheets March 31, 2020 (Unaudited) December 31, 2019 Cash and cash equivalents $124,231 $104,268 Restricted cash 471 471 Due from clearing brokers 10,879 23,818 Securities and other investments owned, at fair value 287,786 408,213 Securities borrowed 674,163 814,331 Accounts receivable, net 46,450 46,624 Due from related parties 4,391 5,832 Advances against customer contracts 11,121 27,347 Loans receivable, at fair value 326,299 43,338 Loans receivable, at cost — 225,848 Prepaid expenses and other assets 114,686 81,808 Operating lease right - of - use assets 46,213 47,809 Property and equipment, net 12,223 12,727 Goodwill 223,697 223,697 Other intangible assets, net 212,500 220,525 Deferred income taxes 35,786 31,522 Total assets $2,130,896 $2,318,178 Accounts payable $6,858 $4,477 Accrued expenses and other liabilities 103,452 130,714 Deferred revenue 73,709 67,121 Due to related parties and partners 1,061 1,750 Due to clearing brokers 5,126 — Securities sold not yet purchased 14,298 41,820 Securities loaned 670,859 810,495 Mandatorily redeemable noncontrolling interests 4,508 4,616 Operating lease liabilities 59,430 61,511 Notes payable 714 38,167 Loan participations sold 12,405 12,478 Term loan 61,932 66,666 Senior notes payable 853,523 688,112 Total liabilities $1,867,875 $1,927,927 Total B. Riley Financial, Inc. stockholders' equity 235,035 360,660 Noncontrolling interests 27,986 29,591 Total equity 263,021 390,251 Total liabilities and equity $2,130,896 $ 2,318,178 (Dollars in thousands)

9 9 U.S. GAAP – Consolidated Statements of Income Unaudited (Dollars in thousands) Three Months Ended - March 31, 2020 2019 Revenues: Services and fees $159,381 $103,896 Trading (losses) income and fair value adjustments on loans (182,442) 25,867 Interest income - Loans and securities lending 21,851 11,420 Sale of goods 1,004 945 Total revenues ( 206) 142,128 Operating expenses: Direct cost of services 19,952 14,116 Cost of goods sold 769 1,119 Selling, general and administrative expenses 87,744 94,964 Restructuring charge — 147 Impairment of tradenames 4,000 — Interest expense - Securities lending and loan participations sold 8,473 6,804 Total operating expenses 120,938 117,150 Operating (loss) income (121,144) 24,978 Other income (expense): Interest income 246 637 Loss from equity investments (236) (3,762) Interest expense (15,654) (10,770) (Loss) income before income taxes (136,788) 11,083 Benefit (provision) for income taxes 37,539 (3,104) Net (loss) income (99,249) 7,979 Net loss attributable to noncontrolling interests (584) (44) Net (loss) income attributable to B. Riley Financial, Inc. $(98,665) $8,023 Preferred stock dividends 1,055 — Net (loss) income available to common shareholders $(99,720) $8,023 Basic (loss) income per common share $(3.83) $0.31 Diluted (loss) income per common share $(3.83) $0.30 Weighted average basic common shares outstanding 26,028,613 26,217,215 Weighted average diluted common shares outstanding 26,028,613 26,687,531

10 10 U.S. GAAP – Consolidated Statements of Cash Flows Three Months Ended - March 31, (Dollars in thousands) 2020 2019 Cash flows from operating activities: Net (loss) income $(99,249) $7,979 Adjustments to reconcile net income to net cash provided by operating activities: Depreciation and amortization 4,956 4,913 Provision for doubtful accounts 724 233 Share - based compensation 5,322 2,614 Fair value adjustments, non - cash 17,926 49 Non - cash interest and other (2,827) 736 Effect of foreign currency on operations 179 130 Loss from equity investments 236 3,762 Deferred income taxes (4,254) (390) Impairment of intangibles and loss on disposal of fixed assets 4,046 88 Gain on extinguishment of debt (1,556) — Income allocated for mandatorily redeemable noncontrolling interests 175 169 Change in operating assets and liabilities 74,777 (11,359) Net cash provided by operating activities 455 8,924 Cash flows from investing activities: Purchases of loans receivable (115,328) (20,154) Repayments of loans receivable 42,128 5,500 Sale of loan receivable to related party 1,800 — Repayment of loan participations sold (244) — Purchases of property, equipment and other (438) (1,746) Proceeds from sale of property, equipment and intangible assets 1 12 Purchase of equity investments — (10,558) Dividends and distributions from equity investments 589 433 Net cash used in investing activities (71,492) (26,513) Cash flows from financing activities: Net cash provided by financing activities 92,332 8,241 Increase (decrease) in cash, cash equivalents and restricted cash 21,295 (9,348) Effect of foreign currency on cash, cash equivalents and restricted cash (1,332) 23 Net increase (decrease) in cash, cash equivalents and restricted cash 19,963 (9,325) Cash, cash equivalents and restricted cash, beginning of period 104,739 180,278 Cash, cash equivalents and restricted cash, end of period $124,702 $170,953 (Unaudited)

11 11 U.S. GAAP – Segment Financial Information (Dollars in thousands) Three Months Ended March 31, 2020 2019 Capital Markets segment: Revenues - Services and fees $104,413 48,014 Trading (losses) income and fair value adjustments on loans (182,442) 25,867 Interest income - Loans and securities lending 21,851 11,420 Total revenues (56,178) 85,301 Selling, general and administrative expenses (54,711) (63,389) Restructuring recovery — 29 Interest expense - Securities lending and loan participations sold (8,473) (6,804) Depreciation and amortization (1,105) (1,276) Segment (loss) income (120,467) 13,861 Auction and Liquidation segment: Revenues - Services and fees 20,661 20,709 Direct cost of services (14,816) (6,274) Cost of goods sold (29) (14) Selling, general and administrative expenses (1,526) (2,915) Depreciation and amortization (1) (2) Segment income 4,289 11,504 Valuation and Appraisal segment: Revenues - Services and fees 8,788 8,583 Selling, general and administrative expenses (6,867) (7,187) Depreciation and amortization (41) (33) Segment income 1,880 1,363 Three Months Ended March 31, 2020 2019 Principal Investments – United Online and magicJack segment: Revenues - Services and fees 21,718 26,590 Revenues - Sale of goods 1,004 945 Total revenues 22,722 27,535 Direct cost of services (5,136) (7,842) Cost of goods sold (740) (1,105) Selling, general and administrative expenses (5,463) (7,020) Depreciation and amortization (2,879) (3,463) Restructuring charge — (176) Segment income 8,504 7,929 Brands segment: Revenues - Services and fees 3,801 — Selling, general and administrative expenses (904) — Depreciation and amortization (714) — Impairment of tradenames (4,000) — Segment loss (1,817) — Consolidated operating (loss) income from reportable segments $(107,611) $34,657 (Unaudited)

12 12 Definition of US GAAP to Non - GAAP Financial Measures Certain of the information set forth herein, including adjusted net income and adjusted EBITDA, may be considered non - GAAP financial measures . B . Riley Financial believes this information is useful to investors because it provides a basis for measuring the Company's available capital resources, the operating performance of its business and its cash flow, excluding net interest expense, provisions for or benefit from income taxes, depreciation, amortization, fair value adjustment, transaction and other expenses, restructuring costs, and stock - based compensation that would normally be included in the most directly comparable measures calculated and presented in accordance with Generally Accepted Accounting Principles ("GAAP") . In addition, the Company's management uses these non - GAAP financial measures along with the most directly comparable GAAP financial measures in evaluating the Company's operating performance, capital resources and cash flow . Non - GAAP financial measures should not be considered in isolation from, or as a substitute for, financial information presented in compliance with GAAP, and non - financial measures as reported by the Company may not be comparable to similarly titled amounts reported by other companies .