Exhibit 99.2

1 NASDAQ: RILY Third Quarter 2020 Supplemental Financial Data October 29, 2020
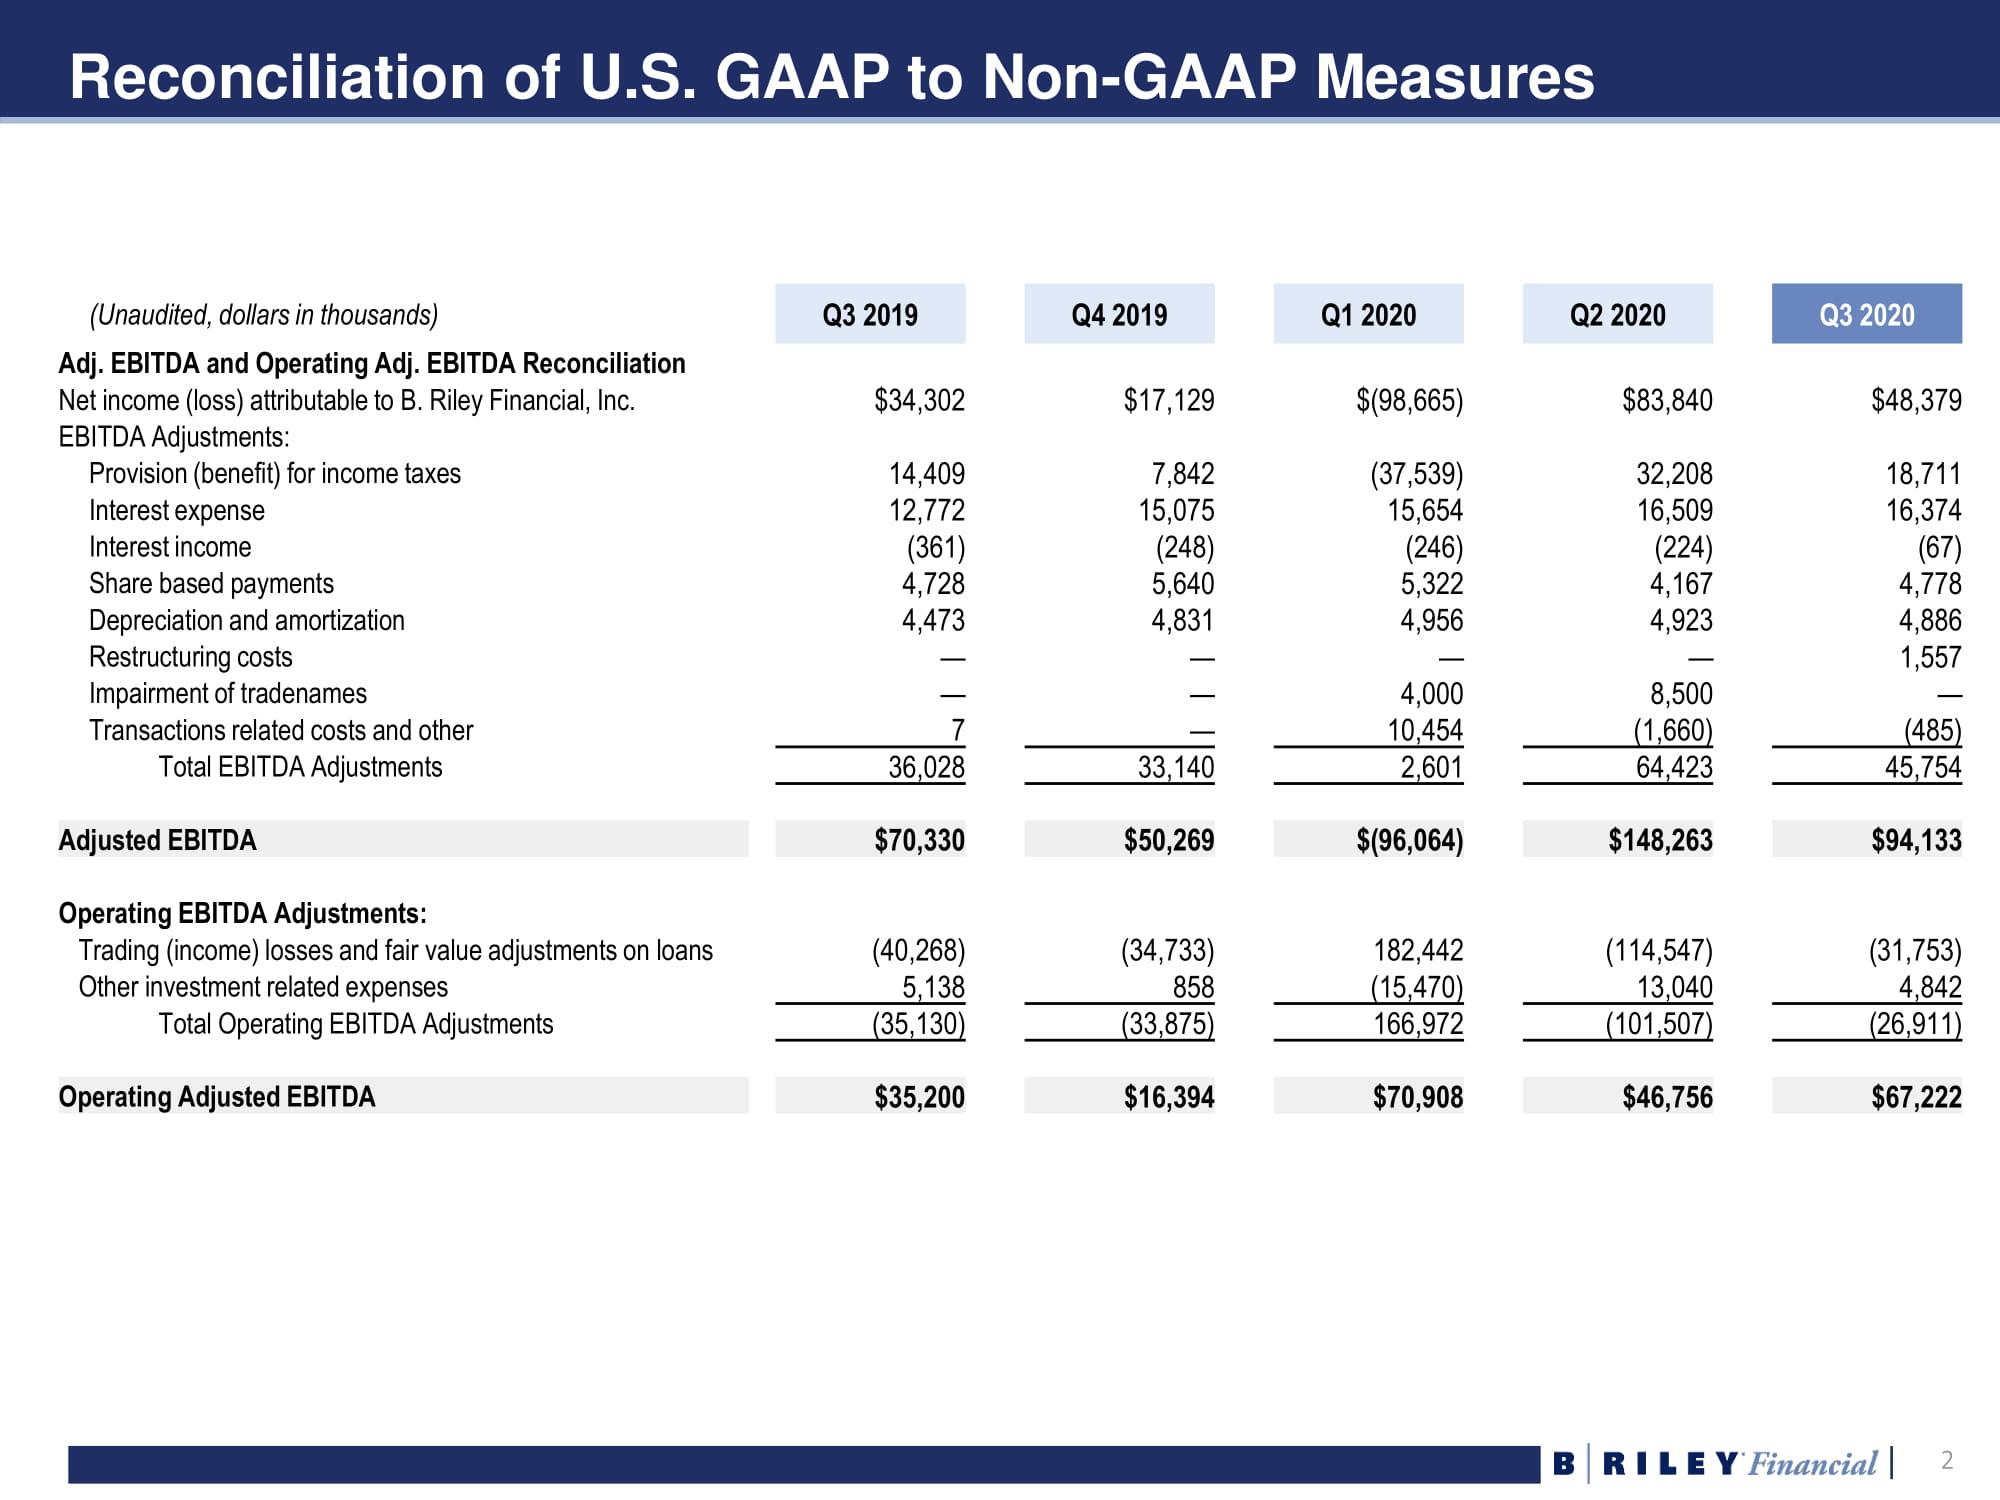
2 2 Reconciliation of U.S. GAAP to Non - GAAP Measures (Unaudited, dollars in thousands) Q3 2019 Q4 2019 Q1 2020 Q2 2020 Q3 2020 Adj. EBITDA and Operating Adj. EBITDA Reconciliation Net income (loss) attributable to B. Riley Financial, Inc. $34,302 $17,129 $(98,665) $83,840 $48,379 EBITDA Adjustments: Provision (benefit) for income taxes 14,409 7,842 (37,539) 32,208 18,711 Interest expense 12,772 15,075 15,654 16,509 16,374 Interest income (361) (248) (246) (224) (67) Share based payments 4,728 5,640 5,322 4,167 4,778 Depreciation and amortization 4,473 4,831 4,956 4,923 4,886 Restructuring costs — — — — 1,557 Impairment of tradenames — — 4,000 8,500 — Transactions related costs and other 7 — 10,454 (1,660) (485) Total EBITDA Adjustments 36,028 33,140 2,601 64,423 45,754 Adjusted EBITDA $70,330 $50,269 $(96,064) $148,263 $94,133 Operating EBITDA Adjustments: Trading (income) losses and fair value adjustments on loans (40,268) (34,733) 182,442 (114,547) (31,753) Other investment related expenses 5,138 858 (15,470) 13,040 4,842 Total Operating EBITDA Adjustments (35,130) (33,875) 166,972 (101,507) (26,911) Operating Adjusted EBITDA $35,200 $16,394 $70,908 $46,756 $67,222
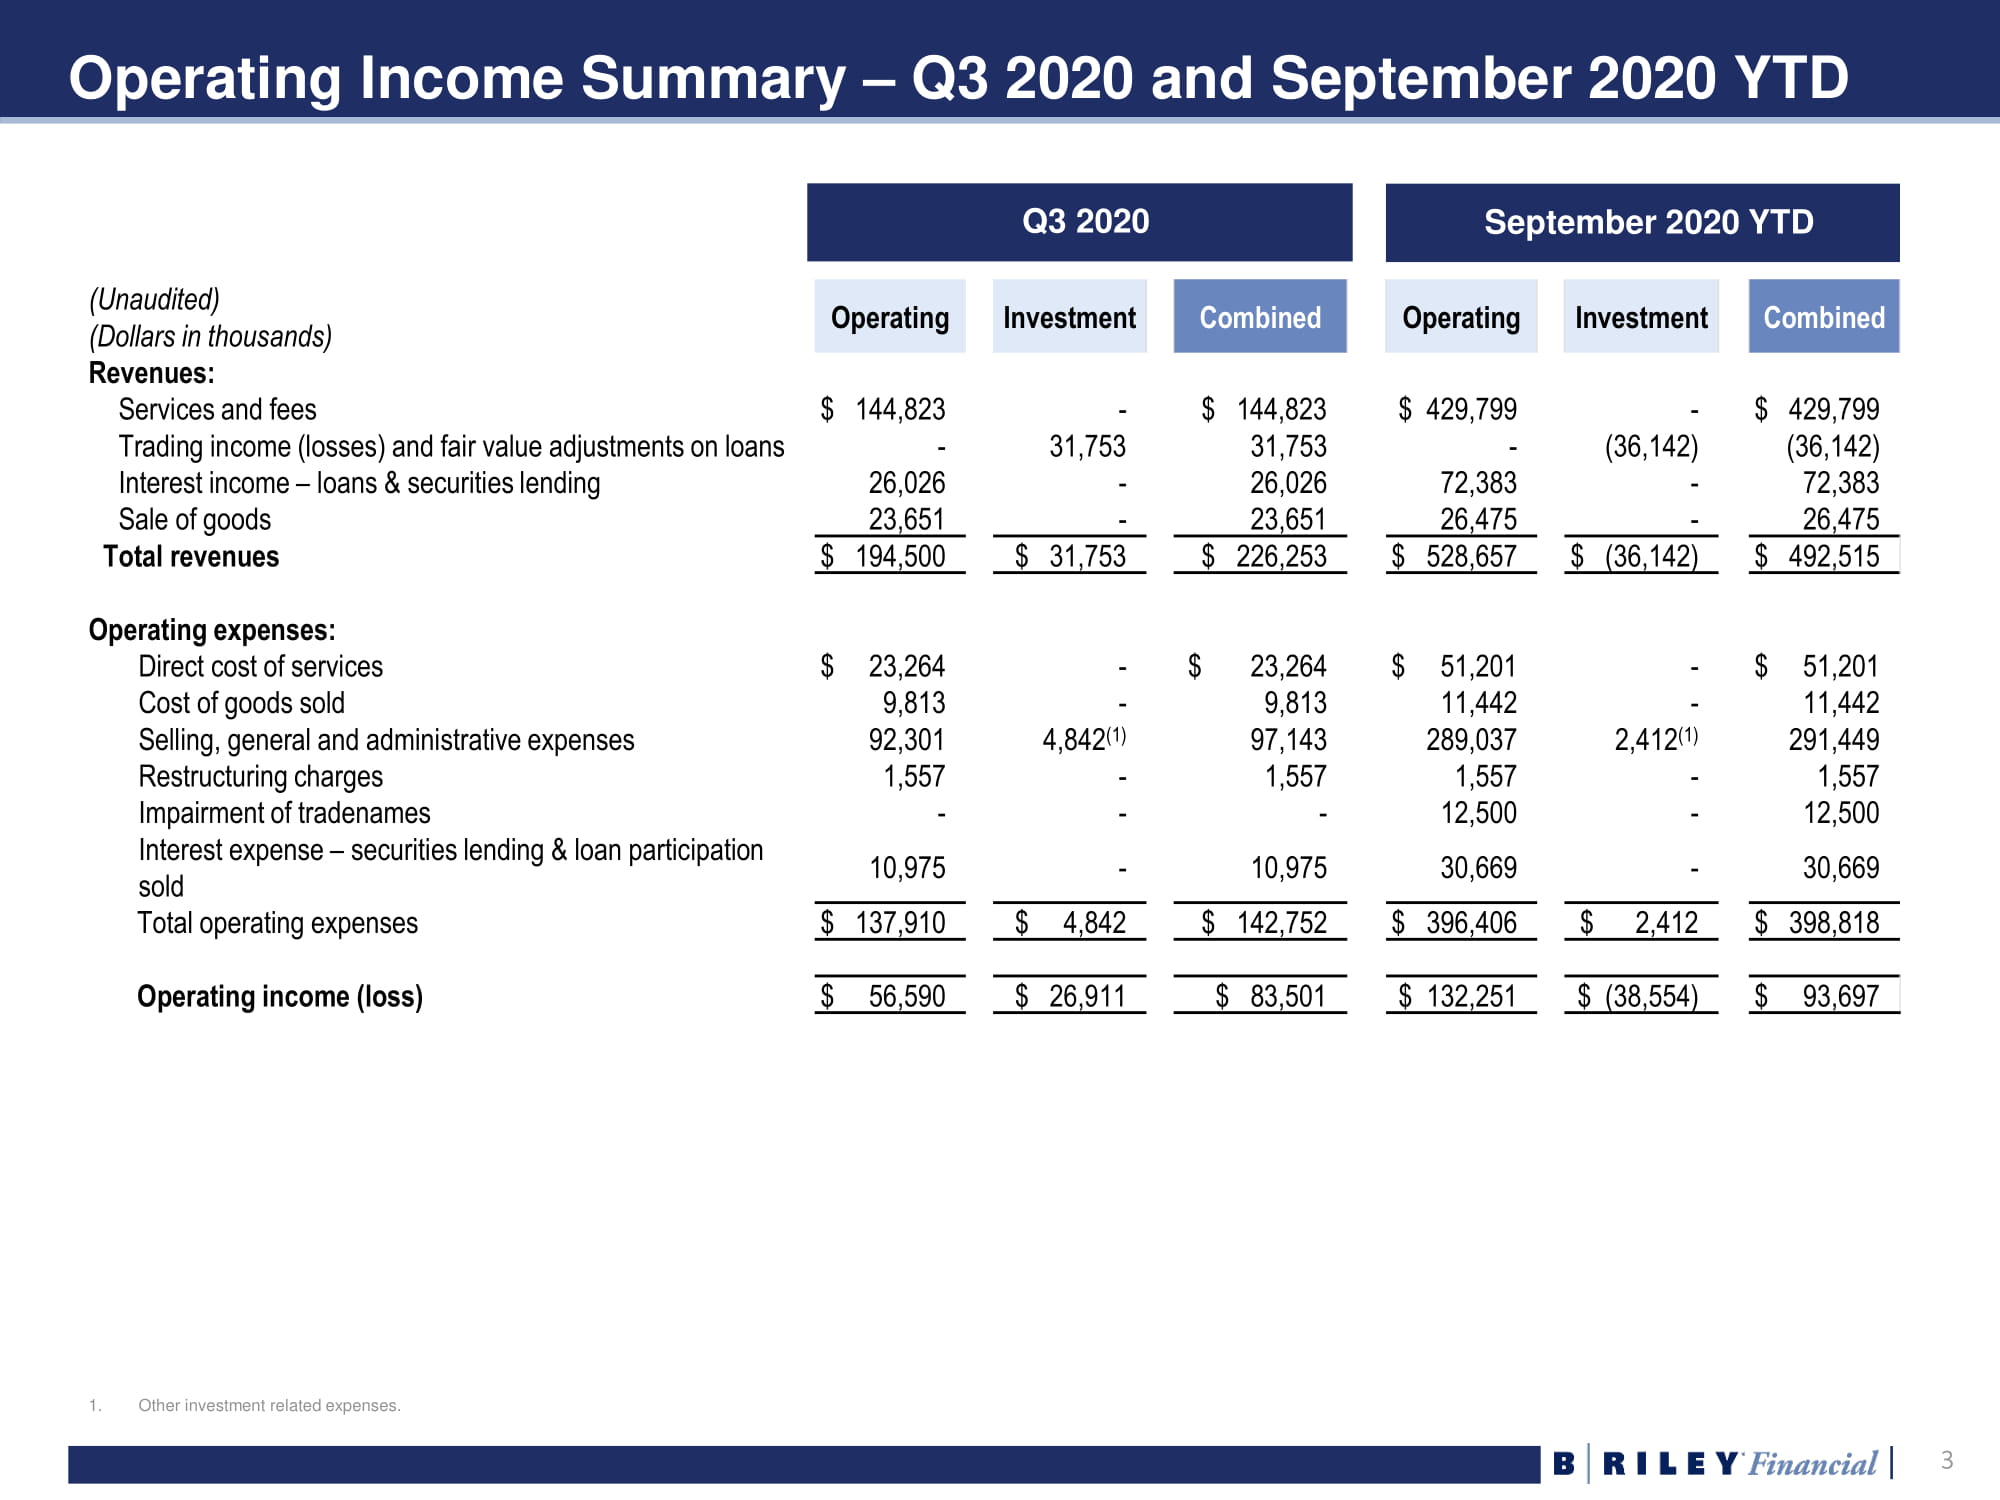
3 3 Operating Income Summary – Q3 2020 and September 2020 YTD 1. Other investment related expenses. (Unaudited) (Dollars in thousands) Operating Investment Combined Operating Investment Combined Revenues: Services and fees $ 144,823 - $ 144,823 $ 429,799 - $ 429,799 Trading income (losses) and fair value adjustments on loans - 31,753 31,753 - (36,142) (36,142) Interest income – loans & securities lending 26,026 - 26,026 72,383 - 72,383 Sale of goods 23,651 - 23,651 26,475 - 26,475 Total revenues $ 194,500 $ 31,753 $ 226,253 $ 528,657 $ (36,142) $ 492,515 Operating expenses: Direct cost of services $ 23,264 - $ 23,264 $ 51,201 - $ 51,201 Cost of goods sold 9,813 - 9,813 11,442 - 11,442 Selling, general and administrative expenses 92,301 4,842 (1) 97,143 289,037 2,412 (1) 291,449 Restructuring charges 1,557 - 1,557 1,557 - 1,557 Impairment of tradenames - - - 12,500 - 12,500 Interest expense – securities lending & loan participation sold 10,975 - 10,975 30,669 - 30,669 Total operating expenses $ 137,910 $ 4,842 $ 142,752 $ 396,406 $ 2,412 $ 398,818 Operating income (loss) $ 56,590 $ 26,911 $ 83,501 $ 132,251 $ (38,554) $ 93,697 Q3 2020 September 2020 YTD
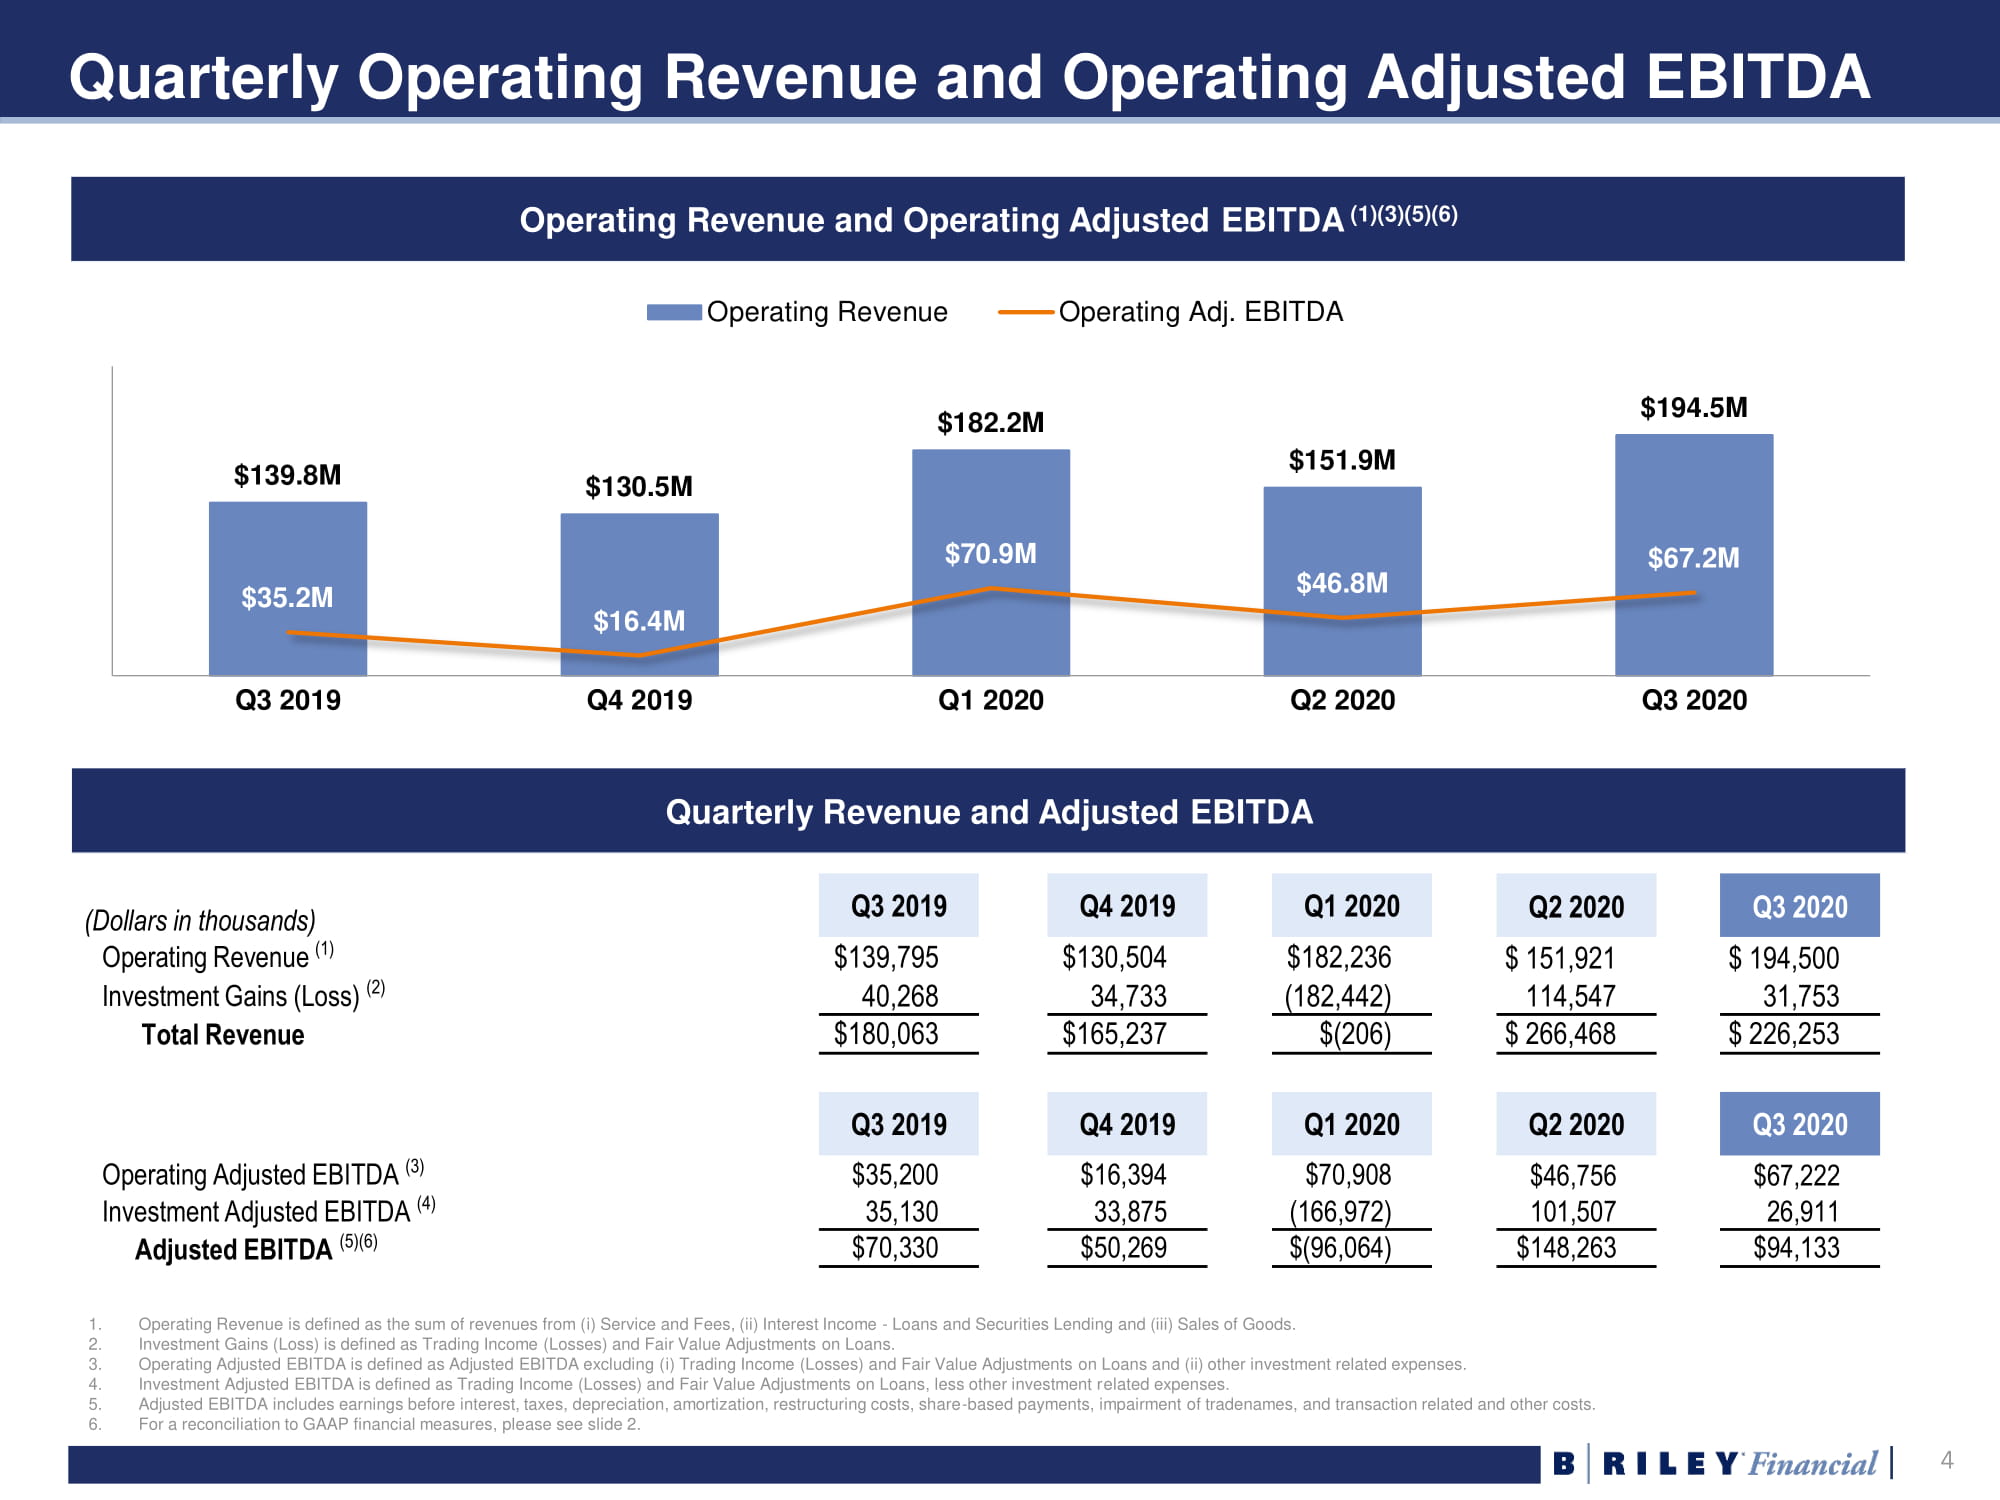
4 4 Quarterly Operating Revenue and Operating Adjusted EBITDA Operating Revenue and Operating Adjusted EBITDA (1)(3)(5)(6) $139.8M $130.5M $182.2M $151.9M $194.5M $35.2M $16.4M $70.9M $46.8M $67.2M Q3 2019 Q4 2019 Q1 2020 Q2 2020 Q3 2020 Operating Revenue Operating Adj. EBITDA (Dollars in thousands) Q3 2019 Q4 2019 Q1 2020 Q2 2020 Q3 2020 Operating Revenue (1) $139,795 $130,504 $182,236 $ 151,921 $ 194,500 Investment Gains (Loss) (2) 40,268 34,733 (182,442) 114,547 31,753 Total Revenue $180,063 $165,237 $(206) $ 266,468 $ 226,253 Q3 2019 Q4 2019 Q1 2020 Q2 2020 Q3 2020 Operating Adjusted EBITDA (3) $35,200 $16,394 $70,908 $46,756 $67,222 Investment Adjusted EBITDA (4) 35,130 33,875 (166,972) 101,507 26,911 Adjusted EBITDA (5)(6) $70,330 $50,269 $(96,064) $148,263 $94,133 Quarterly Revenue and Adjusted EBITDA 1. Operating Revenue is defined as the sum of revenues from ( i ) Service and Fees, (ii) Interest Income - Loans and Securities Lending and (iii) Sales of Goods. 2. Investment Gains (Loss) is defined as Trading Income (Losses) and Fair Value Adjustments on Loans. 3. Operating Adjusted EBITDA is defined as Adjusted EBITDA excluding ( i ) Trading Income (Losses) and Fair Value Adjustments on Loans and (ii) other investment related expenses. 4. Investment Adjusted EBITDA is defined as Trading Income (Losses) and Fair Value Adjustments on Loans, less other investment r ela ted expenses. 5. Adjusted EBITDA includes earnings before interest, taxes, depreciation, amortization, restructuring costs, share - based payments, impairment of tradenames, and transaction related and other costs. 6. For a reconciliation to GAAP financial measures, please see slide 2.
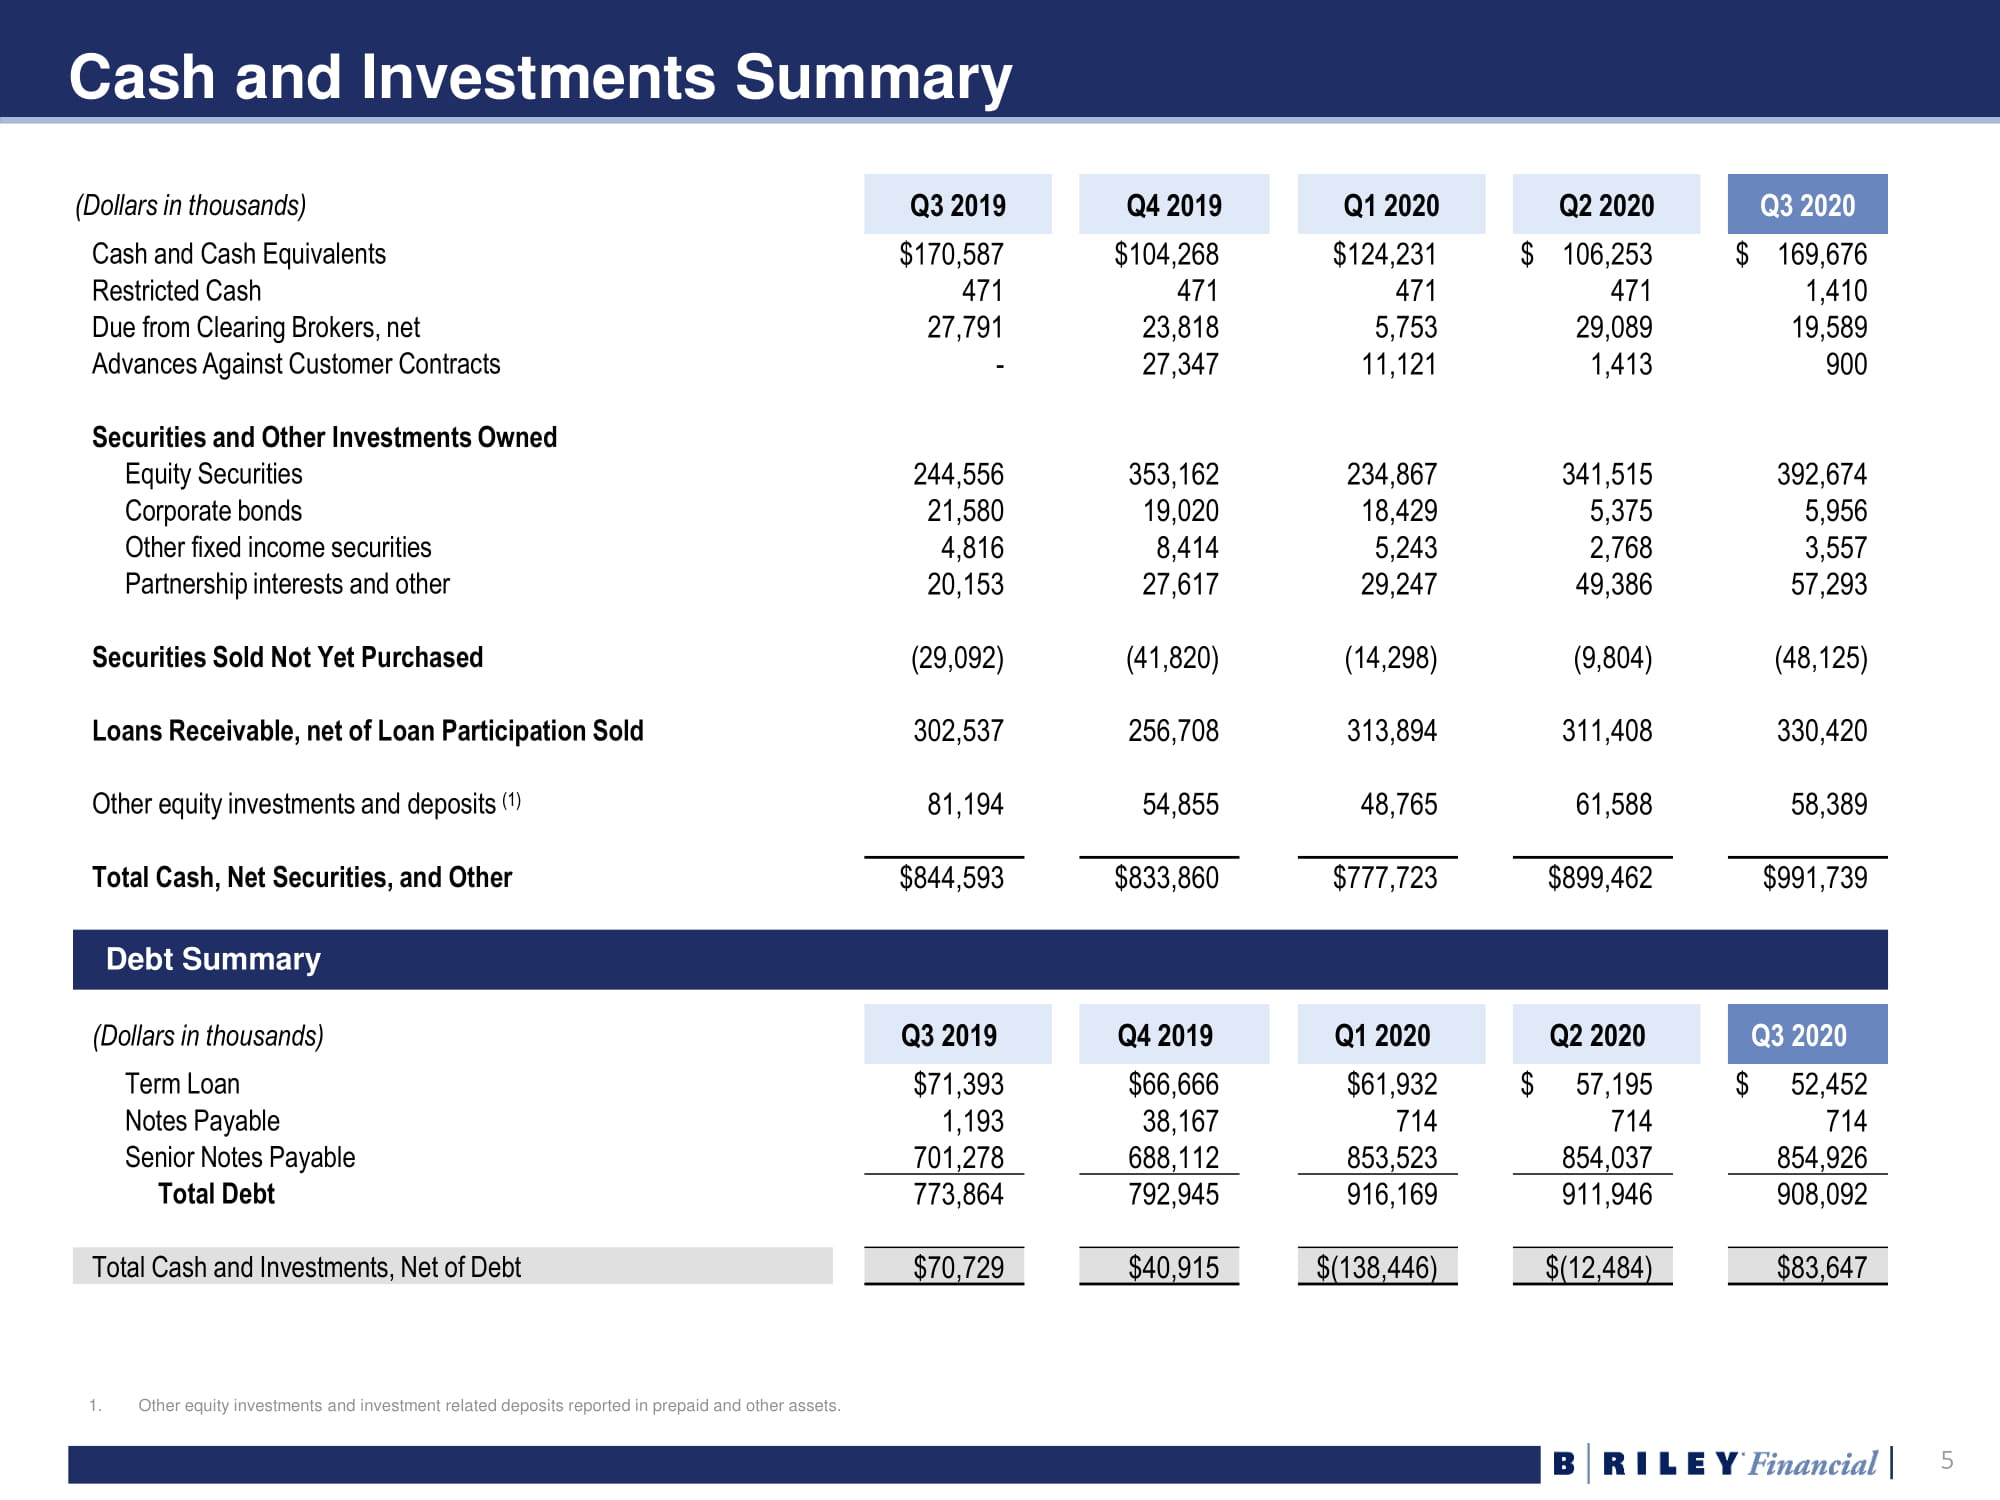
5 5 Cash and Investments Summary (Dollars in thousands) Q3 2019 Q4 2019 Q1 2020 Q2 2020 Q3 2020 Cash and Cash Equivalents $170,587 $104,268 $124,231 $ 106,253 $ 169,676 Restricted Cash 471 471 471 471 1,410 Due from Clearing Brokers, net 27,791 23,818 5,753 29,089 19,589 Advances Against Customer Contracts - 27,347 11,121 1,413 900 Securities and Other Investments Owned Equity Securities 244,556 353,162 234,867 341,515 392,674 Corporate bonds 21,580 19,020 18,429 5,375 5,956 Other fixed income securities 4,816 8,414 5,243 2,768 3,557 Partnership interests and other 20,153 27,617 29,247 49,386 57,293 Securities Sold Not Yet Purchased (29,092) (41,820) (14,298) (9,804) (48,125) Loans Receivable, net of Loan Participation Sold 302,537 256,708 313,894 311,408 330,420 Other equity investments and deposits (1) 81,194 54,855 48,765 61,588 58,389 Total Cash, Net Securities, and Other $844,593 $833,860 $777,723 $899,462 $991,739 (Dollars in thousands) Q3 2019 Q4 2019 Q1 2020 Q2 2020 Q3 2020 Term Loan $71,393 $66,666 $61,932 $ 57,195 $ 52,452 Notes Payable 1,193 38,167 714 714 714 Senior Notes Payable 701,278 688,112 853,523 854,037 854,926 Total Debt 773,864 792,945 916,169 911,946 908,092 Total Cash and Investments, Net of Debt $70,729 $40,915 $(138,446) $(12,484) $83,647 1. Other equity investments and investment related deposits reported in prepaid and other assets. Debt Summary
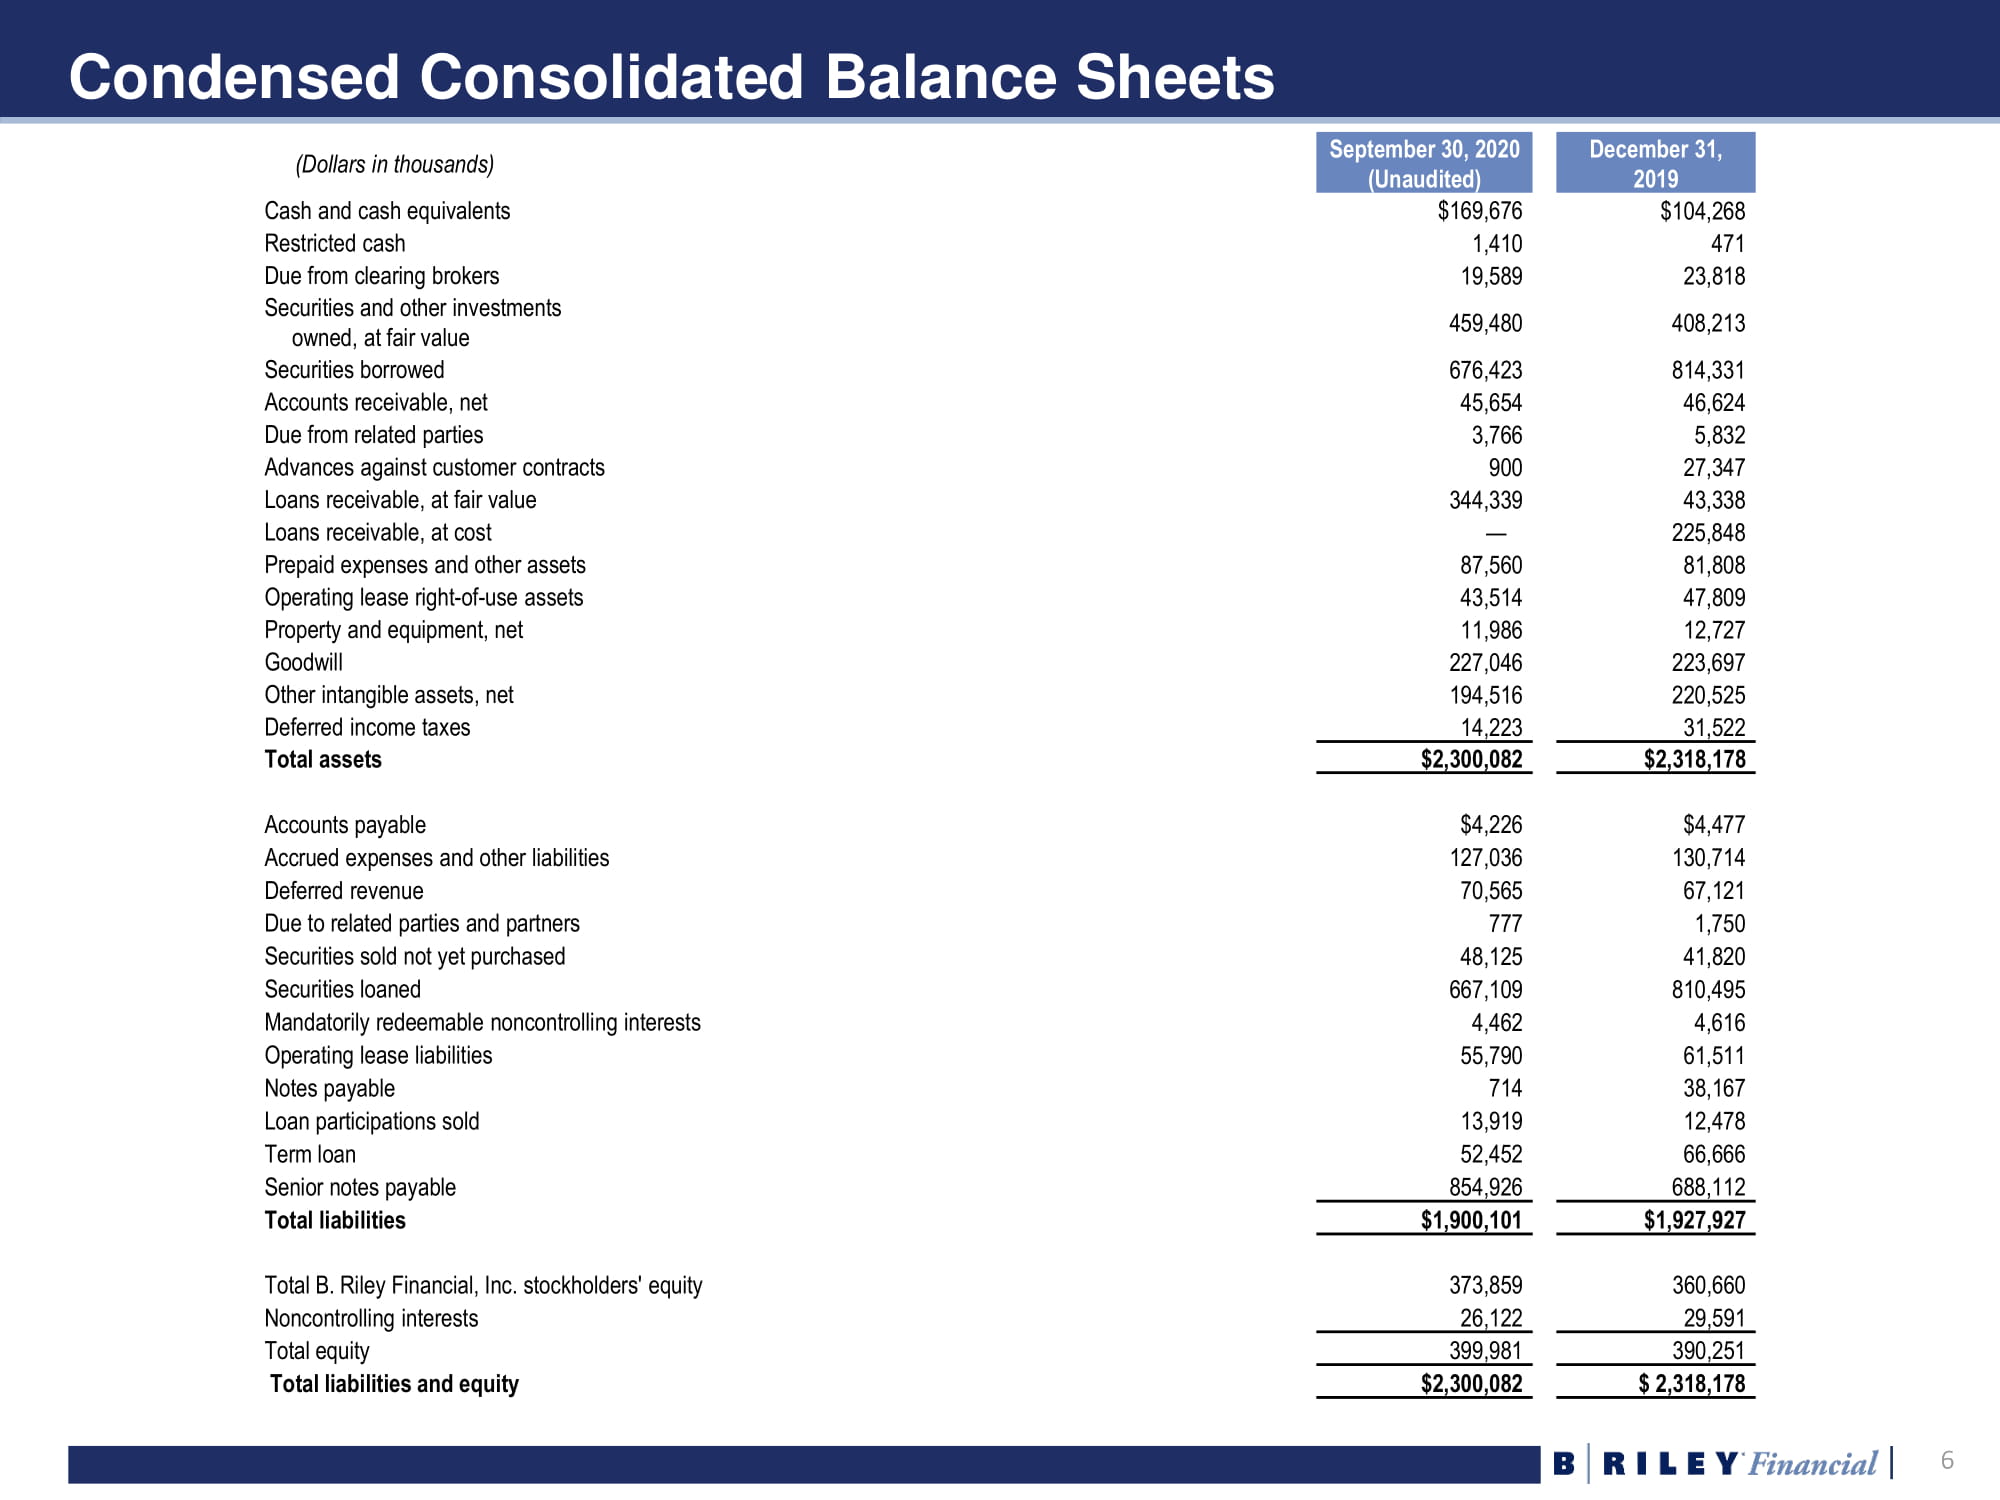
6 6 Condensed Consolidated Balance Sheets (Dollars in thousands) September 30, 2020 (Unaudited) December 31, 2019 Cash and cash equivalents $169,676 $104,268 Restricted cash 1,410 471 Due from clearing brokers 19,589 23,818 Securities and other investments owned, at fair value 459,480 408,213 Securities borrowed 676,423 814,331 Accounts receivable, net 45,654 46,624 Due from related parties 3,766 5,832 Advances against customer contracts 900 27,347 Loans receivable, at fair value 344,339 43,338 Loans receivable, at cost — 225,848 Prepaid expenses and other assets 87,560 81,808 Operating lease right - of - use assets 43,514 47,809 Property and equipment, net 11,986 12,727 Goodwill 227,046 223,697 Other intangible assets, net 194,516 220,525 Deferred income taxes 14,223 31,522 Total assets $2,300,082 $2,318,178 Accounts payable $4,226 $4,477 Accrued expenses and other liabilities 127,036 130,714 Deferred revenue 70,565 67,121 Due to related parties and partners 777 1,750 Securities sold not yet purchased 48,125 41,820 Securities loaned 667,109 810,495 Mandatorily redeemable noncontrolling interests 4,462 4,616 Operating lease liabilities 55,790 61,511 Notes payable 714 38,167 Loan participations sold 13,919 12,478 Term loan 52,452 66,666 Senior notes payable 854,926 688,112 Total liabilities $1,900,101 $1,927,927 Total B. Riley Financial, Inc. stockholders' equity 373,859 360,660 Noncontrolling interests 26,122 29,591 Total equity 399,981 390,251 Total liabilities and equity $2,300,082 $ 2,318,178

7 7 Condensed Consolidated Statements of Income (Unaudited) (Dollars in thousands) Three Months Ended September 30, 2020 2019 Revenues: Services and fees $144,823 $113,111 Trading income and fair value adjustments on loans 31,753 40,268 Interest income - Loans and securities lending 26,026 25,766 Sale of goods 23,651 918 Total revenues 226,253 180,063 Operating expenses: Direct cost of services 23,264 7,936 Cost of goods sold 9,813 911 Selling, general and administrative expenses 97,143 101,092 Restructuring charge 1,557 — Impairment of tradenames — — Interest expense - Securities lending and loan participations sold 10,975 10,273 Total operating expenses 142,752 120,212 Operating income 83,501 59,851 Other income (expense): Interest income 67 361 Income from equity investments 409 1,113 Interest expense (16,374) (12,722) Income before income taxes 67,603 48,553 Provision for income taxes (18,711) (14,409) Net income 48,892 34,144 Net income (loss) attributable to noncontrolling interests 513 (158) Net income attributable to B. Riley Financial, Inc. $48,379 $34,302 Preferred stock dividends 1,088 — Net income available to common shareholders $47,291 $34,302 Basic income per common share $1.86 $1.29 Diluted income per common share $1.75 $1.21 Weighted average basic common shares outstanding 25,446,292 26,556,223 Weighted average diluted common shares outstanding 27,050,448 28,233,423
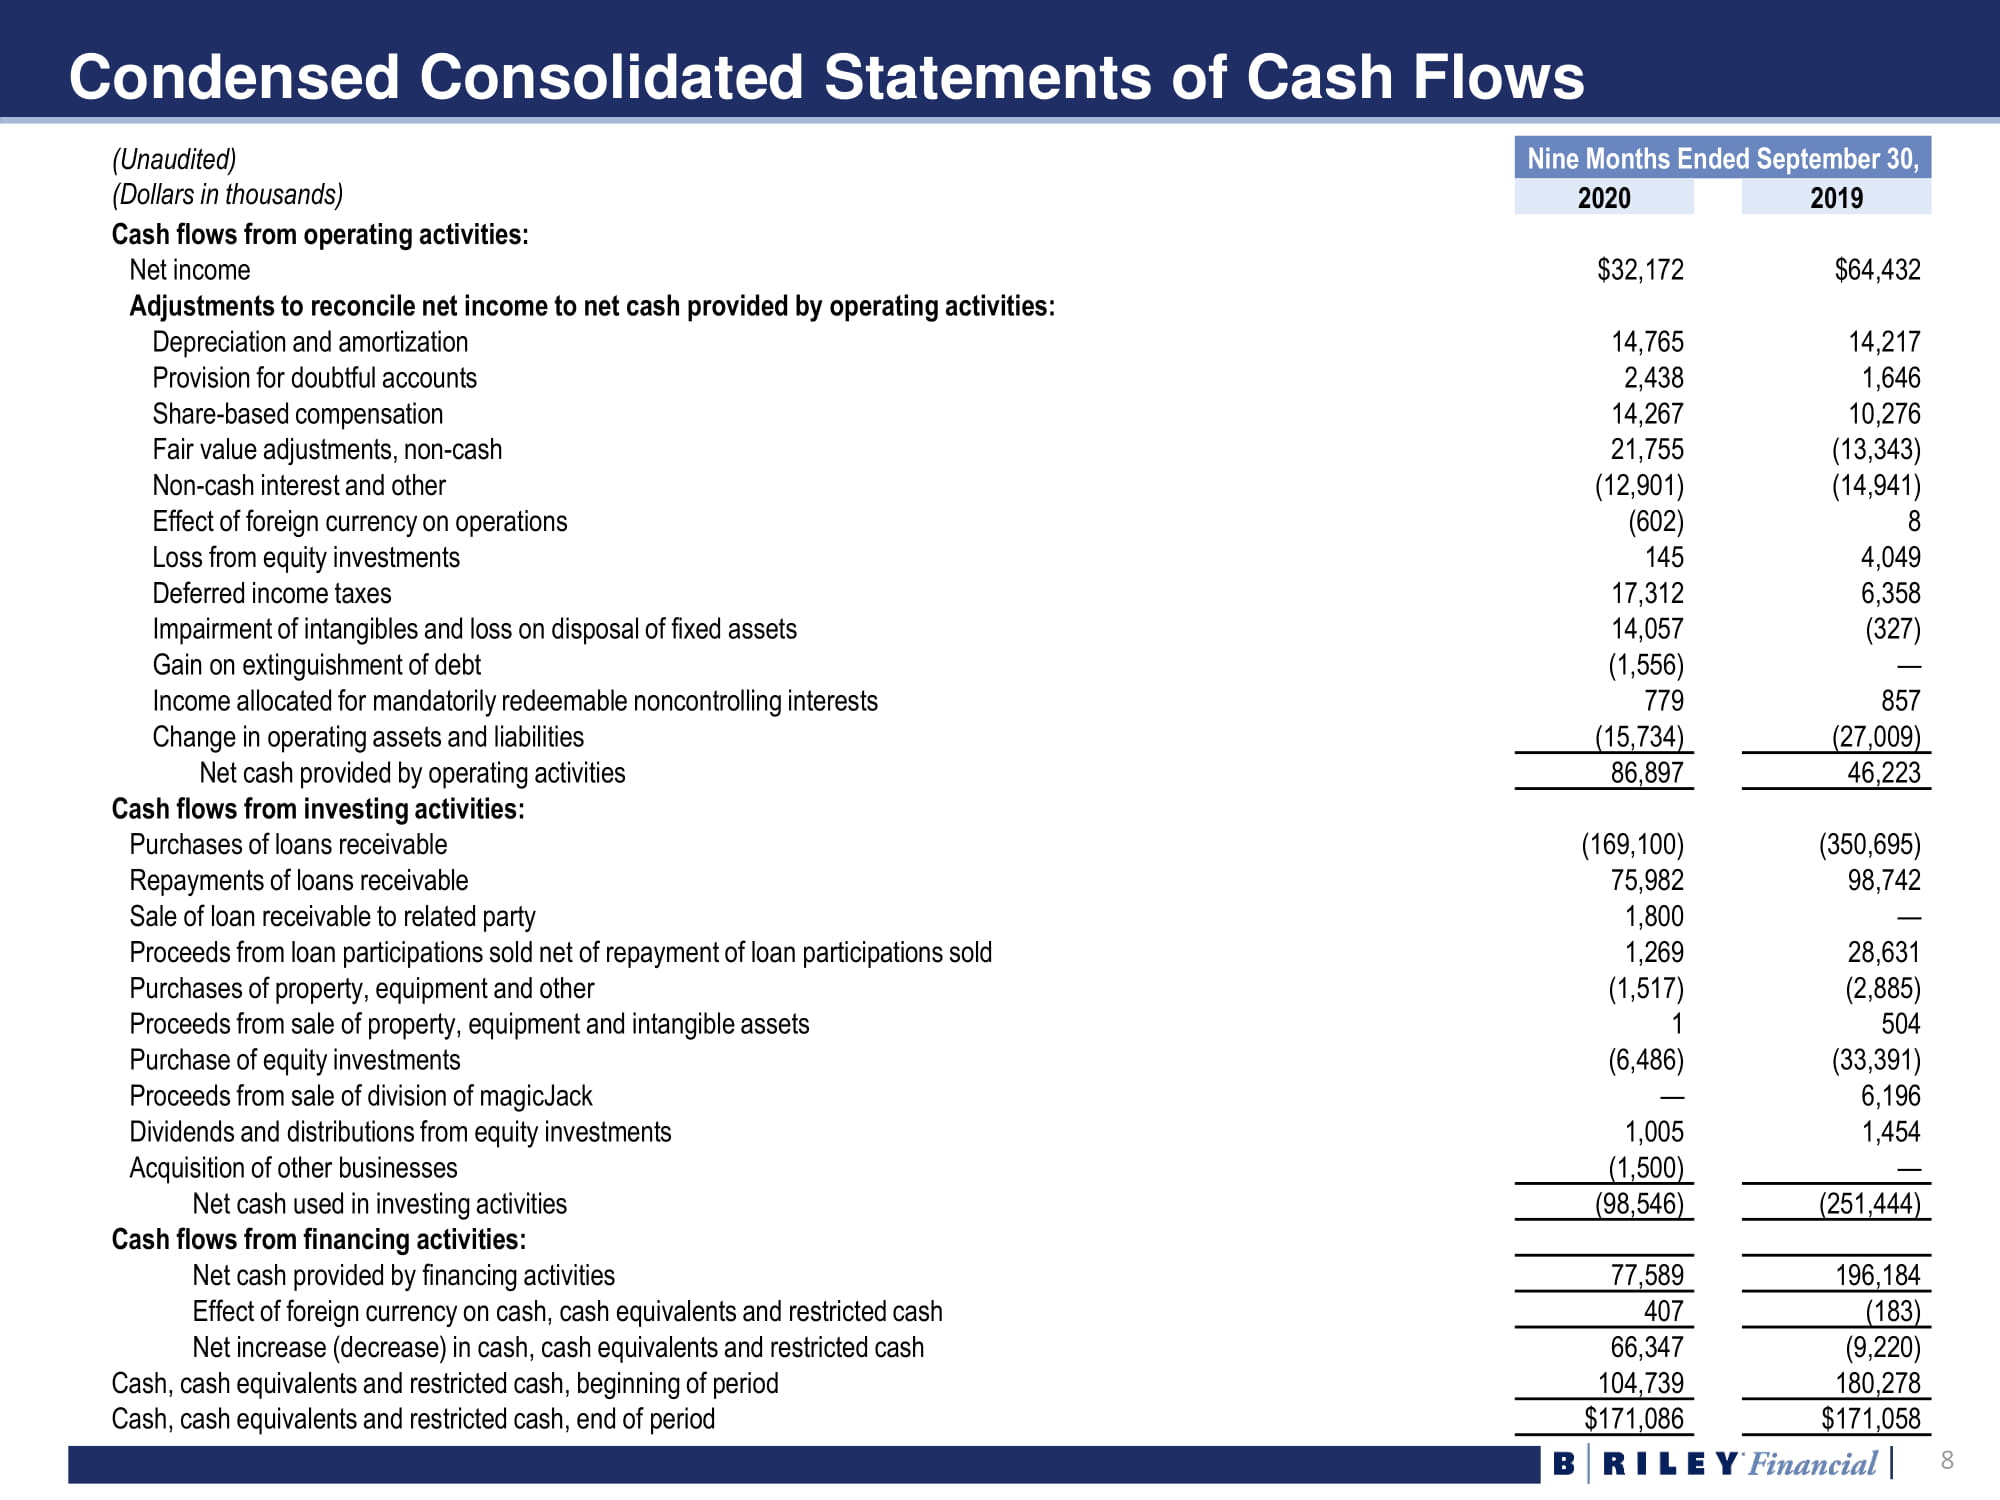
8 8 Condensed Consolidated Statements of Cash Flows (Unaudited) (Dollars in thousands) Nine Months Ended September 30, 2020 2019 Cash flows from operating activities: Net income $32,172 $64,432 Adjustments to reconcile net income to net cash provided by operating activities: Depreciation and amortization 14,765 14,217 Provision for doubtful accounts 2,438 1,646 Share - based compensation 14,267 10,276 Fair value adjustments, non - cash 21,755 (13,343) Non - cash interest and other (12,901) (14,941) Effect of foreign currency on operations (602) 8 Loss from equity investments 145 4,049 Deferred income taxes 17,312 6,358 Impairment of intangibles and loss on disposal of fixed assets 14,057 (327) Gain on extinguishment of debt (1,556) — Income allocated for mandatorily redeemable noncontrolling interests 779 857 Change in operating assets and liabilities (15,734) (27,009) Net cash provided by operating activities 86,897 46,223 Cash flows from investing activities: Purchases of loans receivable (169,100) (350,695) Repayments of loans receivable 75,982 98,742 Sale of loan receivable to related party 1,800 — Proceeds from loan participations sold net of repayment of loan participations sold 1,269 28,631 Purchases of property, equipment and other (1,517) (2,885) Proceeds from sale of property, equipment and intangible assets 1 504 Purchase of equity investments (6,486) (33,391) Proceeds from sale of division of magicJack — 6,196 Dividends and distributions from equity investments 1,005 1,454 Acquisition of other businesses (1,500) — Net cash used in investing activities (98,546) (251,444) Cash flows from financing activities: Net cash provided by financing activities 77,589 196,184 Effect of foreign currency on cash, cash equivalents and restricted cash 407 (183) Net increase (decrease) in cash, cash equivalents and restricted cash 66,347 (9,220) Cash, cash equivalents and restricted cash, beginning of period 104,739 180,278 Cash, cash equivalents and restricted cash, end of period $171,086 $171,058

9 9 Segment Financial Information (Unaudited) (Dollars in thousands) Three Months Ended September 30, 2020 2019 Capital Markets segment: Revenues - Services and fees $89,032 $68,062 Trading income and fair value adjustments on loans 31,753 40,268 Interest income - Loans and securities lending 26,026 25,766 Total revenues 146,811 134,096 Selling, general and administrative expenses (68,442) (70,140) Restructuring charge (1,417) — Interest expense - Securities lending and loan participations sold (10,975) (10,273) Depreciation and amortization (1,166) (1,281) Segment income 64,811 52,402 Auction and Liquidation segment: Revenues - Services and fees 21,473 11,232 Revenues - Sale of goods 22,712 54 Total revenues 44,185 11,286 Direct cost of services (18,373) (2,371) Cost of goods sold (9,046) (126) Selling, general and administrative expenses (4,625) (2,835) Restructuring charge (140) — Depreciation and amortization (1) (1) Segment income 12,000 5,953 Valuation and Appraisal segment: Revenues - Services and fees 9,655 10,818 Selling, general and administrative expenses (6,632) (7,331) Depreciation and amortization (51) (36) Segment income 2,972 3,451 Three Months Ended September 30, 2020 2019 Principal Investments – United Online and magicJack segment: Revenues - Services and fees 20,663 22,999 Revenues - Sale of goods 939 864 Total revenues 21,602 23,863 Direct cost of services (4,891) (5,565) Cost of goods sold (767) (785) Selling, general and administrative expenses (4,840) (5,895) Depreciation and amortization (2,736) (2,956) Restructuring charge — — Segment income 8,368 8,662 Brands segment: Revenues - Services and fees 4,000 — Selling, general and administrative expenses (994) — Depreciation and amortization (714) — Segment income 2,292 — Consolidated operating income from reportable segments $90,443 $70,468

10 10 Definition of US GAAP to Non - GAAP Financial Measures Certain of the information set forth herein, including operating revenue, adjusted EBITDA, operating adjusted EBITDA, and investment adjusted EBITDA may be considered non - GAAP financial measures . B . Riley Financial believes this information is useful to investors because it provides a basis for measuring the Company's available capital resources, the operating performance of its business and its revenues and cash flow, ( i ) excluding in the case of operating revenues, trading income (losses) and fair value adjustments on loans, (ii) excluding in the case of adjusted EBITDA, net interest expense, provisions for or benefit from income taxes, depreciation, amortization, fair value adjustment, restructuring costs, impairment of trade names, stock - based compensation and transaction and other expenses, (iii) excluding in the case of operating adjusted EBITDA, aforementioned adjustments for adjusted EBITDA, trading income (losses) and fair value adjustments on loans, and other investment related expenses, and (iv) in the case of investment adjusted EBITDA this includes trading income (losses) and fair value adjustments on loans, net of other investment related expenses, that would normally be included in the most directly comparable measures calculated and presented in accordance with Generally Accepted Accounting Principles ("GAAP") . In addition, the Company's management uses these non - GAAP financial measures along with the most directly comparable GAAP financial measures in evaluating the Company's operating performance, capital resources and cash flow . Non - GAAP financial measures should not be considered in isolation from, or as a substitute for, financial information presented in compliance with GAAP, and non - financial measures as reported by the Company may not be comparable to similarly titled amounts reported by other companies .