Exhibit 99.2

1 NASDAQ: RILY First Quarter 2022 Supplemental Financial Data April 28, 2022
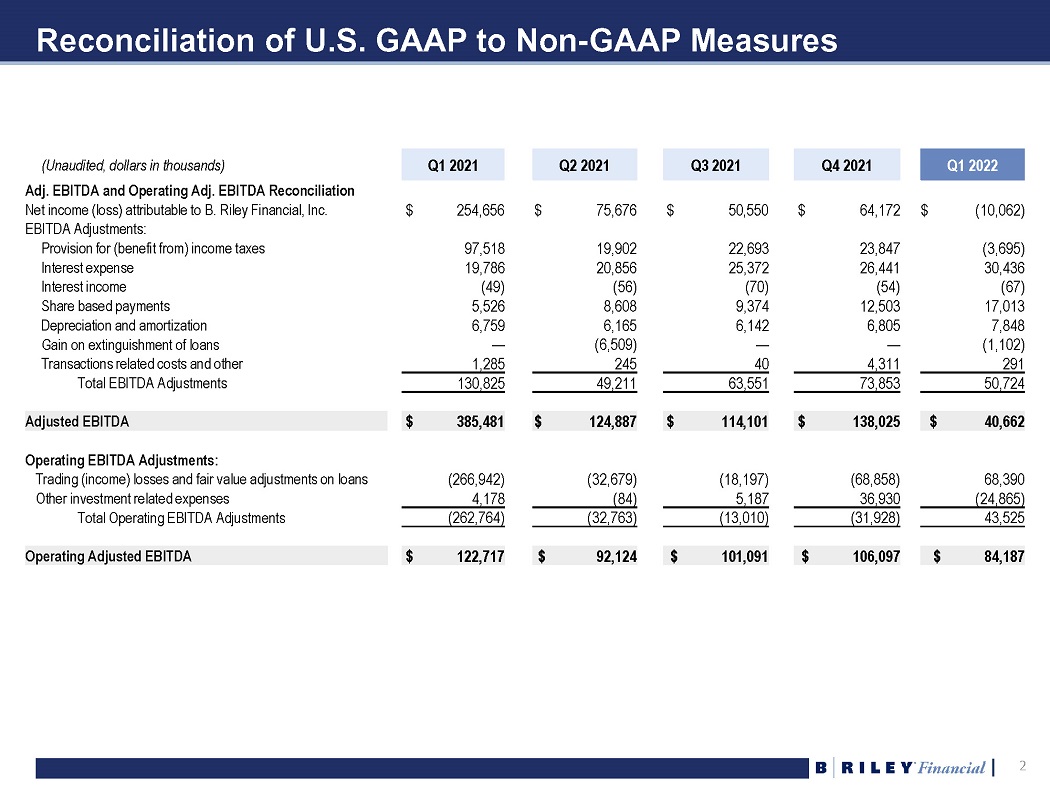
2 2 Reconciliation of U.S. GAAP to Non - GAAP Measures (Unaudited, dollars in thousands) Q1 2021 Q2 2021 Q3 2021 Q4 2021 Q1 2022 Adj. EBITDA and Operating Adj. EBITDA Reconciliation Net income (loss) attributable to B. Riley Financial, Inc. $ 254,656 $ 75,676 $ 50,550 $ 64,172 $ (10,062) EBITDA Adjustments: Provision for (benefit from) income taxes 97,518 19,902 22,693 23,847 (3,695) Interest expense 19,786 20,856 25,372 26,441 30,436 Interest income (49) (56) (70) (54) (67) Share based payments 5,526 8,608 9,374 12,503 17,013 Depreciation and amortization 6,759 6,165 6,142 6,805 7,848 Gain on extinguishment of loans — (6,509) — — (1,102) Transactions related costs and other 1,285 245 40 4,311 291 Total EBITDA Adjustments 130,825 49,211 63,551 73,853 50,724 Adjusted EBITDA $ 385,481 $ 124,887 $ 114,101 $ 138,025 $ 40,662 Operating EBITDA Adjustments: Trading (income) losses and fair value adjustments on loans (266,942) (32,679) (18,197) (68,858) 68,390 Other investment related expenses 4,178 (84) 5,187 36,930 (24,865) Total Operating EBITDA Adjustments (262,764) (32,763) (13,010) (31,928) 43,525 Operating Adjusted EBITDA $ 122,717 $ 92,124 $ 101,091 $ 106,097 $ 84,187
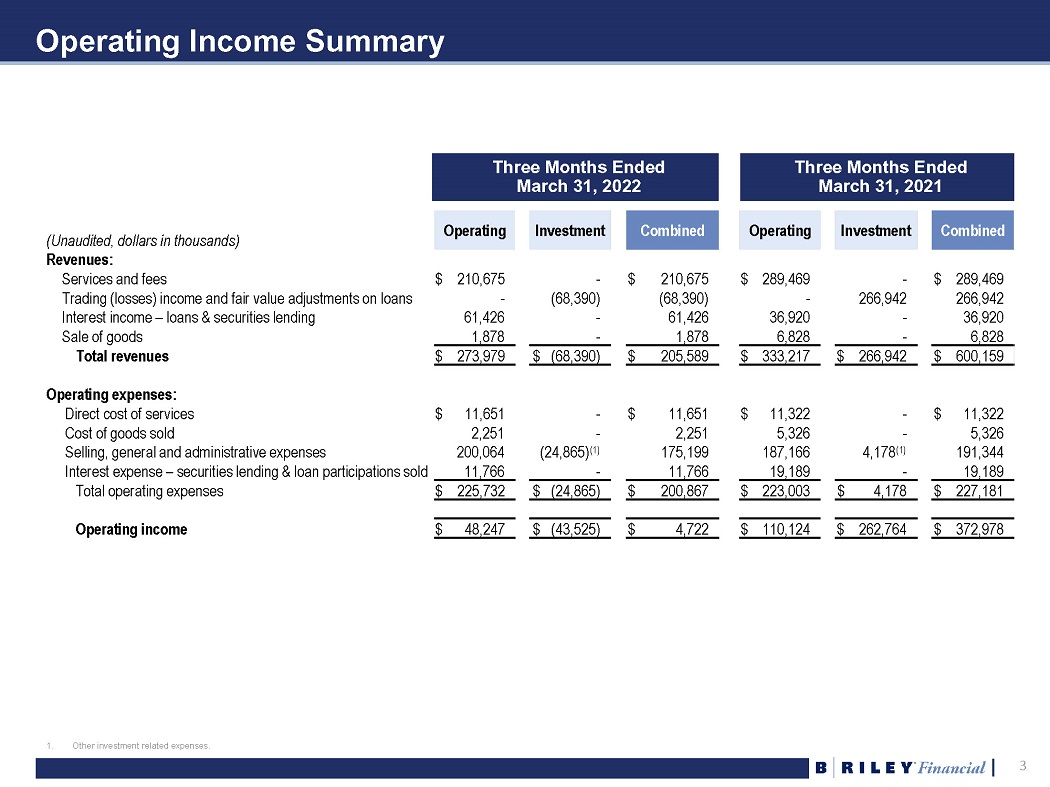
3 3 Operating Income Summary 1. Other investment related expenses. (Unaudited, dollars in thousands) Operating Investment Combined Operating Investment Combined Revenues: Services and fees $ 210,675 - $ 210,675 $ 289,469 - $ 289,469 Trading (losses) income and fair value adjustments on loans - (68,390) (68,390) - 266,942 266,942 Interest income – loans & securities lending 61,426 - 61,426 36,920 - 36,920 Sale of goods 1,878 - 1,878 6,828 - 6,828 Total revenues $ 273,979 $ (68,390) $ 205,589 $ 333,217 $ 266,942 $ 600,159 Operating expenses: Direct cost of services $ 11,651 - $ 11,651 $ 11,322 - $ 11,322 Cost of goods sold 2,251 - 2,251 5,326 - 5,326 Selling, general and administrative expenses 200,064 (24,865) (1) 175,199 187,166 4,178 (1) 191,344 Interest expense – securities lending & loan participations sold 11,766 - 11,766 19,189 - 19,189 Total operating expenses $ 225,732 $ (24,865) $ 200,867 $ 223,003 $ 4,178 $ 227,181 Operating income $ 48,247 $ (43,525) $ 4,722 $ 110,124 $ 262,764 $ 372,978 Three Months Ended March 31, 2022 Three Months Ended March 31, 2021

4 4 Quarterly Operating Revenue and Operating Adjusted EBITDA Operating Revenue and Operating Adjusted EBITDA (1)(3)(5)(6) (Dollars in thousands) Q1 2021 Q2 2021 Q3 2021 Q4 2021 Q1 2022 Operating Revenue (1) $ 333,217 $ 304,091 $ 363,325 $ 353,252 $ 273,979 Investment Gains (Loss) (2) 266,942 32,679 18,197 68,858 (68,390) Total Revenue $ 600,159 $ 336,770 $ 381,522 $ 422,110 $ 205,589 Q1 2021 Q2 2021 Q3 2021 Q4 2021 Q1 2022 Operating Adjusted EBITDA (3) $ 122,717 $ 92,124 $ 101,091 $ 106,097 $ 84,187 Investment Adjusted EBITDA (4) 262,764 32,763 13,010 31,928 (43,525) Adjusted EBITDA (5)(6) $ 385,481 $ 124,887 $ 114,101 $ 138,025 $ 40,662 Quarterly Revenue and Adjusted EBITDA 1. Operating Revenue is defined as the sum of revenues from (i) Service and Fees, (ii) Interest Income - Loans and Securities Lendi ng and (iii) Sales of Goods. 2. Investment Gains (Loss) is defined as Trading Income (Losses) and Fair Value Adjustments on Loans. 3. Operating Adjusted EBITDA is defined as Adjusted EBITDA excluding (i) Trading Income (Losses) and Fair Value Adjustments on L oan s and (ii) other investment related expenses. 4. Investment Adjusted EBITDA is defined as Trading Income (Losses) and Fair Value Adjustments on Loans, less other investment r ela ted expenses. 5. Adjusted EBITDA includes earnings before interest, taxes, depreciation, amortization, restructuring costs, share - based payments, gain on extinguishment of loans, impairment of tradenames, and transaction related and other costs. 6. For a reconciliation to GAAP financial measures, please see slide 2. $333.2M $304.1M $363.3M $353.3M $274.0M $122.7M $92.1M $101.1M $106.1M $84.2M Q1 2021 Q2 2021 Q3 2021 Q4 2021 Q1 2022 Operating Revenue Operating Adj. EBITDA
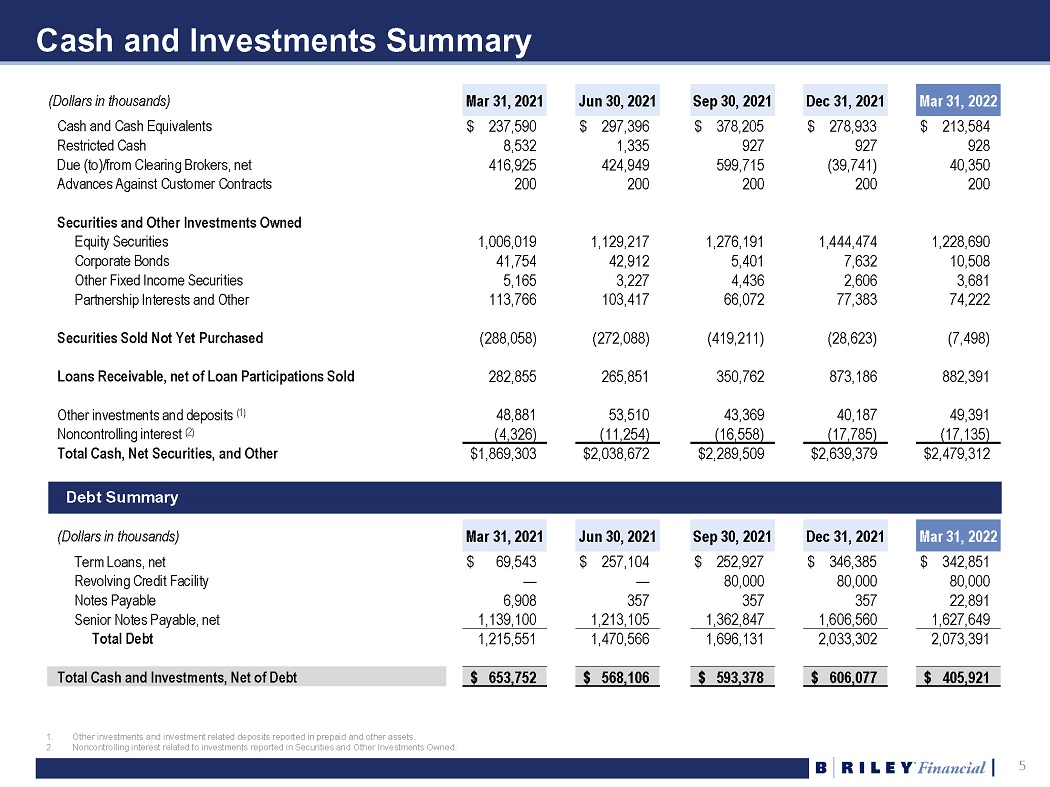
5 5 Cash and Investments Summary (Dollars in thousands) Mar 31, 2021 Jun 30, 2021 Sep 30, 2021 Dec 31, 2021 Mar 31, 2022 Cash and Cash Equivalents $ 237,590 $ 297,396 $ 378,205 $ 278,933 $ 213,584 Restricted Cash 8,532 1,335 927 927 928 Due (to)/from Clearing Brokers, net 416,925 424,949 599,715 (39,741) 40,350 Advances Against Customer Contracts 200 200 200 200 200 Securities and Other Investments Owned Equity Securities 1,006,019 1,129,217 1,276,191 1,444,474 1,228,690 Corporate Bonds 41,754 42,912 5,401 7,632 10,508 Other Fixed Income Securities 5,165 3,227 4,436 2,606 3,681 Partnership Interests and Other 113,766 103,417 66,072 77,383 74,222 Securities Sold Not Yet Purchased (288,058) (272,088) (419,211) (28,623) (7,498) Loans Receivable, net of Loan Participations Sold 282,855 265,851 350,762 873,186 882,391 Other investments and deposits (1) 48,881 53,510 43,369 40,187 49,391 Noncontrolling interest (2) (4,326) (11,254) (16,558) (17,785) (17,135) Total Cash, Net Securities, and Other $1,869,303 $2,038,672 $2,289,509 $2,639,379 $2,479,312 (Dollars in thousands) Mar 31, 2021 Jun 30, 2021 Sep 30, 2021 Dec 31, 2021 Mar 31, 2022 Term Loans, net $ 69,543 $ 257,104 $ 252,927 $ 346,385 $ 342,851 Revolving Credit Facility — — 80,000 80,000 80,000 Notes Payable 6,908 357 357 357 22,891 Senior Notes Payable, net 1,139,100 1,213,105 1,362,847 1,606,560 1,627,649 Total Debt 1,215,551 1,470,566 1,696,131 2,033,302 2,073,391 Total Cash and Investments, Net of Debt $ 653,752 $ 568,106 $ 593,378 $ 606,077 $ 405,921 1. Other investments and investment related deposits reported in prepaid and other assets. 2. Noncontrolling interest related to investments reported in Securities and Other Investments Owned. Debt Summary
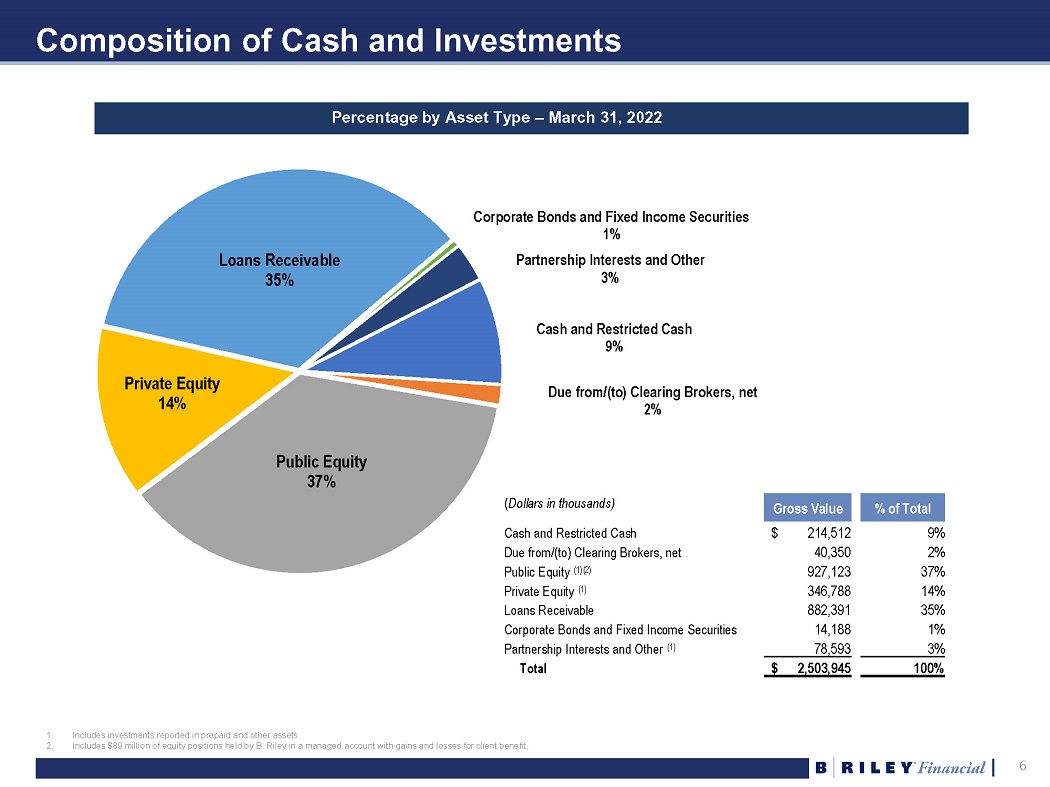
6 6 Composition of Cash and Investments Percentage by Asset Type – March 31, 2022 Cash and Restricted Cash 9% Due from/(to) Clearing Brokers, net 2% Public Equity 37% Private Equity 14% Loans Receivable 35% Corporate Bonds and Fixed Income Securities 1% Partnership Interests and Other 3% ( Dollars in thousands) Gross Value % of Total Cash and Restricted Cash $ 214,512 9% Due from/(to) Clearing Brokers, net 40,350 2% Public Equity (1)(2) 927,123 37% Private Equity (1) 346,788 14% Loans Receivable 882,391 35% Corporate Bonds and Fixed Income Securities 14,188 1% Partnership Interests and Other (1) 78,593 3% Total $ 2,503,945 100% 1. Includes investments reported in prepaid and other assets. 2. Includes $89 million equity positions held by B.Riley in managed account with gains and losses for client benefit
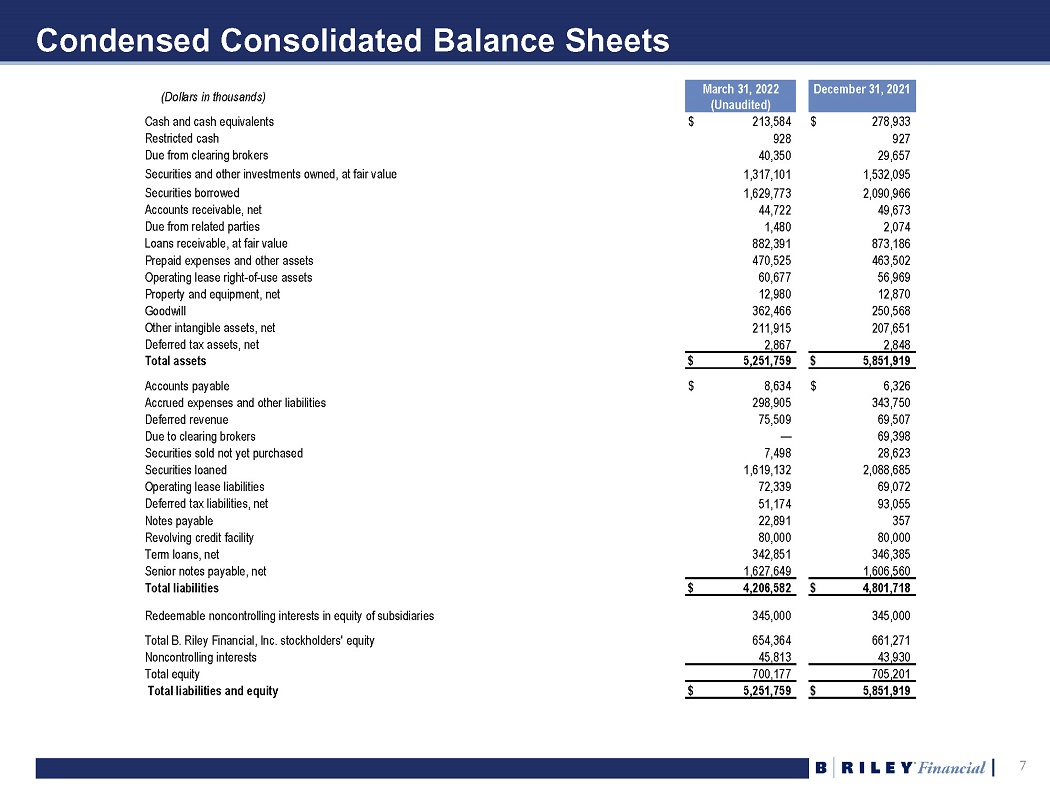
7 7 Condensed Consolidated Balance Sheets (Dollars in thousands) March 31, 2022 (Unaudited) December 31, 2021 Cash and cash equivalents $ 213,584 $ 278,933 Restricted cash 928 927 Due from clearing brokers 40,350 29,657 Securities and other investments owned, at fair value 1,317,101 1,532,095 Securities borrowed 1,629,773 2,090,966 Accounts receivable, net 44,722 49,673 Due from related parties 1,480 2,074 Loans receivable, at fair value 882,391 873,186 Prepaid expenses and other assets 470,525 463,502 Operating lease right - of - use assets 60,677 56,969 Property and equipment, net 12,980 12,870 Goodwill 362,466 250,568 Other intangible assets, net 211,915 207,651 Deferred tax assets, net 2,867 2,848 Total assets $ 5,251,759 $ 5,851,919 Accounts payable $ 8,634 $ 6,326 Accrued expenses and other liabilities 298,905 343,750 Deferred revenue 75,509 69,507 Due to clearing brokers — 69,398 Securities sold not yet purchased 7,498 28,623 Securities loaned 1,619,132 2,088,685 Operating lease liabilities 72,339 69,072 Deferred tax liabilities, net 51,174 93,055 Notes payable 22,891 357 Revolving credit facility 80,000 80,000 Term loans, net 342,851 346,385 Senior notes payable, net 1,627,649 1,606,560 Total liabilities $ 4,206,582 $ 4,801,718 Redeemable noncontrolling interests in equity of subsidiaries 345,000 345,000 Total B. Riley Financial, Inc. stockholders' equity 654,364 661,271 Noncontrolling interests 45,813 43,930 Total equity 700,177 705,201 Total liabilities and equity $ 5,251,759 $ 5,851,919

8 8 Consolidated Statements of Operations (Unaudited, dollars in thousands, except share data) Three Months Ended March 31, 2022 2021 Revenues: Services and fees $ 210,675 $ 289,469 Trading (losses) income and fair value adjustments on loans (68,390) 266,942 Interest income - Loans and securities lending 61,426 36,920 Sale of goods 1,878 6,828 Total revenues 205,589 600,159 Operating expenses: Direct cost of services 11,651 11,322 Cost of goods sold 2,251 5,326 Selling, general and administrative expenses 175,199 191,344 Interest expense - Securities lending and loan participations sold 11,766 19,189 Total operating expenses 200,867 227,181 Operating income 4,722 372,978 Other income (expense): Interest income 67 49 Change in fair value of financial instruments and other 5,981 — Income from equity investments 6,775 875 Interest expense (30,436) (19,786) (Loss) income before income taxes (12,891) 354,116 Benefit from (provision for) income taxes 3,695 (97,518) Net (loss) income (9,196) 256,598 Net income attributable to noncontrolling interests 866 1,942 Net (loss) income attributable to B. Riley Financial, Inc. $ (10,062) $ 254,656 Preferred stock dividends 2,002 1,749 Net (loss) income available to common shareholders $ (12,064) $ 252,907 Basic (loss) income per common share $ (0.43) $ 9.38 Diluted (loss) income per common share $ (0.43) $ 8.81 Weighted average basic common shares outstanding 27,855,033 26,972,275 Weighted average diluted common shares outstanding 27,855,033 28,710,368
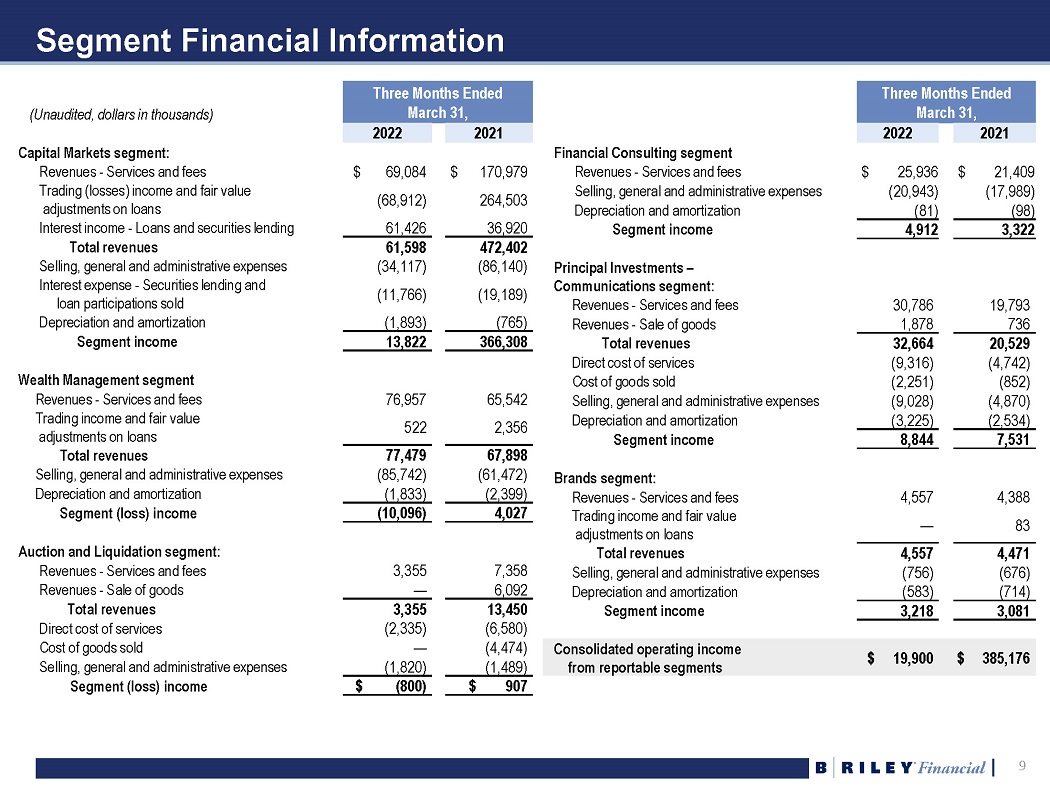
9 9 Segment Financial Information (Unaudited, dollars in thousands) Three Months Ended March 31, 2022 2021 Capital Markets segment: Revenues - Services and fees $ 69,084 $ 170,979 Trading (losses) income and fair value adjustments on loans (68,912) 264,503 Interest income - Loans and securities lending 61,426 36,920 Total revenues 61,598 472,402 Selling, general and administrative expenses (34,117) (86,140) Interest expense - Securities lending and loan participations sold (11,766) (19,189) Depreciation and amortization (1,893) (765) Segment income 13,822 366,308 Wealth Management segment Revenues - Services and fees 76,957 65,542 Trading income and fair value adjustments on loans 522 2,356 Total revenues 77,479 67,898 Selling, general and administrative expenses (85,742) (61,472) Depreciation and amortization (1,833) (2,399) Segment (loss) income (10,096) 4,027 Auction and Liquidation segment: Revenues - Services and fees 3,355 7,358 Revenues - Sale of goods — 6,092 Total revenues 3,355 13,450 Direct cost of services (2,335) (6,580) Cost of goods sold — (4,474) Selling, general and administrative expenses (1,820) (1,489) Segment (loss) income $ (800) $ 907 Three Months Ended March 31 , 2022 2021 Financial Consulting segment Revenues - Services and fees $ 25,936 $ 21,409 Selling, general and administrative expenses (20,943) (17,989) Depreciation and amortization (81) (98) Segment income 4,912 3,322 Principal Investments – Communications segment: Revenues - Services and fees 30,786 19,793 Revenues - Sale of goods 1,878 736 Total revenues 32,664 20,529 Direct cost of services (9,316) (4,742) Cost of goods sold (2,251) (852) Selling, general and administrative expenses (9,028) (4,870) Depreciation and amortization (3,225) (2,534) Segment income 8,844 7,531 Brands segment: Revenues - Services and fees 4,557 4,388 Trading income and fair value adjustments on loans — 83 Total revenues 4,557 4,471 Selling, general and administrative expenses (756) (676) Depreciation and amortization (583) (714) Segment income 3,218 3,081 Consolidated operating income from reportable segments $ 19,900 $ 385,176
10 10 Definition of US GAAP to Non - GAAP Financial Measures Certain of the information set forth herein, including operating revenue, adjusted EBITDA, operating adjusted EBITDA, and investment adjusted EBITDA may be considered non - GAAP financial measures . B . Riley Financial believes this information is useful to investors because it provides a basis for measuring the Company's available capital resources, the operating performance of its business and its revenues and cash flow, (i) excluding in the case of operating revenues, trading income (losses) and fair value adjustments on loans, (ii) excluding in the case of adjusted EBITDA, net interest expense, provisions for or benefit from income taxes, depreciation, amortization, fair value adjustment, restructuring costs, gain on extinguishment of loans, impairment of trade names, stock - based compensation and transaction and other expenses, (iii) excluding in the case of operating adjusted EBITDA, aforementioned adjustments for adjusted EBITDA, as well as trading income (losses) and fair value adjustments on loans, and other investment related expenses, and (iv) in the case of investment adjusted EBITDA this includes trading income (losses) and fair value adjustments on loans, net of other investment related expenses, that would normally be included in the most directly comparable measures calculated and presented in accordance with Generally Accepted Accounting Principles ("GAAP") . In addition, the Company's management uses these non - GAAP financial measures along with the most directly comparable GAAP financial measures in evaluating the Company's operating performance, capital resources and cash flow . Non - GAAP financial measures should not be considered in isolation from, or as a substitute for, financial information presented in compliance with GAAP, and non - financial measures as reported by the Company may not be comparable to similarly titled amounts reported by other companies .