Exhibit 99.2

1 NASDAQ: RILY Second Quarter 2022 Supplemental Financial Data July 28, 2022
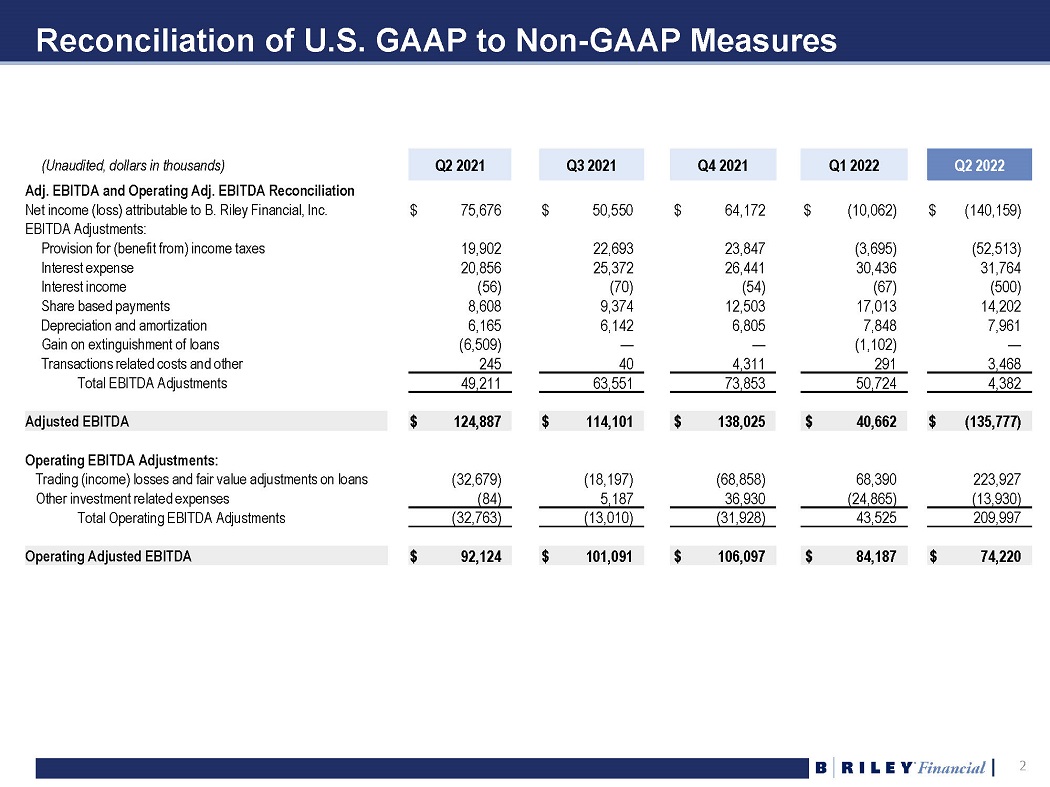
Reconciliation of U.S. GAAP to Non - GAAP Measures 2 (Unaudited, dollars in thousands) Q2 2021 Q3 2021 Q4 2021 Q1 2022 Q2 2022 Adj. EBITDA and Operating Adj. EBITDA Reconciliation Net income (loss) attributable to B. Riley Financial, Inc. $ 75,676 $ 50,550 $ 64,172 $ (10,062) $ (140,159) EBITDA Adjustments: Provision for (benefit from) income taxes 19,902 22,693 23,847 (3,695) (52,513) Interest expense 20,856 25,372 26,441 30,436 31,764 Interest income (56) (70) (54) (67) (500) Share based payments 8,608 9,374 12,503 17,013 14,202 Depreciation and amortization 6,165 6,142 6,805 7,848 7,961 Gain on extinguishment of loans (6,509) — — (1,102) — Transactions related costs and other 245 40 4,311 291 3,468 Total EBITDA Adjustments 49,211 63,551 73,853 50,724 4,382 Adjusted EBITDA $ 124,887 $ 114,101 $ 138,025 $ 40,662 $ (135,777) Operating EBITDA Adjustments: Trading (income) losses and fair value adjustments on loans (32,679) (18,197) (68,858) 68,390 223,927 Other investment related expenses (84) 5,187 36,930 (24,865) (13,930) Total Operating EBITDA Adjustments (32,763) (13,010) (31,928) 43,525 209,997 Operating Adjusted EBITDA $ 92,124 $ 101,091 $ 106,097 $ 84,187 $ 74,220

Operating Income Summary 3 1. Other investment related expenses. (Unaudited, dollars in thousands) Operating Investment Combined Operating Investment Combined Revenues: Services and fees $ 266,143 — $ 266,143 $ 200,905 — $ 200,905 Trading income (losses) and fair value adjustments on loans — 32,679 32,679 — (223,927) (223,927) Interest income – loans & securities lending 25,491 — 25,491 63,835 — 63,835 Sale of goods 12,457 — 12,457 1,887 — 1,887 Total revenues $304,091 $ 32,679 $ 336,770 $ 266,627 $ (223,927) $ 42,700 Operating expenses: Direct cost of services $ 12,094 — $ 12,094 $ 17,785 — $ 17,785 Cost of goods sold 3,626 — 3,626 1,994 — 1,994 Selling, general and administrative expenses 200,006 (84) (1) 199,922 181,066 (13,930) (1) 167,136 Interest expense – securities lending & loan participations sold 10,983 — 10,983 14,544 — 14,544 Total operating expenses $ 226,709 $ (84) $ 226,625 $ 215,389 $ (13,930) $ 201,459 Operating income (loss) $ 77,382 $ 32,763 $ 110,145 $ 51,238 $ (209,997) $ (158,759) Three Months Ended June 30, 2021 Three Months Ended June 30, 2022
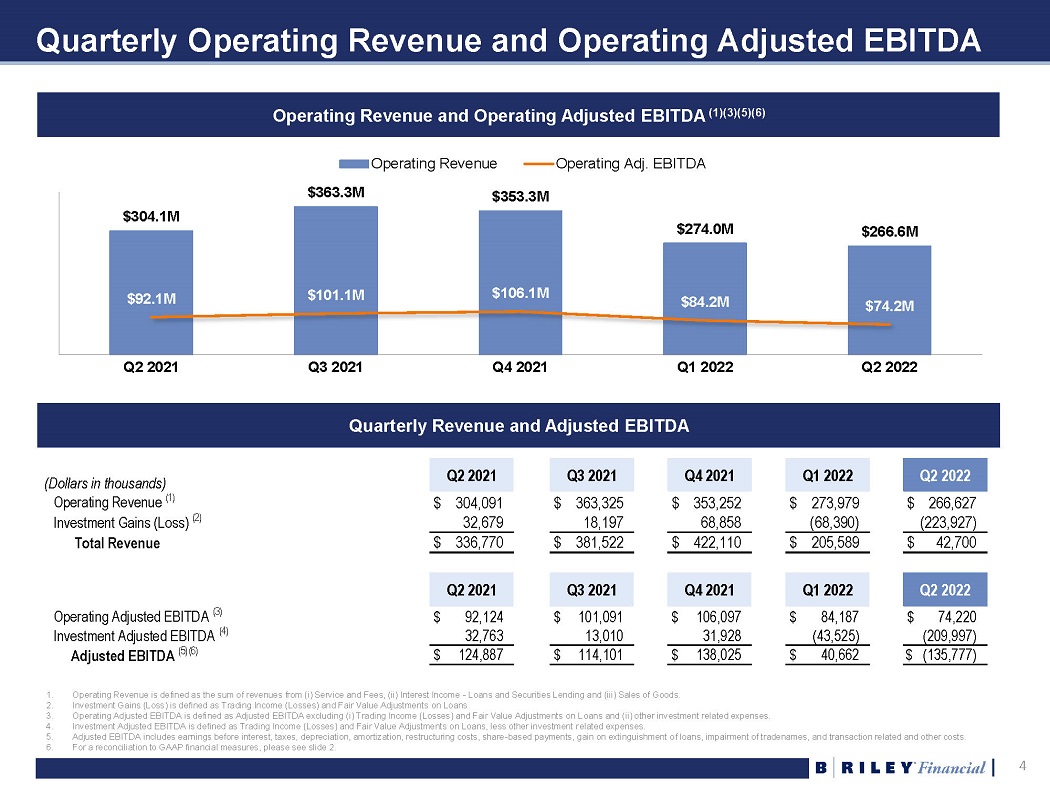
Quarterly Operating Revenue and Operating Adjusted EBITDA Operating Revenue and Operating Adjusted EBITDA (1)(3)(5)(6) (Dollars in thousands) Q2 2021 Q3 2021 Q4 2021 Q1 2022 Q2 2022 Operating Revenue (1) $ 304,091 $ 363,325 $ 353,252 $ 273,979 $ 266,627 Investment Gains (Loss) (2) 32,679 18,197 68,858 (68,390) (223,927) Total Revenue $ 336,770 $ 381,522 $ 422,110 $ 205,589 $ 42,700 Q2 2021 Q3 2021 Q4 2021 Q1 2022 Q2 2022 Operating Adjusted EBITDA (3) $ 92,124 $ 101,091 $ 106,097 $ 84,187 $ 74,220 Investment Adjusted EBITDA (4) 32,763 13,010 31,928 (43,525) (209,997) Adjusted EBITDA (5)(6) $ 124,887 $ 114,101 $ 138,025 $ 40,662 $ (135,777) Quarterly Revenue and Adjusted EBITDA 1. 2. 3. 4. 5. Operating Revenue is defined as the sum of revenues from (i) Service and Fees, (ii) Interest Income - Loans and Securities Lending and (iii) Sales of Goods. Investment Gains (Loss) is defined as Trading Income (Losses) and Fair Value Adjustments on Loans. Operating Adjusted EBITDA is defined as Adjusted EBITDA excluding (i) Trading Income (Losses) and Fair Value Adjustments on Loans and (ii) other investment related expenses. Investment Adjusted EBITDA is defined as Trading Income (Losses) and Fair Value Adjustments on Loans, less other investment related expenses. Adjusted EBITDA includes earnings before interest, taxes, depreciation, amortization, restructuring costs, share - based payments, gain on extinguishment of loans, impairment of tradenames, and transaction related and other costs. $304.1M $363.3M $353.3M $274.0M $266.6M $92.1M $101.1M $106.1M $84.2M $74.2M Q2 2021 Q3 2021 Q4 2021 Q1 2022 Q2 2022 Operating Revenue Operating Adj. EBITDA 6. For a reconciliation to GAAP financial measures, please see slide 2. 4
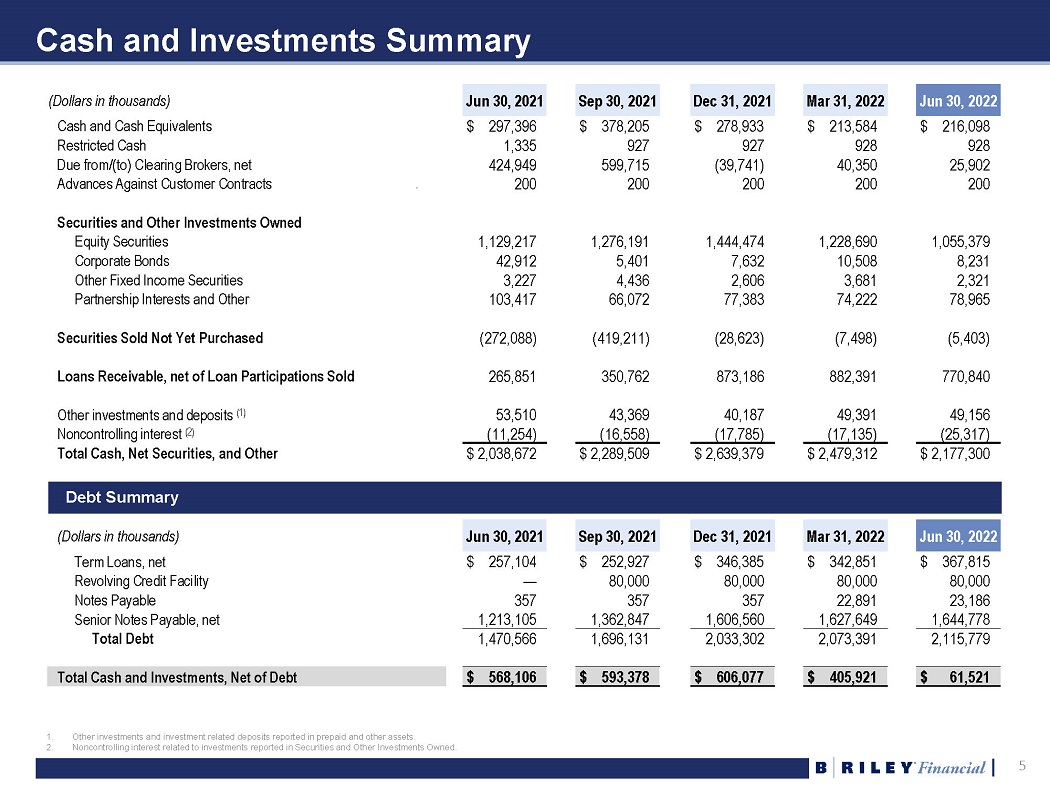
Cash and Investments Summary 5 (Dollars in thousands) Jun 30, 2021 Sep 30, 2021 Dec 31, 2021 Mar 31, 2022 Jun 30, 2022 Cash and Cash Equivalents $ 297,396 $ 378,205 $ 278,933 $ 213,584 $ 216,098 Restricted Cash 1,335 927 927 928 928 Due from/(to) Clearing Brokers, net 424,949 599,715 (39,741) 40,350 25,902 Advances Against Customer Contracts 200 200 200 200 200 Securities and Other Investments Owned Equity Securities 1,129,217 1,276,191 1,444,474 1,228,690 1,055,379 Corporate Bonds 42,912 5,401 7,632 10,508 8,231 Other Fixed Income Securities 3,227 4,436 2,606 3,681 2,321 Partnership Interests and Other 103,417 66,072 77,383 74,222 78,965 Securities Sold Not Yet Purchased (272,088) (419,211) (28,623) (7,498) (5,403) Loans Receivable, net of Loan Participations Sold 265,851 350,762 873,186 882,391 770,840 Other investments and deposits (1) 53,510 43,369 40,187 49,391 49,156 Noncontrolling interest (2) (11,254) (16,558) (17,785) (17,135) (25,317) Total Cash, Net Securities, and Other $ 2,038,672 $ 2,289,509 $ 2,639,379 $ 2,479,312 $ 2,177,300 Debt Summary (Dollars in thousands) Jun 30, 2021 Sep 30, 2021 Dec 31, 2021 Mar 31, 2022 Jun 30, 2022 Term Loans, net $ 257,104 $ 252,927 $ 346,385 $ 342,851 $ 367,815 Revolving Credit Facility — 80,000 80,000 80,000 80,000 Notes Payable 357 357 357 22,891 23,186 Senior Notes Payable, net 1,213,105 1,362,847 1,606,560 1,627,649 1,644,778 Total Debt 1,470,566 1,696,131 2,033,302 2,073,391 2,115,779 Total Cash and Investments, Net of Debt $ 568,106 $ 593,378 $ 606,077 $ 405,921 $ 61,521 1. 2. Other investments and investment related deposits reported in prepaid and other assets. Noncontrolling interest related to investments reported in Securities and Other Investments Owned.
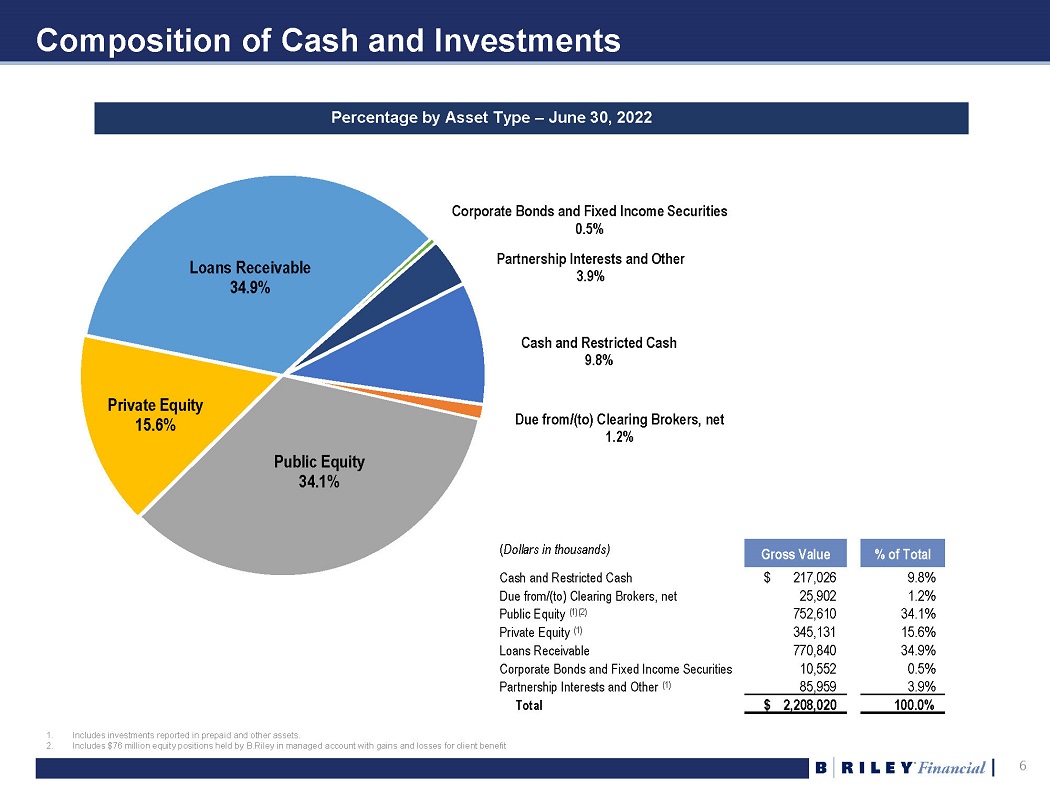
Composition of Cash and Investments Percentage by Asset Type – June 30, 2022 Cash and Restricted Cash 9.8% 6 Due from/(to) Clearing Brokers, net 1.2% Public Equity 34.1% Private Equity 15.6% Loans Receivable 34.9% Corporate Bonds and Fixed Income Securities 0.5% Partnership Interests and Other 3.9% ( Dollars in thousands) Gross Value % of Total Cash and Restricted Cash $ 217,026 9.8% Due from/(to) Clearing Brokers, net 25,902 1.2% Public Equity (1)(2) 752,610 34.1% Private Equity (1) 345,131 15.6% Loans Receivable 770,840 34.9% Corporate Bonds and Fixed Income Securities 10,552 0.5% Partnership Interests and Other (1) 85,959 3.9% Total $ 2,208,020 100.0% 1. 2. Includes investments reported in prepaid and other assets. Includes $76 million equity positions held by B.Riley in managed account with gains and losses for client benefit
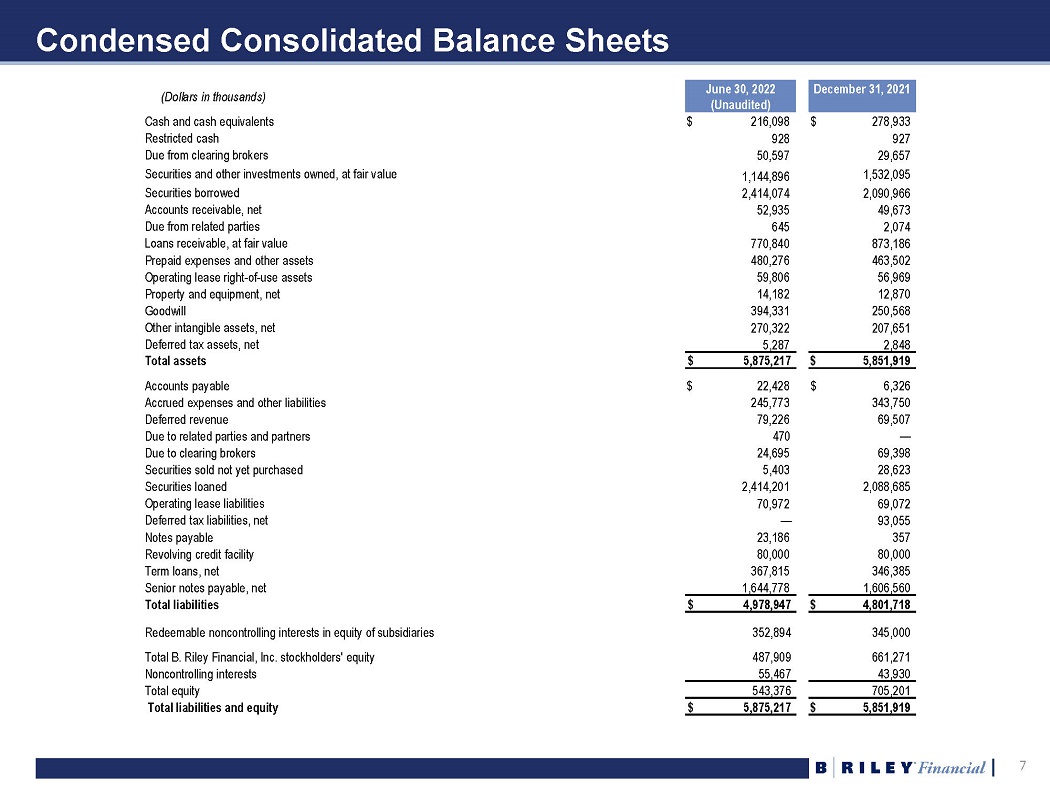
Condensed Consolidated Balance Sheets 7 (Dollars in thousands) June 30, 2022 (Unaudited) December 31, 2021 Cash and cash equivalents $ 216,098 $ 278,933 Restricted cash 928 927 Due from clearing brokers 50,597 29,657 Securities and other investments owned, at fair value 1,144,896 1,532,095 Securities borrowed 2,414,074 2,090,966 Accounts receivable, net 52,935 49,673 Due from related parties 645 2,074 Loans receivable, at fair value 770,840 873,186 Prepaid expenses and other assets 480,276 463,502 Operating lease right - of - use assets 59,806 56,969 Property and equipment, net 14,182 12,870 Goodwill 394,331 250,568 Other intangible assets, net 270,322 207,651 Deferred tax assets, net 5,287 2,848 Total assets $ 5,875,217 $ 5,851,919 Accounts payable $ 22,428 $ 6,326 Accrued expenses and other liabilities 245,773 343,750 Deferred revenue 79,226 69,507 Due to related parties and partners 470 — Due to clearing brokers 24,695 69,398 Securities sold not yet purchased 5,403 28,623 Securities loaned 2,414,201 2,088,685 Operating lease liabilities 70,972 69,072 Deferred tax liabilities, net — 93,055 Notes payable 23,186 357 Revolving credit facility 80,000 80,000 Term loans, net 367,815 346,385 Senior notes payable, net 1,644,778 1,606,560 Total liabilities $ 4,978,947 $ 4,801,718 Redeemable noncontrolling interests in equity of subsidiaries 352,894 345,000 Total B. Riley Financial, Inc. stockholders' equity 487,909 661,271 Noncontrolling interests 55,467 43,930 Total equity 543,376 705,201 Total liabilities and equity $ 5,875,217 $ 5,851,919
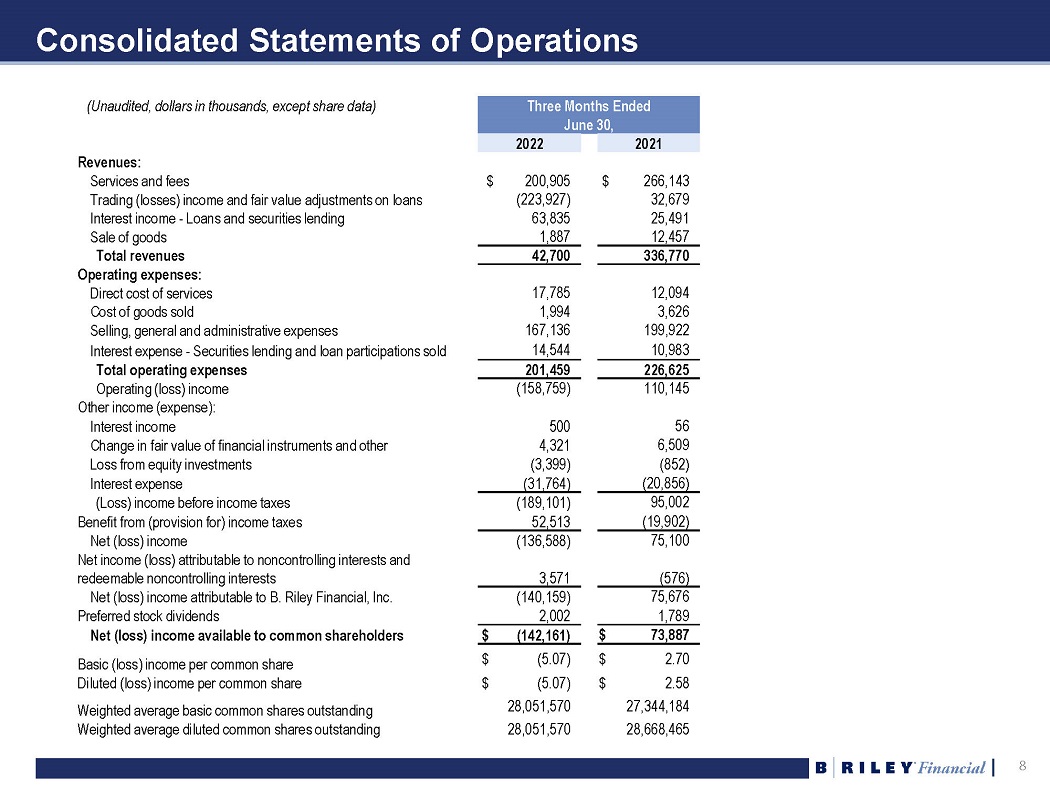
Consolidated Statements of Operations 8 (Unaudited, dollars in thousands, except share data) Three Months Ended June 30, 2022 2021 Revenues: Services and fees $ 200,905 $ 266,143 Trading (losses) income and fair value adjustments on loans (223,927) 32,679 Interest income - Loans and securities lending 63,835 25,491 Sale of goods 1,887 12,457 Total revenues 42,700 336,770 Operating expenses: Direct cost of services 17,785 12,094 Cost of goods sold 1,994 3,626 Selling, general and administrative expenses 167,136 199,922 Interest expense - Securities lending and loan participations sold 14,544 10,983 Total operating expenses 201,459 226,625 Operating (loss) income (158,759) 110,145 Other income (expense): Interest income 500 56 Change in fair value of financial instruments and other 4,321 6,509 Loss from equity investments (3,399) (852) Interest expense (31,764) (20,856) (Loss) income before income taxes (189,101) 95,002 Benefit from (provision for) income taxes 52,513 (19,902) Net (loss) income (136,588) 75,100 Net income (loss) attributable to noncontrolling interests and redeemable noncontrolling interests 3,571 (576) Net (loss) income attributable to B. Riley Financial, Inc. (140,159) 75,676 Preferred stock dividends 2,002 1,789 Net (loss) income available to common shareholders $ (142,161) $ 73,887 Basic (loss) income per common share $ (5.07) $ 2.70 Diluted (loss) income per common share $ (5.07) $ 2.58 Weighted average basic common shares outstanding 28,051,570 27,344,184 Weighted average diluted common shares outstanding 28,051,570 28,668,465
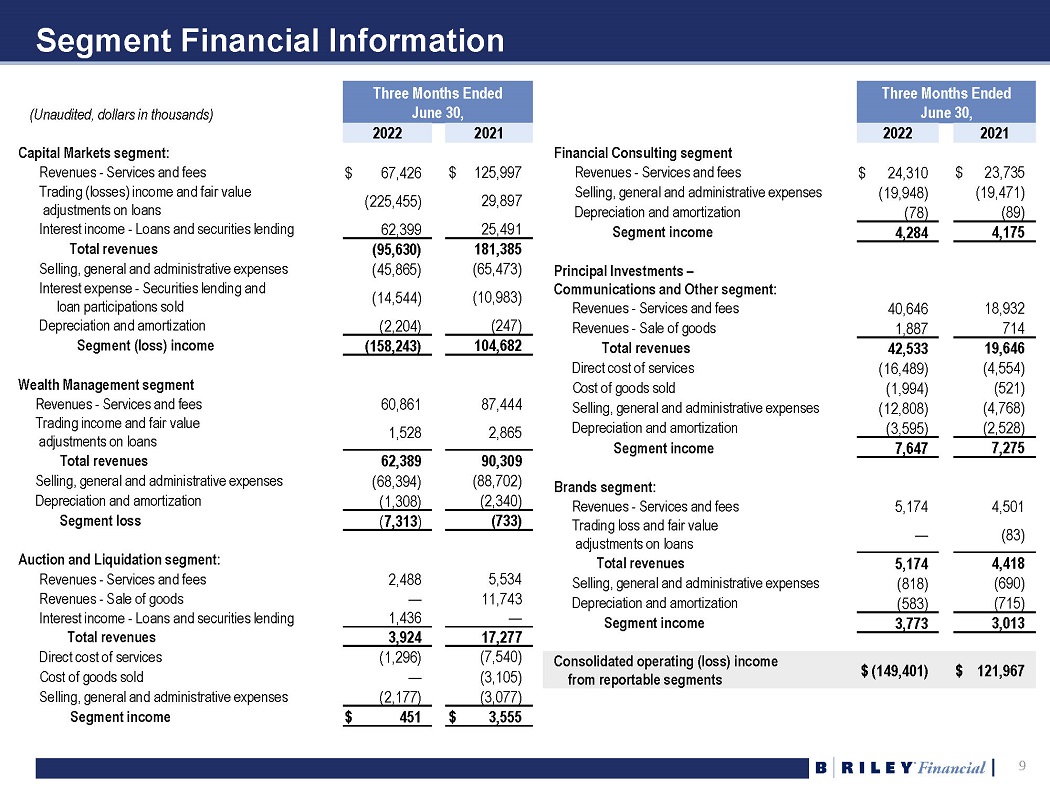
Segment Financial Information 9 (Unaudited, dollars in thousands) Three Months Ended June 30, 2022 2021 Capital Markets segment: Revenues - Services and fees $ 67,426 $ 125,997 Trading (losses) income and fair value adjustments on loans (225,455) 29,897 Interest income - Loans and securities lending 62,399 25,491 Total revenues (95,630) 181,385 Selling, general and administrative expenses (45,865) (65,473) Interest expense - Securities lending and loan participations sold (14,544) (10,983) Depreciation and amortization (2,204) (247) Segment (loss) income (158,243) 104,682 Wealth Management segment Revenues - Services and fees 60,861 87,444 Trading income and fair value adjustments on loans 1,528 2,865 Total revenues 62,389 90,309 Selling, general and administrative expenses (68,394) (88,702) Depreciation and amortization (1,308) (2,340) Segment loss ( 7,313 ) (733) Auction and Liquidation segment: Revenues - Services and fees 2,488 5,534 Revenues - Sale of goods — 11,743 Interest income - Loans and securities lending 1,436 — Total revenues 3,924 17,277 Direct cost of services (1,296) (7,540) Cost of goods sold — (3,105) Selling, general and administrative expenses (2,177) (3,077) Segment income $ 451 $ 3,555 Three Months Ended June 30, 2022 2021 Financial Consulting segment Revenues - Services and fees $ 24,310 $ 23,735 Selling, general and administrative expenses (19,948) (19,471) Depreciation and amortization (78) (89) Segment income 4,284 4,175 Principal Investments – Communications and Other segment: Revenues - Services and fees 40,646 18,932 Revenues - Sale of goods 1,887 714 Total revenues 42,533 19,646 Direct cost of services (16,489) (4,554) Cost of goods sold (1,994) (521) Selling, general and administrative expenses (12,808) (4,768) Depreciation and amortization (3,595) (2,528) Segment income 7,647 7,275 Brands segment: Revenues - Services and fees 5,174 4,501 Trading loss and fair value adjustments on loans — (83) Total revenues 5,174 4,418 Selling, general and administrative expenses (818) (690) Depreciation and amortization (583) (715) Segment income 3,773 3,013 Consolidated operating (loss) income from reportable segments $ (149,401) $ 121,967
Definition of US GAAP to Non - GAAP Financial Measures 10 Certain of the information set forth herein, including operating revenue, adjusted EBITDA, operating adjusted EBITDA, and investment adjusted EBITDA may be considered non - GAAP financial measures . B . Riley Financial believes this information is useful to investors because it provides a basis for measuring the Company's available capital resources, the operating performance of its business and its revenues and cash flow, (i) excluding in the case of operating revenues, trading income (losses) and fair value adjustments on loans, (ii) excluding in the case of adjusted EBITDA, net interest expense, provisions for or benefit from income taxes, depreciation, amortization, fair value adjustment, restructuring costs, gain on extinguishment of loans, impairment of trade names, stock - based compensation and transaction and other expenses, (iii) excluding in the case of operating adjusted EBITDA, aforementioned adjustments for adjusted EBITDA, as well as trading income (losses) and fair value adjustments on loans, and other investment related expenses, and (iv) in the case of investment adjusted EBITDA this includes trading income (losses) and fair value adjustments on loans, net of other investment related expenses, that would normally be included in the most directly comparable measures calculated and presented in accordance with Generally Accepted Accounting Principles ("GAAP") . In addition, the Company's management uses these non - GAAP financial measures along with the most directly comparable GAAP financial measures in evaluating the Company's operating performance, capital resources and cash flow . Non - GAAP financial measures should not be considered in isolation from, or as a substitute for, financial information presented in compliance with GAAP, and non - financial measures as reported by the Company may not be comparable to similarly titled amounts reported by other companies .