Exhibit 99.2
NASDAQ:RILY May 2019
Title Text FORWARD LOOKING STATEMENTS This presentation contains statements that are forward - looking statements within the meaning of Section 27 A of the Securities Act of 1933 , as amended, and Section 21 E of the Securities Exchange Act of 1934 , as amended that are based on management’s current expectations and assumptions and are subject to risks and uncertainties . These forward looking statements can often be identified by their use of words such as “anticipates,” “believes,” “can,” “continue,” “could,” “estimates,” “expects,” “forecast,” “intends,” “may,” “outlook,” “plans,” “potential,” “predicts,” “projects,” “should,” “target,” “will,” “would” or the negative of these terms or other comparable terminology . Such forward looking statements include, but are not limited to, expressed or implied statements regarding future financial performance and future dividends, the effects of our business model, the effects of our balance sheet on our ability to pursue business opportunities, the effects and anticipated benefits of our acquisitions and related actions, the strength of our business segments, assessments of future opportunities and performance, expectations regarding future transactions, and the financial impact, size and consistency of returns and timing thereof, expectations regarding market dynamics, as well as statements regarding the effect of investments in our business segments . Because these forward - looking statements involve known and unknown risks and uncertainties, there are important factors that could cause actual results, events or developments to differ materially from those expressed or implied by these forward - looking statements . Factors that could cause actual results to differ from those contained in the forward - looking statements include but are not limited to risks related to : volatility in our revenues and results of operations ; changing conditions in the financial markets ; our ability to generate sufficient revenues to achieve and maintain profitability ; the short term nature of our engagements ; the accuracy of our estimates and valuations of inventory or assets in “guarantee” based engagements ; competition in the asset management business ; potential losses related to our auction or liquidation engagements ; our dependence on communications, information and other systems and third parties ; potential losses related to purchase transactions in our auctions and liquidations business ; the potential loss of financial institution clients ; potential losses from or illiquidity of our proprietary investments ; changing economic and market conditions ; potential liability and harm to our reputation if we were to provide an inaccurate appraisal or valuation ; failure to successfully compete in any of our segments ; loss of key personnel ; our ability to borrow under our credit facilities or raise additional funds through offerings as necessary ; failure to comply with the terms of our credit agreements ; our ability to meet future capital requirements ; our ability to promptly and effectively integrate our business with that of magicJack ; and the diversion of management time on acquisition - related issues . Other factors that could adversely affect our operating results and cash flows include (without limitation) those risks described from time to time in B . Riley Financial, Inc . ’s periodic filings with the SEC, including, without limitation, the risks described in B . Riley Financial, Inc . ’s Annual Report on Form 10 - K for the year ended December 31 , 2018 under the captions "Risk Factors" and "Management's Discussion and Analysis of Financial Condition and Results of Operations“ and our Quarterly Report on Form 10 - Q for the quarter ended March 31 , 2019 . These factors should be considered carefully and readers are cautioned not to place undue reliance on such forward - looking statements . All information is current as of the date this presentation is issued, and B . Riley Financial, Inc . undertakes no duty to update this information . 2 Safe Harbor Statement
Title Text Table of Contents 3 I. Transaction Summary & Credit Metrics II. B. Riley Financial at a Glance III. Segments Overview IV. Financial Overview V. Appendix
Transaction Summary & Credit Metrics
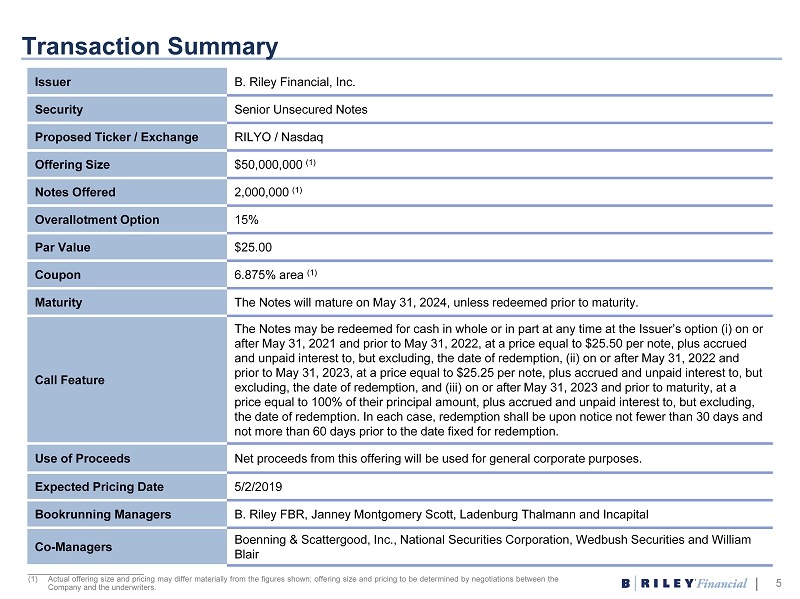
Title Text Transaction Summary ___________________________ (1) Actual offering size and pricing may differ materially from the figures shown ; offering size and pricing to be determined by negotiations between the Company and the underwriters . Issuer B. Riley Financial, Inc. Security Senior Unsecured Notes Proposed Ticker / Exchange RILYO / Nasdaq Offering Size $50,000,000 (1) Notes Offered 2,000,000 (1) Overallotment Option 15% Par Value $25.00 Coupon 6.875% area (1) Maturity The Notes will mature on May 31, 2024, unless redeemed prior to maturity. Call Feature The Notes may be redeemed for cash in whole or in part at any time at the Issuer’s option (i) on or after May 31, 2021 and prior to May 31, 2022, at a price equal to $25.50 per note, plus accrued and unpaid interest to, but excluding, the date of redemption, (ii) on or after May 31, 2022 and prior to May 31, 2023, at a price equal to $25.25 per note, plus accrued and unpaid interest to, but excluding, the date of redemption, and (iii) on or after May 31, 2023 and prior to maturity, at a price equal to 100% of their principal amount, plus accrued and unpaid interest to, but excluding, the date of redemption. In each case, redemption shall be upon notice not fewer than 30 days and not more than 60 days prior to the date fixed for redemption. Use of Proceeds Net proceeds from this offering will be used for general corporate purposes. Expected Pricing Date 5/2/2019 Bookrunning Managers B. Riley FBR, Janney Montgomery Scott, Ladenburg Thalmann and Incapital Co - Managers Boenning & Scattergood, Inc., National Securities Corporation, Wedbush Securities and William Blair 5
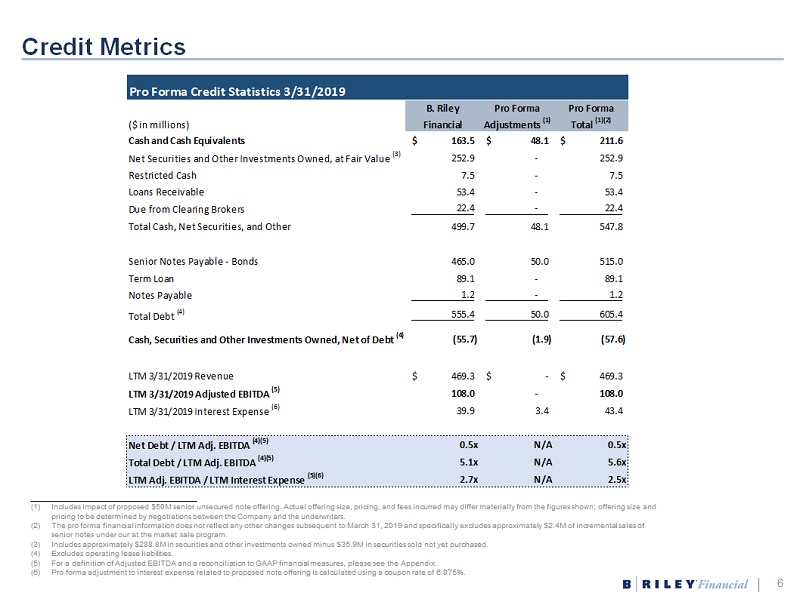
Title Text Credit Metrics 6 ______________________________________ (1) Includes impact of proposed $50M senior unsecured note offering. Actual offering size, pricing, and fees incurred may differ mat erially from the figures shown; offering size and pricing to be determined by negotiations between the Company and the underwriters. (2) The pro forma financial information does not reflect any other changes subsequent to March 31, 2019 and specifically excludes ap proximately $2.4M of incremental sales of senior notes under our at the market sale program. (3) Includes approximately $288.8M in securities and other investments owned minus $35.9M in securities sold not yet purchased. (4) Excludes operating lease liabilities. (5) For a definition of Adjusted EBITDA and a reconciliation to GAAP financial measures, please see the Appendix. (6) Pro forma adjustment to interest expense related to proposed note offering is calculated using a coupon rate of 6.875%. Pro Forma Credit Statistics 3/31/2019 B. Riley Pro Forma Pro Forma ($ in millions) Financial Adjustments (1) Total (1)(2) Cash and Cash Equivalents 163.5$ 48.1$ 211.6$ Net Securities and Other Investments Owned, at Fair Value (3) 252.9 - 252.9 Restricted Cash 7.5 - 7.5 Loans Receivable 53.4 - 53.4 Due from Clearing Brokers 22.4 - 22.4 Total Cash, Net Securities, and Other 499.7 48.1 547.8 Senior Notes Payable - Bonds 465.0 50.0 515.0 Term Loan 89.1 - 89.1 Notes Payable 1.2 - 1.2 Total Debt (4) 555.4 50.0 605.4 Cash, Securities and Other Investments Owned, Net of Debt (4) (55.7) (1.9) (57.6) LTM 3/31/2019 Revenue 469.3$ -$ 469.3$ LTM 3/31/2019 Adjusted EBITDA (5) 108.0 - 108.0 LTM 3/31/2019 Interest Expense (6) 39.9 3.4 43.4 Net Debt / LTM Adj. EBITDA (4)(5) 0.5x N/A 0.5x Total Debt / LTM Adj. EBITDA (4)(5) 5.1x N/A 5.6x LTM Adj. EBITDA / LTM Interest Expense (5)(6) 2.7x N/A 2.5x

B. Riley Financial at a Glance
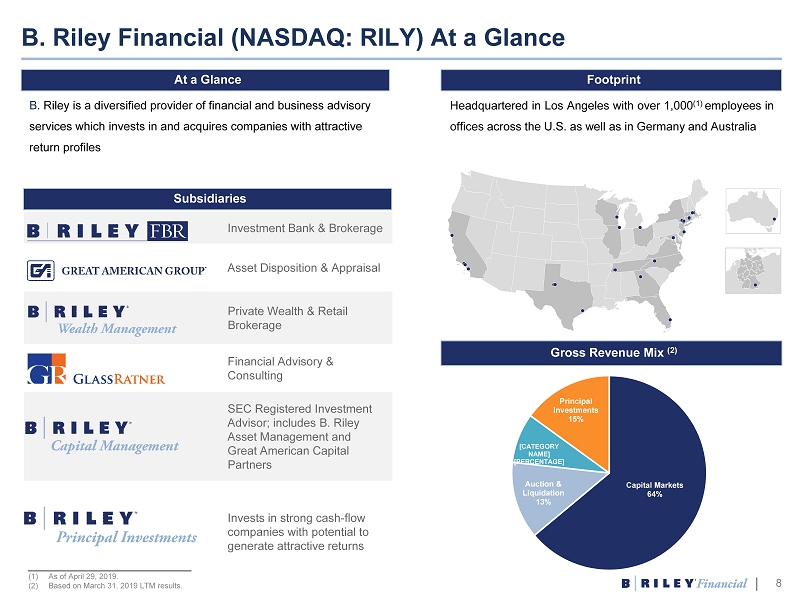
Title Text B. Riley Financial (NASDAQ: RILY) At a Glance 8 B . Riley is a diversified provider of financial and business advisory services which invests in and acquires companies with attractive return profiles Gross Revenue Mix (2) Capital Markets 64% Auction & Liquidation 13% [CATEGORY NAME] [PERCENTAGE] Principal Investments 15% Headquartered in Los Angeles with over 1 , 000 ( 1 ) employees in offices across the U . S . as well as in Germany and Australia Investment Bank & Brokerage Asset Disposition & Appraisal Private Wealth & Retail Brokerage Financial Advisory & Consulting SEC Registered Investment Advisor; includes B. Riley Asset Management and Great American Capital Partners Invests in strong cash - flow companies with potential to generate attractive returns Subsidiaries ______________________________________ (1) As of April 29, 2019. (2) Based on March 31, 2019 LTM results. Footprint At a Glance
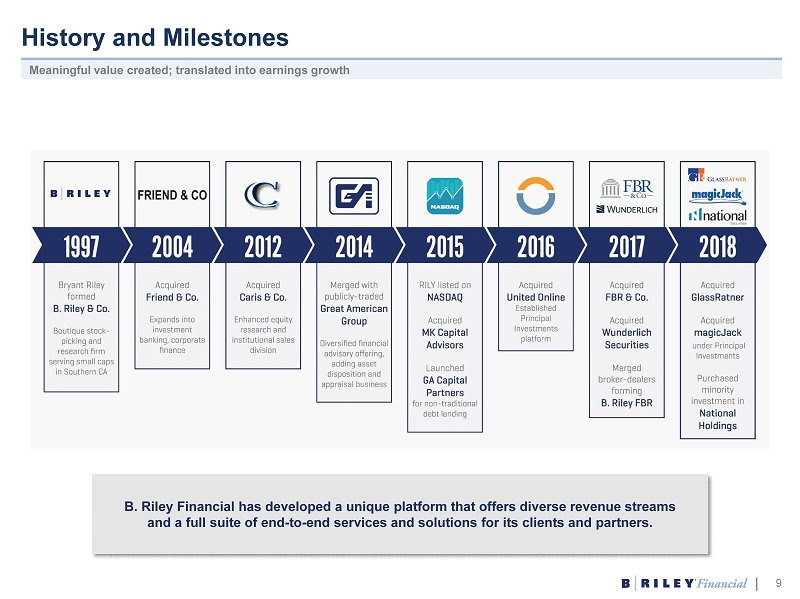
Title Text Meaningful value created; translated into earnings growth History and Milestones 9 B. Riley Financial has developed a unique platform that offers diverse revenue streams and a full suite of end - to - end services and solutions for its clients and partners.
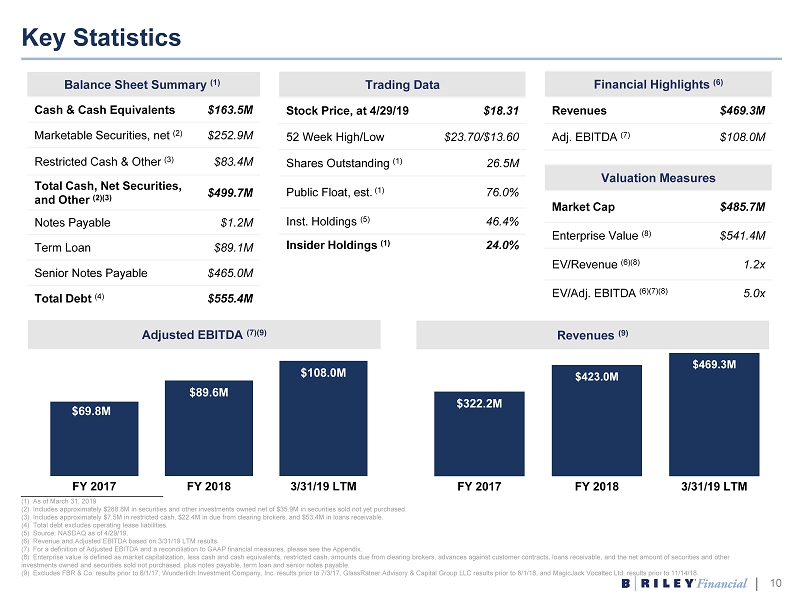
Title Text Key Statistics 10 Trading Data Stock Price, at 4/29/19 $18.31 52 Week High/Low $23.70/$13.60 Shares Outstanding (1) 26.5M Public Float, est. (1) 76.0% Inst. Holdings (5) 46.4% Insider Holdings (1) 24.0% Balance Sheet Summary (1) Cash & Cash Equivalents $163.5M Marketable Securities, net (2) $252.9M Restricted Cash & Other (3) $83.4M Total Cash, Net Securities, and Other (2)(3) $499.7M Notes Payable $1.2M Term Loan $89.1M Senior Notes Payable $465.0M Total Debt (4) $555.4M $69.8M $89.6M $108.0M FY 2017 FY 2018 3/31/19 LTM $322.2M $423.0M $469.3M FY 2017 FY 2018 3/31/19 LTM Valuation Measures Market Cap $485.7M Enterprise Value (8) $541.4M EV/Revenue (6)(8) 1.2x EV/Adj. EBITDA (6)(7)(8) 5.0x Adjusted EBITDA (7)(9) Revenues (9) Financial Highlights (6) Revenues $469.3M Adj. EBITDA (7) $108.0M ______________________________________ (1) As of March 31, 2019 (2) Includes approximately $288.8M in securities and other investments owned net of $35.9M in securities sold not yet purcha sed . (3) Includes approximately $7.5M in restricted cash, $22.4M in due from clearing brokers, and $53.4M in loans receivable. (4) Total debt excludes operating lease liabilities. (5) Source : NASDAQ as of 4/29/19 . (6) Revenue and Adjusted EBITDA based on 3/31/19 LTM results. (7) For a definition of Adjusted EBITDA and a reconciliation to GAAP financial measures, please see the Appendix. (8) Enterprise value is defined as market capitalization, less cash and cash equivalents, restricted cash, amounts due from clear ing brokers, advances against customer contracts, loans receivable, and the net amount of securities and other investments owned and securities sold not purchased, plus notes payable, term loan and senior notes payable. (9) Excludes FBR & Co. results prior to 6/1/17, Wunderlich Investment Company, Inc. results prior to 7/3/17, GlassRatner Advisory & Capital Group LLC results prior to 8/1/18, and MagicJack Vocaltec Ltd. results prior to 11/14/18.

Segments Overview
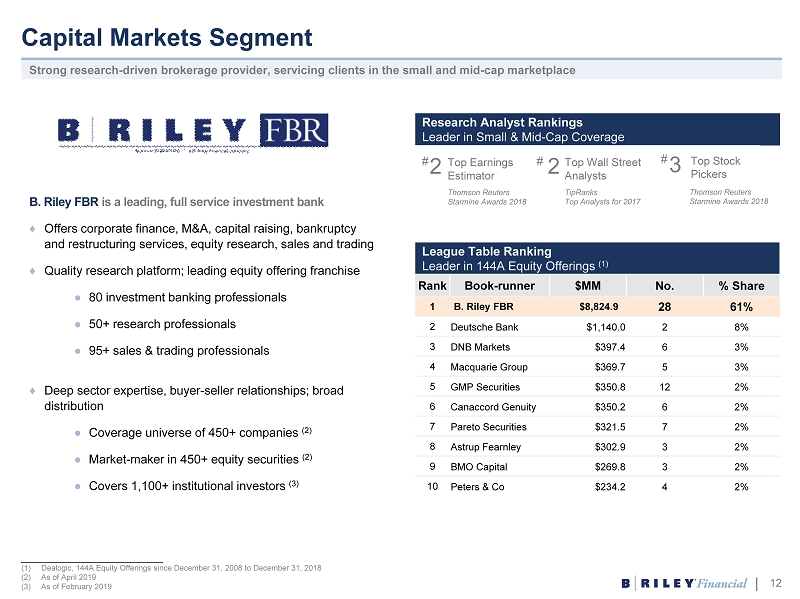
Title Text Strong research - driven brokerage provider, servicing clients in the small and mid - cap marketplace Capital Markets Segment 12 B. Riley FBR is a leading, full service investment bank ♦ Offers corporate finance, M&A, capital raising, bankruptcy and restructuring services, equity research, sales and trading ♦ Quality research platform; leading equity offering franchise ● 80 investment banking professionals ● 50+ research professionals ● 95+ sales & trading professionals ♦ Deep sector expertise, buyer - seller relationships; broad distribution ● Coverage universe of 450+ companies (2) ● Market - maker in 450+ equity securities (2) ● Covers 1,100+ institutional investors (3) # 2 Research Analyst Rankings Leader in Small & Mid - Cap Coverage Top Earnings Estimator # 2 Thomson Reuters Starmine Awards 2018 Top Stock Pickers 3 Thomson Reuters Starmine Awards 2018 Top Wall Street Analysts # TipRanks Top Analysts for 2017 League Table Ranking Leader in 144A Equity Offerings (1) Rank Book - runner $MM No. % Share 1 B. Riley FBR $8,824.9 28 61% 2 Deutsche Bank $ 1,140.0 2 8% 3 DNB Markets $ 397.4 6 3% 4 Macquarie Group $ 369.7 5 3% 5 GMP Securities $ 350.8 12 2% 6 Canaccord Genuity $ 350.2 6 2% 7 Pareto Securities $ 321.5 7 2% 8 Astrup Fearnley $ 302.9 3 2% 9 BMO Capital $ 269.8 3 2% 10 Peters & Co $ 234.2 4 2% ______________________________________ (1) Dealogic , 144A Equity Offerings since December 31, 2008 to December 31, 2018 (2) As of April 2019 (3) As of February 2019
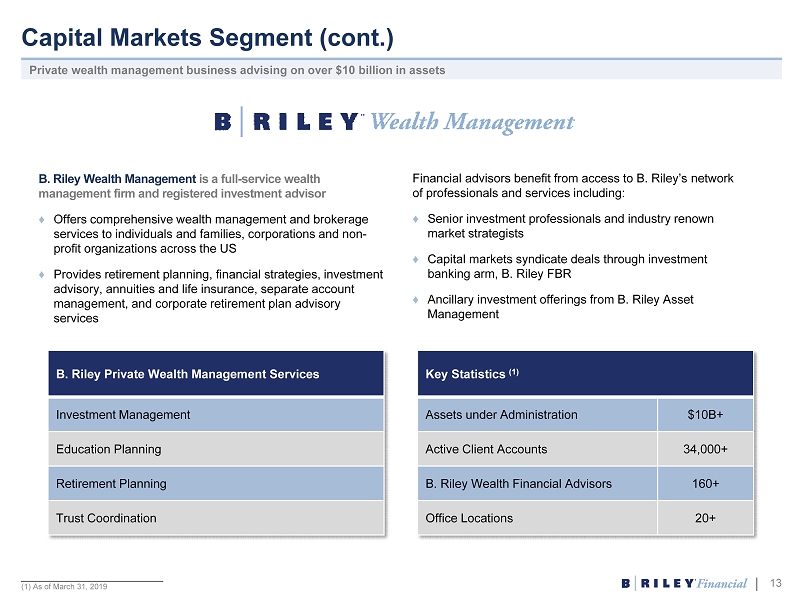
Title Text Capital Markets Segment (cont.) 13 B. Riley Wealth Management is a full - service wealth management firm and registered investment advisor ♦ Offers comprehensive wealth management and brokerage services to individuals and families, corporations and non - profit organizations across the US ♦ Provides retirement planning, financial strategies, investment advisory, annuities and life insurance, separate account management, and corporate retirement plan advisory services Private wealth management business advising on over $10 billion in assets Key Statistics (1) Assets under Administration $10B+ Active Client Accounts 34,000+ B. Riley Wealth Financial Advisors 160+ Office Locations 20+ B. Riley Private Wealth Management Services Investment Management Education Planning Retirement Planning Trust Coordination ______________________________________ (1) As of March 31, 2019 Financial advisors benefit from access to B. Riley’s network of professionals and services including: ♦ Senior investment professionals and industry renown market strategists ♦ Capital markets syndicate deals through investment banking arm, B. Riley FBR ♦ Ancillary investment offerings from B. Riley Asset Management
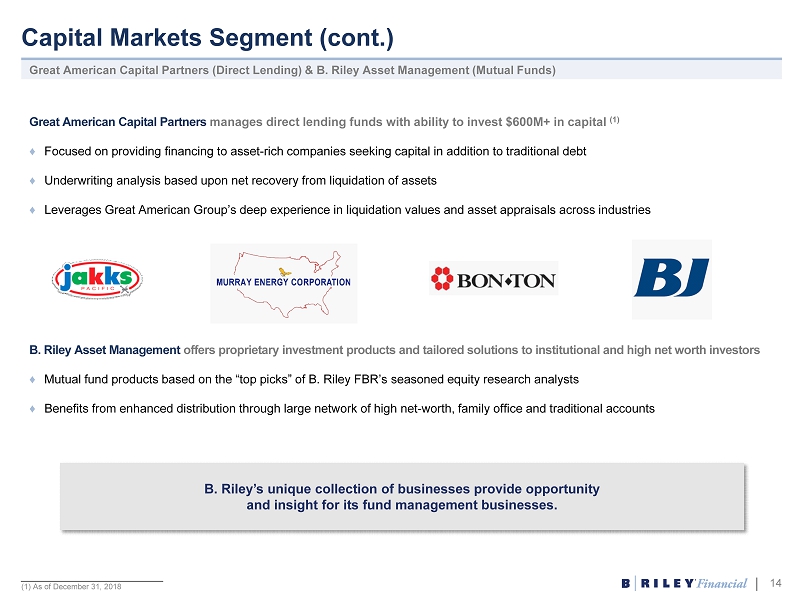
Title Text Great American Capital Partners (Direct Lending) & B. Riley Asset Management (Mutual Funds) Capital Markets Segment (cont.) 14 Great American Capital Partners manages direct lending funds with ability to invest $600M+ in capital (1) ♦ Focused on providing financing to asset - rich companies seeking capital in addition to traditional debt ♦ Underwriting analysis based upon net recovery from liquidation of assets ♦ Leverages Great American Group’s deep experience in liquidation values and asset appraisals across industries B. Riley Asset Management offers proprietary investment products and tailored solutions to institutional and high net worth investors ♦ Mutual fund products based on the “top picks” of B. Riley FBR’s seasoned equity research analysts ♦ Benefits from enhanced distribution through large network of high net - worth, family office and traditional accounts B. Riley’s unique collection of businesses provide opportunity and insight for its fund management businesses. ______________________________________ (1) As of December 31, 2018
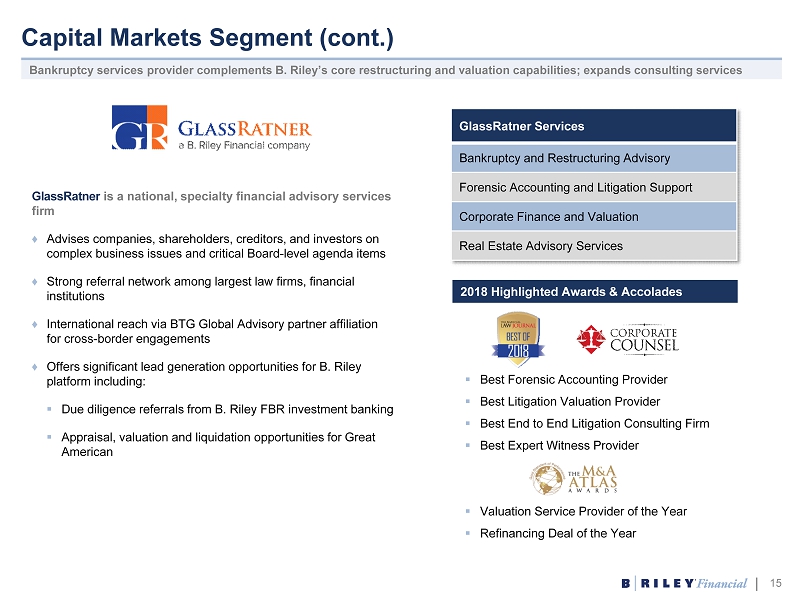
Title Text Bankruptcy services provider complements B. Riley’s core restructuring and valuation capabilities; expands consulting services Capital Markets Segment (cont.) 15 GlassRatner is a national, specialty financial advisory services firm ♦ Advises companies, shareholders, creditors, and investors on complex business issues and critical Board - level agenda items ♦ Strong referral network among largest law firms, financial institutions ♦ International reach via BTG Global Advisory partner affiliation for cross - border engagements ♦ Offers significant lead generation opportunities for B. Riley platform including: ▪ Due diligence referrals from B. Riley FBR investment banking ▪ Appraisal, valuation and liquidation opportunities for Great American GlassRatner Services Bankruptcy and Restructuring Advisory Forensic Accounting and Litigation Support Corporate Finance and Valuation Real Estate Advisory Services ▪ Best Forensic Accounting Provider ▪ Best Litigation Valuation Provider ▪ Best End to End Litigation Consulting Firm ▪ Best Expert Witness Provider ▪ Valuation Service Provider of the Year ▪ Refinancing Deal of the Year 2018 Highlighted Awards & Accolades
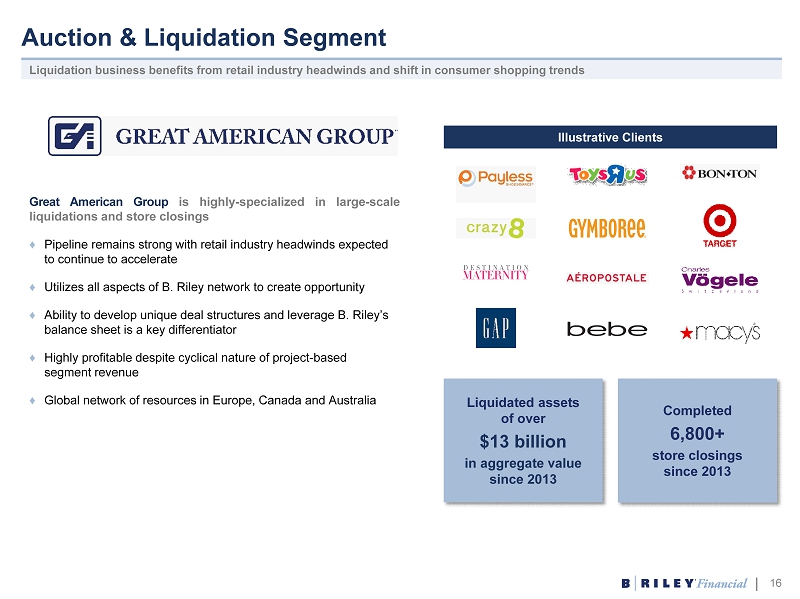
Title Text Liquidation business benefits from retail industry headwinds and shift in consumer shopping trends Auction & Liquidation Segment 16 Great American Group is highly - specialized in large - scale liquidations and store closings ♦ Pipeline remains strong with retail industry headwinds expected to continue to accelerate ♦ Utilizes all aspects of B. Riley network to create opportunity ♦ Ability to develop unique deal structures and leverage B. Riley’s balance sheet is a key differentiator ♦ Highly profitable despite cyclical nature of project - based segment revenue ♦ Global network of resources in Europe, Canada and Australia Liquidated assets of over $13 billion in aggregate value since 2013 Completed 6,800+ store closings since 2013 Illustrative Clients
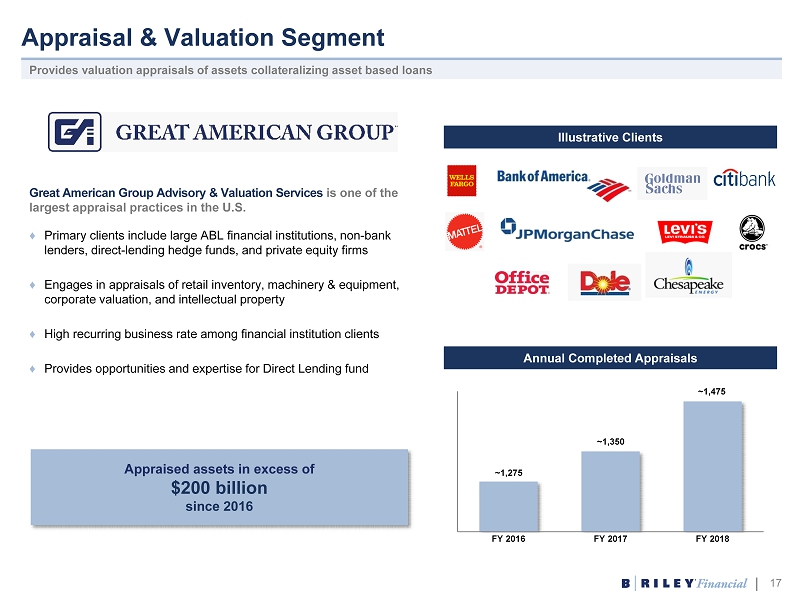
Title Text Provides valuation appraisals of assets collateralizing asset based loans Appraisal & Valuation Segment 17 Great American Group Advisory & Valuation Services is one of the largest appraisal practices in the U.S. ♦ Primary clients include large ABL financial institutions, non - bank lenders, direct - lending hedge funds, and private equity firms ♦ Engages in appraisals of retail inventory, machinery & equipment, corporate valuation, and intellectual property ♦ High recurring business rate among financial institution clients ♦ Provides opportunities and expertise for Direct Lending fund Illustrative Clients ~1,275 ~1,350 ~1,475 FY 2016 FY 2017 FY 2018 Annual Completed Appraisals Appraised assets in excess of $200 billion since 2016
Title Text Invests in companies with strong cash - flow profiles with potential to generate attractive returns Principal Investments Segment 18 Operationally - focused, control equity investments which leverage B. Riley Financial’s expertise and resources: ♦ United Online (acquired July 2016) ● Internet access subscription and online advertising produce high gross margins; predictable subscriber attrition ● Low overhead from successful execution of cost synergies; highly profitable business generating significant cash flows ♦ bebe stores (OTCQB:BEBE) (acquired 29% ownership in January 2018) ● Assisted in bebe’s transformation into online - only retailer; streamlined operations to achieve significant cost savings ● bebe’s net operating losses provide opportunity to develop a platform to generate attractive investment yields ♦ magicJack VocalTec (acquired in November 2018) ● Offers potential operational synergies with United Online

Financial Overview
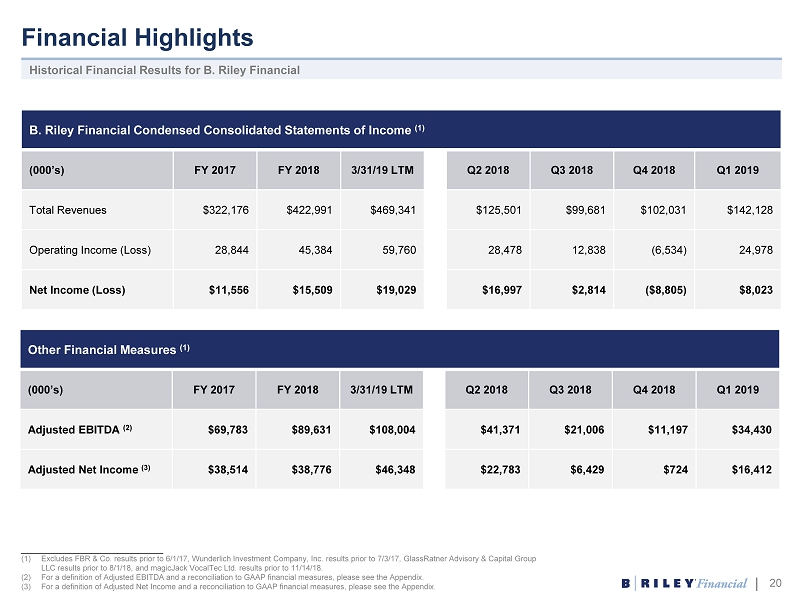
Title Text Historical Financial Results for B. Riley Financial Financial Highlights 20 B. Riley Financial Condensed Consolidated Statements of Income (1) (000’s) FY 2017 FY 2018 3/31/19 LTM Q2 2018 Q3 2018 Q4 2018 Q1 2019 Total Revenues $322,176 $422,991 $469,341 $125,501 $99,681 $102,031 $142,128 Operating Income (Loss) 28,844 45,384 59,760 28,478 12,838 (6,534) 24,978 Net Income (Loss) $11,556 $15,509 $19,029 $16,997 $2,814 ($8,805) $8,023 Other Financial Measures (1) (000’s) FY 2017 FY 2018 3/31/19 LTM Q2 2018 Q3 2018 Q4 2018 Q1 2019 Adjusted EBITDA (2) $69,783 $89,631 $108,004 $41,371 $21,006 $11,197 $34,430 Adjusted Net Income (3) $38,514 $38,776 $46,348 $22,783 $6,429 $724 $16,412 ______________________________________ (1) Excludes FBR & Co. results prior to 6/1/17, Wunderlich Investment Company, Inc. results prior to 7/3/17, GlassRatner Advisory & Capital Group LLC results prior to 8/1/18, and magicJack VocalTec Ltd. results prior to 11/14/18. (2) For a definition of Adjusted EBITDA and a reconciliation to GAAP financial measures, please see the Appendix. (3) For a definition of Adjusted Net Income and a reconciliation to GAAP financial measures, please see the Appendix .
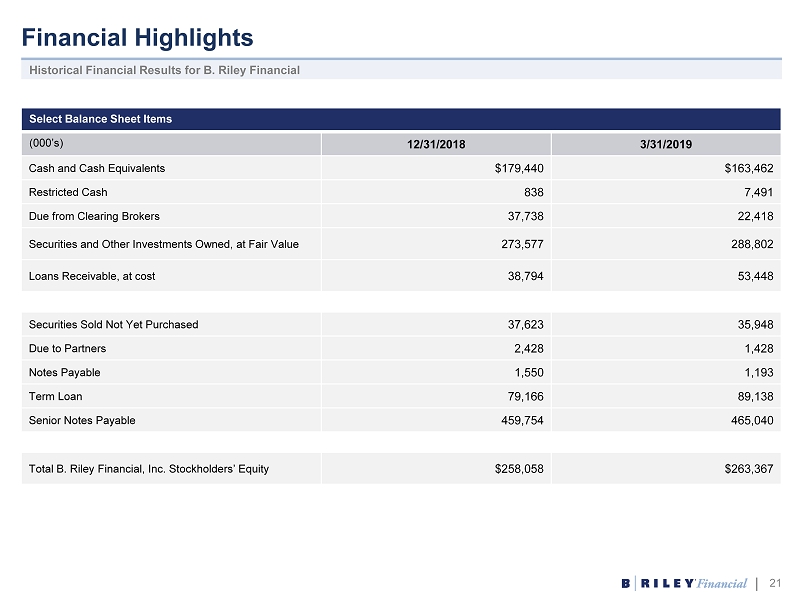
Title Text Historical Financial Results for B. Riley Financial Financial Highlights 21 Select Balance Sheet Items (000’s) 12/31/2018 3/31/2019 Cash and Cash Equivalents $179,440 $163,462 Restricted Cash 838 7,491 Due from Clearing Brokers 37,738 22,418 Securities and Other Investments Owned, at Fair Value 273,577 288,802 Loans Receivable, at cost 38,794 53,448 Securities Sold Not Yet Purchased 37,623 35,948 Due to Partners 2,428 1,428 Notes Payable 1,550 1,193 Term Loan 79,166 89,138 Senior Notes Payable 459,754 465,040 Total B. Riley Financial, Inc. Stockholders’ Equity $258,058 $263,367

Appendix
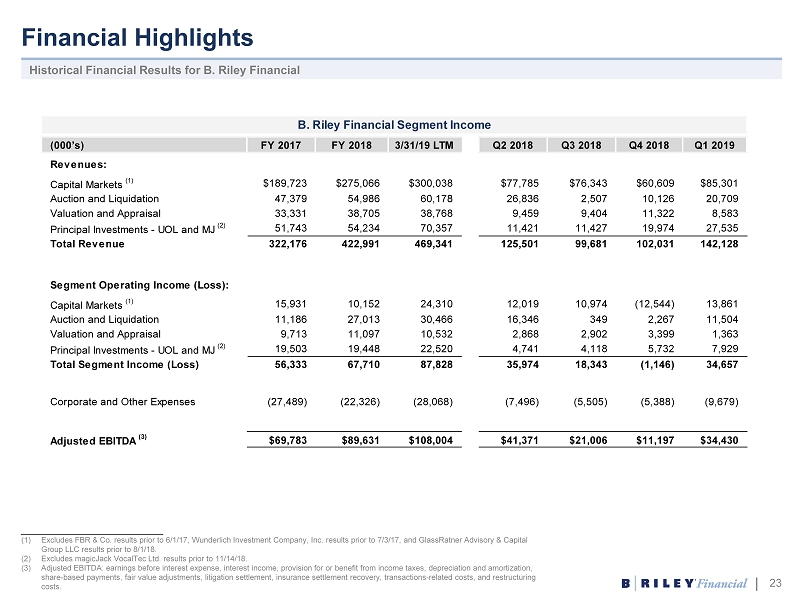
Title Text Historical Financial Results for B. Riley Financial Financial Highlights 23 ______________________________________ (1) Excludes FBR & Co. results prior to 6/1/17, Wunderlich Investment Company, Inc. results prior to 7/3/17, and GlassRatner Advi sor y & Capital Group LLC results prior to 8/1/18. (2) Excludes magicJack VocalTec Ltd. results prior to 11/14/18. (3) Adjusted EBITDA: earnings before interest expense, interest income, provision for or benefit from income taxes, depreciation and amortization, share - based payments, fair value adjustments, litigation settlement, insurance settlement recovery, transactions - related costs, and restructuring costs. B. Riley Financial Segment Income (000’s) FY 2017 FY 2018 3/31/19 LTM Q2 2018 Q3 2018 Q4 2018 Q1 2019 Revenues: Capital Markets (1) $189,723 $275,066 $300,038 $77,785 $76,343 $60,609 $85,301 Auction and Liquidation 47,379 54,986 60,178 26,836 2,507 10,126 20,709 Valuation and Appraisal 33,331 38,705 38,768 9,459 9,404 11,322 8,583 Principal Investments - UOL and MJ (2) 51,743 54,234 70,357 11,421 11,427 19,974 27,535 Total Revenue 322,176 422,991 469,341 125,501 99,681 102,031 142,128 Segment Operating Income (Loss): Capital Markets (1) 15,931 10,152 24,310 12,019 10,974 (12,544) 13,861 Auction and Liquidation 11,186 27,013 30,466 16,346 349 2,267 11,504 Valuation and Appraisal 9,713 11,097 10,532 2,868 2,902 3,399 1,363 Principal Investments - UOL and MJ (2) 19,503 19,448 22,520 4,741 4,118 5,732 7,929 Total Segment Income (Loss) 56,333 67,710 87,828 35,974 18,343 (1,146) 34,657 Corporate and Other Expenses (27,489) (22,326) (28,068) (7,496) (5,505) (5,388) (9,679) Adjusted EBITDA (3) $69,783 $89,631 $108,004 $41,371 $21,006 $11,197 $34,430
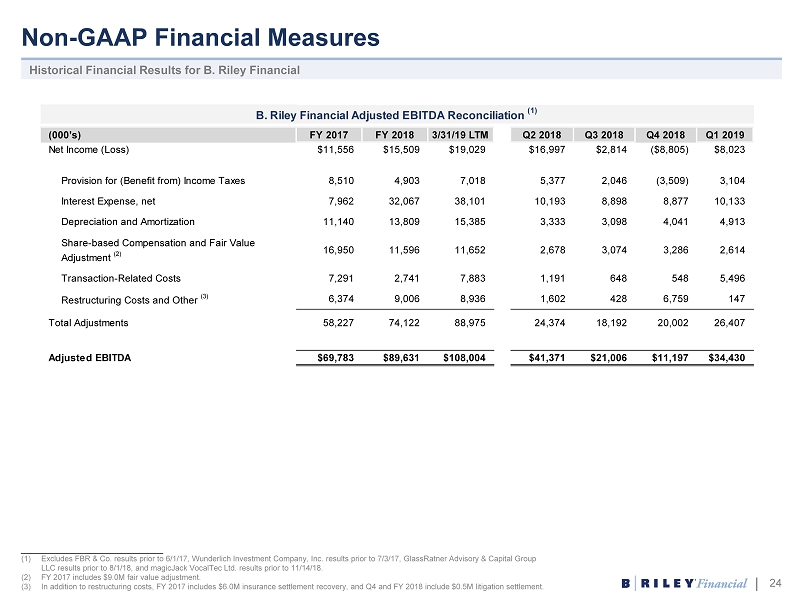
Title Text Historical Financial Results for B. Riley Financial Non - GAAP Financial Measures 24 ______________________________________ (1) Excludes FBR & Co. results prior to 6/1/17, Wunderlich Investment Company, Inc. results prior to 7/3/17, GlassRatner Advisory & Capital Group LLC results prior to 8/1/18, and magicJack VocalTec Ltd. results prior to 11/14/18. (2) FY 2017 includes $9.0M fair value adjustment. (3) In addition to restructuring costs, FY 2017 includes $6.0M insurance settlement recovery, and Q4 and FY 2018 include $0.5M li tig ation settlement. B. Riley Financial Adjusted EBITDA Reconciliation (1) (000’s) FY 2017 FY 2018 3/31/19 LTM Q2 2018 Q3 2018 Q4 2018 Q1 2019 Net Income (Loss) $11,556 $15,509 $19,029 $16,997 $2,814 ($8,805) $8,023 Provision for (Benefit from) Income Taxes 8,510 4,903 7,018 5,377 2,046 (3,509) 3,104 Interest Expense, net 7,962 32,067 38,101 10,193 8,898 8,877 10,133 Depreciation and Amortization 11,140 13,809 15,385 3,333 3,098 4,041 4,913 Share-based Compensation and Fair Value Adjustment (2) 16,950 11,596 11,652 2,678 3,074 3,286 2,614 Transaction-Related Costs 7,291 2,741 7,883 1,191 648 548 5,496 Restructuring Costs and Other (3) 6,374 9,006 8,936 1,602 428 6,759 147 Total Adjustments 58,227 74,122 88,975 24,374 18,192 20,002 26,407 Adjusted EBITDA $69,783 $89,631 $108,004 $41,371 $21,006 $11,197 $34,430
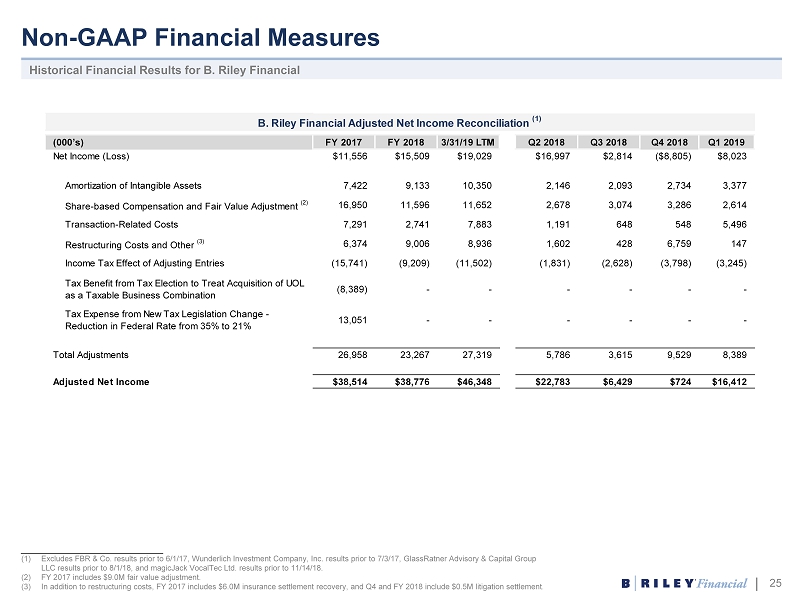
Title Text Historical Financial Results for B. Riley Financial Non - GAAP Financial Measures 25 ______________________________________ (1) Excludes FBR & Co. results prior to 6/1/17, Wunderlich Investment Company, Inc. results prior to 7/3/17, GlassRatner Advisory & Capital Group LLC results prior to 8/1/18, and magicJack VocalTec Ltd. results prior to 11/14/18. (2) FY 2017 includes $9.0M fair value adjustment. (3) In addition to restructuring costs, FY 2017 includes $6.0M insurance settlement recovery, and Q4 and FY 2018 include $0.5M li tig ation settlement . B. Riley Financial Adjusted Net Income Reconciliation (1) (000’s) FY 2017 FY 2018 3/31/19 LTM Q2 2018 Q3 2018 Q4 2018 Q1 2019 Net Income (Loss) $11,556 $15,509 $19,029 $16,997 $2,814 ($8,805) $8,023 Amortization of Intangible Assets 7,422 9,133 10,350 2,146 2,093 2,734 3,377 Share-based Compensation and Fair Value Adjustment (2) 16,950 11,596 11,652 2,678 3,074 3,286 2,614 Transaction-Related Costs 7,291 2,741 7,883 1,191 648 548 5,496 Restructuring Costs and Other (3) 6,374 9,006 8,936 1,602 428 6,759 147 Income Tax Effect of Adjusting Entries (15,741) (9,209) (11,502) (1,831) (2,628) (3,798) (3,245) Tax Benefit from Tax Election to Treat Acquisition of UOL as a Taxable Business Combination (8,389) - - - - - - Tax Expense from New Tax Legislation Change - Reduction in Federal Rate from 35% to 21% 13,051 - - - - - - Total Adjustments 26,958 23,267 27,319 5,786 3,615 9,529 8,389 Adjusted Net Income $38,514 $38,776 $46,348 $22,783 $6,429 $724 $16,412
Title Text Contact Us 26 11100 Santa Monica Blvd. Suite 800 Los Angeles, CA 90025 P (310) 966 - 1444 | F (310) 966 - 1448 Headquarters Investor Relations E ir@brileyfin.com P (310) 966 - 1444 Investor Contact Jo Anne McCusker E jmccusker@brileyfin.com P (646) 885 - 5425 Media Contact

For more information, please visit www.brileyfin.com