Use these links to rapidly review the document
TABLE OF CONTENTS1
TABLE OF CONTENTS2
Table of Contents
UNITED STATES
SECURITIES AND EXCHANGE COMMISSION
Washington, D.C. 20549
FORM 10-K
| | |
| (Mark One) | | |
ý |
|
ANNUAL REPORT PURSUANT TO SECTION 13 OR 15(d) OF THE SECURITIES EXCHANGE ACT OF 1934 |
For the fiscal year ended February 3, 2013 |
or |
o |
|
TRANSITION REPORT PURSUANT TO SECTION 13 OR 15(d) OF THE SECURITIES EXCHANGE ACT OF 1934 |
For the transition period from to
|
Commission file number 333-159809
HD SUPPLY, INC.
(Exact name of registrant as specified in its charter)
| | |
Delaware
(State or other jurisdiction of
incorporation or organization) | | 75-2007383
(IRS Employer Identification No.) |
3100 Cumberland Boulevard, Suite 1480,
Atlanta, Georgia
(Address of principal executive offices) |
|
30339
(Zip Code) |
(770) 852-9000
(Registrant's telephone number, including area code)
Not Applicable
(Former name, former address and former fiscal year, if changed since last report)
Securities registered pursuant to Section 12(b) of the Act:
| | |
| Title of Class | | Name of each exchange on which registered |
|---|
| None | | |
Securities registered pursuant to section 12(g) of the Act:
Indicate by check mark if the registrant is a well-known seasoned issuer, as defined in Rule 405 of the Securities Act. Yes o No ý
Indicate by check mark if the registrant is not required to file reports pursuant to Section 13 or Section 15(d) of the Act. Yes o No ý
Indicate by check mark whether the registrant (1) has filed all reports required to be filed by Section 13 or 15(d) of the Securities Exchange Act of 1934 during the past 12 months (or for such shorter period that the registrant was required to file such reports), and (2) has been subject to such filing requirements for the past 90 days. Yes o No ý
Indicate by check mark whether the registrant has submitted electronically and posted on its corporate Web site, if any, every Interactive Data File required to be submitted and posted pursuant to Rule 405 of Regulation S-T (§232.405) during the preceding 12 months (or for such shorter period that the registrant was required to submit and post such files). Yes ý No o
Indicate by check mark if disclosure of delinquent filers in response to Item 405 of Regulation S-K (§229.405) is not contained herein, and will not be contained, to the best of registrant's knowledge, in definitive proxy or information statements incorporated by reference in Part III of this Form 10-K or any amendment to this Form 10-K.ý
Indicate by check mark whether the registrant is a large accelerated filer, an accelerated filer, a non-accelerated filer, or a smaller reporting company. See the definitions of "large accelerated filer," "accelerated filer," and "smaller reporting company" in Rule 12b-2 of the Exchange Act.
| | | | | | |
| Large accelerated filer o | | Accelerated filer o | | Non-accelerated filer ý
(Do not check if a
smaller reporting company) | | Smaller reporting company o |
Indicate by check mark whether the registrant is a shell company (as defined in Rule 12b-2 of the Act).o Yes ý No
The registrant is a privately held corporation and its equity shares are not publicly traded. As of April 15, 2013, there were 1,000 shares of common stock of HD Supply, Inc. outstanding, all of which were owned by HDS Holding Corporation.
Table of Contents
INDEX TO FORM 10-K
| | | | | | |
| |
| | Page | |
|---|
| | Background Information and Glossary of Certain Defined Terms | | | 1 | |
| | Forward-looking statements and information | | | 3 | |
Part I | | | | | | |
Item 1. | | BUSINESS | | | 6 | |
Item 1A. | | RISK FACTORS | | | 16 | |
Item 2. | | PROPERTIES | | | 39 | |
Item 3. | | LEGAL PROCEEDINGS | | | 40 | |
Part II | | | | | | |
Item 5. | | MARKET FOR REGISTRANT'S COMMON EQUITY, RELATED STOCKHOLDER MATTERS AND ISSUER PURCHASES OF EQUITY SECURITIES | | | 40 | |
Item 6. | | SELECTED FINANCIAL DATA | | | 41 | |
Item 7. | | MANAGEMENT'S DISCUSSION AND ANALYSIS OF FINANCIAL CONDITION AND RESULTS OF OPERATIONS | | | 44 | |
Item 7A. | | QUANTITATIVE AND QUALITATIVE DISCLOSURES ABOUT MARKET RISK | | | 79 | |
Item 8. | | FINANCIAL STATEMENTS AND SUPPLEMENTARY DATA | | | 80 | |
Item 9A. | | CONTROLS AND PROCEDURES | | | 141 | |
Part III | | | | | | |
Item 10. | | DIRECTORS, EXECUTIVE OFFICERS AND CORPORATE GOVERNANCE | | | 142 | |
Item 11. | | EXECUTIVE COMPENSATION | | | 148 | |
Item 12. | | SECURITY OWNERSHIP OF CERTAIN BENEFICIAL OWNERS AND MANAGEMENT | | | 162 | |
Item 13. | | CERTAIN RELATIONSHIPS AND RELATED TRANSACTIONS, AND DIRECTOR INDEPENDENCE | | | 167 | |
Item 14. | | PRINCIPAL ACCOUNTANT FEES AND SERVICES | | | 169 | |
Part IV | | | | | | |
Item 15. | | EXHIBITS AND FINANCIAL STATEMENT SCHEDULES | | | 170 | |
Signatures | | |
178 | |
Table of Contents
Background Information and Glossary of Certain Defined Terms
The Transactions
On August 30, 2007, investment funds associated with Bain Capital Partners, LLC ("Bain"), The Carlyle Group ("Carlyle") and Clayton, Dubilier & Rice, Inc. ("CD&R") (collectively, the "Equity Sponsors") formed HD Supply Holdings, Inc. (formerly known as HDS Investment Holding, Inc., "Holding") and entered into a stock purchase agreement with The Home Depot, Inc. ("Home Depot" or "THD") pursuant to which Home Depot agreed to sell to Holding, or to a wholly owned subsidiary of Holding, certain intellectual property and all the outstanding common stock of HD Supply, Inc. and the Canadian subsidiary CND Holdings, Inc. On August 30, 2007, through a series of transactions, Holding's direct wholly owned subsidiary, HDS Holding Corporation, acquired direct control of HD Supply through the merger of its wholly owned subsidiary, HDS Acquisition Corp., with and into HD Supply, Inc. (the "Company") and the Canadian subsidiary CND Holdings, Inc. Through these transactions (the "Transactions"), Home Depot was paid cash of $8.2 billion and 12.5% of Holding's common stock worth $325 million.
Defined Terms for Indebtedness
In this annual report on Form 10-K, unless otherwise indicated or the context otherwise requires:
- •
- "7.5% Senior Notes" refers to the Company's 7.50% Senior Notes due 2020 issued on February 1, 2013 in an aggregate principal amount of $1,275 million.
- •
- "11.5% Senior Notes" refers to the Company's 11.50% Senior Notes due 2020 issued on October 15, 2012 in an aggregate principal amount of $1,000 million.
- •
- "14.875% Senior Notes" refers to the Company's 14.875% Senior Notes due 2020 issued on April 12, 2012 in an aggregate principal amount of $757 million.
- •
- "ABL Facility" refers to the Company's asset based lending facility issued on April 12, 2012, providing for senior secured revolving loans and letters of credit of up to a maximum aggregate principal amount of $1,500 million (subject to availability under the borrowing base).
- •
- "April 2012 First Priority Notes" refers to the Company's 81/8% Senior Secured First Priority Notes due 2019 issued on April 12, 2012 in an aggregate principal amount of $950 million.
- •
- "August 2012 First Priority Notes" refers to the Company's 81/8% Senior Secured First Priority Notes due 2019 issued on August 2, 2012 in an aggregate principal amount of $300 million.
- •
- "First Priority Notes" refers collectively to the April 2012 First Priority Notes and the August 2012 First Priority Notes.
- •
- "Old ABL Credit Facility" refers to the senior asset based revolving credit facility entered into by HD Supply (as successor by merger to HDS Acquisition Subsidiary, Inc.) on August 30, 2007 (as amended by Amendment No. 1, dated as of October 3, 2007, Amendment No. 2, dated as of November 1, 2007, and Limited Consent and Amendment No. 3, dated as of March 19, 2010), in an aggregate principal amount of $2,100 million, a portion of which may be used for letters of credit or swing-line loans.
- •
- "Old Senior Notes" refers to the Company's 12.0% Senior Cash Pay Notes due 2014.
- •
- "Old Senior Secured Credit Facility" refers to the senior secured credit facility entered into by HD Supply (as successor by merger to HDS Acquisition Subsidiary, Inc.) on August 30, 2007, as amended on October 2, 2007, November 1, 2007, and March 19, 2010, which consists of a $1,000 million term loan facility and a $300 million revolving credit facility.
1
Table of Contents
- •
- "Old Senior Subordinated Notes" refers to the Company's 13.5% Senior Subordinated Notes due 2015.
- •
- "Old Term Loan" refers to the $1,000 million term loan facility under the Old Senior Secured Credit Facility.
- •
- "Priority Notes" refers collectively to the First Priority Notes and the Second Priority Notes.
- •
- "Refinancing Transactions" refers to the transactions described below in "Description of Indebtedness."
- •
- "Second Priority Notes" refers to the Company's 11.0% Senior Secured Second Priority Notes due 2020 issued on April 12, 2012 in an aggregate principal amount of $675 million.
- •
- "Senior Credit Facilities" refers collectively to the ABL Facility and the Term Loan Facility.
- •
- "Senior Notes" refers collectively to the 11.5% Senior Notes and 7.5% Senior Notes.
- •
- "Senior Subordinated Notes" refers to the Company's 10.5% Senior Subordinated Notes due 2021 issued on January 16, 2013 in an aggregate principal amount of $950 million.
- •
- "Term Loan Facility" refers to the Company's senior secured credit facility issued on April 12, 2012, providing for Term Loans in an aggregate principal amount of $1,000 million.
- •
- "Term Loan" refers to the term loans issued under the Term Loan Facility.
- •
- "THD Guarantee" refers to Home Depot's guarantee of our payment obligations for principal and interest of the Old Term Loan under the Old Senior Secured Credit Facility.
Description of Indebtedness
The following transactions (the "Refinancing Transactions") occurred on April 12, 2012:
- •
- Entry into a new Term Loan Facility and the repayment of all amounts outstanding under our Old Senior Secured Credit Facility.
- •
- Entry into a new ABL Facility and the repayment of all amounts outstanding under our Old ABL Credit Facility.
- •
- Bain and Carlyle exchanged certain of the Old Senior Notes held by them prior to the redemption of the Old Senior Notes for a portion of the 14.875% Senior Notes (the "Sponsor Exchange").
- •
- CD&R purchased a portion of the 14.875% Senior Notes (the "CD&R Purchase" and together with the Sponsor Exchange, the "14.875% Senior Notes Issuance").
- •
- The issuance of the April 2012 First Priority Notes.
- •
- The issuance of the Second Priority Notes.
- •
- The redemption of the remaining Old Senior Notes.
- •
- The termination of the THD Guarantee.
On August 2, 2012, we issued the August 2012 First Priority Notes. The net proceeds from the August 2012 First Priority Notes issuance were used to reduce outstanding borrowings under the Company's ABL Facility.
On October 15, 2012, we issued the 11.5% Senior Notes. On November 8, 2012, the net proceeds from the 11.5% Senior Notes issuance were used to redeem $930 million aggregate principal amount of Old Senior Subordinated Notes at a price of 103.375%.
2
Table of Contents
On January 16, 2013, we issued 10.5% Senior Subordinated Notes. On February 8, 2013, the net proceeds from the Senior Subordinated Notes issuance were used to redeem all of the remaining outstanding principal amount of Old Senior Subordinated Notes at a price of 103.375%.
On February 1, 2013, we issued the 7.5% Senior Notes due 2020. The net proceeds from the 7.5% Senior Notes issuance were used to repurchase all of the outstanding principal amount of 14.875% Senior Notes at a price equal to the principal amount of the 14.875% Senior Notes repurchased plus a make-whole premium (calculated pursuant to the formula set forth in the indenture governing the 14.875% Senior Notes to a repurchase date of February 1, 2013). Also on February 1, 2013, the trustee for the 14.875% Senior Notes cancelled all of the outstanding 14.875% Senior Notes.
On February 15, 2013, we modified the Term Loan Facility to lower the applicable borrowing margins and replace the hard call provision applicable to optional prepayment of term loans thereunder with a soft call option.
Our Senior Credit Facilities, First Priority Notes, Second Priority Notes, Senior Notes, Senior Subordinated Notes, and Old Senior Subordinated Notes are discussed in greater detail in "Item 8. Financial Statements and Supplementary Data—Notes to the Consolidated Financial Statements—Note 6, Debt" within this annual report on Form 10-K.
Glossary of Certain Other Terms
| | |
| ASC | | Accounting Standards Codification |
| HDS Canada | | HD Supply Canada |
| CTI | | Creative Touch Interiors |
| DCF | | Discounted cash flow |
| DOT | | U.S. Department of Transportation |
| Exchange Act | | Securities Exchange Act of 1934 |
| Fiscal 2010 | | Fiscal year ended January 30, 2011 |
| Fiscal 2011 | | Fiscal year ended January 29, 2012 |
| Fiscal 2012 | | Fiscal year ended February 3, 2013 |
| GAAP | | Generally accepted accounting principles in the United States of America |
| Gross margin | | Gross profit as a percentage of net sales |
| HD Supply | | HD Supply, Inc. |
| HDPE | | High-density polyethylene |
| Holding | | HD Supply Holdings, Inc. |
| HVAC | | Heating, ventilating, and air conditioning |
| IPVF | | Industrial Pipes, Valves and Fittings |
| MRO | | Maintenance, repair and operations |
| NOLs | | Net operating losses |
| Peachtree | | Peachtree Business Products LLC |
| PIK | | Paid-in-kind |
| PVC | | Polyvinyl chlorides |
| RAMSCO | | Rexford Albany Municipal Supply Company, Inc. |
| SKU | | Stock-keeping unit |
| SEC | | U.S. Securities and Exchange Commission |
| Vendor rebates | | Vendors providing for inventory purchase rebates |
Forward-looking statements and information
This annual report on Form 10-K includes forward-looking statements within the meaning of the Private Securities Litigation Reform Act of 1995. Some of the forward-looking statements can be
3
Table of Contents
identified by the use of forward-looking terms such as "believes," "expects," "may," "will," "should," "could," "seeks," "intends," "plans," "estimates," "anticipates" or other comparable terms. These forward-looking statements include all matters that are not historical facts. They appear in a number of places throughout this report and include statements regarding our intentions, beliefs or current expectations concerning, among other things, our results of operations, financial condition, liquidity, prospects, growth strategies and the industries in which we operate.
Forward-looking statements are subject to known and unknown risks and uncertainties, many of which may be beyond our control. We caution you that forward-looking statements are not guarantees of future performance and that our actual results of operations, financial condition and liquidity, and the development of the industries in which we operate may differ materially from those made in or suggested by the forward-looking statements contained in this report. In addition, even if our results of operations, financial condition and liquidity, and the development of the industries in which we operate are consistent with the forward-looking statements contained in this report, those results or developments may not be indicative of results or developments in subsequent periods. A number of important factors could cause actual results to differ materially from those contained in or implied by the forward-looking statements, including those reflected in forward-looking statements relating to our operations and business, the risks and uncertainties discussed in this annual report on Form 10-K (See "Risk Factors") and those described from time to time in our other filings with the SEC. Factors that could cause actual results to differ from those reflected in forward-looking statements relating to our operations and business include:
- •
- inherent risks of the maintenance, repair and operations market, infrastructure spending and the non-residential and residential construction markets;
- •
- our ability to achieve profitability;
- •
- our ability to service our debt and to refinance all or a portion of our indebtedness;
- •
- limitations and restrictions in the agreements governing our indebtedness;
- •
- the competitive environment in which we operate and demand for our products and services in highly competitive and fragmented industries;
- •
- the loss of any of our significant customers;
- •
- competitive pricing pressure from our customers;
- •
- our ability to identify and acquire suitable acquisition candidates on favorable terms;
- •
- cyclicality and seasonality of the maintenance, repair and operations market, infrastructure spending and the non-residential and residential construction markets;
- •
- our ability to identify and develop relationships with a sufficient number of qualified suppliers and to maintain our supply chains;
- •
- our ability to manage fixed costs;
- •
- the development of alternatives to distributors in the supply chain;
- •
- our ability to manage our working capital through product purchasing and customer credit policies;
- •
- potential material liabilities under our self-insured programs;
- •
- our ability to attract, train and retain highly qualified associates and key personnel;
- •
- limitations on our income tax net operating loss carryforwards in the event of an ownership change;
4
Table of Contents
- •
- our ability to identify and integrate new products; and
- •
- the significant influence our sponsors have over corporate decisions.
You should read this annual report on Form 10-K completely and with the understanding that actual future results may be materially different from expectations. All forward-looking statements made in this report are qualified by these cautionary statements. These forward-looking statements are made only as of the date of this annual report on Form 10-K, and we do not undertake any obligation, other than as may be required by law, to update or revise any forward-looking statements to reflect changes in assumptions, the occurrence of unanticipated events, changes in future operating results over time or otherwise. Comparisons of results for current and any prior periods are not intended to express any future trends or indications of future performance, unless expressed as such, and should only be viewed as historical data.
5
Table of Contents
PART I
ITEM 1. BUSINESS
Our Company
We are one of the largest industrial distributors in North America. We believe we have leading positions in the three distinct market sectors in which we specialize: Maintenance, Repair & Operations; Infrastructure & Power; and Specialty Construction. These market sectors are large and fragmented, and we believe they present opportunities for significant growth. We aspire to be the "First Choice" of customers, associates, suppliers and the communities in which we operate. This aspiration drives our relentless focus and is reflected in the customer and market centricity, speed and precision, intense teamwork, process excellence and trusted relationships that define our culture. We believe this aspiration distinguishes us from other distributors and has created value for our shareholders, driven above-market growth and delivered attractive returns on invested capital.
We serve our markets with an integrated go-to-market strategy. We operate through over 600 locations across 46 U.S. states and nine Canadian provinces. We have approximately 15,000 associates delivering localized, customer-tailored products, services and expertise. We serve approximately 500,000 customers, which include contractors, government entities, maintenance professionals, home builders and industrial businesses. Our broad range of end-to-end product lines and services include over one million SKUs of quality, name-brand and proprietary-brand products as well as value-add services supporting the entire lifecycle of a project from infrastructure and construction to maintenance, repair and operations. For the fiscal year ended February 3, 2013, or fiscal 2012, we generated $8.0 billion in Net sales, representing 14.3% growth over the fiscal year ended January 29, 2012, or fiscal 2011, or 12.2% excluding the 53rd week of fiscal 2012; $683 million of Adjusted EBITDA, representing 34.4% growth over fiscal 2011, or 31.7% excluding the 53rd week of fiscal 2012; and incurred a Net loss of $1,179 million. For a reconciliation of Net income (loss), the most directly comparable financial measure under GAAP, to Adjusted EBITDA, see "Part II, Item 7. Management's Discussion and Analysis of Financial Condition and Results of Operations—Key Business Metrics—Cash interest expense and Adjusted EBITDA."
We believe our long-standing customer relationships and competitive advantage stem from our knowledgeable associates, extensive product and service offerings, national footprint, integrated best-in-class technology, broad purchasing scale and strategic supplier relationships. We believe that our comprehensive supply chain solutions improve the effectiveness and efficiency of our customers' businesses. Our value-add services include customer training, material and product fabrication, kitting, jobsite delivery, will call pick up options, as well as onsite managed inventory, online material management and emergency response capabilities. Furthermore, we believe our product application knowledge, comprehensive product assortment, and sourcing expertise allow our customers to perform reliably and give them the tools to enhance profitability. We reach our customers through a variety of sales channels, including professional outside and inside sales forces, call centers and branch supported direct marketing programs utilizing market-specific product catalogs, and business unit websites. Our distribution network allows us to provide rapid, reliable, on-time delivery and customer pickup throughout the U.S. and Canada. Additionally, we believe our highly integrated, best-in-class technology provides leading e-commerce and integrated workflow capabilities for our customers, while providing us unparalleled pricing, budgeting, reporting and analytical capabilities across our Company. We believe customers view us as an integral part of the value chain due to our extensive product knowledge, expansive product availability and the ability to directly integrate with their systems and workflows.
Since 2007 we have undertaken significant operating and growth initiatives at all levels. We developed and are implementing a multi-year strategy to optimize our business mix. This strategy includes entering new markets and product lines, streamlining and upgrading our process and technology capabilities, acquiring new capabilities and selling non-core business units. At the same time,
6
Table of Contents
we attracted what we believe to be "best of the best" talent capitalizing on relevant experience, teamwork and change navigation. With this transformational execution behind us, we believe our Company is well-positioned to continue to grow in excess of the markets in which we operate.
We operate our Company through four reportable segments: Facilities Maintenance, Waterworks, Power Solutions and White Cap. The charts below summarize the breakdown of the results for our reportable segments and Corporate & Other in fiscal 2012.
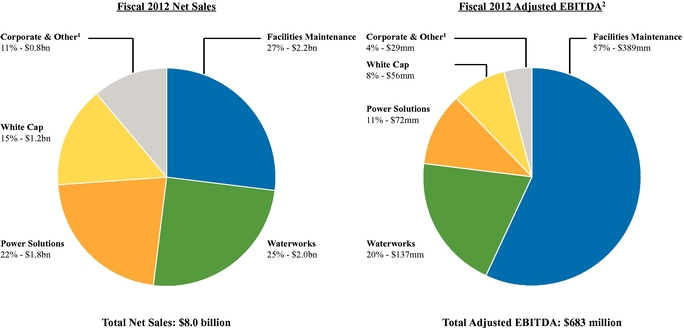
- (1)
- Crown Bolt, CTI, Repair & Remodel and HD Supply Canada, in addition to Corporate and Eliminations, comprise "Corporate & Other."
- (2)
- Adjusted EBITDA is our measure of profitability for our reportable segments and Corporate & Other as presented within our audited consolidated financial statements in accordance with GAAP. See Note 14 to our consolidated financial statements.
Facilities Maintenance. Facilities Maintenance distributes MRO products, provides value-add services and fabricates custom products. Our Facilities Maintenance business unit serves multifamily, hospitality, healthcare and institutional facilities. Products include electrical and lighting items, plumbing, HVAC products, appliances, janitorial supplies, hardware, kitchen and bath cabinets, window coverings, textiles and guest amenities, healthcare maintenance and water and wastewater treatment products. Facilities Maintenance operates a distribution center-based model that sells its products primarily through a professional sales force, print catalogs and e-commerce.
Waterworks. Waterworks distributes complete lines of water and wastewater transmission products, serving contractors and municipalities in the water and waste-water industries for residential and non-residential uses. Our Waterworks business unit serves non-residential, residential, water systems, sewage systems and other markets. Products include pipes, fittings, valves, hydrants and meters for use in the construction, maintenance and repair of water and waste-water systems as well as fire-protection systems. Waterworks has complemented its core products through additional offerings, including smart meters (AMR/AMI), HDPE pipes and specific engineered treatment plant products and services.
Power Solutions. Power Solutions distributes electrical transmission and distribution products, power plant MRO supplies and smart-grid products, and arranges materials management and procurement outsourcing for the power generation and distribution industries. Our Power Solutions business unit serves the utilities and electrical markets. Products include conductors such as wire and
7
Table of Contents
cable, transformers, overhead transmission and distribution hardware, switches, protective devices and underground distribution, connectors used in the construction or maintenance and repair of electricity transmission and substation distribution infrastructure, and electrical wire and cable, switchgear, supplies, lighting and conduit used in non-residential and residential construction.
White Cap. White Cap distributes specialized hardware, tools, engineered materials and safety products to non-residential and residential contractors. Products include tilt-up brace systems, forming and shoring systems, concrete chemicals, hand and power tools, rebar, ladders, safety and fall arrest equipment, specialty screws and fasteners, sealants and adhesives, drainage pipe, geo-synthetics, erosion and sediment control equipment and other engineered materials used broadly across all types of non-residential and residential construction.
Corporate & Other. Corporate & Other is comprised of the following business units: Crown Bolt, CTI, Repair & Remodel and HD Supply Canada. Crown Bolt is a retail distribution operator providing program and packaging solutions, sourcing, distribution, and in-store service, fasteners, builders' hardware, rope and chain and plumbing accessories, primarily serving Home Depot and other hardware stores. CTI offers turnkey supply and installation services for multiple interior finish options, including flooring, cabinets, countertops, and window coverings, along with comprehensive design center services for non-residential, residential and senior living projects. Our Repair & Remodel business unit offers light remodeling and construction supplies, kitchen and bath cabinets, windows, plumbing materials, electrical equipment and other products, primarily to small remodeling contractors and trade professionals. HD Supply Canada is an industrial distributor that primarily focuses on servicing fasteners/industrial supplies and specialty lighting markets which operates across nine provinces. Corporate & Other also includes costs related to our centralized support functions, which include finance, information technology, human resources, legal, supply chain and other support services and removes inter-segment transactions.
8
Table of Contents
Summary of Reportable Segments
The table below is a summary of our four reportable segments. Although our reportable segments are distinct and specialized to reflect the needs of their customers, we operate our Company with an integrated go-to-market strategy.
| | | | | | | | | |
| | | |
 | |
 | |
 | |
 |
| | Overview | | Catalog Based Distributor of MRO Products to Maintenance Professionals | | Distributor of Water, Sewer, Storm and Fire Protection Products | | Distributor of Utilities and Electrical Construction and Industrial Products | | Distributor of Specialty Construction and Safety Supplies |
| | Fiscal 2012 Net Sales | | $2.2 billion | | $2.0 billion | | $1.8 billion | | $1.2 billion |
| | Fiscal 2012 Adjusted EBITDA(1) | | $389 million | | $137 million | | $72 million | | $56 million |
| | Adjusted EBITDA Margin(2) | | 18% | | 7% | | 4% | | 5% |
| | Growth(3) | | 20% | | 21% | | 40% | | 224% |
| | Locations | | 40 Distribution Centers in U.S.; 2 in Canada | | 238 Branches in 44 U.S. States | | 97 Branches in 26 U.S. States; 4 in Canada | | 137 Branches in 31 U.S. States |
| | Approx. SKUs | | 175,000 | | 300,000 | | 220,000 | | 230,000 |
| | Select Products | | Electrical and Lighting Items; Plumbing; HVAC Products; Appliances; Janitorial Supplies; Hardware; Kitchen and Bath Cabinets; Window Coverings; Textiles and Guest Amenities; Healthcare Maintenance; Water and Wastewater Treatment Products | | Water and Wastewater Transmission Products Including Pipe (PVC, Ductile Iron, HDPE); Fittings; Valves; Fire Protection; Metering Systems; Storm Drain; Hydrants; Fusion Machine Rental; Valve Testing and Repair | | Pole Line Hardware; Wire and Cable; Gear and Controls; Power Equipment; Fixtures and Lightning; Meters | | Concrete Accessories and Chemicals; Tools; Engineered Materials and Fasteners; Safety; Erosion and Waterproofing |
|
|
|
 |
|
 |
|
 |
|
 |
| | Value-add Services | | Next Day Delivery; Customized and Fabricated Products; Renovations and Installation Services; Technical Support; Customer Training; e-Commerce Solutions | | Proprietary PC-based Estimating Software; Job Management Reports; Electronic Billing; On-demand Customer Reports; Part Number Interchange; Material Management Online ("MMO"); Database Depot; Distributor Managed Inventory ("DMI") | | Emergency Response Solutions; Integrated Inventory and Sourcing Solutions; IT Solutions (Virtual Warehouse, EDI, Online Ordering, Custom Online Catalog); SmartGrid; Project Services (Material Take Offs and Laydown Yards); Tool Repair | | Pre-Bid Assistance; Product Submittals; Value Engineering; Change Order Support; Rentals (Tilt-Up Braces, Forming/Shoring, Equipment); Fabrication Including Detailing and Engineering; Tool Repair; Electronic Billing |
| | Customer Examples | | Residential Property Owners and Managers; Hotels and Lodging Facilities; Assisted Living Facilities Institutions; Water and Wastewater Treatment Facilities | | Professional Contractors Serving Municipalities, Non-residential and Residential Construction | | Municipalities and Co-ops; Investor Owned Utilities; Non-residential, Residential and Mechanical Contractors; Industrial (Industrial Manufactures, MRO, Oil and Gas Contractors) | | Professional Contractors Serving Non-residential, Residential and Industrial Construction |
|
|
|
 |
- (1)
- Adjusted EBITDA is our measure of profitability for our reportable segments as presented within our consolidated financial statements in accordance with GAAP. See Note 14 to our consolidated financial statements.
- (2)
- Adjusted EBITDA Margin is equal to Adjusted EBITDA divided by Net sales.
- (3)
- Growth is equal to growth in Adjusted EBITDA over fiscal 2011 and excludes the 53rd week of fiscal 2012.
- (4)
- Management estimates based on market data and industry knowledge.
- (5)
- Unless stated otherwise, market position refers to management's estimate of our market position in North America within the estimated addressable markets we serve.
9
Table of Contents
Our Market Sectors
We offer a diverse range of products and services to the Maintenance, Repair & Operations, Infrastructure & Power and Specialty Construction market sectors in the U.S. and Canada. The markets in which we operate have a high degree of customer and supplier fragmentation, with customers that typically demand a high level of service and availability of a broad set of complex products from a large number of suppliers. These market dynamics make the distributor a critical element within the value chain.
The table below summarizes our market sectors, business units and end-markets, including our net sales by end-market.
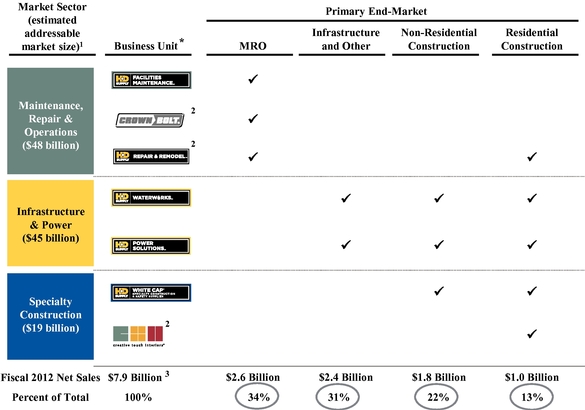
- *
- Excludes HD Supply Canada.
- (1)
- Management estimates based on market data and industry knowledge.
- (2)
- Crown Bolt, Creative Touch Interiors, Repair & Remodel and HD Supply Canada, in addition to Corporate and Eliminations, comprise "Corporate & Other."
- (3)
- Figures do not foot due to rounding. Excludes HD Supply Canada.
Maintenance, Repair & Operations
In the Maintenance, Repair & Operations market sector, our Facilities Maintenance, Crown Bolt and Repair & Remodel business units serve customers across multiple industries by primarily delivering supplies and services needed to maintain and upgrade multifamily, hospitality, healthcare and institutional facilities. Facilities Maintenance and Crown Bolt are distribution center based models, while Repair & Remodel operates through retail outlets primarily serving cash and carry customers. We estimate that this market sector currently represents an addressable market in excess of $48 billion annually with demand driven primarily by ongoing maintenance requirements of a broad range of existing structures and traditional repair and remodeling construction activity across multiple industries.
10
Table of Contents
We believe Facilities Maintenance customers value speed and product availability over price. In addition, we believe that our leadership position in this sector positions us to capitalize on improving business conditions across our addressable market. For example, we expect to benefit from the relative stability of demand for MRO materials during periods of lower vacancy rates within multifamily housing and higher occupancy rates within hospitality.
Infrastructure & Power
In the Infrastructure & Power market sector, Waterworks and Power Solutions support both established infrastructure and new projects by meeting demand for critical supplies and services used to build and maintain water systems and electrical power generation, transmission and distribution infrastructure. We estimate that this market sector currently represents an addressable market in excess of $45 billion annually with demand in the U.S. driven primarily by an aging and overburdened national infrastructure, general population growth trends and the need for cost-effective energy distribution. The broad geographic presence of our business units, through a regionally organized branch distribution network, reduces our exposure to economic factors in any single region. We believe we have the potential to capitalize on a substantial backlog of deferred projects that will need to be addressed in the coming years as a result of our customers delaying much needed upgrades or repairs during the recent economic downturn as well as a recovery in the non-residential and residential construction markets.
Specialty Construction
In the Specialty Construction market sector, White Cap and CTI serve professional contractors and trades by meeting their distinct and customized supply needs in non-residential, residential and industrial applications. We estimate that this market sector currently represents an addressable market in excess of $19 billion annually with demand driven primarily by residential construction, non-residential construction, industrial and repair and remodeling construction spending. White Cap is our primary business unit serving this sector through the broad national presence of its regionally organized branch distribution network. CTI serves its market through a network of branches and design centers. We believe we are well-positioned to benefit from the recovery from historical lows within the non-residential and residential construction end-markets.
Our History
In March 1997, Home Depot, the former parent of our operating subsidiaries, acquired Maintenance Warehouse / America Corp., a Texas corporation organized on January 26, 1985, and a leading direct marketer of MRO products to the hospitality and multifamily housing markets. Since 1997, our business has grown rapidly, primarily through the acquisition of more than 40 businesses.
From fiscal 2000 to fiscal 2004, we extended our presence into new categories while growing existing businesses through 10 acquisitions. New businesses included plumbing and HVAC (through the acquisition of Apex Supply), flooring products and installation (Floors, Inc., Floorworks, Inc., Arvada Hardwood Floor Company) and specialty hardware, tools and materials for construction contractors (White Cap). Growth at existing businesses was driven organically and through "tuck-in" acquisitions, expanding our presence in the Maintenance, Repair & Operations market sector (N-E Thing Supply, Economy Maintenance Supply) and flooring and design services for professional homebuilders (Creative Touch Interiors).
In fiscal 2005, we accelerated the pace of consolidation by acquiring 18 businesses, the largest of which was National Waterworks, a leading distributor of products used to build, repair and maintain water and wastewater transmission systems. In fiscal 2006, we transformed our business with the acquisition of Hughes Supply, which doubled our Net sales and further established our market leadership in a number of our largest business units, which we supplemented with 11 other strategic acquisitions.
11
Table of Contents
In 2007, investment funds associated with the Equity Sponsors formed Holding and purchased HD Supply from Home Depot. In connection with the 2007 Acquisition, Home Depot obtained a 12.5% interest in the common stock of Holding.
Since 2007, we have focused on extending our presence in key growth sectors and exiting less attractive sectors. In February 2008, we sold our Lumber and Building Materials operations to ProBuild Holdings. In June 2009, we purchased substantially all of the assets of ORCO Construction Supply, the second largest construction materials distributor in the U.S., through White Cap. In February 2011, we sold all of the assets of SESCO/QUESCO, an electrical products division of HD Supply Canada, to Sonepar Canada. In May 2011, we purchased all of the assets of RAMSCO, expanding Waterworks in upstate New York. In September 2011, we sold our Plumbing/HVAC operations to Hajoca Corporation. In March 2012, we sold our IPVF business to Shale-Inland Holdings LLC. In June 2012, we acquired Peachtree, which specializes in customizable business and property marketing supplies, to enhance Facilities Maintenance. In December 2012, we purchased substantially all of the assets of Water Products, expanding the geographic footprint of Waterworks.
Customers and Suppliers
We maintain a customer base of approximately 500,000 customers, many of which represent long-term relationships. Home Depot is our largest customer, accounting for approximately 4% of fiscal 2012 Net sales. We are subject to very low customer concentration with no customer, other than Home Depot, representing more than 1% of fiscal 2012 Net sales, reducing our exposure to any single customer.
We have developed relationships with approximately 15,000 strategic suppliers, many of which are long-standing. These supplier relationships provide us with reliable access to inventory, volume purchasing benefits and the ability to deliver a diverse product offering on a cost-effective basis. We maintain multiple suppliers for a substantial number of our products, thereby limiting the risk of product shortage for customers.
Competition
We operate in a highly fragmented industry and hold leading positions in multiple market sectors. Competition, including our competitors and specific competitive factors, varies for each market sector. The majority of our competition comes from mid-size regional distributors and small, local distributors; however, we also face competition from a number of national competitors, including Fastenal, Grainger, MSC Industrial, Rexel, Watsco, WESCO and Wolseley plc (Ferguson division).
We believe the principal competitive factors for our market sectors include local selling capabilities, availability, breadth and cost of materials and supplies, technical knowledge and expertise, value-add service capabilities, customer and supplier relationships, reliability and accuracy of service, effective use of technology, delivery capabilities and timeliness, pricing of products, and the provision of credit. We believe that our competitive strengths and strategy allow us to compete effectively in our market sectors.
Seasonality
In a typical year, our operating results are impacted by seasonality. Historically, sales of our products have been higher in the second and third quarters of each fiscal year due to favorable weather and longer daylight conditions during these periods. Seasonal variations in operating results may also be significantly impacted by inclement weather conditions, such as cold or wet weather, which can delay construction projects.
12
Table of Contents
Products
Maintenance, Repair & Operations:
Facilities Maintenance: Electrical and lighting items, plumbing, HVAC products, appliances, janitorial supplies, hardware, kitchen and bath cabinets, window coverings, textiles and guest amenities, healthcare maintenance and water and wastewater treatment products.
Crown Bolt: Fasteners, builders hardware, rope and chain, and plumbing accessories primarily consumed in home improvement, do-it-yourself projects and residential construction.
Repair & Remodel: Kitchen cabinets, windows, plumbing materials, masonry, electrical equipment, lumber, flooring and tools and tool rentals for small remodeling, home improvement and do-it-yourself residential projects.
Infrastructure & Power:
Waterworks: Water and wastewater transmission products including pipe (PVC, Ductile Iron, HDPE), fittings, valves, fire protection, metering systems, storm drain, hydrants, fusion machine rental, valve testing and repair.
Power Solutions: Pole line hardware, wire and cable, gear and controls, power equipment, fixtures and lightning, meters
Specialty Construction:
White Cap: Concrete accessories and chemicals, tools, engineered materials and fasteners, safety, erosion and waterproofing.
CTI: Flooring, cabinets, countertops and window coverings, along with comprehensive design center services, for the interior finish of non-residential, residential and senior living projects.?
Intellectual property
Our trademarks and those of our subsidiaries, certain of which are material to our business, are registered or otherwise legally protected in the United States, Canada and elsewhere. We, together with our subsidiaries, own approximately 160 trademarks registered worldwide. We also rely upon trade secrets and know-how to develop and maintain our competitive position. We protect intellectual property rights through a variety of methods, including trademark, patent, copyright and trade secret laws, in addition to confidentiality agreements with suppliers, employees, consultants and others who have access to our proprietary information. Generally, registered trademarks have a perpetual life,provided that they are renewed on a timely basis and continue to be used properly as trademarks. We intend to maintain our material trademark registrations so long as they remain valuable to our business. Other than the trademarksHD Supply (and design),USABluebook,Creative Touch Interiors andWhite Cap, we do not believe our business is dependent to a material degree on trademarks, patents, copyrights or trade secrets. Other than commercially available software licenses, we do not believe that any of our licenses for third-party intellectual property are material to our business, taken as a whole. See "Risk Factors—If we are unable to protect our intellectual property rights, or we infringe on the intellectual property rights of others, our ability to compete could be negatively impacted."
13
Table of Contents
Employees
In domestic and international operations, we had approximately 15,000 employees as of February 3, 2013, consisting of approximately 9,000 hourly personnel and approximately 6,000 salaried employees.
As of February 3, 2013, less than one percent of our hourly workforce was covered by collective bargaining agreements.
Regulation
Our operations are affected by various statutes, regulations and laws in the markets in which we operate, which historically have not had a material effect on our business. While we are not engaged in a regulated industry, we are subject to various laws applicable to businesses generally, including laws affecting land usage, zoning, the environment, health and safety, transportation, labor and employment practices (including pensions), competition, immigration and other matters. Additionally, building codes may affect the products our customers are allowed to use, and consequently, changes in building codes may affect the saleability of our products. The transportation and disposal of many of our products are also subject to federal regulations. The DOT regulates our operations in domestic interstate commerce. We are subject to safety requirements governing interstate operations prescribed by the DOT. Vehicle dimensions and driver hours of service also remain subject to both federal and state regulation. See "Risk Factors—Risks Relating to Our Business—Our costs of doing business could increase as a result of changes in U.S. federal, state or local regulations."
Environmental, Health and Safety Matters
We are subject to a broad range of foreign, federal, state and local environmental, health and safety laws and regulations, including those pertaining to air emissions, water discharges, the handling, disposal and transport of solid and hazardous materials and wastes, the investigation and remediation of contamination and otherwise relating to health and safety and the protection of the environment and natural resources. As our operations, and those of many of the companies we have acquired, to a limited extent involve and have involved the handling, transport and distribution of materials that are, or could be classified as, toxic or hazardous, there is some risk of contamination and environmental damage inherent in our operations and the products we handle, transport and distribute. Our environmental, health and safety liabilities and obligations may result in significant capital expenditures and other costs, which could negatively impact our business, financial condition and results of operations. We may be fined or penalized by regulators for failing to comply with environmental, health and safety laws and regulations, or we may be held responsible for such failures by companies we have acquired. In addition, contamination resulting from our current or past operations, and those of many of the companies we have acquired, may trigger investigation or remediation obligations, which may have a material adverse effect on our business, financial condition and results of operations.
Available Information
We are subject to the reporting and information requirements of the Exchange Act and, as a result, we file periodic reports and other information with the SEC.
The public may read and copy any such reports or other information that we file with the SEC. Such filings are available to the public over the internet at the SEC's website at http://www.sec.gov. The SEC's website is included in this annual report on Form 10-K as an inactive textual reference only. In addition, the Company's annual report on Form 10-K, quarterly reports on Form 10-Q, current reports on Form 8-K, and amendments to those reports are available free of charge to the public through the "Investor Relations" portion of the Company's website, www.hdsupply.com, as soon as reasonably practical after they are filed with the SEC. We include our website address in this filing only as a
14
Table of Contents
textual reference. The information contained on our website is not incorporated by reference into this report. You may also obtain a copy of any information that we file with the SEC at no cost by calling us, or writing to us, at the following address:
HD Supply, Inc.
3100 Cumberland Boulevard, Suite 1480
Atlanta, Georgia 30339
Attn: General Counsel
(770) 852-9000
15
Table of Contents
ITEM 1A. RISK FACTORS
Risks Relating to Our Business
We are subject to inherent risks of the maintenance, repair and operations market, infrastructure spending and the non-residential and residential construction markets, including risks related to general economic conditions.
Demand for our products and services depends to a significant degree on spending in our markets. The level of activity in our markets depends on a variety of factors that we cannot control.
Historically, both new housing starts and residential remodeling have decreased in slow economic periods. In addition, residential construction activity can impact the level of non-residential construction activity. Other factors impacting the level of activity in the non-residential and residential construction markets include:
- •
- changes in interest rates;
- •
- unemployment rates;
- •
- high foreclosure rates and unsold/foreclosure inventory;
- •
- unsold new housing inventory;
- •
- availability of financing (including the impact of disruption in the mortgage markets);
- •
- adverse changes in industrial economic outlook;
- •
- a decrease in the affordability of homes;
- •
- vacancy rates;
- •
- capacity utilization;
- •
- capital spending;
- •
- commercial investment;
- •
- corporate profitability;
- •
- local, state and federal government regulation; and
- •
- shifts in populations away from the markets that we serve.
Infrastructure spending depends largely on interest rates, availability and commitment of public funds for municipal spending, capacity utilization and general economic conditions. In the maintenance, repair and operations market, the level of activity depends largely on the number of units and occupancy rates within multifamily, hospitality, healthcare and institutional facilities markets. Because all of our markets are sensitive to changes in the economy, downturns (or lack of substantial improvement) in the economy in any region in which we operate have adversely affected and could continue to adversely affect our business, financial condition and results of operations. For example, we distribute many of our products to waterworks contractors in connection with non-residential, residential and industrial construction projects. The water and wastewater transmission products industry is affected by changes in economic conditions, including national, regional and local standards in construction activity, and the amount spent by municipalities on waterworks infrastructure. While we operate in many markets in the United States and Canada, our business is particularly impacted by changes in the economies of California, Texas and Florida, which represented approximately 15%, 13% and 9%, respectively, in net sales for fiscal 2012.
In addition, the markets in which we compete are sensitive to general business and economic conditions in the United States and worldwide, including availability of credit, interest rates,
16
Table of Contents
fluctuations in capital, credit and mortgage markets, and business and consumer confidence. Adverse developments in global financial markets and general business and economic conditions, including through recession, downturn or otherwise, could have a material adverse effect on our business, financial condition, results of operations and cash flows, including our ability and the ability of our customers and suppliers to access capital. There was a significant decline in economic growth, both in the United States and worldwide, that began in the second half of 2007 and continued through 2009. In addition, volatility and disruption in the capital markets during that period reached unprecedented levels, with stock markets falling dramatically and credit becoming very expensive or unavailable to many companies without regard to those companies' underlying financial strength. As a result of these developments, many lenders and institutional investors reduced, and in some cases, ceased to provide funding to borrowers. Although there have been some indications of stabilization in the general economy and certain industries and markets in which we operate, there can be no guarantee that any improvement in these areas will continue or be sustained.
We have been, and may continue to be, adversely impacted by the decline in the new residential construction market since its peak in 2005.
Most of our business units are dependent to varying degrees upon the new residential construction market. The homebuilding industry has undergone a significant decline from its peak in 2005. According to the U.S. Census Bureau, actual single family housing starts in the U.S. during 2012 increased 24% from 2011 levels, but remain 69% below their peak in 2005. The multi-year downturn in the homebuilding industry has resulted in a substantial reduction in demand for our products and services, which in turn had a significant adverse effect on our business and operating results during fiscal years 2008 to 2012, as compared to peak levels. In addition, the mortgage markets continue to experience disruption and reduced availability of mortgages for potential homebuyers due to more restrictive standards to qualify for mortgages, including with respect to new home construction loans.
We cannot predict the duration of the current housing industry market conditions, or the timing or strength of any future recovery of housing activity in our markets. We also cannot provide any assurances that the homebuilding industry will recover to historical levels, or that the operational strategies we have implemented to address the current market conditions will be successful. Continued weakness in the new residential construction market would have a significant adverse effect on our business, financial condition and operating results. In addition, because of these factors, there may be fluctuations in our operating results, and the results for any historical period may not be indicative of results for any future period.
The non-residential construction market continues to experience a downturn which could materially and adversely affect our business, liquidity and results of operations.
Many of our business units are dependent on the non-residential construction market and the slowdown and volatility of the United States economy in general is having an adverse effect on our business units that serve this industry. According to the U.S. Census Bureau, actual non-residential construction put-in-place in the U.S. during 2012 increased 8% from 2011 levels, but remains 12% lower than 2009 levels. From time to time, our business units that serve the non-residential construction market have also been adversely affected in various parts of the country by declines in non-residential construction starts due to, among other things, changes in tax laws affecting the real estate industry, high interest rates and the level of residential construction activity. Continued uncertainty about current economic conditions will continue to pose a risk to our business units that serve the non-residential construction market as participants in this industry may postpone spending in response to tighter credit, negative financial news and/or declines in income or asset values, which could have a continued material negative effect on the demand for our products and services.
17
Table of Contents
We cannot predict the duration of the current market conditions, or the timing or strength of any future recovery of non-residential construction activity in our markets. Continued weakness in the non-residential construction market would have a significant adverse effect on our business, financial condition and operating results. In addition, because of these factors, there may be fluctuations in our operating results, and the results for any historical period may not be indicative of results for any future period.
Residential renovation and improvement activity levels may not return to historic levels which may negatively impact our business, liquidity and results of operations.
Certain of our business units rely on residential renovation and improvement (including repair and remodeling) activity levels. Unlike most previous cyclical declines in new home construction in which we did not experience comparable declines in our home improvement business units, the recent economic decline adversely affected our home improvement business units as well. According to Moody's Economy.com, residential improvement project spending in the United States increased 10% in 2012, but remains 14% below its peak in 2006. Continued high unemployment levels, high mortgage delinquency and foreclosure rates, limitations in the availability of mortgage and home improvement financing and significantly lower housing turnover, may continue to limit consumers' spending, particularly on discretionary items, and affect their confidence level leading to continued reduced spending on home improvement projects.
We cannot predict the timing or strength of a significant recovery in these markets. Continued depressed activity levels in consumer spending for home improvement and new home construction will continue to adversely affect our results of operations and our financial position. Furthermore, continued economic weakness may cause unanticipated shifts in consumer preferences and purchasing practices and in the business models and strategies of our customers. Such shifts may alter the nature and prices of products demanded by the end consumer and our customers and could adversely affect our operating performance.
We may be unable to achieve or maintain profitability.
We have set goals to progressively improve our profitability over time by growing our sales, increasing our gross margin and reducing our expenses as a percentage of sales. For the fiscal years 2012 and 2011 we had net losses of $1,179 million and $543 million, respectively. There can be no assurance that we will achieve our enhanced profitability goals. Factors that could significantly adversely affect our efforts to achieve these goals include, but are not limited to, the failure to:
- •
- grow our revenue through organic growth or through acquisitions;
- •
- improve our revenue mix by investing (including through acquisitions) in businesses that provide higher margins than we have been able to generate historically;
- •
- achieve improvements in purchasing or to maintain or increase our rebates from vendors through our vendor consolidation and/or low-cost country initiatives;
- •
- improve our gross margins through the utilization of improved pricing practices and technology and sourcing savings;
- •
- maintain or reduce our overhead and support expenses as we grow;
- •
- effectively evaluate future inventory reserves;
- •
- collect monies owed from customers;
- •
- maintain relationships with our significant customers; and
- •
- integrate any businesses acquired.
18
Table of Contents
Any of these failures or delays may adversely affect our ability to increase our profitability.
We may be required to take impairment charges relating to our operations which could impact our future operating results.
As of February 3, 2013, goodwill represented approximately 43% of our total assets. Goodwill is not amortized and is subject to impairment testing at least annually using a fair value based approach. The identification and measurement of impairment involves the estimation of the fair value of reporting units. The estimates of fair value of reporting units are based on the best information available as of the date of the assessment and incorporate management assumptions about expected future cash flows and other valuation techniques. Future cash flows can be affected by changes in industry or market conditions among other things.
The recoverability of goodwill is evaluated at least annually and when events or changes in circumstances indicate that the fair value of a reporting unit has more likely than not declined below its carrying value. The annual impairment test resulted in no impairment of goodwill during fiscal 2012, fiscal 2011 or fiscal 2010. However, during the fourth quarter of fiscal 2012, our Crown Bolt business reached an agreement to amend and extend its strategic purchase agreement with Home Depot. While the amendment extends the agreement five years through fiscal 2019, retaining Crown Bolt as the exclusive supplier of certain products to Home Depot, it eliminates the minimum purchase requirement and adjusted future pricing. These changes resulted in a reduction of expected future cash proceeds from Home Depot. We, therefore, considered this amendment a triggering event and, as such, we performed an additional goodwill impairment analysis for Crown Bolt. As a result of the analysis, we recorded a non-cash, pre-tax goodwill impairment charge of $150 million during the fourth quarter of fiscal 2012.
We cannot accurately predict the amount and timing of any impairment of assets. In addition to the goodwill impairment charge we recorded in fiscal 2012, we may be required to take additional goodwill or other asset impairment charges relating to certain of our reporting units and asset groups, if weakness in the non-residential and/or residential construction markets and/or the general U.S. economy continues. Similarly, certain company transactions, such as the amendment to the Crown Bolt strategic purchase agreement with Home Depot, could result in additional goodwill impairment charges being recorded. Any such non-cash charges would have an adverse effect on our financial results.
In view of the general economic downturn in the United States, we may be required to close under-performing locations.
We may have to close under-performing branches from time to time as warranted by general economic conditions and/or weakness in the industries in which we operate. For example, during the economic downturn from 2007 through fiscal 2010, we closed branches and terminated employees as part of our restructuring plans during that timeframe. Any future facility closures could have a significant adverse effect on our financial condition, operating results and cash flows.
We occupy most of our facilities under long-term non-cancelable leases. We may be unable to renew leases on favorable terms or at all. Also, if we close a facility, we remain obligated under the applicable lease.
Most of our facilities are located in leased premises. Many of our current leases are non-cancelable and typically have terms ranging from 3 to 5 years, with options to renew for specified periods of time. We believe that leases we enter into in the future will likely be long-term and non-cancelable and have similar renewal options. However, there can be no assurance that we will be able to renew our current or future leases on favorable terms or at all which could have an adverse effect on our ability to operate our business and on our results of operations. In addition, if we close or idle a facility, we generally remain committed to perform our obligations under the applicable lease,
19
Table of Contents
which include, among other things, payment of the base rent for the balance of the lease term. Over the course of the last three fiscal years, we closed or idled facilities for which we remain liable on the lease obligations. Our obligation to continue making rental payments in respect of leases for closed or idled facilities could have a material adverse effect on our business and results of operations.
The industries in which we operate are highly competitive and fragmented, and demand for our products and services could decrease if we are not able to compete effectively.
The markets in which we operate are fragmented and highly competitive. Our competition includes other distributors and manufacturers that sell products directly to their respective customer base and some of our customers that resell our products. To a limited extent, retailers of electrical fixtures and supplies, building materials, maintenance, repair and operations supplies and contractors' tools also compete with us. We also expect that new competitors may develop over time as internet-based enterprises become more established and reliable and refine their service capabilities. Competition varies depending on product line, customer classification and geographic area.
We compete with many local, regional and, in several markets and product categories, other national distributors. Several of our competitors in one or more of our business units have substantially greater financial and other resources than us. No assurance can be given that we will be able to respond effectively to such competitive pressures. Increased competition by existing and future competitors could result in reductions in sales, prices, volumes and gross margins that could materially adversely affect our business, financial condition and results of operations. Furthermore, our success will depend, in part, on our ability to maintain our market share and gain market share from competitors.
In addition, contracts with municipalities are often awarded and renewed through periodic competitive bidding. We may not be successful in obtaining or renewing these contracts, which could be harmful to our business and financial performance.
Our competitors continue to consolidate, which could cause markets to become more competitive and could negatively impact our business.
Our competitors in the United States and Canada are consolidating. This consolidation is being driven by customer needs and supplier capabilities, which could cause markets to become more competitive as greater economies of scale are achieved by distributors. Customers are increasingly aware of the total costs of fulfillment and of the need to have consistent sources of supply at multiple locations. We believe these customer needs could result in fewer distributors as the remaining distributors become larger and capable of being a consistent source of supply.
There can be no assurance that we will be able to take advantage effectively of this trend toward consolidation. The trend in our industry toward consolidation could make it more difficult for us to maintain operating margins and could also increase competition for our acquisition targets and result in higher purchase price multiples. Furthermore, as our industrial and construction customers face increased foreign competition and potentially lose business to foreign competitors or shift their operations overseas in an effort to reduce expenses, we may face increased difficulty in growing and maintaining our market share and growth prospects in these markets.
The loss of any of our significant customers could adversely affect our financial condition.
Our ten largest customers generated approximately 8% of our Net sales in fiscal 2012, and our largest customer, Home Depot, accounted for approximately 4% of our Net sales in that same period. We cannot guarantee that we will maintain or improve our relationships with these customers or that we will continue to supply these customers at historical levels. During the economic downturn, some of our customers reduced their operations. For example, some homebuilder customers exited or severely
20
Table of Contents
curtailed building activity in certain of our markets. There is no assurance that our customers will determine to increase their operations or return to historic levels. Slow economic recovery could continue to have a significant adverse effect on our financial condition, operating results and cash flows.
In addition, consolidation among customers could also result in a loss of some of our present customers to our competitors. The loss of one or more of our significant customers, a significant customer's decision to purchase our products in significantly lower quantities than they have in the past, or deterioration in our relationship with any of them could significantly affect our financial condition, operating results and cash flows. For example, during fiscal 2012 our Crown Bolt business agreed to an amendment of its strategic purchase agreement with Home Depot. While the amendment extends the agreement five years through fiscal 2019, it eliminates the minimum purchase requirement and adjusts future pricing. These changes resulted in a reduction of expected future cash proceeds from Home Depot. We, therefore, considered this amendment a triggering event and, as such, we performed an additional goodwill impairment analysis for Crown Bolt. As a result of the analysis, we recorded a non-cash, pre-tax goodwill impairment charge of $150 million during the fourth quarter of fiscal 2012.
Generally, our customers are not required to purchase any minimum amount of products from us. The contracts into which we have entered with most of our customers typically provide that we supply particular products or services for a certain period of time when and if ordered by the customer. Should our customers purchase our products in significantly lower quantities than they have in the past, such decreased purchases could have a material adverse effect on our financial condition, operating results and cash flows.
The majority of our net sales are credit sales which are made primarily to customers whose ability to pay is dependent, in part, upon the economic strength of the industry and geographic areas in which they operate, and the failure to collect monies owed from customers could adversely affect our financial condition.
The majority of our Net sales volume in fiscal 2012 was facilitated through the extension of credit to our customers whose ability to pay is dependent, in part, upon the economic strength of the industry in the areas where they operate. Our business units offer credit to customers, either through unsecured credit that is based solely upon the creditworthiness of the customer, or secured credit for materials sold for a specific job where the security lies in lien rights associated with the material going into the job. The type of credit offered depends both on the financial strength of the customer and the nature of the business in which the customer is involved. End users, resellers and other non-contractor customers generally purchase more on unsecured credit than secured credit. The inability of our customers to pay off their credit lines in a timely manner, or at all, would adversely affect our financial condition, operating results and cash flows. Furthermore, our collections efforts with respect to non-paying or slow-paying customers could negatively impact our customer relations going forward.
Because we depend on the creditworthiness of certain of our customers, if the financial condition of our customers declines, our credit risk could increase. Significant contraction in our markets, coupled with tightened credit availability and financial institution underwriting standards, could adversely affect certain of our customers. Should one or more of our larger customers declare bankruptcy, it could adversely affect the collectability of our accounts receivable, bad debt reserves and net income.
21
Table of Contents
We are subject to competitive pricing pressure from our customers.
Certain of our largest customers historically have exerted significant pressure on their outside suppliers to keep prices low because of their market share and their ability to leverage such market share in the highly fragmented building products supply industry. The economic downturn has resulted in increased pricing pressures from our customers. If we are unable to generate sufficient cost savings to offset any price reductions, our financial condition, operating results and cash flows may be adversely affected.
We may not achieve the acquisition component of our growth strategy.
Acquisitions may continue to be an important component of our growth strategy; however, there can be no assurance that we will be able to continue to grow our business through acquisitions as we have done historically or that any businesses acquired will perform in accordance with expectations or that business judgments concerning the value, strengths and weaknesses of businesses acquired will prove to be correct. Future acquisitions may result in the incurrence of debt and contingent liabilities, an increase in interest expense and amortization expense and significant charges relative to integration costs. Our strategy could be impeded if we do not identify suitable acquisition candidates and our financial condition and results of operations will be adversely affected if we overpay for acquisitions.
Acquisitions involve a number of special risks, including:
- •
- problems implementing disclosure controls and procedures for the newly acquired business;
- •
- unforeseen difficulties extending internal control over financial reporting and performing the required assessment at the newly acquired business;
- •
- potential adverse short-term effects on operating results through increased costs or otherwise;
- •
- diversion of management's attention and failure to recruit new, and retain existing, key personnel of the acquired business;
- •
- failure to successfully implement infrastructure, logistics and systems integration;
- •
- our business growth could outpace the capability of our systems; and
- •
- the risks inherent in the systems of the acquired business and risks associated with unanticipated events or liabilities, any of which could have a material adverse effect on our business, financial condition and results of operations.
In addition, we may not be able to obtain financing necessary to complete acquisitions on attractive terms or at all.
A range of factors may make our quarterly revenues and earnings variable.
We have historically experienced, and in the future expect to continue to experience, variability in revenues and earnings on a quarterly basis. The factors expected to contribute to this variability include, among others: (i) the cyclical nature of some of the markets in which we compete, including the non-residential and residential construction markets, (ii) general economic conditions in the various local markets in which we compete, (iii) the pricing policies of our competitors, (iv) the production schedules of our customers and (v) the effects of the weather. These factors, among others, make it difficult to project our operating results on a consistent basis.
22
Table of Contents
The maintenance, repair and operations market, infrastructure spending and the non-residential and residential construction markets are seasonal and cyclical.
Although weather patterns affect our operating results throughout the year, adverse weather historically has reduced construction and maintenance and repair activity in our first and fourth fiscal quarters. In contrast, our highest volume of Net sales historically has occurred in our second fiscal quarter. To the extent that hurricanes, severe storms, floods, other natural disasters or similar events occur in the geographic regions in which we operate, our business may be adversely affected. In addition, most of our business units experience seasonal variation as a result of the dependence of our customers on suitable weather to engage in construction, maintenance and renovation and improvement projects. For example, White Cap sells products used primarily in the non-residential and residential construction industry. Generally, during the winter months, construction activity declines due to inclement weather and shorter daylight hours. As a result, operating results for the business units that experience such seasonality may vary significantly from period to period. We anticipate that fluctuations from period to period will continue in the future.
Disruptions at distribution centers or shipping ports, due to events such as work stoppages, the flooding from Hurricane Sandy in 2012, as well as disruptions caused by tornadoes, blizzards and other storms from time to time, may affect our ability to both maintain key products in inventory and deliver products to our customers on a timely basis, which may in turn adversely affect our results of operations.
In addition, infrastructure spending and the non-residential and residential construction markets are subject to cyclical market pressures. The length and magnitude of these cycles have varied over time and by market. Prices of the products we sell are historically volatile and subject to fluctuations arising from changes in supply and demand, national and international economic conditions, labor costs, competition, market speculation, government regulation and trade policies, as well as from periodic delays in the delivery of our products. We have a limited ability to control the timing and amount of changes to prices that we pay for our products. In addition, the supply of our products fluctuates based on available manufacturing capacity. A shortage of capacity, or excess capacity, in the industry can result in significant increases or declines in market prices for those products, often within a short period of time. Such price fluctuations can adversely affect our financial condition, operating results and cash flows.
Fluctuating commodity prices may adversely impact our results of operations.
The cost of steel, aluminum, copper, ductile iron, PVC and other commodities used in the products we distribute can be volatile. Although we attempt to resist cost increases by our suppliers and to pass on increased costs to our customers, we are not always able to do so quickly or at all. In addition, if prices decrease for commodities used in products we distribute, we may have inventories purchased at higher prices than prevailing market prices. Significant fluctuations in the cost of the commodities used in products we distribute have in the past adversely affected, and in the future may adversely affect, our results of operations and financial condition.
If petroleum prices increase, our results of operations could be adversely affected.
Petroleum prices have fluctuated significantly in recent years. Prices and availability of petroleum products are subject to political, economic and market factors that are outside our control. Political events in petroleum-producing regions as well as hurricanes and other weather-related events may cause the price of fuel to increase. Within several of our business units, we deliver a significant volume of products to our customers by truck. Our operating profit will be adversely affected if we are unable to obtain the fuel we require or to fully offset the anticipated impact of higher fuel prices through increased prices or fuel surcharges to our customers. Besides passing fuel costs on to customers, we
23
Table of Contents
have not entered into any hedging arrangements that protect against fuel price increases and we do not have any long-term fuel purchase contracts. If shortages occur in the supply of necessary petroleum products and we are not able to pass along the full impact of increased petroleum prices to our customers, our results of operations would be adversely affected.
Product shortages may impair our operating results.
Our ability to offer a wide variety of products to our customers is dependent upon our ability to obtain adequate product supply from manufacturers or other suppliers. Generally, our products are obtainable from various sources and in sufficient quantities. However, the loss of, or substantial decrease in the availability of, products from our suppliers, or the loss of our key supplier agreements, could adversely impact our financial condition, operating results and cash flows. In addition, supply interruptions could arise from shortages of raw materials (including petroleum products), labor disputes or weather conditions affecting products or shipments, transportation disruptions or other factors beyond our control. Short- and long-term disruptions in our supply chain would result in a need to maintain higher inventory levels as we replace similar product, a higher cost of product and ultimately a decrease in our Net sales and profitability. A disruption in the timely availability of our products by our key suppliers would result in a decrease in our revenues and profitability, especially in our business units with supplier concentration, such as our Waterworks business. Although in many instances we have agreements with our suppliers, these agreements are generally terminable by either party on limited notice. Failure by our suppliers to continue to supply us with products on commercially reasonable terms, or at all, would put pressure on our operating margins and have a material adverse effect on our financial condition, operating results and cash flows. Short-term changes in the cost of these materials, some of which are subject to significant fluctuations, are sometimes, but not always passed on to our customers. Our inability to pass on material price increases to our customers could adversely impact our financial condition, operating results and cash flows.
We rely on third-party suppliers and long supply chains, and if we fail to identify and develop relationships with a sufficient number of qualified suppliers, or if there is a significant interruption in our supply chains, our ability to timely and efficiently access products that meet our standards for quality could be adversely affected.
We buy our products and supplies from suppliers located throughout the world. These suppliers manufacture and source products from the United States and abroad. Our ability to identify and develop relationships with qualified suppliers who can satisfy our standards for quality and our need to access products and supplies in a timely and efficient manner is a significant challenge. We may be required to replace a supplier if their products do not meet our quality or safety standards. In addition, our suppliers could discontinue selling products at any time for reasons that may or may not be in our control or the suppliers' control. Our operating results and inventory levels could suffer if we are unable to promptly replace a supplier who is unwilling or unable to satisfy our requirements with a supplier providing similar products. Our suppliers' ability to deliver products may also be affected by financing constraints caused by credit market conditions, which could negatively impact our revenue and cost of products sold, at least until alternate sources of supply are arranged.
In addition, since some of the products that we distribute are produced in foreign countries, we are dependent on long supply chains for the successful delivery of many of our products. The length and complexity of these supply chains make them vulnerable to numerous risks, many of which are beyond our control, which could cause significant interruptions or delays in delivery of our products. Factors such as political instability, the financial instability of suppliers, suppliers' noncompliance with applicable laws, trade restrictions, labor disputes, currency fluctuations, changes in tariff or import policies, severe weather, terrorist attacks and transport capacity and cost may disrupt these supply chains and our ability to access products and supplies. For example, if the government of China were to
24
Table of Contents
reduce or withdraw the tax benefits they provide our Chinese suppliers, the cost of some of our products may increase and our margins could be reduced. We expect more of our products will be imported in the future, which will further increase these risks. If we increase the percentage of our products that are sourced from lower-cost countries, these risks will be amplified. Moreover, these risks will be amplified by our ongoing efforts to consolidate our supplier base across our business units. A significant interruption in our supply chains caused by any of the above factors could result in increased costs or delivery delays and result in a decrease in our Net sales and profitability.
We have substantial fixed costs and, as a result, our operating income is sensitive to changes in our net sales.
A significant portion of our expenses are fixed costs (including personnel), which do not fluctuate with Net sales. Consequently, a percentage decline in our Net sales could have a greater percentage effect on our operating income if we do not act to reduce personnel or take other cost reduction actions. Any decline in our Net sales would cause our profitability to be adversely affected. Moreover, a key element of our strategy is managing our assets, including our substantial fixed assets, more effectively, including through sales or other disposals of excess assets. Our failure to rationalize our fixed assets in the time, and within the costs, we expect could have an adverse effect on our results of operations and financial condition.
A change in our product mix could adversely affect our results of operations.
Our results may be affected by a change in our product mix. Our outlook, budgeting and strategic planning assume a certain product mix of sales. If actual results vary from this projected product mix of sales, our financial results could be negatively impacted.
The impairment or failure of financial institutions may adversely affect us.
We have exposure to counterparties with which we execute transactions, including U.S. and foreign commercial banks, insurance companies, investment banks, investment funds and other financial institutions. Many of these transactions could expose us to risk in the event of the bankruptcy, receivership, default or similar event involving a counterparty. While we have not realized any significant losses to date, the bankruptcy, receivership, default or similar event involving one of our financial institution counterparties could have a material adverse impact on our access to funding or our ability to meet our financing agreement obligations.
The development of alternatives to distributors in the supply chain could cause a decrease in our sales and operating results and limit our ability to grow our business.
Our customers could begin purchasing more of their product needs directly from manufacturers, which would result in decreases in our Net sales and earnings. Our suppliers could invest in infrastructure to expand their own local sales force and sell more products directly to our customers, which also would negatively impact our business. For example, multiple municipalities may outsource their entire waterworks systems to a single company, thereby increasing such company's leverage in the marketplace and its ability to buy directly from suppliers, which may have a material adverse effect on our operating results.
In addition to these factors, our customers may elect to establish their own building products manufacturing and distribution facilities, or give advantages to manufacturing or distribution intermediaries in which they have an economic stake. These changes in the supply chain could adversely affect our financial condition, operating results and cash flows.
25
Table of Contents
Because our business is working capital intensive, we rely on our ability to manage our product purchasing and customer credit policies.
Our operations are working capital intensive, and our inventories, accounts receivable and accounts payable are significant components of our net asset base. We manage our inventories and accounts payable through our purchasing policies and our accounts receivable through our customer credit policies. If we fail to adequately manage our product purchasing or customer credit policies, our working capital and financial condition may be adversely affected.
Anti-terrorism measures and other disruptions to the transportation network could impact our distribution system and our operations.
Our ability to provide efficient distribution of products to our customers is an integral component of our overall business strategy. In the aftermath of terrorist attacks in the United States, federal, state and local authorities have implemented and continue to implement various security measures that affect many parts of the transportation network in the United States and abroad. Our customers typically need quick delivery and rely on our on-time delivery capabilities. If security measures disrupt or impede the timing of our deliveries, we may fail to meet the needs of our customers, or may incur increased expenses to do so.
Interruptions in the proper functioning of IT systems could disrupt operations and cause unanticipated increases in costs or decreases in revenues, or both.
Because we use our information systems to, among other things, manage inventories and accounts receivable, make purchasing decisions and monitor our results of operations, the proper functioning of our IT systems is critical to the successful operation of our business. Although our IT systems are protected through physical and software safeguards and remote processing capabilities exist, IT systems are still vulnerable to natural disasters, power losses, unauthorized access, telecommunication failures and other problems. If critical IT systems fail, or are otherwise unavailable, our ability to process orders, track credit risk, identify business opportunities, maintain proper levels of inventories, collect accounts receivable and pay expenses and otherwise manage our business units would be adversely affected.
Third-party service providers are responsible for managing a significant portion of our information systems. Our business and results of operations may be adversely affected if the third-party service provider does not perform satisfactorily.
The implementation of our technology initiatives could disrupt our operations in the near term, and our technology initiatives might not provide the anticipated benefits or might fail.
We have made, and will continue to make, significant technology investments in each of our business units and in our administrative functions. Our technology initiatives are designed to streamline our operations to allow our associates to continue to provide high quality service to our customers and to provide our customers a better experience, while improving the quality of our internal control environment. The cost and potential problems and interruptions associated with the implementation of our technology initiatives could disrupt or reduce the efficiency of our operations in the near term. In addition, our new or upgraded technology might not provide the anticipated benefits, it might take longer than expected to realize the anticipated benefits or the technology might fail altogether.
We may experience a failure in or breach of our operational or information security systems, or those of our third-party service providers, as a result cyber attacks or information security breaches.
Information security risks have generally increased in recent years because of the proliferation of new technologies and the increased sophistication and activities of perpetrators of cyber attacks. A
26
Table of Contents
failure in or breach of our operational or information security systems, or those of our third-party service providers, as a result of cyber attacks or information security breaches could disrupt our business, result in the disclosure or misuse of confidential or proprietary information, damage our reputation, increase our costs and/or cause losses. As a result, cyber security and the continued development and enhancement of the controls and processes designed to protect our systems, computers, software, data and networks from attack, damage or unauthorized access remain a priority for us. Although we believe that we have robust information security procedures and other safeguards in place, as cyber threats continue to evolve, we may be required to expend additional resources to continue to enhance our information security measures and/or to investigate and remediate any information security vulnerabilities.
The interests of the Equity Sponsors may differ from the interests of holders of our debt.
As a result of the Transactions, the Equity Sponsors and their affiliates own most of the outstanding capital stock of our parent company, Holding. Holding entered into a stockholders agreement with its stockholders in connection with the closing of the Transactions which contains, among other things, provisions relating to Holding's governance, transfer restrictions, tag-along rights, drag-along rights, preemptive rights and certain unanimous approval rights. This stockholders agreement provides that the Equity Sponsors are entitled to elect (or cause to be elected) nine out of ten of Holding's directors, which includes three designees of each Equity Sponsor. One of the directors designated by the Equity Sponsor associated with CD&R shall serve as the chairman. See "Item 13. Certain Relationships and Related Transactions, and Director Independence-Stockholders agreement and stockholder arrangements." The interests of the Equity Sponsors may differ from our interest and from those of holders of our outstanding notes in material respects. For example, the Equity Sponsors may have an interest in pursuing acquisitions, divestitures, financings or other transactions that, in their judgment, could enhance their overall equity portfolios, even though such transactions might involve risks to holders of our outstanding notes. The Equity Sponsors are in the business of making investments in companies, and may from time to time in the future, acquire interests in businesses that directly or indirectly compete with certain portions of our business or are suppliers of our customers. The companies in which one or more of the Equity Sponsors invest may also pursue acquisition opportunities that may be complementary to our business and, as a result, those acquisition opportunities may not be available to us. Additionally, the Equity Sponsors may determine that the disposition of some or all of their interests in our company would be beneficial to the Equity Sponsors at a time when such disposition could be detrimental to the holders of our outstanding notes. If we encounter financial difficulties, or we are unable to pay our debts as they mature, the interests of our equity holders might conflict with those of the holders of our outstanding notes. In that situation, for example, the holders of our outstanding notes might want us to raise additional equity from our equity holders or other investors to reduce our leverage and pay our debts, while our equity holders might not want to increase their investment in us or have their ownership diluted and instead choose to take other actions, such as selling our assets. The Equity Sponsors have no obligation to provide us with financing and are able to sell their equity ownership in us at any time. Moreover, the Equity Sponsors' ownership of our company may have the effect of discouraging offers to acquire control of our company.
Our costs of doing business could increase as a result of changes in U.S. federal, state or local regulations.
Our operations are principally affected by various statutes, regulations and laws in the 46 U.S. states and nine Canadian provinces in which we operate. While we are not engaged in a regulated industry, we are subject to various laws applicable to businesses generally, including laws affecting land usage, zoning, the environment, health and safety, transportation, labor and employment practices (including pensions), competition, immigration and other matters. Additionally, building codes may affect the products our customers are allowed to use, and consequently, changes in building codes may
27
Table of Contents
affect the saleability of our products. Changes in U.S. federal, state or local regulations governing the sale of some of our products could increase our costs of doing business. In addition, changes to U.S. federal, state and local tax regulations could increase our costs of doing business. We cannot provide assurance that we will not incur material costs or liabilities in connection with regulatory requirements.
We deliver products to many of our customers through our own fleet of vehicles. The DOT regulates our operations in domestic interstate commerce. We are subject to safety requirements governing interstate operations prescribed by the DOT. Vehicle dimensions and driver hours of service also remain subject to both federal and state regulation. More restrictive limitations on vehicle weight and size, trailer length and configuration, or driver hours of service could increase our costs, which, if we are unable to pass these cost increases on to our customers, would reduce our gross margins, increase our Selling, general and administrative expenses and reduce our Net income (loss).
We cannot predict whether future developments in law and regulations concerning our business units will affect our business, financial condition and results of operations in a negative manner. Similarly, we cannot assess whether our business units will be successful in meeting future demands of regulatory agencies in a manner which will not materially adversely affect our business, financial condition or results of operations.
We will need to begin disclosing our use of 'conflict minerals' in certain of the products we distribute, which will impose costs on us and could raise reputational and other risks.
The SEC has promulgated final rules in connection with the Dodd-Frank Wall Street Reform and Consumer Protection Act, regarding disclosure of the use of certain minerals, known as 'conflict minerals', that are mined from the Democratic Republic of the Congo and adjoining countries. These new requirements will require due diligence efforts in fiscal year 2013 and thereafter, with initial disclosure requirements effective in May 2014. There will be costs associated with complying with these disclosure requirements, including costs to determine which of our products are subject to the new rules and the source of any 'conflict minerals' used in those products. In addition, the implementation of these rules could adversely affect the sourcing, supply, and pricing of materials used in those products. Also, we may face reputational challenges if we are unable to verify the origins for all metals used in products through the procedures we may implement. We may also encounter challenges to satisfy customers that may require all of the components of products purchased to be certified as conflict free. If we are not able to meet customer requirements, customers may choose to disqualify us as a distributor.
The nature of our business exposes us to construction defect and product liability claims as well as other legal proceedings.
We rely on manufacturers and other suppliers to provide us with the products we sell and distribute. As we do not have direct control over the quality of the products manufactured or supplied by such third-party suppliers, we are exposed to risks relating to the quality of the products we distribute and install. It is possible that inventory from a manufacturer or supplier could be sold to our customers and later be alleged to have quality problems or to have caused personal injury, subjecting us to potential claims from customers or third parties. We have been subject to such claims in the past, which have been resolved without material financial impact. We are currently involved in construction defect and product liability claims relating to our various construction trades and the products we distribute and manufacture and relating to products we have installed. In certain situations, we have undertaken to voluntarily remediate any defects, which can be a costly measure. We also operate a large fleet of trucks and other vehicles and therefore face the risk of traffic accidents.
While we currently maintain insurance coverage to address a portion of these types of liabilities, we cannot make assurances that we will be able to obtain such insurance on acceptable terms in the
28
Table of Contents
future, if at all, or that any such insurance will provide adequate coverage against potential claims. Further, while we seek indemnification against potential liability for products liability claims from relevant parties, including but not limited to manufacturers and suppliers, we cannot guarantee that we will be able to recover under such indemnification agreements. Moreover, as we increase the number of private label products we distribute, our exposure to potential liability for products liability claims may increase. Product liability claims can be expensive to defend and can divert the attention of management and other personnel for significant time periods, regardless of the ultimate outcome. An unsuccessful product liability defense could be highly costly and accordingly result in a decline in revenues and profitability. In addition, uncertainties with respect to the Chinese legal system may adversely affect us in resolving claims arising from our proprietary brand products manufactured in China. Because many laws and regulations are relatively new and the Chinese legal system is still evolving, the interpretations of many laws, regulations and rules are not always uniform. Finally, even if we are successful in defending any claim relating to the products we distribute, claims of this nature could negatively impact customer confidence in our products and our Company.
From time to time, we are also involved in government inquiries and investigations, as well as class action, consumer, employment, tort proceedings and other litigation. We cannot predict with certainty the outcomes of these legal proceedings and other contingencies, including environmental remediation and other proceedings commenced by government authorities. The outcome of some of these legal proceedings and other contingencies could require us to take, or refrain from taking, actions which could adversely affect our operations or could require us to pay substantial amounts of money. Additionally, defending against these lawsuits and proceedings may involve significant expense and diversion of management's attention and resources from other matters. We have been informed that the Office of the United States Attorney for the Northern District of New York is conducting an investigation related to the activities of certain disadvantaged business enterprises. In May of 2011, in connection with that investigation, the government executed a search of an entity from which Waterworks purchased assets shortly before the search was executed. On June 20, 2012, in connection with that same investigation, the government executed search warrants at two Waterworks branches. The Company was updated by the government on its investigation in March 2013 and continues to cooperate with the investigation. While the Company cannot predict the outcome, it believes a potential loss on this matter is reasonably possible but due to the current state of the investigation it is not able to estimate a range of potential loss.
If we become subject to material liabilities under our self-insured programs, our financial results may be adversely affected.
We provide workers' compensation, automobile and product/general liability coverage through a high deductible insurance program. In addition, we provide medical coverage to some of our employees through a self-insured preferred provider organization. Though we believe that we have adequate insurance coverage in excess of self-insured retention levels, our results of operations and financial condition may be adversely affected if the number and severity of insurance claims increases.
We may see increased costs arising from health care reform.
In March 2010, the United States government enacted comprehensive health care reform legislation which, among other things, includes guaranteed coverage requirements, eliminates pre-existing condition exclusions and annual and lifetime maximum limits, restricts the extent to which policies can be rescinded and imposes new and significant taxes on health insurers and health care benefits. The legislation imposes implementation effective dates which began in 2010 and extend through 2020, and many of the changes require additional guidance from government agencies or federal regulations. Therefore, due to the phased-in nature of the implementation and the lack of interpretive guidance, it is difficult to determine at this time what impact the health care reform
29
Table of Contents
legislation will have on our financial results. Possible adverse effects of the health reform legislation include increased costs, exposure to expanded liability and requirements for us to revise ways in which we provide healthcare and other benefits to our employees. As a result, our results of operations, financial position and cash flows could be materially adversely affected.
Our success depends upon our ability to attract, train and retain highly qualified associates and key personnel.
To be successful, we must attract, train and retain a large number of highly qualified associates while controlling related labor costs. Our ability to control labor costs is subject to numerous external factors, including prevailing wage rates and health and other insurance costs. We compete with other businesses for these associates and invest significant resources in training and motivating them. There is no assurance that we will be able to attract or retain highly qualified associates in the future, including, in particular, those employed by companies we acquire. A very small proportion of our employees are currently covered by collective bargaining or other similar labor agreements. Historically, the effects of collective bargaining and other similar labor agreements on us have not been significant. However, if a larger number of our employees were to unionize, including in the wake of any future legislation that makes it easier for employees to unionize, the effect on us may be negative. Any inability by us to negotiate acceptable new contracts under these collective bargaining arrangements could cause strikes or other work stoppages, and new contracts could result in increased operating costs. If any such strikes or other work stoppages occur, or if other employees become represented by a union, we could experience a disruption of our operations and higher labor costs. Labor relations matters affecting our suppliers of products and services could also adversely affect our business from time to time.
In addition, our business results depend largely upon our chief executive officer and senior management team as well as our branch managers and sales personnel, including those of companies recently acquired, and their experience, knowledge of local market dynamics and specifications and long-standing customer relationships. We customarily sign employment letters providing for an agreement not to compete with key personnel of companies we acquire in order to maintain key customer relationships and manage the transition of the acquired business. Our inability to retain or hire qualified branch managers or sales personnel at economically reasonable compensation levels would restrict our ability to grow our business, limit our ability to continue to successfully operate our business and result in lower operating results and profitability.
Fluctuations in foreign currency exchange rates may significantly reduce our revenues and profitability.
As an industrial distributor of manufactured products, our profitability is tied to the prices we pay to the manufacturers from which we purchase our products. Some of our suppliers price their products in currencies other than the U.S. dollar or incur costs of production in non-U.S. currencies. Accordingly, depreciation of the U.S. dollar against foreign currencies increases the prices we pay for these products. Even short-term currency fluctuations could adversely impact revenues and profitability if we are unable to pass higher supply costs on to our customers. Our delayed ability to pass on material price increases to our customers could adversely impact our financial condition, operating results and cash flows.
If we are unable to protect our intellectual property rights, or we infringe on the intellectual property rights of others, our ability to compete could be negatively impacted.
Our ability to compete effectively depends, in part, upon our ability to protect and preserve proprietary aspects of our intellectual property, including our trademarks and customer lists. The use of our intellectual property or similar intellectual property by others could adversely impact our ability to compete, cause us to lose Net sales or otherwise harm our business. If it became necessary for us to
30
Table of Contents
resort to litigation to protect these rights, any proceedings could be burdensome and costly, and we may not prevail.
Also, we cannot be certain that the products that we sell do not and will not infringe issued patents or other intellectual property rights of others. Further, we are subject to legal proceedings and claims in the ordinary course of our business, including claims of alleged infringement of the trademarks, patents and other intellectual property rights of third parties by us or our customers in connection with their use of the products that we distribute. Should we be found liable for infringement, we (or our suppliers) may be required to enter into licensing agreements (if available on acceptable terms or at all) or pay damages and cease making or selling certain products. Moreover, we may need to redesign or sell different products to avoid future infringement liability. Any of the foregoing could cause us to incur significant costs, prevent us from selling our products or negatively impact our ability to compete.
Income tax payments may ultimately differ from amounts currently recorded by us. Future tax law changes may materially increase our prospective income tax expense.
We are subject to income taxation in many jurisdictions in the U.S. as well as foreign jurisdictions. Judgment is required in determining our worldwide income tax provision and, accordingly, there are many transactions and computations for which our final income tax determination is uncertain. We are routinely audited by income tax authorities in many tax jurisdictions. Although we believe the recorded tax estimates are reasonable, the ultimate outcome from any audit (or related litigation) could be materially different from amounts reflected in our income tax provisions and accruals. Future settlements of income tax audits may have a material effect on earnings between the period of initial recognition of tax estimates in the financial statements and the point of ultimate tax audit settlement. Additionally, it is possible that future income tax legislation in any jurisdiction to which we are subject may be enacted that could have a material impact on our worldwide income tax provision beginning with the period that such legislation becomes effective.
We carried back tax NOLs from our tax years ended on February 3, 2008 and February 1, 2009 to tax years during which we were a member of Home Depot's U.S. federal consolidated tax group. As a result of those NOL carrybacks, Home Depot received cash refunds from the Internal Revenue Service ("IRS") in the amount of approximately $354 million. Under an agreement (the "Tax Cooperation Agreement") between Holding and Home Depot, Home Depot paid to us the refund proceeds resulting from the NOL carrybacks. In connection with an audit of our U.S. federal income tax returns filed for the tax years ended on February 3, 2008 and February 1, 2009, the IRS has disallowed certain deductions claimed by us. In May 2012, the IRS issued a formal Revenue Agent's Report ("RAR") challenging approximately $299 million (excluding interest) of the cash refunds resulting from our NOL carrybacks. In January 2013, the IRS issued a revised RAR reducing the challenge to approximately $131 million (excluding interest) of cash refunds from our carrybacks. The issuance of the January 2013 revised RAR formally revoked the original May 2012 RAR and reduced the amount of cash refunds the IRS is currently challenging by $168 million. As of February 3, 2013, we estimate the interest to which the IRS would be entitled, if successful in all claims, to be approximately $14 million. If the IRS is ultimately successful with respect to the proposed adjustments, pursuant to the terms of the Tax Cooperation Agreement, we would be required to reimburse Home Depot an amount equal to the disallowed refunds plus related interest. If the IRS is successful in defending its positions with respect to the disallowed deductions, certain of those disallowed deductions may be available to us in the form of increases in our deferred tax assets by approximately $63 million before any valuation allowance. We believe that our positions with respect to the deductions and the corresponding NOL carrybacks are supported by, and consistent with, applicable tax law. In collaboration with Home Depot, we have challenged the proposed adjustments by filing a formal protest with the Office of Appeals Division within the IRS. During the administrative appeal period and as allowed under statute, we intend to
31
Table of Contents
vigorously defend our positions rather than pay any amount related to the proposed adjustments. In the event of an unfavorable outcome at the Office of Appeals, we will strongly consider litigating the matter in U.S. Tax Court. The unpaid assessment would continue to accrue interest at the statutory rate until resolved. If we are ultimately required to pay a significant amount related to the proposed adjustments to Home Depot pursuant to the terms of the Tax Cooperation Agreement (or to the IRS), our cash flows, future results of operations and financial positions could be affected in a significant and adverse manner.
Our NOL carryforwards could be limited if we experience an ownership change as defined in the Internal Revenue Code.
As of February 3, 2013, we have U.S. federal NOL carryforwards of $1.8 billion ($636 million on a tax-effected basis), which begin to expire in fiscal 2029. We also have significant state NOL carryforwards, which begin to expire in various years between fiscal 2013 and fiscal 2030. Our ability to deduct these NOL carryforwards against future taxable income could be limited if we experience an "ownership change," as defined in Section 382 of the Internal Revenue Code of 1986, as amended. In general, an ownership change may result from transactions increasing the aggregate ownership of certain persons (or groups of persons) in our stock by more than 50 percentage points over a testing period (generally three years). While we do not believe an ownership change has occurred at this time, future direct or indirect changes in the ownership of our common stock, including sales or acquisitions of our common stock by certain stockholders and purchases and issuances of our common stock by us, some of which are not in our control, could result in an ownership change. Any limitation on the use of our NOL carryforwards could result in the payment of taxes above the amounts currently estimated and have a negative effect on our future results of operations and financial position.
We may not be able to identify new products and new product lines and integrate them into our distribution network, which may impact our ability to compete.
Our business depends in part on our ability to identify future products and product lines that complement existing products and product lines and that respond to our customers' needs. We may not be able to compete effectively unless our product selection keeps up with trends in the markets in which we compete or trends in new products. In addition, our ability to integrate new products and product lines into our distribution network could impact our ability to compete. Furthermore, the success of new products and new product lines will depend on market demand and there is a risk that new products and new product lines will not deliver expected results, which could negatively impact our future sales and results of operations. Our expansion into new markets may present competitive, distribution and regulatory challenges that differ from current ones. We may be less familiar with the target customers and may face different or additional risks, as well as increased or unexpected costs, compared to existing operations. Growth into new markets may also bring us into direct competition with companies with whom we have little or no past experience as competitors. To the extent we are reliant upon expansion into new geographic, industry and product markets for growth and do not meet the new challenges posed by such expansion, our future sales growth could be negatively impacted, our operating costs could increase, and our business operations and financial results could be negatively affected.
We could incur significant costs in complying with environmental, health and safety laws or permits or as a result of satisfying any liability or obligation imposed under such laws or permits.
Our operations are subject to various federal, state, local and foreign environmental, health and safety laws and regulations. Among other things, these laws regulate the emission or discharge of materials into the environment, govern the use, storage, treatment, disposal and management of hazardous substances and wastes, protect the health and safety of our employees and the end users of our products, regulate the materials used in and the recycling of products and impose liability for the
32
Table of Contents
costs of investigating and remediating, and damages resulting from, present and past releases of hazardous substances. Violations of these laws and regulations or non-compliance with any conditions contained in any environmental permit can result in substantial fines or penalties, injunctive relief, requirements to install pollution or other controls or equipment, civil and criminal sanctions, permit revocations and/or facility shutdowns. We could be held liable for the costs to address contamination of any real property we have ever owned, operated or used as a disposal site. We could also incur fines, penalties, sanctions or be subject to third-party claims for property damage, personal injury or nuisance or otherwise as a result of violations of or liabilities under environmental laws in connection with releases of hazardous or other materials. In addition, changes in, or new interpretations of, existing laws, regulations or enforcement policies, the discovery of previously unknown contamination, or the imposition of other environmental liabilities or obligations in the future, including additional investigation or other obligations with respect to any potential health hazards of our products or business activities or the imposition of new permit requirements, may lead to additional compliance or other costs that could have material adverse effect on our business, financial condition or results of operations. See Part I, Item 3. "Legal Proceedings" of this annual report on Form 10-K.
We may be affected by global climate change or by legal, regulatory or market responses to such potential change.
Concern over climate change, including the impact of global warming, has led to significant federal, state, and international legislative and regulatory efforts to limit greenhouse gas ("GHG") emissions. For example, in the past several years, the U.S. Congress has considered various bills that would regulate GHG emissions. While these bills have not yet received sufficient Congressional support for enactment, some form of federal climate change legislation is possible in the future. Even in the absence of such legislation, the Environmental Protection Agency, spurred by judicial interpretation of the Clean Air Act, may regulate GHG emissions, especially diesel engine emissions, and this could impose substantial costs on us. These costs include an increase in the cost of the fuel and other energy we purchase and capital costs associated with updating or replacing our internal fleet of trucks and other vehicles prematurely. In addition, new laws or future regulation could directly and indirectly affect our customers and suppliers (through an increase in the cost of production or their ability to produce satisfactory products) and our business (through the impact on our inventory availability, cost of sales, operations or demands for the products we sell). Until the timing, scope and extent of any future regulation becomes known, we cannot predict its effect on our cost structure or our operating results. Notwithstanding our dedication to being a responsible corporate citizen, it is reasonably possible that such legislation or regulation could impose material costs on us. Moreover, even without such legislation or regulation, increased awareness and any adverse publicity in the global marketplace about the GHGs emitted by companies involved in the transportation of goods could harm our reputation and reduce customer demand for our products and services.
Our failure to maintain effective disclosure controls and internal control over financial reporting could adversely affect our business, financial position and results of operations.
We are required to evaluate the effectiveness of our disclosure controls and internal control over financial reporting on a periodic basis and publicly disclose the results of these evaluations and related matters, in accordance with the requirements of Section 404 of the Sarbanes-Oxley Act of 2002. These reporting and other obligations place significant additional demands on our management and administrative and operational resources, including our accounting resources, which could adversely affect our operations among other things. To comply with these requirements, we have upgraded, and are continuing to upgrade our systems, including information technology, implemented additional financial and management controls, reporting systems and procedures. We cannot be certain that we will be successful in maintaining adequate control over our financial reporting and financial processes. Furthermore, as we grow our business, our disclosure controls and internal controls will become more complex, and we may require significantly more resources to ensure that these controls remain effective. If we are unable to continue upgrading our financial and management controls, reporting systems, information technology and procedures in a timely and effective fashion, additional management and other resources of our Company may need to be devoted to assist in compliance with the disclosure and financial reporting requirements and other rules that apply to reporting companies, which could adversely affect our business, financial position and results of operations.
33
Table of Contents
We have not been required to have and have not had our independent registered public accounting firm perform an evaluation of our internal control over financial reporting as of the end of our last fiscal year in accordance with the provisions of the Sarbanes-Oxley Act of 2002. Had our independent registered public accounting firm performed an evaluation of our internal control over financial reporting in accordance with the provisions of the Sarbanes-Oxley Act of 2002, additional control deficiencies may have been identified by our independent registered public accounting firm and those control deficiencies could have also represented one or more material weaknesses.
Future changes in financial accounting standards may significantly change our reported results of operations.
GAAP is subject to interpretation by the Financial Accounting Standards Board ("FASB"), the American Institute of Certified Public Accountants, the SEC and various bodies formed to promulgate and interpret appropriate accounting principles. A change in these principles or interpretations could have a significant effect on our reported financial results, and could affect the reporting of transactions completed before the announcement of a change. In addition, the SEC has announced a multi-year plan that could ultimately lead to the use of International Financial Reporting Standards by U.S. issuers in their SEC filings. Any such change could have a significant effect on our reported financial results.
Additionally, our assumptions, estimates and judgments related to complex accounting matters could significantly affect our financial results. GAAP and related accounting pronouncements, implementation guidelines and interpretations with regard to a wide range of matters that are relevant to our business, including but not limited to, revenue recognition, impairment of long-lived assets, leases and related economic transactions, intangibles, self-insurance, income taxes, property and equipment, litigation, and stock-based compensation are highly complex and involve many subjective assumptions, estimates and judgments by us. Changes in these rules or their interpretation or changes in underlying assumptions, estimates or judgments by us (i) could require us to make changes to our accounting systems to implement these changes that could increase our operating costs and (ii) could significantly change our reported or expected financial performance.
In an exposure draft issued in August 2010, the FASB, together with the International Accounting Standards Board ("IASB"), proposed a comprehensive set of changes in accounting for leases. The lease accounting model contemplated by these changes is a "right of use" model that assumes that each lease creates an asset (the lessee's right to use the leased asset) and a liability (the future rent payment obligations) which should be reflected on a lessee's balance sheet to fairly represent the lease transaction and the lessee's related financial obligations. We conduct operations primarily under leases that are accounted for as operating leases, with no related assets and liabilities on our balance sheet. The proposed changes would require that substantially all of our operating leases be recognized as assets and liabilities on our balance sheet. The effective date has not been determined and a revised exposure draft is expected in the second quarter of 2013. Changes in lease accounting rules or their interpretation, or changes in underlying assumptions, estimates or judgments by us could significantly change our reported or expected financial performance.
Holding has filed a registration statement with the SEC for a potential initial public offering. Fulfilling the obligations incident to being a public company, including with respect to the requirements of and related rules under the Sarbanes-Oxley Act of 2002, will be expensive and time-consuming, and any delays or difficulties in satisfying these obligations could have a material adverse effect on our future results of operations.
Holding has filed a registration statement with the SEC for a potential initial public offering. Should the offering be completed, Holding will be subject to the reporting and corporate governance requirements, stock exchange listing standards and the Sarbanes-Oxley Act of 2002, that apply to issuers of listed equity, which will impose certain new compliance costs and obligations upon us. The changes necessitated by publicly listing Holding's equity will require a significant commitment of
34
Table of Contents
additional resources and management oversight which will increase our operating costs. These changes will also place additional demands on our finance and accounting staff and on our financial accounting and information systems. Other expenses associated with Holding being a public company include increases in auditing, accounting and legal fees and expenses, investor relations expenses, increased directors' fees and director and officer liability insurance costs, registrar and transfer agent fees and listing fees, as well as other expenses. As a public company, Holding will be required, among other things, to:
- •
- define and expand the roles and the duties of its Board of Directors and its committees; and
- •
- institute more comprehensive compliance, investor relations and internal audit functions.
In particular, beginning with the year ending February 1, 2015 Holding's independent registered public accounting firm will be required to provide an attestation report on the effectiveness of internal controls over financial reporting pursuant to Section 404(b) of the Sarbanes-Oxley Act of 2002. If Holding's independent registered public accounting firm is unable to provide an unqualified report regarding the effectiveness of its internal controls over financial reporting (at such time as it is required to do so), investors could lose confidence in the reliability of our financial statements. Failure to comply with the Sarbanes-Oxley Act of 2002 could potentially subject Holding and us to sanctions or investigations by the SEC, or other regulatory authorities.
Risks Relating to Our Indebtedness
We have substantial debt and may incur substantial additional debt, which could adversely affect our financial health, reduce our profitability, limit our ability to obtain financing in the future and pursue certain business opportunities and reduce the value of your investment.
As of February 3, 2013, we had an aggregate principal amount of $7,329 million of outstanding debt, net of unamortized discounts of $26 million and including unamortized premium of $21 million.
The amount of our debt or such other obligations could have important consequences, including, but not limited to:
- •
- a substantial portion of our cash flow from operations must be dedicated to the payment of principal and interest on our indebtedness, thereby reducing the funds available to us for other purposes;
- •
- our ability to obtain additional financing for working capital, capital expenditures, acquisitions, debt service requirements or general corporate purposes and other purposes may be impaired in the future;
- •
- we are exposed to the risk of increased interest rates because a portion of our borrowings is at variable rates of interest;
- •
- we may be at a competitive disadvantage compared to our competitors with less debt or with comparable debt at more favorable interest rates and that, as a result, may be better positioned to withstand economic downturns;
- •
- our ability to refinance indebtedness may be limited or the associated costs may increase;
- •
- our ability to engage in acquisitions without raising additional equity or obtaining additional debt financing may be impaired in the future;
- •
- it may be more difficult for us to satisfy our obligations to our creditors, resulting in possible defaults on and acceleration of such indebtedness;
- •
- we may be more vulnerable to general adverse economic and industry conditions; and
35
Table of Contents
- •
- our flexibility to adjust to changing market conditions and our ability to withstand competitive pressures could be limited, or we may be prevented from making capital investments that are necessary or important to our operations in general, growth strategy and efforts to improve operating margins of our business units.
If our cash flow and capital resources are insufficient to fund our debt service obligations, we may be forced to reduce or delay capital expenditures, sell assets, seek to obtain additional equity capital or refinance our debt. We cannot make assurances that we will be able to refinance our debt on terms acceptable to us, or at all. In the future, our cash flow and capital resources may not be sufficient for payments of interest on and principal of our debt, and such alternative measures may not be successful and may not permit us to meet our scheduled debt service obligations.
We cannot make assurances that we will be able to refinance any of our indebtedness, or obtain additional financing, particularly because of our high levels of debt and the debt incurrence restrictions imposed by the agreements governing our debt, as well as prevailing market conditions. In the absence of such operating results and resources, we could face substantial liquidity problems and might be required to dispose of material assets or operations to meet our debt service and other obligations. Our debt facilities and the indentures governing our outstanding notes restrict our ability to dispose of assets and how we use the proceeds from any such dispositions. We cannot make assurances that we will be able to consummate those dispositions, or if we do, what the timing of the dispositions will be or whether the proceeds that we realize will be adequate to meet our debt service obligations, when due.
Despite our current level of indebtedness, we may still be able to incur substantially more debt. This could further exacerbate the risks to our financial condition described above.
We may be able to incur significant additional indebtedness in the future, including secured debt. Although the agreements governing our indebtedness contain restrictions on the incurrence of additional indebtedness, these restrictions are subject to a number of qualifications and exceptions, and the additional indebtedness incurred in compliance with these restrictions could be substantial. These restrictions also will not prevent us from incurring obligations that do not constitute indebtedness, including obligations under lease arrangements that are currently recorded as operating leases even if operating leases were to be treated as debt under GAAP. In addition, our ABL Facility provides a commitment of up to $1.5 billion subject to a borrowing base. As of February 3, 2013, we are able to borrow an additional $910 million under the ABL Facility. If new debt is added to our current debt levels, the related risks that we now face could intensify. See "Part II, Item 7. Management's Discussion and Analysis of Financial Condition and Results of Operations—External Financing."
The agreements and instruments governing our debt contain restrictions and limitations that could significantly impact our ability to operate our business and adversely affect the holders of our common stock.
Our Senior Credit Facilities contain covenants that, among other things, restrict or limit our subsidiaries' ability to:
- •
- dispose of assets;
- •
- incur additional indebtedness (including guarantees of additional indebtedness);
- •
- prepay or amend our various debt instruments;
- •
- pay dividends and make certain payments;
- •
- create liens on assets;
- •
- engage in certain asset sales, mergers, acquisitions, consolidations or sales of all, or substantially all, of our assets;
36
Table of Contents
- •
- engage in certain transactions with affiliates; and
- •
- permit consensual restrictions on our subsidiaries' ability to pay dividends.
The indentures governing our outstanding notes contain restrictive covenants that, among other things, limit the ability of our subsidiaries to:
- •
- incur additional debt;
- •
- pay dividends, redeem stock or make other distributions;
- •
- make certain investments;
- •
- create liens;
- •
- transfer or sell assets;
- •
- merge or consolidate with other companies; and
- •
- enter into certain transactions with our affiliates.
Our ability to comply with the covenants and restrictions contained in the Senior Credit Facilities and the indentures governing our outstanding notes may be affected by economic, financial and industry conditions beyond our control. The breach of any of these covenants or restrictions could result in a default under either the Senior Credit Facilities or the indentures governing our outstanding notes that would permit the applicable lenders or noteholders, as the case may be, to declare all amounts outstanding thereunder to be due and payable, together with accrued and unpaid interest. If we are unable to repay indebtedness, lenders having secured obligations, such as the lenders under the Senior Credit Facilities, could proceed against the collateral securing the secured obligations. This could have serious consequences to our financial condition and results of operations and could cause us to become bankrupt or insolvent.
We may have future capital needs and may not be able to obtain additional financing on acceptable terms.
Although we believe that our current cash position and the additional committed funding available under our ABL Facility is sufficient for our current operations, any reductions in our available borrowing capacity, or our inability to renew or replace our debt facilities, when required or when business conditions warrant, could have a material adverse effect on our business, financial condition and results of operations. The economic conditions, credit market conditions, and economic climate affecting our industry, as well as other factors, may constrain our financing abilities. Our ability to secure additional financing, if available, and to satisfy our financial obligations under indebtedness outstanding from time to time will depend upon our future operating performance, the availability of credit generally, economic conditions and financial, business and other factors, many of which are beyond our control. The market conditions and the macroeconomic conditions that affect our industry could have a material adverse effect on our ability to secure financing on favorable terms, if at all.
We may be unable to secure additional financing or financing on favorable terms or our operating cash flow may be insufficient to satisfy our financial obligations under the indebtedness outstanding from time to time. Furthermore, if financing is not available when needed, or is available on unfavorable terms, we may be unable to take advantage of business opportunities or respond to competitive pressures, any of which could have a material adverse effect on our business, financial condition and results of operations.
Increases in interest rates would increase the cost of servicing our debt and could reduce our profitability.
A significant portion of our outstanding debt, including under the Senior Credit Facilities, bears interest at variable rates. As a result, increases in interest rates would increase the cost of servicing our
37
Table of Contents
debt and could materially reduce our profitability and cash flows. Each 1% increase in interest rates on our variable-rate debt would increase our annual forecasted interest expense by approximately $13 million based on balances as of February 3, 2013 and excluding the effect of the interest rate floor on our Term Loan Facility. Assuming all revolving loans were fully drawn, each one percentage point increase in interest rates would result in a $25 million increase in annual cash interest expense on our Senior Credit Facilities, excluding the effect of the interest rate floor on our Term Loan Facility. The impact of increases in interest rates could be more significant for us than it would be for some other companies because of our substantial indebtedness.
If securities or industry analysts do not publish research or publish misleading or unfavorable research about our business, the price of our outstanding notes could decline.
The trading market for our outstanding notes will depend in part on the research and reports that securities or industry analysts publish about us or our business. We do not currently have and may never obtain research coverage by securities and industry analysts. In the event we obtain securities or industry analyst coverage; if one or more of these analysts publishes unfavorable research about our business, the price of our outstanding notes may decline.
We may not be able to repurchase our existing notes upon a change of control.
Upon the occurrence of specific kinds of change of control events, we will be required to offer to repurchase all outstanding notes, including our First Priority Notes, Second Priority Notes, Senior Notes and Senior Subordinated Notes, until such notes are redeemed in full. Additionally, under the Term Loan Facility and the ABL Facility, a change of control (as defined therein) constitutes an event of default that permits the lenders to accelerate the maturity of borrowings under the respective agreements and terminate their commitments to lend. We may not be able to satisfy the obligations upon a change of control because we may not have sufficient financial resources to purchase all of the debt securities that are tendered upon a change of control and repay our other indebtedness that will become due. Consequently, we may require additional financing from third parties to fund any such purchases, and we may be unable to obtain financing on satisfactory terms or at all. Further, our ability to repurchase our existing notes may be limited by law. In order to avoid the obligations to repurchase our existing notes and events of default and potential breaches of the credit agreement governing the Term Loan Facility, and the credit agreement governing the ABL Facility, we may have to avoid certain change of control transactions that would otherwise be beneficial to us.
38
Table of Contents
ITEM 2. PROPERTIES
Properties
As of February 3, 2013, we had a network of over 600 locations, of which approximately 50 were owned and 550 were leased. We generally prefer to lease our locations, as it provides the flexibility to expand or relocate our sites as needed to serve evolving markets. Our leased locations comprise approximately 17 million square feet while our owned locations comprise approximately 2 million square feet. Our leases typically have an initial term that ranges from 3 to 5 years, and the leases usually provide for the option to renew. We currently lease approximately 55,000 and 195,000 square feet of office space in Atlanta, Georgia and Orlando, Florida, respectively, for our corporate headquarters. We believe our locations meet our current needs and that additional locations will be available as we expand in the future.
39
Table of Contents
ITEM 3. LEGAL PROCEEDINGS
The Company is involved in litigation from time to time in the ordinary course of business. The Company establishes reserves for litigation and similar matters when those matters present loss contingencies that it determines to be both probable and reasonably estimable in accordance with ASC 450, Contingencies. In the opinion of management, based on current knowledge, all reasonably estimable and probable matters are believed to be adequately reserved for or covered by insurance and disclosed herein. For all such other matters, we believe the possibility of losses from such matters are remote or such matters are of such kind or involve such amounts that would not have a material adverse effect on the financial position, results of operations or cash flows of the Company if disposed of unfavorably.
In April 2012, the Company was contacted by prosecutors for the South Coast Air Quality Management District ("SCAQMD") in California regarding allegations that the Company sold products in violation of applicable SCAQMD VOC (volatile organic compound) rules. The Company has received a request for information from SCAQMD seeking information related to the alleged violations. The Company is in the process of responding to the request for information and settlement discussions are ongoing. Although the Company cannot predict the outcome of this matter, it does not expect the outcome to have a material adverse effect on its consolidated financial condition or results of operations.
In addition, the Company has been informed that the Office of the United States Attorney for the Northern District of New York is conducting an investigation related to the activities of certain disadvantaged business enterprises. In May of 2011, in connection with that investigation, the government executed a search of an entity from which Waterworks purchased assets shortly before the search was executed. On June 20, 2012, in connection with that same investigation, the government executed search warrants at two Waterworks branches. The Company was updated by the government on its investigation in March 2013 and continues to cooperate with the investigation. While the Company cannot predict the outcome, it believes a potential loss on this matter is reasonably possible but due to the current state of the investigation it is not able to estimate a range of potential loss.
PART II
ITEM 5. MARKET FOR REGISTRANT'S COMMON EQUITY, RELATED STOCKHOLDER MATTERS AND ISSUER PURCHASES OF EQUITY SECURITIES
There is no established public trading market for the Company's common stock. The Company had one record holder of common stock on March 31, 2013, and no equity securities of the Company are authorized for issuance under any equity compensation plan.
40
Table of Contents
ITEM 6. SELECTED FINANCIAL DATA
The selected consolidated financial data set forth below should be read in conjunction with "Management's Discussion and Analysis of Financial Condition and Results of Operations" and the audited consolidated financial statements and related notes appearing elsewhere in this annual report on Form 10-K. Our consolidated financial information may not be indicative of our future performance.
On March 26, 2012, HD Supply disposed of its IPVF business. During fiscal 2011, HD Supply disposed of its Plumbing/HVAC and SESCO/QUESCO operations. In accordance with ASC 205-20, Discontinued Operations, the results of the IPVF, Plumbing/HVAC and SESCO/QUESCO operations and the gain on sale of the businesses are classified as discontinued operations. The presentation of discontinued operations includes revenues and expenses of the discontinued operations and gain on the sale of businesses, net of tax, as one line item on the Consolidated Statements of Operations. All prior period Consolidated Statements of Operations have been revised to reflect this presentation.
41
Table of Contents
Selected consolidated financial information
| | | | | | | | | | | | | | | | |
| | Fiscal year ended | |
|---|
| | February 3,
2013 | | January 29,
2012 | | January 30,
2011 | | January 31,
2010 | | February 1,
2009 | |
|---|
| | (Dollars in millions)
| |
|---|
Statement of income data: | | | | | | | | | | | | | | | | |
Net sales | | $ | 8,035 | | $ | 7,028 | | $ | 6,449 | | $ | 6,313 | | $ | 8,198 | |
Cost of sales | | | 5,715 | | | 5,014 | | | 4,608 | | | 4,545 | | | 5,980 | |
| | | | | | | | | | | | |
Gross profit | | | 2,320 | | | 2,014 | | | 1,841 | | | 1,768 | | | 2,218 | |
Operating expenses: | | | | | | | | | | | | | | | | |
Selling, general and administrative | | | 1,661 | | | 1,532 | | | 1,455 | | | 1,453 | | | 1,770 | |
Depreciation and amortization | | | 336 | | | 327 | | | 341 | | | 359 | | | 374 | |
Restructuring | | | — | | | — | | | 8 | | | 21 | | | 31 | |
Goodwill and other intangible asset impairment | | | 152 | | | — | | | — | | | 219 | | | 867 | |
| | | | | | | | | | | | |
Total operating expenses | | | 2,149 | | | 1,859 | | | 1,804 | | | 2,052 | | | 3,042 | |
| | | | | | | | | | | | |
Operating income (loss) | | | 171 | | | 155 | | | 37 | | | (284 | ) | | (824 | ) |
Interest expense | | | 658 | | | 639 | | | 623 | | | 602 | | | 644 | |
Interest (income) | | | — | | | — | | | — | | | — | | | (3 | ) |
Loss (gain) on extinguishment of debt | | | 709 | | | — | | | 2 | | | (200 | ) | | — | |
Other (income) expense, net | | | — | | | — | | | (3 | ) | | (8 | ) | | 12 | |
| | | | | | | | | | | | |
Income (loss) from continuing operations before provision for income taxes and discontinued operations | | | (1,196 | ) | | (484 | ) | | (585 | ) | | (678 | ) | | (1,477 | ) |
Provision (benefit) for income taxes | | | 3 | | | 79 | | | 28 | | | (198 | ) | | (329 | ) |
| | | | | | | | | | | | |
Income (loss) from continuing operations | | | (1,199 | ) | | (563 | ) | | (613 | ) | | (480 | ) | | (1,148 | ) |
Income (loss) from discontinued operations, net of tax | | | 20 | | | 20 | | | (6 | ) | | (34 | ) | | (107 | ) |
| | | | | | | | | | | | |
Net income (loss) | | $ | (1,179 | ) | $ | (543 | ) | $ | (619 | ) | $ | (514 | ) | $ | (1,255 | ) |
| | | | | | | | | | | | |
Balance sheet data (end of period): | | | | | | | | | | | | | | | | |
Working capital (unaudited)(1) | | $ | 1,120 | | $ | 1,012 | | $ | 1,176 | | $ | 1,925 | | $ | 2,071 | |
Cash and cash equivalents(2) | | | 141 | | | 111 | | | 292 | | | 539 | | | 771 | |
Total assets | | | 7,334 | | | 6,738 | | | 7,089 | | | 7,845 | | | 9,088 | |
Total debt(3) | | | 7,329 | | | 5,462 | | | 5,249 | | | 5,775 | | | 6,056 | |
Total stockholder's equity (deficit) | | | (1,591 | ) | | (428 | ) | | 96 | | | 688 | | | 1,175 | |
Other financial data (unaudited): | | | | | | | | | | | | | | | | |
Cash interest expense(4) | | $ | 535 | | $ | 457 | | $ | 365 | | $ | 363 | | $ | 397 | |
Adjusted EBITDA(5) | | | 683 | | | 508 | | | 411 | | | 343 | | | 476 | |
Capital expenditures | | | 115 | | | 115 | | | 49 | | | 58 | | | 77 | |
Statement of cash flows data: | | | | | | | | | | | | | | | | |
Cash flows provided by (used in) operating activities, net | | $ | (681 | ) | $ | (165 | ) | $ | 551 | | $ | 69 | | $ | 548 | |
Cash flows provided by (used in) investing activities, net | | | (800 | ) | | (6 | ) | | (45 | ) | | (41 | ) | | 37 | |
Cash flows provided by (used in) financing activities, net | | | 1,511 | | | (10 | ) | | (755 | ) | | (263 | ) | | 86 | |
- (1)
- We define working capital as current assets (including cash) minus current liabilities, which include the current portion of long-term debt and accrued interest thereon.
- (2)
- Cash and cash equivalents as of February 3, 2013 excludes $936 million of cash equivalents that were restricted for the redemption of debt.
42
Table of Contents
- (3)
- Total debt includes current and non-current installments of long-term debt and capital leases and associated discounts and premiums. As of February 3, 2013, debt includes $889 million of Old Senior Subordinated Notes that we committed to redeem and did redeem on February 8, 2013.
- (4)
- Cash interest expense is not a recognized term under GAAP and does not purport to be an alternative to interest expense. For additional detail, including a reconciliation from interest expense, the most directly comparable financial measure under GAAP, to cash interest expense for the periods presented, see "Part II, Item 7. Management's Discussion and Analysis of Financial Condition and Results of Operations—Key Business Metrics—Cash interest expense and Adjusted EBITDA."
- (5)
- Adjusted EBITDA is not a recognized term under GAAP and does not purport to be an alternative to net income (loss) as measure of operating performance. For additional detail, including a reconciliation from net income (loss), the most directly comparable financial measure under GAAP, to Adjusted EBITDA for the periods presented, see "Part II, Item 7. Management's Discussion and Analysis of Financial Condition and Results of Operations—Key Business Metrics—Cash interest expense and Adjusted EBITDA."
43
Table of Contents
ITEM 7. MANAGEMENT'S DISCUSSION AND ANALYSIS OF FINANCIAL CONDITION AND RESULTS OF OPERATIONS
Overview
HD Supply, Inc. is one of the largest industrial distributors in North America. We believe we have leading positions in the three distinct market sectors in which we specialize: Maintenance, Repair & Operations; Infrastructure & Power; and Specialty Construction. We estimate that the aggregate size of our currently addressable markets is approximately $110 billion annually. We serve these markets with an integrated go-to-market strategy. We operate through over 600 locations across 46 U.S. states and nine Canadian provinces. We have approximately 15,000 associates delivering localized, customer-tailored products, services and expertise. We serve approximately 500,000 customers, which include contractors, government entities, maintenance professionals, home builders and industrial businesses. Our broad range of end-to-end product lines and services include over one million SKUs of quality, name-brand and proprietary-brand products as well as value-add services supporting the entire lifecycle of a project from infrastructure and construction to maintenance, repair and operations.
Description of segments
We operate our Company through four reportable segments: Facilities Maintenance, Waterworks, Power Solutions and White Cap.
Facilities Maintenance. Facilities Maintenance distributes MRO products, provides value-add services and fabricates custom products. We estimate that our Facilities Maintenance business unit serves a currently addressable market of $48 billion annually, which includes multifamily, hospitality, healthcare and institutional facilities. Products include electrical and lighting items, plumbing, HVAC products, appliances, janitorial supplies, hardware, kitchen and bath cabinets, window coverings, textiles and guest amenities, healthcare maintenance and water and wastewater treatment products.
Waterworks. Waterworks distributes complete lines of water and wastewater transmission products, serving contractors and municipalities in the water and waste-water industries for residential and non-residential uses. We estimate that our Waterworks business unit serves a currently addressable market of $10 billion annually, which includes the non-residential, residential, water systems, sewage systems and other markets. Products include pipes, fittings, valves, hydrants and meters for use in the construction, maintenance and repair of water and waste-water systems as well as fire-protection systems. Waterworks has complemented its core products through additional offerings, including smart meters (AMR/AMI), HDPE pipes and specific engineered treatment plant products and services.
Power Solutions. Power Solutions distributes electrical transmission and distribution products, power plant MRO supplies and smart-grid products, and arranges materials management and procurement outsourcing for the power generation and distribution industries. We estimate that our Power Solutions business unit serves a currently addressable market of $35 billion annually, which includes the utilities and electrical markets. Products include conductors such as wire and cable, transformers, overhead transmission and distribution hardware, switches, protective devices and underground distribution, connectors used in the construction or maintenance and repair of electricity transmission and substation distribution infrastructure, and electrical wire and cable, switchgear, supplies, lighting and conduit used in non-residential and residential construction.
White Cap. White Cap distributes specialized hardware, tools and engineered materials to non-residential and residential contractors. We estimate that our White Cap business unit serves a currently addressable market of $19 billion annually. Products include tilt-up brace systems, forming and shoring systems, concrete chemicals, hand and power tools, rebar, ladders, safety and fall arrest equipment, specialty screws and fasteners, sealants and adhesives, drainage pipe, geo-synthetics, erosion
44
Table of Contents
and sediment control equipment and other engineered materials used broadly across all types of non-residential and residential construction.
In addition to the reportable segments, our consolidated financial results include "Corporate and Other." Corporate & Other is comprised of the following business units: Crown Bolt, CTI, Repair & Remodel and HD Supply Canada. Crown Bolt is a retail distribution operator providing program and packaging solutions, sourcing, distribution, and in-store service, fasteners, builders' hardware, rope and chain and plumbing accessories, primarily serving Home Depot and other hardware stores. CTI offers turnkey supply and installation services for multiple interior finish options, including flooring, cabinets, countertops, and window coverings, along with comprehensive design center services for non-residential, residential and senior living projects. Our Repair & Remodel business unit offers light remodeling and construction supplies, kitchen and bath cabinets, windows, plumbing materials, electrical equipment and other products, primarily to small remodeling contractors and trade professionals. HD Supply Canada is an industrial distributor that primarily focuses on servicing fasteners/industrial supplies and specialty lighting markets which operates across nine provinces. Corporate & Other also includes costs related to our centralized support functions, which include finance, information technology, human resources, legal, supply chain and other support services and removes inter-segment transactions.
Acquisitions
We enter into strategic acquisitions to expand into new markets, new platforms, and new geographies in an effort to better service existing customers and attract new ones. In accordance with the acquisition method of accounting under ASC 805, Business Combinations, the results of the acquisitions we completed are reflected in our consolidated financial statements from the date of acquisition forward.
On December 3, 2012, the Company purchased substantially all of the assets of Water Products of Oklahoma, Inc., Arkansas Water Products, LLC, and Municipal Water Works Supply, LP (collectively "Water Products") for approximately $52 million. These businesses distribute water, sewer, gas and related products, such as pipes, valves, fittings, hydrants, pumps and meters, and offer maintenance products and repair services primarily to municipalities and contractors. The businesses are operated as part of the Waterworks segment.
On June 29, 2012, the Company purchased Peachtree for approximately $196 million. Headquartered in Marietta, Georgia, Peachtree specializes in customizable business and property marketing supplies, serving residential and commercial property managers, medical facilities, schools and universities, churches and funeral homes. Peachtree is operated as part of the Facilities Maintenance segment.
On May 2, 2011, the Company closed on a transaction to acquire substantially all of the assets of RAMSCO for approximately $21 million. RAMSCO specializes in distributing water, sanitary and storm sewer materials primarily to municipalities and contractors through four locations in upstate New York. These locations are operated as part of the Waterworks segment.
Discontinued operations
On March 26, 2012, the Company sold all of the issued and outstanding equity interests in its IPVF business to Shale-Inland Holdings, LLC. The Company received cash proceeds of approximately $477 million, net of $5 million of transaction costs. As a result of the sale, the Company recorded a $12 million pre-tax gain in fiscal 2012.
On September 9, 2011, the Company sold all of the issued and outstanding equity interests in its Plumbing/HVAC business to Hajoca Corporation. The Company received cash proceeds of approximately $116 million, net of $8 million remaining in escrow and $4 million of transaction costs.
45
Table of Contents
As a result of the sale, the Company recorded a $7 million pre-tax gain in fiscal 2011. During the fiscal 2012, the Company paid an additional $1 million in transaction costs and received $4 million from escrow.
Financial Information
In accordance with ASC 205-20, Discontinued Operations, the results of these operations as well as the gain on sale of businesses are classified as discontinued operations. The presentation of discontinued operations includes revenues and expenses of the discontinued operations and the gains on the sales of businesses, net of tax, as one line item on the Consolidated Statements of Operations and Comprehensive Income (Loss). All Consolidated Statements of Operations and Comprehensive Income (Loss) presented have been revised to reflect this presentation. For additional detail related to the results of operations of the discontinued operations, see "Note 3, Discontinued Operations," in the Notes to the Consolidated Financial Statements within Item 8 of this annual report on Form 10-K.
Key business metrics
Net Sales
We earn our Net sales primarily from the sale of construction, infrastructure, maintenance and renovation and improvement related products and our provision of related services to approximately 500,000 customers, including contractors, government entities, maintenance professionals, home builders and industrial businesses. We recognize sales, net of sales tax and allowances for returns and discounts, when persuasive evidence of an agreement exists, delivery has occurred or services have been rendered, price to the buyer is fixed and determinable and collectability is reasonably assured. Net sales in certain business units, particularly Waterworks and Power Solutions, fluctuate with the price of commodities as we seek to minimize the effects of changing commodities prices by passing such increases in the prices of certain commodity-based products to our customers.
We ship products to customers predominantly by internal fleet and to a lesser extent by third-party carriers. Net sales are recognized from product sales when title to the products is passed to the customer, which generally occurs at the point of destination for products shipped by internal fleet and at the point of shipping for products shipped by third-party carriers.
We include shipping and handling fees billed to customers in net sales. Shipping and handling costs associated with inbound freight are capitalized to inventories and relieved through cost of sales as inventories are sold. Shipping and handling costs associated with outbound freight are included in Selling, general and administrative expenses and totaled $116 million, $96 million and $91 million in fiscal 2012, fiscal 2011 and fiscal 2010, respectively.
Gross profit
Gross profit primarily represents the difference between the product cost from our suppliers (net of earned rebates and discounts) including the cost of inbound freight and the sale price to our customers. The cost of outbound freight (including internal transfers), purchasing, receiving and warehousing are included in Selling, general and administrative expenses within operating expenses. Our gross profits may not be comparable to those of other companies, as other companies may include all of the costs related to their distribution network in cost of sales.
Operating expenses
Operating expenses are primarily comprised of selling, general and administrative costs, which include payroll expenses (salaries, wages, employee benefits, payroll taxes and bonuses), rent, insurance,
46
Table of Contents
utilities, repair and maintenance and professional fees. In addition, operating expenses include depreciation and amortization, restructuring charges, and goodwill impairments.
Cash interest expense and Adjusted EBITDA
Cash interest expense represents total interest expense in continuing operations less (i) amortization of deferred financing costs, (ii) amortization of the asset related to the estimated fair value of the THD Guarantee, (iii) PIK interest expense on our 14.875% Senior Notes and Old Senior Subordinated Notes, (iv) amortization of amounts in accumulated other comprehensive income related to derivatives, and (v) amortization of original issue discounts and premium. Effective September 1, 2011, the interest expense on our Old Senior Subordinated Notes was no longer paid-in-kind, but rather paid in cash.
Cash interest expense is not a recognized term under GAAP and does not purport to be an alternative to interest expense. Management believes that cash interest expense is useful for analyzing the cash flow needs and debt service requirements of the Company. The following table provides a reconciliation of interest expense, the most directly comparable financial measure under GAAP, to cash interest expense for the periods presented (amounts in millions):
| | | | | | | | | | | | | | | | |
| | Fiscal year ended | |
|---|
| | February 3,
2013 | | January 29,
2012 | | January 30,
2011 | | January 31,
2010 | | February 1,
2009 | |
|---|
| | (Dollars in millions)
| |
|---|
Interest expense | | $ | 658 | | $ | 639 | | $ | 623 | | $ | 602 | | $ | 644 | |
Amortization of deferred financing costs | | | (23 | ) | | (37 | ) | | (36 | ) | | (33 | ) | | (33 | ) |
Amortization of THD Guarantee | | | (2 | ) | | (13 | ) | | (14 | ) | | (21 | ) | | (21 | ) |
PIK interest expense(a) | | | (93 | ) | | (132 | ) | | (206 | ) | | (182 | ) | | (192 | ) |
Amortization of amounts in accumulated other comprehensive income related to derivatives | | | — | | | — | | | (2 | ) | | (3 | ) | | (1 | ) |
Amortization of original issue discounts and premium | | | (5 | ) | | — | | | — | | | — | | | — | |
| | | | | | | | | | | | |
Cash interest expense | | $ | 535 | | $ | 457 | | $ | 365 | | $ | 363 | | $ | 397 | |
| | | | | | | | | | | | |
- (a)
- PIK interest expense in fiscal year ended February 3, 2013 represents PIK interest incurred on our 14.875% Senior Notes issued in April 2012. In October 2012, $56 million of this interest was capitalized at the first interest payment date. The entire $93 million of interest was paid in cash upon extinguishment of these notes on February 1, 2013.
We present Adjusted EBITDA because it is a primary measure used by management to evaluate operating performance. We believe the presentation of Adjusted EBITDA enhances investors' overall understanding of the financial performance of our business. Adjusted EBITDA is not a recognized term under GAAP and does not purport to be an alternative to Net income (loss) as a measure of operating performance. We believe Adjusted EBITDA is helpful in highlighting operating trends because it excludes the results of decisions that are outside the control of operating management and that can differ significantly from company to company depending on long-term strategic decisions regarding capital structure, the tax jurisdictions in which companies operate, age and book depreciation of facilities and capital investments. We further believe that Adjusted EBITDA are frequently used by securities analysts, investors and other interested parties in their evaluation of companies, many of
47
Table of Contents
which present an Adjusted EBITDA measure when reporting their results. We compensate for the limitations of using non-GAAP financial measures by using them to supplement GAAP results to provide a more complete understanding of the factors and trends affecting the business than GAAP results alone. Because not all companies use identical calculations, our presentation of Adjusted EBITDA may not be comparable to other similarly titled measures of other companies.
Adjusted EBITDA is based on "Consolidated EBITDA," a measure which is defined in our Term Loan Facility and ABL Facility and used in calculating financial ratios in several material debt covenants. Borrowings under these facilities are a key source of liquidity and our ability to borrow under these facilities depends upon, among other things, our compliance with such financial ratio covenants. In particular, both facilities contain restrictive covenants that can restrict our activities if we do not maintain financial ratios calculated based on Consolidated EBITDA and our ABL Facility requires us to maintain a minimum fixed charge coverage ratio of 1:1 if our specified excess availability (including an amount by which our borrowing base exceeds the outstanding amounts) under the ABL Facility falls below the greater of $150 million and 10% of the aggregate commitments. Adjusted EBITDA is defined as Net income (loss) less Income (loss) from discontinued operations, net of tax, plus (i) Interest expense and Interest income, net, (ii) Provision (benefit) for income taxes, (iii) Depreciation and amortization and further adjusted to exclude non-cash items and certain other adjustments to Consolidated Net Income permitted in calculating Consolidated EBITDA under our Term Loan Facility and our ABL Facility. We believe that presenting Adjusted EBITDA is appropriate to provide additional information to investors about how the covenants in those agreements operate and about certain non-cash and other items. The Term Loan Facility and ABL Facility permit us to make certain additional adjustments to Consolidated Net Income in calculating Consolidated EBITDA, such as projected net cost savings, which are not reflected in the Adjusted EBITDA data presented herein. We may in the future reflect such permitted adjustments in our calculations of Adjusted EBITDA. These covenants are important to the Company as failure to comply with certain covenants would result in a default under our Senior Credit Facilities. The material covenants in our Senior Credit Facilities are discussed in "Item 7. Management's Discussion and Analysis of Financial Condition and Results of Operations—Liquidity and Capital Resources—External Financing."
Adjusted EBITDA has limitations as analytical tools and should not be considered in isolation or as a substitute for analyzing our results as reported under GAAP. Some of these limitations are:
- •
- Adjusted EBITDA does not reflect changes in, or cash requirements for, our working capital needs;
- •
- Adjusted EBITDA does not reflect our interest expense, or the requirements necessary to service interest or principal payments on our debt;
- •
- Adjusted EBITDA does not reflect our income tax expenses or the cash requirements to pay our taxes;
- •
- Adjusted EBITDA does not reflect historical cash expenditures or future requirements for capital expenditures or contractual commitments; and
- •
- although depreciation and amortization charges are non-cash charges, the assets being depreciated and amortized will often have to be replaced in the future, and Adjusted EBITDA do not reflect any cash requirements for such replacements.
48
Table of Contents
The following table presents a reconciliation of net income (loss), the most directly comparable financial measure under GAAP, to Adjusted EBITDA for the periods presented (amounts in millions):
| | | | | | | | | | | | | | | | |
| | Fiscal year ended | |
|---|
| | February 3,
2013 | | January 29,
2012 | | January 30,
2011 | | January 31,
2010 | | February 1,
2009 | |
|---|
Net income (loss) | | $ | (1,179 | ) | $ | (543 | ) | $ | (619 | ) | $ | (514 | ) | $ | (1,255 | ) |
Less income (loss) from discontinued operations, net of tax | | | 20 | | | 20 | | | (6 | ) | | (34 | ) | | 107 | |
| | | | | | | | | | | | |
Income (loss) from continuing operations | | | (1,199 | ) | | (563 | ) | | (613 | ) | | (480 | ) | | (1,148 | ) |
| | | | | | | | | | | | |
Interest expense, net | | | 658 | | | 639 | | | 623 | | | 602 | | | 641 | |
Provision (benefit) from income taxes | | | 3 | | | 79 | | | 28 | | | (198 | ) | | (329 | ) |
Depreciation and amortization(i) | | | 339 | | | 329 | | | 343 | | | 364 | | | 381 | |
Other (income) expense, net(ii) | | | — | | | — | | | (3 | ) | | (8 | ) | | 12 | |
Loss (gain) on extinguishment of debt(iii) | | | 709 | | | — | | | 2 | | | (200 | ) | | — | |
Goodwill & other intangible asset impairment(iv) | | | 152 | | | — | | | — | | | 219 | | | 867 | |
Restructuring charge(v) | | | — | | | — | | | 8 | | | 21 | | | 32 | |
Stock-based compensation(vi) | | | 16 | | | 20 | | | 17 | | | 18 | | | 14 | |
Management fee & related expenses paid to Equity Sponsors(vii) | | | 5 | | | 5 | | | 5 | | | 5 | | | 6 | |
Other | | | — | | | (1 | ) | | 1 | | | — | | | — | |
| | | | | | | | | | | | |
Adjusted EBITDA | | $ | 683 | | $ | 508 | | $ | 411 | | $ | 343 | | $ | 476 | |
| | | | | | | | | | | | |
- (i)
- Depreciation and amortization includes amounts recorded within Cost of sales in the Consolidated Statements of Operations and Comprehensive Income (Loss).
- (ii)
- Represents the (gains)/losses associated with the changes in fair value of interest rate swap contracts not accounted for under hedge accounting and other non-operating (income)/expense.
- (iii)
- Represents the loss/(gain) on extinguishment of debt including the premium/(discount) paid to repurchase or call the debt as well as the write-off of unamortized deferred financing costs and other assets associated with such debt.
- (iv)
- Represents the non-cash impairment charge of goodwill and an intangible asset recognized during fiscal 2012, fiscal 2009 and fiscal 2008 in accordance with Accounting Standards Codification 350, Intangibles—Goodwill and Other.
- (v)
- Represents the costs incurred for employee reductions and branch closures or consolidations. These costs include occupancy costs, severance, and other costs incurred to exit a location.
- (vi)
- Represents the stock-based compensation costs for stock options.
- (vii)
- The Company entered into a management agreement whereby the Company pays the Equity Sponsors a $5 million annual aggregate management fee and related expenses through August 2017.
Relationship with Home Depot
Historical relationship
On August 30, 2007, investment funds associated with Clayton, Dubilier & Rice, Inc., The Carlyle Group and Bain Capital Partners, LLC (collectively the "Equity Sponsors") formed Holding and entered into a stock purchase agreement with The Home Depot, Inc. ("Home Depot" or "THD")
49
Table of Contents
pursuant to which Home Depot agreed to sell to Holding or to a wholly owned subsidiary of Holding certain intellectual properties and all the outstanding common stock of HD Supply, Inc. and the Canadian subsidiary CND Holdings, Inc. On August 30, 2007, through a series of transactions, Holding's direct wholly owned subsidiary, HDS Holding Corporation, acquired direct control of HD Supply through the merger of its wholly owned subsidiary, HDS Acquisition Corp., with and into HD Supply, Inc. and the Canadian subsidiary CND Holdings, Inc. Through these transactions (the "Transactions"), Home Depot was paid cash of approximately $8.2 billion and 12.5% of Holding's common stock worth $325 million.
Strategic agreement
On the date of the Transactions, Home Depot entered into a strategic purchase agreement with Crown Bolt. This agreement provides a guaranteed revenue stream to Crown Bolt through January 31, 2015 by specifying minimum annual purchase requirements from Home Depot. During fiscal 2012 and fiscal 2011, Crown Bolt recorded an additional $19 million and $20 million, respectively, in net sales to satisfy the minimum purchase requirement provisions under the strategic purchase agreement. On February 1, 2013, Crown Bolt reached an agreement to amend and extend its strategic purchase agreement with Home Depot. While the amendment extends the agreement five years through January 31, 2020, retaining Crown Bolt as the exclusive supplier of certain products to Home Depot, it eliminated the minimum purchase requirement and additionally reduces future pricing by approximately $20 million annually. These changes resulted in a reduction of expected future cash proceeds from Home Depot. We, therefore, considered this amendment a triggering event and, as such, performed an additional goodwill impairment analysis for Crown Bolt. As a result of the analysis, Crown Bolt recorded a non-cash, pre-tax goodwill impairment charge of $150 million during the fourth quarter of fiscal 2012. Additionally, we recorded a $2 million charge to write-off an unamortized tradename as a result of the discontinued use of the tradename. For more information on these charges, see "Critical Accounting Policies—Goodwill" within this section of this annual report on Form 10-K and "Note 5, Goodwill and Intangible Assets," in the Notes to the Consolidated Financial Statements within Item 8 of this annual report on Form 10-K.
HD Supply derived revenue from the sale of products to Home Depot of $296 million, $275 million, and $299 million in fiscal 2012, fiscal 2011, and fiscal 2010, respectively.
Tax Sharing Arrangements
For a discussion of tax sharing arrangements with Home Depot, including the risk that we may be required to reimburse Home Depot an amount equal to a contested tax refund plus related interest, see Part I, Item 1A, "Risk Factors—Risks Relating to Our Business—Income tax payments may ultimately differ from amounts currently recorded by us. Future tax law changes may materially increase our prospective income tax expense," and Part III, Item 13, "Certain Relationships and Related Party Transactions, and Director Independence—Tax sharing arrangements" of this annual report on Form 10-K.
Seasonality
In a typical year, our operating results are impacted by seasonality. Historically, sales of our products have been higher in the second and third quarters of each fiscal year due to favorable weather and longer daylight conditions during these periods. Seasonal variations in operating results may also be significantly impacted by inclement weather conditions, such as cold or wet weather, which can delay construction projects.
50
Table of Contents
Fiscal year
HD Supply's fiscal year is a 52- or 53-week period ending on the Sunday nearest to January 31. Fiscal year ended February 3, 2013 ("fiscal 2012") includes 53 weeks. Fiscal years ended January 29, 2012 ("fiscal 2011") and January 30, 2011 ("fiscal 2010") both include 52 weeks. The impact of a 53rd week in fiscal 2012 led to increased net sales of $148 million and increased Adjusted EBITDA of $14 million.
Consolidated results of operations
| | | | | | | | | | | | | | | | |
| |
| |
| |
| | Percentage
Increase (Decrease) | |
|---|
| | Fiscal Year | |
| |
| |
|---|
| | 2012
vs. 2011 | | 2011
vs. 2010 | |
|---|
Dollars in millions | | 2012 | | 2011 | | 2010 | |
|---|
Net sales | | $ | 8,035 | | $ | 7,028 | | $ | 6,449 | | | 14.3 | | | 9.0 | |
Gross profit | | | 2,320 | | | 2,014 | | | 1,841 | | | 15.2 | | | 9.4 | |
Operating expenses: | | | | | | | | | | | | | | | | |
Selling, general & administrative | | | 1,661 | | | 1,532 | | | 1,455 | | | 8.4 | | | 5.3 | |
Depreciation & amortization | | | 336 | | | 327 | | | 341 | | | 2.8 | | | (4.1 | ) |
Restructuring | | | — | | | — | | | 8 | | | — | | | * | |
Goodwill & other intangible asset
impairment(a) | | | 152 | | | — | | | — | | | * | | | * | |
| | | | | | | | | | | | | | |
Total operating expenses | | | 2,149 | | | 1,859 | | | 1,804 | | | 15.6 | | | 3.0 | |
Operating income (loss) | | | 171 | | | 155 | | | 37 | | | 10.3 | | | * | |
Interest expense | | | 658 | | | 639 | | | 623 | | | 3.0 | | | 2.6 | |
Loss on extinguishment of debt | | | 709 | | | — | | | 2 | | | * | | | * | |
Other (income) expense, net | | | — | | | — | | | (3 | ) | | — | | | * | |
| | | | | | | | | | | | | | |
Income (loss) from continuing operations before provision (benefit) for income taxes | | | (1,196 | ) | | (484 | ) | | (585 | ) | | * | | | * | |
Provision (benefit) for income taxes | | | 3 | | | 79 | | | 28 | | | * | | | * | |
| | | | | | | | | | | | | | |
Income (loss) from continuing operations | | $ | (1,199 | ) | $ | (563 | ) | $ | (613 | ) | | * | | | * | |
| | | | | | | | | | | | | | |
Non-GAAP Financial Data: | | | | | | | | | | | | | | | | |
Adjusted EBITDA(b) | | $ | 683 | | $ | 508 | | $ | 411 | | | 34.4 | | | 23.6 | |
- *
- not meaningful;(a) See "Note 5, Goodwill and Intangible Assets," in the Notes to the Consolidated Financial Statements within Item 8 of this annual report on Form 10-K.(b) See "Part II, Item 7. Management's Discussion and Analysis of Financial Condition and Results of Operations—Key Business Metrics—Cash interest expense and Adjusted EBITDA." for a reconciliation of net income (loss), the most directly comparable financial measure under GAAP, to Adjusted EBITDA for the periods presented.
51
Table of Contents
Consolidated results of operations (Continued)
| | | | | | | | | | | | | | | | |
| | % of Net sales | | Basis Point
Increase (Decrease) | |
|---|
| | Fiscal Year | |
|---|
| | 2012
vs. 2011 | | 2011
vs. 2010 | |
|---|
| | 2012 | | 2011 | | 2010 | |
|---|
Net sales | | | 100.0 | % | | 100.0 | % | | 100.0 | % | | — | | | — | |
Gross profit | | | 28.9 | | | 28.7 | | | 28.5 | | | 20 | | | 20 | |
Operating expenses: | | | | | | | | | | | | | | | | |
Selling, general & administrative | | | 20.7 | | | 21.8 | | | 22.6 | | | (110 | ) | | (80 | ) |
Depreciation & amortization | | | 4.2 | | | 4.7 | | | 5.2 | | | (50 | ) | | (50 | ) |
Restructuring | | | — | | | — | | | 0.1 | | | — | | | (10 | ) |
Goodwill & other intangible asset impairment | | | 1.9 | | | — | | | — | | | 190 | | | — | |
| | | | | | | | | | | | | | |
Total operating expenses | | | 26.8 | | | 26.5 | | | 27.9 | | | 30 | | | (140 | ) |
Operating income (loss) | | | 2.1 | | | 2.2 | | | 0.6 | | | (10 | ) | | 160 | |
Interest expense | | | 8.2 | | | 9.1 | | | 9.7 | | | (90 | ) | | (60 | ) |
Loss on extinguishment of debt | | | 8.8 | | | — | | | — | | | * | | | — | |
Other (income) expense, net | | | — | | | — | | | — | | | — | | | — | |
| | | | | | | | | | | | | | |
Income (loss) from continuing operations before provision (benefit) for income taxes | | | (14.9 | ) | | (6.9 | ) | | (9.1 | ) | | * | | | 220 | |
Provision (benefit) for income taxes | | | — | | | 1.1 | | | 0.4 | | | — | | | 70 | |
| | | | | | | | | | | | | | |
Income (loss) from continuing operations | | | (14.9 | ) | | (8.0 | ) | | (9.5 | ) | | * | | | 150 | |
| | | | | | | | | | | | | | |
Non-GAAP Financial Data: | | | | | | | | | | | | | | | | |
Adjusted EBITDA | | | 8.5 | | | 7.2 | | | 6.4 | | | 130 | | | 80 | |
Fiscal 2012 compared to fiscal 2011
Highlights
Net sales in fiscal 2012 increased $1,007 million, or 14.3%, compared to fiscal 2011. Excluding the impact of the 53rd week in fiscal 2012, Net sales increased $859 million, or 12.2%, as compared to fiscal 2011. All of our business units realized increases in Net sales, led by Facilities Maintenance, Waterworks, Power Solutions and White Cap. Operating income increased $16 million, or 10.3%, during fiscal 2012 as compared to fiscal 2011, negatively impacted by the goodwill and other intangible asset impairment and positively impacted by the 53rd week in fiscal 2012. Excluding the impairment and the 53rd week, Operating income increased $154 million, or 99.4%, during fiscal 2012 as compared to fiscal 2011. Adjusted EBITDA increased by $175 million, or 34.4%, in fiscal 2012 as compared to fiscal 2011. In addition, on a 52-week basis, Adjusted EBITDA grew $161 million, or 31.7%, in fiscal 2012 as compared to fiscal 2011. This growth was driven by our sales initiatives, continued focus on margin expansion and cost control, geographic and product line expansions through acquisitions and greenfields, and improvements in the markets we serve.
During fiscal 2012, Crown Bolt and Home Depot agreed to an amendment and five-year extension of the strategic purchase agreement, which eliminated the minimum purchase requirement beginning with fiscal 2013, but retains Crown Bolt as the exclusive supplier of products purchased by Home Depot from Crown Bolt through January 31, 2020. In addition, we refinanced all of our outstanding indebtedness, extending our closest principal maturity from 2015 to 2017 and lowered our future cash interest payments. We maintain strong liquidity with $981 million available as of February 3, 2013.
52
Table of Contents
Net sales
Net sales increased $1,007 million, or 14.3%, to $8,035 million during fiscal 2012 as compared to fiscal 2011. Excluding the impact of the 53rd week in fiscal 2012, Net sales increased $859 million, or 12.2%, as compared to fiscal 2011.
For the full year and on a 52-week basis, each of our business units experienced an increase in Net sales during fiscal 2012 as compared to fiscal 2011. The Net sales increases were primarily due to sales initiatives at each of our business units and, to a lesser extent, increases in market volume and acquisitions. Organic sales growth on a 52-week basis was 11.4% for fiscal 2012 as compared to fiscal 2011.
Gross profit
Gross profit increased $306 million, or 15.2%, to $2,320 million during fiscal 2012 as compared to fiscal 2011. Excluding the impact of the 53rd week in fiscal 2012, Gross profit increased $264 million, or 13.1%, as compared to fiscal 2011.
An increase in gross profit in fiscal 2012 was experienced across all of our business units, driven by Facilities Maintenance, Waterworks, Power Solutions and White Cap.
Gross profit as a percentage of Net sales ("gross margin") increased approximately 20 basis points to 28.9% in fiscal 2012 from 28.7% in fiscal 2011. The improvement was driven by Facilities Maintenance and White Cap.
Operating expenses
Operating expenses increased $290 million, or 15.6%, to $2,149 million during fiscal 2012 as compared to fiscal 2011. Excluding the $152 million goodwill and other intangible asset impairment, operating expenses increased $138 million, or 7.4%, during fiscal 2012 as compared to fiscal 2011.
Selling, general and administrative expenses increased $129 million, or 8.4%, in fiscal 2012 as compared to fiscal 2011. Excluding the impact of the 53rd week, Selling, general and administrative expenses increased $101 million, or 6.6%, in fiscal 2012 as compared to fiscal 2011. This was primarily a result of an increase in variable expenses due to higher sales volumes and investment in sales initiatives. Depreciation and amortization expense increased by $9 million, or 2.8%, in fiscal 2012 as compared to fiscal 2011. The increase was due to investment in property and equipment.
Operating expenses as a percentage of Net sales increased approximately 30 basis points to 26.8%in fiscal 2012 as compared to fiscal 2011, primarily due to the goodwill and other intangible asset impairment charge. Excluding the impairment charge, Operating expenses as a percentage of Net sales decreased approximately 160 basis points to 24.9% in fiscal 2012 as compared to fiscal 2011. The improvement reflects the leverage of fixed costs through sales volume increases primarily at White Cap and Waterworks, and, to a lesser extent, Facilities Maintenance.
Operating income (loss)
Operating income increased $16 million, or 10.3%, during fiscal 2012 as compared to fiscal 2011, negatively impacted by the goodwill and other intangible asset impairment and positively impacted by the 53rd week in fiscal 2012. Excluding the impairment and the 53rd week, Operating income increased $154 million, or 99.4%, during fiscal 2012 as compared to fiscal 2011. The improvement was due to the increase in Net sales and Gross profit and control over the growth in Operating expenses.
Operating income as a percentage of Net sales decreased approximately 10 basis points in fiscal 2012 as compared to fiscal 2011, impacted negatively by the goodwill and other intangible asset impairment charge. Excluding the impairment charge, Operating income as a percentage of Net sales
53
Table of Contents
increased approximately 180 basis points to 4.0% in fiscal 2012 as compared to fiscal 2011, driven by Facilities Maintenance, Waterworks, Power Solutions and White Cap.
Interest expense
Interest expense increased $19 million, or 3.0%, during fiscal 2012 as compared to fiscal 2011. The increase was primarily due to the additional interest expense paid as a result of the shortened call period on the early extinguishment of the Old Senior Notes and an increase in outstanding borrowings, partially offset by lower amortization of deferred debt costs, only one fiscal quarter of amortization of the intangible asset value assigned to the THD Guarantee in fiscal 2012, and a reduction in effective interest rates from our refinancing activity.
Loss on extinguishment of debt
During fiscal 2012, our debt refinancing and redemption activities resulted in charges of $709 million recorded in accordance with GAAP (ASC 470-50, Debt-Modifications and Extinguishments).
In connection with the refinancing of most of our debt instruments in the first quarter of fiscal 2012, we recorded a charge of $220 million, which consisted of $150 million for the premium paid to the holders of the Old Senior Notes, as contractually required, upon early extinguishment, $46 million write-off of unamortized deferred debt costs and $24 million to write-off the remaining unamortized value associated with the THD Guarantee that was terminated in the refinancing.
In connection with the partial redemption of our Old Senior Subordinated Notes in the fourth quarter of fiscal 2012, we recorded a charge of $37 million, which consisted of a $31 million premium payment to redeem the Old Senior Subordinated Notes and $5 million to write-off the pro-rata portion of the unamortized deferred debt costs.
In connection with the repurchase of our 14.875% Senior Notes in the fourth quarter of fiscal 2012, we recorded a charge of $452 million, which consisted of a $422 million make-whole premium payment, a $28 million write-off unamortized original issue discount, and $2 million write-off of unamortized deferred debt costs.
For additional information on our debt-related activity in fiscal 2012, see "Liquidity, capital resources and financial condition—External financing" within this section of this annual report on Form 10-K.
Provision (benefit) for income taxes
The provision for income taxes from continuing operations in fiscal 2012 was $3 million compared to $79 million in fiscal 2011. The effective rate for continuing operations for fiscal 2012 was an expense of 0.2%, reflecting the impact of a $442 million increase in the U.S. valuation allowance on deferred tax assets driven by the uncertainty regarding our ability to utilize the NOL for fiscal 2012. The U.S. valuation allowance for fiscal 2012 includes an increase of $44 million related to deferred tax liabilities generated by indefinite life intangibles. The deferred tax liability associated with indefinite life intangibles is not available as a source of taxable income to support the realization of deferred tax assets created by other deductible temporary timing differences. The fiscal 2012 effective tax rate was also impacted by a reduction in deferred tax liabilities of $39 million related to the goodwill impairment for book purposes. The fiscal 2012 goodwill impairment created a deferred tax asset which reduced the fiscal 2012 tax expense by decreasing the deferred tax liability associated with indefinite life intangibles which prior to the impairment could not serve as a source of taxable income.
In addition, the tax expense for fiscal 2012 was also reduced by an adjustment to the Company's valuation allowance as a result of the acquisition of additional deferred tax liabilities in conjunction
54
Table of Contents
with the Peachtree acquisition. The Company recorded a $6 million reduction in income tax expense associated with an adjustment to the Company's valuation allowance as a result of the Peachtree acquisition. The impact to the Company's income tax rate of acquiring Peachtree's net deferred tax liability is recorded in the Company's financial statements outside of Peachtree's purchase accounting. Peachtree's net deferred tax liability of $6 million recorded in purchase accounting is available to the Company as a source of future taxable income to support the realization of the Company's deferred tax assets which results in lowering the Company's valuation allowance and income tax expense by such amount.
The effective rate for continuing operations for fiscal 2011 was an expense of 16.4%, reflecting the impact of a $259 million increase in the U.S. valuation allowance on deferred tax assets driven by the uncertainty regarding our ability to utilize the NOL for fiscal 2011. The U.S. valuation allowance for fiscal 2011 includes an increase of $58 million related to deferred tax liabilities generated by indefinite lived intangibles. The deferred tax liability associated with indefinite life intangibles is not available as a source of taxable income to support the realization of deferred tax assets created by other deductible temporary timing differences.
We regularly assess the realization of our net deferred tax assets and the need for any valuation allowance. This assessment requires management to make judgments as to the recoverability of the deferred tax assets and if it is determined that it is "more likely than not" that the benefits will not be realized, valuation allowances are recognized. In evaluating whether it is "more likely than not" that the Company would recover these deferred tax assets, future taxable income, the reversal of existing temporary differences, and tax planning strategies are considered.
Adjusted EBITDA
Adjusted EBITDA increased $175 million, or 34.4%, in fiscal 2012 as compared to fiscal 2011. On a 52-week basis, Adjusted EBITDA increased $161 million, or 31.7%, as compared to fiscal 2011.
The increase in Adjusted EBITDA in fiscal 2012 is primarily due to the increases in Net sales and Gross profit. Adjusted EBITDA as a percentage of Net sales increased approximately 130 basis points to 8.5% in fiscal 2012 as compared to fiscal 2011, primarily due to the leverage of fixed costs through sales volume increases and efforts to control variable expenses.
Fiscal 2011 compared to fiscal 2010
Highlights
Net sales in fiscal 2011 increased $579 million, or 9.0%, compared to fiscal 2010. The increase was driven by Facilities Maintenance, Waterworks, Power Solutions and White Cap. Despite continued weakness in the economy, during fiscal 2011, our sales initiatives, continued focus on margin expansion and cost control resulted in an increase in our Operating income of $118 million and our Adjusted EBITDA of $97 million, or 23.6%, as compared to fiscal 2010. In addition, we continued to maintain strong liquidity, with $1.2 billion available as of January 29, 2012.
Net sales
Net sales increased $579 million, or 9.0%, to $7,028 million during fiscal 2011 as compared to fiscal 2010.
Net sales were positively impacted by sales initiatives, improvements in the energy market, and commodity prices. The increase was led by Facilities Maintenance with an increase of $188 million, or 11.2%, in fiscal 2011 as compared to fiscal 2010.
55
Table of Contents
Gross profit
Gross profit increased $173 million, or 9.4%, to $2,014 million during fiscal 2011 as compared to fiscal 2010.
The improvements in gross profit were primarily due to increased sales volumes across most of our business units. Gross margin increased approximately 20 basis points to 28.7% in fiscal 2011 from 28.5% in fiscal 2010, primarily as a result of product mix.
Operating expenses
Operating expenses increased $55 million, or 3.0%, to $1,859 million during fiscal 2011 as compared to fiscal 2010.
Selling, general and administrative expenses increased at our four largest business units during fiscal 2011 as compared to fiscal 2010, primarily as a result of increases in variable expenses due to sales volume increases and, to a lesser extent, an increase in employee benefits related to the restoration of the Company's match on the 401(k) defined contribution plan. Selling, general and administrative expenses as a percentage of Net sales declined approximately 80 basis points to 21.8% in fiscal 2011 as compared to fiscal 2010, through the leverage of fixed costs through sales volume increases and efforts to control variable expenses.
Depreciation and amortization expense declined primarily due to lower capital expenditures in recent years. During fiscal 2010, we recorded $8 million of restructuring charges under the fiscal 2009 restructuring plan.
Operating income (loss)
Operating income of $155 million increased $118 million during fiscal 2011 as compared to fiscal 2010, as a result of the improvement in Net sales and Gross profit and control over growth in Operating expenses. Operating income as a percentage of Net sales increased approximately 160 basis points in fiscal 2011 as compared to fiscal 2010. The improvement was driven by White Cap and Facilities Maintenance.
Interest expense
Interest expense associated with interest-bearing debt was higher in fiscal 2011 as compared to fiscal 2010. The increase was due to an increase in the principal of the Old Senior Subordinated Notes due to the PIK interest capitalization, partially offset by a decline in average debt balances on the Old ABL Credit Facility and the existing cash flow revolving credit facility as compared to fiscal 2010. Interest expense in fiscal 2011 was also positively impacted by a reduction in interest rates on our variable rate debt as compared to fiscal 2010.
Loss on extinguishment of debt
In connection with the amendment of our debt agreements in fiscal 2010, we prepaid $30 million aggregate principal of our Old Term Loans under the Old Senior Secured Credit Facility. As a result of this extinguishment, we wrote-off the unamortized pro-rata portion of the THD Guarantee and the unamortized pro-rata portion of the deferred debt costs, resulting in a charge of $2 million.
Other (income) expense, net
During fiscal 2010, we recognized a $6 million gain related to the valuation of our interest rate swaps. In addition, in connection with the amendment of our debt agreements in fiscal 2010, we incurred $3 million of financing fees that were recorded to Other (income) expense, net.
56
Table of Contents
Provision (benefit) for income taxes
The provision (benefit) for income taxes from continuing operations increased to a $79 million provision in fiscal 2011 from a $28 million provision in fiscal 2010. The effective rate for continuing operations for fiscal 2011 was an expense of 16.4%, mainly driven by the impact of a $259 million increase in the U.S. valuation allowance on deferred tax assets. The U.S. valuation allowance for fiscal 2011 included an increase of $58 million related to deferred tax liabilities generated by indefinite lived intangibles. The deferred tax liability associated with indefinite life intangibles is not available as a source of taxable income to support the realization of deferred tax assets created by other deductible temporary timing differences. The effective rate for continuing operations for fiscal 2010 was an expense of 4.8% driven by the impact of a $228 million increase in the valuation allowance on deferred tax assets.
Adjusted EBITDA
Adjusted EBITDA increased $97 million, or 23.6%, in fiscal 2011 as compared to fiscal 2010. The increase in Adjusted EBITDA is primarily due to the increases in Net sales and Gross profit. Adjusted EBITDA as a percentage of Net sales increased approximately 80 basis points to 7.2% in fiscal 2011, primarily due to the leverage of fixed costs through sales volume increases and efforts to control variable expenses.
Results of operations by reportable segment
Facilities Maintenance
| | | | | | | | | | | | | | | | |
| |
| |
| |
| | Increase (Decrease) | |
|---|
| | Fiscal Year | |
|---|
| | 2012 vs. 2011 | | 2011 vs. 2010 | |
|---|
| | 2012 | | 2011 | | 2010 | |
|---|
| | (Dollars in millions)
| |
|---|
Net sales | | $ | 2,182 | | $ | 1,870 | | $ | 1,682 | | | 16.7 | % | | 11.2 | % |
Operating income (loss) | | $ | 271 | | $ | 213 | | $ | 179 | | | 27.2 | % | | 19.0 | % |
% of Net sales | | | 12.4 | % | | 11.4 | % | | 10.6 | % | | 100 bps | | | 80 bps | |
Depreciation and amortization | | | 118 | | | 105 | | | 103 | | | 12.4 | % | | 1.9 | % |
| | | | | | | | | | | | | | |
Adjusted EBITDA | | $ | 389 | | $ | 318 | | $ | 282 | | | 22.3 | % | | 12.8 | % |
% of Net sales | | | 17.8 | % | | 17.0 | % | | 16.8 | % | | 80 bps | | | 20 bps | |
Fiscal 2012 compared to fiscal 2011
Net sales
Net sales increased $312 million, or 16.7%, during fiscal 2012 as compared to fiscal 2011. Excluding the impact of the 53rd week in fiscal 2012, Net sales increased $271 million, or 14.5%, as compared to fiscal 2011.
The Net sales growth was primarily due to new initiatives in the multifamily, hospitality, and healthcare markets. Net sales were also positively impacted by improving market conditions in the multifamily and hospitality markets and the Peachtree acquisition in June 2012. Organic sales growth on a 52-week basis was 12.4% in fiscal 2012 as compared to fiscal 2011.
Adjusted EBITDA
Adjusted EBITDA increased $71 million, or 22.3%, during fiscal 2012 as compared to fiscal 2011. Excluding the impact of the 53rd week in fiscal 2012, Adjusted EBITDA increased $63 million, or 19.8%, as compared to fiscal 2011.
57
Table of Contents
The increase was due to sales volume, new sales initiatives, and the Peachtree acquisition. This increase was partially offset by increased Selling, general and administrative expense related to the hiring of additional associates to support the expanding business and drive future growth.
Adjusted EBITDA as a percentage of Net sales increased approximately 80 basis points to 17.8% in fiscal 2012 as compared to fiscal 2011. The increase was primarily due to expansion of gross margins and the leverage of fixed costs through sales volume increases, partially offset by the investment in sales force additions.
Fiscal 2011 compared to fiscal 2010
Net sales
Net sales increased $188 million, or 11.2%, to $1,870 million during fiscal 2011 as compared to fiscal 2010.
The Net sales growth was driven by new initiatives primarily in the hospitality, multifamily, and healthcare markets. In addition, Net sales were positively impacted by favorable market conditions in the multifamily and hospitality industries.
Adjusted EBITDA
Adjusted EBITDA increased $36 million, or 12.8%, during fiscal 2011 as compared to fiscal 2010.
The increase was due to volume increases and new sales initiatives, partially offset by increased Selling, general and administrative expense, primarily personnel costs related to increasing sales volume and new initiatives. Also, contributing to the increased Selling, general and administrative expenses were increased average fuel prices and the reinstatement of the Company's 401(k) match.
Adjusted EBITDA as a percentage of Net sales increased approximately 20 basis points to 17.0% in fiscal 2011 as compared to fiscal 2010, primarily due to the leverage of fixed costs through sales volume increases, partially offset by the investment in new sales initiatives.
Waterworks
| | | | | | | | | | | | | | | | |
| |
| |
| |
| | Increase (Decrease) | |
|---|
| | Fiscal Year | |
|---|
| | 2012 vs. 2011 | | 2011 vs. 2011 | |
|---|
| | 2012 | | 2011 | | 2010 | |
|---|
| | (Dollars in millions)
| |
|---|
Net sales | | $ | 2,028 | | $ | 1,772 | | $ | 1,659 | | | 14.4 | % | | 6.8 | % |
Operating income (loss) | | $ | 31 | | $ | 12 | | $ | (6 | ) | | 158.3 | % | | * | |
% of Net sales | | | 1.5 | % | | 0.7 | % | | (0.4 | )% | | 80 bps | | | 110 bps | |
Depreciation and amortization | | | 106 | | | 100 | | | 99 | | | 6.0 | % | | 1.0 | % |
Restructuring | | | — | | | — | | | 1 | | | — | | | * | |
| | | | | | | | | | | | | | |
Adjusted EBITDA | | $ | 137 | | $ | 112 | | $ | 94 | | | 22.3 | % | | 19.1 | % |
% of Net sales | | | 6.8 | % | | 6.3 | % | | 5.7 | % | | 50 bps | | | 60 bps | |
Fiscal 2012 compared to fiscal 2011
Net sales
Net sales increased $256 million, or 14.4%, in fiscal 2012 as compared to fiscal 2011. Excluding the impact of the 53rd week in fiscal 2012, Net sales increased $220 million, or 12.4%, as compared to fiscal 2011.
58
Table of Contents
The Net sales increase was primarily due to sales initiatives, increases in prices due to commodity price inflation, primarily polyvinyl chloride ("PVC") and ductile iron products, and improvement in the residential housing market. In addition, Net sales were positively impacted by the fiscal 2012 acquisition of Water Products and the fiscal 2011 acquisition of RAMSCO. Organic sales growth on a 52-week basis was 11.2% in fiscal 2012 as compared to fiscal 2011.
Adjusted EBITDA
Adjusted EBITDA increased $25 million, or 22.3%, during fiscal 2012 as compared to fiscal 2011. Excluding the impact of the 53rd week in fiscal 2012, Adjusted EBITDA increased $23 million, or 20.5%, as compared to fiscal 2011.
The increase was due to volume increases and new sales initiatives, partially offset by increased Selling, general and administrative expense, primarily personnel costs due to the increased volume.
Adjusted EBITDA as a percentage of Net sales increased approximately 50 basis points in fiscal 2012 as compared to fiscal 2011. The increase was driven primarily by the leverage of fixed costs through sales volume increases, efforts to control variable expenses and product mix. In addition, fiscal 2012 was negatively impacted by gross margin compression from fluctuating commodity prices.
Fiscal 2011 compared to fiscal 2010
Net sales
Net sales increased $113 million, or 6.8%, to $1,772 million during fiscal 2011 as compared to fiscal 2010.
The increase was primarily due to sales initiatives and increases in prices due to commodity price inflation, primarily PVC. The acquisition of RAMSCO also contributed to the Net sales increase. Organic sales growth in fiscal 2011 was 5.0%.
Adjusted EBITDA
Adjusted EBITDA increased $18 million, or 19.1%, during fiscal 2011 as compared to fiscal 2010.
The increase was driven by volume increases and positive impacts from fluctuating commodity prices. The positive impacts were partially offset by higher Selling, general and administrative costs, primarily due to variable compensation as a result of higher sales volumes.
Adjusted EBITDA as a percentage of Net sales increased approximately 60 basis points in fiscal 2011 as compared to fiscal 2010. The increase was driven primarily by the leverage of fixed costs through sales volume increases and efforts to control variable expenses.
Power Solutions
| | | | | | | | | | | | | | | | |
| |
| |
| |
| | Increase (Decrease) | |
|---|
| | Fiscal Year | |
|---|
| | 2012 vs. 2011 | | 2011 vs. 2010 | |
|---|
| | 2012 | | 2011 | | 2010 | |
|---|
| | (Dollars in millions)
| |
|---|
Net sales | | $ | 1,787 | | $ | 1,625 | | $ | 1,462 | | | 10.0 | % | | 11.1 | % |
Operating income (loss) | | $ | 47 | | $ | 25 | | $ | 25 | | | 88.0 | % | | — | |
% of Net sales | | | 2.6 | % | | 1.5 | % | | 1.7 | % | | 110 bps | | | (20 | ) bps |
Depreciation and amortization | | | 25 | | | 25 | | | 24 | | | — | | | 4.2 | % |
| | | | | | | | | | | | | | |
Adjusted EBITDA | | $ | 72 | | $ | 50 | | $ | 49 | | | 44.0 | % | | 2.0 | % |
% of Net sales | | | 4.0 | % | | 3.1 | % | | 3.4 | % | | 90 bps | | | (30 | ) bps |
59
Table of Contents
Fiscal 2012 compared to fiscal 2011
Net sales
Net sales increased $162 million, or 10.0%, in fiscal 2012 as compared to fiscal 2011. Excluding the impact of the 53rd week in fiscal 2012, Net sales increased $127 million, or 7.8%, as compared to fiscal 2011.
The Net sales increase was driven by increasing sales volume with large investor-owned utilities and other sales initiatives.
Adjusted EBITDA
Adjusted EBITDA increased $22 million, or 44.0%, during fiscal 2012 as compared to fiscal 2011. Excluding the impact of the 53rd week in fiscal 2012, Adjusted EBITDA increased $20 million, or 40.0%, as compared to fiscal 2011.
The Adjusted EBITDA increase was driven by increasing sales and leverage of fixed costs through sales volume increases. Adjusted EBITDA as a percentage of Net sales increased approximately 90 basis points in fiscal 2012 as compared to fiscal 2011. The increase was driven primarily by the leverage of fixed costs through sales volume increases and efforts to control variable expenses, partially offset by product mix.
Fiscal 2011 compared to fiscal 2010
Net sales
Net sales increased $163 million, or 11.1%, to $1,625 million during fiscal 2011 as compared to fiscal 2010.
Net sales growth was primarily due to sales initiatives, increased transmission and substation projects, and positive impacts from fluctuating commodity prices, primarily copper and steel.
Adjusted EBITDA
Adjusted EBITDA increased $1 million, or 2.0%, during fiscal 2011 as compared to fiscal 2010. The Adjusted EBITDA increase is driven by sales volume increases offset by margin compression.
Adjusted EBITDA as a percentage of Net sales decreased approximately 30 basis points in fiscal 2011 as compared to fiscal 2010. The decrease was driven by gross margin compression, partially offset by the leverage of fixed costs through sales volume increases and efforts to control variable expenses.
White Cap
| | | | | | | | | | | | | | | | |
| | Fiscal Year | | Increase (Decrease) | |
|---|
| | 2012 | | 2011 | | 2010 | | 2012 vs. 2011 | | 2011 vs. 2010 | |
|---|
| | (Dollars in millions)
| |
|---|
Net sales | | $ | 1,178 | | $ | 981 | | $ | 852 | | | 20.1 | % | | 15.1 | % |
Operating income (loss) | | $ | 24 | | $ | (16 | ) | $ | (54 | ) | | * | | | 70.4 | % |
% of Net sales | | | 2.0 | % | | (1.6 | )% | | (6.3 | )% | | 360 bps | | | 470 bps | |
Depreciation and amortization | | | 32 | | | 33 | | | 39 | | | (3.0 | )% | | (15.4 | )% |
Restructuring | | | — | | | — | | | 5 | | | — | | | * | |
| | | | | | | | | | | | | | |
Adjusted EBITDA | | $ | 56 | | $ | 17 | | $ | (10 | ) | | * | | | * | |
% of Net sales | | | 4.8 | % | | 1.7 | % | | (1.2 | )% | | 310 bps | | | 290 bps | |
60
Table of Contents
Fiscal 2012 compared to fiscal 2011
Net sales increased $197 million, or 20.1%, during fiscal 2012 as compared to fiscal 2011. Excluding the impact of the 53rd week in fiscal 2012, Net sales increased $176 million, or 17.9%, as compared to fiscal 2011.
The increase was primarily due to sales initiatives, and, to a lesser extent, improvements in the residential housing market.
Adjusted EBITDA
Adjusted EBITDA increased $39 million to $56 million during fiscal 2012 as compared to $17 million in fiscal 2011. Excluding the impact of the 53rd week in fiscal 2012, Adjusted EBITDA increased $38 million as compared to fiscal 2011.
The increase in Adjusted EBITDA was primarily driven by sales initiatives, product mix, and sourcing initiatives.
Adjusted EBITDA as a percentage of Net sales increased approximately 310 basis points to 4.8% in fiscal 2012 as compared to fiscal 2011, primarily due to improved gross margins and the leverage of fixed costs through sales volume increases. Gross margins were favorably impacted by purchase discounts and rebates achieved as a result of higher purchasing volumes.
Fiscal 2011 compared to fiscal 2010
Net sales
Net sales increased $129 million, or 15.1%, to $981 million during fiscal 2011 as compared to fiscal 2010.
The increase in Net sales was driven primarily by sales initiatives and, to a lesser extent, rising commodity prices, primarily steel.
Adjusted EBITDA
Adjusted EBITDA improved $27 million during fiscal 2011 to $17 million compared to a loss of $10 million in fiscal 2010.
The improvement was primarily driven by gross profit increases as a result of volume and commodity impacts, the leverage of fixed costs through sales volume increases, and efforts to control variable expenses.
Adjusted EBITDA as a percentage of Net sales improved to 1.7% in fiscal 2011 from (1.2)% in fiscal 2010, primarily due to the leverage of fixed costs through sales volume increases and efforts to control variable expenses and, to a lesser extent, improved gross margins.
Liquidity, capital resources and financial condition
Sources and uses of cash
Our sources of funds, primarily from operations, cash on-hand, and, to the extent necessary, from readily available external financing arrangements, are sufficient to meet all current obligations on a timely basis. We believe that these sources of funds will be sufficient to meet the operating needs of our business for at least the next twelve months.
During fiscal 2012, our sources of funds were primarily cash receipts from operations, net debt borrowings, and proceeds from the sale of IPVF. These sources of cash were offset by the costs
61
Table of Contents
associated with the debt refinancings, investment of cash restricted for debt repayment, payment of interest on debt, and acquisitions.
As of February 3, 2013, our combined liquidity of approximately $981 million was comprised of $141 million in cash and cash equivalents and $840 million of available borrowings under our ABL Facility, based on qualifying inventory and receivables.
Information about the Company's cash flows, by category, is presented in the Consolidated Statements of Cash Flows and is summarized as follows:
Net cash provided by (used for):
| | | | | | | | | | |
| | Fiscal 2012 | | Fiscal 2011 | | Fiscal 2010 | |
|---|
| | (Amounts in millions)
| |
|---|
Operating activities | | $ | (681 | ) | $ | (165 | ) | $ | 551 | |
Investing activities | | | (800 | ) | | (6 | ) | | (45 | ) |
Financing activities | | | 1,511 | | | (10 | ) | | (755 | ) |
Working capital
Working capital, excluding cash and cash equivalents, increased to $979 million as of the end of fiscal 2012 from $901 million as of the end of fiscal 2011. During March 2012, we sold our IPVF business. Excluding the disposition impact, working capital increased approximately $410 million, primarily due to an increase in Receivables and Inventory reflecting higher sales volumes and a decrease in accrued interest, offset by an increase in Accounts Payable and a decrease in Deferred tax assets.
Working capital, excluding cash and cash equivalents, increased to $901 million as of the end of fiscal 2011 from $884 million as of the end of fiscal 2010. The increase was primarily driven by an increase in receivables and inventory as well as a decrease to accounts payable due to the timing of inventory purchases, substantially offset by the working capital decrease for the sale of businesses and increases in accrued interest and the current maturities of long-term debt.
Operating activities
Cash flow from operating activities in fiscal 2012 was a use of $681 million compared with a use of $165 million in fiscal 2011. The use of cash in fiscal 2012 was driven by the payment of $502 million of original issue discounts and PIK interest related to the extinguishment of all of the 14.857% Senior Notes and $930 million of the Old Senior Subordinated Notes. Additionally, cash interest paid in fiscal 2012 unrelated to extinguishments was $621 million compared to $356 million in fiscal 2011. Excluding the cash interest payments in both periods, cash flow from operating activities increased $251 million in fiscal 2012 as compared to fiscal 2011. The increase was primarily due to an increase in sales volumes, partially offset by an increase in working capital, excluding the impact of dispositions, to support the increasing sales volumes.
Cash flow from operating activities in fiscal 2011 was a use of $165 million compared with cash flow provided by operating activities of $551 million in fiscal 2010. The decrease was primarily due to the timing of payments for the purchase of inventory and the receipt of an IRS refund in fiscal 2010 of $220 million.
Investing activities
During fiscal 2012, cash used in investing activities was $800 million, primarily driven by the net investment of $936 million of cash proceeds from debt issuances, $248 million payments for business
62
Table of Contents
acquisitions and $115 million in capital expenditures. These payments were partially offset by $481 million of net proceeds from the sale of businesses.
During fiscal 2011, cash used in investing activities was $6 million, primarily driven by $115 million of capital expenditures and the $21 million acquisition of RAMSCO, partially offset by $128 million of proceeds from the sale of businesses. During fiscal 2011, capital expenditures increased $66 million as compared to fiscal 2010, driven by the purchase of open-ended vehicle leases and reflecting our commitment to invest in our business through information technology, greenfield expansion, and other strategic initiatives.
During fiscal 2010, cash used in investing activities was $45 million, primarily driven by $49 million of capital expenditures.
Financing activities
During fiscal 2012, cash provided by financing activities was $1,511 million, due to net debt borrowings of $1,641 million, which includes the financing of $603 million of contractually required premiums paid to extinguish the Old Senior Notes, the Old Senior Subordinated Notes, and the 14.875% Senior Notes prior to maturity, offset by payments of $132 million for debt issuance costs.
During fiscal 2011, cash used in financing activities was $10 million, due entirely to net debt repayments.
During fiscal 2010, cash used in financing activities was $755 million, due to net debt repayments of $722 million, including the prepayment on the Term Loan of $30 million, and $34 million in financing fees related to the amendment of our credit agreements.
External financing
As of February 3, 2013, we had an aggregate principal amount of $7.3 billion of outstanding debt, net of unamortized discounts of $26 million and including unamortized premiums of $21 million, and an additional $910 million of available borrowings under our ABL Facility (after giving effect to the borrowing base limitations and approximately $61 million in letters of credit issued and including $70 million of borrowings available on qualifying cash balances). In addition, as of February 3, 2013, we had $936 million of cash equivalents restricted for the redemption of debt. From time to time, depending on market conditions and other factors, we may seek to repay, redeem, repurchase or otherwise acquire or refinance a portion or all of our indebtedness. We may make such repurchases in privately negotiated transactions or otherwise. In addition, Holding has filed a registration statement with the SEC for a potential initial public offering and indicated that it expects to use the proceeds of such offering to repay, redeem, repurchase or otherwise acquire or retire certain of our outstanding indebtedness.
On February 15, 2013, HD Supply modified its Term Loan Facility (as defined below) to lower the borrowing margin 275 basis points to LIBOR (subject to a floor of 1.25%) plus a borrowing margin of 3.25% or Prime plus a borrowing margin of 2.25% at the Company's election. The amendment also replaced the hard call provision applicable to optional prepayment of term loans thereunder with a soft call option. The soft call option provides for a premium equal to 1.0% of the aggregate principal amount of term loans being prepaid if, on or prior to August 15, 2013, the Company enters into certain repricing transactions. In connection with the modification, the Company incurred approximately $30 million in financing fees, of which approximately $27 million will be amortized into interest expense over the remaining term of the amended facility in accordance with GAAP (ASC 470, Debt). Of the non-deferred financing fees, approximately $2 million will be recorded as a Loss on extinguishment of debt and the remaining $1 million will be recorded as Other non-operating expense in the Consolidated Statement of Operations in the first quarter of fiscal 2013.
63
Table of Contents
On February 1, 2013, HD Supply issued $1,275 million aggregate principal amount of 7.5% Senior Notes due 2020 (the "7.5% Senior Notes") at par. As a result of the issuance, the Company incurred $21 million in debt issuance costs, of which $19 million was paid as of February 3, 2013. The net proceeds from the 7.5% Senior Notes issuance were used to repurchase all of the Company's outstanding 14.875% Senior Notes (issued in April 2012 to the Equity Sponsors), plus a $422 million make-whole premium calculated in accordance with the 14.875% Senior Notes Indenture (as defined below), plus $37 million of un-capitalized PIK interest thereon through February 1, 2013. Also on February 1, 2013, the trustee for the 14.875% Senior Notes cancelled all of the outstanding 14.875% Senior Notes. As a result of these transactions, the Company incurred a $452 million loss on extinguishment, which included the make-whole premium, a $28 million write-off of unamortized original issue discount, and a $2 million write-off of unamortized deferred debt costs.
On January 16, 2013, HD Supply issued $950 million aggregate principal amount of 10.5% Senior Subordinated Notes due 2021 (the "Senior Subordinated Notes") at par. As a result of the issuance, the Company incurred $16 million in debt issuance costs, of which $15 million was paid as of February 3, 2013. On February 8, 2013, the Company used the net proceeds from the Senior Subordinated Notes issuance to redeem all of its remaining $889 million outstanding 13.5% Senior Subordinated Notes, originally issued in August 2007, ("Old Senior Subordinated Notes") at a redemption price equal to 103.375% of the principal amount thereof and paid (together with $36 million of cash on hand) accrued and unpaid interest thereon through the redemption date. As a result, in the first quarter of fiscal 2013, the Company will report a $34 million loss on extinguishment, which includes a $30 million premium payment to redeem the Old Senior Subordinated Notes and $4 million to write-off the unamortized deferred debt cost.
On October 15, 2012, HD Supply issued $1,000 million aggregate principal amount of 11.5% Senior Notes due 2020 (the "11.5% Senior Notes") at par. As a result of the issuance, the Company incurred and paid $17 million in debt issuance costs. On November 8, 2012, the Company used the net proceeds from the 11.5% Senior Notes issuance to redeem $930 million of its outstanding Old Senior Subordinated Notes at a redemption price equal to 103.375% of the principal amount thereof and to pay $23 million of accrued interest. As a result, the Company incurred a $37 million loss on extinguishment, which included a $31 million premium payment to redeem the Old Senior Subordinated Notes prior to maturity and $5 million to write-off the pro-rata portion of unamortized deferred debt costs.
Refinancing Transactions and Additional Notes
On April 12, 2012, HD Supply consummated the following transactions (the "Refinancing Transactions") in connection with the refinancing of the senior portion of its debt structure:
- •
- the issuance of $950 million of its 81/8% Senior Secured First Priority Notes due 2019 (the "April 2012 First Priority Notes");
- •
- the issuance of $675 million of its 11% Senior Secured Second Priority Notes due 2020 (the "Second Priority Notes");
- •
- the issuance of approximately $757 million of 14.875% Senior Notes due 2020 (the "14.875% Senior Notes");
- •
- entry into a new senior term facility (the "Term Loan Facility") maturing in 2017 and providing for term loans in an aggregate principal amount of $1,000 million; and
- •
- entry into a new senior asset based lending facility (the "ABL Facility") maturing in 2017 and providing for senior secured revolving loans and letters of credit of up to a maximum aggregate principal amount of $1,500 million (subject to availability under the borrowing base).
64
Table of Contents
The proceeds of the First Priority Notes, the Second Priority Notes, the 14.875% Senior Notes, the Term Loan Facility and the ABL Facility were used to (i) repay all amounts outstanding under the Old Senior Secured Credit Facility (Senior Secured Credit Facility dated as of August 30, 2007), (ii) repay all amounts outstanding under the Old ABL Credit Facility (ABL Credit Facility dated as of August 30, 2007), (iii) repurchase all remaining outstanding Old Senior Notes (12.0% Senior Notes dated as of August 30, 2007) and (iv) pay related fees and expenses.
Affiliates of certain of the Equity Sponsors owned an aggregate principal amount of approximately $484 million of the Old Senior Notes which they exchanged in a non-cash transaction for their investment in the 14.875% Senior Notes.
On August 2, 2012, the Company issued $300 million additional aggregate principal amount of its 81/8% First Priority Notes due 2019 (the "August 2012 First Priority Notes") at a premium of 107.5%. At closing, the Company received approximately $317 million, net of transaction fees. The August 2012 First Priority Notes were issued under the indenture pursuant to which HD Supply previously issued the April 2012 First Priority Notes, all of which remain outstanding. The net proceeds from the sale of the August 2012 First Priority Notes were applied to reduce outstanding borrowings under the ABL Facility.
As a result of the Refinancing Transactions and the issuance of the August 2012 First Priority Notes, the Company incurred $80 million in debt issuance costs and recorded a $220 million loss on extinguishment, which included a $150 million premium payment to redeem the Old Senior Notes, $46 million to write-off the pro-rata portion of the unamortized deferred debt costs, and $24 million to write-off the remaining unamortized Other asset associated with the THD Guarantee that was terminated in the Refinancing Transactions.
Unamortized deferred debt costs
In accordance with ASC 470, Debt, the Company determined that all of the redemption of Old Senior Notes was an extinguishment as either the original note holders were unknown or the refinancing was considered a "substantial" change. As a result of the extinguishment, the Company wrote-off approximately $24 million in unamortized deferred financing charges associated with the Old Senior Notes. Similarly, under ASC 470, approximately $834 million of the Old ABL Credit Facility and approximately $1,169 million of the Old Senior Secured Credit Facility were deemed extinguishments, with the remaining portions considered modifications. As a result of the extinguishment, the Company wrote-off approximately $22 million of $42 million in unamortized deferred financing charges associated with these credit agreements.
65
Table of Contents
Long-term debt as of February 3, 2013 and January 29, 2012 consisted of the following (dollars in millions):
| | | | | | | | | | | | | |
| | February 3, 2013 | | January 29, 2012 | |
|---|
| | Outstanding
Principal | | Interest
Rate %(1) | | Outstanding
Principal | | Interest
Rate %(1) | |
|---|
ABL Facility due 2017 | | $ | 300 | | | 1.96 | | $ | — | | | — | |
Old Term Loan due August 30, 2012 | | | — | | | — | | | 73 | | | 1.53 | |
Old Term Loan due April 1, 2014 | | | — | | | — | | | 855 | | | 3.03 | |
Old ABL Term Loan due April 1, 2014 | | | — | | | — | | | 214 | | | 3.56 | |
Term Loan due 2017, net of unamortized discount of $26 million as of February 3, 2013 | | | 969 | | | 7.25 | | | — | | | — | |
First Priority Notes due 2019, including unamortized premium of $21 million as of February 3, 2013 | | | 1,271 | | | 8.125 | | | — | | | — | |
Second Priority Notes due 2020 | | | 675 | | | 11.00 | | | — | | | — | |
Old Senior Notes due 2014 | | | — | | | — | | | 2,500 | | | 12.00 | |
11.5% Senior Notes due 2020 | | | 1,000 | | | 11.50 | | | — | | | — | |
7.5% Senior Notes due 2020 | | | 1,275 | | | 7.50 | | | — | | | — | |
Senior Subordinated Notes due 2021 | | | 950 | | | 10.50 | | | — | | | — | |
Old Senior Subordinated Notes due 2015 | | | 889 | | | 13.50 | | | 1,820 | | | 13.50 | |
| | | | | | | | | | | | |
Total long-term debt | | $ | 7,329 | | | | | | 5,462 | | | | |
Less current installments | | | (899 | ) | | | | | (82 | ) | | | |
| | | | | | | | | | | | |
Long-term debt, excluding current installments | | $ | 6,430 | | | | | $ | 5,380 | | | | |
| | | | | | | | | | | | |
- (1)
- Represents the stated rate of interest, without including the effect of discounts or premiums.
Senior Credit Facilities
The Term Loan Facility consists of a senior secured Term Loan Facility (the "Term Loan Facility," the term loans thereunder, the "Term Loans") providing for Term Loans in an aggregate principal amount of $1,000.0 million. On April 12, 2012, proceeds of the Term Loans, together with proceeds from the ABL Facility (the "ABL Facility" and, together with the Term Loan Facility, the "Senior Credit Facilities,") were used to (i) repay all amounts outstanding under the Old Senior Secured Credit Facility, (ii) repay all amounts outstanding under the Old ABL Credit Facility (iii) repurchase all remaining outstanding Old Senior Notes and (iv) pay related fees and expenses. The Term Loan Facility also permits the Company to add one or more incremental term loan facilities to be included in the Term Loan Facility, to increase the existing loans by requesting supplemental term loan commitments, or to add one or more revolving credit facility commitments or letter of credit facility commitments to be included in the Term Loan Facility. As of February 3, 2013, the outstanding principal balance of the Term Loans was $969 million, net of unamortized discount of $26 million. On February 15, 2013, the Company entered into Amendment No. 1 (the "Amendment") to the Term Loan Facility, which reduced the interest rates applicable to loans thereunder and modified the optional prepayment provisions obtained therein.
66
Table of Contents
The ABL Facility provides for senior secured revolving loans and letters of credit of up to a maximum aggregate principal amount of $1,500 million (subject to availability under a borrowing base). Extensions of credit under the ABL Facility are limited by a borrowing base calculated periodically based on specified percentages of the value of eligible inventory and eligible accounts receivables, subject to certain reserves and other adjustments. As of February 3, 2013, the outstanding principal drawn on the ABL Facility was $300 million. A portion of the ABL Facility is available for letters of credit and swingline loans. The ABL Facility also permits the Company to add one or more incremental term loan facilities to be included in the ABL Facility or one or more revolving credit facility commitments to be included in the ABL Facility.
Maturity; Prepayment
The Term Loan Facility will mature on October 12, 2017 (the "Term Loan Maturity Date"). The Term Loans will amortize in equal quarterly installments in aggregate annual amounts equal to 1% of the original principal amount of the Term Loan Facility with the balance payable on the Term Loan Maturity Date. The ABL Facility will mature on April 12, 2017.
On or prior to August 15, 2013, any optional prepayment of Term Loans in connection with certain repricing transactions are subject to a prepayment premium equal to 1% of the aggregate principal amount of Term Loans being prepaid. After August 15, 2013, the Term Loans may be prepaid without premium or penalty. Subject to certain exceptions, the Term Loan Facility will be subject to mandatory prepayment in an amount equal to 100% of the net proceeds of certain asset sales and certain insurance recovery events; and 50% of annual excess cash flow for any fiscal year, such percentage to decrease to 0% depending on the attainment of certain leverage ratio targets.
The ABL Facility may be prepaid at the Company's option at any time without premium or penalty and will be subject to mandatory prepayment if the outstanding ABL Facility exceeds either the aggregate commitments with respect thereto or the current borrowing base, in an amount equal to such excess. Mandatory prepayments do not result in a permanent reduction of the lenders' commitments under the ABL Facility.
Guarantee; Security
The Company is the borrower under the Term Loan Facility. The Company and certain of its subsidiaries, including HD Supply Canada, Inc., a Canadian subsidiary (the "Canadian Borrower"), are the borrowers under the ABL Facility. Each of the Company's existing and subsequently acquired or organized direct or indirect wholly-owned domestic restricted subsidiaries, subject to certain exceptions, in each case to the extent otherwise permitted by applicable law, regulation and contractual provision (the "Subsidiary Guarantors") guarantee the Company's payment obligations under the Senior Credit Facilities (and each direct and indirect wholly-owned Canadian subsidiary, subject to certain exceptions, in each case to the extent otherwise permitted by applicable law, regulation and contractual provision (the "Canadian Guarantors") guarantee the Canadian Borrower's payment obligations under the ABL Facility).
The obligations under the Senior Credit Facilities and the guarantees thereof are secured in favor of the administrative agent and collateral agent or U.S. ABL collateral agent, as applicable, by (i) all of the capital stock of the Company, all capital stock of all domestic subsidiaries owned by the Company and the Subsidiary Guarantors and 65% of the capital stock of any foreign subsidiary owned directly by the Company or any Subsidiary Guarantor (it being understood that a foreign subsidiary holding company will be deemed a foreign subsidiary) and (ii) substantially all other tangible and intangible assets owned by the Company and each Subsidiary Guarantor, in each case to the extent permitted by applicable law and subject to certain exceptions and subject to the priority of liens between the Senior Credit Facilities, the First Priority Notes and the Second Priority Notes. The Canadian obligations
67
Table of Contents
under the ABL Facility are also secured by liens on substantially all assets of the Canadian Borrower and the Canadian Guarantors, subject to certain exceptions.
Interest; Fees
After giving effect to the Amendment, the interest rates applicable to the loans under the Term Loan Facility are based on a fluctuating rate of interest measured by reference to either, at the Company's option, (i) an adjusted London inter-bank offered rate (adjusted for statutory reserve requirements), plus a borrowing margin of 3.25%, or (ii) an alternate base rate, plus a borrowing margin of 2.25%.
The interest rates applicable to the loans under the ABL Facility are subject to a pricing grid based on average daily excess availability for the previous fiscal quarter.
Customary fees were payable in respect of the Senior Credit Facilities.
Covenants
The Term Loan Facility contains a number of negative covenants that, among other things, limit or restrict the ability of the Company and its material restricted subsidiaries to incur other indebtedness (including guarantees of other indebtedness); incur certain liens; pay dividends or make other restricted payments, including investments; prepay or amend the terms of other indebtedness; enter into certain types of transactions with affiliates; sell certain assets; sell or otherwise dispose of all or substantially all of its assets; enter into agreements restricting dividends or other distributions by subsidiaries to the Company or a Subsidiary Guarantor or, in the case of the Company, consolidate or merge.
The ABL Facility contains a number of negative covenants that, among other things, limit or restrict the Company's ability and, in certain cases, the Company's subsidiaries to carry out acquisitions, mergers, consolidations, to pay dividends, and to prepay certain indebtedness (including First Priority Notes, the Second Priority Notes, the Senior Notes and the Subordinated Notes), in each case to the extent any such transaction would reduce availability under the ABL Facility below a specified amount.
The Senior Credit Facilities also contain certain affirmative covenants, including financial and other reporting requirements.
Events of Default
The Senior Credit Facilities provide for customary events of default, including non-payment of principal, interest or fees, violation of covenants, material inaccuracy of representations or warranties, specified cross default and cross acceleration to other material indebtedness, certain bankruptcy events, certain ERISA events, material invalidity of guarantees or security interests and material judgments.
Priority Notes
In connection with the Refinancing Transactions, on April 12, 2012 the Company issued $950 million aggregate principal amount of 81/8% Senior Secured First Priority Notes due April 15, 2019 (the "April 2012 First Priority Notes") at par. On August 2, 2012, the Company issued an additional $300 million aggregate principal amount of 81/8% Senior Secured First Priority Notes due 2019 (together with the April 2012 First Priority Notes, the "First Priority Notes"). As of February 3, 2013, the outstanding principal balance of the First Priority Notes was $1,271 million, including unamortized premium of $21 million.
In connection with the Refinancing Transactions, on April 12, 2012 the Company issued $675 million aggregate principal amount of 11% Senior Secured Second Priority Notes due April 15, 2020 (the "Second Priority Notes" and, together with the First Priority Notes, the "Priority Notes") at
68
Table of Contents
par. As of February 3, 2013, the outstanding principal balance of the Second Priority Notes was $675 million.
Guarantees; Security
The Priority Notes are guaranteed by each of the Company's existing and future wholly owned domestic subsidiaries (subject to certain exceptions) and by each of the Company's other domestic subsidiaries that is a borrower under the ABL Facility or that guarantees payment of indebtedness of the Company under certain credit facilities or capital markets securities (the "Subsidiary Guarantors").
The Priority Notes and the guarantees thereof are secured in favor of the collateral agent, by (i) all capital stock of all domestic subsidiaries owned by the Company and the Subsidiary Guarantors and 65% of the capital stock of any foreign subsidiary owned directly by the Company or any Subsidiary Guarantors (it being understood that a foreign subsidiary holding company will be deemed a foreign subsidiary) and (ii) substantially all other tangible and intangible assets owned by the Company and each Subsidiary Guarantor, in each case to the extent permitted by applicable law and subject to certain exceptions and subject to the priority of liens between the Priority Notes and the Senior Credit Facilities.
Redemption; Offer to Repurchase
Prior to April 15, 2015, the Company may redeem some or all of the First Priority Notes by paying the applicable make-whole premium. At any time on or after April 15, 2015, the Company may redeem some or all of the First Priority Notes at redemption prices specified in the indenture governing the First Priority Notes. Prior to April 15, 2016, the Company may redeem some or all of the Second Priority Notes by paying the applicable make-whole premium. At any time on or after April 15, 2016, the Company may redeem some or all of the Second Priority Notes at redemption prices specified in the indenture governing the Second Priority Notes. In addition, in the event of an equity offering prior to April 15, 2015, the Company may redeem up to 35% of the principal amount of the First Priority Notes and the Second Priority Notes at a redemption price equal to 100% plus the amount of the respective coupon, using the net cash proceeds raised in the equity offering.
In the event of certain events that constitute a Change of Control (as defined in the applicable indenture), the Company must offer to repurchase all of the First Priority Notes and the Second Priority Notes (unless otherwise redeemed) at a price equal to 101% of their principal amount, plus accrued and unpaid interest, if any, to the repurchase date. If the Company or any of its restricted subsidiaries sells assets under certain circumstances, the Company must use the proceeds to make an offer to purchase the First Priority Notes and the Second Priority Notes at a price equal to 100% of their principal amount, plus accrued and unpaid interest, if any, to the date of purchase.
Covenants
The indentures governing the Priority Notes contain restrictive covenants that, among other things, limit the ability of the Company and its restricted subsidiaries to: incur more indebtedness; pay dividends, redeem stock or make other distributions; make investments; create restrictions on the ability of the Company's restricted subsidiaries to pay dividends to the Company or make other intercompany transfers; create liens securing indebtedness; transfer or sell assets; merge or consolidate; and enter into certain transactions with the Company's affiliates. Most of these covenants will cease to apply for so long as the applicable Priority Notes have investment grade ratings from both Moody's Investment Services, Inc. and Standard & Poor's.
69
Table of Contents
Intercreditor Agreements
On April 12, 2012, the ABL Facility collateral agent, the Term Loan Facility collateral agent, the First Priority Notes collateral agent and the Second Priority Notes collateral agent entered into an intercreditor agreement as to the relative priorities of their respective security interests in the collateral securing such indebtedness and certain other matters relating to the administration of security interests. In addition, the Term Loan Facility collateral agent, the First Priority Notes collateral agent and the Second Priority Notes collateral agent entered into a separate intercreditor agreement as to the relative priorities of their respective security interests in the collateral securing such indebtedness and certain other matters relating to the administration of security interests.
Senior Notes
On October 15, 2012, the Company issued $1 billion aggregate principal amount of 11.50% Senior Notes due July 15, 2020 (the "11.5% Senior Notes") at par. As of February 3, 2013, the outstanding principal balance of the 11.5% Senior Notes was $1 billion. On February 1, 2013, the Company issued $1,275 million aggregate principal amount of 7.50% Senior Notes due July 15, 2020 (the "7.5% Senior Notes" and, together with the 11.5% Senior Notes, the "Senior Notes") at par. As of February 3, 2013, the outstanding principal balance of the 7.5% Senior Notes was $1,275 million.
Guarantees
The Senior Notes are guaranteed, on a senior unsecured basis, by each of the Company's wholly owned existing and future domestic subsidiaries (subject to certain exceptions) and by each of the Company's other domestic subsidiaries that is a borrower under the ABL Facility or that guarantees payment of indebtedness of the Company under certain credit facilities or capital markets securities.
Redemption; Offer to Repurchase
Prior to October 15, 2016, the Company may redeem some or all of the Senior Notes by paying the applicable make-whole premium. At any time on or after October 15, 2016, the Company may redeem some or all of the Senior Notes at redemption prices specified in the indenture governing the applicable Senior Notes. In addition, in the event of an equity offering prior to October 15, 2015, the Company may redeem up to 35% of the principal amount of each of the 11.5% Senior Notes and the 7.5% Senior Notes at a redemption price equal to 100% plus the amount of the respective coupon, using the net cash proceeds raised in the equity offering.
In the event of certain events that constitute a Change of Control (as defined in the applicable indenture), the Company must offer to repurchase all of the 11.5% Senior Notes and the 7.5% Senior Notes (unless otherwise redeemed) at a price equal to 101% of their principal amount, plus accrued and unpaid interest, if any, to the repurchase date. If the Company or any of its restricted subsidiaries sells assets under certain circumstances, the Company must use the proceeds to make an offer to purchase the 11.5% Senior Notes and the 7.5% Senior Notes at a price equal to 100% of their principal amount, plus accrued and unpaid interest, if any, to the date of purchase.
Covenants
The indentures governing the Senior Notes contain covenants that, among other things, limit the ability of the Company and its restricted subsidiaries, as described in the applicable indenture, to: incur more indebtedness; pay dividends, redeem stock or make other distributions; make investments; create restrictions on the ability of the Company's restricted subsidiaries to pay dividends to the Company or make other intercompany transfers; create liens securing indebtedness; transfer or sell assets; merge or consolidate; and enter into certain transactions with the Company's affiliates. Most of these covenants
70
Table of Contents
will cease to apply for so long as the 11.5% Senior Notes or the 7.5% Senior Notes, as applicable, have investment grade ratings from both Moody's Investment Services, Inc. and Standard & Poor's.
Senior Subordinated Notes
On January 16, 2013, the Company issued $950 million aggregate principal amount of 10.50% Senior Subordinated Notes due 2021 (the "Senior Subordinated Notes") at par.
Guarantees
The Senior Subordinated Notes are guaranteed, on an unsecured senior subordinated basis, by the same entities described above under "—Senior Notes—Guarantees."
Prior to January 15, 2016, the Company may redeem some or all of the Senior Subordinated Notes by paying the applicable make-whole premium. At any time on or after January 15, 2016, the Company may redeem some or all of the Senior Subordinated Notes at redemption prices specified in the indenture governing the Senior Subordinated Notes.
In addition, at any time after July 31, 2013 and on or before July 31, 2014, the Company may also redeem up to 100% of the aggregate principal amount of the Senior Subordinated Notes with funds in an equal aggregate amount not exceeding the aggregate proceeds of certain qualified public equity offerings at a redemption price (expressed as a percentage of principal amount) of (x) if such redemption occurs on or prior to January 31, 2014, 103% and (y) if such redemption occurs after January 31, 2014 and on or prior to July 31, 2014, 102%, in each case plus accrued and unpaid interest, if any, to the redemption date. In addition, in the event of an equity offering prior to January 15, 2016, the Company may redeem up to 35% of the principal amount of the Senior Subordinated Notes at a redemption price equal to 100% plus the amount of the coupon, using the net cash proceeds raised in the equity offering.
In the event of certain events that constitute a Change of Control (as defined in the indenture), the Company must offer to repurchase all of the Senior Subordinated Notes (unless otherwise redeemed) at a price equal to 101% of their principal amount, plus accrued and unpaid interest, if any, to the repurchase date. If the Company or any of its restricted subsidiaries sells assets under certain circumstances, the Company must use the proceeds to make an offer to purchase the Senior Subordinated Notes at a price equal to 100% of their principal amount, plus accrued and unpaid interest, if any, to the date of purchase.
Covenants
The indenture governing the Senior Subordinated Notes contains covenants that limit the Company and its restricted subsidiaries in the same manner described above under "—Senior Notes—Covenants."
Registration Rights Agreements
On January 31, 2013, the Company filed a registration statement on Form S-4/A with the SEC in accordance with the registration rights agreements relating to the 11.5% Senior Notes and the Priority Notes. On January 31, 2013, the registration statement was declared effective by the SEC. On February 5, 2013, the Company executed the offer to exchange: outstanding First Priority Notes with registered First Priority Notes, outstanding Second Priority Notes with registered Second Priority Notes, and outstanding 11.5% Senior Notes with registered 11.5% Senior Notes. The exchange offers closed in
71
Table of Contents
the first quarter of fiscal 2013 with substantially all of the notes held by eligible participants in the exchange offers tendered.
On January 31, 2013, the Company filed a registration statement on Form S-4/A with the SEC in accordance with the registration rights agreements relating to the Senior Subordinated Notes. On January 31, 2013, the registration statement was declared effective by the SEC. On February 5, 2013, the Company executed the offer to exchange outstanding Senior Subordinated Notes with registered Senior Subordinated Notes. The exchange offer closed in the first quarter of fiscal 2013 with substantially all of the notes held by eligible participants in the exchange offer tendered.
The 7.5% Senior Notes and the guarantees have not been registered under the Securities Act of 1933, as amended. The Company has agreed to make an offer to exchange the 7.5% Senior Notes for registered, publicly tradable notes that have substantially identical terms as the 7.5% Senior Notes within 270 days following the original issue date of the 7.5% Senior Notes. The Company is obligated to pay additional interest, up to a maximum additional interest rate of 0.50% per annum, on the 7.5% Senior Notes if the exchange offer has not been completed within 360 days following the original issue date of the 7.5% Senior Notes.
14.875% Senior Unsecured Notes due 2020
The Company issued approximately $757 million aggregate principal amount (net of $30 million of original issue discount) of 14.875% Senior Notes under an Indenture, dated as of April 12, 2012 (the "14.875% Senior Notes Indenture"), among the Company, the Subsidiary Guarantors and Wilmington Trust, National Association, as Trustee to investment funds associated with Bain Capital Partners, LLC, Carlyle Investment Management, LLC and Clayton, Dubilier & Rice, LLC, the Equity Sponsors. The 14.875% Senior Notes bore interest at a rate of 14.875% per annum and were scheduled to mature on October 12, 2020. Interest was to be paid semi-annually in arrears on each April 12th and October 12th through maturity, commencing on October 12, 2012, except that the first eleven payment periods through October 2017 were to be PIK and therefore increase the balance of the outstanding indebtedness rather than paid in cash. On October 12, 2012, the Company made a PIK payment of $56 million, increasing the outstanding principal balance to approximately $813 million.
The Company was permitted to redeem the 14.875% Senior Notes, in whole or in part, at any time prior to April 12, 2015, at a price equal to 100% of the principal amount thereof, plus accrued and unpaid interest, if any, to the redemption date, plus the applicable make-whole premium set forth in the 14.875% Senior Notes Indenture. On February 1, 2013, the Company repurchased the 14.875% Senior Notes in accordance with the redemption provisions of the 14.875% Senior Notes Indenture.
Old Senior Subordinated Notes
On August 30, 2007, the Company issued $1,300 million aggregate principal amount of Senior Subordinated Notes due 2015 bearing interest at a rate of 13.5% per annum (the "Old Senior Subordinated Notes"). Interest payments were due each March and September 1st through maturity except that the first eight payment periods through September 2011 were PIK and therefore increased the balance of the outstanding indebtedness rather than paid in cash.
On May 15, 2012, the Company repurchased $1 million aggregate principal of its Old Senior Subordinated Notes at a price of 97% plus accrued interest. On November 8, 2012, the Company redeemed $930 million aggregate principal of its outstanding Old Senior Subordinated Notes at a price of 103.375% plus $23 million of accrued interest. As of February 3, 2013, $889 million of the Company's Old Senior Subordinated Notes remained outstanding. On February 8, 2013, the Company redeemed all of its remaining $889 million outstanding Old Senior Subordinated Notes at a redemption price equal to 103.375% plus $52 million of accrued interest.
72
Table of Contents
Rating agency actions
In January 2013, Moody's Investors Service ("Moody's") upgraded HD Supply's rating to B3, with a stable outlook, from Caa1, with a positive outlook. The speculative grade liquidity assessment remains SGL-3. Moody's cited improvements in our maturity profile following the refinancing of our remaining Old Senior Subordinated Notes due 2015 with our Senior Subordinated Notes due 2021. The interest rates and other terms within our current credit agreements are not impacted by rating agency actions.
Interest rate swaps
We maintained interest rate swap agreements to exchange fixed and variable rate interest payment obligations without the exchange of the underlying principal amounts. At execution, our swaps committed us to pay fixed interest and receive variable interest, effectively converting $400 million of floating-rate debt to fixed rate debt. Swaps with a combined $200 million notional value matured on January 31, 2010. The remaining swaps with a combined $200 million notional value matured on January 31, 2011, the first day of fiscal 2011. During fiscal 2010, we paid a weighted-average fixed rate of 3.9% and received a weighted-average floating rate of 0.3%.
Commodity and interest rate risk
Commodity risk
We are aware of the potentially unfavorable effects inflationary pressures may create through higher asset replacement costs and related depreciation, higher interest rates and higher material costs. In addition, our operating performance is affected by price fluctuations in the commodity-based products that we purchase and sell, which contain commodities such as steel, copper, aluminum, PVC, petroleum and other commodities. We are also exposed to fluctuations in petroleum costs as we deliver a substantial portion of the products we sell by truck. We seek to minimize the effects of inflation and changing prices through economies of purchasing and inventory management resulting in cost reductions and productivity improvements as well as price increases to maintain reasonable gross margins.
As discussed above, our results of operations were favorably or negatively impacted by fluctuating commodity prices based on our ability or inability to pass increases in the prices of certain commodity-based products to our customers. Such commodity price fluctuations have from time to time produced volatility in our financial performance and could do so in the future.
Interest rate risk related to debt
We are subject to interest rate risk associated with our debt. While changes in interest rates impact the fair value of the fixed-rate debt, there is no impact to earnings and cash flow. Alternatively, while changes in interest rates do not affect the fair value of our variable-rate debt, they do affect future earnings and cash flows.
Our ABL Facility and our Term Loan Facility bear variable interest rates.
- •
- The ABL Facility bears interest (i) in the case of U.S. dollar denominated loans, either at LIBOR or the Prime Rate, at the option of the Company, plus applicable borrowing margins and (ii) in the case of Canadian dollar denominated loans, either at the BA Rate or the Canadian Prime Rate, at the option of the Company, plus applicable borrowing t margins. The borrowing margins are defined by a pricing grid, as included in the ABL Facility agreement, based on average excess availability for the previous quarter.
73
Table of Contents
- •
- Subsequent to the modification on February 15, 2013, the Term Loan Facility bears interest at LIBOR (subject to a floor of 1.25%) plus a borrowing margin of 3.25% or Prime plus a borrowing margin of 2.25% at the Company's election.
A 1% increase in interest rates on our variable-rate debt would increase our annual forecasted interest expense by approximately $13 million (based on our borrowings as of February 3, 2013 and excluding the effect of the interest rate floor on our Term Loan Facility).
Off-balance sheet arrangements
In accordance with generally accepted accounting principles in the United States of America, operating leases for a portion of our real estate and other assets are not reflected in our Consolidated Balance Sheets.
Contractual obligations
The following table discloses aggregate information about our contractual obligations as of February 3, 2013 and the periods in which payments are due (amounts in millions):
| | | | | | | | | | | | | | | | |
| |
| | Payments due by period | |
|---|
| | Total | | Fiscal
2013 | | Fiscal
2014-2015 | | Fiscal
2016-2017 | | Fiscal years
after 2017 | |
|---|
Long-term debt(1) | | $ | 7,334 | | $ | 899 | | $ | 20 | | $ | 1,265 | | $ | 5,150 | |
Interest on long-term debt(2) | | | 3,940 | | | 546 | | | 1,086 | | | 1,066 | | | 1,242 | |
Operating leases | | | 482 | | | 123 | | | 180 | | | 98 | | | 81 | |
Purchase obligations(3) | | | 684 | | | 684 | | | — | | | — | | | — | |
| | | | | | | | | | | | |
Total contractual cash
obligations(4) | | $ | 12,440 | | $ | 2,252 | | $ | 1,286 | | $ | 2,429 | | $ | 6,473 | |
| | | | | | | | | | | | |
- (1)
- "Fiscal 2013" includes $889 million of Old Senior Subordinated Notes that were redeemed on February 8, 2013.
- (2)
- The interest on long-term debt includes the effect of the amendment to our Term Loan Facility on February 15, 2013 that reduced the applicable borrowing margins on the outstanding Term Loans. The interest rates for the ABL Facility are calculated based on the rates as of February 3, 2013. The interest on long-term debt includes payments for agent administration fees.
- (3)
- Purchase obligations include various commitments with vendors to purchase goods and services, primarily inventory. These purchase obligations are generally cancelable, but the Company has no intent to cancel.
- (4)
- The contractual obligations table excludes $215 million of unrecognized tax benefits due to uncertainty regarding the timing of future cash payments, if any, related to the liabilities recorded in accordance with the GAAP guidance for uncertain tax positions.
Recent accounting pronouncements
Fair value measurement—In May 2011, the Financial Accounting Standards Board ("FASB") issued ASU No. 2011-04, "Amendments to Achieve Common Fair Value Measurement and Disclosure Requirements in U.S. GAAP and IFRSs" ("ASU 2011-04"). The amendments in this ASU are intended to improve the comparability of fair value measurements presented and disclosed in financial statements prepared in accordance with GAAP and International Financial Reporting Standards ("IFRS"s). The amendments in this ASU explain how to measure fair value. They do not require additional fair value measurements and are not intended to establish valuation standards or affect valuation practices outside of financial reporting. The Company adopted the provisions of ASU 2011-04 on January 30, 2012. The adoption did not have an impact on the Company's financial position or results of operations.
74
Table of Contents
Comprehensive income: Presentation—In June 2011, the FASB issued ASU No. 2011-05, "Presentation of Comprehensive Income" ("ASU 2011-05"), to increase the prominence of items reported in other comprehensive income and to facilitate convergence of GAAP and IFRS. ASU 2011-05 eliminates the option to present components of other comprehensive income as part of the statement of changes in stockholders' equity and requires that all non-owner changes in stockholders' equity be presented either in a single continuous statement of comprehensive income or in two separate but consecutive statements. In the two-statement approach, the first statement should present total net income and its components followed consecutively by a second statement that should present total other comprehensive income, the components of other comprehensive income, and the total of comprehensive income. The Company adopted the provisions of ASU 2011-05 on January 30, 2012. The adoption of ASU 2011-05 did not have an impact on the Company's financial position or results of operations.
Comprehensive income: Reclassifications—In February 2013, the FASB issued ASU No. 2013-02, "Reporting of Amounts Reclassified Out of Accumulated Other Comprehensive Income" ("ASU 2013-02"), to supersede and replace the presentation requirements for reclassifications out of accumulated other comprehensive income in ASU 2011-05, which were deferred indefinitely under ASU No. 2011-12, ""Deferral of the Effective Date for Amendments to the Presentation of Reclassifications of Items Out of Accumulated Other Comprehensive Income in Accounting Standards Update No. 2011-05" ("ASU 2011-12"), issued in December 2011. The amendments in ASU 2013-02 would require an entity to provide additional information about reclassifications out of accumulated other comprehensive income by the respective line items of net income. For public entities, the amendments are effective for fiscal years, and interim periods within those years, beginning after December 15, 2012. The adoption of ASU 2013-02 will not have an impact on the Company's financial position or results of operations.
Goodwill impairment testing—In September 2011, the FASB issued ASU No. 2011-08, "Testing Goodwill for Impairment" ("ASU 2011-08"), which simplifies how entities test goodwill for impairment and permits an entity to first assess qualitative factors to determine whether it is more likely than not that the fair value of a reporting unit is less than its carrying amount as a basis for determining whether it is necessary to perform the two-step goodwill impairment test. The Company adopted the provisions of ASU 2011-08 on January 30, 2012. The adoption of ASU 2011-08 did not have an impact on the Company's financial position or results of operations.
Release of Cumulative Translation Adjustment—In March 2013, the FASB issued ASU No. 2013-05, "Parent's Accounting for the Cumulative Translation Adjustment upon Derecognition of Certain Subsidiaries or Groups of Assets within a Foreign Entity or of an Investment in a Foreign Entity" ("ASU 2013-05"), which resolves diversity in practice regarding the release of the cumulative translation adjustment into net income when a parent either sells a part of all of its investment in a foreign entity or no longer holds a controlling financial interest in a subsidiary or group of assets within a foreign entity. The amendments in ASU 2013-05 are effective prospectively for fiscal years, and interim periods within those years, beginning after December 15, 2013. Early adoption is permitted. The adoption of ASU 2013-05 will not have a material impact on the Company's financial position or results of operations.
Critical accounting policies
Our critical accounting policies include:
Revenue recognition
We recognize revenue when persuasive evidence of an agreement exists, delivery has occurred or services have been rendered, the price to the buyer is fixed and determinable and collectability is
75
Table of Contents
reasonably assured. We ship products to customers predominantly by internal fleet and to a lesser extent by third-party carriers. Revenues, net of sales tax and allowances for returns and discounts, are recognized from product sales when title to the products is passed to the customer, which generally occurs at the point of destination for products shipped by internal fleet and at the point of shipping for products shipped by third-party carriers.
Allowance for doubtful accounts
We evaluate the collectability of accounts receivable based on numerous factors, including past transaction history with customers, their credit worthiness and an assessment of our lien and bond rights. Initially, we estimate an allowance for doubtful accounts as a percentage of aged receivables. This estimate is periodically adjusted when we become aware of a specific customer's inability to meet its financial obligations (e.g., bankruptcy filing) or as a result of changes in our historical collection patterns. While we have a large customer base that is geographically dispersed, a slowdown in the markets in which we operate may result in higher than expected uncollectible accounts, and therefore, the need to revise estimates for bad debts. To the extent historical credit experience is not indicative of future performance or other assumptions used by management do not prevail, the allowance for doubtful accounts could differ significantly, resulting in either higher or lower future provisions for doubtful accounts.
Inventories
Inventories consist primarily of finished goods and are carried at the lower of cost or market. The cost of substantially all of our inventories is determined by the moving or weighted average cost method. We evaluate our inventory value at the end of each quarter to ensure that it is carried at the lower of cost or market. This evaluation includes an analysis of historical physical inventory results, a review of potential excess and obsolete inventories based on inventory aging and anticipated future demand. Periodically, each branch's perpetual inventory records are adjusted to reflect any declines in net realizable value below inventory carrying cost. To the extent historical physical inventory results are not indicative of future results and if future events impact, either favorably or unfavorably, the saleability of our products or our relationship with certain key vendors, our inventory reserves could differ significantly, resulting in either higher or lower future inventory provisions.
Consideration received from vendors
We enter into agreements with many of our vendors providing for inventory purchase rebates ("vendor rebates") upon achievement of specified volume purchasing levels. We accrue the receipt of vendor rebates as part of our cost of sales for products sold based on progress towards earning the vendor rebates, taking into consideration cumulative purchases of inventory to date and projected purchases through the end of the year. An estimate of unearned vendor rebates is included in the carrying value of inventory at each period end for vendor rebates to be received on products not yet sold. While we believe we will continue to receive consideration from vendors in fiscal 2013 and thereafter, there can be no assurance that vendors will continue to provide comparable amounts of vendor rebates in the future.
Impairment of long-lived assets
Long-lived assets, including property and equipment, are reviewed for possible impairment whenever events or circumstances indicate that the carrying amount of an asset may not be recoverable. To analyze recoverability, we project undiscounted future cash flows over the remaining life of the asset. If these projected cash flows are less than the carrying amount, an impairment loss is recognized based on the fair value of the asset less any costs of disposition. Our judgment regarding the existence of impairment indicators are based on market and operational performance. Future events could cause
76
Table of Contents
us to conclude that impairment indicators exist and that assets are impaired. Evaluating the impairment also requires us to estimate future operating results and cash flows that require judgment by management. If different estimates were used, the amount and timing of asset impairments could be affected.
Goodwill
Goodwill represents the excess of the purchase price paid over the fair value of the net assets acquired in connection with business acquisitions. Accounting Standards Codification 350, Intangibles—Goodwill and Other, requires entities to periodically assess the carrying value of goodwill by reviewing the fair value of the net assets underlying all acquisition-related goodwill on a reporting unit basis, as defined by ASC 350. We assess the recoverability of goodwill in the third quarter of each fiscal year. We also use judgment in assessing whether we need to test goodwill more frequently for impairment than annually given factors such as unexpected adverse economic conditions, competition, product changes and other events. If the carrying amount of a reporting unit that contains goodwill exceeds fair value, a possible impairment would be indicated.
In accordance with ASU 2011-08, during fiscal 2012, we determined that it was not more likely than not that the fair value of Facilities Maintenance and White Cap was less than the carrying value for each business unit. Based on this assessment, we determined that it was not necessary to perform the two-step goodwill impairment test for these two reporting units. We bypassed this qualitative analysis for the remaining five reporting units and proceeded with the first step of the two-step goodwill impairment test.
We determine the fair value of a reporting unit using a DCF analysis and a market comparable method, with each method being equally weighted in the calculation.
Determining fair value requires the exercise of significant judgment, including judgment about appropriate discount rates, the amount and timing of expected future cash flows, as well as relevant comparable company earnings multiples for the market comparable approach. The cash flows employed in the DCF analyses are based on the Company's most recent long-range forecast and, for years beyond the forecast, the Company's estimates, which are based on estimated exit multiples ranging from six to seven times the final forecasted year earnings before interest, taxes, depreciation and amortization. The discount rates used in the DCF analyses are intended to reflect the risks inherent in the future cash flows of the respective reporting units and range from 11.5% to 14.0%. For the market comparable approach, the Company evaluated comparable company public trading values, using earnings multiples and sales multiples that are used to value the reporting units.
There was no indication of impairment in any of the Company's reporting units during the fiscal 2012, the fiscal 2011 or the fiscal 2010 annual testing and accordingly, the second step of the goodwill impairment analysis was not performed. At the time of our fiscal 2012 annual testing, the fair value of the reporting units exceeded their carrying value by the following percentages: 47% for Waterworks, 31% for Utilities, 6% for Crown Bolt, 40% for Repair & Remodel, and 116% for Electrical.
During the fourth quarter of fiscal 2012, Crown Bolt reached an agreement to amend and extend its strategic purchase agreement with Home Depot. While the amendment extends the agreement five years through fiscal 2019, it eliminates the minimum purchase requirement and adjusts future pricing. These changes resulted in a reduction of expected future cash proceeds from Home Depot. We, therefore, considered this amendment a triggering event and, as such, the Company performed an additional goodwill impairment analysis for Crown Bolt. As a result of step one of the analysis, there was an indication of impairment in the Crown Bolt reporting unit. Based on the results of step two, we recorded a non-cash, pre-tax goodwill impairment charge of $150 million during the fourth quarter of fiscal 2012. Additionally, we recorded a $2 million charge to write-off an unamortized tradename as a result of the discontinued use of the tradename.
77
Table of Contents
The Company's DCF model is based on HD Supply's expectation of future market conditions for each of the reporting units, as well as discount rates that would be used by market participants in an arms-length transaction. Future events could cause the Company to conclude that market conditions have declined or discount rates have increased to the extent that the Company's goodwill could be further impaired. It is not possible at this time to determine if any such future impairment charge would result.
Income Taxes
Income taxes are determined under the liability method as required by ASC 740, Income Taxes. Income tax expense or benefit is based on pre-tax financial accounting income. Deferred tax assets and liabilities are recognized for the expected tax consequences of temporary differences between the tax bases of assets and liabilities and their reported amounts. Deferred tax assets and liabilities are measured using enacted tax rates expected to apply to taxable income in the years in which those temporary differences are expected to be recovered or settled. This measurement is reduced, if necessary, by a valuation allowance based on the amount of tax benefits that, based on available evidence, are not "more likely than not" to be realized. The Company recorded a valuation allowance related to its U.S. continuing operations of $442 million, $259 million, and $228 million in fiscal 2012, fiscal 2011, and fiscal 2010, as it believes it is "more likely than not" all of the U.S. deferred income tax assets will not be realized. In addition, the Company recorded an $8 million valuation allowance reduction, a $7 million valuation allowance reduction, and a $2 million valuation allowance increase related to its U.S. discontinued operations for fiscal 2012, fiscal 2011, and fiscal 2010, respectively.
The Company follows the GAAP guidance for uncertain tax positions within ASC 740, Income Taxes. ASC 740 provides guidance related to the financial statement recognition and measurement of tax positions taken or expected to be taken in a tax return. The standard prescribes the minimum recognition threshold that a tax position is required to meet before being recognized in the financial statements. ASC 740 also provides guidance on derecognition, classification, interest and penalties, accounting in interim periods and disclosure. Initial recognition, derecognition and measurement is based on management's judgment given the facts, circumstances and information available at the reporting date. If these judgments are not accurate then future income tax expense or benefit could be different.
Self-insurance
We have a high deductible insurance program for most losses related to general liability, product liability, environmental liability, automobile liability, workers' compensation, and we are self-insured for medical claims and certain legal claims. The expected ultimate cost for claims incurred as of the balance sheet date is not discounted and is recognized as a liability. Self-insurance losses for claims filed and claims incurred but not reported are accrued based upon estimates of the aggregate liability for uninsured claims using loss development factors and actuarial assumptions followed in the insurance industry and historical loss development experience.
To the extent the projected future development of the losses resulting from environmental, workers' compensation, automobile, general and product liability claims incurred as of February 3, 2013 differs from the actual development of such losses in future periods, our insurance reserves could differ significantly, resulting in either higher or lower future insurance expense.
Management estimates
Management believes the assumptions and other considerations used to estimate amounts reflected in our consolidated financial statements are appropriate. However, if actual experience differs from the assumptions and other considerations used in estimating amounts reflected in our consolidated financial
78
Table of Contents
statements, the resulting changes could have a material adverse effect on our consolidated results of operations, and in certain situations, could have a material adverse effect on our financial condition.
Stock-Based Compensation
Our stock-based compensation expense is estimated at the grant date based on an award's fair value as calculated by the Black-Scholes option-pricing model and is recognized as expense over the requisite service period. The Black-Scholes model requires various highly judgmental assumptions including expected volatility and option life. If any of the assumptions used in the Black-Scholes model changes significantly, stock-based compensation expense may differ materially in the future from that recorded in the current period. In addition, we estimate the expected forfeiture rate and only recognize expense for those shares expected to vest. We estimate the forfeiture rate based on historical experience. To the extent our actual forfeiture rate is different from our estimate, stock-based compensation expense is adjusted accordingly. See "Note 9—Stock Based Compensation and Employee Benefit Plans" in the Notes to the Consolidated Financial Statements within Item 8 of this annual report on Form 10-K.
ITEM 7A. QUANTITATIVE AND QUALITATIVE DISCLOSURES ABOUT MARKET RISK
The information required by this Item is included under "Item 7. Management's Discussion and Analysis of Financial Condition and Results of Operations" under the caption "Commodity and interest rate risk."
79
Table of Contents
HD SUPPLY, INC.
ITEM 8. FINANCIAL STATEMENTS AND SUPPLEMENTARY DATA
Index to financial statements
| | |
| | Page |
|---|
Report of Independent Registered Public Accounting Firm | | 81 |
Consolidated statements of operations and comprehensive income (loss) for (i) the fiscal year ended February 3, 2013, (ii) the fiscal year ended January 29, 2012, and (iii) the fiscal year ended January 30, 2011 | |
82 |
Consolidated balance sheets as of February 3, 2013 and January 29, 2012 | |
83 |
Consolidated statements of stockholder's equity (deficit) for (i) the fiscal year ended February 3, 2013, (ii) the fiscal year ended January 29, 2012, and (iii) the fiscal year ended January 30, 2011 | |
84 |
Consolidated statements of cash flows for (i) the fiscal year ended February 3, 2013, (ii) the fiscal year ended January 29, 2012, and (iii) the fiscal year ended January 30, 2011 | |
85 |
Notes to consolidated financial statements | |
86 |
80
Table of Contents
REPORT OF INDEPENDENT REGISTERED PUBLIC ACCOUNTING FIRM
To the Board of Directors and Stockholder of HD Supply, Inc.:
In our opinion, the accompanying consolidated balance sheets and the related consolidated statements of operations and comprehensive income (loss), stockholder's equity (deficit) and cash flows present fairly, in all material respects, the financial position of HD Supply, Inc. and its subsidiaries at February 3, 2013 and January 29, 2012, and the results of their operations and their cash flows for each of the three years in the period ended February 3, 2013 in conformity with accounting principles generally accepted in the United States of America. In addition, in our opinion, the financial statement schedule appearing under Item 15(c) presents fairly, in all material respects, the information set forth therein when read in conjunction with the related consolidated financial statements. These financial statements and financial statement schedule are the responsibility of the Company's management. Our responsibility is to express an opinion on these financial statements and financial statement schedule based on our audits. We conducted our audits of these statements in accordance with the standards of the Public Company Accounting Oversight Board (United States). Those standards require that we plan and perform the audit to obtain reasonable assurance about whether the financial statements are free of material misstatement. An audit includes examining, on a test basis, evidence supporting the amounts and disclosures in the financial statements, assessing the accounting principles used and significant estimates made by management, and evaluating the overall financial statement presentation. We believe that our audits provide a reasonable basis for our opinion.
/s/ PricewaterhouseCoopers LLP
PricewaterhouseCoopers LLP (signed)
Atlanta, Georgia
April 16, 2013
81
Table of Contents
HD SUPPLY, INC.
CONSOLIDATED STATEMENTS OF OPERATIONS AND
COMPREHENSIVE INCOME (LOSS)
Amounts in millions
| | | | | | | | | | |
| | Fiscal Year Ended | |
|---|
| | February 3,
2013 | | January 29,
2012 | | January 30,
2011 | |
|---|
Net Sales | | $ | 8,035 | | $ | 7,028 | | $ | 6,449 | |
Cost of sales | | | 5,715 | | | 5,014 | | | 4,608 | |
| | | | | | | | |
Gross Profit | | | 2,320 | | | 2,014 | | | 1,841 | |
Operating expenses: | | | | | | | | | | |
Selling, general and administrative | | | 1,661 | | | 1,532 | | | 1,455 | |
Depreciation and amortization | | | 336 | | | 327 | | | 341 | |
Restructuring | | | — | | | — | | | 8 | |
Goodwill and other intangible asset impairment | | | 152 | | | — | | | — | |
| | | | | | | | |
Total operating expenses | | | 2,149 | | | 1,859 | | | 1,804 | |
| | | | | | | | |
Operating Income (Loss) | | | 171 | | | 155 | | | 37 | |
Interest expense | | | 658 | | | 639 | | | 623 | |
Loss on extinguishment of debt | | | 709 | | | — | | | 2 | |
Other (income) expense, net | | | — | | | — | | | (3 | ) |
| | | | | | | | |
Income (Loss) from Continuing Operations Before Provision (Benefit) for Income Taxes | | | (1,196 | ) | | (484 | ) | | (585 | ) |
Provision (benefit) for income taxes | | | 3 | | | 79 | | | 28 | |
| | | | | | | | |
Income (Loss) from Continuing Operations | | | (1,199 | ) | | (563 | ) | | (613 | ) |
Income (loss) from discontinued operations, net of tax | | | 20 | | | 20 | | | (6 | ) |
| | | | | | | | |
Net Income (Loss) | | $ | (1,179 | ) | $ | (543 | ) | $ | (619 | ) |
| | | | | | | | |
Other comprehensive income (loss): | | | | | | | | | | |
Foreign currency translation adjustment | | | — | | | (1 | ) | | 9 | |
Unrealized gains on derivatives | | | — | | | — | | | 1 | |
| | | | | | | | |
Total Comprehensive Income (Loss) | | $ | (1,179 | ) | $ | (544 | ) | $ | (609 | ) |
| | | | | | | | |
The accompanying notes are an integral part of these consolidated financial statements.
82
Table of Contents
HD SUPPLY, INC.
CONSOLIDATED BALANCE SHEETS
Amounts in millions, except share data
| | | | | | | |
| | February 3,
2013 | | January 29,
2012 | |
|---|
ASSETS | | | | | | | |
Current assets: | | | | | | | |
Cash and cash equivalents | | $ | 141 | | $ | 111 | |
Cash equivalents restricted for debt redemption | | | 936 | | | — | |
Receivables, less allowance for doubtful accounts of $23 and $32 | | | 1,008 | | | 1,002 | |
Inventories | | | 987 | | | 1,108 | |
Deferred tax asset | | | 42 | | | 58 | |
Other current assets | | | 49 | | | 47 | |
| | | | | | |
Total current assets | | | 3,163 | | | 2,326 | |
| | | | | | |
Property and equipment, net | | | 395 | | | 398 | |
Goodwill | | | 3,138 | | | 3,151 | |
Intangible assets, net | | | 473 | | | 735 | |
Other assets | | | 165 | | | 128 | |
| | | | | | |
Total assets | | $ | 7,334 | | $ | 6,738 | |
| | | | | | |
LIABILITIES AND STOCKHOLDER'S EQUITY (DEFICIT) | | | | | | | |
Current liabilities: | | | | | | | |
Accounts payable | | $ | 693 | | $ | 714 | |
Accrued compensation and benefits | | | 160 | | | 140 | |
Current installments of long-term debt | | | 899 | | | 82 | |
Other current liabilities | | | 291 | | | 378 | |
| | | | | | |
Total current liabilities | | | 2,043 | | | 1,314 | |
| | | | | | |
Long-term debt, excluding current installments | | | 6,430 | | | 5,380 | |
Deferred tax liabilities | | | 104 | | | 111 | |
Other liabilities | | | 348 | | | 361 | |
| | | | | | |
Total liabilities | | | 8,925 | | | 7,166 | |
| | | | | | |
Stockholder's equity (deficit): | | | | | | | |
Common stock, par value $0.01; authorized 1,000 shares; issued and outstanding 1,000 shares at February 3, 2013 and January 29, 2012 | | | — | | | — | |
Paid-in capital | | | 2,696 | | | 2,680 | |
Accumulated deficit | | | (4,285 | ) | | (3,106 | ) |
Accumulated other comprehensive loss | | | (2 | ) | | (2 | ) |
| | | | | | |
Total stockholder's equity (deficit) | | | (1,591 | ) | | (428 | ) |
| | | | | | |
Total liabilities and stockholder's equity (deficit) | | $ | 7,334 | | $ | 6,738 | |
| | | | | | |
The accompanying notes are an integral part of these consolidated financial statements.
83
Table of Contents
HD SUPPLY, INC.
CONSOLIDATED STATEMENTS OF STOCKHOLDER'S EQUITY (DEFICIT)
Amounts in millions
| | | | | | | | | | | | | | | | |
| | Common
Stock | | Paid-in
Capital | | Accumulated
Deficit | | Accumulated
Other
Comprehensive
Income
(Loss) | | Total
Equity | |
|---|
Balance at January 31, 2010 | | $ | — | | $ | 2,643 | | $ | (1,944 | ) | $ | (11 | ) | $ | 688 | |
| | | | | | | | | | | | |
Equity contribution | | | | | | 1 | | | | | | | | | 1 | |
Net loss | | | | | | | | | (619 | ) | | | | | (619 | ) |
Other comprehensive income (loss): | | | | | | | | | | | | | | | | |
Foreign currency translation adjustment | | | | | | | | | | | | 9 | | | 9 | |
Unrealized gains on derivatives, net of tax of $(1) | | | | | | | | | | | | 1 | | | 1 | |
Stock-based compensation | | | | | | 17 | | | | | | | | | 17 | |
Other | | | | | | (1 | ) | | | | | | | | (1 | ) |
| | | | | | | | | | | | |
Balance at January 30, 2011 | | $ | — | | $ | 2,660 | | $ | (2,563 | ) | $ | (1 | ) | $ | 96 | |
| | | | | | | | | | | | |
Net loss | | | | | | | | | (543 | ) | | | | | (543 | ) |
Other comprehensive income (loss): | | | | | | | | | | | | | | | | |
Foreign currency translation adjustment | | | | | | | | | | | | (1 | ) | | (1 | ) |
Stock-based compensation | | | | | | 20 | | | | | | | | | 20 | |
| | | | | | | | | | | | |
Balance at January 29, 2012 | | $ | — | | $ | 2,680 | | $ | (3,106 | ) | $ | (2 | ) | $ | (428 | ) |
| | | | | | | | | | | | |
Net loss | | | | | | | | | (1,179 | ) | | | | | (1,179 | ) |
Other comprehensive income (loss): | | | | | | | | | | | | | | | | |
Foreign currency translation adjustment | | | | | | | | | | | | — | | | — | |
Stock-based compensation | | | | | | 16 | | | | | | | | | 16 | |
| | | | | | | | | | | | |
Balance at February 3, 2013 | | $ | — | | $ | 2,696 | | $ | (4,285 | ) | $ | (2 | ) | $ | (1,591 | ) |
| | | | | | | | | | | | |
The accompanying notes are an integral part of these consolidated financial statements.
84
Table of Contents
HD SUPPLY, INC.
CONSOLIDATED STATEMENTS OF CASH FLOWS
Amounts in millions
| | | | | | | | | | |
| | Fiscal Year Ended | |
|---|
| | February 3,
2013 | | January 29,
2012 | | January 30,
2011 | |
|---|
CASH FLOWS FROM OPERATING ACTIVITIES: | | | | | | | | | | |
Net income (loss) | | $ | (1,179 | ) | $ | (543 | ) | $ | (619 | ) |
Reconciliation of net income (loss) to net cash provided by (used in) operating activities: | | | | | | | | | | |
Depreciation and amortization | | | 342 | | | 350 | | | 369 | |
Provision for uncollectibles | | | 4 | | | 13 | | | 12 | |
Non-cash interest expense | | | 123 | | | 183 | | | 259 | |
Payment of interest and discounts upon extinguishment of PIK notes | | | (502 | ) | | — | | | — | |
Loss on extinguishment of debt | | | 709 | | | — | | | 2 | |
Stock-based compensation expense | | | 16 | | | 20 | | | 17 | |
Deferred income taxes | | | (2 | ) | | 76 | | | 20 | |
Goodwill & other intangible asset impairment | | | 152 | | | — | | | — | |
Gain on sale of businesses | | | (12 | ) | | (9 | ) | | — | |
Other | | | (1 | ) | | 6 | | | (3 | ) |
Changes in assets and liabilities, net of the effects of acquisitions & dispositions: | | | | | | | | | | |
(Increase) decrease in receivables | | | (102 | ) | | (170 | ) | | (61 | ) |
(Increase) decrease in inventories | | | (177 | ) | | (149 | ) | | 2 | |
(Increase) decrease in other current assets | | | (11 | ) | | (3 | ) | | 231 | |
(Increase) decrease in other assets | | | 1 | | | — | | | 1 | |
Increase (decrease) in accounts payable and accrued
liabilities | | | (46 | ) | | 58 | | | 312 | |
Increase (decrease) in other long-term liabilities | | | 4 | | | 3 | | | 9 | |
| | | | | | | | |
Net cash provided by (used in) operating activities | | | (681 | ) | | (165 | ) | | 551 | |
| | | | | | | | |
CASH FLOWS FROM INVESTING ACTIVITIES: | | | | | | | | | | |
Capital expenditures | | | (115 | ) | | (115 | ) | | (49 | ) |
Proceeds from sales of property and equipment | | | 17 | | | 4 | | | 4 | |
Payments for businesses acquired, net of cash acquired | | | (248 | ) | | (21 | ) | | — | |
Proceeds from sales of businesses | | | 481 | | | 128 | | | — | |
Purchase of investments | | | (1,921 | ) | | (23 | ) | | — | |
Proceeds from sale of investments | | | 985 | | | 21 | | | — | |
Other investing activities | | | 1 | | | — | | | — | |
| | | | | | | | |
Net cash provided by (used in) investing activities | | | (800 | ) | | (6 | ) | | (45 | ) |
| | | | | | | | |
CASH FLOWS FROM FINANCING ACTIVITIES: | | | | | | | | | | |
Equity contribution | | | — | | | — | | | 1 | |
Borrowings of long-term debt | | | 6,365 | | | — | | | — | |
Repayments of long-term debt | | | (5,024 | ) | | (10 | ) | | (40 | ) |
Borrowings on long-term revolver debt | | | 1,301 | | | 1,053 | | | 178 | |
Repayments on long-term revolver debt | | | (1,001 | ) | | (1,053 | ) | | (860 | ) |
Debt issuance and modification fees | | | (132 | ) | | — | | | (34 | ) |
Other financing activities | | | 2 | | | — | | | — | |
| | | | | | | | |
Net cash provided by (used in) financing activities | | | 1,511 | | | (10 | ) | | (755 | ) |
| | | | | | | | |
Effect of exchange rates on cash and cash equivalents | | | — | | | — | | | 2 | |
| | | | | | | | |
Increase (decrease) in cash and cash equivalents | | | 30 | | | (181 | ) | | (247 | ) |
Cash and cash equivalents at beginning of period | | | 111 | | | 292 | | | 539 | |
| | | | | | | | |
Cash and cash equivalents at end of period | | $ | 141 | | $ | 111 | | $ | 292 | |
| | | | | | | | |
The accompanying notes are an integral part of these consolidated financial statements.
85
Table of Contents
HD SUPPLY, INC.
NOTES TO CONSOLIDATED FINANCIAL STATEMENTS
NOTE 1—NATURE OF BUSINESS AND SUMMARY OF SIGNIFICANT ACCOUNTING POLICIES
Nature of Business
HD Supply, Inc. (the "Company" or "HD Supply"), a wholly-owned subsidiary of HD Supply Holdings, Inc., is one of the largest industrial distribution companies in North America. With a diverse portfolio of industry-leading businesses, the Company provides a broad range of products and services to more than 500,000 professional customers in the infrastructure and energy, maintenance, repair and improvement, and specialty construction markets.
The Company provides an expansive offering of approximately one million stock-keeping units ("SKUs") of quality, name-brand and propriety-brand products at competitive prices. Through approximately 635 locations across 46 states and 9 Canadian provinces, HD Supply provides localized, customer-driven services including jobsite delivery, will call or direct-ship options, diversified logistics and innovative solutions that contribute to its customers' success.
HD Supply is managed primarily on a product line basis and reports results of operations in four reportable segments. The reportable segments are Facilities Maintenance, Waterworks, Power Solutions, and White Cap. Other operating segments include Crown Bolt, Repair & Remodel, Creative Touch Interiors ("CTI"), and HD Supply Canada. In addition, the consolidated financial statements include Corporate, which includes enterprise-wide functional departments.
Principles of Consolidation
The consolidated financial statements present the results of operations, financial position and cash flows of HD Supply, Inc. and its wholly-owned subsidiaries. All material intercompany balances and transactions are eliminated. Results of operations of businesses acquired are included from their respective dates of acquisition. The assets, liabilities, and results of operations of all discontinued operations have been separately reported as discontinued operations for all periods presented. Certain amounts in prior-period financial statements have been reclassified to conform to the current period's presentation.
Fiscal Year
HD Supply's fiscal year is a 52- or 53-week period ending on the Sunday nearest to January 31. Fiscal year ended February 3, 2013 ("fiscal 2012") includes 53 weeks. Fiscal years ended January 29, 2012 ("fiscal 2011") and January 30, 2011 ("fiscal 2010") both include 52 weeks.
Estimates
Management has made a number of estimates and assumptions relating to the reporting of assets and liabilities, the disclosure of contingent assets and liabilities, and reported amounts of revenues and expenses in preparing these consolidated financial statements in conformity with accounting principles generally accepted in the United States of America ("U.S. GAAP"). Actual results could differ from these estimates.
Cash and Cash Equivalents
HD Supply considers all highly liquid investments with maturities of three months or less when purchased to be cash equivalents.
86
Table of Contents
HD SUPPLY, INC.
NOTES TO CONSOLIDATED FINANCIAL STATEMENTS (Continued)
NOTE 1—NATURE OF BUSINESS AND SUMMARY OF SIGNIFICANT ACCOUNTING POLICIES (Continued)
Allowance for Doubtful Accounts
Accounts receivable are evaluated for collectability based on numerous factors, including past transaction history with customers, their credit worthiness, and an assessment of lien and bond rights. An allowance for doubtful accounts is estimated as a percentage of aged receivables. This estimate is periodically adjusted when management becomes aware of a specific customer's inability to meet its financial obligations (e.g., bankruptcy filing) or as a result of changes in historical collection patterns.
Inventories
Inventories consist primarily of finished goods and are carried at the lower of cost or market. The cost of substantially all inventories is determined by the moving or weighted average cost method. Inventory value is evaluated at each balance sheet date to ensure that it is carried at the lower of cost or market. This evaluation includes an analysis of historical physical inventory results, a review of excess and obsolete inventories based on inventory aging, and anticipated future demand. Periodically, perpetual inventory records are adjusted to reflect declines in net realizable value below inventory carrying cost.
Consideration Received From Vendors
HD Supply enters into agreements with many of its vendors providing for inventory purchase rebates ("vendor rebates") upon achievement of specified volume purchasing levels. Vendor rebates are accrued as part of cost of sales for products sold based on progress towards earning the vendor rebates, taking into consideration cumulative purchases of inventory to date and projected purchases through the end of the year. An estimate of unearned vendor rebates is included in the carrying value of inventory at each period end for vendor rebates recognized on products not yet sold. At February 3, 2013 and January 29, 2012, vendor rebates due to HD Supply were $66 million and $71 million, respectively. These receivables are included in Receivables in the accompanying Consolidated Balance Sheets.
Property and Equipment
Property and equipment are recorded at cost and depreciated using the straight-line method based on the following estimated useful lives of the assets:
| | |
Buildings and improvements | | 5 - 45 years |
Transportation equipment | | 5 - 7 years |
Furniture, fixtures and equipment | | 2 - 10 years |
Capitalized Software Costs
HD Supply capitalizes certain software costs, which are being amortized on a straight-line basis over the estimated useful lives of the software, ranging from three to six years. At February 3, 2013 and January 29, 2012, capitalized software costs totaled $82 million and $71 million, respectively, net of accumulated amortization of $126 million and $114 million, respectively. Amortization of capitalized software costs totaled $30 million, $28 million, and $31 million, in fiscal 2012, fiscal 2011, and fiscal 2010, respectively.
87
Table of Contents
HD SUPPLY, INC.
NOTES TO CONSOLIDATED FINANCIAL STATEMENTS (Continued)
NOTE 1—NATURE OF BUSINESS AND SUMMARY OF SIGNIFICANT ACCOUNTING POLICIES (Continued)
Goodwill
Goodwill represents the excess of purchase price over fair value of net assets acquired. HD Supply does not amortize goodwill, but does assess the recoverability of goodwill in the third quarter of each fiscal year or whenever events or circumstances indicate that it is "more likely than not" that the fair value of a reporting unit has dropped below its carrying value. For the fiscal 2012, fiscal 2011 and fiscal 2010 annual impairment tests, the fair values of HD Supply's identified reporting units were estimated using a discounted cash flow ("DCF") analysis and a market comparable method, with each method being equally weighted in the calculation. During fiscal 2012, the Company recorded a $150 million goodwill impairment charge. There were no goodwill impairment charges recorded in fiscal 2011 and fiscal 2010. See Note 5, Goodwill and Intangible Assets, for a complete description of the Company's goodwill.
Impairment of Long-Lived Assets
Long-lived assets, including property and equipment, are reviewed for possible impairment whenever events or circumstances indicate that the carrying amount of an asset may not be recoverable. To analyze recoverability, undiscounted future cash flows over the remaining life of the asset are projected. If these projected cash flows are less than the carrying amount, an impairment loss is recognized to the extent the fair value of the asset less any costs of disposition is less than the carrying amount of the asset. Judgments regarding the existence of impairment indicators are based on market and operational performance. Evaluating potential impairment also requires estimates of future operating results and cash flows.
Self-Insurance
HD Supply has a high deductible insurance program for most losses related to general liability, product liability, environmental liability, automobile liability, workers' compensation, and is self-insured for medical claims and certain legal claims. The expected ultimate cost for claims incurred as of the balance sheet date is not discounted and is recognized as a liability. Self-insurance losses for claims filed and claims incurred but not reported are accrued based upon estimates of the aggregate liability for uninsured claims using loss development factors and actuarial assumptions followed in the insurance industry and historical loss development experience. At February 3, 2013 and January 29, 2012, reserves totaled approximately $94 million and $101 million, respectively.
Fair Value of Financial Instruments
The carrying amounts of restricted and unrestricted cash and cash equivalents, accounts receivable and accounts payable, accrued compensation and benefits and other current liabilities approximate fair value due to the short-term nature of these financial instruments. The Company's long-term financial assets and liabilities are recorded at historical costs. See Note 7, Fair Value Measurements, for information on the fair value of long-term financial instruments.
88
Table of Contents
HD SUPPLY, INC.
NOTES TO CONSOLIDATED FINANCIAL STATEMENTS (Continued)
NOTE 1—NATURE OF BUSINESS AND SUMMARY OF SIGNIFICANT ACCOUNTING POLICIES (Continued)
Revenue Recognition
HD Supply recognizes revenue when persuasive evidence of an agreement exists, delivery has occurred or services have been rendered, the price to the buyer is fixed and determinable and collectability is reasonably assured.
HD Supply ships products to customers predominantly by internal fleet and to a lesser extent by third party carriers. Revenues, net of sales tax and allowances for returns and discounts, are recognized from product sales when title to the products is passed to the customer, which generally occurs at the point of destination for products shipped by internal fleet and at the point of shipping for products shipped by third party carriers. Revenues related to services are recognized in the period the services are performed and totaled $134 million, $115 million, and $98 million in fiscal 2012, fiscal 2011, and fiscal 2010, respectively.
Shipping and Handling Fees and Costs
HD Supply includes shipping and handling fees billed to customers in Net sales. Shipping and handling costs associated with inbound freight are capitalized to inventories and relieved through Cost of sales as inventories are sold. Shipping and handling costs associated with outbound freight are included in Selling, general and administrative expenses and totaled $116 million, $96 million, and $91 million in fiscal 2012, fiscal 2011, and fiscal 2010, respectively.
Concentration of Credit Risk
The majority of HD Supply's sales are credit sales which are made primarily to customers whose ability to pay is dependent, in part, upon the economic strength of industries and the areas where they operate. Concentration of credit risk with respect to trade accounts receivable is limited by the large number of customers comprising HD Supply's customer base. HD Supply performs ongoing credit evaluations of its customers.
Leases
Leases are reviewed for capital or operating classification at their inception under the guidance of Accounting Standard Codification ("ASC ") 840, Leases. The Company uses its incremental borrowing rate in the assessment of lease classification and assumes the initial lease term includes renewal options that are reasonably assured. HD Supply conducts operations primarily under operating leases. For leases classified as operating leases, the Company records rent expense on a straight-line basis, over the lease term beginning with the date the Company has access to the property which in some cases is prior to commencement of lease payments. Accordingly, the amount of rental expense recognized in excess of lease payments is recorded as a deferred rent liability and is amortized to rental expense over the remaining term of the lease. Capital leases currently in effect are not material.
Advertising
Advertising costs are charged to expense as incurred except for the costs of producing and distributing certain direct response sales catalogs, which are capitalized and charged to expense over the life of the related catalog. Advertising expenses were approximately $34 million, $24 million, and
89
Table of Contents
HD SUPPLY, INC.
NOTES TO CONSOLIDATED FINANCIAL STATEMENTS (Continued)
NOTE 1—NATURE OF BUSINESS AND SUMMARY OF SIGNIFICANT ACCOUNTING POLICIES (Continued)
$21 million in fiscal 2012, fiscal 2011, and fiscal 2010, respectively. Capitalized advertising costs related to direct response advertising were not material.
Income Taxes
The Company provides for federal, state and foreign income taxes currently payable, as well as for those deferred due to temporary differences between reporting income and expenses for financial statement purposes versus tax purposes. Federal, state and foreign tax benefits are recorded as a reduction of income taxes. Deferred tax assets and liabilities are recognized for the future tax consequences attributable to temporary differences between the financial statement carrying amounts of existing assets and liabilities and their respective tax bases. Deferred tax assets and liabilities are measured using enacted income tax rates expected to apply to taxable income in the years in which those temporary differences are expected to be recovered or settled. The effect of a change in income tax rates is recognized as income or expense in the period that includes the enactment date.
The Company consists of corporations, limited liability companies and partnerships. All income tax expense (benefit) of the Company is recorded in the accompanying Consolidated Statements of Operations and Comprehensive Income (Loss) with the offset recorded through the Company's current tax accounts, deferred tax accounts, or stockholder's equity account as appropriate.
Comprehensive Income (Loss)
Comprehensive income (loss) includes Net income (loss) adjusted for certain revenues, expenses, gains and losses that are excluded from net income under U.S. GAAP. Adjustments to net income are for foreign currency translation adjustments and unrealized gains or losses on derivatives, to the extent they are accounted for as an effective hedge under ASC 815, Derivatives and Hedging.
Foreign Currency Translation
Assets and liabilities of foreign subsidiaries with a functional currency other than the U. S. dollar, primarily Canadian dollars, are translated into U.S. dollars at the current rate of exchange on the last day of the reporting period. Revenues and expenses are translated at a monthly average exchange rate and equity transactions are translated using either the actual exchange rate on the day of the transaction or a monthly average exchange rate.
Derivative Financial Instruments
When the Company enters into derivative financial instruments, it is for hedging purposes. In hedging the exposure to variable cash flows on forecasted transactions, deferral accounting is applied when the derivative reduces the risk of the underlying hedged item effectively as a result of high inverse correlation with the value of the underlying exposure. If a derivative instrument either initially fails or later ceases to meet the criteria for deferral accounting, any subsequent gains or losses are recognized currently in income. Cash flows resulting from derivative financial instruments are classified in the same category as the cash flows from the items being hedged.
90
Table of Contents
HD SUPPLY, INC.
NOTES TO CONSOLIDATED FINANCIAL STATEMENTS (Continued)
NOTE 1—NATURE OF BUSINESS AND SUMMARY OF SIGNIFICANT ACCOUNTING POLICIES (Continued)
Stock-Based Compensation
HD Supply Holdings, Inc. ("Holding") established an Incentive Stock Plan (the "HDS Plan") for associates of HD Supply, a wholly-owned subsidiary. The HDS Plan provides for the award of non-qualified stock options and deferred share units of the common stock of Holding. The maximum number of shares of common stock that may be issued under the HDS Plan may not exceed 55.6 million, of which a maximum of 30.9 million shares may be issued in respect of options granted under the HDS Plan. Holding will issue new shares of common stock to satisfy options exercised. The HDS Plan is accounted for under ASC 718, Compensation—Stock Compensation, which requires the recognition of share-based compensation costs in the financial statements.
Recent Accounting Pronouncements
Fair value measurement—In May 2011, the Financial Accounting Standards Board ("FASB") issued ASU No. 2011-04, "Amendments to Achieve Common Fair Value Measurement and Disclosure Requirements in U.S. GAAP and IFRSs" ("ASU 2011-04"). The amendments in this ASU are intended to improve the comparability of fair value measurements presented and disclosed in financial statements prepared in accordance with U.S. GAAP and International Financial Reporting Standards ("IFRS"s). The amendments in this ASU explain how to measure fair value. They do not require additional fair value measurements and are not intended to establish valuation standards or affect valuation practices outside of financial reporting. The Company adopted the provisions of ASU 2011-04 on January 30, 2012. The adoption did not have an impact on the Company's financial position or results of operations.
Comprehensive income: Presentation—In June 2011, the FASB issued ASU No. 2011-05, "Presentation of Comprehensive Income" ("ASU 2011-05"), to increase the prominence of items reported in other comprehensive income and to facilitate convergence of U.S. GAAP and IFRS. ASU 2011-05 eliminates the option to present components of other comprehensive income as part of the statement of changes in stockholders' equity and requires that all non-owner changes in stockholders' equity be presented either in a single continuous statement of comprehensive income or in two separate but consecutive statements. In the two-statement approach, the first statement should present total net income and its components followed consecutively by a second statement that should present total other comprehensive income, the components of other comprehensive income, and the total of comprehensive income. The Company adopted the provisions of ASU 2011-05 on January 30, 2012. The adoption of ASU 2011-05 did not have an impact on the Company's financial position or results of operations.
Comprehensive income: Reclassifications—In February 2013, the FASB issued ASU No. 2013-02, "Reporting of Amounts Reclassified Out of Accumulated Other Comprehensive Income" ("ASU 2013-02"), to supersede and replace the presentation requirements for reclassifications out of accumulated other comprehensive income in ASU 2011-05, which were deferred indefinitely under ASU No. 2011-12, ""Deferral of the Effective Date for Amendments to the Presentation of Reclassifications of Items Out of Accumulated Other Comprehensive Income in Accounting Standards Update No. 2011-05" ("ASU 2011-12"), issued in December 2011. The amendments in ASU 2013-02 would require an entity to provide additional information about reclassifications out of accumulated other comprehensive income by the respective line items of net income. For public entities, the
91
Table of Contents
HD SUPPLY, INC.
NOTES TO CONSOLIDATED FINANCIAL STATEMENTS (Continued)
NOTE 1—NATURE OF BUSINESS AND SUMMARY OF SIGNIFICANT ACCOUNTING POLICIES (Continued)
amendments are effective for fiscal years, and interim periods within those years, beginning after December 15, 2012. The adoption of ASU 2013-02 will not have an impact on the Company's financial position or results of operations.
Goodwill impairment testing—In September 2011, the FASB issued ASU No. 2011-08, "Testing Goodwill for Impairment" ("ASU 2011-08"), which simplifies how entities test goodwill for impairment and permits an entity to first assess qualitative factors to determine whether it is more likely than not that the fair value of a reporting unit is less than its carrying amount as a basis for determining whether it is necessary to perform the two-step goodwill impairment test. The Company adopted the provisions of ASU 2011-08 on January 30, 2012. The adoption of ASU 2011-08 did not have an impact on the Company's financial position or results of operations.
Release of Cumulative Translation Adjustment—In March 2013, the FASB issued ASU No. 2013-05, "Parent's Accounting for the Cumulative Translation Adjustment upon Derecognition of Certain Subsidiaries or Groups of Assets within a Foreign Entity or of an Investment in a Foreign Entity" ("ASU 2013-05"), which resolves diversity in practice regarding the release of the cumulative translation adjustment into net income when a parent either sells a part of all of its investment in a foreign entity or no longer holds a controlling financial interest in a subsidiary or group of assets within a foreign entity. The amendments in ASU 2013-05 are effective prospectively for fiscal years, and interim periods within those years, beginning after December 15, 2013. Early adoption is permitted. The adoption of ASU 2013-05 will not have a material impact on the Company's financial position or results of operations.
NOTE 2—ACQUISITIONS
HD Supply enters into strategic acquisitions to expand into new markets, new platforms, and new geographies in an effort to better service existing customers and attract new ones. In accordance with the acquisition method of accounting under ASC 805, Business Combinations, the results of the acquisitions completed by HD Supply are reflected in the Company's consolidated financial statements from the date of acquisition forward.
On December 3, 2012, the Company purchased substantially all of the assets of Water Products of Oklahoma, Inc., Arkansas Water Products, LLC, and Municipal Water Works Supply, LP (collectively "Water Products") for approximately $52 million. These businesses distribute water, sewer, gas and related products, such as pipes, valves, fittings, hydrants, pumps and meters, and offer maintenance products and repair services primarily to municipalities and contractors. The businesses are operated as part of the Waterworks segment.
On June 29, 2012, the Company purchased Peachtree Business Products LLC ("Peachtree") for approximately $196 million. Headquartered in Marietta, Georgia, Peachtree specializes in customizable business and property marketing supplies, serving residential and commercial property managers, medical facilities, schools and universities, churches and funeral homes. Peachtree is operated as part of the Facilities Maintenance segment.
In accordance with ASC 805, Business Combinations, the Company recorded the following assets and liabilities at fair value on the date of the Peachtree acquisition: $129 million in goodwill, $53 million in definite-lived intangible assets, $12 million in property & equipment, $8 million in net
92
Table of Contents
HD SUPPLY, INC.
NOTES TO CONSOLIDATED FINANCIAL STATEMENTS (Continued)
NOTE 2—ACQUISITIONS (Continued)
working capital assets and liabilities, and $6 million in deferred tax liabilities. The total amount of goodwill expected to be deductible for tax purposes is $47 million. The definite-lived intangible assets are primarily $50 million in customer relationships that will be amortized over a weighted-average period of 10.9 years.
On May 2, 2011, the Company purchased substantially all of the assets of Rexford Albany Municipal Supply Company, Inc. ("RAMSCO") for approximately $21 million. RAMSCO specializes in distributing water, sanitary and storm sewer materials primarily to municipalities and contractors through four locations in upstate New York. These locations are operated as part of the Waterworks segment.
NOTE 3—DISCONTINUED OPERATIONS
On March 26, 2012, the Company sold all of the issued and outstanding equity interests in its Industrial Pipes, Valves and Fittings ("IPVF") business to Shale-Inland Holdings, LLC. The Company received cash proceeds of approximately $477 million, net of $5 million of transaction costs. As a result of the sale, the Company recorded a $12 million pre-tax gain in fiscal 2012.
On September 9, 2011, the Company sold all of the issued and outstanding equity interests in its Plumbing/HVAC business to Hajoca Corporation. The Company received cash proceeds of approximately $116 million, net of $8 million remaining in escrow and $4 million of transaction costs. As a result of the sale, the Company recorded a $7 million pre-tax gain in fiscal 2011. During the fiscal 2012, the Company paid an additional $1 million in transaction costs and received $4 million from escrow.
On February 28, 2011, HD Supply Canada sold substantially all of the assets of SESCO/QUESCO, an electrical products division of HD Supply Canada, to Sonepar Canada, and received proceeds of approximately $11 million, less $1 million remaining in escrow. As a result of the sale, the Company recorded a $2 million pre-tax gain in fiscal 2011. During fiscal 2012, the Company received $1 million from escrow.
Summary Financial Information
In accordance with ASC 205-20, Discontinued Operations, the results of the IPVF, Plumbing/HVAC and SESCO/QUESCO operations and the gains on sales of the businesses are classified as discontinued operations. The presentation of discontinued operations includes revenues and expenses of the discontinued operations and gain on the sale of businesses, net of tax, as one line item on the Consolidated Statements of Operations and Comprehensive Income (Loss). All Consolidated Statements of Operations and Comprehensive Income (Loss) presented have been revised to reflect
93
Table of Contents
HD SUPPLY, INC.
NOTES TO CONSOLIDATED FINANCIAL STATEMENTS (Continued)
NOTE 3—DISCONTINUED OPERATIONS (Continued)
this presentation. The following tables provide additional detail related to the results of operations of the discontinued operations (amounts in millions):
| | | | | | | | | | |
| | Fiscal
2012 | | Fiscal
2011 | | Fiscal
2010 | |
|---|
Net sales | | $ | 127 | | $ | 969 | | $ | 1,028 | |
Gain on sales of discontinued operations | | | 12 | | | 9 | | | — | |
Income (loss) before provision for income taxes | | | 20 | | | 20 | | | (6 | ) |
Provision for income taxes | | | — | | | — | | | — | |
| | | | | | | | |
Income (loss) from discontinued operations, net of tax | | $ | 20 | | $ | 20 | | $ | (6 | ) |
| | | | | | | | |
NOTE 4—RELATED PARTIES
On August 30, 2007, investment funds associated with Clayton, Dubilier & Rice, Inc., The Carlyle Group and Bain Capital Partners, LLC (collectively the "Equity Sponsors") formed Holding and entered into a stock purchase agreement with The Home Depot, Inc. ("Home Depot" or "THD") pursuant to which Home Depot agreed to sell to Holding or to a wholly owned subsidiary of Holding certain intellectual properties and all the outstanding common stock of HD Supply, Inc. and the Canadian subsidiary CND Holdings, Inc. On August 30, 2007, through a series of transactions, Holding's direct wholly owned subsidiary, HDS Holding Corporation, acquired direct control of HD Supply through the merger of its wholly owned subsidiary, HDS Acquisition Corp., with and into HD Supply, Inc. and the Canadian subsidiary CND Holdings, Inc. Through these transactions (the "Transactions"), Home Depot was paid cash of approximately $8.2 billion and 12.5% of Holding's common stock worth $325 million.
Home Depot
Sales—HD Supply derived revenue from the sale of products to Home Depot of $296 million, $275 million, and $299 million in fiscal 2012, fiscal 2011, and fiscal 2010, respectively. Accounts receivable from Home Depot were $44 million and $45 million at February 3, 2013 and January 29, 2012, respectively, and are included within Receivables in the accompanying Consolidated Balance Sheets.
Strategic Agreement—On the date of the Transactions, Home Depot entered into a strategic purchase agreement with Crown Bolt, HD Supply's distribution services line of business. This agreement provided a guaranteed revenue stream to Crown Bolt through January 31, 2015 by specifying minimum annual purchase requirements from Home Depot. Crown Bolt recorded $19 million, $20 million and $12 million during fiscal 2012, fiscal 2011 and fiscal 2010, respectively, in Net sales in accordance with the minimum purchase requirement provisions of this strategic purchase agreement. On February 1, 2013, Crown Bolt and Home Depot agreed to an amendment and five-year extension of the strategic purchase agreement, which eliminated the minimum purchase requirement beginning in fiscal 2013, but retains Crown Bolt as the exclusive supplier of products purchased by Home Depot from Crown Bolt through January 31, 2020. Because the amendment was considered a triggering event, HD Supply performed an impairment analysis of goodwill and other intangible assets at Crown Bolt. As a result of the analysis, Crown Bolt recorded a $152 million non-cash impairment charge in fiscal 2012. For more information on this charge, see Note 5, Goodwill and Intangible Assets.
94
Table of Contents
HD SUPPLY, INC.
NOTES TO CONSOLIDATED FINANCIAL STATEMENTS (Continued)
NOTE 4—RELATED PARTIES (Continued)
Equity Sponsors
Sponsor Management Fee—In conjunction with the closing of the Transactions, the Company entered into a management agreement whereby the Company pays the Equity Sponsors a $5 million annual aggregate management fee ("Sponsor Management Fee") and related expenses through August 2017. During each of fiscal 2012, fiscal 2011, and fiscal 2010, the Company recorded $5 million of Sponsor Management Fees and related expenses, which are included in Selling, general and administrative expense in the Consolidated Statements of Operations and Comprehensive Income (Loss).
Notes—Management of the Company has been informed that, as of February 3, 2013, affiliates of certain of the Equity Sponsors beneficially owned approximately $348 million aggregate principal amount, or 39%, of the Company's Old Senior Subordinated Notes (as defined in Note 6, Debt) and approximately $49 million aggregate principal amount of the Company's other outstanding indebtedness. During fiscal 2012, the Company issued and repurchased the 14.875% Senior Notes (as defined in Note 6, Debt) to and from certain affiliates of the Equity Sponsors. See Note 6, Debt, for information on the issuance and repurchase of the 14.875% Senior Notes and Note 17, Subsequent Event—Debt Redemption, for information on the redemption of the Company's Old Senior Subordinated Notes.
Purchases—HD Supply purchased product from affiliates of the Equity Sponsors for approximately $57 million, $60 million, and $24 million in fiscal 2012, fiscal 2011, and fiscal 2010, respectively. Management believes these transactions were conducted at prices that an unrelated third party would pay.
NOTE 5—GOODWILL AND INTANGIBLE ASSETS
Goodwill
The carrying amount of goodwill by reporting unit is as follows (amounts in millions):
| | | | | | | | | | | | | | | | | | | |
| | As of February 3, 2013 | | As of January 29, 2012 | |
|---|
| | Gross Goodwill | | Accumulated
Impairments | | Net
Goodwill | | Gross
Goodwill | | Accumulated
Impairments | | Net
Goodwill | |
|---|
Waterworks | | $ | 1,876 | | $ | (815 | ) | $ | 1,061 | | $ | 1,867 | | $ | (815 | ) | $ | 1,052 | |
Facilities Maintenance | | | 1,603 | | | — | | | 1,603 | | | 1,474 | | | — | | | 1,474 | |
White Cap | | | 183 | | | (74 | ) | | 109 | | | 183 | | | (74 | ) | | 109 | |
Utilities(1) | | | 284 | | | (99 | ) | | 185 | | | 285 | | | (99 | ) | | 186 | |
Crown Bolt | | | 215 | | | (150 | ) | | 65 | | | 215 | | | — | | | 215 | |
Repair & Remodel | | | 125 | | | (30 | ) | | 95 | | | 125 | | | (30 | ) | | 95 | |
Electrical(1) | | | 20 | | | — | | | 20 | | | 20 | | | — | | | 20 | |
CTI | | | 67 | | | (67 | ) | | — | | | 67 | | | (67 | ) | | — | |
IPVF | | | — | | | — | | | — | | | 82 | | | (82 | ) | | — | |
| | | | | | | | | | | | | | |
Total goodwill | | $ | 4,373 | | $ | (1,235 | ) | $ | 3,138 | | $ | 4,318 | | $ | (1,167 | ) | $ | 3,151 | |
| | | | | | | | | | | | | | |
- (1)
- Utilities and Electrical are reporting units that, combined, comprise the Power Solutions segment.
95
Table of Contents
HD SUPPLY, INC.
NOTES TO CONSOLIDATED FINANCIAL STATEMENTS (Continued)
NOTE 5—GOODWILL AND INTANGIBLE ASSETS (Continued)
Goodwill represents the excess of purchase price over fair value of net assets acquired. HD Supply does not amortize goodwill, but does assess the recoverability of goodwill in the third quarter of each fiscal year. If an event occurs or circumstances change that would more likely than not reduce the fair value of a reporting unit below its carrying value, an interim impairment test would be performed between annual tests. Goodwill impairment testing is performed at the reporting unit level.
On January 30, 2012, the Company adopted the provisions of Accounting Standard Update No. 2011-08, "Testing Goodwill for Impairment" ("ASU 2011-08"), which simplifies how entities test goodwill for impairment and permits an entity to first assess qualitative factors to determine whether it is more likely than not that the fair value of a reporting unit is less than its carrying amount as a basis for determining whether it is necessary to perform the two-step goodwill impairment test.
The first step of the impairment test involves comparing each reporting unit's fair value to its carrying value including goodwill. If the fair value of a reporting unit exceeds its carrying value, applicable goodwill is considered not to be impaired. If the carrying value exceeds fair value, there is an indication of impairment and the second step is performed to measure the amount of impairment.
The second step involves calculating an implied fair value of goodwill for each reporting unit for which the first step indicated impairment. The implied fair value of goodwill is determined in the same manner as the amount of goodwill recognized in a business combination, which is the excess of the fair value of the reporting unit, as determined in the first step, over the aggregate fair values of the individual assets, liabilities and identifiable intangibles as if the reporting unit was being acquired in a business combination. If the implied fair value of goodwill in the "pro forma" business combination accounting as described above, exceeds the goodwill assigned to the reporting unit, there is no impairment. If the goodwill assigned to a reporting unit exceeds the implied fair value of the goodwill, an impairment charge is recorded for the excess. An impairment loss recognized cannot exceed the amount of goodwill assigned to a reporting unit, and the loss establishes a new basis in the goodwill. Subsequent reversal of goodwill impairment losses is not permitted under U.S. GAAP. HD Supply performed the annual goodwill impairment testing during the third quarter of fiscal 2012 for the seven reporting units with goodwill balances (goodwill balances at one reporting unit was zero prior to the annual testing). In accordance with ASU 2011-08, the Company elected to first assess qualitative factors on two reporting units, Facilities Maintenance and White Cap, to determine whether it is more likely than not that the fair value of each of these reporting units is less than its carrying amount. Based on this assessment, the Company determined that it was not necessary to perform the two-step goodwill impairment test for these two reporting units. The Company bypassed the qualitative analysis on the remaining five reporting units and proceeded with the first step of the two-step goodwill impairment test.
The Company determines the fair value of a reporting unit using a discounted cash flow ("DCF") analysis and a market comparable method, with each method being equally weighted in the calculation. Determining fair value requires the exercise of significant judgment, including judgment about appropriate discount rates, the amount and timing of expected future cash flows, as well as relevant comparable company earnings multiples for the market comparable approach. The cash flows employed in the DCF analyses are based on the Company's most recent long-range forecast and, for years beyond the forecast, the Company's estimates, which are based on estimated exit multiples ranging from six to seven times the final forecasted year earnings before interest, taxes, depreciation and amortization. The discount rates used in the DCF analyses are intended to reflect the risks inherent in the future cash flows of the respective reporting units and range from 11.5% to 14.0%. For the market comparable
96
Table of Contents
HD SUPPLY, INC.
NOTES TO CONSOLIDATED FINANCIAL STATEMENTS (Continued)
NOTE 5—GOODWILL AND INTANGIBLE ASSETS (Continued)
approach, the Company evaluated comparable company public trading values, using earnings multiples and sales multiples that are used to value the reporting units.
There was no indication of impairment in any of the Company's reporting units during the annual testing for fiscal 2012, fiscal 2011, and fiscal 2010 and accordingly, the second step of the goodwill impairment analysis was not performed. At the time of our fiscal 2012 annual testing, the fair value of the reporting units for which step one of the goodwill impairment test was completed exceeded their carrying value by the following percentages: 47% for Waterworks, 31% for Utilities, 6% for Crown Bolt, 40% for Repair & Remodel, and 116% for Electrical.
During the fourth quarter of fiscal 2012, Crown Bolt reached an agreement to amend and extend its strategic purchasing agreement with Home Depot. While the amendment extends the agreement five years through fiscal 2019, retaining Crown Bolt as the exclusive supplier of certain products to Home Depot, it eliminated the minimum purchase guarantee and adjusts future pricing. These changes resulted in a reduction of expected future cash proceeds from Home Depot. HD Supply, therefore, considered this amendment a triggering event and, as such, the Company performed an additional goodwill impairment analysis for Crown Bolt. During step one of the additional goodwill impairment analysis, there was an indication of impairment, and, accordingly, the second step of the goodwill impairment analysis was performed for this reporting unit. As a result of step two, the Company recorded a $150 million non-cash goodwill impairment in the fourth quarter of fiscal 2012.
The following table presents the changes in goodwill for the fiscal years presented (amounts in millions).
| | | | | | | | | | |
| | Fiscal 2012 | | Fiscal 2011 | | Fiscal 2010 | |
|---|
Beginning Balance | | $ | 3,151 | | $ | 3,150 | | $ | 3,149 | |
Acquisitions | | | 138 | | | 12 | | | — | |
Realization of tax deductible goodwill from a prior
acquisition | | | (2 | ) | | (11 | ) | | — | |
Impairment | | | (150 | ) | | — | | | — | |
Translation & other adjustments | | | 1 | | | — | | | 1 | |
| | | | | | | | |
Ending Balance | | $ | 3,138 | | $ | 3,151 | | $ | 3,150 | |
| | | | | | | | |
The Company's discounted cash flow model is based on HD Supply's expectation of future market conditions for each of the reporting units, as well as discount rates that would be used by market participants in an arm's-length transaction. Future events could cause the Company to conclude that market conditions have declined or discount rates have increased to the extent that the Company's goodwill could be further impaired. It is not possible at this time to determine if any such future impairment charge would result.
97
Table of Contents
HD SUPPLY, INC.
NOTES TO CONSOLIDATED FINANCIAL STATEMENTS (Continued)
NOTE 5—GOODWILL AND INTANGIBLE ASSETS (Continued)
Intangible Assets
HD Supply's intangible assets as of February 3, 2013 and January 29, 2012 consisted of the following (amounts in millions):
| | | | | | | | | | | | | | | | | | | |
| | As of February 3, 2013 | | As of January 29, 2012 | |
|---|
| | Gross
Intangible | | Accumulated
Amortization | | Net
Intangible | | Gross
Intangible | | Accumulated
Amortization | | Net
Intangible | |
|---|
Customer relationships | | $ | 929 | | $ | (614 | ) | $ | 315 | | $ | 1,532 | | $ | (983 | ) | $ | 549 | |
Strategic purchase agreement | | | 166 | | | (122 | ) | | 44 | | | 166 | | | (99 | ) | | 67 | |
Trade names | | | 153 | | | (41 | ) | | 112 | | | 152 | | | (34 | ) | | 118 | |
Other | | | 2 | | | — | | | 2 | | | 1 | | | — | | | 1 | |
| | | | | | | | | | | | | | |
Total | | $ | 1,250 | | $ | (777 | ) | $ | 473 | | $ | 1,851 | | $ | (1,116 | ) | $ | 735 | |
| | | | | | | | | | | | | | |
During fiscal 2012, the Company recorded $71 million of intangible assets, primarily $66 million in customer relationship intangibles, as a result of the Peachtree and Water Products business acquisitions. The customer relationship intangible assets will be amortized over a weighted-average period of 10.9 years. The remaining intangible assets recorded will be amortized over a weighted-average period of 3.6 years. In addition, during fiscal 2012, $516 million of customer relationship intangible assets became fully amortized and, therefore, were removed from the balance sheet.
During fiscal 2011, the Company recorded $4 million of intangible assets, primarily customer relationship intangibles, as a result of the RAMSCO business acquisition. These intangibles will be amortized over a weighted-average amortization period of 5.6 years.
As a result of the strategic purchase agreement amendment and extension with Home Depot, HD Supply performed an impairment analysis of the intangible asset assigned to the strategic purchase agreement. The analysis showed no indication of impairment of the intangible asset assigned to the strategic purchase agreement. The unamortized net book value of the intangible asset will be amortized over the remainder of the agreement, which is seven years. Additionally, Crown Bolt discontinued the use of a certain tradename. As a result, the related unamortized tradename intangible asset was written off, resulting in a $2 million impairment charge.
Amortization expense for continuing operations related to intangible assets was $243 million, $244 million, and $244 million, in fiscal 2012, fiscal 2011, and fiscal 2010, respectively. Estimated future amortization expense for continuing operations for intangible assets recorded as of February 3, 2013 is $135 million, $105 million, $40 million, $39 million and $38 million for fiscal years 2013 through 2017, respectively.
NOTE 6—DEBT
On February 1, 2013, HD Supply, Inc. issued $1,275 million aggregate principal amount of 7.5% Senior Notes due 2020 (the "7.5% Senior Notes") at par. As a result of the issuance, the Company incurred $21 million in debt issuance costs, of which $19 million was paid as of February 3, 2013. The net proceeds from the 7.5% Senior Notes issuance were used to repurchase all of the Company's outstanding 14.875% Senior Notes (issued in April 2012 to the Equity Sponsors), plus a $422 million make-whole premium calculated in accordance with the 14.875% Senior Notes Indenture (as defined below), plus $37 million of un-capitalized PIK interest thereon through February 1, 2013. Also on
98
Table of Contents
HD SUPPLY, INC.
NOTES TO CONSOLIDATED FINANCIAL STATEMENTS (Continued)
NOTE 6—DEBT (Continued)
February 1, 2013, the trustee for the 14.875% Senior Notes cancelled all of the outstanding 14.875% Senior Notes. As a result of these transactions, the Company incurred a $452 million loss on extinguishment, which included the make-whole premium, a $28 million write-off of unamortized original issue discount, and $2 million write-off of unamortized deferred debt costs.
On January 16, 2013, HD Supply, Inc. issued $950 million aggregate principal amount of 10.5% Senior Subordinated Notes due 2021 (the "Senior Subordinated Notes") at par. As a result of the issuance, the Company incurred $16 million in debt issuance costs, of which $15 million was paid as of February 3, 2013. The Company committed to use the net proceeds from the Senior Subordinated Notes issuance to redeem all of its remaining $889 million outstanding Old Senior Subordinated Notes (as defined below), subject to the required thirty-day notification period.
As of February 3, 2013, the Company held $936 million in cash equivalents classified as Cash equivalents restricted for debt redemption in the Consolidated Balance Sheet for the redemption of $889 million of the Old Senior Subordinated Notes on February 8, 2013. The $936 million was used to redeem the Old Senior Subordinated Notes at a price equal to 103.375% of the principal amount thereof and to pay (together with $36 million of cash on hand) accrued and unpaid interest thereon through the redemption date. See Note 17, Subsequent Events—Debt Redemption.
On October 15, 2012, HD Supply, Inc. issued $1,000 million aggregate principal amount of 11.5% Senior Notes due 2020 (the "11.5% Senior Notes") at par. As a result of the issuance, the Company incurred and paid $17 million in debt issuance costs. On November 8, 2012, the Company used the net proceeds from the 11.5% Senior Notes issuance to redeem $930 million of its outstanding Old Senior Subordinated Notes at a redemption price equal to 103.375% of the principal amount thereof and to pay $23 million of accrued interest. As a result, the Company incurred a $37 million loss on extinguishment, which included a $31 million premium payment to redeem the Old Senior Subordinated Notes prior to maturity and $5 million to write-off the pro-rata portion of unamortized deferred debt costs.
Refinancing Transactions and Additional Notes
On April 12, 2012, HD Supply, Inc. consummated the following transactions (the "Refinancing Transactions") in connection with the refinancing of the senior portion of its debt structure:
- •
- the issuance of $950 million of its 81/8% Senior Secured First Priority Notes due 2019 (the "First Priority Notes");
- •
- the issuance of $675 million of its 11% Senior Secured Second Priority Notes due 2020 (the "Second Priority Notes");
- •
- the issuance of approximately $757 million of 14.875% Senior Notes due 2020 (the "14.875% Senior Notes");
- •
- entry into a new senior term facility (the "Term Loan Facility") maturing in 2017 and providing for term loans in an aggregate principal amount of $1,000 million; and
- •
- entry into a new senior asset based lending facility (the "ABL Facility") maturing in 2017 and providing for senior secured revolving loans and letters of credit of up to a maximum aggregate principal amount of $1,500 million (subject to availability under the borrowing base).
99
Table of Contents
HD SUPPLY, INC.
NOTES TO CONSOLIDATED FINANCIAL STATEMENTS (Continued)
NOTE 6—DEBT (Continued)
The proceeds of the First Priority Notes, the Second Priority Notes, the 14.875% Senior Notes, the Term Loan Facility and the ABL Facility were used to (i) repay all amounts outstanding under the Old Senior Secured Credit Facility (Senior Secured Credit Facility dated as of August 30, 2007), (ii) repay all amounts outstanding under the Old ABL Credit Facility (ABL Credit Facility dated as of August 30, 2007), (iii) repurchase all remaining outstanding Old Senior Notes (12.0% Senior Notes dated as of August 30, 2007) and (iv) pay related fees and expenses.
Affiliates of certain of the Equity Sponsors owned an aggregate principal amount of approximately $484 million of the Old Senior Notes which they exchanged in a non-cash transaction for their investment in the 14.875% Senior Notes.
On August 2, 2012, the Company issued $300 million additional aggregate principal amount of its 81/8% First Priority Notes due 2019 (the "Additional Notes") at a premium of 107.5%. At closing, the Company received approximately $317 million, net of transaction fees. The Additional Notes were issued under the indenture pursuant to which HD Supply previously issued $950 million aggregate principal amount of 81/8% First Priority Notes due 2019, all of which remains outstanding. The net proceeds from the sale of the Additional Notes were applied to reduce outstanding borrowings under the Company's ABL Facility.
As a result of the Refinancing Transactions and the issuance of the Additional Notes, the Company incurred $80 million in debt issuance costs and recorded a $220 million loss on extinguishment, which included a $150 million premium payment to redeem the Old Senior Notes, $46 million to write-off the pro-rata portion of the unamortized deferred debt costs, and $24 million to write-off the remaining unamortized Other asset associated with Home Depot's guarantee of the Company's payment obligations for principal and interest under the Old Term Loan under the Old Senior Secured Credit Facility that was terminated in the Refinancing Transactions.
Unamortized deferred debt costs
In accordance with ASC 470, Debt, the Company determined that all of the redemption of Old Senior Notes was an extinguishment as either the original note holders were unknown or the refinancing was considered a "substantial" change. As a result of the extinguishment, the Company wrote-off approximately $24 million in unamortized deferred financing charges associated with the Old Senior Notes. Similarly, under ASC 470, approximately $834 million of the Old ABL Credit Facility and approximately $1,169 million of the Old Senior Secured Credit Facility were deemed extinguishments, with the remaining portions considered modifications. As a result of the extinguishment, the Company wrote-off approximately $22 million of $42 million in unamortized deferred financing charges associated with these credit agreements.
100
Table of Contents
HD SUPPLY, INC.
NOTES TO CONSOLIDATED FINANCIAL STATEMENTS (Continued)
NOTE 6—DEBT (Continued)
Long-term debt as of February 3, 2013 and January 29, 2012 consisted of the following (dollars in millions):
| | | | | | | | | | | | | |
| | February 3, 2013 | | January 29, 2012 | |
|---|
| | Outstanding
Principal | | Interest
Rate %(1) | | Outstanding
Principal | | Interest
Rate %(1) | |
|---|
ABL Facility due 2017 | | $ | 300 | | | 1.96 | | $ | — | | | — | |
Old Term Loan due August 30, 2012 | | | — | | | — | | | 73 | | | 1.53 | |
Old Term Loan due April 1, 2014 | | | — | | | — | | | 855 | | | 3.03 | |
Old ABL Term Loan due April 1, 2014 | | | — | | | — | | | 214 | | | 3.56 | |
Term Loan due 2017, net of unamortized discount of $26 million as of February 3, 2013 | | | 969 | | | 7.25 | | | — | | | — | |
First Priority Notes due 2019, including unamortized premium of $21 million as of February 3, 2013 | | | 1,271 | | | 8.125 | | | — | | | — | |
Second Priority Notes due 2020 | | | 675 | | | 11.00 | | | — | | | — | |
Old Senior Notes due 2014 | | | — | | | — | | | 2,500 | | | 12.00 | |
11.5% Senior Notes due 2020 | | | 1,000 | | | 11.50 | | | — | | | — | |
7.5% Senior Notes due 2020 | | | 1,275 | | | 7.50 | | | — | | | — | |
Senior Subordinated Notes due 2021 | | | 950 | | | 10.50 | | | — | | | — | |
Old Senior Subordinated Notes due 2015 | | | 889 | | | 13.50 | | | 1,820 | | | 13.50 | |
| | | | | | | | | | | | |
Total long-term debt | | $ | 7,329 | | | | | | 5,462 | | | | |
Less current installments | | | (899 | ) | | | | | (82 | ) | | | |
| | | | | | | | | | | | |
Long-term debt, excluding current installments | | $ | 6,430 | | | | | $ | 5,380 | | | | |
| | | | | | | | | | | | |
- (1)
- Represents the stated rate of interest, without including the effect of discounts or premiums.
Senior Credit Facilities
Asset Based Lending Facility
The ABL Facility provides for senior secured revolving loans and letters of credit of up to a maximum aggregate principal amount of $1,500 million (subject to availability under a borrowing base). Extensions of credit under the ABL Facility will be limited by a borrowing base calculated periodically based on specified percentages of the value of eligible inventory and eligible accounts receivable, subject to certain reserves and other adjustments. As of February 3, 2013, the Company had $910 million of available borrowings under the ABL Facility (after giving effect to the borrowing base limitations and approximately $61 million in letters of credit issued and including $70 million of borrowings available on qualifying cash balances).
A portion of the ABL Facility is available for letters of credit and swingline loans. The ABL Facility also includes a sub-facility for loans and letters of credit in Canadian dollars. The ABL Facility also permits the Company to add one or more incremental term loans, revolving or letter of credit facilities to be included in the ABL Facility up to an aggregate maximum amount of $1,900 million for the total commitments under the ABL Facility (including all incremental commitments).
101
Table of Contents
HD SUPPLY, INC.
NOTES TO CONSOLIDATED FINANCIAL STATEMENTS (Continued)
NOTE 6—DEBT (Continued)
Until the date that was three months after the closing date of the ABL Facility, at the option of the applicable borrower, the interest rates applicable to the loans under the ABL Facility were based, (i) in the case of U.S. dollar denominated loans, either at LIBOR plus 2.00% or Prime Rate plus 1.00% and (ii) in the case of Canadian dollar denominated loans, either the BA Rate plus 2.00% or the Canadian Prime Rate plus 1.00%. From and after the date that was three months after the closing date of the ABL Facility, the foregoing interest margins are subject to a pricing grid, as included in the ABL Facility agreement, based on average excess availability for the previous fiscal quarter. The ABL Facility also contains a letter of credit fee computed at a rate per annum equal to the Applicable Margin (as defined in the agreement) then in effect for LIBOR Loans and an unused commitment fee subject to a pricing grid, as included in the ABL Facility agreement, based on the Average Daily Used Percentage (as defined in the agreement).
The ABL Facility will mature on April 12, 2017; unless the individual applicable lenders agree to extend the maturity of their respective loans under the ABL Facility upon the Company's request and without the consent of any other applicable lender.
The ABL Facility is senior secured indebtedness of the Company and ranks equal in right of payment with all of the Company's existing and future senior indebtedness and senior in right of payment to all of the Company's existing and future subordinated indebtedness.
The ABL Facility is guaranteed, on a senior secured basis, by the Subsidiary Guarantors. These guarantees are subject to release under customary circumstances as stipulated in the agreement.
The ABL Facility is secured by a first-priority security interest in the ABL Priority Collateral, subject to permitted liens.
Prepayments
The ABL Facility may be prepaid at the Company's option at any time without premium or penalty and will be subject to mandatory prepayment if the outstanding ABL Facility exceeds either the aggregate commitments with respect thereto or the current borrowing base, in an amount equal to such excess. Mandatory prepayments do not result in a permanent reduction of the lenders' commitments under the ABL Facility.
Guarantees
The Company, and at the Company's option, certain of the Company's subsidiaries, including HD Supply Canada, Inc., a Canadian subsidiary (the "Canadian Borrower"), are the borrowers under the ABL Facility. The Subsidiary Guarantors guarantee the Company's payment obligations under the ABL Facility (and, in the case of Canadian obligations, each direct and indirect wholly-owned Canadian subsidiary, subject to certain exceptions, in each case to the extent otherwise permitted by applicable law, regulation and contractual provision (the "Canadian Guarantors") guarantee the Canadian Borrower's payment obligations under the ABL Facility).
The Company's obligations under the ABL Facility and the guarantees thereof, are secured in favor of the U.S. ABL collateral agent, by (i) all of the capital stock of the Company, all capital stock of all domestic subsidiaries directly owned by the Company and the Subsidiary Guarantors and 65% of the capital stock of any foreign subsidiary held directly by the Company or any Subsidiary Guarantor (it
102
Table of Contents
HD SUPPLY, INC.
NOTES TO CONSOLIDATED FINANCIAL STATEMENTS (Continued)
NOTE 6—DEBT (Continued)
being understood that a foreign subsidiary holding company will be deemed a foreign subsidiary) and (ii) substantially all other tangible and intangible assets owned by the Company and each Subsidiary Guarantor, in each case to the extent permitted by applicable law and subject to certain exceptions and subject to the priority of liens between the Term Loan Facility, the First Priority Notes, the Second Priority Notes and the ABL Facility.
The Canadian obligations under the ABL Facility are also secured by liens on substantially all assets of the Canadian Borrower and the Canadian Guarantors, subject to certain exceptions.
Covenants
The ABL Facility contains a number of covenants that, among other things, limit or restrict the Company's ability and, in certain cases, the Company's subsidiaries to make acquisitions, mergers, consolidations, dividends, and to prepay certain indebtedness (including the First Priority Notes, the Second Priority Notes, the 11.5% Senior Notes, the 7.5% Senior Notes, and the Senior Subordinated Notes), in each case to the extent any such transaction would reduce availability under the ABL Facility below a specified amount.
In addition, if the Company's specified excess availability (including an amount by which the Company's borrowing base exceeds the existing commitments) under the ABL Facility falls below the greater of $150 million and 10% of the aggregate commitments (a "Liquidity Event"), the Company will be required to maintain a Fixed Charge Coverage Ratio of at least 1.0:1.0, as defined in the ABL Facility.
The ABL Facility also contains certain affirmative covenants, including financial and other reporting requirements. The Company is in compliance with all such covenants.
Senior Secured Term Loan Facility
The Term Loan Facility consists of a senior secured Term Loan Facility (the "Term Loan Facility"; the term loan thereunder, the "Term Loan") providing for a Term Loan in an aggregate principal amount of $1,000 million (net of $30 million of original issue discount). The Term Loan Facility also permits the Company to add one or more incremental term loans, revolving or letter of credit facilities of up to $250 million plus a certain amount depending on a secured first lien leverage ratio test included in the Term Loan Facility. The Term Loan bears interest at LIBOR (subject to a floor of 1.25%) plus a borrowing margin of 6.00% or Prime plus a borrowing margin of 5.00% at the Company's election, payable at the end of each calendar quarter with respect to Prime rate draws or at the maturity of each LIBOR draw (unless a draw is for a six-, nine-, or twelve-month period, then interest shall be paid quarterly). The Term Loan amortizes in nominal quarterly installments, beginning September 30, 2012, equal to 0.25% of the original aggregate principal amount of the Term Loan and matures on October 12, 2017; provided that the individual applicable lenders may agree to extend the maturity of their respective Term Loans upon the Company's request and without the consent of any other applicable lender. See Note 17, Subsequent Events—Debt Modification, for information about an amendment to the Term Loan Facility.
The Term Loan Facility is senior secured indebtedness of the Company and ranks equal in right of payment with all of the Company's existing and future senior indebtedness and senior in right of payment to all of the Company's existing and future subordinated indebtedness.
103
Table of Contents
HD SUPPLY, INC.
NOTES TO CONSOLIDATED FINANCIAL STATEMENTS (Continued)
NOTE 6—DEBT (Continued)
The Term Loan Facility is guaranteed, on a senior secured basis, by the Subsidiary Guarantors. These guarantees are subject to release under customary circumstances. The guarantee of each Subsidiary Guarantor is a senior secured obligation of that Subsidiary Guarantor and ranks equal in right of payment with all existing and future senior indebtedness of that Subsidiary Guarantor and senior in right of payment to all existing and future subordinated indebtedness of such Subsidiary Guarantor.
Collateral
The Term Loan Facility and the related guarantees are secured by a first-priority security interest in the Cash Flow Priority Collateral, subject to permitted liens. In addition, the Term Loan Facility and the related guarantees are secured by a second-priority security interest in the ABL Priority Collateral, subject to permitted liens.
Prepayment
Prior to the first anniversary of the closing date of the Term Loan Facility, the loans under the Term Loan Facility may not be optionally prepaid. During the second and third years following the closing date of the Term Loan Facility, the Term Loans may be optionally prepaid at a price of 102% and 101%, respectively, of the principal amount being prepaid. On and after the third anniversary of the closing date of the Term Loan Facility, the Term Loans may be prepaid without premium or penalty. Under certain circumstances and subject to certain exceptions, the Term Loan Facility will be subject to mandatory prepayment in an amount equal to:
- •
- 100% of the net proceeds (other than those that are used to purchase certain assets or to repay certain other indebtedness) of certain asset sales and certain insurance recovery events; and
- •
- 50% of annual excess cash flow for any fiscal year, such percentage to decrease to 0% depending on the attainment of certain secured leverage ratio targets.
In addition, upon the incurrence of certain events constituting a Change of Control (as defined in the credit agreement governing the Term Loan Facility (the "Term Loan Credit Agreement")), the Company must offer to prepay the Term Loans (unless otherwise repaid) at a price equal to 101% of their principal amount, plus accrued and unpaid interest, if any, to the repayment date.
Guarantee
The Company is the borrower under the Term Loan Facility. The Subsidiary Guarantors guarantee the Company's payment obligations under the Term Loan Facility.
The Company's obligations under the Term Loan Facility and the guarantees thereof are secured in favor of the collateral agent by (i) all of the capital stock of the Company, all capital stock of all domestic subsidiaries directly owned by the Company and the Subsidiary Guarantors and 65% of the capital stock of any foreign subsidiary owned directly by the Company or any Subsidiary Guarantors (it being understood that a foreign subsidiary holding company will be deemed a foreign subsidiary) and (ii) substantially all other tangible and intangible assets owned by the Company and each Subsidiary Guarantor, in each case to the extent permitted by applicable law and subject to certain exceptions and subject to the priority of liens between the Term Loan Facility, the First Priority Notes, the Second Priority Notes and the ABL Facility.
104
Table of Contents
HD SUPPLY, INC.
NOTES TO CONSOLIDATED FINANCIAL STATEMENTS (Continued)
NOTE 6—DEBT (Continued)
Covenants
The Term Loan Facility contains a number of covenants that, among other things, limit the ability of the Company and its restricted subsidiaries, as described in the Term Loan Credit Agreement, to: incur more indebtedness; pay dividends, redeem stock or make other distributions; make investments; create restrictions on the ability of the Company's restricted subsidiaries to pay dividends to the Company or make other intercompany transfers; create liens securing indebtedness; transfer or sell assets; merge or consolidate; enter into certain transactions with the Company's affiliates; and prepay or amend the terms of certain indebtedness.
The Term Loan Facility also contains certain affirmative covenants, including financial and other reporting requirements. The Company is in compliance with all such covenants.
Events of Default under the ABL Facility and Term Loan Facility
The ABL Facility and Term Loan Facility also provide for customary events of default, including non-payment of principal, interest or fees, violation of covenants, material inaccuracy of representations or warranties, specified cross default and cross acceleration to other material indebtedness, certain bankruptcy events, certain ERISA events, material invalidity of guarantees or security interest, material judgments and changes of control.
81/8% Senior Secured First Priority Notes due 2019
The Company issued $950 million of First Priority Notes under an Indenture, dated, and amended, as of April 12, 2012 (the "First Priority Indenture") among the Company, certain subsidiaries of the Company, as guarantors (the "Subsidiary Guarantors"), the Trustee, and the Note Collateral Agent. On August 2, 2012, the Company issued $300 million additional aggregate principal amount of its First Priority Notes (the "Additional Notes") at a premium of 107.5%. The First Priority Notes bear interest at a rate of 81/8% per annum and will mature on April 15, 2019. Interest will be paid semi-annually in arrears on April 15th and October 15th of each year, commencing on October 15, 2012.
The First Priority Notes are senior secured indebtedness of the Company and rank equal in right of payment with all of its existing and future senior indebtedness and senior in right of payment to all of its existing and future subordinated indebtedness.
The First Priority Notes are guaranteed, on a senior secured basis, by each of the Company's Wholly Owned Domestic Subsidiaries (as defined in the First Priority Indenture), other than an Excluded Subsidiary (as defined in the First Priority Indenture), and by each of the Company's other Domestic Subsidiaries (as defined in the First Priority Indenture) that is a borrower under the ABL Facility or that guarantees payment of indebtedness of the Company under any Credit Facility or Capital Markets Securities (as defined in the First Priority Indenture). These guarantees are subject to release under customary circumstances as stipulated in the First Priority Indenture.
Collateral
The First Priority Notes and the related guarantees are secured by a first-priority security interest in substantially all of the tangible and intangible assets of the Company and the Subsidiary Guarantors (other than the ABL Priority Collateral, in which the First Priority Notes and the related guarantees have a second priority security interest), including pledges of all Capital Stock of the Company's
105
Table of Contents
HD SUPPLY, INC.
NOTES TO CONSOLIDATED FINANCIAL STATEMENTS (Continued)
NOTE 6—DEBT (Continued)
Restricted Subsidiaries directly owned by the Company and the Subsidiary Guarantors (but only up to 65% of each series of Capital Stock of each direct Foreign Subsidiary owned by the Company or any Subsidiary Guarantor), subject to certain thresholds, exceptions and permitted liens, and excluding any Excluded Assets (as defined in the First Priority Indenture) and Excluded Subsidiary Securities (as defined in the First Priority Indenture) (the "Cash Flow Priority Collateral").
In addition, the First Priority Notes and the related guarantees are secured by a second-priority security interest in substantially all of the Company's and the Subsidiary Guarantors' present and future assets which secure the Company's obligations under the ABL Facility on a first priority basis, including accounts receivable, inventory and other related assets and all proceeds thereof, subject to permitted liens. Such assets are referred to as the "ABL Priority Collateral." (The Cash Flow Priority Collateral and the ABL Priority Collateral together are referred to herein as the "Collateral.")
Redemption
The Company may redeem the First Priority Notes, in whole or in part, at any time (1) prior to April 15, 2015, at a price equal to 100% of the principal amount thereof, plus accrued and unpaid interest, if any, to the redemption date, plus the applicable make-whole premium set forth in the First Priority Indenture and (2) on and after April 15, 2015, at the applicable redemption price set forth below (expressed as a percentage of principal amount), plus accrued and unpaid interest, if any, to the relevant redemption date, if redeemed during the 12-month period commencing on April 15 of the year set forth below.
| | | | |
Year | | Percentage | |
|---|
2015 | | | 106.094 | % |
2016 | | | 104.063 | % |
2017 | | | 102.031 | % |
2018 and thereafter | | | 100.000 | % |
In addition, at any time prior to April 15, 2015, the Company may redeem up to 35% of the aggregate principal amount of the First Priority Notes with the proceeds of certain equity offerings at a redemption price of 108.125% of the principal amount in respect of the First Priority Notes being redeemed, plus accrued and unpaid interest to the redemption date, provided, however, that if the First Priority Notes are redeemed, an aggregate principal amount of First Priority Notes equal to at least 50% of the original aggregate principal amount of First Priority Notes must remain outstanding immediately after each such redemption of First Priority Notes.
11% Senior Secured Second Priority Notes due 2020
The Company issued $675 million aggregate principal amount of Second Priority Notes under an Indenture, dated, and amended, as of April 12, 2012 (the "Second Priority Indenture"), among the Company, the Subsidiary Guarantors, the Trustee, and the Note Collateral Agent. The Second Priority Notes bear interest at a rate of 11% per annum and will mature on April 15, 2020. Interest will be paid semi-annually in arrears on April 15th and October 15th of each year, commencing on October 15, 2012.
106
Table of Contents
HD SUPPLY, INC.
NOTES TO CONSOLIDATED FINANCIAL STATEMENTS (Continued)
NOTE 6—DEBT (Continued)
The Second Priority Notes are senior secured indebtedness of the Company and rank equal in right of payment with all of the Company's existing and future senior indebtedness and senior in right of payment to all of the Company's existing and future subordinated indebtedness.
The Second Priority Notes are guaranteed, on a senior secured basis, by each of the Company's Wholly Owned Domestic Subsidiaries (as defined in the Second Priority Indenture), other than an Excluded Subsidiary (as defined in the Second Priority Indenture), and by each of the Company's other Domestic Subsidiaries (as defined in the Second Priority Indenture) that is a borrower under the ABL Facility or that guarantees payment of indebtedness of the Company under any Credit Facility or Capital Markets Securities (as defined in the Second Priority Indenture). These guarantees are subject to release under customary circumstances as stipulated in the Second Priority Indenture.
Collateral
The Second Priority Notes and the related guarantees are secured by a second-priority security interest in the Cash Flow Priority Collateral, subject to permitted liens. In addition, the Second Priority Notes and the related guarantees are secured by a third-priority security interest in the ABL Priority Collateral, subject to permitted liens.
Redemption
The Company may redeem the Second Priority Notes, in whole or in part, at any time (1) prior to April 15, 2016, at a price equal to 100% of the principal amount thereof, plus accrued and unpaid interest, if any, to the redemption date, plus the applicable make-whole premium set forth in the Second Priority Indenture and (2) on and after April 15, 2016, at the applicable redemption price set forth below (expressed as a percentage of principal amount), plus accrued and unpaid interest, if any, to the relevant redemption date, if redeemed during the 12-month period commencing on April 15 of the year set forth below.
| | | | |
Year | | Percentage | |
|---|
2016 | | | 105.500 | % |
2017 | | | 102.750 | % |
2018 and thereafter | | | 100.000 | % |
In addition, at any time prior to April 15, 2015, the Company may redeem up to 35% of the aggregate principal amount of the Second Priority Notes with the proceeds of certain equity offerings at a redemption price of 111.000% of the principal amount in respect of the Second Priority Notes being redeemed, plus accrued and unpaid interest to the redemption date, provided, however, that if the Second Priority Notes are redeemed, an aggregate principal amount of Second Priority Notes equal to at least 50% of the original aggregate principal amount of Second Priority Notes must remain outstanding immediately after each such redemption of Second Priority Notes.
11.5% Senior Unsecured Notes due 2020
The Company issued $1,000 million aggregate principal amount of 11.5% Senior Notes under an Indenture, dated, and amended, as of October 15, 2012 ("11.5% Senior Notes Indenture") among the Company, certain subsidiaries of the Company as guarantors (the "Subsidiary Guarantors") and the
107
Table of Contents
HD SUPPLY, INC.
NOTES TO CONSOLIDATED FINANCIAL STATEMENTS (Continued)
NOTE 6—DEBT (Continued)
Trustee. The 11.5% Senior Notes bear interest at a rate of 11.5% per annum and will mature on July 15, 2020. Interest will be paid semi-annually in arrears on April 15th and October 15th of each year, commencing on April 15, 2013.
The 11.5% Senior Notes are unsecured senior indebtedness of the Company and rank equal in right of payment with all of the Company's existing and future senior indebtedness, senior in right of payment to all of the Company's existing and future subordinated indebtedness, and effectively subordinated to all of the Company's existing and future secured indebtedness, including, without limitation, indebtedness under the Senior Credit Facilities, the First Priority Notes and the Second Priority Notes, to the extent of the value of the collateral securing such indebtedness.
The 11.5% Senior Notes are guaranteed, on a senior unsecured basis, by each of the Company's direct and indirect domestic existing and future subsidiaries that is a wholly owned domestic subsidiary (other than certain excluded subsidiaries), and by each other domestic subsidiary that is a borrower under the ABL Facility or that guarantees the Company's obligations under any credit facility or capital markets securities. These guarantees are subject to release under customary circumstances as stipulated in the 11.5% Senior Notes Indenture.
Redemption
The Company may redeem the 11.5% Senior Notes, in whole or in part, at any time (1) prior to October 15, 2016, at a price equal to 100% of the principal amount thereof, plus accrued and unpaid interest, if any, to the redemption date, plus the applicable make-whole premium set forth in the 11.5% Senior Notes Indenture and (2) on and after October 15, 2016, at the applicable redemption price set forth below (expressed as a percentage of principal amount), plus accrued and unpaid interest, if any, to the relevant redemption date, if redeemed during the 12-month period commencing on October 15 of the year set forth below.
| | | | |
Year | | Percentage | |
|---|
2016 | | | 105.750 | % |
2017 | | | 102.875 | % |
2018 and thereafter | | | 100.000 | % |
In addition, at any time prior to October 15, 2015, the Company may redeem up to 35% of the aggregate principal amount of the 11.5% Senior Notes with the proceeds of certain equity offerings at a redemption price of 111.50% of the principal amount in respect of the 11.5% Senior Notes being redeemed, plus accrued and unpaid interest to the redemption date, provided, however, that if the 11.5% Senior Notes are redeemed, an aggregate principal amount of the 11.5% Senior Notes equal to at least 50% of the original aggregate principal amount of the 11.5% Senior Notes must remain outstanding immediately after each such redemption of the 11.5% Senior Notes.
7.5% Senior Unsecured Notes due 2020
The Company issued $1,275 million aggregate principal amount of 7.5% Senior Notes under an Indenture, dated, and amended, as of February 1, 2013 ("7.5% Senior Notes Indenture") among the Company, certain subsidiaries of the Company as guarantors (the "Subsidiary Guarantors") and the Trustee. The 7.5% Senior Notes bear interest at a rate of 7.5% per annum and will mature on July 15,
108
Table of Contents
HD SUPPLY, INC.
NOTES TO CONSOLIDATED FINANCIAL STATEMENTS (Continued)
NOTE 6—DEBT (Continued)
2020. Interest will be paid semi-annually in arrears on April 15th and October 15th of each year, commencing on April 15, 2013.
The 7.5% Senior Notes are unsecured senior indebtedness of the Company and rank equal in right of payment with all of the Company's existing and future senior indebtedness, senior in right of payment to all of the Company's existing and future subordinated indebtedness, and effectively subordinated to all of the Company's existing and future secured indebtedness, including, without limitation, indebtedness under the Senior Credit Facilities, the First Priority Notes and the Second Priority Notes, to the extent of the value of the collateral securing such indebtedness.
The 7.5% Senior Notes are guaranteed, on a senior unsecured basis, by each of the Company's direct and indirect domestic existing and future subsidiaries that is a wholly owned domestic subsidiary (other than certain excluded subsidiaries), and by each other domestic subsidiary that is a borrower under the ABL Facility or that guarantees the Company's obligations under any credit facility or capital markets securities. These guarantees are subject to release under customary circumstances as stipulated in the 7.5% Senior Notes Indenture.
Redemption
The Company may redeem the 7.5% Senior Notes, in whole or in part, at any time (1) prior to October 15, 2016, at a price equal to 100% of the principal amount thereof, plus accrued and unpaid interest, if any, to the redemption date, plus the applicable make-whole premium set forth in the 7.5% Senior Notes Indenture and (2) on and after October 15, 2016, at the applicable redemption price set forth below (expressed as a percentage of principal amount), plus accrued and unpaid interest, if any, to the relevant redemption date, if redeemed during the 12-month period commencing on October 15 of the year set forth below.
| | | | |
Year | | Percentage | |
|---|
2016 | | | 103.750 | % |
2017 | | | 101.875 | % |
2018 and thereafter | | | 100.000 | % |
In addition, at any time prior to October 15, 2015, the Company may redeem up to 35% of the aggregate principal amount of the 7.5% Senior Notes with the proceeds of certain equity offerings at a redemption price of 107.50% of the principal amount in respect of the 7.5% Senior Notes being redeemed, plus accrued and unpaid interest to the redemption date, provided, however, that if the 7.5% Senior Notes are redeemed, an aggregate principal amount of the 7.5% Senior Notes equal to at least 50% of the original aggregate principal amount of the 7.5% Senior Notes must remain outstanding immediately after each such redemption of the 7.5% Senior Notes.
14.875% Senior Unsecured Notes due 2020
The Company issued approximately $757 million aggregate principal amount (net of $30 million of original issue discount) of 14.875% Senior Notes under an Indenture, dated as of April 12, 2012 (the "14.875% Senior Notes Indenture"), among the Company, the Subsidiary Guarantors and Wilmington Trust, National Association, as Trustee to investment funds associated with Bain Capital Partners, LLC, Carlyle Investment Management, LLC and Clayton, Dubilier & Rice, LLC, the Equity Sponsors. The
109
Table of Contents
HD SUPPLY, INC.
NOTES TO CONSOLIDATED FINANCIAL STATEMENTS (Continued)
NOTE 6—DEBT (Continued)
14.875% Senior Notes bore interest at a rate of 14.875% per annum and were scheduled to mature on October 12, 2020. Interest was to be paid semi-annually in arrears on each April 12th and October 12th through maturity, commencing on October 12, 2012, except that the first eleven payment periods through October 2017 were to be paid in kind ("PIK") and therefore increase the balance of the outstanding indebtedness rather than paid in cash. On October 12, 2012, the Company made a PIK payment of $56 million, increasing the outstanding principal balance to approximately $813 million.
The Company was permitted to redeem the 14.875% Senior Notes, in whole or in part, at any time prior to April 12, 2015, at a price equal to 100% of the principal amount thereof, plus accrued and unpaid interest, if any, to the redemption date, plus the applicable make-whole premium set forth in the 14.875% Senior Notes Indenture. On February 1, 2013, the Company repurchased the 14.875% Senior Notes in accordance with the redemption provisions of the 14.875% Senior Notes Indenture.
10.5% Senior Subordinated Notes due 2021
The Company issued $950 million aggregate principal amount of 10.5% Senior Subordinated Notes due 2021 ("Senior Subordinated Notes") under an Indenture, dated as of January 16, 2013 ("Senior Subordinated Notes Indenture") among the Company, certain subsidiaries of the Company as guarantors (the "Subsidiary Guarantors") and the Trustee. The Senior Subordinated Notes bear interest at a rate of 10.5% per annum and will mature on January 15, 2021. Interest will be paid semi-annually in arrears on April 15th and October 15th of each year, commencing on April 15, 2013.
The Senior Subordinated Notes are unsecured senior subordinated indebtedness of the Company and rank subordinated in right of payment to all the Company's existing and future senior indebtedness, equal in right of payment with all of the Company's existing and future senior subordinated indebtedness, and effectively subordinated to all of the Company's existing and future secured indebtedness, including, without limitation, indebtedness under the Senior Credit Facilities, the First Priority Notes and the Second Priority Notes, to the extent of the value of the collateral securing such indebtedness.
The Senior Subordinated Notes are guaranteed, on an unsecured senior subordinated basis, by each of the Company's direct and indirect domestic existing and future subsidiaries that is a wholly owned domestic subsidiary (other than certain excluded subsidiaries), and by each other domestic subsidiary that is a borrower under the ABL Facility or that guarantees the Company's obligations under any credit facility or capital markets securities. These guarantees are subject to release under customary circumstances as stipulated in the Senior Subordinated Notes Indenture.
Redemption
The Company may redeem the Senior Subordinated Notes, in whole or in part, at any time (1) prior to January 15, 2016, at a price equal to 100% of the principal amount thereof, plus accrued and unpaid interest, if any, to the redemption date, plus the applicable make-whole premium set forth in the Senior Subordinated Notes Indenture and (2) on and after January 15, 2016, at the applicable redemption price set forth below (expressed as a percentage of principal amount), plus accrued and
110
Table of Contents
HD SUPPLY, INC.
NOTES TO CONSOLIDATED FINANCIAL STATEMENTS (Continued)
NOTE 6—DEBT (Continued)
unpaid interest, if any, to the relevant redemption date, if redeemed during the 12-month period commencing on January 15 of the years set forth below.
| | | | |
Year | | Percentage | |
|---|
2016 | | | 107.875 | % |
2017 | | | 105.250 | % |
2018 | | | 102.625 | % |
2019 and thereafter | | | 100.000 | % |
In addition, at any time after July 31, 2013 and on or before July 31, 2014, the Company may also redeem up to 100% of the aggregate principal amount of the Senior Subordinated Notes with funds in an equal aggregate amount not exceeding the aggregate proceeds of certain qualified public equity offerings at a redemption price (expressed as a percentage of principal amount) of (x) if such redemption occurs on or prior to January 31, 2014, 103% and (y) if such redemption occurs after January 31, 2014 and on or prior to July 31, 2014, 102%, in each case plus accrued and unpaid interest, if any, to the redemption date; provided, however, that if less than 100% of the Senior Subordinated Notes are to be redeemed in any qualified public offering redemption, at least 33.33% of the original aggregate principal amount of Senior Subordinated Notes must remain outstanding immediately after giving effect to such qualified public offering redemption.
In addition to the foregoing, at any time prior to January 15, 2016, the Company may redeem up to 35% of the aggregate principal amount of the Senior Subordinated Notes with the proceeds of certain equity offerings at a redemption price of 110.50% of the principal amount in respect of the Senior Subordinated Notes being redeemed, plus accrued and unpaid interest to the redemption date, provided, however, that if the Senior Subordinated Notes are redeemed, an aggregate principal amount of Senior Subordinated Notes equal to at least 50% (or 35% if any redemption in connection with certain qualified public equity offerings shall have been consummated) of the original aggregate principal amount of Senior Subordinated Notes must remain outstanding immediately after each such redemption of Senior Subordinated Notes.
First Priority Notes and Second Priority Notes (collectively the "Priority Notes"), 11.5% Senior Notes and 7.5% Senior Notes (collectively the "Senior Notes"), and Senior Subordinated Notes
Offer to Repurchase
In the event of certain events that constitute a Change of Control (as defined in the First Priority Indenture and Second Priority Indenture, collectively the "Priority Indentures," the 11.5% Senior Notes Indentures and the 7.5% Senior Notes Indentures, collectively the "Senior Indentures," and the Senior Subordinated Notes Indenture), the Company must offer to repurchase all of the Priority Notes, Senior Notes, and Senior Subordinated Notes (unless otherwise redeemed) at a price equal to 101% of their principal amount, plus accrued and unpaid interest, if any, to the repurchase date. If the Company sells assets under certain circumstances, the Company must use the proceeds to make an offer to purchase the Priority Notes, Senior Notes, and Senior Subordinated Notes at a price equal to 100% of their principal amount, plus accrued and unpaid interest, if any, to the date of purchase.
111
Table of Contents
HD SUPPLY, INC.
NOTES TO CONSOLIDATED FINANCIAL STATEMENTS (Continued)
NOTE 6—DEBT (Continued)
Covenants
The Priority Indentures, Senior Indentures, and Senior Subordinated Notes Indenture contain covenants that, among other things, limit the ability of the Company and its restricted subsidiaries to: incur more indebtedness; pay dividends, redeem stock or make other distributions; make investments; create restrictions on the ability of the Company's restricted subsidiaries to pay dividends to the Company or make other intercompany transfers; create liens securing indebtedness; transfer or sell assets; merge or consolidate; and enter into certain transactions with the Company's affiliates. Most of these covenants will cease to apply for so long as the Priority Notes, Senior Notes, and Senior Subordinated Notes have investment grade ratings from both Moody's Investment Services, Inc. and Standard & Poor's. The Company is in compliance with all such covenants.
Events of Default
The Priority Indentures, Senior Indentures, and Senior Subordinated Notes Indenture also provide for events of default, which, if any of them occurs, would permit or require the principal, premium, if any, interest and other monetary obligations on all the then outstanding Priority Notes, Senior Notes, and Senior Subordinated Notes to be due and payable immediately. The Priority Indentures, Senior Indentures, and Senior Subordinated Notes also provide for specified cross default and cross acceleration to other material indebtedness.
Registration Rights Agreements
The 11.5% Senior Notes and the guarantees have not been registered under the Securities Act of 1933, as amended (the "Securities Act"). The Company has agreed to make an offer to exchange the 11.5% Senior Notes for registered, publicly tradable notes that have substantially identical terms as the 11.5% Senior Notes within 270 days following the original issue date of the 11.5% Senior Notes. The Company is obligated to pay additional interest, up to a maximum additional interest rate of 0.50% per annum, on the 11.5% Senior Notes if the exchange offer has not been completed within 360 days following the original issue date of the 11.5% Senior Notes.
The Priority Notes and the guarantees have not been registered under the Securities Act. The Company has agreed to make an offer to exchange the Priority Notes for registered, publicly tradable notes that have substantially identical terms as the Priority Notes within 270 days following the original issue date of the Priority Notes. The Company is obligated to pay additional interest, up to a maximum additional interest rate of 0.50% per annum, on the Priority Notes if the exchange offer has not been completed within 360 days following the original issue date of the Priority Notes.
On January 31, 2013, the Company filed a registration statement on Form S-4/A with the SEC in accordance with the registration rights agreements relating to the 11.5% Senior Notes and Priority Notes. On January 31, 2013, the registration statement was declared effective by the SEC. See Note 17, Subsequent Events—Exchange Offers, for additional information regarding this exchange offer.
The Senior Subordinated Notes and the guarantees have not been registered under the Securities Act. The Company has agreed to make an offer to exchange the Senior Subordinated Notes for registered, publicly tradable notes that have substantially identical terms as the Senior Subordinated Notes within 270 days following the original issue date of the Senior Subordinated Notes. The Company is obligated to pay additional interest, up to a maximum additional interest rate of 0.50% per
112
Table of Contents
HD SUPPLY, INC.
NOTES TO CONSOLIDATED FINANCIAL STATEMENTS (Continued)
NOTE 6—DEBT (Continued)
annum, on the Senior Subordinated Notes if the exchange offer has not been completed within 360 days following the original issue date of the Senior Subordinated Notes.
On January 31, 2013, the Company filed a registration statement on Form S-4/A with the SEC in accordance with the registration rights agreements relating to the Senior Subordinated Notes. On January 31, 2013, the registration statement was declared effective by the SEC. See Note 17, Subsequent Events—Exchange Offers, for additional information regarding this exchange offer.
The 7.5% Senior Notes and the guarantees have not been registered under the Securities Act of 1933, as amended. The Company has agreed to make an offer to exchange the 7.5% Senior Notes for registered, publicly tradable notes that have substantially identical terms as the 7.5% Senior Notes within 270 days following the original issue date of the 7.5% Senior Notes. The Company is obligated to pay additional interest, up to a maximum additional interest rate of 0.50% per annum, on the 7.5% Senior Notes if the exchange offer has not been completed within 360 days following the original issue date of the 7.5% Senior Notes.
Old Senior Subordinated Notes
On August 30, 2007, the Company issued $1,300 million aggregate principal amount of Senior Subordinated Notes due 2015 bearing interest at a rate of 13.5% (the "Old Senior Subordinated Notes"). Interest payments were due each March 1st and September 1st through maturity except that the first eight payment periods through September 2011 were paid in kind ("PIK") and therefore increased the balance of the outstanding indebtedness rather than paid in cash.
On May 15, 2012, the Company repurchased $1 million aggregate principal of its Old Senior Subordinated Notes at a price of 97% plus accrued interest. On November 8, 2012, the Company redeemed $930 million aggregate principal of its outstanding Old Senior Subordinated Notes at a price of 103.375% plus $23 million of accrued interest. As of February 3, 2013, $889 million of the Company's Old Senior Subordinated Notes remained outstanding. On January 9, 2013, the Company issued a notice of redemption, subject to the required thirty-day notification period, to redeem all of the remaining $889 million aggregate principal outstanding of Old Senior Subordinated Notes. See Note 17, Subsequent Events—Debt Redemption.
Debt Maturities
Maturities of long-term debt outstanding, in principal amounts, at February 3, 2013 are summarized below (amounts in millions):
| | | | | | | | | | | | | | | | | | | | | | |
| | Fiscal Year | |
| |
| |
|---|
| | 2013(1) | | 2014 | | 2015 | | 2016 | | 2017 | | Thereafter | | Total | |
|---|
Principal maturities | | $ | 899 | | $ | 10 | | $ | 10 | | $ | 10 | | $ | 1,255 | | $ | 5,150 | | $ | 7,334 | |
- (1)
- Includes $889 million of the Company's Old Senior Subordinated Notes due 2015. On January 9, 2013, the Company issued a notice of redemption, subject to the required thirty-day notification period, to redeem all of the remaining $889 million outstanding Old Senior Subordinated Notes. See Note 17, Subsequent Events—Debt Redemption.
113
Table of Contents
HD SUPPLY, INC.
NOTES TO CONSOLIDATED FINANCIAL STATEMENTS (Continued)
NOTE 7—FAIR VALUE MEASUREMENTS
The fair value measurements and disclosure principles of U.S. GAAP (ASC 820, Fair Value Measurements and Disclosures) define fair value, establish a framework for measuring fair value and provide disclosure requirements about fair value measurements. These principles define a three-tier fair value hierarchy, which prioritizes the inputs used in measuring fair value as follows:
| | |
Level 1— | | Quoted prices (unadjusted) in active markets for identical assets or liabilities; |
Level 2— | | Quoted prices for similar assets or liabilities in active markets, quoted prices for identical or similar assets or liabilities in markets that are not active, and inputs (other than quoted prices) that are observable for the asset or liability, either directly or indirectly; |
Level 3— | | Unobservable inputs in which little or no market activity exists. |
The Company's financial instruments that are not reflected at fair value on the balance sheet were as follows (amounts in millions):
| | | | | | | | | | | | | |
| | As of February 3, 2013 | | As of January 29, 2012 | |
|---|
| | Recorded
Amount(1) | | Estimated
Fair Value(1) | | Recorded
Amount(1) | | Estimated
Fair Value(1) | |
|---|
ABL Facility | | $ | 300 | | $ | 292 | | $ | — | | $ | — | |
Term Loans and Notes | | | 7,034 | | | 7,573 | | | 5,462 | | | 5,070 | |
| | | | | | | | | | |
Total | | $ | 7,334 | | $ | 7,865 | | $ | 5,462 | | $ | 5,070 | |
| | | | | | | | | | |
- (1)
- These amounts do not include accrued interest; accrued interest is classified as Other current liabilities and Other liabilities in the accompanying Consolidated Balance Sheets. These amounts do not include any related discounts and premiums.
The Company utilized Level 2 inputs, as defined in the fair value hierarchy, to measure the fair value of the long-term debt. The Old Term Loans outstanding as of January 29, 2012 were guaranteed by Home Depot. Therefore, management's estimates of fair value for the Old Term Loans were based on a review of the fair value of debt issued by companies with similar credit ratings as Home Depot. For all of the Company's other debt instruments, management's fair value estimates were based on recent similar credit facilities initiated by companies with like credit quality in similar industries, quoted prices for similar instruments, and inquiries with certain investment communities.
NOTE 8—INCOME TAXES
The components of Income (Loss) from Continuing Operations before Provision (Benefit) for Income Taxes are as follows (amounts in millions):
| | | | | | | | | | |
| | Fiscal Year Ended | |
|---|
| | February 3, 2013 | | January 29, 2012 | | January 30, 2011 | |
|---|
United States | | $ | (1,210 | ) | $ | (503 | ) | $ | (606 | ) |
Foreign | | | 14 | | | 19 | | | 21 | |
| | | | | | | | |
Total | | $ | (1,196 | ) | $ | (484 | ) | $ | (585 | ) |
| | | | | | | | |
114
Table of Contents
HD SUPPLY, INC.
NOTES TO CONSOLIDATED FINANCIAL STATEMENTS (Continued)
NOTE 8—INCOME TAXES (Continued)
The Provision (Benefit) for Income Taxes consisted of the following (amounts in millions):
| | | | | | | | | | |
| | Fiscal Year Ended | |
|---|
| | February 3, 2013 | | January 29, 2012 | | January 30, 2011 | |
|---|
Current: | | | | | | | | | | |
Federal | | $ | — | | $ | — | | $ | — | |
State | | | 3 | | | 3 | | | 2 | |
Foreign | | | 2 | | | — | | | 6 | |
| | | | | | | | |
| | | 5 | | | 3 | | | 8 | |
Deferred: | | | | | | | | | | |
Federal | | | (3 | ) | | 64 | | | 12 | |
State | | | (1 | ) | | 6 | | | 4 | |
Foreign | | | — | | | (5 | ) | | 4 | |
Foreign realization of tax deductible goodwill from prior acquisitions | | | 2 | | | 11 | | | — | |
| | | | | | | | |
| | | (2 | ) | | 76 | | | 20 | |
| | | | | | | | |
Total | | $ | 3 | | $ | 79 | | $ | 28 | |
| | | | | | | | |
The Company's combined federal, state and foreign effective tax rate for continuing operations for fiscal 2012, fiscal 2011, and fiscal 2010 was approximately (0.2%), (16.4%), and (4.8%), respectively.
The Company's effective tax rate will vary based on a variety of factors, including overall profitability, the geographical mix of income before taxes and the related tax rates in the jurisdictions where it operates, restructuring and other one-time charges, as well as discrete events, such as settlements of future audits. The Company's fiscal 2012, fiscal 2011 and fiscal 2010 effective tax rates were significantly impacted by the recording of a valuation allowance on its net U.S. deferred tax assets. The fiscal 2012 and fiscal 2011 valuation allowance was directly impacted by the increasing of the deferred tax liability for U.S. goodwill amortization for tax purposes. The deferred tax liability related to the Company's U.S. tax deductible goodwill must be considered as a liability related to an asset with an indefinite life. Therefore, the deferred tax liability does not amortize and is not available as a source of taxable income to support the realization of deferred tax assets created by other deductible temporary timing differences.
The fiscal 2012 effective tax rate was also impacted by the goodwill impairment of an indefinite life intangible asset for book purposes. The fiscal 2012 goodwill impairment created a deferred tax asset which reduced the fiscal 2012 tax expense by decreasing the deferred tax liability associated with indefinite life intangibles which prior to the impairment could not serve as a source of taxable income. In addition, the tax expense for fiscal 2012 was also reduced by an adjustment to the Company's valuation allowance as a result of the acquisition of additional deferred tax liabilities in conjunction with the Peachtree acquisition.
115
Table of Contents
HD SUPPLY, INC.
NOTES TO CONSOLIDATED FINANCIAL STATEMENTS (Continued)
NOTE 8—INCOME TAXES (Continued)
The reconciliation of the provision (benefit) for income taxes from continuing operations at the federal statutory rate of 35% to the actual tax provision (benefit) for fiscal 2012, fiscal 2011, and fiscal 2010 is as follows (amounts in millions):
| | | | | | | | | | |
| | Fiscal Year Ended | |
|---|
| | February 3, 2013 | | January 29, 2012 | | January 30, 2011 | |
|---|
Income taxes at federal statutory rate | | $ | (419 | ) | $ | (169 | ) | $ | (205 | ) |
State income taxes, net of federal income tax benefit | | | (53 | ) | | (24 | ) | | (15 | ) |
Non-deductible goodwill impairment | | | 17 | | | — | | | — | |
Non-deductible interest | | | 14 | | | 15 | | | 13 | |
Valuation allowance | | | 442 | | | 259 | | | 228 | |
Adjustments to tax reserves | | | (1 | ) | | 12 | | | 4 | |
Other, net | | | 3 | | | (14 | ) | | 3 | |
| | | | | | | | |
Total provision (benefit) | | $ | 3 | | $ | 79 | | $ | 28 | |
| | | | | | | | |
116
Table of Contents
HD SUPPLY, INC.
NOTES TO CONSOLIDATED FINANCIAL STATEMENTS (Continued)
NOTE 8—INCOME TAXES (Continued)
The tax effects of temporary differences that give rise to significant portions of the deferred tax assets and deferred tax liabilities as of February 3, 2013 and January 29, 2012 were as follows (amounts in millions):
| | | | | | | |
| | February 3, 2013 | | January 29, 2012 | |
|---|
Current: | | | | | | | |
Deferred Tax Assets: | | | | | | | |
Interest | | $ | 131 | | $ | 33 | |
Allowance for doubtful accounts | | | 9 | | | 12 | |
Inventory | | | 37 | | | 49 | |
Accrued compensation | | | 1 | | | 3 | |
Accrued self-insurance liabilities | | | 5 | | | 5 | |
Restructuring liabilities | | | 4 | | | 7 | |
Other accrued liabilities | | | 23 | | | 27 | |
Valuation allowance | | | (167 | ) | | (76 | ) |
| | | | | | |
Current deferred tax assets | | | 43 | | | 60 | |
Deferred Tax Liabilities: | | | | | | | |
Prepaid expense | | $ | (1 | ) | $ | (1 | ) |
| | | | | | |
Current deferred tax liabilities | | | (1 | ) | | (1 | ) |
Noncurrent: | | | | | | | |
Deferred Tax Assets: | | | | | | | |
Interest | | $ | — | | $ | 236 | |
Accrued compensation | | | 33 | | | 27 | |
Accrued self-insurance liabilities | | | 13 | | | 15 | |
Other accrued liabilities | | | 7 | | | 8 | |
Deferred revenue | | | 8 | | | 8 | |
Restructuring liabilities | | | 29 | | | 32 | |
Net operating loss | | | 830 | | | 374 | |
Net capital loss carryforward | | | — | | | 10 | |
Fixed assets | | | 23 | | | 16 | |
Other | | | 22 | | | 21 | |
Valuation allowance | | | (758 | ) | | (415 | ) |
| | | | | | |
Noncurrent deferred tax assets | | | 207 | | | 332 | |
Deferred Tax Liabilities: | | | | | | | |
Deferred Financing Costs | | $ | (8 | ) | $ | (24 | ) |
Software costs | | | (25 | ) | | (23 | ) |
Intangible assets | | | (193 | ) | | (316 | ) |
Income from discharge of indebtedness | | | (80 | ) | | (80 | ) |
| | | | | | |
Noncurrent deferred tax liabilities | | | (306 | ) | | (443 | ) |
| | | | | | |
Deferred tax assets (liabilities), net | | $ | (57 | ) | $ | (52 | ) |
| | | | | | |
The Company reported $6 million of long-term deferred tax assets related to its Canadian business within other assets on its balance sheet.
117
Table of Contents
HD SUPPLY, INC.
NOTES TO CONSOLIDATED FINANCIAL STATEMENTS (Continued)
NOTE 8—INCOME TAXES (Continued)
In fiscal 2012, the Company recorded a valuation allowance on its total U.S. operations of $434 million of which $442 million related to continuing operations which was reduced by $8 million for discontinued operations. In fiscal 2011, the Company recorded a valuation allowance on its total U.S. operations of $252 million of which $259 million related to continuing operations which was reduced by $7 million for discontinued operations. In fiscal 2010, the Company recorded a valuation allowance on its total U.S. operations of $230 million of which $228 million related to continuing operations and $2 million related to discontinued operations. The Company records a valuation allowance when it is "more likely than not" that some portion or all of the deferred income tax assets will not be realized. In reaching this determination, the Company considers the future reversals of taxable temporary differences, future taxable income, exclusive of taxable temporary differences and carryforwards, taxable income in prior carryback years and tax planning strategies.
During the first quarter of fiscal 2010, the Company designated the undistributed earnings of certain aspects of its foreign operations as not permanently reinvested. In fiscal 2012, the Company repatriated $29 million of cash which resulted in $3 million of income tax expense in the U.S. In fiscal 2011, the Company did not repatriate cash from its foreign operations to the U.S. If the company had repatriated cash to the U.S., no additional income tax expense would have been generated. In fiscal 2010, the Company repatriated $33 million of cash which resulted in $2 million of income tax expense in the U.S. In general, to the extent the Company's financial reporting book basis over tax basis of a foreign subsidiary exceeds the cash available for repatriation, deferred taxes have not been provided for, as they are essentially permanent in duration. If these amounts were not considered reinvested, it is estimated that no additional deferred taxes would have been provided for.
As of February 3, 2013, the Company has tax-effected U.S. federal net operating loss carryforwards of $636 million which expire beginning in fiscal 2029. The Company also has $158 million of tax effected state net operating loss carryfowards which expire in various years between fiscal 2013 and fiscal 2030. During fiscal 2012, the Company generated a capital gain from the sale of the IPVF business. The capital gain allowed the Company to fully utilize the fiscal 2011 capital loss carryforward of $10 million associated with the Company's exit from the Plumbing business. The future utilization of the Company's net operating loss carryforwards could be limited if the Company experiences an "ownership change," as defined in Section 382 of the Internal Revenue Code of 1986, as amended. In general, an ownership change may result from transactions increasing the aggregate ownership of certain persons (or groups of persons) in the Company's stock by more than 50 percentage points over a testing period (generally 3 years).
There was no net income tax benefit or expense included in discontinued operations in fiscal 2012, fiscal 2011 or fiscal 2010.
Federal, state and foreign income taxes net receivable (payable) total zero and $4 million as of February 3, 2013 and January 29, 2012, respectively.
Accounting for uncertain tax positions
The Company follows the U.S. GAAP guidance for uncertain tax positions within ASC 740, Income Taxes. ASC 740 requires application of a "more likely than not" threshold to the recognition and de-recognition of tax positions. It further requires that a change in judgment related to prior years' tax positions be recognized in the quarter of such change. A reconciliation of the beginning and ending
118
Table of Contents
HD SUPPLY, INC.
NOTES TO CONSOLIDATED FINANCIAL STATEMENTS (Continued)
NOTE 8—INCOME TAXES (Continued)
amount of unrecognized tax benefits for continuing operations for fiscal 2012, fiscal 2011, and fiscal 2010 is as follows (amounts in millions):
| | | | | | | | | | |
| | Fiscal Year Ended | |
|---|
| | February 3,
2013 | | January 29,
2012 | | January 30,
2011 | |
|---|
Unrecognized Tax Benefits beginning of period | | $ | 196 | | $ | 192 | | $ | 190 | |
Gross increases for tax positions in current period | | | — | | | — | | | 1 | |
Gross increases for tax positions in prior period | | | 2 | | | 6 | | | 4 | |
Gross decreases for tax positions in prior period | | | 0 | | | — | | | — | |
Settlements | | | (1 | ) | | (1 | ) | | (3 | ) |
Lapse of statutes | | | (4 | ) | | (1 | ) | | — | |
| | | | | | | | |
Unrecognized Tax Benefits end of period | | $ | 193 | | $ | 196 | | $ | 192 | |
| | | | | | | | |
There are $193 million, $196 million, and $192 million of unrecognized tax benefits included in the balance at February 3, 2013, January 29, 2012, and January 30, 2011, respectively, whose resolution could affect the annual effective income tax rate.
The Company accrued $3 million, $5 million, and $2 million of net interest and penalties related to unrecognized tax benefits for fiscal 2012, fiscal 2011, and fiscal 2010, respectively. The Company's ending net accrual for interest and penalties related to unrecognized tax benefits at February 3, 2013, January 29, 2012, and January 30, 2011 was $22 million, $19 million, and $14 million, respectively. The Company's accounting policy is to classify interest and penalties as components of income tax expense. Accrued interest and penalties from unrecognized tax benefits are included as a component of other liabilities on the Consolidated Balance Sheet.
The Company is subject to audits and examinations of its tax returns by tax authorities in various jurisdictions, including the Internal Revenue Service ("IRS"). Management regularly assesses the likelihood of adverse outcomes resulting from these examinations to determine the adequacy of provisions for income taxes. Certain of the Company's tax years 2006 and forward remain open for audit by the IRS and various state governments. The Company does not anticipate any significant changes in its unrecognized tax benefits over the next twelve months.
See Note 13, Commitments and Contingencies, for discussion on the IRS audit of the Company's U.S. federal income tax returns.
NOTE 9—STOCK-BASED COMPENSATION AND EMPLOYEE BENEFIT PLANS
Stock-Based Compensation Plan
Effective December 4, 2007, HD Supply Holdings, Inc. ("Holding") established a Stock Incentive Plan (the "HDS Plan") for associates of HD Supply, a wholly-owned subsidiary. The HDS Plan provides for the award of non-qualified stock options and deferred share units of the common stock of Holding. Holding will issue new shares of common stock to satisfy options exercised.
119
Table of Contents
HD SUPPLY, INC.
NOTES TO CONSOLIDATED FINANCIAL STATEMENTS (Continued)
NOTE 9—STOCK-BASED COMPENSATION AND EMPLOYEE BENEFIT PLANS (Continued)
Under the terms of the HDS Plan, non-qualified stock options are to carry exercise prices at, or above, the fair market value of Holding's stock on the date of the grant. Since Holding common stock is not publicly traded, the fair market value of the stock is determined by the Board of Directors of Holding based on such factors as it deems appropriate, including but not limited to the earnings and other financial and operating information of the Company in recent periods, the potential value of the Company as a whole, the future prospects of the Company and the industries in which it competes, the history and management of the Company, the general condition of the securities markets, the fair market value of securities of companies engaged in businesses similar to those of the Company, and any recent valuation of the common stock of Holding that shall have been performed by an independent valuation firm (although the Board of Directors of Holding is not obligated to obtain such a valuation). The non-qualified stock options generally vest at the rate of 20% per year commencing on the first anniversary date of the grant or 100% on the third anniversary of the grant and expire on the tenth anniversary date of the grant. The Company made a one-time grant in April 2011 of 10.6 million options with an exercise price of $4.15 that vests in its entirety on the three-year anniversary of the grant.
On January 15, 2010, the Company initiated a one-time stock option exchange program ("Option Exchange Program"). Under the Option Exchange Program, all participants of the HDS Plan were offered the opportunity to exchange their outstanding options (the "Eligible Options") to purchase shares of Holding's common stock (the "Common Stock") granted under the HDS Plan for a lesser number of new options (as determined in accordance with the exchange ratios below) under the HDS Plan.
The Option Exchange Program covered all options that were outstanding under the HDS Plan, including vested and unvested options, at the time of the offer. Eligible Options that had an exercise price greater than $10.00 per share were offered for exchange for a lesser number of options with a new exercise price equal to $4.15 per share (the "Repriced Options"). For every three Eligible Options with an exercise price greater than $10.00 per share, an eligible employee was offered two new Repriced Options. Options that had an exercise price equal to $10.00 per share were offered for exchange for an equal number of options with an exercise price equal to $10.00 per share (the "New $10.00 Options", and together with the Repriced Options, the "New Options").
Regardless of the vesting status of the Eligible Options, the New Options have a five-year vesting period, with 20% of the New Options vesting on each anniversary of the date of exchange and an expiration date that is ten years from the date of exchange. All of the New Options are subject to the terms and conditions of the HDS Plan and the eligible employee's new stock option agreement.
The offering period for the Option Exchange Program commenced on January 15, 2010 and expired on February 2, 2010. Participation in the Option Exchange Program was voluntary. However, once an eligible employee elected to participate, all of his or her Eligible Options were exchanged. Once the offer to exchange expired, all Eligible Options that were surrendered for exchange were cancelled and the New Options were granted.
120
Table of Contents
HD SUPPLY, INC.
NOTES TO CONSOLIDATED FINANCIAL STATEMENTS (Continued)
NOTE 9—STOCK-BASED COMPENSATION AND EMPLOYEE BENEFIT PLANS (Continued)
On February 3, 2010, as a result of employee elections under the Option Exchange Program, the Company exchanged and issued the following options:
| | | | |
Number of Eligible Options Exchanged | | | 20,484,001 | |
Number of Repriced Options issued in the Option Exchange Program | | | 6,828,025 | |
Number of New $10.00 Options issued in the Option Exchange
Program | | | 10,242,002 | |
As a result of the exchange, the Company will incur incremental stock-based compensation charges of approximately $1 million per year over the five years following the exchange date. The maximum number of shares of common stock that may be issued under the HDS Plan subsequent to the Option Exchange Program may not exceed 55.6 million, of which a maximum of 30.9 million shares may be issued in respect of options granted under the HDS Plan.
A summary of option activity under the HDS Plan is presented below (shares in thousands):
| | | | | | | |
| | Number of Shares | | Weighted Average Option Price | |
|---|
Outstanding at January 31, 2010 | | | 20,899 | | $ | 13.13 | |
| | | | | | |
Granted(1) | | | 21,495 | | | 7.66 | |
Exercised | | | — | | | — | |
Canceled(2) | | | (23,927 | ) | | 12.41 | |
| | | | | | |
Outstanding at January 30, 2011 | | | 18,467 | | $ | 7.69 | |
| | | | | | |
Granted | | | 12,485 | | | 4.62 | |
Exercised | | | — | | | — | |
Canceled | | | (1,415 | ) | | 6.63 | |
| | | | | | |
Outstanding at January 29, 2012 | | | 29,537 | | $ | 6.44 | |
| | | | | | |
Granted | | | 1,894 | | | 8.09 | |
Exercised | | | (49 | ) | | 7.34 | |
Canceled | | | (1,746 | ) | | 7.34 | |
| | | | | | |
Outstanding at February 3, 2013 | | | 29,636 | | $ | 6.50 | |
| | | | | | |
- (1)
- Includes shares granted in conjunction with the Option Exchange Program
- (2)
- Includes shares canceled in conjunction with the Option Exchange Program
As of February 3, 2013, there were approximately 29.6 million stock options outstanding with a weighted average remaining life of 7.7 years. As of February 3, 2013, there were approximately 6.9 million options exercisable with a weighted average exercise price of $7.72 and a weighted average remaining life of 7.1 years.
The estimated fair value of the options when granted is amortized to expense over the options' vesting or required service period. The fair value for these options was estimated by management, after considering a third-party valuation specialist's assessment, at the date of grant based on the expected
121
Table of Contents
HD SUPPLY, INC.
NOTES TO CONSOLIDATED FINANCIAL STATEMENTS (Continued)
NOTE 9—STOCK-BASED COMPENSATION AND EMPLOYEE BENEFIT PLANS (Continued)
life of the option and historical exercise experience, using a Black-Scholes option pricing model with the following weighted-average assumptions:
| | | | | | | | | | |
| | Fiscal Year Ended | |
|---|
| | February 3,
2013 | | January 29,
2012 | | January 30,
2011 | |
|---|
Risk-free interest rate | | | 1.1 | % | | 2.8 | % | | 3.0 | % |
Dividend yield | | | 0.0 | % | | 0.0 | % | | 0.0 | % |
Expected volatility factor | | | 47.6 | % | | 46.0 | % | | 48.9 | % |
Expected option life in years | | | 6.5 | | | 6.6 | | | 6.8 | |
The risk free interest rate was determined based on an analysis of U.S. Treasury zero-coupon market yields as of the date of the option grant for issues having expiration lives similar to the expected option life. The expected volatility was based on an analysis of the historical volatility of HD Supply's competitors over the expected life of the HD Supply options. These volatilities were weighted by the respective HD Supply segment against which they compete, resulting in an overall industry-based volatility for HD Supply. As insufficient data exists to determine the historical life of options issued under the HDS Plan, the expected option life was determined based on the vesting schedule of the options and their contractual life taking into consideration the expected time in which the share price of Holding would exceed the exercise price of the option. The weighted-average fair value of each option granted during fiscal 2012, fiscal 2011, and fiscal 2010 was $2.41, $1.99, and $1.64, respectively. HD Supply recognized $16 million, $20 million, and $17 million of stock-based compensation expense related to stock options, included in Selling, general and administrative expense in the Consolidated Statements of Operations and Comprehensive Income (Loss), during fiscal 2012, fiscal 2011, and fiscal 2010, respectively. As of February 3, 2013 the unamortized compensation expense related to stock options was $20 million and was expected to be recognized over a period of 4.8 years.
Employee Benefit Plans
HD Supply offers a comprehensive Health & Welfare Benefits Program which allows employees who satisfy certain eligibility requirements to choose among different levels and types of coverage. The Health & Welfare Benefits program provides employees healthcare coverage in which the employer and employee share costs. In addition, the Program offers employees the opportunity to participate in various voluntary coverages, including flexible spending accounts.
HD Supply maintains a 401(k) defined contribution plan that is qualified under Sections 401(a) and 501(a) of the Internal Revenue Code. Employees who satisfy the plan's eligibility requirements may elect to contribute a portion of their compensation to the plan on a pre-tax basis. HD Supply may match a percentage of the employees' contributions to the plan based on approval from the Board of Directors. Matching contributions are generally made shortly after the end of each pay period or after the Company's fiscal year-end if an additional annual matching contribution based on the Company's fiscal-year financial results is approved. HD Supply paid $15 million, $7 million, and less than $1 million during fiscal 2012, fiscal 2011, and fiscal 2010, respectively.
122
Table of Contents
HD SUPPLY, INC.
NOTES TO CONSOLIDATED FINANCIAL STATEMENTS (Continued)
NOTE 10—STOCKHOLDER'S EQUITY
Common Stock
The Company is authorized to issue 1,000 shares of common stock, par value $0.01 per share. As of February 3, 2013 and January 29, 2012, 1,000 shares were issued and outstanding.
Accumulated Other Comprehensive Income (Loss)
On both February 3, 2013 and January 29, 2012, accumulated other comprehensive income (loss) is comprised of $(2) million of cumulative foreign currency translation adjustments, net.
NOTE 11—SUPPLEMENTAL BALANCE SHEET AND CASH FLOW INFORMATION
Receivables
Receivables as of February 3, 2013 and January 29, 2012 consisted of the following (amounts in millions):
| | | | | | | |
| | February 3,
2013 | | January 29,
2012 | |
|---|
Trade receivables, net of allowance for doubtful accounts | | $ | 926 | | $ | 919 | |
Vendor rebate receivables | | | 66 | | | 71 | |
Other receivables | | | 16 | | | 12 | |
| | | | | | |
Total receivables, net | | $ | 1,008 | | $ | 1,002 | |
| | | | | | |
Property and Equipment
Property and equipment as of February 3, 2013 and January 29, 2012 consisted of the following (amounts in millions):
| | | | | | | |
| | February 3,
2013 | | January 29,
2012 | |
|---|
Land | | $ | 37 | | $ | 42 | |
Buildings and improvements | | | 201 | | | 206 | |
Transportation equipment | | | 60 | | | 44 | |
Furniture, fixtures and equipment | | | 301 | | | 298 | |
Capitalized software | | | 208 | | | 185 | |
Construction in progress | | | 38 | | | 40 | |
| | | | | | |
| | | 845 | | | 815 | |
Less accumulated depreciation & amortization | | | (450 | ) | | (417 | ) |
| | | | | | |
Property and equipment, net | | $ | 395 | | $ | 398 | |
| | | | | | |
123
Table of Contents
HD SUPPLY, INC.
NOTES TO CONSOLIDATED FINANCIAL STATEMENTS (Continued)
NOTE 11—SUPPLEMENTAL BALANCE SHEET AND CASH FLOW INFORMATION (Continued)
Other Current Liabilities
Other current liabilities as of February 3, 2013 and January 29, 2012 consisted of the following (amounts in millions):
| | | | | | | |
| | February 3,
2013 | | January 29,
2012 | |
|---|
Accrued interest | | $ | 147 | | $ | 233 | |
Accrued non-income taxes | | | 34 | | | 31 | |
Branch closure & consolidation reserves | | | 7 | | | 16 | |
Other | | | 103 | | | 98 | |
| | | | | | |
Total other current liabilities | | $ | 291 | | $ | 378 | |
| | | | | | |
Significant Non-Cash Transactions
Interest payments on the 14.875% Senior Notes were due each April 12th and October 12th through maturity, commencing on October 12, 2012, except that the first eleven payment periods through October 2017 should be paid in kind ("PIK") and therefore increase the balance of the outstanding indebtedness rather than paid in cash. The Company made non-cash PIK interest payments during fiscal 2012 of $56 million, increasing the outstanding principal balance of the 14.875% Senior Notes.
Interest payments on the Old Senior Subordinated Notes were due each March 1st and September 1st through maturity except that the first eight payment periods through September 2011 were paid in kind. The Company made non-cash PIK interest payments during fiscal 2011 and fiscal 2010 of $223 million and $196 million, respectively, increasing the outstanding balance of the Old Senior Subordinated Notes.
Supplemental Cash Flow Information
Cash paid for interest in fiscal 2012, fiscal 2011, and fiscal 2010 was approximately $621 million, $356 million, and $363 million, respectively. Additionally, during fiscal 2012, the Company paid $502 million of original issue discounts and PIK interest related to the extinguishment of all of the 14.875% Senior Notes and $930 million of Old Senior Subordinated Notes.
During fiscal 2010, as a result of tax legislation regarding net operating loss carryback periods, the Company filed for and received a cash refund of $220 million from the Internal Revenue Service for income tax previously paid. Cash paid for income taxes, net of refunds, in fiscal 2012, fiscal 2011, and fiscal 2010 was approximately $1 million net payment, $5 million net payment, and $216 million net refund, respectively.
NOTE 12—BRANCH CLOSURE AND CONSOLIDATION ACTIVITIES
Concurrent with the Transactions and acquisition integration, management evaluated the operations and performance of individual branches and identified branches for closure or consolidation. In addition, during fiscal years 2008 and 2009, management initiated additional plans to restructure its business, which included evaluating opportunities to consolidate branches, reduce costs, more efficiently employ working capital and streamline activities. Under these plans, which were completed in fiscal 2010, management closed or consolidated 235 branches and reduced workforce personnel by
124
Table of Contents
HD SUPPLY, INC.
NOTES TO CONSOLIDATED FINANCIAL STATEMENTS (Continued)
NOTE 12—BRANCH CLOSURE AND CONSOLIDATION ACTIVITIES (Continued)
approximately 5,000 employees. The Company does not expect to incur additional restructuring charges under these plans.
The remaining liability balances for these plans represents the net present value of future lease obligations, including rent, taxes, utilities, etc., less estimated sublease income of the closed branches. The Company regularly reviews the assumptions used to estimate these liabilities.
The following table presents the activity for the liability balances, included in Other current liabilities and Other liabilities in the Consolidated Balance Sheets (amounts in millions):
| | | | | | | | | | | | | |
| | Severance | | Occupancy
Costs | | Other | | Total | |
|---|
Balance—January 31, 2010 | | $ | 3 | | $ | 66 | | $ | 2 | | $ | 71 | |
| | | | | | | | | | |
Charges, net of reductions | | | 2 | | | 4 | | | 2 | | | 8 | |
Cash payments | | | (4 | ) | | (21 | ) | | (2 | ) | | (27 | ) |
Other | | | (1 | ) | | 2 | | | — | | | 1 | |
| | | | | | | | | | |
Balance—January 30, 2011 | | $ | — | | $ | 51 | | $ | 2 | | $ | 53 | |
| | | | | | | | | | |
Charges, net of reductions | | | — | | | 2 | | | — | | | 2 | |
Cash payments | | | — | | | (13 | ) | | (2 | ) | | (15 | ) |
| | | | | | | | | | |
Balance—January 29, 2012 | | $ | — | | $ | 40 | | $ | — | | $ | 40 | |
| | | | | | | | | | |
Charges, net of reductions | | | — | | | (4 | ) | | — | | | (4 | ) |
Cash payments | | | — | | | (14 | ) | | — | | | (14 | ) |
Other | | | — | | | (1 | ) | | — | | | (1 | ) |
| | | | | | | | | | |
Balance—February 3, 2013 | | $ | — | | $ | 21 | | $ | — | | $ | 21 | |
| | | | | | | | | | |
As of February 3, 2013, approximately $7 million of the liability balances for the branch closure and consolidation activities is classified as a current liability on the Company's Consolidated Balance Sheet. Payments for occupancy costs are expected to be substantially complete over the next five years, with certain property lease obligations extending out as far as eleven years. The Company regularly reviews the assumptions used to estimate the net present value of the on-going lease liabilities and other occupancy costs, net of expected sublease income. In addition, the Company continues to actively pursue buyout options or subleasing opportunities for the leased properties. The expected timing of cash payments related to the branch closure and consolidation activities could change or adjustments to the reserve may become necessary depending on the success and timing of entering into these types of agreements. Due to favorable lease and property dispositions, during fiscal 2012, the Company reduced the liability by $4 million, $2 million of which was recorded to continuing operations and $2 million of which was recorded as Income from discontinued operations, net in the Consolidated Statement of Operations and Comprehensive Income (Loss).
NOTE 13—COMMITMENTS AND CONTINGENCIES
Lease Commitments
HD Supply occupies certain facilities and operates certain equipment and vehicles under leases that expire at various dates through the year 2026. In addition to minimum rentals, there are certain executory costs such as real estate taxes, insurance, and common area maintenance on most of its facility leases. Expense under these leases totaled $132 million, $144 million, and $146 million in fiscal 2012, fiscal 2011, and fiscal 2010, respectively. Capital leases currently in effect are not material.
125
Table of Contents
HD SUPPLY, INC.
NOTES TO CONSOLIDATED FINANCIAL STATEMENTS (Continued)
NOTE 13—COMMITMENTS AND CONTINGENCIES (Continued)
Future minimum aggregate rental payments under non-cancelable operating leases as of February 3, 2013 are as follows (amounts in millions):
| | | | | | | | | | | | | | | | | | | | | | |
| | Fiscal Year | |
| |
| |
|---|
| | 2013 | | 2014 | | 2015 | | 2016 | | 2017 | | Thereafter | | Total | |
|---|
Operating Leases | | $ | 123 | | $ | 101 | | $ | 79 | | $ | 59 | | $ | 39 | | $ | 81 | | $ | 482 | |
The Company subleases certain leased facilities to third parties. Total future minimum rentals to be received under non-cancelable subleases as of February 3, 2013 are approximately $18 million. These subleases expire at various dates through the year 2023.
Purchase Obligations
As of February 3, 2013, the Company has agreements in place with various vendors to purchase goods and services, primarily inventory, in the aggregate amount of $684 million. These purchase obligations are generally cancelable, but the Company has no intent to cancel. Payment is due during fiscal 2013 for these obligations.
Internal Revenue Service
HD Supply carried back tax net operating losses ("NOL") from its tax years ended on February 3, 2008 and February 1, 2009 to tax years during which it was a member of Home Depot's U.S. federal consolidated tax group. As a result of those NOL carrybacks, Home Depot received cash refunds from the IRS in the amount of approximately $354 million. Under an agreement (the "Agreement") between Holding and Home Depot, Home Depot paid HD Supply the refund proceeds resulting from the NOL carrybacks.
In connection with an audit of the Company's U.S. federal income tax returns filed for the tax years ended on February 3, 2008 and February 1, 2009, the IRS has disallowed certain deductions claimed by the Company. In May 2012, the IRS issued a formal Revenue Agent's Report ("RAR") challenging approximately $299 million (excluding interest) of the cash refunds resulting from HD Supply's NOL carrybacks. In January 2013, the IRS issued a revised RAR reducing the challenge to approximately $131 million (excluding interest) of cash refunds from HD Supply's carrybacks. The issuance of the January 2013 revised RAR formally revoked the original May 2012 RAR and reduced the amount of cash refunds the IRS is currently challenging by $168 million. As of February 3, 2013, the Company estimates the interest to which the IRS would be entitled, if successful in all claims, to be approximately $14 million. If the IRS is ultimately successful with respect to the proposed adjustments, pursuant to the terms of the Agreement, the Company would be required to reimburse Home Depot an amount equal to the disallowed refunds plus related interest. If the IRS is successful in defending its positions with respect to the disallowed deductions, certain of those disallowed deductions may be available to the Company in the form of increases in its deferred tax assets by approximately $63 million before any valuation allowance.
The Company believes that its positions with respect to the deductions and the corresponding NOL carrybacks are supported by, and consistent with, applicable tax law. In collaboration with Home Depot, HD Supply has challenged the proposed adjustments by filing a formal protest with the Office of Appeals Division within the IRS. During the administrative appeal period and as allowed under
126
Table of Contents
HD SUPPLY, INC.
NOTES TO CONSOLIDATED FINANCIAL STATEMENTS (Continued)
NOTE 13—COMMITMENTS AND CONTINGENCIES (Continued)
statute, the Company intends to vigorously defend its positions rather than pay any amount related to the proposed adjustments. In the event of an unfavorable outcome at the Office of Appeals, the Company will strongly consider litigating the matter in U.S. Tax Court. The unpaid assessment would continue to accrue interest at the statutory rate until resolved. If the Company is ultimately required to pay a significant amount related to the proposed adjustments to Home Depot pursuant to the terms of the Agreement (or to the IRS), the Company's cash flows, future results of operations and financial positions could be affected in a significant and adverse manner.
See Note 8, Income Taxes, for further disclosures on the Company's income taxes.
Legal Matters
HD Supply is involved in various legal proceedings arising in the normal course of its business. The Company establishes reserves for litigation and similar matters when those matters present loss contingencies that it determines to be both probable and reasonably estimable in accordance with ASC 450, Contingencies. In the opinion of management, based on current knowledge, all reasonably estimable and probable matters are believed to be adequately reserved for or covered by insurance and disclosed herein. For all such other matters, management believes the possibility of losses from such matters are remote or such matters are of such kind or involve such amounts that would not have a material adverse effect on the financial position, results of operations or cash flows of the Company if disposed of unfavorably.
The Company has been informed that the Office of the United States Attorney for the Northern District of New York is conducting an investigation related to the activities of certain disadvantaged business enterprises. In May of 2011, in connection with that investigation, the government executed a search of an entity from which Waterworks purchased assets shortly before the search was executed. On June 20, 2012, in connection with that same investigation, the government executed search warrants at two Waterworks branches. The Company was updated by the government on its investigation in March 2013 and continues to cooperate with the investigation. While the Company cannot predict the outcome, it believes a potential loss on this matter is reasonably possible but due to the current state of the investigation it is not able to estimate a range of potential loss.
NOTE 14—SEGMENT INFORMATION
HD Supply's operating segments are based on management structure and internal reporting. Each segment offers different products and services to the end customer, except for Corporate and Other, which provides general corporate overhead support and HD Supply Canada (included in Corporate and Other), which is organized based on geographic location. The Company determines the reportable segments in accordance with the principles of segment reporting within U.S. GAAP (ASC 280, Segment Reporting). For purposes of evaluation under these segment reporting principles, the Chief Operating Decision Maker for HD Supply assesses HD Supply's ongoing performance, based on the periodic review and evaluation of Net sales, Adjusted EBITDA, and certain other measures for each of the operating segments.
127
Table of Contents
HD SUPPLY, INC.
NOTES TO CONSOLIDATED FINANCIAL STATEMENTS (Continued)
NOTE 14—SEGMENT INFORMATION (Continued)
HD Supply has four reportable segments, each of which is presented below:
- •
- Facilities Maintenance—Supplies maintenance, repair and operations ("MRO") products and upgrade and renovation services largely to the multifamily, healthcare, hospitality, and institutional markets.
- •
- Waterworks—Distributes complete lines of water and wastewater transmission products, serving contractors and municipalities in all aspects of the water and wastewater industries.
- •
- Power Solutions—Distributes electrical transmission and distribution products, power plant maintenance, repair and operations supplies, smart-grid technologies, and provides materials management and procurement outsourcing arrangements to investor-owned utilities, municipal and provincial power authorities, rural electric cooperatives and utility contractors and distributes electrical products such as wire and cable, switch gear supplies, lighting and conduit to residential and commercial contractors.
- •
- White Cap—Distributes specialized hardware, tools, building materials, and safety equipment to professional contractors.
In addition to the reportable segments, the Company's consolidated financial results include "Corporate and Other." Corporate & Other is comprised of the following business units: Crown Bolt, Creative Touch Interiors ("CTI"), Repair & Remodel and HD Supply Canada. Crown Bolt is a retail distribution operator providing program and packaging solutions, sourcing, distribution, and in-store service, fasteners, builders' hardware, rope and chain and plumbing accessories, primarily serving The Home Depot and other hardware stores. CTI offers turnkey supply and installation services for multiple interior finish options, including flooring, cabinets, countertops, and window coverings, along with comprehensive design center services for residential, commercial and senior living projects. Our Repair & Remodel business unit offers light remodeling and construction supplies, kitchen and bath cabinets, windows, plumbing materials, electrical equipment and other products, primarily to small remodeling contractors and trade professionals. HD Supply Canada is an industrial distributor that primarily focuses on servicing fasteners/industrial supplies and specialty lighting markets which operates across nine provinces. Corporate & Other also includes costs related to our centralized support functions, which include finance, information technology, human resources, legal, supply chain and other support services and removes inter segment transactions.
128
Table of Contents
HD SUPPLY, INC.
NOTES TO CONSOLIDATED FINANCIAL STATEMENTS (Continued)
NOTE 14—SEGMENT INFORMATION (Continued)
The following tables present Net sales, Adjusted EBITDA, and certain other measures for each of the reportable segments and total continuing operations for the periods indicated (amounts in millions):
| | | | | | | | | | | | | | | | | | | |
| | Fiscal Year 2012 | |
|---|
| | Net
Sales | | Adjusted
EBITDA | | Depreciation(1)
& Software
Amortization | | Other
Intangible
Amortization | | Total
Assets(2) | | Capital
Expenditures | |
|---|
Facilities Maintenance | | $ | 2,182 | | $ | 389 | | $ | 39 | | $ | 79 | | $ | 2,463 | | $ | 35 | |
Waterworks | | | 2,028 | | | 137 | | | 10 | | | 96 | | | 1,562 | | | 12 | |
Power Solutions | | | 1,787 | | | 72 | | | 7 | | | 18 | | | 816 | | | 4 | |
White Cap | | | 1,178 | | | 56 | | | 12 | | | 20 | | | 521 | | | 22 | |
Corporate & Other | | | 860 | | | 29 | | | 28 | | | 30 | | | 1,972 | | | 42 | |
| | | | | | | | | | | | | | |
Total continuing operations | | $ | 8,035 | | $ | 683 | | $ | 96 | | $ | 243 | | $ | 7,334 | | $ | 115 | |
| | | | | | | | | | | | | | |
| | | | | | | | | | | | | | | | | | | |
| | Fiscal Year 2011 | |
|---|
| | Net Sales | | Adjusted EBITDA | | Depreciation(1)
& Software Amortization | | Other Intangible Amortization | | Total Assets(2) | | Capital Expenditures | |
|---|
Facilities Maintenance | | $ | 1,870 | | $ | 318 | | $ | 30 | | $ | 75 | | $ | 2,264 | | $ | 32 | |
Waterworks | | | 1,772 | | | 112 | | | 5 | | | 95 | | | 1,562 | | | 5 | |
Power Solutions | | | 1,625 | | | 50 | | | 5 | | | 20 | | | 775 | | | 5 | |
White Cap | | | 981 | | | 17 | | | 14 | | | 19 | | | 481 | | | 16 | |
Corporate & Other | | | 780 | | | 11 | | | 31 | | | 35 | | | 1,656 | | | 51 | |
| | | | | | | | | | | | | | |
Total continuing operations | | $ | 7,028 | | $ | 508 | | $ | 85 | | $ | 244 | | $ | 6,738 | | $ | 109 | |
| | | | | | | | | | | | | | |
| | | | | | | | | | | | | | | | | | | |
| | Fiscal Year 2010 | |
|---|
| | Net Sales | | Adjusted EBITDA | | Depreciation(1) & Software Amortization | | Other Intangible Amortization | | Total Assets(2) | | Capital Expenditures | |
|---|
Facilities Maintenance | | $ | 1,682 | | $ | 282 | | $ | 28 | | $ | 75 | | $ | 2,265 | | $ | 20 | |
Waterworks | | | 1,659 | | | 94 | | | 5 | | | 94 | | | 1,582 | | | 2 | |
Power Solutions | | | 1,462 | | | 49 | | | 5 | | | 19 | | | 740 | | | 2 | |
White Cap | | | 852 | | | (10 | ) | | 20 | | | 19 | | | 439 | | | 3 | |
Corporate & Other | | | 794 | | | (4 | ) | | 41 | | | 37 | | | 2,063 | | | 18 | |
| | | | | | | | | | | | | | |
Total continuing operations | | $ | 6,449 | | $ | 411 | | $ | 99 | | $ | 244 | | $ | 7,089 | | $ | 45 | |
| | | | | | | | | | | | | | |
- (1)
- Depreciation includes amounts recorded within Cost of sales in the Consolidated Statements of Operations.
- (2)
- Total Assets include amounts attributable to discontinued operations for the periods prior to the dispositions.
129
Table of Contents
HD SUPPLY, INC.
NOTES TO CONSOLIDATED FINANCIAL STATEMENTS (Continued)
NOTE 14—SEGMENT INFORMATION (Continued)
Reconciliation to Consolidated Financial Statements
| | | | | | | | | | |
| | Fiscal 2012 | | Fiscal 2011 | | Fiscal 2010 | |
|---|
Total Adjusted EBITDA | | $ | 683 | | $ | 508 | | $ | 411 | |
Depreciation and amortization | | | 339 | | | 329 | | | 343 | |
Stock-based compensation | | | 16 | | | 20 | | | 17 | |
Management fees and expenses | | | 5 | | | 5 | | | 5 | |
Restructuring | | | — | | | — | | | 8 | |
Goodwill & other intangible asset impairment | | | 152 | | | — | | | — | |
Other | | | — | | | (1 | ) | | 1 | |
| | | | | | | | |
Operating income | | | 171 | | | 155 | | | 37 | |
Interest expense | | | 658 | | | 639 | | | 623 | |
Loss on extinguishment of debt | | | 709 | | | | | | | |
Other (income) expense, net | | | — | | | — | | | (1 | ) |
| | | | | | | | |
Income (Loss) from Continuing Operations Before Provision (Benefit) for Income Taxes | | | (1,196 | ) | | (484 | ) | | (585 | ) |
Provision (benefit) for income taxes | | | 3 | | | 79 | | | 28 | |
| | | | | | | | |
Income (loss) from continuing operations | | $ | (1,199 | ) | $ | (563 | ) | $ | (613 | ) |
| | | | | | | | |
Net sales for HD Supply outside the United States, primarily Canada, were $428 million, $404 million, and $365 million in fiscal 2012, fiscal 2011, and fiscal 2010, respectively. Long-lived assets of HD Supply outside the United States, primarily Canada, were $16 million and $18 million as of February 3, 2013 and January 29, 2012, respectively.
NOTE 15—GUARANTOR SUBSIDIARIES
The Company has issued First Priority Notes, Second Priority Notes, 11.5% Senior Notes, 7.5% Senior Notes, Senior Subordinated Notes, and Old Senior Subordinated Notes (collectively the "Notes") guaranteed by certain of its subsidiaries (the "Guarantor Subsidiaries"). The Guarantor Subsidiaries are direct or indirect wholly-owned domestic subsidiaries of the Company. The subsidiaries of the Company that do not guarantee the Notes ("Non-guarantor Subsidiaries") are direct or indirect wholly-owned subsidiaries of the Company and primarily include the Company's operations in Canada and a non-operating subsidiary in the United States that previously held an investment of the Company's Old Senior Subordinated Notes, which was eliminated in consolidation. During fiscal 2012, the investment in the Old Senior Subordinated Notes was contributed to the Parent in a non-cash transaction. The Parent retired this portion of the Old Senior Subordinated Notes. These transactions had no impact on the consolidated results of operations or financial position.
In connection with the Notes, the Company determined the need for compliance with Rule 3-10 of SEC Regulation S-X ("Rule 3-10"). In lieu of providing separate audited financial statements for the Guarantor Subsidiaries, the Company has included the accompanying Condensed Consolidating Financial Statements in accordance with Rule 3-10(d) of SEC Regulation S-X. The following supplemental financial information sets forth, on a consolidating basis, the condensed statements of operations and comprehensive income (loss), the condensed balance sheets, and the condensed statements of cash flows for the parent company issuer of the Notes, HD Supply, Inc., (the "Parent Issuer"), for the Guarantor Subsidiaries and for the Non-guarantor Subsidiaries and total consolidated HD Supply, Inc. and subsidiaries (amounts in millions):
130
Table of Contents
HD SUPPLY, INC.
NOTES TO CONSOLIDATED FINANCIAL STATEMENTS (Continued)
NOTE 15—GUARANTOR SUBSIDIARIES (Continued)
CONDENSED CONSOLIDATING STATEMENTS OF OPERATIONS AND COMPREHENSIVE INCOME (LOSS)
| | | | | | | | | | | | | | | | |
| | Fiscal Year 2012 | |
|---|
| | Parent Issuer | | Guarantor Subsidiaries | | Non-Guarantor Subsidiaries | | Eliminations | | Total | |
|---|
Net Sales | | $ | — | | $ | 7,608 | | $ | 428 | | $ | (1 | ) | $ | 8,035 | |
Cost of sales | | | — | | | 5,398 | | | 317 | | | — | | | 5,715 | |
| | | | | | | | | | | | |
Gross Profit | | | — | | | 2,210 | | | 111 | | | (1 | ) | | 2,320 | |
Operating expenses: | | | | | | | | | | | | | | | | |
Selling, general and administrative | | | 64 | | | 1,504 | | | 94 | | | (1 | ) | | 1,661 | |
Depreciation and amortization | | | 13 | | | 321 | | | 2 | | | — | | | 336 | |
Goodwill & other intangible asset impairment | | | — | | | 152 | | | — | | | — | | | 152 | |
| | | | | | | | | | | | |
Total operating expenses | | | 77 | | | 1,977 | | | 96 | | | (1 | ) | | 2,149 | |
Operating Income (Loss) | | | (77 | ) | | 233 | | | 15 | | | — | | | 171 | |
Interest expense | | | 715 | | | 301 | | | 1 | | | (359 | ) | | 658 | |
Interest (income) | | | (302 | ) | | (3 | ) | | (54 | ) | | 359 | | | — | |
Net (earnings) loss of equity affiliates | | | 14 | | | — | | | — | | | (14 | ) | | — | |
Loss on extinguishment of debt | | | 709 | | | — | | | — | | | — | | | 709 | |
| | | | | | | | | | | | |
Income (Loss) from Continuing Operations Before Provision (Benefit) for Income Taxes | | | (1,213 | ) | | (65 | ) | | 68 | | | 14 | | | (1,196 | ) |
Provision (benefit) for income taxes | | | (22 | ) | | — | | | 25 | | | — | | | 3 | |
| | | | | | | | | | | | |
Income (Loss) from Continuing Operations | | | (1,191 | ) | | (65 | ) | | 43 | | | 14 | | | (1,199 | ) |
Income (loss) from discontinued operations, net of tax | | | 12 | | | 8 | | | — | | | — | | | 20 | |
| | | | | | | | | | | | |
Net Income (Loss) | | $ | (1,179 | ) | $ | (57 | ) | $ | 43 | | $ | 14 | | $ | (1,179 | ) |
| | | | | | | | | | | | |
Other comprehensive income—foreign currency translation adjustment | | | — | | | — | | | — | | | — | | | — | |
| | | | | | | | | | | | |
Total Comprehensive Income (Loss) | | $ | (1,179 | ) | $ | (57 | ) | $ | 43 | | $ | 14 | | $ | (1,179 | ) |
| | | | | | | | | | | | |
131
Table of Contents
HD SUPPLY, INC.
NOTES TO CONSOLIDATED FINANCIAL STATEMENTS (Continued)
NOTE 15—GUARANTOR SUBSIDIARIES (Continued)
CONDENSED CONSOLIDATING STATEMENTS OF OPERATIONS AND COMPREHENSIVE INCOME (LOSS) (Continued)
| | | | | | | | | | | | | | | | |
| | Fiscal Year 2011 | |
|---|
| | Parent Issuer | | Guarantor Subsidiaries | | Non-Guarantor
Subsidiaries | | Eliminations | | Total | |
|---|
Net Sales | | $ | — | | $ | 6,630 | | $ | 398 | | $ | — | | $ | 7,028 | |
Cost of sales | | | — | | | 4,720 | | | 294 | | | — | | | 5,014 | |
| | | | | | | | | | | | |
Gross Profit | | | — | | | 1,910 | | | 104 | | | — | | | 2,014 | |
Operating expenses: | | | | | | | | | | | | | | | | |
Selling, general and administrative | | | 78 | | | 1,372 | | | 82 | | | — | | | 1,532 | |
Depreciation and amortization | | | 12 | | | 313 | | | 2 | | | — | | | 327 | |
| | | | | | | | | | | | |
Total operating expenses | | | 90 | | | 1,685 | | | 84 | | | — | | | 1,859 | |
Operating Income (Loss) | | | (90 | ) | | 225 | | | 20 | | | — | | | 155 | |
Interest expense | | | 722 | | | 298 | | | 1 | | | (382 | ) | | 639 | |
Interest (income) | | | (299 | ) | | (3 | ) | | (80 | ) | | 382 | | | — | |
Net (earnings) loss of equity affiliates | | | 30 | | | — | | | — | | | (30 | ) | | — | |
| | | | | | | | | | | | |
Income (Loss) from Continuing Operations Before Provision (Benefit) for Income Taxes | | | (543 | ) | | (70 | ) | | 99 | | | 30 | | | (484 | ) |
Provision (benefit) for income taxes | | | 32 | | | 10 | | | 37 | | | — | | | 79 | |
| | | | | | | | | | | | |
Income (Loss) from Continuing Operations | | | (575 | ) | | (80 | ) | | 62 | | | 30 | | | (563 | ) |
Income (loss) from discontinued operations, net of tax | | | 32 | | | (15 | ) | | 3 | | | — | | | 20 | |
| | | | | | | | | | | | |
Net Income (Loss) | | $ | (543 | ) | $ | (95 | ) | $ | 65 | | $ | 30 | | $ | (543 | ) |
| | | | | | | | | | | | |
Other comprehensive income—foreign currency translation adjustment | | | (1 | ) | | — | | | (1 | ) | | 1 | | | (1 | ) |
| | | | | | | | | | | | |
Total Comprehensive Income (Loss) | | $ | (544 | ) | $ | (95 | ) | $ | 64 | | $ | 31 | | $ | (544 | ) |
| | | | | | | | | | | | |
132
Table of Contents
HD SUPPLY, INC.
NOTES TO CONSOLIDATED FINANCIAL STATEMENTS (Continued)
NOTE 15—GUARANTOR SUBSIDIARIES (Continued)
CONDENSED CONSOLIDATING STATEMENTS OF OPERATIONS AND COMPREHENSIVE INCOME (LOSS) (Continued)
| | | | | | | | | | | | | | | | |
| | Fiscal Year 2010 | |
|---|
| | Parent Issuer | | Guarantor
Subsidiaries | | Non-Guarantor
Subsidiaries | | Eliminations | | Total | |
|---|
Net Sales | | $ | — | | $ | 6,085 | | $ | 364 | | $ | — | | $ | 6,449 | |
Cost of sales | | | — | | | 4,339 | | | 269 | | | — | | | 4,608 | |
| | | | | | | | | | | | |
Gross Profit | | | — | | | 1,746 | | | 95 | | | — | | | 1,841 | |
Operating expenses: | | | | | | | | | | | | | | | | |
Selling, general and administrative | | | 82 | | | 1,302 | | | 71 | | | — | | | 1,455 | |
Depreciation and amortization | | | 16 | | | 322 | | | 3 | | | — | | | 341 | |
Restructuring | | | — | | | 8 | | | — | | | — | | | 8 | |
| | | | | | | | | | | | |
Total operating expenses | | | 98 | | | 1,632 | | | 74 | | | — | | | 1,804 | |
Operating Income (Loss) | | | (98 | ) | | 114 | | | 21 | | | — | | | 37 | |
Interest expense | | | 701 | | | 298 | | | — | | | (376 | ) | | 623 | |
Interest (income) | | | (298 | ) | | (4 | ) | | (74 | ) | | 376 | | | — | |
Loss on extinguishment of debt | | | 2 | | | — | | | — | | | — | | | 2 | |
Other (income) expense, net | | | (3 | ) | | — | | | — | | | — | | | (3 | ) |
Net (earnings) loss of equity affiliates | | | 178 | | | — | | | — | | | (178 | ) | | — | |
| | | | | | | | | | | | |
Income (Loss) from Continuing Operations Before Provision (Benefit) for Income Taxes | | | (678 | ) | | (180 | ) | | 95 | | | 178 | | | (585 | ) |
Provision (benefit) for income taxes | | | (17 | ) | | 6 | | | 39 | | | — | | | 28 | |
| | | | | | | | | | | | |
Income (Loss) from Continuing Operations | | | (661 | ) | | (186 | ) | | 56 | | | 178 | | | (613 | ) |
Income (loss) from discontinued operations, net of tax | | | 42 | | | (49 | ) | | 1 | | | — | | | (6 | ) |
| | | | | | | | | | | | |
Net Income (Loss) | | $ | (619 | ) | $ | (235 | ) | $ | 57 | | $ | 178 | | $ | (619 | ) |
| | | | | | | | | | | | |
Other comprehensive income: | | | | | | | | | | | | | | | | |
Foreign currency translation adjustment | | | 9 | | | — | | | 9 | | | (9 | ) | | 9 | |
Unrealized gains on derivatives, net of tax | | | 1 | | | — | | | — | | | — | | | 1 | |
| | | | | | | | | | | | |
Total Comprehensive Income (Loss) | | $ | (609 | ) | $ | (235 | ) | $ | 66 | | $ | 169 | | $ | (609 | ) |
| | | | | | | | | | | | |
133
Table of Contents
HD SUPPLY, INC.
NOTES TO CONSOLIDATED FINANCIAL STATEMENTS (Continued)
NOTE 15—GUARANTOR SUBSIDIARIES (Continued)
CONDENSED CONSOLIDATING BALANCE SHEETS
| | | | | | | | | | | | | | | | |
| | As of February 3, 2013 | |
|---|
| | Parent Issuer | | Guarantor Subsidiaries | | Non-Guarantor Subsidiaries | | Eliminations | | Total | |
|---|
ASSETS | | | | | | | | | | | | | | | | |
Current assets: | | | | | | | | | | | | | | | | |
Cash and cash equivalents | | $ | 91 | | $ | 15 | | $ | 35 | | $ | — | | $ | 141 | |
Cash equivalents restricted for debt
redemption | | | 936 | | | — | | | — | | | — | | | 936 | |
Receivables, net | | | 4 | | | 937 | | | 67 | | | — | | | 1,008 | |
Inventories | | | — | | | 928 | | | 59 | | | — | | | 987 | |
Deferred tax asset | | | — | | | 48 | | | 1 | | | (7 | ) | | 42 | |
Intercompany receivable | | | — | | | 1 | | | — | | | (1 | ) | | — | |
Other current assets | | | 9 | | | 37 | | | 3 | | | — | | | 49 | |
| | | | | | | | | | | | |
Total current assets | | | 1,040 | | | 1,966 | | | 165 | | | (8 | ) | | 3,163 | |
| | | | | | | | | | | | |
Property and equipment, net | | | 66 | | | 323 | | | 6 | | | — | | | 395 | |
Goodwill | | | — | | | 3,132 | | | 6 | | | — | | | 3,138 | |
Intangible assets, net | | | — | | | 469 | | | 4 | | | — | | | 473 | |
Deferred tax asset | | | 48 | | | — | | | 6 | | | (48 | ) | | 6 | |
Investment in subsidiaries | | | 2,854 | | | — | | | — | | | (2,854 | ) | | — | |
Intercompany notes receivable | | | 2,774 | | | 634 | | | — | | | (3,408 | ) | | — | |
Other assets | | | 153 | | | 6 | | | — | | | — | | | 159 | |
| | | | | | | | | | | | |
Total assets | | $ | 6,935 | | $ | 6,530 | | $ | 187 | | $ | (6,318 | ) | $ | 7,334 | |
| | | | | | | | | | | | |
LIABILITIES AND STOCKHOLDER'S EQUITY (DEFICIT) | | | | | | | | | | | | | | | | |
Current liabilities: | | | | | | | | | | | | | | | | |
Accounts payable | | $ | 14 | | $ | 638 | | $ | 41 | | $ | — | | $ | 693 | |
Accrued compensation and benefits | | | 46 | | | 108 | | | 6 | | | — | | | 160 | |
Current installments of long-term debt | | | 899 | | | — | | | — | | | — | | | 899 | |
Deferred tax liabilities | | | 7 | | | — | | | — | | | (7 | ) | | — | |
Intercompany payable | | | — | | | — | | | 1 | | | (1 | ) | | — | |
Other current liabilities | | | 183 | | | 98 | | | 10 | | | — | | | 291 | |
| | | | | | | | | | | | |
Total current liabilities | | | 1,149 | | | 844 | | | 58 | | | (8 | ) | | 2,043 | |
| | | | | | | | | | | | |
Long-term debt, excluding current installments | | | 6,430 | | | — | | | — | | | — | | | 6,430 | |
Deferred tax liabilities | | | — | | | 152 | | | — | | | (48 | ) | | 104 | |
Intercompany notes payable | | | 634 | | | 2,774 | | | — | | | (3,408 | ) | | — | |
Other liabilities | | | 313 | | | 28 | | | 7 | | | — | | | 348 | |
| | | | | | | | | | | | |
Total liabilities | | | 8,526 | | | 3,798 | | | 65 | | | (3,464 | ) | | 8,925 | |
| | | | | | | | | | | | |
Stockholder's equity (deficit) | | | (1,591 | ) | | 2,732 | | | 122 | | | (2,854 | ) | | (1,591 | ) |
| | | | | | | | | | | | |
Total liabilities and stockholder's equity (deficit) | | $ | 6,935 | | $ | 6,530 | | $ | 187 | | $ | (6,318 | ) | $ | 7,334 | |
| | | | | | | | | | | | |
134
Table of Contents
HD SUPPLY, INC.
NOTES TO CONSOLIDATED FINANCIAL STATEMENTS (Continued)
NOTE 15—GUARANTOR SUBSIDIARIES (Continued)
CONDENSED CONSOLIDATING BALANCE SHEETS (Continued)
| | | | | | | | | | | | | | | | |
| | As of January 29, 2012 | |
|---|
| | Parent Issuer | | Guarantor Subsidiaries | | Non-Guarantor Subsidiaries | | Eliminations | | Total | |
|---|
ASSETS | | | | | | | | | | | | | | | | |
Current assets: | | | | | | | | | | | | | | | | |
Cash and cash equivalents | | $ | 49 | | $ | 12 | | $ | 50 | | $ | — | | $ | 111 | |
Receivables, net | | | 4 | | | 922 | | | 97 | | | (21 | ) | | 1,002 | |
Inventories | | | — | | | 1,027 | | | 81 | | | — | | | 1,108 | |
Deferred tax asset | | | — | | | 89 | | | 2 | | | (33 | ) | | 58 | |
Other current assets | | | 8 | | | 34 | | | 5 | | | — | | | 47 | |
| | | | | | | | | | | | |
Total current assets | | | 61 | | | 2,084 | | | 235 | | | (54 | ) | | 2,326 | |
| | | | | | | | | | | | |
Property and equipment, net | | | 61 | | | 331 | | | 6 | | | — | | | 398 | |
Goodwill | | | — | | | 3,143 | | | 8 | | | — | | | 3,151 | |
Intangible assets, net | | | — | | | 731 | | | 4 | | | — | | | 735 | |
Deferred tax asset | | | 158 | | | — | | | 6 | | | (164 | ) | | — | |
Investment in subsidiaries | | | 3,456 | | | — | | | — | | | (3,456 | ) | | — | |
Intercompany notes receivable | | | 2,774 | | | 641 | | | — | | | (3,415 | ) | | — | |
Other assets | | | 122 | | | 6 | | | 261 | | | (261 | ) | | 128 | |
| | | | | | | | | | | | |
Total assets | | $ | 6,632 | | $ | 6,936 | | $ | 520 | | $ | (7,350 | ) | $ | 6,738 | |
| | | | | | | | | | | | |
LIABILITIES AND STOCKHOLDER'S EQUITY (DEFICIT) | | | | | | | | | | | | | | | | |
Current liabilities: | | | | | | | | | | | | | | | | |
Accounts payable | | $ | 21 | | $ | 648 | | $ | 45 | | $ | — | | $ | 714 | |
Accrued compensation and benefits | | | 42 | | | 93 | | | 5 | | | — | | | 140 | |
Current installments of long-term debt | | | 82 | | | — | | | — | | | — | | | 82 | |
Deferred tax liabilities | | | 33 | | | — | | | — | | | (33 | ) | | — | |
Other current liabilities | | | 284 | | | 104 | | | 11 | | | (21 | ) | | 378 | |
| | | | | | | | | | | | |
Total current liabilities | | | 462 | | | 845 | | | 61 | | | (54 | ) | | 1,314 | |
| | | | | | | | | | | | |
Long-term debt, excluding current installments | | | 5,641 | | | — | | | — | | | (261 | ) | | 5,380 | |
Deferred tax liabilities | | | — | | | 275 | | | — | | | (164 | ) | | 111 | |
Intercompany notes payable | | | 641 | | | 2,774 | | | — | | | (3,415 | ) | | — | |
Other liabilities | | | 316 | | | 37 | | | 8 | | | — | | | 361 | |
| | | | | | | | | | | | |
Total liabilities | | | 7,060 | | | 3,931 | | | 69 | | | (3,894 | ) | | 7,166 | |
| | | | | | | | | | | | |
Stockholder's equity | | | (428 | ) | | 3,005 | | | 451 | | | (3,456 | ) | | (428 | ) |
| | | | | | | | | | | | |
Total liabilities and stockholder's equity (deficit) | | $ | 6,632 | | $ | 6,936 | | $ | 520 | | $ | (7,350 | ) | $ | 6,738 | |
| | | | | | | | | | | | |
135
Table of Contents
HD SUPPLY, INC.
NOTES TO CONSOLIDATED FINANCIAL STATEMENTS (Continued)
NOTE 15—GUARANTOR SUBSIDIARIES (Continued)
CONDENSED CONSOLIDATING STATEMENTS OF CASH FLOWS
| | | | | | | | | | | | | | | | |
| | Fiscal Year 2012 | |
|---|
| | Parent Issuer | | Guarantor Subsidiaries | | Non-Guarantor Subsidiaries | | Eliminations | | Total | |
|---|
Net cash flows from operating activities | | $ | (813 | ) | $ | 110 | | $ | 73 | | $ | (51 | ) | $ | (681 | ) |
| | | | | | | | | | | | |
Cash flows from investing activities | | | | | | | | | | | | | | | | |
Capital expenditures | | | (26 | ) | | (87 | ) | | (2 | ) | | — | | | (115 | ) |
Proceeds from sale of property and equipment | | | — | | | 17 | | | — | | | — | | | 17 | |
Payment for a business acquired | | | — | | | (248 | ) | | — | | | — | | | (248 | ) |
Proceeds from sale of a business | | | 480 | | | — | | | 1 | | | — | | | 481 | |
Purchase of other investments | | | (1,921 | ) | | — | | | — | | | — | | | (1,921 | ) |
Proceeds from sale of investments | | | 985 | | | — | | | — | | | — | | | 985 | |
Purchase of debt investments | | | — | | | — | | | (1 | ) | | 1 | | | — | |
Proceeds from (payments of) intercompany notes | | | — | | | 6 | | | — | | | (6 | ) | | — | |
Investments (return of capital) in equity affiliates | | | (169 | ) | | — | | | — | | | 169 | | | — | |
Other investing activities | | | — | | | 1 | | | — | | | — | | | 1 | |
| | | | | | | | | | | | |
Net cash flows from investing activities | | | (651 | ) | | (311 | ) | | (2 | ) | | 164 | | | (800 | ) |
| | | | | | | | | | | | |
Cash flows from financing activities | | | | | | | | | | | | | | | | |
Dividend payment | | | — | | | — | | | (51 | ) | | 51 | | | — | |
Equity contribution (return of capital) | | | — | | | 204 | | | (35 | ) | | (169 | ) | | — | |
Borrowings (repayments) of intercompany notes | | | (6 | ) | | — | | | — | | | 6 | | | — | |
Borrowings of long-term debt | | | 6,365 | | | — | | | — | | | — | | | 6,365 | |
Repayments of long-term debt | | | (5,023 | ) | | — | | | — | | | (1 | ) | | (5,024 | ) |
Borrowings on long-term revolver | | | 1,291 | | | — | | | 10 | | | — | | | 1,301 | |
Repayments of long-term revolver | | | (991 | ) | | — | | | (10 | ) | | — | | | (1,001 | ) |
Debt issuance and modification fees | | | (132 | ) | | — | | | — | | | — | | | (132 | ) |
Other financing activities | | | 2 | | | — | | | — | | | — | | | 2 | |
| | | | | | | | | | | | |
Net cash flows from financing activities | | | 1,506 | | | 204 | | | (86 | ) | | (113 | ) | | 1,511 | |
| | | | | | | | | | | | |
Net increase (decrease) in cash & cash equivalents | | $ | 42 | | $ | 3 | | $ | (15 | ) | $ | — | | $ | 30 | |
Cash and cash equivalents at beginning of period | | | 49 | | | 12 | | | 50 | | | — | | | 111 | |
| | | | | | | | | | | | |
Cash and cash equivalents at end of period | | $ | 91 | | $ | 15 | | $ | 35 | | $ | — | | $ | 141 | |
| | | | | | | | | | | | |
136
Table of Contents
HD SUPPLY, INC.
NOTES TO CONSOLIDATED FINANCIAL STATEMENTS (Continued)
NOTE 15—GUARANTOR SUBSIDIARIES (Continued)
CONDENSED CONSOLIDATING STATEMENTS OF CASH FLOWS (Continued)
| | | | | | | | | | | | | | | | |
| | Fiscal Year 2011 | |
|---|
| | Parent Issuer | | Guarantor Subsidiaries | | Non-Guarantor
Subsidiaries | | Eliminations | | Total | |
|---|
Net cash flows from operating activities | | $ | (629 | ) | $ | 458 | | $ | 6 | | $ | — | | $ | (165 | ) |
Cash flows from investing activities | | | | | | | | | | | | | | | | |
Capital expenditures | | | (15 | ) | | (98 | ) | | (2 | ) | | — | | | (115 | ) |
Proceeds from sales of property and
equipment | | | — | | | 4 | | | — | | | — | | | 4 | |
Payments for businesses acquired | | | — | | | (21 | ) | | — | | | — | | | (21 | ) |
Proceeds from sale of a business | | | 117 | | | — | | | 11 | | | — | | | 128 | |
Purchase of investments | | | (21 | ) | | (2 | ) | | — | | | — | | | (23 | ) |
Proceeds from sale of investments | | | 21 | | | — | | | — | | | — | | | 21 | |
Proceeds from (payments of) intercompany notes | | | — | | | (337 | ) | | — | | | 337 | | | — | |
| | | | | | | | | | | | |
Net cash flows from investing activities | | | 102 | | | (454 | ) | | 9 | | | 337 | | | (6 | ) |
Cash flows from financing activities | | | | | | | | | | | | | | | | |
Borrowings (repayments) of
intercompany notes | | | 337 | | | — | | | — | | | (337 | ) | | — | |
Repayments of long-term debt | | | (10 | ) | | — | | | — | | | — | | | (10 | ) |
Borrowings on long-term revolver | | | 1,053 | | | — | | | — | | | — | | | 1,053 | |
Repayments of long-term revolver | | | (1,053 | ) | | — | | | — | | | — | | | (1,053 | ) |
| | | | | | | | | | | | |
Net cash flows from financing activities | | | 327 | | | — | | | — | | | (337 | ) | | (10 | ) |
Effect of exchange rates on cash | | | — | | | — | | | — | | | — | | | — | |
| | | | | | | | | | | | |
Net increase (decrease) in cash & cash equivalents | | $ | (200 | ) | $ | 4 | | $ | 15 | | $ | — | | $ | (181 | ) |
Cash and cash equivalents at beginning of period | | | 249 | | | 8 | | | 35 | | | — | | | 292 | |
| | | | | | | | | | | | |
Cash and cash equivalents at end of period | | $ | 49 | | $ | 12 | | $ | 50 | | $ | — | | $ | 111 | |
| | | | | | | | | | | | |
137
Table of Contents
HD SUPPLY, INC.
NOTES TO CONSOLIDATED FINANCIAL STATEMENTS (Continued)
NOTE 15—GUARANTOR SUBSIDIARIES (Continued)
CONDENSED CONSOLIDATING STATEMENTS OF CASH FLOWS (Continued)
| | | | | | | | | | | | | | | | |
| | Fiscal Year 2010 | |
|---|
| | Parent Issuer | | Guarantor Subsidiaries | | Non-Guarantor
Subsidiaries | | Eliminations | | Total | |
|---|
Net cash flows from operating activities | | $ | 452 | | $ | 83 | | $ | 16 | | $ | — | | $ | 551 | |
Cash flows from investing activities | | | | | | | | | | | | | | | | |
Capital expenditures | | | (6 | ) | | (41 | ) | | (2 | ) | | — | | | (49 | ) |
Proceeds from sales of property and equipment | | | — | | | 4 | | | — | | | — | | | 4 | |
Proceeds from (payments of) intercompany notes | | | — | | | (46 | ) | | — | | | 46 | | | — | |
Return of investment | | | 33 | | | — | | | — | | | (33 | ) | | — | |
| | | | | | | | | | | | |
Net cash flows from investing activities | | | 27 | | | (83 | ) | | (2 | ) | | 13 | | | (45 | ) |
Cash flows from financing activities | | | | | | | | | | | | | | | | |
Equity contribution (return of capital) | | | 1 | | | — | | | (33 | ) | | 33 | | | 1 | |
Borrowings (repayments) of intercompany notes | | | 46 | | | — | | | — | | | (46 | ) | | — | |
Repayments of long-term debt | | | (40 | ) | | — | | | — | | | — | | | (40 | ) |
Borrowings on long-term revolver | | | 178 | | | — | | | — | | | — | | | 178 | |
Repayments of long-term revolver | | | (860 | ) | | — | | | — | | | — | | | (860 | ) |
Debt modification and issuance costs | | | (34 | ) | | — | | | — | | | — | | | (34 | ) |
| | | | | | | | | | | | |
Net cash flows from financing activities | | | (709 | ) | | — | | | (33 | ) | | (13 | ) | | (755 | ) |
Effect of exchange rates on cash | | | — | | | — | | | 2 | | | — | | | 2 | |
| | | | | | | | | | | | |
Net increase (decrease) in cash & cash equivalents | | $ | (230 | ) | $ | — | | $ | (17 | ) | $ | — | | $ | (247 | ) |
Cash and cash equivalents at beginning of period | | | 479 | | | 8 | | | 52 | | | — | | | 539 | |
| | | | | | | | | | | | |
Cash and cash equivalents at end of period | | $ | 249 | | $ | 8 | | $ | 35 | | $ | — | | $ | 292 | |
| | | | | | | | | | | | |
138
Table of Contents
HD SUPPLY, INC.
NOTES TO CONSOLIDATED FINANCIAL STATEMENTS (Continued)
NOTE 16—QUARTERLY FINANCIAL DATA (UNAUDITED)
The following is a summary of the quarterly consolidated results of operations for the fiscal years ended February 3, 2013 and January 29, 2012 (amounts in millions):
| | | | | | | | | | | | | | | | |
| | First Quarter | | Second Quarter | | Third Quarter | | Fourth Quarter | | TOTAL | |
|---|
Fiscal Year 2012 | | | | | | | | | | | | | | | | |
Net sales | | $ | 1,836 | | $ | 2,059 | | $ | 2,146 | | $ | 1,994 | | $ | 8,035 | |
Gross profit | | | 523 | | | 594 | | | 616 | | | 587 | | | 2,320 | |
Loss from continuing operations | | | (376 | ) | | (56 | ) | | (53 | ) | | (714 | ) | | (1,199 | ) |
Net income (loss) | | | (360 | ) | | (56 | ) | | (50 | ) | | (713 | ) | | (1,179 | ) |
Fiscal Year 2011 | | | | | | | | | | | | | | | | |
Net sales | | $ | 1,608 | | $ | 1,875 | | $ | 1,893 | | $ | 1,652 | | $ | 7,028 | |
Gross profit | | | 460 | | | 533 | | | 535 | | | 486 | | | 2,014 | |
Loss from continuing operations | | | (169 | ) | | (108 | ) | | (119 | ) | | (167 | ) | | (563 | ) |
Net income (loss) | | | (164 | ) | | (101 | ) | | (105 | ) | | (173 | ) | | (543 | ) |
Loss from continuing operations and Net income (loss) in the first quarter of fiscal 2012 includes a loss on extinguishment of debt of $220 million. Loss from continuing operations and Net income (loss) in the fourth quarter of fiscal 2012 includes a loss on extinguishment of debt of $489 million and goodwill and other intangible asset impairment charges of $152 million, or $113 million net of tax. There is no tax impact related to the losses on extinguishment of debt due to the Company's valuation allowance position. See Note 8, Income Taxes, for further information on the Company's taxes.
NOTE 17—SUBSEQUENT EVENTS
Debt Redemption
On February 8, 2013, the Company redeemed the remaining $889 million outstanding aggregate principal amount of Old Senior Subordinated Notes at a redemption price equal to 103.375% of the principal amount thereof and paid accrued and unpaid interest thereon through the redemption date. As a result, in the first quarter of fiscal 2013, the Company will report a $34 million loss on extinguishment, which includes a $30 million premium payment to redeem the Old Senior Subordinated Notes and $4 million to write-off the unamortized deferred debt cost. In addition, the deferred interest deductions on the Old Senior Subordinated Notes (representing the net deferred tax asset of $131 million) are currently deductible on the Company's fiscal 2013 federal income tax return and applicable state returns. Such deductions will not have an impact on the Company's fiscal 2013 total tax expense and may increase the Company's overall net operating loss carryforward.
Debt Modification
On February 15, 2013, HD Supply, Inc. modified its Term Loan Facility to lower the borrowing margins 275 basis points to LIBOR (subject to a floor of 1.25%) plus a borrowing margin of 3.25% or Prime plus a borrowing margin of 2.25% at the Company's election. The amendment also replaced the hard call provision applicable to optional prepayment of term loans thereunder with a soft call option. The soft call option provides for a premium equal to 1.0% of the aggregate principal amount of term loans being prepaid if, on or prior to August 15, 2013, the Company enters into certain repricing transactions. In connection with the modification, the Company incurred approximately $30 million in
139
Table of Contents
HD SUPPLY, INC.
NOTES TO CONSOLIDATED FINANCIAL STATEMENTS (Continued)
NOTE 17—SUBSEQUENT EVENTS (Continued)
financing fees, of which approximately $27 million will be amortized into interest expense over the remaining term of the amended facility in accordance with U. S. GAAP (ASC 470, Debt). Of the non-deferred financing fees, approximately $2 million will be recorded as a Loss on extinguishment of debt and the remaining $1 million will be recorded as Other non-operating expense in the Consolidated Statement of Operations and Comprehensive Income (Loss) in the first quarter of fiscal 2013.
Exchange Offers
On February 5, 2013, the Company executed the offer to exchange outstanding First Priority Notes with registered First Priority Notes, outstanding Second Priority Notes with registered Second Priority Notes, outstanding 11.5% Senior Notes with registered 11.5% Senior Notes and outstanding Senior Subordinated Notes with registered Senior Subordinated Notes. The exchange offers closed in the first quarter of fiscal 2013 with substantially all of the notes held by eligible participants in the exchange offers tendered.
140
Table of Contents
ITEM 9A. CONTROLS AND PROCEDURES
Disclosure Controls and Procedures
The Company, under the supervision and with the participation of its management, including the Chief Executive Officer and the Chief Financial Officer, evaluated the effectiveness of the design and operation of the Company's "disclosure controls and procedures" (as defined in Rule 13a-15(e) under the Securities Exchange Act of 1934, as amended (the "Exchange Act")) as of the end of the period covered by this report. Based on that evaluation, the Chief Executive Officer and the Chief Financial Officer concluded that the Company's disclosure controls and procedures were effective as of February 3, 2013.
Change in Internal Control over Financial Reporting
There were no changes in the Company's internal control over financial reporting, as defined in the Exchange Act Rules 13a-15(f) or 15d-15(f), during the fourth quarter of fiscal 2012 that have materially affected, or are reasonably likely to materially affect, our internal control over financial reporting.
Management's Report on Internal Control over Financial Reporting
The management of the Company is responsible for establishing and maintaining adequate internal control over financial reporting, as such term is defined in Securities Exchange Act of 1934 Rule 13a-15(f). Internal control over financial reporting is a process designed to provide reasonable assurance regarding the reliability of financial reporting and the preparation of financial statements for external purposes in accordance with generally accepted accounting principles. Due to its inherent limitations, internal control over financial reporting may not prevent or detect misstatements and, even when determined to be effective, can only provide reasonable, not absolute, assurance with respect to financial statement preparation and presentation. Projections of any evaluation of effectiveness to future periods are subject to risk that controls may become inadequate as a result of changes in conditions or deterioration in the degree of compliance.
Under the supervision and with the participation of the management of the Company, including the Company's Chief Executive Officer and Chief Financial Officer, the Company conducted an evaluation of the effectiveness of its internal control over financial reporting as of February 3, 2013 based on the framework in Internal Control—Integrated Framework issued by the Committee of Sponsoring Organizations of the Treadway Commission ("COSO"). Based on its evaluation under the framework in Internal Control—Integrated Framework, the management of the Company concluded that its internal control over financial reporting was effective as of February 3, 2013.
This annual report does not include an attestation report of the Company's independent registered public accounting firm due to an exemption established by rules of the SEC for non-accelerated filers. Our independent registered public accounting firm did not perform an evaluation of our internal control over financial reporting as of February 3, 2013 in accordance with the provisions of the Sarbanes-Oxley Act of 2002. Had our independent registered public accounting firm performed an evaluation of our internal control over financial reporting in accordance with the provisions of the Sarbanes-Oxley Act of 2002, additional control deficiencies may have been identified by our independent registered public accounting firm and those control deficiencies could have also represented one or more material weaknesses.
141
Table of Contents
PART III
ITEM 10. DIRECTORS, EXECUTIVE OFFICERS AND CORPORATE GOVERNANCE
The following table sets forth certain information concerning our executive officers and directors: The respective age of each individual in the table below is as of March 31, 2013.
| | | | | |
Name | | Age | | Position |
|---|
Joseph J. DeAngelo | | | 51 | | President and Chief Executive Officer, Director |
Ronald J. Domanico | | |
54 | | Senior Vice President and Chief Financial Officer |
Ricardo J. Nunez | | |
48 | | Senior Vice President, General Counsel and Corporate Secretary |
Margaret Newman | | |
44 | | Senior Vice President, Human Resources, Marketing & Communications |
Jerry Webb | | |
55 | | Chief Executive Officer, HD Supply Waterworks |
Anesa Chaibi | | |
46 | | President and Chief Executive Officer, HD Supply Facilities Maintenance |
John Stegeman | | |
52 | | Executive President, HD Supply and President, HD Supply White Cap |
Rick J. McClure | | |
54 | | Chief Executive Officer, HD Supply Power Solutions |
James G. Berges | | |
65 | | Chairman of the Board of Directors of Holding and HD Supply |
Vipul Amin | | |
36 | | Director of Holding and HD Supply |
Brian A. Bernasek | | |
40 | | Director of Holding and HD Supply |
Paul B. Edgerley | | |
57 | | Director of Holding and HD Supply |
Mitchell Jacobson | | |
62 | | Director of Holding and HD Supply |
Lew Klessel | | |
45 | | Director of Holding and HD Supply |
Gregory Ledford | | |
55 | | Director of Holding and HD Supply |
Nathan K. Sleeper | | |
39 | | Director of Holding and HD Supply |
Stephen M. Zide | | |
53 | | Director of Holding and HD Supply |
Joseph J. DeAngelo has been President and Chief Executive Officer since January 2005 and has been a director since August 30, 2007. Mr. DeAngelo served as Executive Vice President and Chief Operating Officer of Home Depot from January 2007 through August 2007. From August 2005 to December 2006, he served as Senior Vice President—HD Supply. From January 2005 to August 2005, Mr. DeAngelo served as Senior Vice President—Home Depot Supply, Pro Business and Tool Rental and from April 2004 through January 2005, he served as Senior Vice President—Pro Business and Tool Rental. Mr. DeAngelo previously served as Executive Vice President of The Stanley Works, a tool manufacturing company, from March 2003 through April 2004. From 1986 until April 2003, Mr. DeAngelo held various positions with GE. His final position with GE was as President and Chief Executive Officer of General Electric TIP/Modular Space, a division of General Electric Capital. Mr. DeAngelo holds a bachelor's degree in Accounting and Economics from the State University of New York at Albany.
Ronald J. Domanico has been Senior Vice President and Chief Financial Officer since April 2010, joining HD Supply from Caraustar Industries, Inc., a leading manufacturer of recycled paperboard and converter of paperboard products, where he served as Vice President and Chief Financial Officer beginning October 2002. Caraustar and certain of its subsidiaries filed voluntary petitions on May 31, 2009 in the United States Bankruptcy Court for the Northern District of Georgia seeking relief under the provisions of Chapter 11 of the Bankruptcy Code, and successfully emerged from bankruptcy in
142
Table of Contents
August 2009. Prior to joining Caraustar, Mr. Domanico was Executive Vice President and Chief Financial Officer at AHL Services, Inc. From 1981 to 2000, he worked at Kraft Foods and Nabisco in progressively senior roles of increasing responsibility in financial management, operations, planning and business development. Mr. Domanico's last eleven years at Kraft and Nabisco, including seven years living abroad, were in chief financial officer positions of operating subsidiaries/divisions. When he left the company, he was Senior Vice President and Chief Financial Officer for Nabisco International and Chief Executive Officer for Nabisco Asia. Mr. Domanico was named to the Caraustar board of directors in May 2006 and served until his departure in 2009. He is also a board member of the Georgia Council on Economic Education and the CFO Roundtable. Mr. Domanico holds a bachelor's degree in Management Science and an M.B.A. with a concentration in Finance from the University of Illinois in Urbana-Champaign.
Ricardo J. Nunez has served as Senior Vice President, General Counsel and Corporate Secretary since August 2007 and was also responsible for managing our Real Estate, Loss Prevention, Corporate Security, Business Continuity, and Environmental, Health and Safety operations for a portion of this time. Mr. Nunez served as Vice President of Legal Operations of Home Depot from August 2005 to August 2007. Previously, he held leadership positions at General Electric Energy ("GE Energy"), which included lead legal counsel responsible for global manufacturing and sourcing, global compliance, and sales of products and services. Prior to joining GE Energy, Mr. Nunez served as counsel at Esso Inter-America Inc., the Exxon affiliate responsible for downstream operations throughout Latin America and the Caribbean. Mr. Nunez also spent four years at Steel, Hector & Davis, a law firm based in Florida, where he practiced real estate and land use law primarily. He is active in various civic and charitable organizations and currently sits on the board of directors of The Westminster Schools and Atlanta Speech School. Mr. Nunez holds a bachelor's degree in Economics from the Wharton School at the University of Pennsylvania and a J.D. from Columbia Law School.
Margaret Newman joined HD Supply in April 2007 and has served as Senior Vice President of Human Resources, Marketing and Communications since July 2008. Prior to HD Supply, Ms. Newman held senior Human Resources leadership roles at Conseco Insurance Group from August 2005 to April 2007, and at Sears Roebuck and Company from September 1997 to August 2005. She has more than 19 years of business experience in the manufacturing industry, building her expertise in organizational effectiveness; acquisition and integration; benefits design; talent acquisition and management; leadership development and employee engagement. Ms. Newman holds a bachelor's degree in Psychology from Coe College and master's degree in Sociology from the University of Wisconsin.
Jerry Webb has served as Chief Executive Officer, HD Supply Waterworks since December 2011, and served as President, HD Supply Waterworks from March 2007 to November 2011. Mr. Webb joined the HD Supply team in connection with the acquisition of National Waterworks Holdings, Inc. by HD Supply in August 2005. Mr. Webb has spent his entire career in HD Supply Waterworks and its predecessor companies: National Waterworks, U.S. Filter Distribution Group, Inc. and Davis Water & Waste Industries ("Davis"). Mr. Webb previously served as Vice President of the Southeast Region of National Waterworks from November 2002 through March 2007. He began his career in 1981 with Davis and served in numerous capacities including Sales Representative, Operations Manager, Branch Manager, District Manager and National Sales Manager. Following the acquisition of Davis by U.S. Filter, Mr. Webb served as Vice President for the Southeast Region of U.S. Filter from 1996 until 2002. Mr. Webb holds a B.B.A. degree in Accounting from Valdosta State University.
Anesa Chaibi has served as President and Chief Executive Officer, HD Supply Facilities Maintenance since September 2005. Prior to joining HD Supply, Ms. Chaibi served as General Manager of Global Quality and Commercial Operations for GE Water & Process Technologies in 2005. Ms. Chaibi began her career in 1989 in the GE Chemical and Materials Leadership Program. She held roles of increasing responsibility in manufacturing, operations, production, marketing, corporate initiatives, global sourcing, Six Sigma Quality, and as a Business Leader within GE Silicones, Plastics,
143
Table of Contents
Power Systems, Industrial Systems, Water & Process Technologies and Infrastructure before leaving to join Home Depot and then HD Supply. During her career, she also worked for CSC Index as a Strategic Management Consultant. Ms. Chaibi has a Bachelor of Science in chemical engineering from West Virginia University and an M.B.A. from the Fuqua School of Business at Duke University.
John Stegeman joined HD Supply in April 2010 as Executive President and focused on building the Specialty Construction and Safety business as the President of HD Supply White Cap. Prior to joining HD Supply, Mr. Stegeman was most recently President and Chief Executive Officer of Ferguson Enterprises ("Ferguson"), headquartered in Newport News, Virginia from 2005 to 2009. He began his career with Ferguson in 1985 as a management trainee and advanced through the company holding various management positions in three of Ferguson's five business groups: Waterworks, Plumbing, and Heating and Air Conditioning. As part of the Ferguson Waterworks business group, Mr. Stegeman served as Senior Vice President before being named Chief Operating Officer of Ferguson in May 2005. Mr. Stegeman received a bachelor's degree from Virginia Tech and has attended advanced management programs at Wharton School of Business, IMD, Duke University's Fuqua School of Business, University of Virginia Darden School of Business and Columbia University.
Rick J. McClure has served as President, HD Supply Power Solutions since August 2012 when HD Supply combined its Utilities and Electrical businesses. Prior to that, he served as President of HD Supply Utilities from 2006 to August 2012. Mr. McClure joined HD Supply in connection with the acquisition of Hughes Supply by HD Supply in February 2006. He previously served as President, Hughes Utilities from 2005 to 2006, and was Vice President of Utilities at Hughes Supply from 2002 until 2005. Mr. McClure was President and Chief Executive Officer of Utiliserve from 1997 to 2002, and spent almost 20 years in leadership roles within Operations Management and Sales & Operations Management at Utiliserve between 1978 and 2002. Mr. McClure holds a degree in Electrical Engineering from the University of Colorado at Denver.
James G. Berges has been the Chairman of the Board of Directors since August 2007. Mr. Berges has been an operating partner of CD&R since 2005. Mr. Berges was President of Emerson Electric Co. from 1999 and served as director of Emerson Electric Co. from 1997 until his retirement in 2005. Emerson Electric Co. is a global manufacturer of products, systems and services for industrial automation, process control, HVAC, electronics and communications, and appliances and tools. He is a director of PPG Industries, Inc., NCI Building Systems, Inc., and Atkore International and chairman of the board of Hussman International, Inc. He also served as director of MKS Instruments, Inc. from February 2002 to May 2007 and Diversey, Inc. from 2009 to 2010. Mr. Berges holds a B.S. in Electrical Engineering from the University of Notre Dame.
Vipul Amin became a director in April 2012. Mr. Amin is a Principal with Carlyle's U.S. Buyout group, focusing primarily on buyouts, privatizations and strategic minority investments throughout the U.S. in the industrial and transportation sector. Since joining Carlyle in 2000, Mr. Amin has been actively involved in various of the firm's portfolio companies, including Accudyne Industries and PQ Corporation currently. In addition, Mr. Amin was a member of the transaction team that executed Carlyle's investments in each of John Maneely Company and Rexnord Corporation. Prior to joining Carlyle, Mr. Amin was employed with Bowles Hollowell Connor and Co. Mr. Amin received an M.B.A. from Harvard University and an A.B. in philosophy from Duke University. He is also a member of the Board of Directors of Accudyne Industries.
Brian A. Bernasek became a director in January 2011. Mr. Bernasek is a Managing Director of Carlyle where he focuses on investment opportunities primarily in the industrial and transportation sectors. Since joining Carlyle in 2000, Mr. Bernasek has been actively involved in several of the firm's investments, including Accudyne Industries, Allison Transmission, AxleTech International, Rexnord Corporation and The Hertz Corporation. Prior to joining Carlyle, Mr. Bernasek held positions with Investcorp International, a private equity firm, and in the investment banking division of Morgan
144
Table of Contents
Stanley & Co. Mr. Bernasek is a graduate of the University of Notre Dame and received his M.B.A. from Harvard Business School. He is also a member of the Board of Directors of Accudyne Industries, Allison Transmission and Hertz Global Holdings.
Paul B. Edgerley became a director in August 2007. Mr. Edgerley joined Bain in 1988 and has been a Managing Director since 1990. Mr. Edgerley focuses on investment in the industrial and consumer product sectors. He currently serves on the Board of Directors of The Boston Celtics, China Fire, Steel Dynamics, Sensata Technologies, MEI Conlux and Hero MotoCorp. Prior to joining Bain, Mr. Edgerley spent five years at Bain & Company where he worked as a Consultant and Manager in the healthcare, information services, retail and automobile industries. Previously, he was a certified public accountant working at Peat Marwick, Mitchell & Company. Mr. Edgerley was awarded an MBA with distinction from Harvard Business School and a B.S. from Kansas State University.
Mitchell Jacobson became a director in October 2007. Mr. Jacobson has served as Chairman of the Board of Directors of MSC Industrial Direct Co., Inc. since January 1998, and previously served in various executive officer roles from June 1982 to November 2005. Mr. Jacobson currently serves on the Board of Directors of Wolfgang Puck Worldwide. In addition, he serves on the Boards of Trustees for both New York University and New York University School of Law, and is a member of the New York University School of Law Foundation Investment Committee. He serves as a Trustee for New York Presbyterian Hospital and is a member of the hospital's Investment Committee, as well as the Chair of the hospital's Hedge Fund Subcommittee and a member of both the Asset Allocation and Private Investment Subcommittees. Further, he is a director of the Sid Jacobson Jewish Community Center. Mr. Jacobson is a graduate of Brandeis University and the New York University School of Law.
Lew Klessel became a director in October 2007. Mr. Klessel is a Managing Director at Bain where he has worked since 2005. Prior to joining Bain, Mr. Klessel held a variety of operating and strategy leadership positions from 1997 to 2005 at Home Depot, most recently as President of HD Supply Facilities Maintenance. He has also been a strategy consultant with McKinsey & Company and a Certified Public Accountant with Ernst & Young. Mr. Klessel received an M.B.A. from Harvard Business School and a B.S. from the Wharton School at the University of Pennsylvania. He also serves as a director for Michaels Stores and Guitar Center.
Gregory S. Ledford became a director in January 2011. Mr. Ledford is a Managing Director of Carlyle where he leads U.S. buyout opportunities in the Industrial and Transportation sectors. Since joining Carlyle in 1988, Mr. Ledford has led the firm's investments in Allison Transmission, AxleTech International, The Hertz Corporation, Horizon Lines, Grand Vehicle Works and Piedmont Holdings. From 1991 to 1997, he served as Chairman and Chief Executive Officer of The Reilly Corp., a former Carlyle portfolio company that was successfully sold in September 1997. Prior to joining Carlyle, Mr. Ledford was Director of Capital Leasing for MCI Telecommunications. Mr. Ledford is a graduate of the University of Virginia's McIntire School of Commerce, where he serves as the Vice President of the Fountain Board, and received his M.B.A. from Loyola College. Mr. Ledford is also a member of the Board of Directors of Allison Transmission, Axalta Coating Systems, Genesee & Wyoming and Veyance Technologies and previously served as a director of Hertz Global Holdings.
Nathan K. Sleeper became a director in April 2010. Mr. Sleeper is a partner of CD&R and has significant financial and investment experience from his involvement in its investment in numerous portfolio companies and has played active roles in overseeing those businesses. Prior to joining CD&R in 2000, he worked in the investment banking division of Goldman, Sachs & Co. and at investment firm Tiger Management Corp. Mr. Sleeper is a director of Wilsonart International Holdings, LLC, Roofing Supply Group, Inc., Hussman International, Inc., Atkore International Group, Inc., NCI Building Systems, and U.S. Foods, Inc. and previously served as a director of Hertz Global Holdings, Inc. from 2005 to 2011 and Culligan Ltd. from 2004 to 2012. Mr. Sleeper holds a B.A. from Williams College and an M.B.A. from Harvard Business School.
145
Table of Contents
Stephen M. Zide became a director in June 2007. Mr. Zide is a Managing Director of Bain, having joined the firm in 1997. He currently heads the firm's New York office and leads its North American Industrial Sector. Prior to joining Bain, Mr. Zide was a partner of the law firm of Kirkland & Ellis LLP. Mr. Zide received an M.B.A. from Harvard Business School, a J.D. from Boston University School of Law and a B.A. from the University of Rochester. He also serves as a director of Sensata Technologies B.V., Innophos Holdings, Inc., Consolidated Container Corporation, Apex Tool Group, and Trinseo LLC.
All of the directors were appointed by the Equity Sponsors pursuant to the Second Amended and Restated Stockholders Agreement of HD Supply dated September 21, 2007.
Corporate Governance
Board Composition
Our business and affairs are managed under the direction of our Board of Directors. We currently have ten directors. Our directors hold office until their successors have been elected and qualified or until the earlier of their resignation or removal.
As a result of the 2007 Acquisition, Holding entered into a stockholders agreement with certain of its stockholders which provides that the Equity Sponsors are entitled to elect (or cause to be elected) nine out of ten directors, which includes three designees of each Equity Sponsor. The tenth director is our Chief Executive Officer. Pursuant to the Second Amended and Restated Stockholders Agreement, one of the directors designated by the Equity Sponsor associated with CD&R serves as the chairman. Pursuant to an agreement between Clayton, Dubilier & Rice Fund VII, L.P. and Mitchell Jacobson, the fund agreed to appoint Mr. Jacobson to serve as a director of HD Supply for so long as Mr. Jacobson and his immediate family continue to hold certain minimum investments in HD Supply and certain other conditions are met.
When considering whether directors and nominees have the experience, qualifications, attributes or skills, taken as a whole, to enable the Board of Directors to satisfy their oversight responsibilities effectively in light of our business and structure, the Board of Directors focused primarily on each person's background and experience as reflected in the information discussed in each of the directors' individual biographies set forth immediately above. We believe that our directors provide an appropriate mix of experience and skills relevant to the size and nature of our business. In particular, the members of the Board of Directors considered the following important characteristics:
- •
- Messrs. Berges and Sleeper are representatives appointed by CD&R and have significant financial and investment experience from their involvement in CD&R's investment in numerous portfolio companies and have played active roles in overseeing those businesses;
- •
- Mr. Jacobson, who was also appointed by CD&R, has extensive experience in our industry, including service as Chairman of the Board, Chief Executive Officer and in various other executive positions of a large publicly traded industrial supply company;
- •
- Messrs. Ledford, Bernasek and Amin are representatives appointed by Carlyle, and have significant financial and investment experience from their involvement in Carlyle's investment in numerous portfolio companies and have played active roles in overseeing those businesses;
- •
- Messrs. Zide, Edgerley and Klessel are representatives appointed by Bain, and have significant financial and investment experience from their involvement in Bain's investment in numerous portfolio companies and have played active roles in overseeing those businesses; and
- •
- Our Chief Executive Officer, Mr. DeAngelo, has extensive experience in our industry, including as a senior executive of the Company and its predecessor since 2004, as well as leadership experience with other leading companies, including GE.
146
Table of Contents
In addition, we believe Mr. Berges' experience in the manufacturing industry and Mr. Klessel's experience in the home improvement industry are valuable to our Board of Directors. In addition to private equity, several of the directors representing our Equity Sponsors also have backgrounds in other fields that bring a diversity of experience to our Board, including law—Mr. Zide, investment banking—Mr. Bernasek, strategy consulting—Mr. Klessel, and accounting—Mr. Edgerley. We also value the experience that our directors bring from their service on other boards. All of the directors appointed by the Equity Sponsors serve on the boards of other Exchange Act reporting companies (companies with public equity and/or public debt), including numerous portfolio companies.
Committees of the Board of Directors
The Board of Directors of both Holding and HD Supply have an Audit Committee, Compensation Committee and an Executive Committee.
The Audit Committee, which consists of Messrs. Jacobson, Klessel and Amin has the responsibility for, among other things, assisting the Board of Directors in reviewing: our financial reporting and other internal control processes; our financial statements; the independent auditors' qualifications and independence; the performance of our internal audit function and independent auditors; and our compliance with legal and regulatory requirements and our code of business conduct and ethics.
Mr. Jacobson has been identified as an "audit committee financial expert" as that term is defined in the rules and regulations of the SEC.
The Compensation Committee, which consists of Messrs. Zide, Bernasek and Sleeper, has the responsibility for reviewing and approving the compensation and benefits of our employees, directors and consultants, administering our employee benefits plans, authorizing and ratifying stock option grants and other incentive arrangements and authorizing employment and related agreements.
The Executive Committee, which consists of Messrs. Bernasek, Berges and Klessel, meets between meetings of the Board of Directors and has the power to exercise all the powers and authority of the Board of Directors with respect to matters delegated to the Committees by the Board of Directors, except for the limitations under Section 144(c) of the Delaware General Corporation Law, and/or applicable limitations under the company's organizational documents.
Code of Conduct and Guidelines for Ethical Behavior
Our Board of Directors maintains a Code of Ethics for Senior Executive and Financial Officers that applies to our senior executive and financial officers including our principal executive officer, principal financial officer, principal accounting officer, or persons performing similar functions. A copy of the Code of Ethics for Senior Executive and Financial Officers is available on our website at http://governance.hdsupply.com. We will promptly disclose any future amendments to this code on our website as well as any waivers from this code for executive officers and directors. Copies of this code are also available in print from our Corporate Secretary upon request. We also maintain a Code of Business Conduct and Ethics that governs all of our employees.
147
Table of Contents
ITEM 11. EXECUTIVE COMPENSATION
Overview
The following Compensation Discussion and Analysis provides information regarding the material elements of our fiscal 2012 compensation program for our "named executive officers," also referred to as the "NEOs." The Compensation Committees of HD Supply's and HDS's Boards, which have identical membership (collectively, the "Committee"), pursuant to their charters, are responsible for establishing, implementing and reviewing on an annual basis our compensation programs and actual compensation paid to our NEOs, except for our Chief Executive Officer, with respect to whom the Committee's decisions are subject to review and final approval by our Board.
Executive Summary
As a result of improving market conditions and the Company's execution of key initiatives, and cost saving strategies, the overall financial performance for fiscal 2012 was above expectations. The strong fiscal 2012 performance of the Company resulted in the following compensation decisions:
- •
- Mr. DeAngelo declined a proposed merit increase and continued with his current base salary amount. In order to ensure that the base pay amounts remain competitive for key leaders, Mr. Domanico received a 3% merit increase and Ms. Chaibi received an increase of 5%. Mr. Stegeman did not receive an increase given that his current base salary continued to be competitive. Mr. Fabere received an increase at the time of his promotion to Senior Vice President, Operations.
- •
- All of our NEOs earned a cash award under the annual cash incentive program, the Management Incentive Plan. As a result of our performance exceeding expectations, the awards earned ranged from 111% to 172% of target.
- •
- The Committee does not make routine annual equity grants. The NEOs, except for Mr. Fabere, did not receive equity grants in 2012. During 2012, Mr. Fabere received an equity grant in connection with his role as Vice President, Sourcing and a second grant in connection with his promotion to Senior Vice President, Operations.
Determining Executive Compensation
At HD Supply, our Human Resources team, in partnership with the Committee, drives the design and implementation of all executive compensation programs. Our finance team heavily supports the process by providing financial analysis and input and review of program design. Except with respect to his own compensation, our Chief Executive Officer has final management-level review of any compensation program before it is sent to the Committee for consideration and approval. The Committee has the task of evaluating and approving our material compensation programs, including our equity compensation program. Management frequently consults with the Committee during the design process to obtain their direction and feedback on how the design of our executive compensation programs support the overall strategy of the Company. As described below, data from outside consultants are also used during the design process to obtain further insight into the features of our compensation program.
148
Table of Contents
Philosophy and Objectives
Our company and our aspiration to be the "First Choice" is built on the mission of "One Team, Driving Customer Success and Value Creation," a philosophy we believe is best embodied by our SPIRIT values:
| | |
| Service: | | Help our customers succeed by delivering exceptional service and the best total value experience |
Performance: |
|
Exceed our commitments everyday to our team, customers, suppliers, Equity Sponsors and communities |
Integrity: |
|
Treat team members the way you would like you and your family to be treated |
Respect: |
|
Always do the right thing and always take the high road |
Innovation: |
|
Seek new ways to build a reliable, effective and efficient chain of execution for our customers |
Teamwork: |
|
Win together by creating an environment where every individual puts the team first |
The Committee and our management believe that fostering these values requires a performance culture geared toward customer success and sustainable, long-term profitability. The Company's compensation programs are designed to reward achievement of these goals, thereby attracting and retaining talent that will contribute to such a culture. In particular, our executive compensation programs are intended to meet the following objectives:
- •
- to balance commitment, long-term financial success, short-term operational excellence and achievement of short-term goals. This balance includes but is not limited to driving profitable growth while aligning our executives' long term interests with shareholders' interests.
- •
- to attract, retain and motivate our top executive talent.
- •
- to differentiate rewards based on outstanding individual performance so as to promote a high performance culture.
In addition, we intend that our compensation programs will be aligned with:
- •
- Our business strategy: Our compensation programs link pay to our strategy by rewarding executives upon achievement of profitability, long-term growth, excellence in achievement of short-term operational and financial goals and by reinforcing the "One Team" philosophy.
- •
- Our shareholders' interests: Through the strategic use of equity-based compensation, the total compensation of our executives is directly linked to the sustained value they create for our shareholders.
- •
- Our goal of retaining and motivating key talent: To retain the best executive talent, the total compensation opportunity is designed to provide attractive levels of compensation if performance targets are met and upside opportunity when performance targets are exceeded.
Compensation Consultant and Use of Comparator Data
For the last four fiscal years, the Company has engaged Pearl Meyer & Partners to provide input with respect to our executive compensation programs, including a market review of the competitiveness of total compensation of our executives and a review of our equity program. A representative from Pearl Meyer & Partners attends our Committee meetings.
149
Table of Contents
In light of new SEC rules, the Company requested and received information from Pearl Meyer & Partners with respect to potential conflicts of interest, including the following factors: (1) other services provided to us by the consultant; (2) fees paid by us as a percentage of the consulting firm's total revenue; (3) policies and procedures maintained by the consulting firm that are designed to prevent a conflict of interest; (4) any business or personal relationships between the individual consultants involved in the engagement and a member of the Committee; (5) any Company stock owned by the individual consultants involved in the engagement; (6) any business or personal relationships between our executive officers and the consulting firm or the individual consultants involved in the engagement. Based on an assessment of these factors, including information gathered from directors and executive officers addressing business or personal relationships with the consulting firm or the individual consultants, the Committee concluded that the work of Pearl Meyer & Partners did not raise any conflict of interest.
In general, neither the Company nor the Committee has exclusively relied on any of the data or advice received from Pearl Meyer & Partners as to the amount of any particular item of compensation. Pearl Meyer & Partners provides input which the Company and Committee take into consideration, as the case may be, on the particular element of compensation under consideration.
Comparator Data
The Committee reviews compensation levels and practices at comparator companies in setting the compensation of our NEOs and when reviewing or establishing the Company's compensation programs for other associates. The information is used to help the Committee better understand the competitive market and how executives are compensated at other companies that are similar in size or industry, and companies with whom we compete for talent.
Our breadth of Specialty Business Units makes finding direct comparators challenging. We seek comparators that share a similar industrial distribution model or are a direct competitor to a specific line of business.
Companies are therefore included in the comparator group because they (1) operate in the same business as the Company or one of our business units (industrial distribution of building supplies), (2) operate in a similar business (distribution of any product), or (3) operate in a similar business model (business to business). The comparator group was developed by management and the Committee, with input from Pearl Meyer & Partners, and has been used to provide input into both the value of total compensation for executives as well as the relative value of each component of compensation. We do not rely on percentile rankings of compensation within the comparator group to determine specific compensation amounts for the NEOs; rather, the comparator group is used to identify programs and levels of pay which management and the Committee consider when evaluating our own programs.
150
Table of Contents
In fiscal 2012, we used the following comparator group consisting of companies in the same or similar business or having a similar business model:
| | |
| Arrow Electronics Inc. | | Masco Corp |
Coca-Cola Enterprises |
|
Office Depot |
Conagra Foods |
|
Owens & Minor |
Danaher, Corp |
|
Pepsi Bottling Group |
Fastenal Co. |
|
Staples, Inc. |
Genuine Parts |
|
Watsco, Inc. |
Interline Brands Inc. |
|
WESCO International, Inc. |
MSC Industrial Direct |
|
W.W. Grainger, Inc. |
The comparator group is reviewed and updated each year as appropriate. No changes were made to the fiscal 2012 comparator group as compared to fiscal 2011.
Employment of Senior Vice President, Operations
During fiscal 2012, the role of Senior Vice President, Operations was reinstated. The role was filled with an internal candidate, Mark Fabere, who previously served as Vice President, Sourcing.
Effective July 30, 2012, we entered into a promotion letter agreement with Mr. Fabere which provides for (1) a base salary of $285,000 per year, (2) an annual cash incentive award target increase from 40% to 60%, (3) the right to participate in other employee or fringe benefit programs for senior executives, including HDS Investment Holding, Inc. Stock Incentive Plan (the "Stock Plan"), and (4) an equity grant (described below). On November 8, 2012, Mr. Fabere received a stock option grant as outlined in his promotion letter agreement. The option grant consisted of 80,000 options having a strike price of $6.20 and a grant date fair value of $231,200 and 120,000 options having a strike price of $10.00 and a grant date fair value of $250,800. In addition, Mr. Fabere received a stock grant in May 2012 in connection with a prior promotion to Vice President, Sourcing. The grant consisted of 60,000 options having a strike price of $5.89 and a grant date fair value of $169,200 and 90,000 options having a strike price of $10.00 and a grant date fair value of $179,100. All options granted vest in five equal annual installments on each of the first through fifth anniversaries of the grant date. As part of our standard promotion offer, the offer letter agreement also contains non-competition and non-solicitation provisions.
The fiscal 2012 non-equity incentive plan compensation paid to Mr. Fabere included a prorated portion of the Long-term Incentive Plan ("LTIP") and Founders Award Plan ("FAP"). These two plans were available to Mr. Fabere in his role as Director, Sourcing. Upon his promotion to Vice President, Sourcing then to Senior Vice President, Operations, Mr. Fabere continued to participate in the Management Incentive Plan (described below), and was no longer eligible to participate in the LTIP or FAP.
In addition, Mr. Fabere received a discretionary bonus of $30,000 in recognition of superior performance of goals and objectives. In order to ensure that he received the full value of the bonus, we assisted in paying the taxes on the bonus.
While we considered Mr. Fabere an executive officer for fiscal 2012, we do not believe Mr. Fabere is currently an executive officer.
151
Table of Contents
Components of Compensation
The Company believes that the compensation programs it maintains are important in achieving the compensation goals described above. For fiscal 2012, the principal components of compensation for the named executive officers were:
- •
- base salary;
- •
- annual cash incentives;
- •
- equity incentive compensation for one of the NEOs; and
- •
- benefits and perquisites.
Each of our NEOs is party to an employment offer letter which contains certain employment and severance arrangements. These severance arrangements are discussed more fully below under "Potential Payments upon Termination or Change in Control."
The design of each component of compensation fits into the overall executive pay program and supports the philosophy and objectives previously discussed in the following manner:
| | | | |
Pay component | | Objective of pay component | | Key measures |
|---|
• Base salary | | • Provides competitive pay while managing fixed costs | | • Individual performance and contribution
• Scope of responsibilities
• Experience |
• Annual cash incentives | | • Focuses on short-term operational metrics that drive and support our long-term strategy
• Where applicable, creates incentives for performance based on performance of individual NEOs' business unit
• To reward an executive for superior individual performance against non-financial goals | | • Achievement of agreed upon operating plan goals in profitability
• Achievement of non-financial goals |
152
Table of Contents
| | | | |
Pay component | | Objective of pay component | | Key measures |
|---|
• Equity awards granted in the form of stock options | | • Aligns executive interests to shareholders by rewarding long-term focus on profitability and value creation for the enterprise
• Assists in the retention of key talent
• Creates an "ownership culture" | | • Growth in stock value
• Employment retention through the vesting period of the stock options |
• Benefits and perquisites | | • Benefits provide a safety net of protection in the case of illness, disability or death
• Perquisites generally enable the executive to perform their duties efficiently and minimize distractions | | • Benefits are provided to executives on the same basis as provided to our salaried associates
• Perquisites are valued by our executives at minimal cost to us |
A discussion of each of the components of compensation for the NEOs is below, including a discussion of the factors considered in determining the applicable amount payable or achievable under each component.
Base Salary
Base salaries are set to attract and retain top executive talent while managing fixed costs at an appropriate level. The determination of any particular executive's base salary is based on personal performance and contribution, experience in the role, changes to the scope of responsibilities, market rates of pay and internal equity. Each year, the Chief Executive Officer, with input from Human Resources, proposes base salary increases, if any, for all NEOs, excluding himself, based on performance and the Company's merit increase budget prepared by management. His proposal is subject to review and approval (with or without modifications) by the Committee. Changes to Mr. DeAngelo's base rate of pay are initiated and approved by the Committee directly, subject to the review and final approval of HD Supply's Board of Directors.
In fiscal 2012, Mr. DeAngelo declined to be considered for a pay increase.
Increases were recommended and approved by the Committee for Mr. Domanico and Ms. Chaibi to ensure their base salaries remained competitive. Mr. Domanico received a 3% increase. Ms. Chaibi received a 5% increase. Mr. Stegeman's salary remained the same since his base pay continued to be competitive. Mr. Fabere received an increase of 12% upon his promotion to the role of Senior Vice President, Operations.
Annual Cash Incentives
Annual cash incentives are designed to focus the NEOs on producing superior results against key financial metrics relevant to the Company as a whole or to the individual business units that the NEO leads. By tying a significant portion of the executive's total annual cash compensation to annual variable pay, we reinforce our "pay for performance" culture and focus our executives on critical short-term financial and operational objectives which also support our long-term financial goals.
153
Table of Contents
Management Incentive Plan
All of our NEOs participate in the Management Incentive Plan ("MIP"), which provides cash-based incentives dependent on annual results against the key financial metric described below. A committee which includes Human Resources personnel, the CFO and the Controller (the "MIP Committee") monitors the MIP to ensure compliance with its intent and terms and to periodically review and make certain recommendations to the Committee, as discussed below.
MIP target payouts to our NEOs are expressed as a percentage of base salary. Annually, these percentage targets are reviewed against comparator data and adjusted, if necessary, based on the Committee's estimation of what level of targeted payouts is necessary to retain and motivate our executives. In fiscal 2012, the Committee approved changes to the percentage of base pay targets for Mr. DeAngelo and Ms. Chaibi. Ms. Chaibi's target was recommended by the CEO. The percentage of base pay target for Mr. DeAngelo was increased from 125% to 150%. Ms. Chaibi's percentage of base pay target was increased from 60% to 100%. These increases were provided to ensure total compensation continued to motivate top performance and remain competitive.
For fiscal 2012, MIP performance targets were based on MIP-adjusted earnings before interest, taxes, depreciation, and amortization ("MIP-adjusted EBITDA"). For purposes of the MIP, management fees and related expenses paid to the Equity Sponsors and stock-based compensation costs for stock options are excluded from MIP-adjusted EBITDA, both as to the targets and as to MIP-adjusted EBITDA as ultimately determined. In addition, in accordance with the MIP, from time to time throughout the year, the MIP Committee may request that the Committee exclude from the MIP-adjusted EBITDA calculation certain non-recurring items, certain items which are beyond the control of management or certain items which may adversely affect current results but contribute to long-term profitability improvement.
For fiscal year 2012, we viewed MIP-adjusted EBITDA as the key operating metric that would drive business profitability. The MIP provides a threshold level (at which 25% of the target percentage of base salary is earned, except for Facilities Maintenance where threshold level performance earns 50% of the target percentage), a target (or "plan") level (at which 100% of the target percentage of base salary is earned), and a maximum level for superior results (at which 200% of the target percentage of base salary may be earned for participants in the MIP assigned to one of our specific business units and 150% of the target percentage of base salary for participants in the MIP assigned to our Global Support Center).
For the NEO's participation in the MIP, the following percentages applied:
| | | | | | | | | | | | | | | | |
| | MIP-Adjusted EBITDA
Facilities Maintenance | | MIP-Adjusted EBITDA
White Cap | | MIP-Adjusted EBITDA
Global Support Center | |
|---|
| | Performance
Required | | Payout %
Earned | | Performance
Required | | Payout %
Earned | | Performance
Required | | Payout %
Earned | |
|---|
Threshold | | 95% of Plan | | | 50 | % | 90% of Plan | | | 25 | % | 90% of Plan | | | 25 | % |
Plan | | 100% of Plan | | | 100 | % | 100% of Plan | | | 100 | % | 100% of Plan | | | 100 | % |
150% Payout | | 104% of Plan | | | 150 | % | 110% of Plan | | | 150 | % | 107% of Plan | | | 150 | % |
200% Payout | | 107% of Plan | | | 200 | % | 142% of Plan | | | 200 | % | NA | | | NA | |
Payout = Salary × Target % of Salary × Payout % Earned
For fiscal 2012, the MIP goal for GSC was a MIP-adjusted EBITDA of $672 million (which includes the acquisition of Peachtree as part of our Facilities Maintenance line of business). The Committee, in approving the plan goals in February 2012 (with an adjustment in November 2012 to account for the acquisition of Peachtree), viewed this level as appropriate in order to keep the primary focus on adjusted EBITDA. We exceeded our goal for fiscal 2012. Our MIP-adjusted EBITDA was
154
Table of Contents
$683 million (which includes the results of our Peachtree acquisition). As a result, each of our NEOs earned an incentive award.
As President of Facilities Maintenance, Ms. Chaibi's MIP payout is based on the financial performance of Facilities Maintenance. For 2012, Facilities Maintenance's financial goal was a MIP-adjusted EBITDA of $369 million. Facilities Maintenance exceeded its goal with a MIP-adjusted EBITDA of $389 million.
As President of White Cap, Mr. Stegeman's MIP payout is based the financial performance of White Cap. For 2012, White Cap's financial goal was a MIP-adjusted EBITDA of $47 million. White Cap exceeded its goal with a MIP-adjusted EBITDA of $58 million.
Fiscal 2012 performance resulted in the following payments being made to our NEOs under the MIP:
| | | | | | | | | | |
| | Target %
(expressed as a
% of base salary) | | MIP-Adjusted
EBITDA
payout % earned | | Aggregate MIP
payment ($) | |
|---|
Joseph J. DeAngelo | | | 150 | % | | 111.4 | % | | 1,462,344 | |
Ronald J. Domanico | | | 75 | % | | 111.4 | % | | 469,939 | |
John Stegeman | | | 100 | % | | 163.4 | % | | 1,184,807 | |
Anesa Chaibi | | | 100 | % | | 171.6 | % | | 901,679 | |
Mark Fabere(1) | | | 60 | % | | 111.4 | % | | 152,707 | |
- (1)
- Mr. Fabere's aggregate MIP payment represents prorated target award levels applicable to him during fiscal 2012.
2013 MIP Award
In 2013, we expect no material changes to the MIP as MIP-adjusted EBITDA will continue to be the sole performance measure to ensure singular focus on the metric that drives company value most directly.
Equity Incentive Compensation
Our NEOs participate in the Stock Plan. The Stock Plan was adopted by our Board of Directors shortly following our separation from Home Depot. HD Supply established the Stock Plan because it viewed the granting of equity awards under the Stock Plan as the most effective way to align executive performance to our key goal of increasing value for HD Supply's shareholders. The view of our Board of Directors was that, assuming that our management is successful in increasing the value of HD Supply, awards under the Stock Plan will have the highest potential value for all participants as a percentage of total compensation.
Our Board of Directors believed the best way to accomplish these goals was to provide one up-front grant of stock options with a significant vesting period and, at the same time, provide the opportunity to purchase additional shares of our common stock. Therefore, our NEOs were granted options to purchase shares of HD Supply common stock and were also offered the opportunity to purchase additional HD Supply common shares. The program makes "founding owners" of our NEOs and is intended to motivate them to increase the value of HD Supply, and therefore our share price, over time. The vesting component was intended to maximize the retentive effect of the Stock Plan. The up-front nature of the option grants was intended to position our executives for the highest possible return (because, if the share value of HD Supply increases over time, annual or other periodic grants would have higher strike prices and, therefore, less intrinsic value to our executives).
155
Table of Contents
While the Committee does not currently make routine annual grants to any of our NEOs or other executives, the Committee may, from time to time, determine that an additional grant to one or more of our NEOs or other associates is appropriate in order to retain or reward key talent. In addition, the Committee will consider making grants in the case of new hires or promotions.
In 2012, we granted Mr. Fabere stock options in connection with his promotion as noted in the "Employment of Senior Vice President, Operations" section. Mr. Fabere also received stock options in 2012 prior to his promotion. No equity grants were made to the other NEOs since the Committee granted stock options to these executives in April 2011.
Benefits and Perquisites
The benefits provided to our NEOs are the same as those generally provided to our other salaried associates and include medical, vision and dental insurance, basic life insurance and accidental death and dismemberment insurance, short and long term disability insurance and a 401(k) plan.
Our executives participate in a limited number of perquisite programs. We maintain these programs because they are valued by our NEOs but impose relatively little cost to us.
All of the NEOs participate in the Executive Basic Life Insurance Plan. Under this plan, the beneficiary of a participant who dies while employed by us is entitled to a lump sum payment of $500,000.
The NEOs are also offered Supplemental Term Life Insurance. This plan provides participants with 20-year level premium term life insurance, with coverage in $500,000 increments up to $5,000,000. The participant owns the policy, and the Company pays the premium on his or her behalf. The value of the premium is fully taxable. At the end of the year, each participant receives an additional payment equal to the gross amount of taxes paid on the benefit. This additional payment is also fully taxable and is grossed up.
Other benefits provided to our NEOs include company cars, executive physicals and reimbursement for financial services. The value of providing company cars and reimbursement for financial services is taxable and is grossed up to avoid reducing the value of the benefits.
Tax and accounting considerations
While the accounting and tax treatment of compensation generally has not been a consideration in determining the amounts of compensation for our executive officers, the Committee and management have taken into account the accounting and tax impact of various program designs to balance the potential cost to the Company with the value to the executive.
The expenses associated with executive compensation issued to our executive officers and other key associates are reflected in our financial statements. We account for stock-based programs in accordance with the requirements of ASC 718, Compensation-Stock Compensation, which requires companies to recognize in the income statement the grant date value of equity-based compensation issued to associates over the vesting period of such awards.
Compensation committee report
The Compensation Committee for each of Holding and HD Supply has reviewed and discussed the Compensation Discussion and Analysis required by Item 402(b) of Regulation S-K with management
156
Table of Contents
and, based on such review and discussion, the Compensation Committee recommended to the Board that the Compensation Discussion and Analysis be included in this annual report on Form 10-K.
| | |
| | | The Compensation Committee: |
|
|
Brian Bernasek
Nathan K. Sleeper
Stephen M. Zide |
Compensation committee interlocks and insider participation
The Compensation Committee for each of HD Supply and HDS currently consists of Stephen Zide (Chairman), Brian A. Bernasek and Nate Sleeper. All Committee members are representatives from the Equity Sponsors. Mr. Zide is a Managing Director of Bain, Mr. Bernasek is an executive of Carlyle and Mr. Sleeper is an executive of CD&R.
See Part III, Item 13 "Certain Relationships and Related Party Transactions—Management and Consulting Agreements" for a discussion of the annual fees paid to the Equity Sponsors.
Executive compensation
Summary Compensation Table for Fiscal 2012
The following table sets forth the compensation of our Chief Executive Officer, Chief Financial Officer, and the three other most highly compensated executive officers.
| | | | | | | | | | | | | | | | | | | | | | |
Name and
Principal Position | | Fiscal
Year | | Salary
$ | | Bonus
$(1) | | Option
Awards
$(2) | | Non-Equity
Incentive Plan
Compensation
$(3) | | All Other
Compensation
$(4) | | Total
$ | |
|---|
| Joseph J. DeAngelo | | | 2012 | | | 875,000 | | | — | | | — | | | 1,462,344 | | | 38,127 | | | 2,375,471 | |
Chief Executive Officer | | | 2011 | | | 875,000 | | | — | | | 2,267,282 | | | 1,640,625 | | | 47,170 | | | 4,830,077 | |
| | | 2010 | | | 875,000 | | | — | | | 1,327,625 | | | 1,435,054 | | | 73,937 | | | 3,711,616 | |
Ronald J. Domanico |
|
|
2012 |
|
|
558,600 |
|
|
— |
|
|
— |
|
|
469,939 |
|
|
52,835 |
|
|
1,081,374 |
|
Senior Vice President | | | 2011 | | | 541,200 | | | — | | | 944,699 | | | 614,250 | | | 40,594 | | | 2,140,743 | |
and Chief Financial Officer | | | 2010 | | | 403,800 | | | 300,000 | | | 1,268,800 | | | 516,619 | | | 29,196 | | | 2,518,415 | |
Anesa Chaibi |
|
|
2012 |
|
|
549,959 |
|
|
— |
|
|
— |
|
|
901,679 |
|
|
50,284 |
|
|
1,501,922 |
|
President, Facilities | | | 2011 | | | 509,100 | | | — | | | 1,889,401 | | | 414,927 | | | 43,546 | | | 2,856,974 | |
Maintenance | | | 2010 | | | 439,100 | | | — | | | 287,653 | | | 307,314 | | | 43,014 | | | 1,077,081 | |
John Stegeman |
|
|
2012 |
|
|
725,000 |
|
|
— |
|
|
— |
|
|
1,184,807 |
|
|
35,209 |
|
|
1,945,016 |
|
President, White Cap | | | 2011 | | | 725,000 | | | — | | | 188,940 | | | 552,864 | | | 34,465 | | | 1,501,269 | |
| | | 2010 | | | 571,600 | | | 450,000 | | | 1,718,168 | | | 362,382 | | | 229,080 | | | 3,331,230 | |
Mark Fabere |
|
|
2012 |
|
|
277,423 |
|
|
30,000 |
|
|
830,300 |
|
|
290,503 |
|
|
17,744 |
|
|
1,445,970 |
|
Senior Vice President, | | | | | | | | | | | | | | | | | | | | | | |
Operations | | | | | | | | | | | | | | | | | | | | | | |
- (1)
- Bonus amount includes sign-on bonuses of $300,000 and $450,000 paid to Mr. Domanico and Mr. Stegeman, respectively, as outlined in their offers of employment. A discretionary bonus amount of $30,000 was provided to Mr. Fabere during fiscal 2012.
- (2)
- The fiscal 2012 amount for Mr. Fabere represents the aggregate grant date fair value of stock option awards granted in May 2012 and November 2012. Information about the assumptions used to value these awards can be found in Note 9 to our audited consolidated financial statements.
157
Table of Contents
- (3)
- Non-equity incentive plan compensation reflects amounts paid under the MIP to all NEOs for the applicable year. See "—Components of Compensation—Annual Cash Incentives" for a discussion of the MIP in fiscal 2012. The fiscal 2012 amount for Mr. Fabere also includes a prorated portion of the LTIP and FAP in the amount of $137, 796.
- (4)
- The All Other Compensation column is made up of the following amounts for fiscal 2012:
| | | | | | | | | | | | | | | | |
Name | | Tax Gross Up on
Bonus and Perquisites | | Use of a
Company Car | | Financial
Planning
Assistance | | Other
Perquisites | | Total
$ | |
|---|
Joseph J. DeAngelo | | | 12,942 | | | 5,805 | | | 18,000 | | | 1,380 | | | 38,127 | |
Ronald J. Domanico | | | 20,684 | | | 20,772 | | | 10,000 | | | 1,380 | | | 52,835 | |
Anesa Chaibi | | | 20,229 | | | 19,155 | | | 10,000 | | | 900 | | | 50,284 | |
John Stegeman | | | 12,766 | | | 11,063 | | | 10,000 | | | 1,380 | | | 35,209 | |
Mark Fabere | | | 16,491 | | | 1,253 | | | — | | | — | | | 17,744 | |
Grants of Plan-Based Awards for Fiscal Year 2012
The following table provides information concerning awards granted to the NEOs in the last fiscal year under any plan.
| | | | | | | | | | | | | | | | | | | | | | |
| |
| |
| |
| |
| | All Other
Option
Awards:
Number of
Securities
Underlying
Options
(#) | |
| |
| |
|---|
| |
| | Estimated Possible Payouts Under
Non-Equity Incentive Plan
Awards(1) | |
| | Grant Date
Fair Value
of Stock and
Option
Awards
($) | |
|---|
| |
| | Exercise or
Base Price
of Option
Awards
($/Sh) | |
|---|
Name | | Grant
Date | | Threshold
$ | | Target
$ | | Maximum
$ | |
|---|
Joseph J. DeAngelo | | | | | | | | | | | | | | | | | | | | | | |
2012 MIP | | | | | | 328,125 | | | 1,312,500 | | | 1,968,750 | | | — | | | — | | | — | |
Ronald J. Domanico | | | | | | | | | | | | | | | | | | | | | | |
2012 MIP | | | | | | 105,446 | | | 421,785 | | | 632,678 | | | — | | | — | | | — | |
Anesa Chaibi | | | | | | | | | | | | | | | | | | | | | | |
2012 MIP | | | | | | 262,710 | | | 525,420 | | | 1,050,840 | | | — | | | — | | | — | |
John Stegeman | | | | | | | | | | | | | | | | | | | | | | |
2012 MIP | | | | | | 181,250 | | | 725,000 | | | 1,450,000 | | | — | | | — | | | — | |
Mark Fabere | | | | | | | | | | | | | | | | | | | | | | |
2012 MIP | | | | | | 42,750 | | | 171,000 | | | 256,500 | | | — | | | — | | | — | |
2010-2012 LTIP(2) | | | | | | 21,001 | | | 84,003 | | | 126,005 | | | — | | | — | | | — | |
2010-2012 FAP(2) | | | | | | 18,208 | | | 91,042 | | | 136,563 | | | — | | | — | | | — | |
Stock Plan(3) | | | 5/14/2012 | | | — | | | — | | | — | | | 60,000 | | | 5.89 | | | 169,200 | |
Stock Plan(3) | | | 5/14/2012 | | | — | | | — | | | — | | | 90,000 | | | 10.00 | | | 179,100 | |
Stock Plan(3) | | | 11/8/2012 | | | — | | | — | | | — | | | 80,000 | | | 6.20 | | | 231,200 | |
Stock Plan(3) | | | 11/8/2012 | | | — | | | — | | | — | | | 120,000 | | | 10.00 | | | 250,800 | |
- (1)
- The MIP sets the threshold payout at 25% of the target payout and the maximum payout at 150% of the target payout for Messrs. DeAngelo, Domanico, and Fabere. The MIP sets the threshold payout at 25% of the target payout and the maximum payout at 200% of the target payout for Mr. Stegeman. The MIP sets the threshold payout at 50% of the target payout and the maximum payout at 200% of the target payout for Ms. Chaibi. A discussion of the MIP in fiscal 2012 is under "Compensation Discussion and Analysis—Components and Compensation—Annual Cash Incentives."
- (2)
- The LTIP and the FAP provide an award based on the achievement of certain long-term financial objectives of the Company. For the LTIP and FAP, Mr. Fabere participated in these plans for more
158
Table of Contents
than 50% of the three-year cycle of 2010-2012. Therefore, he was entitled to receive a prorated portion of these awards.
- (3)
- Mr. Fabere received stock options in May 2012 in connection with his role as Vice President, Sourcing. In November 2012, he received stock options outlined in his offer letter agreement in connection with his promotion to Senior Vice President, Operations. These options vest in five equal annual installments on each of the first through fifth anniversaries of the grant date.
Narrative disclosure to summary compensation table and grant plan based awards table
Stock Plan
The Stock Plan and an Associate Stock Option Agreement govern each option award and provide, among other things, the vesting provisions of the options and the option term. Prior to the exercise of an option, the holder has no rights as a stockholder with respect to the shares subject to such option, including voting rights and the right to receive dividends or dividend equivalents. See "Potential Payments upon Termination or Change in Control" for information regarding the cancellation or acceleration of vesting of stock options upon an option holder's termination of employment or a change in control of the Company.
Employment Agreement
We have entered into an employment offer letter with each of our named executive officers. See "Employment of Senior Vice President, Operations" and "Potential Payments upon Termination or Change in Control" for a summary of the material provisions of these letter agreements.
Outstanding Equity Awards at Fiscal Year-End 2012
The following table sets forth the unexercised and unvested stock options held by named executive officers at fiscal year end. Each equity grant is shown separately for each named executive officer. Options granted on April 11, 2011 vest in their entirety and become exercisable on the third anniversary of the grant date except as noted; all other options vest and become exercisable in equal
159
Table of Contents
annual installments on the first five anniversaries of the grant date. No named executive officer holds any stock awards.
| | | | | | | | | | | | | | | | |
| | Option Awards | |
|---|
Name | | Number of Securities
Underlying
Unexercised Options
(#) Exercisable | | Number of Securities
Underlying
Unexercised Options
(#) Unexercisable | | Option
Exercise
Price $ | | Option
Grant
Date | | Option
Expiration
Date | |
|---|
Joseph J. DeAngelo | | | 1,111,500 | | | 741,000 | | $ | 10.00 | | | 2/03/2010 | | | 2/3/2020 | |
| | | 741,000 | | | 494,000 | | $ | 4.15 | | | 2/03/2010 | | | 2/3/2020 | |
| | | — | | | 1,105,991 | | $ | 4.15 | | | 4/11/2011 | | | 4/11/2021 | |
| | | 1,852,200 | | | 2,340,991 | | | | | | | | | | |
Ronald J. Domanico | | |
192,000 | | |
288,000 | |
$ |
10.00 | | |
6/8/2010 | | |
6/8/2020 | |
| | | 128,000 | | | 192,000 | | $ | 4.15 | | | 6/8/2010 | | | 6/8/2020 | |
| | | — | | | 460,829 | | $ | 4.15 | | | 4/11/2011 | | | 4/11/2021 | |
| | | 320,000 | | | 940,829 | | | | | | | | | | |
Anesa Chaibi | | |
240,825 | | |
160,550 | |
$ |
10.00 | | |
2/03/2010 | | |
2/3/2020 | |
| | | 160,550 | | | 107,034 | | $ | 4.15 | | | 2/03/2010 | | | 2/3/2020 | |
| | | — | | | 921,659 | | $ | 4.15 | | | 4/11/2011 | | | 4/11/2021 | |
| | | 401,375 | | | 1,189,243 | | | | | | | | | | |
John Stegeman | | |
260,000 | | |
390,000 | |
$ |
10.00 | | |
6/8/2010 | | |
6/8/2020 | |
| | | 173,333 | | | 260,000 | | $ | 4.15 | | | 6/8/2010 | | | 6/8/2020 | |
| | | — | | | 92,166 | | $ | 4.15 | | | 4/11/2011 | | | 4/11/2021 | |
| | | 433,334 | | | 742,166 | | | | | | | | | | |
Mark Fabere | | |
— | | |
90,000 | |
$ |
10.00 | | |
5/14/2012 | | |
5/14/2022 | |
| | | — | | | 60,000 | | $ | 5.89 | | | 5/14/2012 | | | 5/14/2022 | |
| | | — | | | 120,000 | | $ | 10.00 | | | 11/8/2012 | | | 11/8/2022 | |
| | | — | | | 80,000 | | $ | 6.20 | | | 11/8/2012 | | | 11/8/2022 | |
| | | — | | | 350,000 | | | | | | | | | | |
Option Exercises and Stock Vested for Fiscal 2012
None of our named executive officers exercised any of their stock options during fiscal 2012. No stock awards have been granted to our named executive officers.
Pension Benefits and Nonqualified Deferred Compensation for Fiscal 2012
We do not provide any defined benefit plans or nonqualified deferred compensation plans to our named executive officers.
Potential Payments upon Termination or Change in Control
Pursuant to either their employment arrangements or the Company's historical practice, in the event of termination without cause on February 3, 2013, the last day of fiscal 2012, all of our NEOs would be entitled to up to 24 months of base pay continuation. For Mr. DeAngelo, Mr. Domanico, Ms. Chaibi, Mr. Stegeman and Mr. Fabere, these amounts would be up to $1,750,000, $1,124,760, $1,050,840, $1,450,000 and $570,000, respectively.
The employment arrangements do not provide for any payout upon termination as a result of death, retirement, disability, or termination for cause.
If there is a change in control, the Stock Plan provides for accelerated vesting of unvested stock options. Had a change in control occurred on February 3, 2013, only those options having a strike price of $4.15 or $5.89 would have provided a benefit as the value of our common stock on such date did not exceed the strike price of other outstanding options. Our most recent independent valuation, completed in November 2012, valued our common stock at $6.20 per share. Assuming this stock price as of
160
Table of Contents
February 3, 2013, our NEOs would have received a benefit from the accelerated vesting of unvested stock options in the following amounts: Mr. DeAngelo—$3,279,982; Mr. Domanico—$1,338,299; Ms. Chaibi—$2,108,820; Mr. Stegeman—$721,941; and Mr. Fabere—$18,600.
Stock Plan
Under the Stock Plan, an executive's unvested stock options are canceled upon the termination of his or her employment, except for terminations due to death or disability. Upon death or disability, unvested stock options vest and remain exercisable. In the case of a termination for "cause" (as defined in the Stock Plan), the executive's unvested and vested stock options are canceled as of the effective date of the termination. Following a termination of employment other than for "cause", vested options are canceled unless the executive exercises them within 90 days (180 days if the termination was due to death, disability or retirement) or, if sooner, prior to the options' normal expiration date.
If any termination of employment occurs prior to a public offering, the Company and the Equity Sponsors have the right to purchase any shares of Holding common stock that the executive acquired upon the exercise of options. Upon a termination other than for cause (as defined in the Stock Plan), the purchase price per share is equal to the fair market value (as defined in the Stock Plan) of the shares on the later of the date (i) the executive's employment terminated and (ii) that is six months and one day after the shares were purchased by the executive. Upon termination for cause, the purchase price is equal to the lesser of fair market value and the cost of the shares to the executive.
If the Company experiences a change in control (as defined in the Stock Plan), stock options will generally accelerate and be canceled in exchange for a cash payment equal to the change in control price per share minus the exercise price of the applicable option, unless our Board of Directors elects to provide for alternative awards in lieu of acceleration and payment. Our Board of Directors also has the discretion to accelerate the vesting of options at any time and from time to time.
Under the Stock Plan a "change in control" is defined as:
- •
- the acquisition by any person, entity or "group" (as defined in Section 13(d) of the Securities Exchange Act of 1934, as amended) of 50% or more of the combined voting power of the Company's then outstanding voting securities, other than any such acquisition by the Company, any of its subsidiaries, any associate benefit plan of the Company or any of its subsidiaries, or by the Equity Sponsors, or any affiliates of any of the foregoing;
- •
- the merger, consolidation or other similar transaction involving the Company, as a result of which persons who were stockholders of the Company immediately prior to such merger, consolidation, or other similar transaction do not, immediately thereafter, own, directly or indirectly, more than 50% of the combined voting power entitled to vote generally in the election of directors of the merged or consolidated Company; or
- •
- the sale, transfer or other disposition of all or substantially all of the assets of the Company to one or more persons or entities that are not, immediately prior to such sale, transfer or other disposition, affiliates of the Company.
A public offering of HD Supply Holdings Inc.'s common shares does not constitute a change in control.
161
Table of Contents
ITEM 12. SECURITY OWNERSHIP OF CERTAIN BENEFICIAL OWNERS AND MANAGEMENT
Security Ownership of Certain Beneficial Owners and Management
HDS Holding Corporation owns all of our outstanding common stock and HD Supply Holdings, Inc. owns all of the outstanding common stock of HDS Holding Corporation.
The following table sets forth information as of March 31, 2013 with respect to the beneficial ownership of the common stock of HD Supply Holdings, Inc. by:
- •
- each person known to own beneficially more than 5% of the common stock of HD Supply Holdings, Inc.;
- •
- each director;
- •
- each of the named executive officers; and
- •
- all directors and executive officers as a group.
The amounts and percentages of shares beneficially owned are reported on the basis of SEC regulations governing the determination of beneficial ownership of securities. Under SEC rules, a person is deemed to be a "beneficial owner" of a security if that person has or shares voting power or investment power, which includes the power to dispose of or to direct the disposition of such security. A person is also deemed to be a beneficial owner of any securities of which that person has a right to acquire beneficial ownership within 60 days of the determination date, which in the case of the following table is March 31, 2013. Securities that can be so acquired are deemed to be outstanding for purposes of computing such person's ownership percentage, but not for purposes of computing any other person's percentage. Under these rules, more than one person may be deemed to be a beneficial owner of the same securities and a person may be deemed to be a beneficial owner of securities as to which such person has no economic interest.
The percentage of beneficial ownership is based on 261,157,339 shares of our common stock outstanding as of March 31, 2013.
Except as otherwise indicated in the footnotes to this table, each of the beneficial owners listed has, to our knowledge, sole voting and investment power with respect to the indicated shares of
162
Table of Contents
common stock. Unless otherwise indicated, the address for each individual listed below is c/o HD Supply Holdings, Inc., 3100 Cumberland Boulevard, Suite 1480, Atlanta, Georgia 30339.
| | | | | | | |
| | Shares Beneficially Owned | |
|---|
Name and address of beneficial owner | | Number | | Percentage | |
|---|
Bain Capital Integral Investors 2006, LLC(1)(9) | | | 72,943,750 | | | 27.93 | |
Carlyle Partners V, L.P. and related funds(2)(9) | | | 72,943,750 | | | 27.93 | |
Clayton, Dubilier & Rice Fund VII, L.P. and related funds(3)(9) | | | 72,923,750 | | | 27.92 | |
THD Holdings, LLC(9) | | | 32,500,000 | | | 12.44 | |
James G. Berges(6) | | | — | | | — | |
Joseph J. DeAngelo(4) | | | 2,252,500 | | | * | |
Paul B. Edgerley(5) | | | — | | | — | |
Vipul Amin(7) | | | — | | | — | |
Mitchell Jacobson(8)(9) | | | 8,618,750 | | | 3.30 | |
Lew Klessel(5) | | | — | | | — | |
Brian A. Bernasek(7) | | | — | | | — | |
Nathan K. Sleeper(6) | | | — | | | — | |
Gregory Ledford(7) | | | — | | | — | |
Stephen M. Zide(5) | | | — | | | — | |
Ronald J. Domanico(4) | | | 370,000 | | | * | |
Anesa Chaibi(4) | | | 421,375 | | | * | |
Mark Fabere(4) | | | 30,000 | | | * | |
John A. Stegeman(4) | | | 507,334 | | | * | |
All executive officers and directors as a group (17 persons) | | | 13,579,459 | | | 5.01 | |
- *
- Less than 1%
- (1)
- Bain Capital Investors, LLC ("BCI") is the administrative member of Bain Capital Integral Investors 2006, LLC ("Integral"). Voting and investment determinations with respect to the shares held by Integral are made by an investment committee comprised of the following managing directors of BCI: Andrew Balson, Steven Barnes, Joshua Bekenstein, Louis Bremer, John Connaughton, Todd Cook, Paul Edgerley, Christopher Gordon, Blair Hendrix, Jordan Hitch, David Humphrey, John Kilgallon, Lew Klessel, Matthew Levin, Ian Loring, Philip Loughlin, Seth Meisel, Mark Nunnelly, Stephen Pagliuca, Ian Reynolds, Mark Verdi and Stephen Zide. As a result, and by virtue of the relationships described in this footnote, the investment committee of BCI may be deemed to exercise voting and dispositive power with respect to the shares held by Integral. Each of the members of the investment committee of BCI disclaims beneficial ownership of such shares. The address of each of BCI and Integral is c/o Bain Capital Investors, LLC, John Hancock Tower, 200 Clarendon Street, Boston, MA 02116.
- (2)
- Represents shares held by the following investment funds associated with Carlyle: Carlyle Partners V, L.P., Carlyle Partners V-A, L.P., CP V Coinvestment A, L.P., and CP V Coinvestment B, L.P., which are together referred to as the "Carlyle Funds." Carlyle Partners, V, L.P. holds 68,580,768 shares, Carlyle Partners V-A, L.P. holds 1,379,063 shares, CP V Coinvestment A, L.P. holds 2,641,536 shares, and CP V Coinvestment B, L.P. holds 342,383 shares. Carlyle Group Management L.L.C. is the general partner of The Carlyle Group L.P., which is a publicly traded entity listed on NASDAQ.
- The Carlyle Group L.P. is the managing member of Carlyle Holdings II GP L.L.C., which is the general partner of Carlyle Holdings II L.P., which is the general partner of TC Group Cayman Investment Holdings, L.P., which is the general partner of TC Group Cayman Investment Holdings Sub L.P. TC Group Cayman Investment Holdings Sub L.P. is the managing member of TC
163
Table of Contents
Group V, L.L.C., which is the general partner of TC Group V, L.P., which is the general partner of each of the Carlyle Funds. Accordingly, Carlyle Group Management L.L.C. and each of the entities mentioned in this paragraph may be deemed to share beneficial ownership of the shares of common stock owned of record by the Carlyle Funds.
- The address for each of Carlyle Partners V, L.P., Carlyle Partners V-A, L.P., CP V Coinvestment A, L.P. and CP V Coinvestment B, L.P. is c/o The Carlyle Group, 1001 Pennsylvania Avenue NW, Suite 220 South, Washington, DC 20004.
- (3)
- Represents shares held by the following group of investment funds associated with or designated by Clayton, Dubilier & Rice, LLC: (i) 60,000,000 shares of common stock held by Clayton, Dubilier & Rice Fund VII, L.P., whose general partner is CD&R Associates VII, Ltd., whose sole stockholder is CD&R Associates VII, L.P., whose general partner is CD&R Investment Associates VII, Ltd.; (ii) 427,208 shares of common stock held by CD&R Parallel Fund VII, L.P., whose general partner is CD&R Parallel Fund Associates VII, Ltd.; and (iii) 12,496,542 shares of common stock held by Clayton, Dubilier & Rice Fund VII (Co-Investment), L.P., whose general partner is CD&R Associates VII (Co-Investment), Ltd., whose sole stockholder is CD&R Associates VII, L.P., whose general partner is CD&R Investment Associates VII, Ltd. CD&R Investment Associates VII, Ltd. and CD&R Parallel Fund Associates VII, Ltd. are each managed by a two-person board of directors. Donald J. Gogel and Kevin J. Conway, as the directors of each of CD&R Investment Associates VII, Ltd. and CD&R Parallel Fund Associates VII, Ltd., may be deemed to share beneficial ownership of the shares shown as beneficially owned by Clayton, Dubilier & Rice Fund VII, L.P., CD&R Parallel Fund VII, L.P. and Clayton, Dubilier & Rice Fund VII (Co-Investment), L.P. Such persons expressly disclaim such beneficial ownership.
Investment and voting decisions with respect to shares held by each of Clayton, Dubilier & Rice Fund VII, L.P., CD&R Parallel Fund VII, L.P. and Clayton, Dubilier & Rice Fund VII (Co-Investment), L.P. are made by an investment committee of limited partners of CD&R Associates VII, L.P., currently consisting of more than ten individuals (the "Investment Committee"). All members of the Investment Committee disclaim beneficial ownership of the shares shown as beneficially owned by the funds associated with Clayton, Dubilier & Rice, LLC.
Each of CD&R Associates VII, Ltd., CD&R Associates VII, L.P. and CD&R Investment Associates VII, Ltd. expressly disclaims beneficial ownership of the shares held by Clayton, Dubilier & Rice Fund VII, L.P., as well as of the shares held by each of Clayton, Dubilier & Rice Fund VII (Co-Investment) L.P. and CD&R Parallel Fund VII, L.P. CD&R Parallel Fund Associates VII, Ltd. expressly disclaims beneficial ownership of the shares held by each of CD&R Parallel Fund VII, L.P., Clayton, Dubilier & Rice Fund VII, L.P. and Clayton, Dubilier & Rice Fund VII (Co-Investment), L.P.
The address for each of Clayton Dubilier & Rice Fund VII, L.P., CD&R Parallel Fund VII, L.P., Clayton, Dubilier & Rice Fund VII (Co-Investment), L.P., CD&R Associates VII (Co-Investment), Ltd., CD&R Associates VII, Ltd., CD&R Associates VII, L.P., CD&R Parallel Fund Associates VII, Ltd. and CD&R Investment Associates VII, Ltd. is c/o Maples Corporate Services Limited, P.O. Box 309, Ugland House, Grand Cayman, KY1-1104, Cayman Islands. The address for Clayton, Dubilier & Rice, LLC is 375 Park Avenue, 18th Floor, New York, NY 10152.
- (4)
- Includes, with respect to: (i) Joseph DeAngelo, 400,000 shares of common stock and 1,852,500 vested stock options (or vesting within 60 days of March 31, 2013); (ii) Ronald J. Domanico, 50,000 shares of common stock and 320,000 vested stock options (or vesting within 60 days of March 31, 2013); (iii) Anesa Chaibi, 20,000 shares of common stock and 401,375 vested stock options (or vesting within 60 days of March 31, 2013); (iv) Mark Fabere, 30,000 vested stock options (or vesting within 60 days of March 31, 2013); and (v) John A. Stegeman, 74,000 shares of common stock and 433,334 vested stock options (or vesting within 60 days of March 31, 2013). On
164
Table of Contents
or about December 27, 2012, the 400,000 shares of common stock attributed to Mr. DeAngelo in (i) above were transferred by Mr. DeAngelo to a Trust, with respect to which Mr. DeAngelo's wife serves as Trustee. Mr. DeAngelo disclaims any beneficial ownership of such shares held by the Trust.
- (5)
- Does not include shares of common stock held by Integral. Each of Messrs. Edgerley, Klessel and Zide is a Managing Director and serves on the investment committee of BCI and as a result, and by virtue of the relationships described in footnote (1) above, may be deemed to share beneficial ownership of the shares held by Integral. Each of Messrs. Edgerley, Klessel and Zide disclaims beneficial ownership of such shares. The address of each of Messrs. Edgerley, Klessel and Zide is c/o Bain Capital Investors, LLC, John Hancock Tower, 200 Clarendon Street, Boston, MA 02116.
- (6)
- Does not include 72,923,750 shares of common stock held by investment funds associated with or designated by Clayton, Dubilier & Rice, LLC. Messrs. Berges and Sleeper are directors of HD Supply and executives of Clayton, Dubilier & Rice, LLC. They disclaim any beneficial ownership of the shares held by investment funds associated with or designated by Clayton, Dubilier & Rice, LLC.
- (7)
- Does not include 72,943,750 shares of common stock held by investment funds associated with or designated by Carlyle. Messrs. Amin, Bernasek and Ledford are directors of HD Supply and executives of Carlyle. They disclaim any beneficial ownership of the shares held by investment funds associated with or designated by The Carlyle Group.
- (8)
- Includes (i) 8,515,000 shares of common stock held by JFI-HDS, LLC; Mr. Jacobson is the managing member of JFI-HDS Partner, LLC which is the managing member of JFI-HDS, LLC, and (ii) 103,750 shares held by JFI-HDS Affiliates, LLC; Mr. Jacobson is the managing member of JFI-HDS Partner, LLC which is the managing member of JFI-HDS Affiliates, LLC.
- (9)
- Excludes shares of common stock owned by other parties to the Second Amended and Restated Stockholders Agreement of which they may be deemed to share beneficial ownership. Each person disclaims beneficial ownership of such shares.
165
Table of Contents
Equity Compensation Plan Information
| | | | | | | | | | |
Plan category | | Number of securities
to be issued upon
exercise of
outstanding options,
warrants and rights
(a) | | Weighted-average
exercise price of
outstanding options,
warrants and rights
($)
(b) | | Number of securities
remaining available for
future issuance under
equity compensation plans
(excluding securities
reflected in column (a))
(c) | |
|---|
Equity compensation plans approved by security holders | | | — | | | — | | | — | |
Equity compensation plans not approved by security holders | | | | | | | | | | |
Stock options granted under the HDS Investment Holding, Inc. Stock Incentive Plan(1) | | |
29,636,120 | | |
6.50 | | |
1,294,602 |
(1) |
Common stock sold or granted to participants under the HDS Investment Holding, Inc. Stock Incentive Plan(1) | | |
1,157,339 | | |
N/A | | |
24,853,052 |
(1) |
Deferred Share Units granted to participants under the HDS Investment Holding, Inc. Stock Incentive Plan(1) | | |
— | | |
N/A | | |
24,853,052 |
(1) |
| | | | | | | | |
Total | | | 30,793,459 | | | N/A | | | 24,853,052 | (1) |
| | | | | | | | |
(1) Pursuant to the HDS Investment Holding, Inc. Stock Incentive Plan, the board of directors of Holding is authorized to grant or sell, as the case may be, stock options, common stock and deferred share units up to a total of 55,646,511 shares of common stock, of which 30,930,722 may be issued in the form of stock options. Accordingly, the amounts set forth in column (c) reflect the maximum number of shares of common stock issuable within each category. However, the maximum number of shares remaining available for future issuance in any combination cannot exceed 24,853,052. See "Item 8. Financial Statements and Supplementary Data—Notes to Consolidated Financial Statements—Note 9, Stock-Based Compensation and Employee Benefit Plans" for a description of the Stock Incentive Plan.
166
Table of Contents
ITEM 13. CERTAIN RELATIONSHIPS AND RELATED TRANSACTIONS, AND DIRECTOR INDEPENDENCE
Stockholders agreement and stockholder arrangements
In connection with the closing of the 2007 Acquisition, Holding, the Equity Sponsors and their affiliates and certain other stockholders of HD Supply entered into a stockholders agreement that contains, among other things, provisions relating to our governance and certain approval rights. This stockholders agreement provides that affiliates of the Equity Sponsors who are stockholders of HD Supply are entitled to elect (or cause to be elected) nine out of the ten HD Supply directors, which will include three designees of each Equity Sponsor. Our Chief Executive Officer also serves as a director. One of the directors designated by the Equity Sponsor associated with CD&R serves as the chairman.
Pursuant to an agreement between Clayton, Dubilier & Rice Fund VII, L.P. and Mitchell Jacobson, Clayton, Dubilier & Rice Fund VII, L.P. agreed to appoint Mr. Jacobson to serve as a director of HD Supply for so long as Mr. Jacobson and his immediate family continue to hold certain minimum investments in HD Supply and certain other conditions are met.
Registration Rights Agreement
Holding is a party to an amended and restated registration rights agreement (the "Registration Rights Agreement") with certain of its stockholders, including the Equity Sponsors. The Registration Rights Agreement grants to the Equity Sponsors certain registration rights and includes customary indemnification provisions.
Consulting agreements
In connection with the closing of the 2007 Acquisition, HD Supply and Holding entered into consulting agreements with the Equity Sponsors (or their respective affiliates), pursuant to which the Equity Sponsors provide us with financial advisory and management consulting services. Pursuant to the consulting agreements, we pay the Equity Sponsors an aggregate annual fee of $4.5 million for such services, subject to adjustments from time to time, and we may pay to the Equity Sponsors an aggregate fee equal to a specified percentage of the transaction value of certain types of transactions that we complete, in each case, plus out-of-pocket expenses and subject to approval by the Equity Sponsors, their permitted transferees or their designated affiliates who are shareholders of Holding. Each consulting agreement expires by its terms in August 2017.
Indemnification agreements
In connection with the 2007 Acquisition, we entered into indemnification agreements with HDS and the Equity Sponsors pursuant to which, following the completion of the 2007 Acquisition, we agreed to indemnify the Equity Sponsors, their respective managers, administrative members and the administrative members or general partners of any other investment vehicle that is our stockholder and is managed by such manager or its affiliates and their respective successors and assigns, and the respective directors, officers, shareholders, partners, members, employees, agents, advisors, consultants, representatives and controlling persons of each of them, or of their partners, shareholders or members in their capacity as such, against certain liabilities arising out of performance of the 2007 Acquisition, the performance of the consulting agreements described above under "—Consulting agreements," securities offerings by us and certain other claims and liabilities. We and Holding also entered into a similar indemnification agreement with Home Depot providing for indemnification of Home Depot, its affiliates, directors, officers, shareholders, partners, members, employees, agents, representatives and controlling persons against certain liabilities arising from securities offerings by us.
167
Table of Contents
Tax sharing arrangements
In connection with the 2007 Acquisition, Home Depot has agreed to be responsible for and pay any taxes that were reportable in a tax return that included Home Depot or any subsidiary of Home Depot and also included HDS or any of its subsidiaries, except for taxes relating to a period before HDS or its subsidiary was acquired, directly or indirectly, by Home Depot.
The Internal Revenue Service has disallowed certain deductions claimed by us and has issued a formal Revenue Agent's Report challenging certain of the cash refunds resulting from our carryback of NOLs to taxable years during which we were a member of Home Depot's U.S. federal consolidated tax group. The carryback of the NOLs was made in accordance with (and subject to the terms of) the Tax Cooperation Agreement. Pursuant to the Tax Cooperation Agreement, if the IRS is ultimately successful with respect to the proposed adjustments, we would be required to reimburse Home Depot an amount equal to the disallowed refunds plus related interest. See "Risk Factors—Risks Relating to Our Business—Income tax payments may ultimately differ from amounts currently recorded by us. Future tax law changes may materially increase our prospective income tax expense."
Agreements with Home Depot
Upon the closing of the 2007 Acquisition, we entered into the following agreements with Home Depot and/or its affiliates:
- •
- a Strategic Purchase Agreement, as subsequently amended effective February 4, 2013, pursuant to which the parties agreed to terms relating to (i) the purchase by Home Depot U.S.A., Inc. and its affiliates of certain products from Crown Bolt for a term to end no later than January 31, 2020, (ii) related intellectual property matters and (iii) the provision of related services;
- •
- a Supplier Buying Agreement, pursuant to which the parties agree to certain terms and conditions relating to (i) the purchase by Home Depot U.S.A., Inc. and its affiliates of products from Crown Bolt pursuant to the Strategic Purchase Agreement and (ii) the provision of related in-store services and displays; and
- •
- a Trademark License granting Crown Bolt the royalty-free right to use a number of trademarks in connection with its activities under the Strategic Purchase Agreement.
In addition, certain guarantees, surety bonds and letters of credit that Home Depot and/or its affiliates (other than HD Supply, HD Supply Canada, Inc. and their respective affiliates) entered into prior to the closing of the 2007 Acquisition relate to our and our subsidiaries' obligations to landlords, customers and suppliers, and remained in place immediately after the closing of the 2007 Acquisition. Holding agreed in the purchase and sale agreement to fully indemnify Home Depot and its affiliates from any losses that arise out of these obligations. Holding also agreed to use its reasonable best efforts to cause itself and/or HD Supply to be substituted for Home Depot and/or its affiliates and to have Home Depot and its affiliates released in respect of certain such obligations.
Debt Securities of HD Supply
Pursuant to one or more exchange and/or purchase agreements, in connection with the Refinancing Transactions, Bain and Carlyle exchanged certain of the Old Senior Notes held by them for a portion of the 14.875% Senior Notes, and CD&R purchased a portion of the 14.875% Senior Notes from us for cash. The net proceeds from the offering of the April 2012 First Priority Notes and the Second Priority Notes, together with other sources were used to redeem the Old Senior Notes and fund the other Refinancing Transactions. A portion of the Old Senior Notes redeemed were owned by Bain and Carlyle. During fiscal 2012, HD Supply issued and repurchased the 14.875% Senior Notes to and from certain affiliates of the Equity Sponsors.
168
Table of Contents
In addition, management of the Company has been informed that, as of February 3, 2013, affiliates of certain of the Equity Sponsors beneficially owned approximately $348 million aggregate principal amount, or 39%, of the Old Senior Subordinated Notes and approximately $49 million aggregate principal amount of HD Supply's other outstanding indebtedness. HD Supply redeemed the entire outstanding $889 million aggregate principal amount of the Old Senior Subordinated Notes on February 8, 2013. Affiliates of the Equity Sponsors that held the Old Senior Subordinated Notes had such notes redeemed.
Transactions with Other Related Parties
HD Supply purchased product from affiliates of the Equity Sponsors for approximately $57 million, $60 million, and $24 million in fiscal 2012, fiscal 2011, and fiscal 2010, respectively. Management believes these transactions were conducted at prices that an unrelated third party would pay.
ITEM 14. PRINCIPAL ACCOUNTANT FEES AND SERVICES
PricewaterhouseCoopers LLP acts as HD Supply's principal accountant and also provides certain audit-related, tax and other services. The Audit Committee has established a pre-approval policy for services to be performed by PricewaterhouseCoopers. Under this policy, the Audit Committee approves engagements when the engagements have been presented in reasonable detail to the Audit Committee before services are undertaken.
The fees for services provided by PricewaterhouseCoopers (all of which were pre-approved by the Audit Committee) to HD Supply in fiscal 2012 and fiscal 2011 were as follows:
Audit Fees
- •
- Audit Fees were $3.3 million and $2.2 million for fiscal 2012 and fiscal 2011, respectively. Included in this category are fees for the annual financial statement audit and quarterly financial statement reviews. The increase in fiscal 2012 fees was driven by additional requirements related to the refinancing of HD Supply's indebtedness.
Audit-Related Fees
- •
- Audit-Related Fees were $0.5 million and $1.6 million for fiscal 2012 and fiscal 2011, respectively. These fees, which are for assurance and related services other than those included in Audit Fees, in fiscal 2011 were driven by requirements related to the divestiture of certain businesses. Additionally, the fees include charges for consultations concerning financial accounting and reporting standards and assessment and testing of and making recommendations for improvements in internal control over financial reporting.
Tax Fees
- •
- Tax Fees were $0.6 million and $0.7 million for fiscal 2012 and fiscal 2011, respectively. These fees include charges for various Federal, state, local and international tax compliance and research projects.
All Other Fees
- •
- There were no Other Fees for fiscal 2012 or fiscal 2011.
169
Table of Contents
PART IV
ITEM 15. EXHIBITS AND FINANCIAL STATEMENT SCHEDULES, CONTINUED
(a)(1) Financial Statements
The following financial statements are set forth in Item 8 hereof:
- –
- Report of Independent Registered Public Accounting Firm;
- –
- Consolidated Statements of Operations and Comprehensive Income (Loss) for (i) the fiscal year ended February 3, 2013, (ii) the fiscal year ended January 29, 2012, and (iii) the fiscal year ended January 30, 2011;
- –
- Consolidated Balance Sheets as of February 3, 2013 and January 29, 2012;
- –
- Consolidated Statements of Stockholder's Equity (Deficit) for (i) the fiscal year ended February 3, 2013, (ii) the fiscal year ended January 29, 2012, and (iii) the fiscal year ended January 30, 2011;
- –
- Consolidated Statements of Cash Flows for (i) the fiscal year ended February 3, 2013, (ii) the fiscal year ended January 29, 2012, and (iii) the fiscal year ended January 30, 2011;
- –
- Notes to Consolidated Financial Statements.
(b) Exhibit Index
| | | |
Exhibit
Number | | Exhibit Description |
|---|
| | 2.1 | | Purchase and Sale Agreement, dated as of June 19, 2007, by and between The Home Depot, Inc., THD Holdings, LLC, Home Depot International, Inc., Homer TLC, Inc. and Pro Acquisition Corporation.(1) |
|
2.2 |
|
Letter Agreement, dated August 14, 2007, by and between The Home Depot, Inc., THD Holdings, LLC, Home Depot International, Inc., Homer TLC, Inc. and Pro Acquisition Corporation.(1) |
|
2.3 |
|
Amendment, dated as of August 27, 2007, by and between The Home Depot, Inc., THD Holdings, LLC, Home Depot International, Inc., Homer TLC, Inc. and HDS Investment Holding, Inc. and HDS Acquisition Subsidiary, Inc.(1) |
|
3.1 |
|
Certificate of Incorporation of HD Supply, Inc.(1) |
|
3.2 |
|
By-Laws of HD Supply, Inc.(1) |
|
4.1 |
|
Indenture, dated as of April 12, 2012, among HD Supply, Inc., as issuer, the Subsidiary Guarantors from time to time parties thereto, and Wilmington Trust, National Association, as trustee and note collateral agent, relating to the 81/8% Senior Secured First Priority Notes due 2019.(7) |
|
4.2 |
|
First Supplemental Indenture, dated as of April 12, 2012, among HD Supply, Inc., as issuer, the Subsidiary Guarantors named therein, and Wilmington Trust, National Association, as trustee, relating to the 81/8% Senior Secured First Priority Notes due 2019.(7) |
|
4.3 |
|
Second Supplemental Indenture, dated as of July 27, 2012, among Varsity AP Holding Corporation, GCP Amerifile Coinvest Inc., Varsity AP Holdings LLC, Amerifile, LLC, Peachtree Business Products, LLC, AP RE LLC, HD Supply, Inc. and Wilmington Trust, National Association, as trustee, relating to the 81/8% Senior Secured First Priority Notes due 2019.(8) |
170
Table of Contents
| | | |
Exhibit
Number | | Exhibit Description |
|---|
| | 4.4 | | Third Supplemental Indenture, dated as of August 2, 2012, among HD Supply, Inc., as issuer, the Subsidiary Guarantors named therein, and Wilmington Trust, National Association, as trustee, relating to the 81/8% Senior Secured First Priority Notes due 2019.(8) |
|
4.5 |
|
Indenture, dated as of April 12, 2012, among HD Supply, Inc., as issuer, the Subsidiary Guarantors from time to time parties thereto, and Wilmington Trust, National Association, as trustee and note collateral agent, relating to the 11% Senior Secured Second Priority Notes due 2020.(7) |
|
4.6 |
|
First Supplemental Indenture, dated as of April 12, 2012, among HD Supply, Inc., as issuer, the Subsidiary Guarantors named therein, and Wilmington Trust, National Association, as trustee, relating to the 11% Senior Secured Second Priority Notes due 2020.(7) |
|
4.7 |
|
Second Supplemental Indenture, dated as of July 27, 2012, among Varsity AP Holding Corporation, GCP Amerifile Coinvest Inc., Varsity AP Holdings LLC, Amerifile, LLC, Peachtree Business Products, LLC, AP RE LLC, HD Supply, Inc. and Wilmington Trust, National Association, as trustee, relating to the 11% Senior Secured Second Priority Notes due 2020.(8) |
|
4.8 |
|
Indenture, dated as of October 15, 2012, among HD Supply, Inc., as issuer, the Subsidiary Guarantors from time to time parties thereto, and Wells Fargo Bank, National Association, as trustee, relating to the 11.50% Senior Notes due 2020.(9) |
|
4.9 |
|
Supplemental Indenture, dated as of October 15, 2012, among HD Supply, Inc., as issuer, the Subsidiary Guarantors named therein, and Wells Fargo Bank, National Association, as trustee, relating to the 11.50% Senior Notes due 2020.(9) |
|
4.10 |
|
Indenture, dated as of January 16, 2013, among HD Supply, Inc., as issuer, the Subsidiary Guarantors from time to time parties thereto, and Wells Fargo Bank, National Association, as trustee, relating to the 10.50% Senior Subordinated Notes due 2021.(10) |
|
4.11 |
|
First Supplemental Indenture, dated as of January 16, 2013, among HD Supply, Inc., as issuer, the Subsidiary Guarantors named therein, and Wells Fargo Bank, National Association, as trustee, relating to the 10.50% Senior Subordinated Notes due 2021.(10) |
|
4.12 |
|
Indenture, dated as of February 1, 2013, among HD Supply, Inc., as issuer, the Subsidiary Guarantors from time to time parties thereto, and Wells Fargo Bank, National Association, as trustee, relating to the 7.50% Senior Notes due 2020.(11) |
|
4.13 |
|
First Supplemental Indenture, dated as of February 1, 2013, among HD Supply, Inc., as issuer, the Subsidiary Guarantors named therein, and Wells Fargo Bank, National Association, as trustee, relating to the 7.50% Senior Notes due 2020.(11) |
|
4.14 |
|
Exchange and Registration Rights Agreement, dated as of February 1, 2013, among HD Supply, Inc., as issuer, the Subsidiary Guarantors named therein, and Merrill, Lynch, Pierce, Fenner & Smith Incorporated and the other financial institutions named therein, relating to the 7.50% Senior Notes due 2020.(11) |
|
4.15 |
|
Form of 81/8% Senior Secured First Priority Note due 2019 (included in Exhibit 4.1 hereto). |
|
4.16 |
|
Form of 11% Senior Secured Second Priority Note due 2020 (included in Exhibit 4.5 hereto). |
|
4.17 |
|
Form of 11.50% Senior Note due 2020 (included in Exhibit 4.8 hereto). |
|
4.18 |
|
Form of 10.50% Senior Subordinated Note due 2021 of HD Supply, Inc. (included in Exhibit 4.10 hereto). |
171
Table of Contents
| | | |
Exhibit
Number | | Exhibit Description |
|---|
| | 4.19 | | Form of 7.50% Senior Note due 2020 of HD Supply, Inc. (included in Exhibit 4.12 hereto). |
|
10.1 |
|
Credit Agreement, dated as of April 12, 2012, among HD Supply, Inc., as borrower, the several lenders and financial institutions from time to time parties thereto, Bank of America, N.A., as administrative agent and collateral agent for the lenders party thereto, and the other parties thereto.(7) |
|
10.2 |
|
Guarantee and Collateral Agreement, dated as of April 12, 2012 among HD Supply, Inc., the Subsidiary Guarantors named therein, in favor of Bank of America, N.A., as administrative agent and collateral agent for the banks and other financial institutions from time to time parties to the Credit Agreement.(7) |
|
10.3 |
|
ABL Credit Agreement, dated as of April 12, 2012, among HD Supply, Inc., as parent borrower, the Subsidiary Borrowers from time to time parties thereto, HD Supply Canada, Inc, as Canadian borrower, the several lenders and financial institutions from time to time parties thereto, General Electric Capital Corporation, as administrative agent and U.S. ABL collateral agent for the lenders party thereto, GE Canada Finance Holding Company, as Canadian agent and Canadian collateral agent for the lenders party thereto, and the other parties thereto.(7) |
|
10.4 |
|
ABL Joinder Agreement, dated as of July 27, 2012, among HD Supply, Inc., as parent borrower, certain operating subsidiaries of the Parent Borrower signatory thereto and consented to by the other Loan Parties, General Electric Capital Corporation, as administrative agent and U.S. ABL collateral agent for the lenders party to the ABL Credit Agreement, GE Canada Finance Holding Company, as Canadian agent and Canadian collateral agent for the lenders party to the ABL Credit Agreement.(8) |
|
10.5 |
|
U.S. Guarantee and Collateral Agreement, dated as of April 12, 2012, among HD Supply, Inc., the Subsidiary Borrowers named therein, the Subsidiary Guarantors named therein, in favor of General Electric Capital Corporation, as U.S. ABL administrative agent and U.S. ABL collateral agent for the banks and other financial institutions from time to time parties to the ABL Credit Agreement.(7) |
|
10.6 |
|
Assumption Agreement, dated as of July 27, 2012, made by Varsity AP Holding Corporation, GCP Amerifile Coinvest Inc., Varsity AP Holdings LLC, Amerifile, LLC, Peachtree Business Products, LLC and AP RE LLC in favor of General Electric Capital Corporation, as administrative agent and U.S. ABL collateral agent for the lenders party to the ABL Credit Agreement, and the other parties thereto.(8) |
|
10.7 |
|
Supplemental Agreement, dated as of July 27, 2012, made by HD Supply Holdings, LLC in favor of General Electric Capital Corporation, as administrative agent and U.S. ABL collateral agent for the lenders party to the ABL Credit Agreement, and the other parties thereto.(8) |
|
10.8 |
|
Holding Pledge Agreement, dated as of April 12, 2012, by HDS Holding Corporation in favor of Bank of America, N.A., as collateral agent and administrative agent for the banks and other financial institutions from time to time parties to the Credit Agreement.(7) |
|
10.9 |
|
Assumption Agreement, dated as of July 27, 2012, made by Varsity AP Holding Corporation, GCP Amerifile Coinvest Inc., Varsity AP Holdings LLC, Amerifile, LLC, Peachtree Business Products, LLC and AP RE LLC in favor of Bank of America, N.A., as collateral agent and administrative for the lenders party to the Credit Agreement, and the other parties thereto.(8) |
172
Table of Contents
| | | |
Exhibit
Number | | Exhibit Description |
|---|
| | 10.10 | | Supplemental Agreement, dated as of July 27, 2012, made by HD Supply Holdings, LLC in favor of Bank of America, N.A., as collateral agent and administrative for the lenders party to the Credit Agreement, and the other parties thereto.(8) |
|
10.11 |
|
ABL Holding Pledge Agreement, dated as of April 12, 2012, by HDS Holding Corporation in favor of General Electric Capital Corporation, as administrative agent and collateral agent for the banks and other financial institutions from time to time parties to the ABL Credit Agreement.(7) |
|
10.12 |
|
Collateral Agreement, dated as of April 12, 2012, made by HD Supply, Inc. and the Subsidiaries named therein in favor of Wilmington Trust, National Association, as note collateral agent, relating to the 81/8% Senior Secured First Priority Notes due 2019.(7) |
|
10.13 |
|
Assumption Agreement, dated as of July 27, 2012, made by Varsity AP Holding Corporation, GCP Amerifile Coinvest Inc., Varsity AP Holdings LLC, Amerifile, LLC, Peachtree Business Products, LLC and AP RE LLC in favor of Wilmington Trust, National Association, as collateral agent, relating to the 81/8% Senior Secured First Priority Notes due 2019.(8) |
|
10.14 |
|
Supplemental Agreement, dated as of July 27, 2012, made by HD Supply Holdings, LLC in favor of Wilmington Trust, National Association, as collateral agent, relating to the 81/8% Senior Secured First Priority Notes due 2019.(8) |
|
10.15 |
|
Collateral Agreement, dated as of April 12, 2012, made by HD Supply, Inc. and the Subsidiaries named therein in favor of and Wilmington Trust, National Association, as note collateral agent, relating to the 11% Senior Secured Second Priority Notes due 2020.(7) |
|
10.16 |
|
Assumption Agreement, dated as of July 27, 2012, made by Varsity AP Holding Corporation, GCP Amerifile Coinvest Inc., Varsity AP Holdings LLC, Amerifile, LLC, Peachtree Business Products, LLC and AP RE LLC in favor of Wilmington Trust, National Association, as collateral agent, relating to the 11% Senior Secured Second Priority Notes due 2020.(8) |
|
10.17 |
|
Supplemental Agreement, dated as of July 27, 2012, made by HD Supply Holdings, LLC in favor of Wilmington Trust, National Association, as collateral agent, relating to the 11% Senior Secured Second Priority Notes due 2020.(8) |
|
10.18 |
|
Amendment No. 1 to Credit Agreement, dated as of February 15, 2013, among HD Supply, Inc., as borrower, Bank of America, N.A., as administrative agent and the several lenders and financial institutions party thereto.(11) |
|
10.19 |
|
Intercreditor Agreement, dated as of April 12, 2012, among the Bank of America, N.A., as collateral agent for the banks and other financial institutions party to the Credit Agreement, General Electric Capital Corporation, as collateral agent for the banks and other financial institutions party to the ABL Credit Agreement, Wilmington Trust, National Association, as note collateral agent for the 81/8% Senior Secured First Priority Notes due 2019, and Wilmington Trust, National Association, as note collateral agent for the 11% Senior Secured Second Priority Notes due 2020.(7) |
|
10.20 |
|
Cash Flow Intercreditor Agreement, dated as of April 12, 2012, among Bank of America, N.A., as collateral agent for the banks and other financial institutions party to the Credit Agreement, Wilmington Trust, National Association, as note collateral agent for the 81/8% Senior Secured First Priority Notes due 2019, and Wilmington Trust, National Association, as note collateral agent for the 11% Senior Secured Second Priority Notes due 2020.(7) |
173
Table of Contents
| | | |
Exhibit
Number | | Exhibit Description |
|---|
| | 10.21 | | Notice and Confirmation of Grant of Security Interest in Trademarks, dated as of April 12, 2012, made by subsidiaries of HD Supply, Inc. named therein in favor of Bank of America, N.A., as administrative agent and collateral agent for the banks and other financial institutions that are parties to the Credit Agreement.(7) |
|
10.22 |
|
Grant of Security Interest in Copyrights, dated as of April 12, 2012, made by subsidiaries of HD Supply, Inc. named therein in favor of Bank of America, N.A., as administrative agent and collateral agent for the banks and other financial institutions that are parties to the Credit Agreement.(7) |
|
10.23 |
|
ABL Notice and Confirmation of Grant of Security Interest in Trademarks, dated as of April 12, 2012, made by subsidiaries of HD Supply, Inc. named therein in favor of General Electric Capital Corporation, as administrative agent and collateral agent for the banks and other financial institutions that are parties to the ABL Credit Agreement.(7) |
|
10.24 |
|
ABL Grant of Security Interest in Copyrights, dated as of April 12, 2012, made by subsidiaries of HD Supply, Inc. named therein in favor of General Electric Capital Corporation, as administrative agent and collateral agent for the banks and other financial institutions that are parties to the ABL Credit Agreement.(7) |
|
10.25 |
|
First Lien Secured Note Notice and Confirmation of Grant of Security Interest in Trademarks, dated as of April 12, 2012, made by subsidiaries of HD Supply, Inc. named therein in favor of Wilmington Trust, National Association, as note collateral agent, relating to the 81/8% Senior Secured First Priority Notes due 2019.(7) |
|
10.26 |
|
First Lien Secured Note Grant of Security Interest in Copyrights, dated as of April 12, 2012, made by subsidiaries of HD Supply, Inc. named therein in favor of Wilmington Trust, National Association, as note collateral agent, relating to the 81/8% Senior Secured First Priority Notes due 2019.(7) |
|
10.27 |
|
Second Lien Secured Note Notice and Confirmation of Grant of Security Interest in Trademarks, dated as of April 12, 2012, made by subsidiaries of HD Supply, Inc. named therein in favor of Wilmington Trust, National Association, as note collateral agent, relating to the 11% Senior Secured Second Priority Notes due 2020.(7) |
|
10.28 |
|
Second Lien Secured Note Grant of Security Interest in Copyrights, dated as of April 12, 2012, made by subsidiaries of HD Supply, Inc. named therein in favor of Wilmington Trust, National Association, as note collateral agent, relating to the 11% Senior Secured Second Priority Notes due 2020.(7) |
|
10.29 |
* |
HD Supply Management Incentive Plan.(1) |
|
10.30 |
* |
HDS Investment Holding, Inc. Stock Incentive Plan.(5) |
|
10.31 |
* |
Home Depot Retention Agreement with Joseph DeAngelo, effective August 30, 2007.(1) |
|
10.32 |
* |
Letter of Continued Employment, dated as of August 10, 2007, by Pro Acquisition Corporation in favor of Joseph J. DeAngelo.(3) |
|
10.33 |
* |
Letter of Continued Employment, dated as of August 10, 2007, by Pro Acquisition Corporation in favor of Anesa T. Chaibi.(3) |
|
10.34 |
* |
Letter of Employment, dated as of April 14, 2010, by and between HD Supply, Inc. and Ronald J. Domanico.(4) |
174
Table of Contents
| | | |
Exhibit
Number | | Exhibit Description |
|---|
| | 10.35 | * | Letter of Employment, dated as of March 27, 2010, by and between HD Supply, Inc. and John Stegeman.(3) |
|
10.36 |
* |
Letter of Employment, dated as of August 3, 2012, by and between HD Supply, Inc. and Mark Fabere.(11) |
|
10.37 |
|
Tax Sharing Agreement, dated as of August 30, 2007, by and among HDS Investment Holding, Inc., HDS Acquisition Subsidiary, Inc. (which has been merged into HD Supply, Inc.), HDS Holding Corporation and HD Supply, Inc.(1) |
|
10.38 |
|
Strategic Purchase Agreement, dated August 30, 2007, between Home Depot USA, Inc. and HD Supply Distribution Services, LLC.(1)† |
|
10.39 |
|
Amendment to Strategic Purchase Agreement, dated as of February 3, 2013, between Home Depot U.S.A., Inc. and HD Supply Distribution Services, LLC.(11)† |
|
10.40 |
|
Consulting Agreement, dated August 30, 2007, by and among Bain Capital Partners, LLC, HDS Investment Holding, Inc. and HD Supply, Inc.(1) |
|
10.41 |
|
Consulting Agreement, dated August 30, 2007, by and among TC Group V, L.L.C., HDS Investment Holding, Inc. and HD Supply, Inc.(1) |
|
10.42 |
|
Consulting Agreement, dated August 30, 2007, by and among Clayton, Dubilier & Rice, Inc., HDS Investment Holding, Inc. and HD Supply, Inc.(1) |
|
10.43 |
|
Indemnification Agreement, dated as of August 30, 2007, by and among Bain Capital Integral Investors 2006, LLC, Bain Capital Partners, LLC, HDS Investment Holding, Inc. and HD Supply, Inc.(1) |
|
10.44 |
|
Indemnification Agreement, dated as of August 30, 2007, by and among Carlyle Partners V, L.P., Carlyle Partners V-A, L.P., CP V Coinvestment A, L.P., CP V Coinvestment B, L.P., TC Group V, L.L.C., HDS Investment Holding, Inc. and HD Supply, Inc.(1) |
|
10.45 |
|
Indemnification Agreement, dated as of August 30, 2007, by and among Clayton, Dubilier & Rice Fund VII, L.P., CD&R Parallel Fund VII, L.P., Clayton, Dubilier & Rice Fund VII (Co-Investment), L.P., HDS Investment Holding, Inc. and HD Supply, Inc.(1) |
|
10.46 |
|
Indemnification Agreement, dated as of August 30, 2007, by and among The Home Depot, Inc., HDS Investment Holding, Inc. and HD Supply, Inc.(1) |
|
10.47 |
|
Form of Indemnification Agreement.(2) |
|
10.48 |
|
Form of Employee Stock Option Agreement.(3) |
|
12.1 |
|
Computation of Ratio of Earnings to Fixed Charges(11) |
|
21.1 |
|
List of Subsidiaries(11) |
|
31.1 |
|
Certification of Chief Executive Officer, pursuant to Rule 13a-14(a) promulgated under the Securities Exchange Act of 1934, as amended(11) |
|
31.2 |
|
Certification of Chief Financial Officer, pursuant to Rule 13a-14(a) promulgated under the Securities Exchange Act of 1934, as amended(11) |
|
32.1 |
|
Certification of Chief Executive Officer, pursuant to 18 U.S.C. Section 1350, as adopted pursuant to Section 906 of the Sarbanes-Oxley Act of 2002(11) |
175
Table of Contents
| | | |
Exhibit
Number | | Exhibit Description |
|---|
| | 32.2 | | Certification of Chief Executive Officer, pursuant to 18 U.S.C. Section 1350, as adopted pursuant to Section 906 of the Sarbanes-Oxley Act of 2002(11) |
|
101 |
|
The following financial information from the Annual Report on Form 10-K for the fiscal year ended February 3, 2013, formatted in XBRL (Extensible Business Reporting Language) and furnished electronically herewith: (i) the Consolidated Statements of Operations and Comprehensive Income (Loss); (ii) the Consolidated Balance Sheets; (iii) Consolidated Statements of Stockholder's Equity; (iv) the Consolidated Statements of Cash Flows; and (v) the Notes to the Consolidated Financial Statements.(11) |
- (1)
- Previously filed in Amendment No. 1 to Form S-4 of HD Supply, Inc. (File No. 333-159809) filed on July 10, 2009.
- (2)
- Previously filed in Amendment No. 2 to Form S-4 of HD Supply, Inc. (File No. 333-159809) filed on July 27, 2009.
- (3)
- Previously filed in Form 10-K of HD Supply, Inc. (File No. 333-159809) filed on April 13, 2010.
- (4)
- Previously filed in Form 10-Q of HD Supply, Inc. (File No. 333-159809) filed on June 11, 2010.
- (5)
- Previously filed in Form 10-K of HD Supply, Inc. (File No. 333-159809) filed on April 14, 2011.
- (6)
- Previously filed in Form 10-K of HD Supply, Inc. (File No. 333-159809) filed on March 23, 2012.
- (7)
- Previously filed in Form 10-Q of HD Supply, Inc. (File No. 333-159809) filed on June 7, 2012.
- (8)
- Previously filed in Form 10-Q of HD Supply, Inc. (File No. 333-159809) filed on September 4, 2012.
- (9)
- Previously filed in Form S-4 of HD Supply, Inc. (File No. 333-185158) filed on November 27, 2012.
- (10)
- Previously filed in Amendment No. 2 to Form S-4 of HD Supply, Inc. (File No. 333-185158) filed on January 18, 2013.
- (11)
- Filed herewith.
- *
- Denotes management contract or compensatory plan or arrangement.
- †
- Certain provisions of this exhibit have been omitted and separately filed with the Securities and Exchange Commission pursuant to a request for confidential treatment.
176
Table of Contents
(c) Financial Statement Schedules
HD SUPPLY, INC.
SCHEDULE II—VALUATION AND QUALIFYING ACCOUNTS
(Amounts in millions)
Accounts Receivable Allowance for Doubtful Accounts:
| | | | | | | | | | | | | | | | | | | |
| | Balance at
Beginning
of Period | | Acquisition or
Disposition of Business
Adjustment | | Charges to
Expense/
(Income) | | Doubtful
Accounts
Written
Off, Net | | Other
Adjustments | | Balance at
End of
Period | |
|---|
Fiscal Year ended: | | | | | | | | | | | | | | | | | | | |
January 30, 2011 | | $ | 52 | | | — | | | 12 | | | (28 | ) | | — | | $ | 36 | |
January 29, 2012 | | $ | 36 | | | (2 | ) | | 12 | | | (14 | ) | | — | | $ | 32 | |
February 3, 2013 | | $ | 32 | | | (3 | ) | | 4 | | | (10 | ) | | — | | $ | 23 | |
Deferred Tax Valuation Allowances:
| | | | | | | | | | |
| | Balance at
Beginning
of Period | | Charges to
Expense | | Balance at
End of
Period | |
|---|
Fiscal Year ended: | | | | | | | | | | |
January 30, 2011 | | $ | 9 | | | 230 | | $ | 239 | |
January 29, 2012 | | $ | 239 | | | 252 | | $ | 491 | |
February 3, 2013 | | $ | 491 | | | 434 | | $ | 925 | |
177
Table of Contents
SIGNATURES
Pursuant to the requirements of Section 13 or 15(d) of the Securities Exchange Act of 1934, the registrant has duly caused this report to be signed on its behalf by the undersigned, hereunto duly authorized.
| | | | |
| | | HD SUPPLY, INC. |
|
|
By: |
|
/s/ JOSEPH J. DEANGELO
Name: Joseph J. DeAngelo
Title:President and Chief Executive Officer |
Date: April 16, 2013 |
|
|
|
|
Pursuant to the requirements of the Securities Exchange Act of 1934, this report has been signed below by the following persons on behalf of the registrant and in the capacities and on the dates indicated.
| | | | |
| Signature | | Capacity | | Date |
|---|
|
|
|
|
|
/s/ JOSEPH J. DEANGELO
Joseph J. DeAngelo | | Chief Executive Officer and Director
(Principal Executive Officer) | | April 16, 2013 |
/s/ RONALD J. DOMANICO
Ronald J. Domanico |
|
Senior Vice President and Chief Financial Officer
(Principal Financial Officer) |
|
April 16, 2013 |
/s/ EVAN LEVITT
Evan Levitt |
|
Controller
(Principal Accounting Officer) |
|
April 16, 2013 |
/s/ JAMES G. BERGES
James G. Berges |
|
Chairman |
|
April 16, 2013 |
/s/ VIPUL AMIN
Vipul Amin |
|
Director |
|
April 16, 2013 |
/s/ BRIAN BERNASEK
Brian Bernasek |
|
Director |
|
April 16, 2013 |
/s/ PAUL B. EDGERLEY
Paul B. Edgerley |
|
Director |
|
April 16, 2013 |
178
Table of Contents
| | | | |
| Signature | | Capacity | | Date |
|---|
|
|
|
|
|
/s/ MITCHELL JACOBSON
Mitchell Jacobson | | Director | | April 16, 2013 |
/s/ LEW KLESSEL
Lew Klessel |
|
Director |
|
April 16, 2013 |
/s/ GREGORY S. LEDFORD
Gregory S. Ledford |
|
Director |
|
April 16, 2013 |
/s/ NATHAN SLEEPER
Nathan Sleeper |
|
Director |
|
April 16, 2013 |
/s/ STEPHEN M. ZIDE
Stephen M. Zide |
|
Director |
|
April 16, 2013 |
179