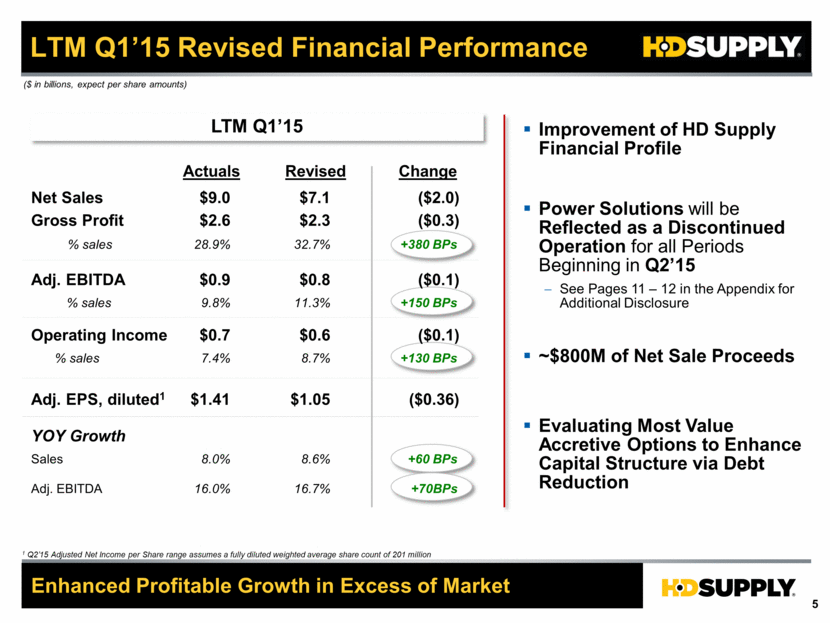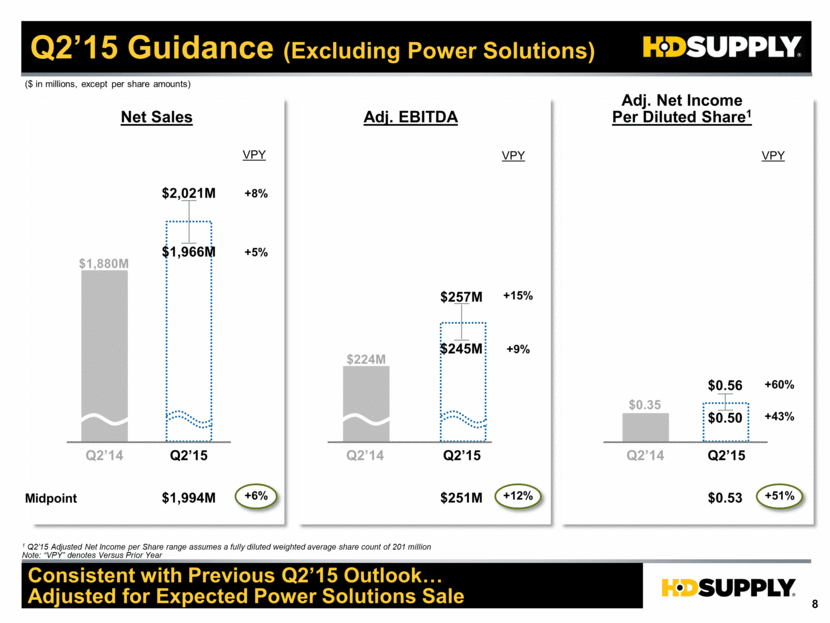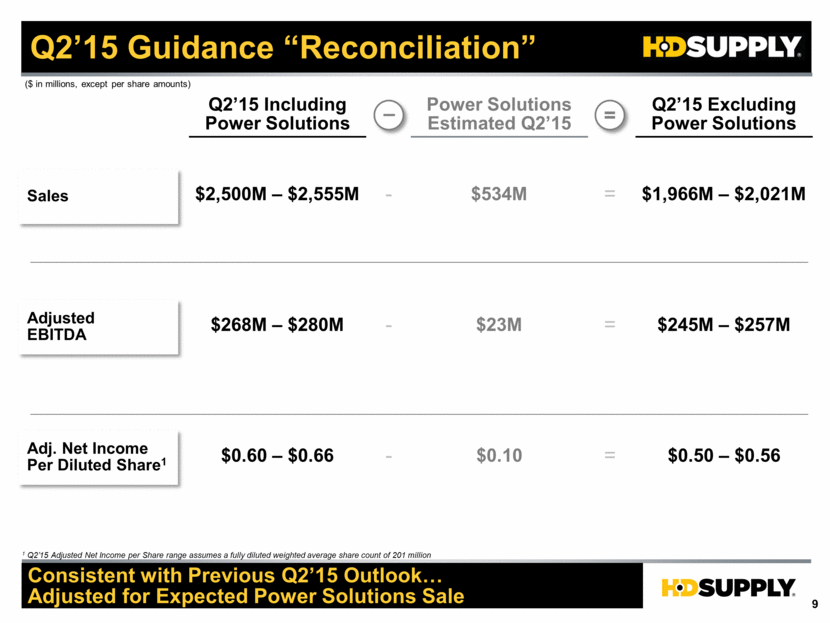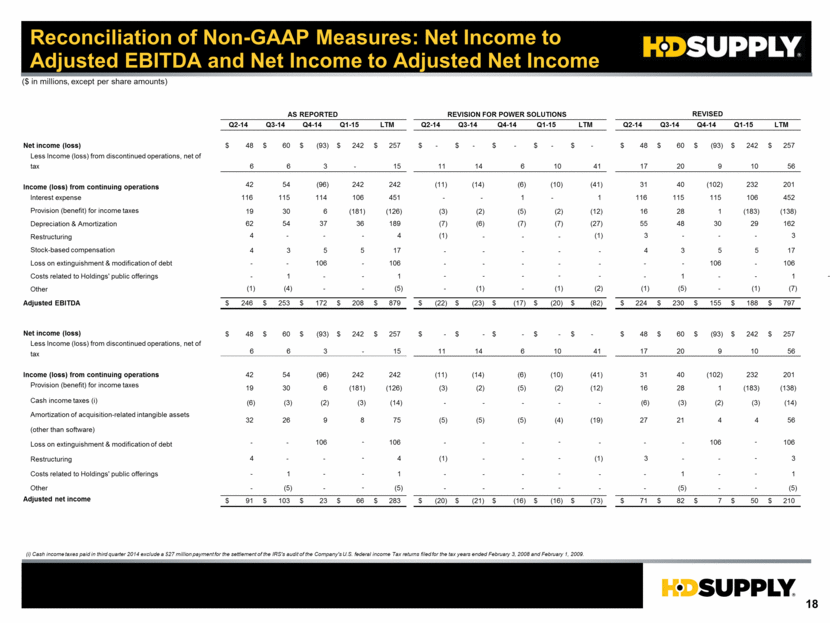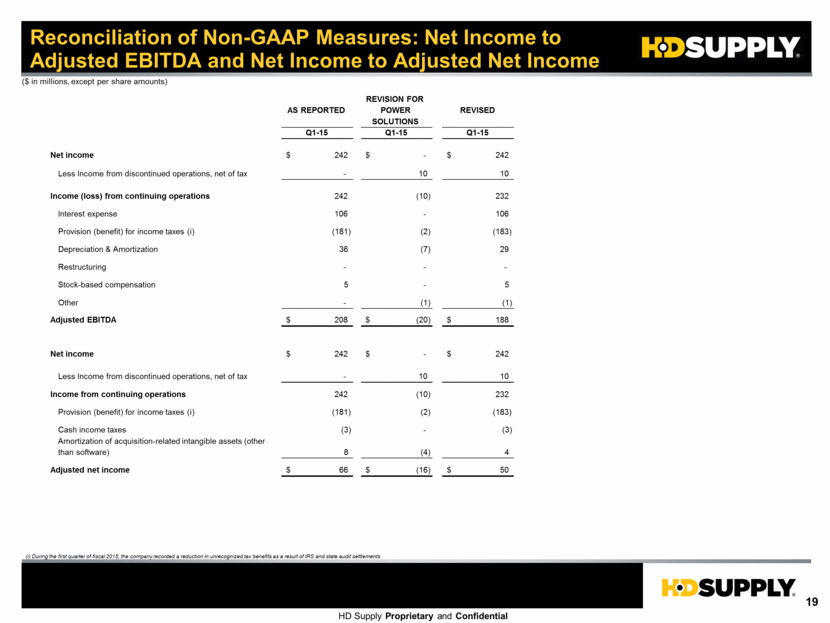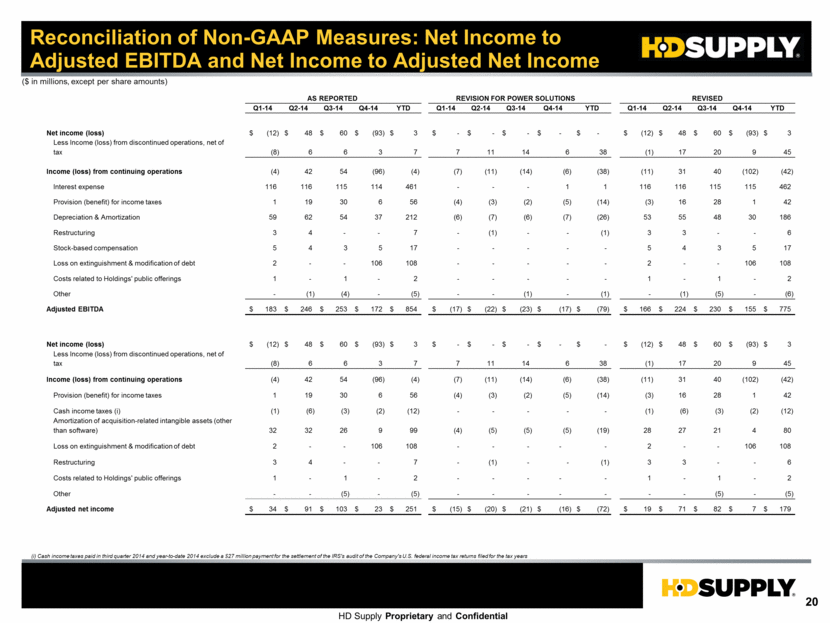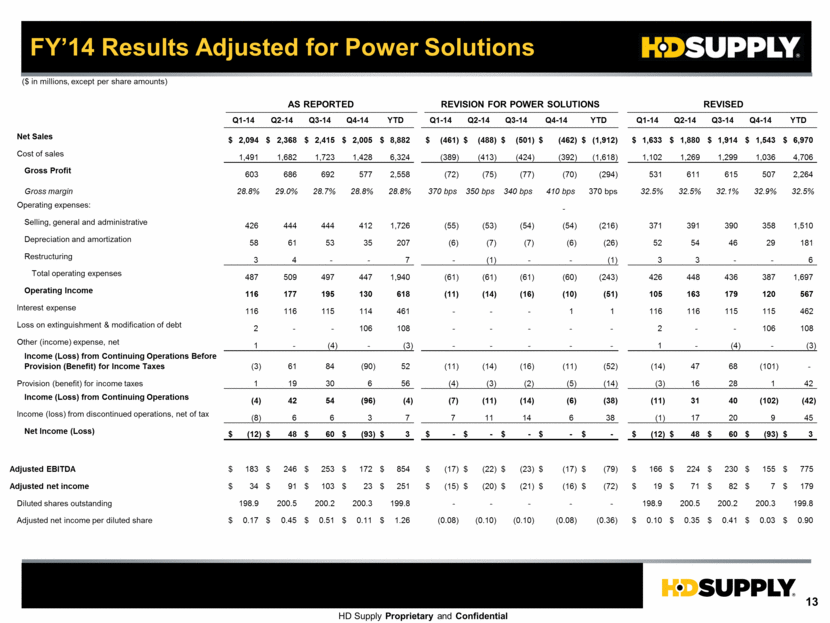
| FY’14 Results Adjusted for Power Solutions ($ in millions, except per share amounts) AS REPORTED REVISION FOR POWER SOLUTIONS REVISED Q1-14 Q2-14 Q3-14 Q4-14 YTD Q1-14 Q2-14 Q3-14 Q4-14 YTD Q1-14 Q2-14 Q3-14 Q4-14 YTD Net Sales 2,094 $ 2,368 $ 2,415 $ 2,005 $ 8,882 $ (461) $ (488) $ (501) $ (462) $ (1,912) $ 1,633 $ 1,880 $ 1,914 $ 1,543 $ 6,970 $ Cost of sales 1,491 1,682 1,723 1,428 6,324 (389) (413) (424) (392) (1,618) 1,102 1,269 1,299 1,036 4,706 Gross Profit 603 686 692 577 2,558 (72) (75) (77) (70) (294) 531 611 615 507 2,264 Gross margin 28.8% 29.0% 28.7% 28.8% 28.8% 370 bps 350 bps 340 bps 410 bps 370 bps 32.5% 32.5% 32.1% 32.9% 32.5% Operating expenses: - Selling, general and administrative 426 444 444 412 1,726 (55) (53) (54) (54) (216) 371 391 390 358 1,510 Depreciation and amortization 58 61 53 35 207 (6) (7) (7) (6) (26) 52 54 46 29 181 Restructuring 3 4 - - 7 - (1) - - (1) 3 3 - - 6 Total operating expenses 487 509 497 447 1,940 (61) (61) (61) (60) (243) 426 448 436 387 1,697 Operating Income 116 177 195 130 618 (11) (14) (16) (10) (51) 105 163 179 120 567 Interest expense 116 116 115 114 461 - - - 1 1 116 116 115 115 462 Loss on extinguishment & modification of debt 2 - - 106 108 - - - - - 2 - - 106 108 Other (income) expense, net 1 - (4) - (3) - - - - - 1 - (4) - (3) Income (Loss) from Continuing Operations Before Provision (Benefit) for Income Taxes (3) 61 84 (90) 52 (11) (14) (16) (11) (52) (14) 47 68 (101) - Provision (benefit) for income taxes 1 19 30 6 56 (4) (3) (2) (5) (14) (3) 16 28 1 42 Income (Loss) from Continuing Operations (4) 42 54 (96) (4) (7) (11) (14) (6) (38) (11) 31 40 (102) (42) Income (loss) from discontinued operations, net of tax (8) 6 6 3 7 7 11 14 6 38 (1) 17 20 9 45 Net Income (Loss) (12) $ 48 $ 60 $ (93) $ 3 $ - $ - $ - $ - $ - $ (12) $ 48 $ 60 $ (93) $ 3 $ Adjusted EBITDA 183 $ 246 $ 253 $ 172 $ 854 $ (17) $ (22) $ (23) $ (17) $ (79) $ 166 $ 224 $ 230 $ 155 $ 775 $ Adjusted net income 34 $ 91 $ 103 $ 23 $ 251 $ (15) $ (20) $ (21) $ (16) $ (72) $ 19 $ 71 $ 82 $ 7 $ 179 $ Diluted shares outstanding 198.9 200.5 200.2 200.3 199.8 - - - - - 198.9 200.5 200.2 200.3 199.8 Adjusted net income per diluted share 0.17 $ 0.45 $ 0.51 $ 0.11 $ 1.26 $ (0.08) (0.10) (0.10) (0.08) (0.36) 0.10 $ 0.35 $ 0.41 $ 0.03 $ 0.90 $ |

