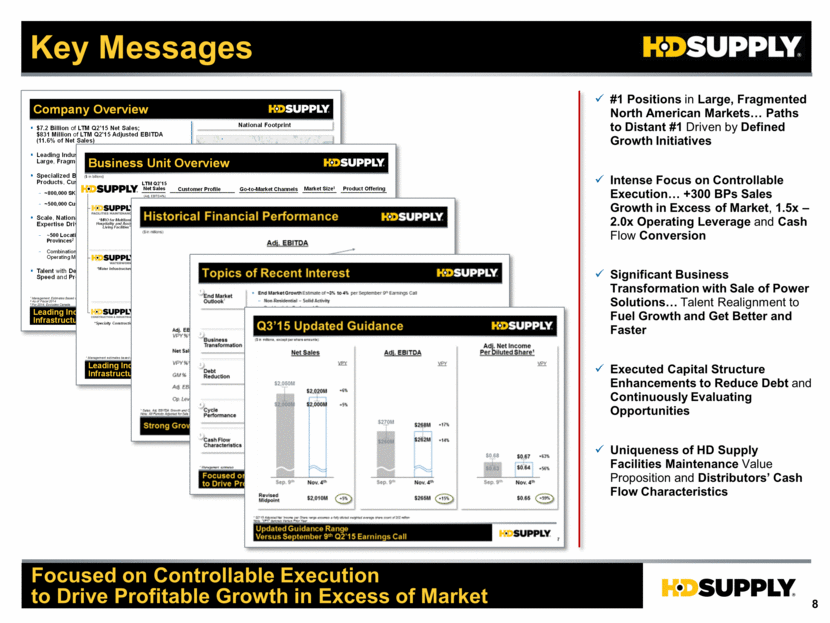
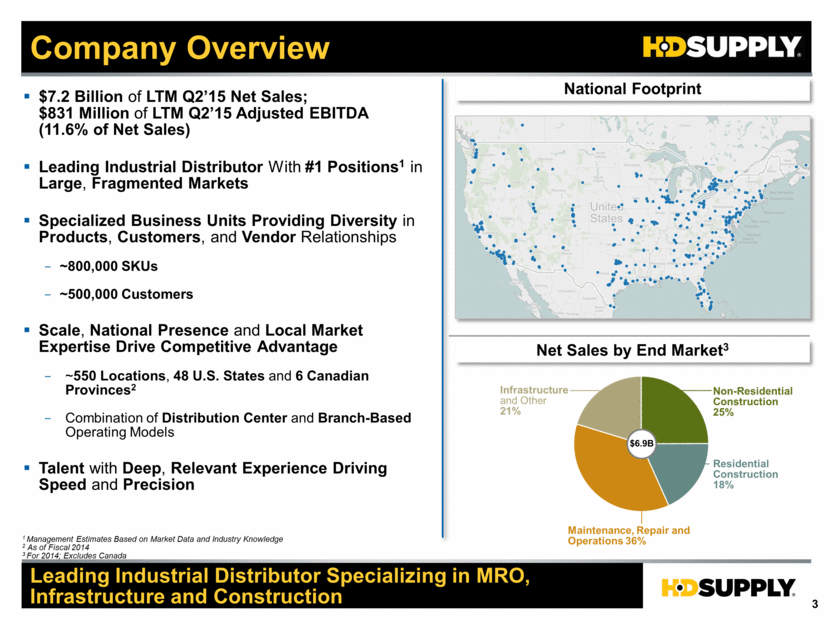
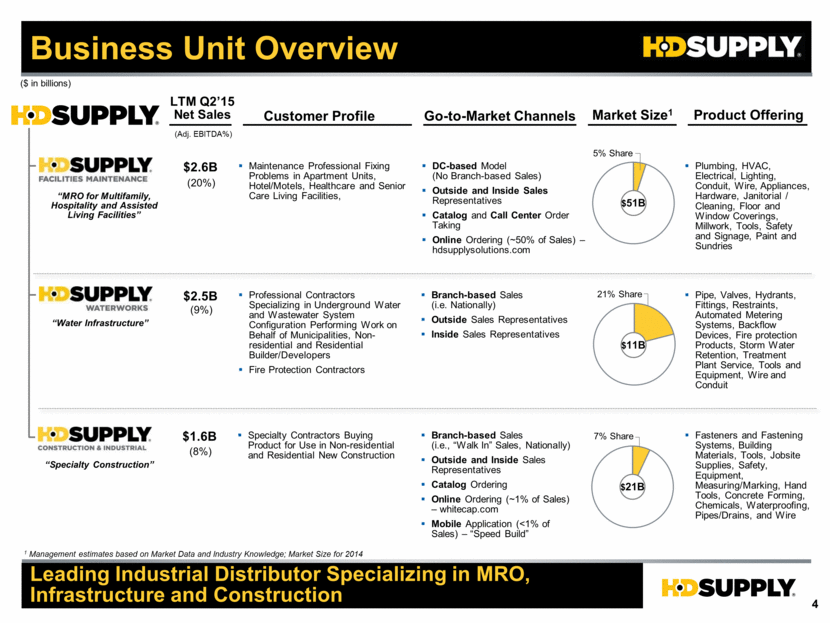
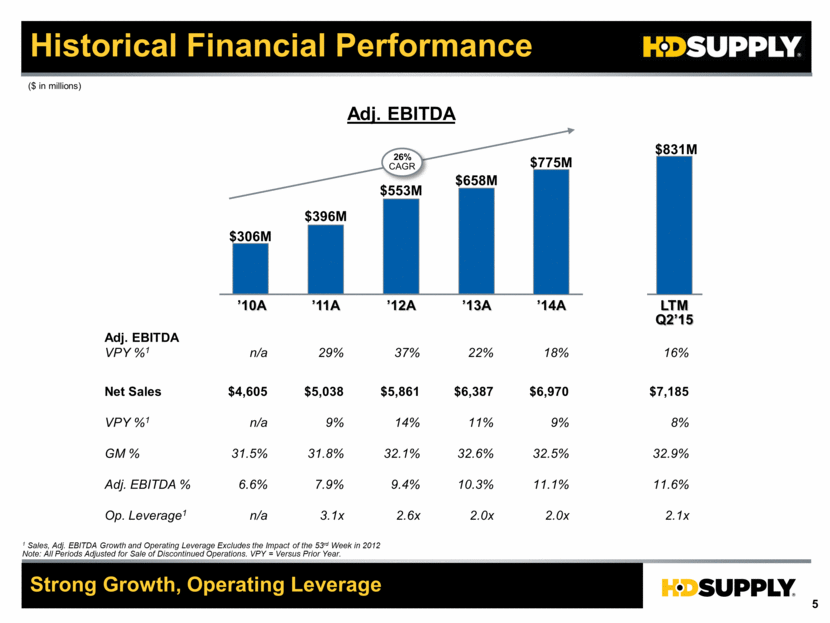
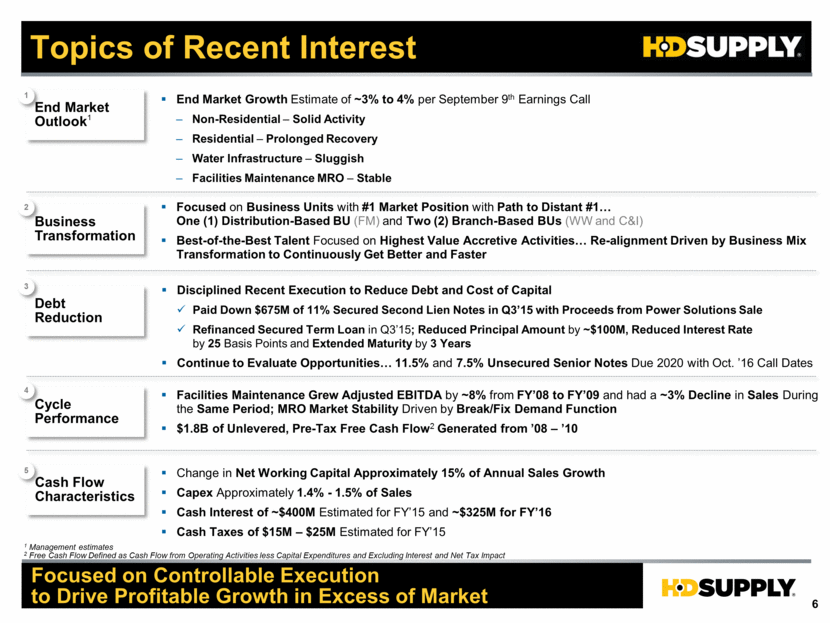
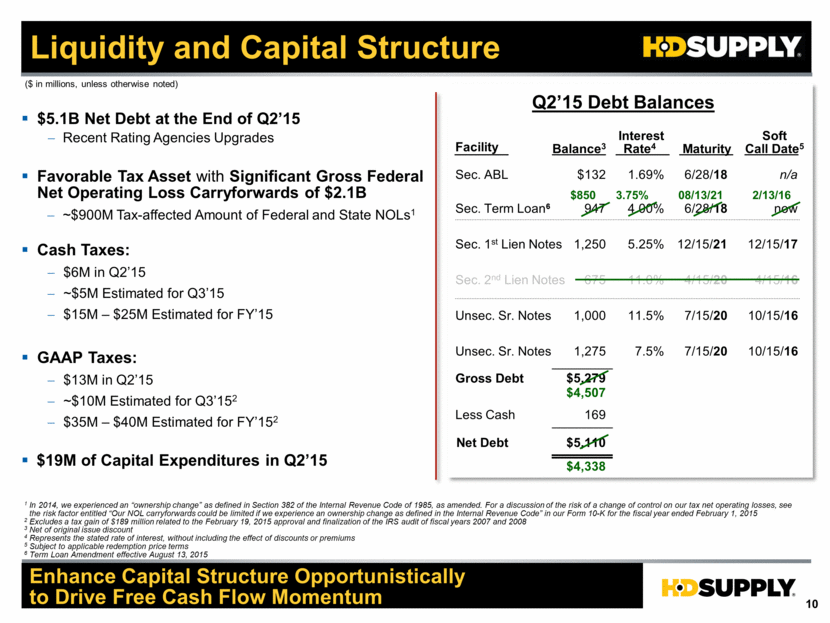
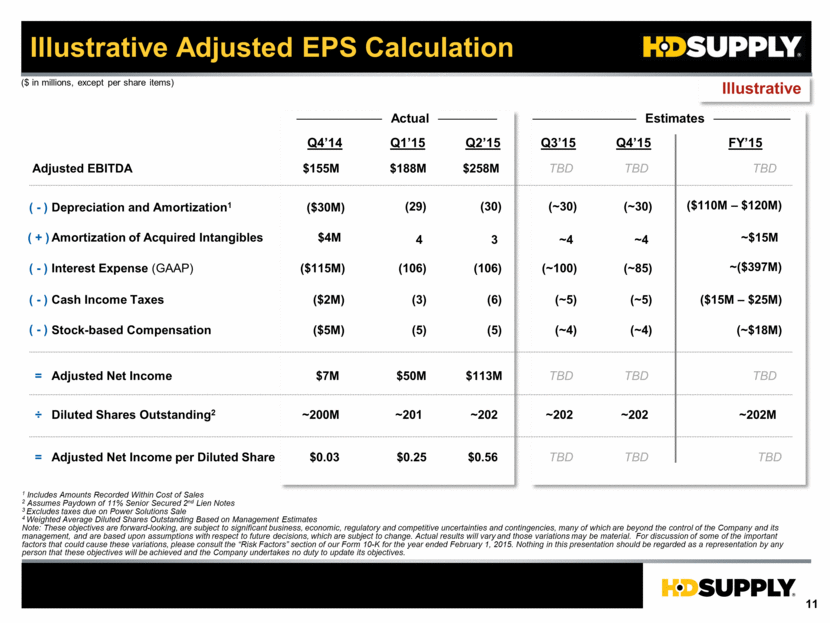
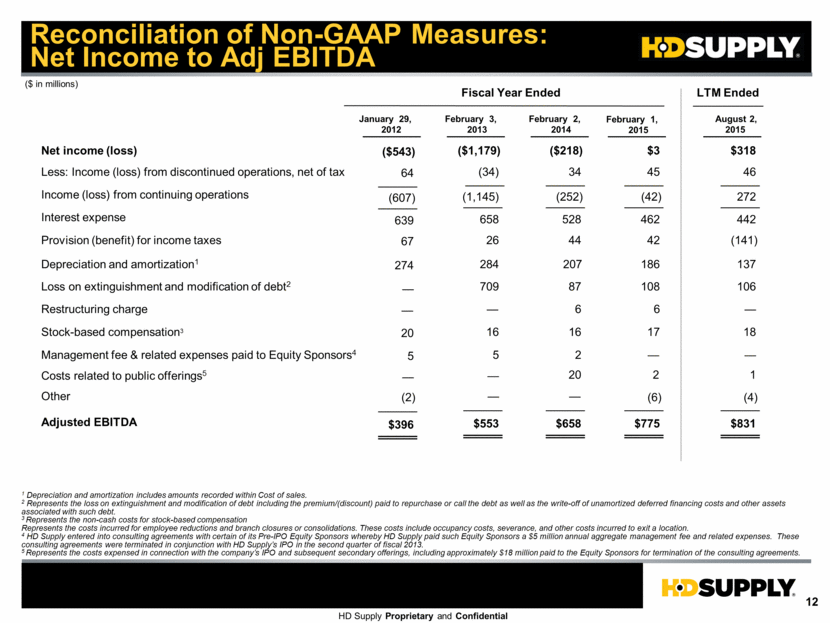
Key Messages #1 Positions in Large, Fragmented North American Markets Paths to Distant #1 Driven by Defined Growth Initiatives Intense Focus on Controllable Execution +300 BPs Sales Growth in Excess of Market, 1.5x – 2.0x Operating Leverage and Cash Flow Conversion Significant Business Transformation with Sale of Power Solutions Talent Realignment to Fuel Growth and Get Better and Faster Executed Capital Structure Enhancements to Reduce Debt and Continuously Evaluating Opportunities Uniqueness of HD Supply Facilities Maintenance Value Proposition and Distributors’ Cash Flow Characteristics Focused on Controllable Execution to Drive Profitable Growth in Excess of Market 3 Company Overview Leading Industrial Distributor Specializing in MRO , Infrastructure and Construction § $7.2 Billion of LTM Q2’15 Net Sales; $831 Million of LTM Q2’15 Adjusted EBITDA (11.6% of Net Sales) § Leading Industrial Distributor With #1 Positions 1 in Large , Fragmented Markets § Specialized Business Units Providing Diversity in Products , Customers , and Vendor Relationships - ~800,000 SKUs - ~500,000 Customers § Scale , National Presence and Local Market Expertise Drive Competitive Advantage - ~ 500 Locations , 48 U.S. States and 6 Canadian Provinces 2 - Combination of Distribution Center and Branch - Based Operating Models § Talent with Deep , Relevant Experience Driving Speed and Precision National Footprint Net Sales by End Market 3 Maintenance, Repair and Operations 36% Residential Construction 18% Non - Residential Construction 25% Infrastructure and Other 21% $6.9B 1 Management Estimates Based on Market Data and Industry Knowledge 2 As of Fiscal 2014 3 For 2014; Excludes Canada 4 Leading Industrial Distributor Specializing in MRO, Infrastructure and Construction Business Unit Overview Product Offering Customer Profile LTM Q2’15 Net Sales ($ in billions ) (Adj. EBITDA%) Market Size 1 “MRO for Multifamily, Hospitality and Assisted Living Facilities” § Maintenance Professional Fixing Problems in Apartment Units, Hotel/Motels, Healthcare and Senior Care Living Facilities, $2.6B (20%) $ 51B 5% Share “Water Infrastructure ” § Professional Contractors Specializing in Underground Water and Wastewater System Configuration Performing Work on Behalf of Municipalities, Non - residential and Residential Builder/Developers § Fire Protection Contractors $2.5B ( 9 %) $ 11B 21% Share “Specialty Construction” § Specialty Contractors Buying Product for Use in Non - residential and Residential New Construction $1.6B (8%) $ 21B 7% Share 1 Management estimates based on Market Data and Industry Knowledge; Market Size for 2014 Go - to - Market Channels § DC - based Model ( No Branch - based Sales) § Outside and Inside Sales Representatives § Catalog and Call Center Order Taking § Online Ordering (~50% of Sales) – hdsupplysolutions.com § Branch - based Sales ( i.e. Nationally ) § Outside Sales Representatives § Inside Sales Representatives § Branch - based Sales ( i.e ., “Walk In” Sales, Nationally) § Outside and Inside Sales Representatives § Catalog Ordering § Online Ordering (~1% of Sales) – whitecap.com § Mobile Application (<1% of Sales) – “ Speed Build ” § Plumbing , HVAC , Electrical , Lighting, Conduit , Wire , Appliances , Hardware , Janitorial / Cleaning , Floor and Window Coverings , Millwork, Tools, Safety and Signage , Paint and Sundries § Pipe, Valves , Hydrants, Fittings, Restraints, Automated Metering Systems, Backflow Devices, Fire protection Products, Storm Water Retention, Treatment Plant Service, Tools and Equipment, Wire and Conduit § Fasteners and Fastening Systems, Building Materials, Tools, Jobsite Supplies, Safety, Equipment, Measuring/Marking, Hand Tools, Concrete Forming, Chemicals, Waterproofing, Pipes/Drains, and Wire
