Two Harbors Investment Corp.
Reports First Quarter 2010 Financial Results
NEW YORK, May 4, 2010 – Two Harbors Investment Corp. (“Two Harbors” or the “Company”) (NYSE Amex: TWO; TWO.WS), a real estate investment trust that focuses on investing in residential mortgage-backed securities, today announced its financial results for the quarter ended March 31, 2010.
First Quarter 2010 Highlights:
| · | Quarterly GAAP earnings were $0.40 per diluted common share |
| · | Increased book value per share to $9.38 at March 31, 2010, from $9.08 as of December 31, 2009 |
| · | Achieved a 17.1% annualized return on average equity on a GAAP basis |
| · | Declared a dividend of $0.36 per common share |
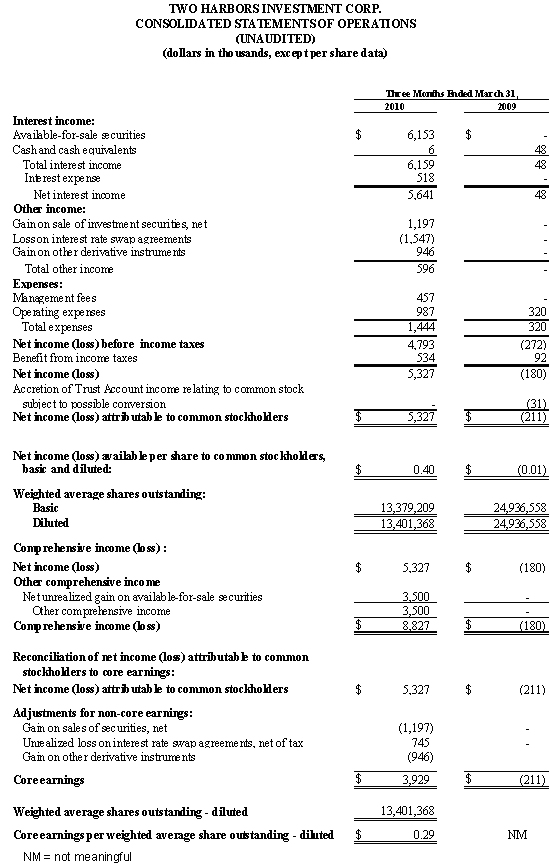
The Company reported Core Earnings for the quarter ended March 31, 2010, of $3.9 million or $0.29 per diluted common share outstanding. “Core Earnings” represents a non-GAAP measure and is defined as net income (loss) excluding impairment losses, gains or losses on sales of securities, unrealized gains or losses on interest rate swaps, gains or losses on other derivative instruments, and certain non-recurring expenses. On a GAAP basis, the Company reported net income for the quarter of $5.3 million or $0.40 per diluted share outstanding.
During the quarter, the Company sold securities for $10.4 million with an amortized cost of $9.2 million for a net realized gain of $1.2 million. In addition, the Company recognized in earnings an unrealized loss, net of tax, of $0.7 million associated with its interest rate swaps, and realized gains on the sale of to-be-announced securities of approximately $0.8 million.
Two Harbors declared a quarterly dividend of $0.36 per common share in March 2010. The annualized dividend yield on the Company’s common stock for the quarter ended March 31, 2010, based on the March 31, 2010 closing price of $9.14 was 15.8%. On a GAAP Earnings basis, the Company provided an annualized return on average equity of 17.1% for the quarter ended March 31, 2010.
The Company’s book value per diluted share as of March 31, 2010 was $9.38 compared to $9.08 as of December 31, 2009.
“We are delighted with our financial results for the quarter,” said Thomas Siering, Two Harbors’ President and Chief Executive Officer. “Our investment team was able to meaningfully grow book value and deliver a strong dividend and EPS metric. We were quite pleased to do so in Two Harbors’ first full quarter of operating results; one that was unobscured by our path to market in October 2009.”
Portfolio Summary
For the quarter ended March 31, 2010, the annualized yield on average available-for-sale securities was 4.9% and the annualized cost of funds on the average borrowings was 0.5%, which resulted in a net interest rate spread of 4.4%. The Company reported debt-to-equity of 3.6:1.0 at March 31, 2010.
In the first quarter, the Company completed deployment of its capital available for investment which resulted in a portfolio as of March 31, 2010 with a total value of $520.2 million, comprised of $412.5 million Agency RMBS and $107.7 million non-Agency RMBS. As of March 31, 2010, fixed-rate securities comprised 32% of the Company’s portfolio and adjustable-rate securities comprised 68% of the Company’s portfolio. Two Harbors was a party to interest rate swaps as of March 31, 2010 with an aggregate notional amount of $150 million, or 33% of the Company’s outstanding borrowings. Interest rate swaps are used to hedge against increases in interest rates on a portion of the Company’s LIBOR-based repurchase agreements.
“Our performance can be primarily attributed to two factors; Agency securities performed in line with expectations by avoiding any adverse impacts from the GSE buyouts and non-Agency securities recorded solid returns,” said William Roth, Two Harbors’ Co-Chief Investment Officer.
“Also noteworthy,” continued Roth “is comprehensive income of $8.8 million for the quarter. Comprehensive income reflects our GAAP earnings for the quarter plus the appreciation in the fair value of our securities.”
The following table summarizes portfolio information for the Company:
| Two Harbors Portfolio | | | | | | |
| (dollars in thousands, except per share data) | | | | | | |
| | | | | | | |
| Portfolio Composition | | | |
| Agency Bonds | | | | | | |
| Fixed Rate Bonds | | $ | 122,017 | | | 23.4 | % |
| Hybrid ARMS | | | 290,521 | | | 55.9 | % |
| Total Agency | | | 412,538 | | | 79.3 | % |
| Non-Agency Bonds | | | | | | | | |
| Senior Bonds | | | 88,345 | | | 17.0 | % |
| Mezzanine Bonds | | | 19,286 | | | 3.7 | % |
| Total Non-Agency | | | 107,631 | | | 20.7 | % |
| | | | | | | | |
| Aggregate Portfolio | | $ | 520,169 | | | | |
| | | | | | | | | |
| Fixed-rate investment securities as a percentage of portfolio | | | 32.3 | % | | | | |
| Adjustable-rate investment securities as a percentage of portfolio | | | 67.7 | % | | | | |
| | | | | | | | | |
| | | For the Quarter Ended | | | | |
| Portfolio Metrics | | March 31, 2010 | | | | |
| Annualized yield on average available-for-sale securities during the quarter | | | | | | | | |
| Agency securities | | | 3.6 | % | | | | |
| Non-Agency securities | | | 10.6 | % | | | | |
| Aggregate Portfolio | | | 4.9 | % | | | | |
| Annualized cost of funds on average repurchase balance during the quarter | | | 0.5 | % | | | | |
| Annualized interest rate spread during the quarter | | | 4.4 | % | | | | |
| Weighted average cost basis of principal and interest securities | | | | | | | | |
| Agency | | $ | 105.0 | | | | |
| Non-Agency | | $ | 56.8 | | | | |
| Weighted average three month CPR for our portfolio | | | | | | | | |
| Agency | | | 16.2 | % | | | | |
| Non-Agency | | | 11.6 | % | | | | |
| Debt-to-equity ratio at period-end | | 3.6 to 1.0 | | | | |
Agency securities owned by Two Harbors at March 31, 2010 experienced a three-month average Constant Prepayment Rate during the first quarter of 2010 of 16.2%. The weighted average cost basis of the Agency portfolio was 105.0% of par, and the net premium amortization was $2.5 million for the three months ended March 31, 2010.
Non-Agency securities owned by Two Harbors at March 31, 2010 experienced a three-month average Constant Prepayment Rate during the first quarter of 2010 of 11.6%. The weighted average cost basis of the non-Agency portfolio was 56.8% of par, and the discount accretion was $1.1 million for the three months ended March 31, 2010. The total net discount remaining was $118.8 million as of March 31, 2010.
Conference Call
Two Harbors Investment Corp. will host a conference call on May 5, 2010, to discuss first quarter 2010 financial results and related information at 9:00 a.m. EST. To participate in the teleconference, please call toll-free 877-868-1835 (or 914-495-8581 for international callers) approximately 10 minutes prior to the above start time. You may also listen to the teleconference live via the Internet at www.twoharborsinvestment.com under the Webcast link. For those unable to attend, the Company’s website will host an archive of the call.
Two Harbors Investment Corp.
Two Harbors Investment Corp., a Maryland corporation, is a real estate investment trust that focuses on investing in residential mortgage-backed securities. Two Harbors is headquartered in Minnetonka, Minnesota, and is externally managed and advised by PRCM Advisers, LLC, a wholly-owned subsidiary of Pine River Capital Management L.P. Additional information is available at www.twoharborsinvestment.com.
Forward-Looking Statements
This press release includes “forward-looking statements” within the meaning of the safe harbor provisions of the United States Private Securities Litigation Reform Act of 1995. Actual results may differ from expectations, estimates and projections and, consequently, readers should not rely on these forward-looking statements as predictions of future events. Words such as “expect,” “target,” “assume,” “estimate,” “project,” “budget,” “forecast,” “anticipate,” “intend,” “plan,” “may,” “will,” “could,” “should,” “believes,” “predicts,” “potential,” “continue,” and similar expressions are intended to identify such forward-looking statements. These forward-looking statements involve significant risks and uncertainties that could cause actual results to differ materially from expected results. Factors that could cause actual results to differ include higher than expected operation costs, changes in prepayment speeds, failure to recover certain losses that are expected to be temporary, changes in interest rates or the regulatory environment, and unanticipated changes in overall market and economic conditions.
Two Harbors cautions readers not to place undue reliance upon any forward-looking statements, which speak only as of the date made. Two Harbors does not undertake or accept any obligation to release publicly any updates or revisions to any forward-looking statement to reflect any change in its expectations or any change in events, conditions or circumstances on which any such statement is based. Additional information concerning these and other risk factors is contained in Two Harbors’ most recent filings with the Securities and Exchange Commission (“SEC”). All subsequent written and oral forward looking statements concerning Two Harbors or matters attributable to Two Harbors or any person acting on its behalf are expressly qualified in their entirety by the cautionary statements above.
Additional Information
Stockholders and warrant holders of Two Harbors, and other interested persons, may find additional information regarding the company at the Securities and Exchange Commission’s Internet site at www.sec.gov or by directing requests to: Two Harbors Investment Corp., 601 Carlson Parkway, Suite 330, Minnetonka, MN 55305, telephone 612-238-3300.
Contact
Anh Huynh, Investor Relations, Two Harbors Investment Corp., 612-238-3348.
# # #
| TWO HARBORS INVESTMENT CORP. |
| CONSOLIDATED BALANCE SHEETS |
| (dollars in thousands, except per share data) |
| |
| ASSETS | March 31, | | | December 31, | |
| | 2010 | | | 2009 | |
| | | (unaudited) | | | | |
| | | | | | | |
| Available-for-sale securities, at fair value | | $ | 520,169 | | | $ | 494,465 | |
| Cash and cash equivalents | | | 25,443 | | | | 26,105 | |
| Total earning assets | | | 545,612 | | | | 520,570 | |
| Restricted cash | | | 22,593 | | | | 8,913 | |
| Accrued interest receivable | | | 2,500 | | | | 2,580 | |
| Due from counterparties | | | 23,340 | | | | 4,877 | |
| Derivative assets, at fair value | | | 3,469 | | | | 364 | |
| Prepaid expenses | | | 602 | | | | 572 | |
| Deferred tax assets | | | 402 | | | | - | |
| Prepaid tax assets | | | 499 | | | | 490 | |
| Total Assets | | $ | 599,017 | | | $ | 538,366 | |
| | | | | | | | | |
| LIABILITIES AND STOCKHOLDERS’ EQUITY | | | | | | | | |
| Liabilities | | | | | | | | |
| Repurchase agreements | | $ | 449,961 | | | $ | 411,893 | |
| Derivative liabilities, at fair value | | | 16,716 | | | | - | |
| Accrued interest payable | | | 383 | | | | 114 | |
| Deferred tax liabilities | | | - | | | | 124 | |
| Accrued expenses and other liabilities | | | 1,376 | | | | 1,030 | |
| Dividends payable | | | 4,825 | | | | 3,484 | |
| Total liabilities | | | 473,261 | | | | 416,645 | |
| | | | | | | | | |
| Common stock, subject to possible conversion | | | - | | | | - | |
| | | | | | | | | |
| Stockholders’ Equity | | | | | | | | |
| Preferred stock, par value $0.01 per share; 50,000,000 | | | | | | | | |
| shares authorized; no shares issued and | | | | | | | | |
| outstanding | | | - | | | | - | |
| Common stock, par value $0.01 per share; | | | | | | | | |
| 450,000,000 shares authorized and 13,379,209 | | | | | | | | |
| shares issued and outstanding | | | 134 | | | | 134 | |
| Additional paid-in capital | | | 131,789 | | | | 131,756 | |
| Accumulated other comprehensive income (loss) | | | 2,550 | | | | (950 | ) |
| Cumulative (losses) earnings | | | (408 | ) | | | (5,735 | ) |
| Cumulative distributions to stockholders | | | (8,309 | ) | | | (3,484 | ) |
| Total stockholders’ equity | | | 125,756 | | | | 121,721 | |
| Total liabilities and stockholders’ equity | | $ | 599,017 | | | $ | 538,366 | |