UNITED STATES
SECURITIES AND EXCHANGE COMMISSION
Washington, D.C. 20549
FORM N-CSR
CERTIFIED SHAREHOLDER REPORT OF REGISTERED MANAGEMENT
INVESTMENT COMPANIES
Investment Company Act file number 811- 22309
Transparent Value Trust
(Exact name of registrant as specified in charter)
702 King Farm Boulevard, Suite 200
Rockville, Maryland 20850
(Address of principal executive offices) (Zip code)
Amy J. Lee
Transparent Value Trust
702 King Farm Boulevard, Suite 200
Rockville, Maryland 20850
(Name and address of agent for service)
Registrant's telephone number, including area code: (301) 296-5100
Date of fiscal year end: September 30
Date of reporting period: October 1, 2022 - March 31, 2023
| Item 1. | Reports to Stockholders. |
The registrant’s semi-annual report transmitted to shareholders pursuant to Rule 30e-1 under the Investment Company Act of 1940, as amended (the “Investment Company Act”), is as follows:
3.31.2023
Guggenheim Funds Semi-Annual Report
Transparent Value Trust |
Guggenheim Directional Allocation Fund | | |
Guggenheim RBP® Dividend Fund | | |
Guggenheim RBP® Large-Cap Defensive Fund | | |
Guggenheim RBP® Large-Cap Market Fund | | |
Guggenheim RBP® Large-Cap Value Fund | | |
GuggenheimInvestments.com | RBP-SEMI-0323x0923 |

| | |
DEAR SHAREHOLDER | 2 |
ECONOMIC AND MARKET OVERVIEW | 3 |
ABOUT SHAREHOLDERS’ FUND EXPENSES | 5 |
DIRECTIONAL ALLOCATION FUND | 8 |
RBP® DIVIDEND FUND | 16 |
RBP® LARGE-CAP DEFENSIVE FUND | 26 |
RBP® LARGE-CAP MARKET FUND | 35 |
RBP® LARGE-CAP VALUE FUND | 44 |
NOTES TO FINANCIAL STATEMENTS | 53 |
OTHER INFORMATION | 60 |
INFORMATION ON BOARD OF TRUSTEES AND OFFICERS | 61 |
GUGGENHEIM INVESTMENTS PRIVACY NOTICE | 67 |
| | THE GUGGENHEIM FUNDS SEMI-ANNUAL REPORT | 1 |
Dear Shareholder:
Guggenheim Partners Investment Management, LLC (“GPIM” or the “Investment Adviser”), is pleased to present the shareholder report for Guggenheim RBP® Funds (the “Funds”). This report covers the semi-annual fiscal period ended March 31, 2023 (the “Reporting Period”).
The Investment Adviser is part of Guggenheim Investments, which represents the investment management businesses of Guggenheim Partners, LLC, (“Guggenheim”) a global, diversified financial services firm.
Guggenheim Funds Distributors, LLC is the distributor of the Funds. Guggenheim Funds Distributors, LLC is affiliated with Guggenheim and the Investment Adviser.
We encourage you to read the Economic and Market Overview section of the report, which follows this letter.
We are committed to providing innovative investment solutions and appreciate the trust you place in us.
Sincerely,
Guggenheim Partners Investment Management, LLC
April 30, 2023
Read a prospectus and summary prospectus (if available) carefully before investing. It contains the investment objectives, risks, charges, expenses and other information, which should be considered carefully before investing. Obtain a prospectus and summary prospectus (if available) at guggenheiminvestments.com or call 800.820.0888.
This material is not intended as a recommendation or as investment advice of any kind, including in connection with rollovers, transfers, and distributions. Such material is not provided in a fiduciary capacity, may not be relied upon for or in connection with the making of investment decisions, and does not constitute a solicitation of an offer to buy or sell securities. All content has been provided for informational or educational purposes only and is not intended to be and should not be construed as legal or tax advice and/or a legal opinion. Always consult a financial, tax and/or legal professional regarding your specific situation.
Funds in Transparent Value Trust may not be suitable for all investors. ● An investment in the Funds will fluctuate and is subject to investment risks, which means investors could lose money ● The intrinsic value of the underlying stocks may never be realized, or the stock may decline in value ● Certain Funds may invest in derivative instruments, which may be more volatile and less liquid, increasing the risk of loss when compared to traditional securities ● Certain Funds’ investments in other investment vehicles subject the Funds to those risks and expenses affecting the investment vehicle ● You may have a gain or loss when you sell your shares ● It is important to note that the Fund is not guaranteed by the U.S. government ● Please read the prospectus for more detailed information regarding these and other risks.
2 | THE GUGGENHEIM FUNDS SEMI-ANNUAL REPORT | |
ECONOMIC AND MARKET OVERVIEW (Unaudited) | March 31, 2023 |
Developments in March 2023 highlighted the increasingly difficult place in which the U.S. Federal Reserve (the “Fed”) and other central banks find themselves as they work toward restoring price stability and maintaining financial stability. The collapse of Silicon Valley Bank and Signature Bank prompted banks to rush for liquidity support from the Fed, totaling $165 billion in the immediate aftermath. Overseas, the Swiss National Bank provided the equivalent of $54 billion in emergency liquidity to Credit Suisse before a deal was struck with rival UBS to buy it for $3.25 billion.
Heightened concerns about further bank stress and central banks’ ability to continue aggressively tightening monetary policy weighed heavily on market-implied expectations for the path of policy rates. Nevertheless, in March 2023 the Fed raised rates by 25 basis points and the European Central Bank raised rates by 50 basis points. One basis point equals 0.01%. We expect central banks will continue to raise rates over the next few months in their continuing effort to bring inflation to heel, despite the cracks in financial stability that are beginning to show.
While markets were volatile, data releases indicated that the U.S. economy is still on a relatively firm footing. March job growth came in at 236,000, well above the level needed to keep the unemployment rate from rising. Housing data has surprised to the upside, likely in response to the recent softening of mortgage rates. Meanwhile, the S&P Global U.S. composite Purchasing Managers’ Index (“PMI”) rose to a 10-month high, with strength especially evident in sub-indices for the service sector. Forward-looking data looks more concerning, however, with the Leading Economic Index turning down further, initial signs of job loss in the most cyclical and interest rate sensitive sectors, and business surveys souring on the economic outlook and plans for spending and hiring.
The Fed acknowledged in its March 2023 Federal Open Market Committee meeting statement that a contraction of credit emanating from volatility in the banking sector was likely to create new headwinds for the economy. In recognition of this new risk, the Fed’s updated Summary of Economic Projections showed a small downward revision of real gross domestic product growth this year, from 0.5 percent to 0.4 percent, followed by a larger downward revision for next year, from 1.6 percent to 1.2 percent. We continue to expect a recession could begin midway through the year.
For the Reporting Period, the S&P 500® Index* returned 15.62%. The MSCI Europe-Australasia-Far East (“EAFE”) Index* (gross) returned 27.52%. The return of the MSCI Emerging Markets Index* (gross) was 14.20%.
In the bond market, the Bloomberg U.S. Aggregate Bond Index* posted a 4.89% return for the Reporting Period, while the Bloomberg U.S. Corporate High Yield Index* returned 7.89%. The return of the ICE Bank of America (“BofA”) 3-Month U.S. Treasury Bill Index* was 1.94% for the six-month period.
The opinions and forecasts expressed may not actually come to pass. This information is subject to change at any time, based on market and other conditions, and should not be construed as a recommendation of any specific security or strategy.
*Index Definitions:
The following indices are referenced throughout this report. Indices are unmanaged and not available for direct investment. Index performance does not reflect transaction costs, fees, or expenses.
Bloomberg U.S. Aggregate Bond Index is a broad-based flagship benchmark that measures the investment grade, U.S. dollar-denominated, fixed-rate taxable bond market, including U.S. Treasuries, government-related and corporate securities, mortgage-backed securities or “MBS” (agency fixed-rate and hybrid adjustable-rate mortgage, or “ARM”, pass-throughs), asset-backed securities (“ABS”), and commercial mortgage-backed securities (“CMBS”) (agency and non-agency).
Bloomberg U.S. Corporate High Yield Index measures the U.S. dollar-denominated, high yield, fixed-rate corporate bond market. Securities are classified as high yield if the middle rating of Moody’s, Fitch, and S&P is Ba1/BB +/BB + or below.
Bloomberg 1-3 Month U.S. Treasury Bill Index includes all publicly issued zero-coupon U.S. Treasury Bills that have a remaining maturity of less than 3 months and more than 1 month, are rated investment grade, and have $250 million or more of outstanding face value. In addition, the securities must be denominated in U.S. dollars and must be fixed rate and nonconvertible. The 1-3 Month U.S. Treasury Bill Index is market capitalization weighted and the securities in the index are updated on the last business day of each month.
| | THE GUGGENHEIM FUNDS SEMI-ANNUAL REPORT | 3 |
ECONOMIC AND MARKET OVERVIEW (Unaudited)(concluded) | March 31, 2023 |
Dow Jones U.S. Large-Cap Total Stock Market IndexSM is a subset of the Dow Jones U.S. Total Stock Market IndexSM, which measures all U.S. equity securities with readily available prices. It includes stocks among the largest 750.
Dow Jones U.S. Large-Cap Value Total Stock Market IndexSM is a subset of the Dow Jones U.S. Large-Cap Total Stock Market IndexSM which in turn comprises the largest 750 constituents of the Dow Jones U.S. Total Stock Market IndexSM, which measures all U.S. equity securities with readily available prices.
Dow Jones U.S. Mid-Cap Total Stock Market IndexSM is a float-adjusted market capitalization weighted index that reflects the shares of securities of the mid-cap portion of the Dow Jones U.S. Total Stock Market Index actually available to investors in the marketplace. The Mid-Cap Index includes the components ranked 501-1000 by full market.
ICE BofA 3-Month U.S. Treasury Bill Index is an unmanaged market Index of U.S. Treasury securities maturing in 90 days that assumes reinvestment of all income.
MSCI EAFE Index is a free float-adjusted market capitalization index that is designed to measure the equity market performance of developed markets, excluding the U.S. & Canada.
MSCI Emerging Markets Index is a free float-adjusted market capitalization weighted index that is designed to measure equity market performance in the global emerging markets.
S&P 500® is a broad-based index, the performance of which is based on the performance of 500 widely held common stocks chosen for market size, liquidity, and industry group representation capitalization.
S&P 500 Value Index is a market-capitalization-weighted index developed by Standard and Poor’s consisting of those stocks within S&P 500 Index that exhibit strong value characteristics.
4 | THE GUGGENHEIM FUNDS SEMI-ANNUAL REPORT | |
ABOUT SHAREHOLDERS’ FUND EXPENSES (Unaudited) | |
All mutual funds have operating expenses, and it is important for our shareholders to understand the impact of costs on their investments. Shareholders of a fund incur two types of costs: (i) transaction costs, including sales charges (loads) on purchase payments, reinvested dividends, other distributions, and exchange fees, and (ii) ongoing costs, including management fees, administrative services, and shareholder reports, among others. These ongoing costs, or operating expenses, are deducted from a fund’s gross income and reduce the investment return of the fund.
A fund’s expenses are expressed as a percentage of its average net assets, which is known as the expense ratio. The following examples are intended to help investors understand the ongoing costs (in dollars) of investing in a fund and to compare these costs with the ongoing costs of investing in other mutual funds.
The examples are based on an investment of $1,000 made at the beginning of the period and held for the entire six-month period beginning September 30, 2022 and ending March 31, 2023.
The following tables illustrate the Funds’ costs in two ways:
Table 1. Based on actual Fund return: This section helps investors estimate the actual expenses paid over the period. The “Ending Account Value” shown is derived from the Fund’s actual return, and the fifth column shows the dollar amount that would have been paid by an investor who started with $1,000 in the Fund. Investors may use the information here, together with the amount invested, to estimate the expenses paid over the period. Simply divide the Fund’s account value by $1,000 (for example, an $8,600 account value divided by $1,000 = 8.6), then multiply the result by the number provided under the heading “Expenses Paid During Period.”
Table 2. Based on hypothetical 5% return: This section is intended to help investors compare a fund’s cost with those of other mutual funds. The table provides information about hypothetical account values and hypothetical expenses based on the Fund’s actual expense ratio and an assumed rate of return of 5% per year before expenses, which is not the Fund’s actual return. The hypothetical account values and expenses may not be used to estimate the actual ending account balance or expenses paid during the period. The example is useful in making comparisons because the U.S. Securities and Exchange Commission (the “SEC”) requires all mutual funds to calculate expenses based on the 5% return. Investors can assess a fund’s costs by comparing this hypothetical example with the hypothetical examples that appear in shareholder reports of other funds.
The calculations illustrated above assume no shares were bought or sold during the period. Actual costs may have been higher or lower, depending on the amount of investment and the timing of any purchases or redemptions.
Please note that the expenses shown in the table are meant to highlight your ongoing costs only and do not reflect any transactional costs, such as sales charges (loads) on purchase payments, and contingent deferred sales charges (“CDSC”) on redemptions, if any. Therefore, the second table is useful in comparing ongoing costs only, and will not help you determine the relative total costs of owning different funds. In addition, if these transactional costs were included, your costs would have been higher.
More information about the Funds’ expenses, including annual expense ratios for periods up to five years (subject to the Fund’s inception date), can be found in the Financial Highlights section of this report. For additional information on operating expenses and other shareholder costs, please refer to the appropriate Fund prospectus.
| | THE GUGGENHEIM FUNDS SEMI-ANNUAL REPORT | 5 |
ABOUT SHAREHOLDERS’ FUND EXPENSES (Unaudited)(continued) | |
| | Expense
Ratio1 | | | Fund
Return | | | Beginning
Account Value
September 30, 2022 | | | Ending
Account Value
March 31, 2023 | | | Expenses
Paid During
Period2 | |
Table 1. Based on actual Fund return3 | | | | | | | | | | | | | | | | | | | | |
Directional Allocation Fund | | | | | | | | | | | | | | | | | | | | |
A-Class | | | 1.50 | % | | | 1.15 | % | | $ | 1,000.00 | | | $ | 1,011.50 | | | $ | 7.52 | |
C-Class | | | 2.09 | % | | | 0.85 | % | | | 1,000.00 | | | | 1,008.50 | | | | 10.47 | |
P-Class | | | 1.35 | % | | | 1.23 | % | | | 1,000.00 | | | | 1,012.30 | | | | 6.77 | |
Institutional Class | | | 1.09 | % | | | 1.32 | % | | | 1,000.00 | | | | 1,013.20 | | | | 5.47 | |
RBP® Dividend Fund | | | | | | | | | | | | | | | | | | | | |
A-Class | | | 1.17 | % | | | 15.00 | % | | | 1,000.00 | | | | 1,150.00 | | | | 6.27 | |
C-Class | | | 1.92 | % | | | 14.68 | % | | | 1,000.00 | | | | 1,146.80 | | | | 10.28 | |
P-Class | | | 1.17 | % | | | 15.17 | % | | | 1,000.00 | | | | 1,151.70 | | | | 6.28 | |
Institutional Class | | | 0.92 | % | | | 15.32 | % | | | 1,000.00 | | | | 1,153.20 | | | | 4.94 | |
RBP® Large-Cap Defensive Fund | | | | | | | | | | | | | | | | | | | | |
A-Class | | | 1.18 | % | | | 13.84 | % | | | 1,000.00 | | | | 1,138.40 | | | | 6.29 | |
C-Class | | | 1.93 | % | | | 13.48 | % | | | 1,000.00 | | | | 1,134.80 | | | | 10.27 | |
P-Class | | | 1.18 | % | | | 13.87 | % | | | 1,000.00 | | | | 1,138.70 | | | | 6.29 | |
Institutional Class | | | 0.93 | % | | | 13.95 | % | | | 1,000.00 | | | | 1,139.50 | | | | 4.96 | |
RBP® Large-Cap Market Fund | | | | | | | | | | | | | | | | | | | | |
A-Class | | | 1.19 | % | | | 11.32 | % | | | 1,000.00 | | | | 1,113.20 | | | | 6.27 | |
C-Class | | | 1.94 | % | | | 10.87 | % | | | 1,000.00 | | | | 1,108.70 | | | | 10.20 | |
P-Class | | | 1.19 | % | | | 11.39 | % | | | 1,000.00 | | | | 1,113.90 | | | | 6.27 | |
Institutional Class | | | 0.94 | % | | | 11.53 | % | | | 1,000.00 | | | | 1,115.30 | | | | 4.96 | |
RBP® Large-Cap Value Fund | | | | | | | | | | | | | | | | | | | | |
A-Class | | | 1.19 | % | | | 13.89 | % | | | 1,000.00 | | | | 1,138.90 | | | | 6.35 | |
C-Class | | | 1.94 | % | | | 13.38 | % | | | 1,000.00 | | | | 1,133.80 | | | | 10.32 | |
P-Class | | | 1.19 | % | | | 13.87 | % | | | 1,000.00 | | | | 1,138.70 | | | | 6.35 | |
Institutional Class | | | 0.94 | % | | | 14.01 | % | | | 1,000.00 | | | | 1,140.10 | | | | 5.02 | |
6 | THE GUGGENHEIM FUNDS SEMI-ANNUAL REPORT | |
ABOUT SHAREHOLDERS’ FUND EXPENSES (Unaudited)(concluded) | |
| Expense
Ratio1 | Fund
Return | Beginning
Account Value
September 30, 2022 | Ending
Account Value
March 31, 2023 | Expenses
Paid During
Period2 |
Table 2. Based on hypothetical 5% return (before expenses) | | | | |
Directional Allocation Fund | | | | | |
A-Class | 1.50% | 5.00% | $ 1,000.00 | $ 1,017.45 | $ 7.55 |
C-Class | 2.09% | 5.00% | 1,000.00 | 1,014.51 | 10.50 |
P-Class | 1.35% | 5.00% | 1,000.00 | 1,018.20 | 6.79 |
Institutional Class | 1.09% | 5.00% | 1,000.00 | 1,019.50 | 5.49 |
RBP® Dividend Fund | | | | | |
A-Class | 1.17% | 5.00% | 1,000.00 | 1,019.10 | 5.89 |
C-Class | 1.92% | 5.00% | 1,000.00 | 1,015.36 | 9.65 |
P-Class | 1.17% | 5.00% | 1,000.00 | 1,019.10 | 5.89 |
Institutional Class | 0.92% | 5.00% | 1,000.00 | 1,020.34 | 4.63 |
RBP® Large-Cap Defensive Fund | | | | | |
A-Class | 1.18% | 5.00% | 1,000.00 | 1,019.05 | 5.94 |
C-Class | 1.93% | 5.00% | 1,000.00 | 1,015.31 | 9.70 |
P-Class | 1.18% | 5.00% | 1,000.00 | 1,019.05 | 5.94 |
Institutional Class | 0.93% | 5.00% | 1,000.00 | 1,020.29 | 4.68 |
RBP® Large-Cap Market Fund | | | | | |
A-Class | 1.19% | 5.00% | 1,000.00 | 1,019.00 | 5.99 |
C-Class | 1.94% | 5.00% | 1,000.00 | 1,015.26 | 9.75 |
P-Class | 1.19% | 5.00% | 1,000.00 | 1,019.00 | 5.99 |
Institutional Class | 0.94% | 5.00% | 1,000.00 | 1,020.24 | 4.73 |
RBP® Large-Cap Value Fund | | | | | |
A-Class | 1.19% | 5.00% | 1,000.00 | 1,019.00 | 5.99 |
C-Class | 1.94% | 5.00% | 1,000.00 | 1,015.26 | 9.75 |
P-Class | 1.19% | 5.00% | 1,000.00 | 1,019.00 | 5.99 |
Institutional Class | 0.94% | 5.00% | 1,000.00 | 1,020.24 | 4.73 |
1 | Annualized and excludes expenses of the underlying funds in which the Funds invest, if any. |
2 | Expenses are equal to the Fund’s annualized expense ratio, net of any applicable fee waivers, multiplied by the average account value over the period, multiplied by 182/365 (to reflect the one-half year period). |
3 | Actual cumulative return at net asset value for the period September 30, 2022 to March 31, 2023. |
| | THE GUGGENHEIM FUNDS SEMI-ANNUAL REPORT | 7 |
PERFORMANCE REPORT AND FUND PROFILE (Unaudited) | March 31, 2023 |
DIRECTIONAL ALLOCATION FUND
OBJECTIVE: Seeks to provide investment results that, before fees and expenses, correspond generally to the performance of the Guggenheim Directional Allocation IndexSM (the “Directional Allocation Index” or “Index”).
Holdings Diversification (Market Exposure as % of Net Assets)

In response to recent market and economic conditions and consistent with the Fund’s objectives and strategies, the Fund has, in recent periods, moved to 100% allocation to cash and cash equivalents and will continue to do so if market conditions warrant.
Inception Dates: |
A-Class | June 18, 2012 |
C-Class | June 18, 2012 |
P-Class | June 18, 2012 |
Institutional Class | June 18, 2012 |
8 | THE GUGGENHEIM FUNDS SEMI-ANNUAL REPORT | |
PERFORMANCE REPORT AND FUND PROFILE (Unaudited)(concluded) | March 31, 2023 |
Average Annual Returns*
Periods Ended March 31, 2023
| 6 Month† | 1 Year | 5 Year | 10 Year |
A-Class Shares | 1.15% | (11.75%) | 5.23% | 8.06% |
A-Class Shares with sales charge‡ | (3.66%) | (15.93%) | 4.21% | 7.42% |
C-Class Shares | 0.85% | (12.36%) | 4.48% | 7.33% |
C-Class Shares with CDSC§ | (0.15%) | (13.23%) | 4.48% | 7.33% |
P-Class Shares** | 1.23% | (11.69%) | 5.27% | 8.14% |
Institutional Class Shares | 1.32% | (11.50%) | 5.53% | 8.41% |
Guggenheim Directional Allocation IndexSM | (0.00%) | (12.60%) | 6.10% | 9.37% |
Dow Jones U.S. Large-Cap Total Stock Market Index | 15.29% | (8.56%) | 10.91% | 12.05% |
* | The performance data above represents past performance that is not predictive of future results. The investment return and principal value of an investment in the Fund will fluctuate so that an investor’s shares, when redeemed, may be worth more or less than their original cost. Returns are historical and include changes in principal and reinvested dividends and capital gains and do not reflect the effect of taxes. The Guggenheim Directional Allocation IndexSM and the Dow Jones U.S. Large-Cap Total Stock Market Index are unmanaged indices and, unlike the Fund, have no management fees or operating expenses to reduce their reported returns. |
** | F-1 Class shares redesignated as P-Class shares effective May 9, 2016. |
† | 6 month returns are not annualized. |
‡ | Effective May 9, 2016, the maximum sales charge decreased from 5.75% to 4.75%. A 5.75% maximum sales charge is used in the calculation of the Average Annual Return since inception based on subscriptions made prior to May 9, 2016, and a 4.75% maximum sales charge is used to calculate performance for periods based on subscriptions made on or after May 9, 2016. |
§ | Fund returns include a CDSC of 1% if redeemed within 12 months of purchase. |
| | THE GUGGENHEIM FUNDS SEMI-ANNUAL REPORT | 9 |
SCHEDULE OF INVESTMENTS (Unaudited) | March 31, 2023 |
DIRECTIONAL ALLOCATION FUND | |
| | Shares | | | Value | |
MONEY MARKET FUND† - 2.5% |
Dreyfus Treasury Obligations Cash Management Fund — Institutional Shares, 4.69%1 | | | 5,532,181 | | | $ | 5,532,181 | |
Total Money Market Fund | | | | |
(Cost $5,532,181) | | | | | | | 5,532,181 | |
| | Face
Amount | | | Value | |
U.S. TREASURY BILLS†† - 97.8% |
U.S. Treasury Bills |
4.05% due 04/27/232 | | $ | 218,000,000 | | | | 217,331,466 | |
Total U.S. Treasury Bills | | | | |
(Cost $217,346,605) | | | | | | | 217,331,466 | |
| | | | | | | | | |
Total Investments - 100.3% | | | | |
(Cost $222,878,786) | | $ | 222,863,647 | |
Other Assets & Liabilities, net - (0.3)% | | | (726,951 | ) |
Total Net Assets - 100.0% | | $ | 222,136,696 | |
† | Value determined based on Level 1 inputs — See Note 4. |
†† | Value determined based on Level 2 inputs — See Note 4. |
1 | Rate indicated is the 7-day yield as of March 31, 2023. |
2 | Rate indicated is the effective yield at the time of purchase. |
| | |
| | See Sector Classification in Other Information section. |
The following table summarizes the inputs used to value the Fund’s investments at March 31, 2023 (See Note 4 in the Notes to Financial Statements):
Investments in Securities (Assets) | | Level 1
Quoted
Prices | | | Level 2
Significant
Observable
Inputs | | | Level 3
Significant
Unobservable
Inputs | | | Total | |
Money Market Fund | | $ | 5,532,181 | | | $ | — | | | $ | — | | | $ | 5,532,181 | |
U.S. Treasury Bills | | | — | | | | 217,331,466 | | | | — | | | | 217,331,466 | |
Total Assets | | $ | 5,532,181 | | | $ | 217,331,466 | | | $ | — | | | $ | 222,863,647 | |
10 | THE GUGGENHEIM FUNDS SEMI-ANNUAL REPORT | |
DIRECTIONAL ALLOCATION FUND | |
STATEMENT OF ASSETS AND LIABILITIES (Unaudited) |
March 31, 2023 |
Assets: |
Investments, at value (cost $222,878,786) | | $ | 222,863,647 | |
Cash | | | 2 | |
Prepaid expenses | | | 29,359 | |
Receivables: |
Interest | | | 80,831 | |
Fund shares sold | | | 1,942 | |
Total assets | | | 222,975,781 | |
| | | | | |
Liabilities: |
Payable for: |
Fund shares redeemed | | | 491,422 | |
Management fees | | | 146,236 | |
Professional fees | | | 93,754 | |
Distribution and service fees | | | 41,074 | |
Due to Investment Adviser | | | 15,168 | |
Transfer agent/maintenance fees | | | 13,419 | |
Fund accounting/administration fees | | | 6,117 | |
Trustees’ fees* | | | 207 | |
Miscellaneous | | | 31,688 | |
Total liabilities | | | 839,085 | |
Net assets | | $ | 222,136,696 | |
| | | | | |
Net assets consist of: |
Paid in capital | | $ | 222,346,135 | |
Total distributable earnings (loss) | | | (209,439 | ) |
Net assets | | $ | 222,136,696 | |
| | | | | |
A-Class: |
Net assets | | $ | 126,597,930 | |
Capital shares outstanding | | | 8,830,111 | |
Net asset value per share | | $ | 14.34 | |
Maximum offering price per share (Net asset value divided by 95.25%) | | $ | 15.06 | |
| | | | | |
C-Class: |
Net assets | | $ | 14,851,725 | |
Capital shares outstanding | | | 1,144,150 | |
Net asset value per share | | $ | 12.98 | |
| | | | | |
P-Class: |
Net assets | | $ | 5,062,286 | |
Capital shares outstanding | | | 349,501 | |
Net asset value per share | | $ | 14.48 | |
| | | | | |
Institutional Class: |
Net assets | | $ | 75,624,755 | |
Capital shares outstanding | | | 5,060,880 | |
Net asset value per share | | $ | 14.94 | |
STATEMENT OF OPERATIONS (Unaudited) |
Six Months Ended March 31, 2023 |
Investment Income: |
Interest | | | 4,495,705 | |
Total investment income | | | 4,495,705 | |
| | | | | |
Expenses: |
Management fees | | | 1,133,257 | |
Distribution and service fees: |
A-Class | | | 196,636 | |
C-Class | | | 87,245 | |
P-Class | | | 6,722 | |
Transfer agent/maintenance fees: |
A-Class | | | 6,594 | |
C-Class | | | 2,793 | |
P-Class | | | 831 | |
Institutional Class | | | 14,953 | |
Professional fees | | | 133,772 | |
Fund accounting/administration fees | | | 54,063 | |
Custodian fees | | | 31,991 | |
Tax expense | | | 13,839 | |
Trustees’ fees* | | | 8,263 | |
Line of credit fees | | | 3,815 | |
Miscellaneous | | | 62,374 | |
Recoupment of previously waived fees: |
A-Class | | | 64,636 | |
C-Class | | | 780 | |
P-Class | | | 246 | |
Institutional Class | | | 3,940 | |
Total expenses | | | 1,826,750 | |
Less: |
A-Class | | | (4,570 | ) |
C-Class | | | (3,208 | ) |
P-Class | | | (951 | ) |
Institutional Class | | | (17,034 | ) |
Expenses waived by Adviser | | | (140,492 | ) |
Earnings credits applied | | | (25,942 | ) |
Total waived/reimbursed expenses | | | (192,197 | ) |
Net expenses | | | 1,634,553 | |
Net investment income | | | 2,861,152 | |
| | | | | |
Net Realized and Unrealized Gain (Loss): |
Net realized gain (loss) on: |
Investments | | | 25,044 | |
Net realized gain | | | 25,044 | |
Net change in unrealized appreciation (depreciation) on: |
Investments | | | (48,970 | ) |
Net change in unrealized appreciation (depreciation) | | | (48,970 | ) |
Net realized and unrealized loss | | | (23,926 | ) |
Net increase in net assets resulting from operations | | $ | 2,837,226 | |
* | Relates to Trustees not deemed “interested persons” within the meaning of Section 2(a)(19) of the 1940 Act. |
SEE NOTES TO FINANCIAL STATEMENTS. | THE GUGGENHEIM FUNDS SEMI-ANNUAL REPORT | 11 |
DIRECTIONAL ALLOCATION FUND | |
STATEMENTS OF CHANGES IN NET ASSETS |
| | Six Months Ended
March 31, 2023
(Unaudited) | | | Year Ended
September 30,
2022 | |
Increase (Decrease) in Net Assets from Operations: | | | | | | | | |
Net investment income (loss) | | $ | 2,861,152 | | | $ | (68,833 | ) |
Net realized gain (loss) on investments | | | 25,044 | | | | (1,829,790 | ) |
Net change in unrealized appreciation (depreciation) on investments | | | (48,970 | ) | | | (26,086,263 | ) |
Net increase (decrease) in net assets resulting from operations | | | 2,837,226 | | | | (27,984,886 | ) |
| | | | | | | | | |
Distributions to shareholders: | | | | | | | | |
A-Class | | | (482,969 | ) | | | (22,873,206 | ) |
C-Class | | | — | | | | (7,531,556 | ) |
P-Class | | | (21,150 | ) | | | (1,174,381 | ) |
Institutional Class | | | (613,597 | ) | | | (18,380,858 | ) |
Total distributions to shareholders | | | (1,117,716 | ) | | | (49,960,001 | ) |
| | | | | | | | | |
Capital share transactions: | | | | | | | | |
Proceeds from sale of shares | | | | | | | | |
A-Class | | | 6,540,597 | | | | 36,607,727 | |
C-Class | | | 225,862 | | | | 499,868 | |
P-Class | | | 221,161 | | | | 87,108 | |
Institutional Class | | | 2,789,789 | | | | 5,835,101 | |
Distributions reinvested | | | | | | | | |
A-Class | | | 435,304 | | | | 20,292,140 | |
C-Class | | | — | | | | 7,433,984 | |
P-Class | | | 20,861 | | | | 1,161,691 | |
Institutional Class | | | 595,770 | | | | 17,864,833 | |
Cost of shares redeemed | | | | | | | | |
A-Class | | | (16,885,657 | ) | | | (35,849,828 | ) |
C-Class | | | (6,352,326 | ) | | | (37,540,879 | ) |
P-Class | | | (648,716 | ) | | | (2,457,640 | ) |
Institutional Class | | | (21,507,137 | ) | | | (39,972,997 | ) |
Net increase (decrease) from capital share transactions | | | (34,564,492 | ) | | | (26,038,892 | ) |
Net increase (decrease) in net assets | | | (32,844,982 | ) | | | (103,983,779 | ) |
| | | | | | | | | |
Net assets: | | | | | | | | |
Beginning of period | | | 254,981,678 | | | | 358,965,457 | |
End of period | | $ | 222,136,696 | | | $ | 254,981,678 | |
| | | | | | | | | |
Capital share activity: | | | | | | | | |
Shares sold | | | | | | | | |
A-Class | | | 458,673 | | | | 2,195,844 | |
C-Class | | | 17,468 | | | | 33,059 | |
P-Class | | | 15,336 | | | | 5,264 | |
Institutional Class | | | 187,717 | | | | 344,245 | |
Shares issued from reinvestment of distributions | | | | | | | | |
A-Class | | | 30,612 | | | | 1,196,471 | |
C-Class | | | — | | | | 481,788 | |
P-Class | | | 1,453 | | | | 67,856 | |
Institutional Class | | | 40,255 | | | | 1,011,599 | |
Shares redeemed | | | | | | | | |
A-Class | | | (1,183,928 | ) | | | (2,293,863 | ) |
C-Class | | | (492,049 | ) | | | (2,494,552 | ) |
P-Class | | | (44,918 | ) | | | (162,961 | ) |
Institutional Class | | | (1,445,515 | ) | | | (2,423,203 | ) |
Net decrease in shares | | | (2,414,896 | ) | | | (2,038,453 | ) |
12 | THE GUGGENHEIM FUNDS SEMI-ANNUAL REPORT | SEE NOTES TO FINANCIAL STATEMENTS. |
DIRECTIONAL ALLOCATION FUND | |
This table is presented to show selected data for a share outstanding throughout each period and to assist shareholders in evaluating a Fund’s performance for the periods presented.
A-Class | | Six Months Ended
March 31, 2023a | | | Year Ended
September 30,
2022 | | | Year Ended
September 30,
2021 | | | Year Ended
September 30,
2020 | | | Year Ended
September 30,
2019 | | | Year Ended
September 30,
2018 | |
Per Share Data |
Net asset value, beginning of period | | $ | 14.23 | | | $ | 18.11 | | | $ | 14.00 | | | $ | 16.50 | | | $ | 18.59 | | | $ | 15.83 | |
Income (loss) from investment operations: |
Net investment income (loss)b | | | .16 | | | | (.01 | ) | | | (.06 | ) | | | .02 | | | | .03 | | | | (.03 | ) |
Net gain (loss) on investments (realized and unrealized) | | | — | | | | (1.27 | ) | | | 4.18 | | | | .07 | | | | (.12 | ) | | | 2.79 | |
Total from investment operations | | | .16 | | | | (1.28 | ) | | | 4.12 | | | | .09 | | | | (.09 | ) | | | 2.76 | |
Less distributions from: |
Net investment income | | | (.05 | ) | | | — | | | | (.01 | ) | | | — | | | | — | | | | — | |
Net realized gains | | | — | | | | (2.60 | ) | | | — | | | | (2.59 | ) | | | (2.00 | ) | | | — | |
Total distributions | | | (.05 | ) | | | (2.60 | ) | | | (.01 | ) | | | (2.59 | ) | | | (2.00 | ) | | | — | |
Net asset value, end of period | | $ | 14.34 | | | $ | 14.23 | | | $ | 18.11 | | | $ | 14.00 | | | $ | 16.50 | | | $ | 18.59 | |
|
Total Returnd | | | 1.15 | % | | | (9.40 | %) | | | 29.42 | % | | | (0.38 | %) | | | 1.13 | % | | | 17.44 | % |
Ratios/Supplemental Data |
Net assets, end of period (in thousands) | | $ | 126,598 | | | $ | 135,504 | | | $ | 152,598 | | | $ | 106,549 | | | $ | 104,877 | | | $ | 117,786 | |
Ratios to average net assets: |
Net investment income (loss) | | | 2.31 | % | | | (0.03 | %) | | | (0.38 | %) | | | 0.16 | % | | | 0.18 | % | | | (0.20 | %) |
Total expensese | | | 1.62 | % | | | 1.48 | % | | | 1.44 | % | | | 1.43 | % | | | 1.40 | % | | | 1.35 | % |
Net expensesf,g,h | | | 1.50 | % | | | 1.39 | % | | | 1.42 | % | | | 1.40 | % | | | 1.39 | % | | | 1.34 | % |
Portfolio turnover rate | | | — | | | | 149 | % | | | 131 | % | | | 313 | % | | | 203 | % | | | 92 | % |
C-Class | | Six Months Ended
March 31, 2023a | | | Year Ended
September 30,
2022 | | | Year Ended
September 30,
2021 | | | Year Ended
September 30,
2020 | | | Year Ended
September 30,
2019 | | | Year Ended
September 30,
2018 | |
Per Share Data |
Net asset value, beginning of period | | $ | 12.87 | | | $ | 16.72 | | | $ | 13.01 | | | $ | 15.59 | | | $ | 17.81 | | | $ | 15.29 | |
Income (loss) from investment operations: |
Net investment income (loss)b | | | .11 | | | | (.12 | ) | | | (.16 | ) | | | (.07 | ) | | | (.08 | ) | | | (.16 | ) |
Net gain (loss) on investments (realized and unrealized) | | | — | | | | (1.13 | ) | | | 3.87 | | | | .08 | | | | (.14 | ) | | | 2.68 | |
Total from investment operations | | | .11 | | | | (1.25 | ) | | | 3.71 | | | | .01 | | | | (.22 | ) | | | 2.52 | |
Less distributions from: |
Net realized gains | | | — | | | | (2.60 | ) | | | — | | | | (2.59 | ) | | | (2.00 | ) | | | — | |
Total distributions | | | — | | | | (2.60 | ) | | | — | | | | (2.59 | ) | | | (2.00 | ) | | | — | |
Net asset value, end of period | | $ | 12.98 | | | $ | 12.87 | | | $ | 16.72 | | | $ | 13.01 | | | $ | 15.59 | | | $ | 17.81 | |
|
Total Returnd | | | 0.85 | % | | | (10.08 | %) | | | 28.52 | % | | | (0.99 | %) | | | 0.38 | % | | | 16.48 | % |
Ratios/Supplemental Data |
Net assets, end of period (in thousands) | | $ | 14,852 | | | $ | 20,835 | | | $ | 60,153 | | | $ | 98,656 | | | $ | 176,994 | | | $ | 239,516 | |
Ratios to average net assets: |
Net investment income (loss) | | | 1.66 | % | | | (0.82 | %) | | | (1.02 | %) | | | (0.53 | %) | | | (0.53 | %) | | | (0.96 | %) |
Total expensese | | | 2.25 | % | | | 2.21 | % | | | 2.15 | % | | | 2.15 | % | | | 2.13 | % | | | 2.11 | % |
Net expensesf,g,h | | | 2.09 | % | | | 2.08 | % | | | 2.09 | % | | | 2.10 | % | | | 2.11 | % | | | 2.11 | % |
Portfolio turnover rate | | | — | | | | 149 | % | | | 131 | % | | | 313 | % | | | 203 | % | | | 92 | % |
SEE NOTES TO FINANCIAL STATEMENTS. | THE GUGGENHEIM FUNDS SEMI-ANNUAL REPORT | 13 |
DIRECTIONAL ALLOCATION FUND | |
FINANCIAL HIGHLIGHTS (continued) |
This table is presented to show selected data for a share outstanding throughout each period and to assist shareholders in evaluating a Fund’s performance for the periods presented.
P-Class | | Six Months Ended
March 31, 2023a | | | Year Ended
September 30,
2022 | | | Year Ended
September 30,
2021 | | | Year Ended
September 30,
2020 | | | Year Ended
September 30,
2019 | | | Year Ended
September 30,
2018 | |
Per Share Data |
Net asset value, beginning of period | | $ | 14.36 | | | $ | 18.25 | | | $ | 14.10 | | | $ | 16.59 | | | $ | 18.67 | | | $ | 15.90 | |
Income (loss) from investment operations: |
Net investment income (loss)b | | | .18 | | | | — | c | | | (.05 | ) | | | .03 | | | | .04 | | | | (.04 | ) |
Net gain (loss) on investments (realized and unrealized) | | | — | | | | (1.29 | ) | | | 4.20 | | | | .07 | | | | (.12 | ) | | | 2.81 | |
Total from investment operations | | | .18 | | | | (1.29 | ) | | | 4.15 | | | | .10 | | | | (.08 | ) | | | 2.77 | |
Less distributions from: |
Net investment income | | | (.06 | ) | | | — | | | | — | c | | | — | | | | — | | | | — | |
Net realized gains | | | — | | | | (2.60 | ) | | | — | | | | (2.59 | ) | | | (2.00 | ) | | | — | |
Total distributions | | | (.06 | ) | | | (2.60 | ) | | | — | | | | (2.59 | ) | | | (2.00 | ) | | | — | |
Net asset value, end of period | | $ | 14.48 | | | $ | 14.36 | | | $ | 18.25 | | | $ | 14.10 | | | $ | 16.59 | | | $ | 18.67 | |
|
Total Return | | | 1.23 | % | | | (9.38 | %) | | | 29.45 | % | | | (0.30 | %) | | | 1.19 | % | | | 17.42 | % |
Ratios/Supplemental Data |
Net assets, end of period (in thousands) | | $ | 5,062 | | | $ | 5,424 | | | $ | 8,533 | | | $ | 9,143 | | | $ | 15,056 | | | $ | 20,892 | |
Ratios to average net assets: |
Net investment income (loss) | | | 2.46 | % | | | (0.01 | %) | | | (0.28 | %) | | | 0.22 | % | | | 0.24 | % | | | (0.22 | %) |
Total expensese | | | 1.50 | % | | | 1.43 | % | | | 1.38 | % | | | 1.40 | % | | | 1.40 | % | | | 1.37 | % |
Net expensesf,g,h | | | 1.35 | % | | | 1.33 | % | | | 1.34 | % | | | 1.35 | % | | | 1.36 | % | | | 1.36 | % |
Portfolio turnover rate | | | — | | | | 149 | % | | | 131 | % | | | 313 | % | | | 203 | % | | | 92 | % |
14 | THE GUGGENHEIM FUNDS SEMI-ANNUAL REPORT | SEE NOTES TO FINANCIAL STATEMENTS. |
DIRECTIONAL ALLOCATION FUND | |
FINANCIAL HIGHLIGHTS (concluded) |
This table is presented to show selected data for a share outstanding throughout each period and to assist shareholders in evaluating a Fund’s performance for the periods presented.
Institutional Class | | Six Months Ended
March 31, 2023a | | | Year Ended
September 30,
2022 | | | Year Ended
September 30,
2021 | | | Year Ended
September 30,
2020 | | | Year Ended
September 30,
2019 | | | Year Ended
September 30,
2018 | |
Per Share Data |
Net asset value, beginning of period | | $ | 14.85 | | | $ | 18.74 | | | $ | 14.48 | | | $ | 16.93 | | | $ | 18.97 | | | $ | 16.12 | |
Income (loss) from investment operations: |
Net investment income (loss)b | | | .20 | | | | .04 | | | | (.01 | ) | | | .07 | | | | .08 | | | | .01 | |
Net gain (loss) on investments (realized and unrealized) | | | (.01 | ) | | | (1.33 | ) | | | 4.32 | | | | .07 | | | | (.12 | ) | | | 2.84 | |
Total from investment operations | | | .19 | | | | (1.29 | ) | | | 4.31 | | | | .14 | | | | (.04 | ) | | | 2.85 | |
Less distributions from: |
Net investment income | | | (.10 | ) | | | — | | | | (.05 | ) | | | — | | | | — | | | | — | |
Net realized gains | | | — | | | | (2.60 | ) | | | — | | | | (2.59 | ) | | | (2.00 | ) | | | — | |
Total distributions | | | (.10 | ) | | | (2.60 | ) | | | (.05 | ) | | | (2.59 | ) | | | (2.00 | ) | | | — | |
Net asset value, end of period | | $ | 14.94 | | | $ | 14.85 | | | $ | 18.74 | | | $ | 14.48 | | | $ | 16.93 | | | $ | 18.97 | |
|
Total Return | | | 1.32 | % | | | (9.11 | %) | | | 29.81 | % | | | (0.03 | %) | | | 1.39 | % | | | 17.68 | % |
Ratios/Supplemental Data |
Net assets, end of period (in thousands) | | $ | 75,625 | | | $ | 93,219 | | | $ | 137,682 | | | $ | 152,083 | | | $ | 266,223 | | | $ | 345,423 | |
Ratios to average net assets: |
Net investment income (loss) | | | 2.68 | % | | | 0.25 | % | | | (0.04 | %) | | | 0.47 | % | | | 0.48 | % | | | 0.04 | % |
Total expensese | | | 1.25 | % | | | 1.20 | % | | | 1.15 | % | | | 1.15 | % | | | 1.13 | % | | | 1.12 | % |
Net expensesf,g,h | | | 1.09 | % | | | 1.08 | % | | | 1.09 | % | | | 1.10 | % | | | 1.11 | % | | | 1.11 | % |
Portfolio turnover rate | | | — | | | | 149 | % | | | 131 | % | | | 313 | % | | | 203 | % | | | 92 | % |
a | Unaudited figures for the period ended March 31, 2023. Percentage amounts for the period, except total return and portfolio turnover rate, have been annualized. |
b | Net investment income (loss) per share was computed using average shares outstanding throughout the period. |
c | Less than $0.01 per share. |
d | Total return does not reflect the impact of any applicable sales charges. |
e | Does not include expenses of the underlying funds in which the Fund invests. |
f | Net expense information reflects the expense ratios after expense waivers and reimbursements, as applicable. |
g | The portion of the ratios of net expenses to average net assets attributable to recoupments of prior fee reductions or expense reimbursements for the years presented was as follows: |
| 3/31/2023a | 09/30/22 | 09/30/21 | 09/30/20 | 09/30/19 | 09/30/18 |
A-Class | 0.10% | 0.01% | — | — | 0.01% | — |
C-Class | 0.01% | 0.01% | — | 0.01% | 0.01% | 0.02% |
P-Class | 0.01% | 0.01% | — | 0.00%i | 0.00%i | 0.01% |
Institutional Class | 0.01% | 0.01% | — | 0.01% | 0.01% | 0.02% |
h | Net expenses may include expenses that are excluded from the expense limitation agreement. Excluding these expenses, the net expense ratios for the years presented would be: |
| 03/31/23a | 09/30/22 | 09/30/21 | 09/30/20 | 09/30/19 | 09/30/18 |
A-Class | 1.46% | 1.38% | 1.41% | 1.40% | 1.39% | 1.34% |
C-Class | 2.06% | 2.08% | 2.08% | 2.10% | 2.10% | 2.10% |
P-Class | 1.31% | 1.33% | 1.34% | 1.35% | 1.35% | 1.35% |
Institutional Class | 1.06% | 1.08% | 1.09% | 1.10% | 1.10% | 1.10% |
SEE NOTES TO FINANCIAL STATEMENTS. | THE GUGGENHEIM FUNDS SEMI-ANNUAL REPORT | 15 |
PERFORMANCE REPORT AND FUND PROFILE (Unaudited) | March 31, 2023 |
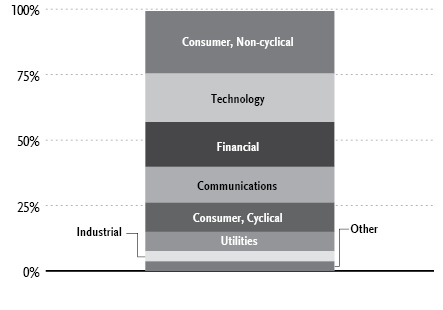
RBP® DIVIDEND FUND
OBJECTIVE: Seeks to provide investment results that, before fees and expenses, correspond generally to the total return performance of the Guggenheim RBP® Dividend IndexSM (the “Dividend Index” or “Index”).
Holdings Diversification (Market Exposure as % of Net Assets)

“Holdings Diversification (Market Exposure as % of Net Assets)” excludes any temporary cash investments.
Inception Dates: |
A-Class | April 18, 2011 |
C-Class | April 18, 2011 |
P-Class | April 18, 2011 |
Institutional Class | February 10, 2011 |
Ten Largest Holdings | (% of Total
Net Assets) |
Microsoft Corp. | 6.9% |
Apple, Inc. | 5.9% |
Exxon Mobil Corp. | 2.2% |
Visa, Inc. — Class A | 2.0% |
Procter & Gamble Co. | 1.9% |
Mastercard, Inc. — Class A | 1.8% |
Home Depot, Inc. | 1.7% |
Broadcom, Inc. | 1.7% |
Merck & Company, Inc. | 1.7% |
Walmart, Inc. | 1.6% |
Top Ten Total | 27.4% |
| | |
“Ten Largest Holdings” excludes any temporary cash investments. |
16 | THE GUGGENHEIM FUNDS SEMI-ANNUAL REPORT | |
PERFORMANCE REPORT AND FUND PROFILE (Unaudited)(concluded) | March 31, 2023 |
Average Annual Returns*
Periods Ended March 31, 2023
| 6 Month† | 1 Year | 5 Year | 10 Year |
A-Class Shares | 15.00% | (7.83%) | 7.63% | 8.80% |
A-Class Shares with sales charge‡ | 9.57% | (12.20%) | 6.59% | 8.15% |
C-Class Shares | 14.68% | (8.46%) | 6.82% | 8.03% |
C-Class Shares with CDSC§ | 13.68% | (9.37%) | 6.82% | 8.03% |
P-Class Shares** | 15.17% | (7.78%) | 7.64% | 8.85% |
Institutional Class Shares | 15.32% | (7.51%) | 7.91% | 9.13% |
Guggenheim RBP Dividend IndexSM | 15.82% | (6.68%) | 9.06% | 10.40% |
Dow Jones U.S. Large-Cap Total Stock Market Index | 15.29% | (8.56%) | 10.91% | 12.05% |
* | The performance data above represents past performance that is not predictive of future results. The investment return and principal value of an investment in the Fund will fluctuate so that an investor’s shares, when redeemed, may be worth more or less than their original cost. Returns are historical and include changes in principal and reinvested dividends and capital gains and do not reflect the effect of taxes. The Guggenheim RBP Dividend IndexSM and Dow Jones U.S. Large-Cap Total Stock Market Index are unmanaged indices and, unlike the Fund, have no management fees or operating expenses to reduce their reported returns. |
** | F-1 Class shares redesignated as P-Class share effective May 9, 2016. |
† | 6 month returns are not annualized. |
‡ | Effective May 9, 2016, the maximum sales charge decreased from 5.75% to 4.75%. A 5.75% maximum sales charge is used in the calculation of the Average Annual Return since inception based on subscriptions made prior to May 9, 2016, and a 4.75% maximum sales charge will be used to calculate performance for periods based on subscriptions made on or after May 9, 2016. |
§ | Fund returns include a CDSC of 1% if redeemed within 12 months of purchase. |
| | THE GUGGENHEIM FUNDS SEMI-ANNUAL REPORT | 17 |
SCHEDULE OF INVESTMENTS (Unaudited) | March 31, 2023 |
RBP® DIVIDEND FUND | |
| | Shares | | | Value | |
COMMON STOCKS† - 99.1% |
| | | | | | | | | |
Technology - 23.4% |
Microsoft Corp. | | | 4,214 | | | $ | 1,214,896 | |
Apple, Inc. | | | 6,250 | | | | 1,030,625 | |
Broadcom, Inc. | | | 470 | | | | 301,524 | |
Accenture plc — Class A | | | 904 | | | | 258,372 | |
Intuit, Inc. | | | 558 | | | | 248,773 | |
Applied Materials, Inc. | | | 1,856 | | | | 227,973 | |
KLA Corp. | | | 508 | | | | 202,778 | |
Monolithic Power Systems, Inc. | | | 368 | | | | 184,199 | |
Electronic Arts, Inc. | | | 1,473 | | | | 177,423 | |
NVIDIA Corp. | | | 455 | | | | 126,385 | |
QUALCOMM, Inc. | | | 921 | | | | 117,501 | |
Total Technology | | | | | | | 4,090,449 | |
| | | | | | | | | |
Financial - 19.0% |
Visa, Inc. — Class A | | | 1,547 | | | | 348,787 | |
Mastercard, Inc. — Class A | | | 880 | | | | 319,801 | |
Prologis, Inc. REIT | | | 1,862 | | | | 232,322 | |
American Express Co. | | | 1,288 | | | | 212,455 | |
Intercontinental Exchange, Inc. | | | 1,916 | | | | 199,820 | |
Chubb Ltd. | | | 985 | | | | 191,267 | |
Life Storage, Inc. REIT | | | 1,448 | | | | 189,818 | |
Rexford Industrial Realty, Inc. REIT | | | 3,035 | | | | 181,038 | |
Mid-America Apartment Communities, Inc. REIT | | | 1,102 | | | | 166,446 | |
Truist Financial Corp. | | | 4,719 | | | | 160,918 | |
Popular, Inc. | | | 2,722 | | | | 156,270 | |
American International Group, Inc. | | | 3,076 | | | | 154,908 | |
MetLife, Inc. | | | 2,435 | | | | 141,084 | |
Annaly Capital Management, Inc. REIT | | | 6,696 | | | | 127,961 | |
American Tower Corp. — Class A REIT | | | 558 | | | | 114,022 | |
Rithm Capital Corp. REIT | | | 10,463 | | | | 83,704 | |
Pinnacle Financial Partners, Inc. | | | 1,217 | | | | 67,129 | |
Blackstone Mortgage Trust, Inc. — Class A REIT | | | 3,715 | | | | 66,313 | |
New York Community Bancorp, Inc. | | | 6,573 | | | | 59,420 | |
American Homes 4 Rent — Class A REIT | | | 1,870 | | | | 58,811 | |
AGNC Investment Corp. REIT | | | 4,128 | | | | 41,610 | |
Comerica, Inc. | | | 409 | | | | 17,759 | |
JPMorgan Chase & Co. | | | 126 | | | | 16,419 | |
Sun Communities, Inc. REIT | | | 71 | | | | 10,002 | |
Total Financial | | | | | | | 3,318,084 | |
| | | | | | | | | |
Consumer, Non-cyclical - 17.3% |
Procter & Gamble Co. | | | 2,290 | | | | 340,500 | |
Merck & Company, Inc. | | | 2,773 | | | | 295,020 | |
Bristol-Myers Squibb Co. | | | 3,546 | | | | 245,773 | |
Danaher Corp. | | | 914 | | | | 230,365 | |
Becton Dickinson and Co. | | | 859 | | | | 212,637 | |
Gilead Sciences, Inc. | | | 2,543 | | | | 210,992 | |
Amgen, Inc. | | | 765 | | | | 184,939 | |
Sysco Corp. | | | 2,310 | | | | 178,402 | |
Bunge Ltd. | | | 1,864 | | | | 178,049 | |
Encompass Health Corp. | | | 3,159 | | | | 170,902 | |
Kroger Co. | | | 3,414 | | | | 168,549 | |
Constellation Brands, Inc. — Class A | | | 600 | | | | 135,534 | |
PepsiCo, Inc. | | | 663 | | | | 120,865 | |
Bruker Corp. | | | 1,300 | | | | 102,492 | |
McKesson Corp. | | | 207 | | | | 73,702 | |
UnitedHealth Group, Inc. | | | 138 | | | | 65,217 | |
Automatic Data Processing, Inc. | | | 255 | | | | 56,771 | |
Johnson & Johnson | | | 259 | | | | 40,145 | |
MarketAxess Holdings, Inc. | | | 34 | | | | 13,304 | |
Total Consumer, Non-cyclical | | | | | | | 3,024,158 | |
| | | | | | | | | |
Consumer, Cyclical - 14.6% |
Home Depot, Inc. | | | 1,030 | | | | 303,974 | |
Walmart, Inc. | | | 1,854 | | | | 273,372 | |
NIKE, Inc. — Class B | | | 2,010 | | | | 246,506 | |
Starbucks Corp. | | | 2,238 | | | | 233,043 | |
TJX Companies, Inc. | | | 2,785 | | | | 218,233 | |
Target Corp. | | | 1,218 | | | | 201,737 | |
General Motors Co. | | | 5,216 | | | | 191,323 | |
Costco Wholesale Corp. | | | 365 | | | | 181,358 | |
Dollar General Corp. | | | 810 | | | | 170,473 | |
WW Grainger, Inc. | | | 238 | | | | 163,937 | |
Watsco, Inc. | | | 458 | | | | 145,717 | |
Lowe’s Companies, Inc. | | | 716 | | | | 143,178 | |
Tractor Supply Co. | | | 334 | | | | 78,503 | |
Total Consumer, Cyclical | | | | | | | 2,551,354 | |
| | | | | | | | | |
Energy - 6.6% |
Exxon Mobil Corp. | | | 3,513 | | | | 385,236 | |
EOG Resources, Inc. | | | 1,762 | | | | 201,978 | |
Valero Energy Corp. | | | 1,422 | | | | 198,511 | |
Pioneer Natural Resources Co. | | | 838 | | | | 171,153 | |
Halliburton Co. | | | 5,243 | | | | 165,889 | |
ConocoPhillips | | | 344 | | | | 34,128 | |
Total Energy | | | | | | | 1,156,895 | |
| | | | | | | | | |
Industrial - 6.3% |
Caterpillar, Inc. | | | 981 | | | | 224,492 | |
Deere & Co. | | | 524 | | | | 216,349 | |
Eaton Corporation plc | | | 1,166 | | | | 199,782 | |
Agilent Technologies, Inc. | | | 1,366 | | | | 188,973 | |
Regal Rexnord Corp. | | | 1,132 | | | | 159,306 | |
Republic Services, Inc. — Class A | | | 478 | | | | 64,635 | |
Emerson Electric Co. | | | 542 | | | | 47,230 | |
Illinois Tool Works, Inc. | | | 26 | | | | 6,330 | |
Total Industrial | | | | | | | 1,107,097 | |
| | | | | | | | | |
Utilities - 5.2% |
NextEra Energy, Inc. | | | 2,874 | | | | 221,528 | |
Exelon Corp. | | | 4,610 | | | | 193,113 | |
Evergy, Inc. | | | 2,821 | | | | 172,420 | |
DTE Energy Co. | | | 1,173 | | | | 128,490 | |
National Fuel Gas Co. | | | 1,380 | | | | 79,681 | |
Vistra Corp. | | | 2,743 | | | | 65,832 | |
FirstEnergy Corp. | | | 1,310 | | | | 52,479 | |
Total Utilities | | | | | | | 913,543 | |
| | | | | | | | | |
18 | THE GUGGENHEIM FUNDS SEMI-ANNUAL REPORT | SEE NOTES TO FINANCIAL STATEMENTS. |
SCHEDULE OF INVESTMENTS (Unaudited)(concluded) | March 31, 2023 |
RBP® DIVIDEND FUND | |
| | Shares | | | Value | |
Communications - 4.5% |
AT&T, Inc. | | | 12,426 | | | $ | 239,200 | |
Comcast Corp. — Class A | | | 6,247 | | | | 236,824 | |
Fox Corp. — Class A | | | 4,751 | | | | 161,771 | |
Interpublic Group of Companies, Inc. | | | 3,870 | | | | 144,119 | |
Fox Corp. — Class B | | | 228 | | | | 7,139 | |
Total Communications | | | | | | | 789,053 | |
| | | | | | | | | |
Basic Materials - 2.2% |
Mosaic Co. | | | 3,546 | | | | 162,691 | |
CF Industries Holdings, Inc. | | | 2,211 | | | | 160,275 | |
Air Products and Chemicals, Inc. | | | 240 | | | | 68,930 | |
Total Basic Materials | | | | | | | 391,896 | |
| | | | | | | | | |
Total Common Stocks | | | | |
(Cost $17,249,741) | | | | | | | 17,342,529 | |
| | | | | | | | | |
EXCHANGE-TRADED FUNDS† - 0.4% |
iShares Select Dividend ETF | | | 357 | | | | 41,833 | |
Vanguard Dividend Appreciation ETF | | | 177 | | | | 27,260 | |
Total Exchange-Traded Funds | | | | |
(Cost $68,948) | | | | | | | 69,093 | |
| | | | | | | | | |
Total Investments - 99.5% | | | | |
(Cost $17,318,689) | | $ | 17,411,622 | |
Other Assets & Liabilities, net - 0.5% | | | 86,768 | |
Total Net Assets - 100.0% | | $ | 17,498,390 | |
† | Value determined based on Level 1 inputs — See Note 4. |
| | plc — Public Limited Company |
| | REIT — Real Estate Investment Trust |
| | |
| | See Sector Classification in Other Information section. |
The following table summarizes the inputs used to value the Fund’s investments at March 31, 2023 (See Note 4 in the Notes to Financial Statements):
Investments in Securities (Assets) | | Level 1
Quoted
Prices | | | Level 2
Significant
Observable
Inputs | | | Level 3
Significant
Unobservable
Inputs | | | Total | |
Common Stocks | | $ | 17,342,529 | | | $ | — | | | $ | — | | | $ | 17,342,529 | |
Exchange-Traded Funds | | | 69,093 | | | | — | | | | — | | | | 69,093 | |
Total Assets | | $ | 17,411,622 | | | $ | — | | | $ | — | | | $ | 17,411,622 | |
SEE NOTES TO FINANCIAL STATEMENTS. | THE GUGGENHEIM FUNDS SEMI-ANNUAL REPORT | 19 |
STATEMENT OF ASSETS AND LIABILITIES (Unaudited) |
March 31, 2023 |
Assets: |
Investments, at value (cost $17,318,689) | | $ | 17,411,622 | |
Cash | | | 51,627 | |
Prepaid expenses | | | 49,343 | |
Receivables: |
Securities sold | | | 87,157 | |
Dividends | | | 22,439 | |
Investment Adviser | | | 3,746 | |
Total assets | | | 17,625,934 | |
| | | | | |
Liabilities: |
Payable for: |
Fund shares redeemed | | | 96,321 | |
Professional fees | | | 13,686 | |
Fund accounting/administration fees | | | 4,330 | |
Transfer agent/maintenance fees | | | 2,868 | |
Distribution and service fees | | | 2,648 | |
Trustees’ fees* | | | 2,236 | |
Distributions to shareholders | | | 280 | |
Miscellaneous | | | 5,175 | |
Total liabilities | | | 127,544 | |
Net assets | | $ | 17,498,390 | |
| | | | | |
Net assets consist of: |
Paid in capital | | $ | 18,170,528 | |
Total distributable earnings (loss) | | | (672,138 | ) |
Net assets | | $ | 17,498,390 | |
| | | | | |
A-Class: |
Net assets | | $ | 9,106,194 | |
Capital shares outstanding | | | 744,888 | |
Net asset value per share | | $ | 12.22 | |
Maximum offering price per share (Net asset value divided by 95.25%) | | $ | 12.83 | |
| | | | | |
C-Class: |
Net assets | | $ | 733,985 | |
Capital shares outstanding | | | 59,237 | |
Net asset value per share | | $ | 12.39 | |
| | | | | |
P-Class: |
Net assets | | $ | 693,956 | |
Capital shares outstanding | | | 56,071 | |
Net asset value per share | | $ | 12.38 | |
| | | | | |
Institutional Class: |
Net assets | | $ | 6,964,255 | |
Capital shares outstanding | | | 591,384 | |
Net asset value per share | | $ | 11.78 | |
STATEMENT OF OPERATIONS (Unaudited) |
Six Months Ended March 31, 2023 |
Investment Income: |
Dividends | | $ | 229,843 | |
Total investment income | | | 229,843 | |
| | | | | |
Expenses: |
Management fees | | | 66,290 | |
Distribution and service fees: |
A-Class | | | 13,491 | |
C-Class | | | 4,267 | |
P-Class | | | 941 | |
Transfer agent/maintenance fees: |
A-Class | | | 6,289 | |
C-Class | | | 941 | |
P-Class | | | 1,364 | |
Institutional Class | | | 6,000 | |
Registration fees | | | 32,269 | |
Professional fees | | | 24,094 | |
Fund accounting/administration fees | | | 8,246 | |
Trustees’ fees* | | | 6,485 | |
Custodian fees | | | 2,942 | |
Line of credit fees | | | 346 | |
Miscellaneous | | | 6,191 | |
Total expenses | | | 180,156 | |
Less: |
Expenses reimbursed by Adviser: |
A-Class | | | (10,418 | ) |
C-Class | | | (1,119 | ) |
P-Class | | | (1,530 | ) |
Institutional Class | | | (7,482 | ) |
Expenses waived by Adviser | | | (61,583 | ) |
Total waived/reimbursed expenses | | | (82,132 | ) |
Net expenses | | | 98,024 | |
Net investment income | | | 131,819 | |
| | | | | |
Net Realized and Unrealized Gain (Loss): |
Net realized gain (loss) on: |
Investments | | | (457,705 | ) |
Net realized loss | | | (457,705 | ) |
Net change in unrealized appreciation (depreciation) on: |
Investments | | | 2,764,527 | |
Net change in unrealized appreciation (depreciation) | | | 2,764,527 | |
Net realized and unrealized gain | | | 2,306,822 | |
Net increase in net assets resulting from operations | | $ | 2,438,641 | |
* | Relates to Trustees not deemed “interested persons” within the meaning of Section 2(a)(19) of the 1940 Act. |
20 | THE GUGGENHEIM FUNDS SEMI-ANNUAL REPORT | SEE NOTES TO FINANCIAL STATEMENTS. |
STATEMENTS OF CHANGES IN NET ASSETS |
| | Six Months Ended
March 31, 2023
(Unaudited) | | | Year Ended
September 30,
2022 | |
Increase (Decrease) in Net Assets from Operations: | | | | | | | | |
Net investment income | | $ | 131,819 | | | $ | 216,302 | |
Net realized loss on investments | | | (457,705 | ) | | | (201,687 | ) |
Net change in unrealized appreciation (depreciation) on investments | | | 2,764,527 | | | | (3,021,832 | ) |
Net increase (decrease) in net assets resulting from operations | | | 2,438,641 | | | | (3,007,217 | ) |
| | | | | | | | | |
Distributions to shareholders: | | | | | | | | |
A-Class | | | (54,968 | ) | | | (1,834,203 | ) |
C-Class | | | (1,949 | ) | | | (264,222 | ) |
P-Class | | | (4,576 | ) | | | (225,153 | ) |
Institutional Class | | | (51,666 | ) | | | (1,722,168 | ) |
Return of Capital: | | | | | | | | |
A-Class | | | — | | | | (32,948 | ) |
C-Class | | | — | | | | (4,746 | ) |
P-Class | | | — | | | | (4,044 | ) |
Institutional Class | | | — | | | | (30,936 | ) |
Total distributions to shareholders | | | (113,159 | ) | | | (4,118,420 | ) |
| | | | | | | | | |
Capital share transactions: | | | | | | | | |
Proceeds from sale of shares | | | | | | | | |
A-Class | | | 624,941 | | | | 1,412,013 | |
C-Class | | | 17,245 | | | | 291,601 | |
P-Class | | | 3,179 | | | | 119,455 | |
Institutional Class | | | 137,355 | | | | 1,036,840 | |
Distributions reinvested | | | | | | | | |
A-Class | | | 54,621 | | | | 1,856,196 | |
C-Class | | | 1,893 | | | | 267,192 | |
P-Class | | | 4,562 | | | | 228,813 | |
Institutional Class | | | 51,531 | | | | 1,748,080 | |
Cost of shares redeemed | | | | | | | | |
A-Class | | | (835,902 | ) | | | (2,998,436 | ) |
C-Class | | | (239,761 | ) | | | (1,659,939 | ) |
P-Class | | | (203,769 | ) | | | (752,512 | ) |
Institutional Class | | | (778,601 | ) | | | (3,271,612 | ) |
Net increase (decrease) from capital share transactions | | | (1,162,706 | ) | | | (1,722,309 | ) |
Net increase (decrease) in net assets | | | 1,162,776 | | | | (8,847,946 | ) |
| | | | | | | | | |
Net assets: | | | | | | | | |
Beginning of period | | | 16,335,614 | | | | 25,183,560 | |
End of period | | $ | 17,498,390 | | | $ | 16,335,614 | |
SEE NOTES TO FINANCIAL STATEMENTS. | THE GUGGENHEIM FUNDS SEMI-ANNUAL REPORT | 21 |
STATEMENTS OF CHANGES IN NET ASSETS (concluded) |
| | Six Months Ended
March 31, 2023
(Unaudited) | | | Year Ended
September 30,
2022 | |
Capital share activity: | | | | | | | | |
Shares sold | | | | | | | | |
A-Class | | | 51,639 | | | | 100,195 | |
C-Class | | | 1,400 | | | | 22,625 | |
P-Class | | | 263 | | | | 8,869 | |
Institutional Class | | | 12,225 | | | | 76,424 | |
Shares issued from reinvestment of distributions | | | | | | | | |
A-Class | | | 4,522 | | | | 134,150 | |
C-Class | | | 155 | | | | 18,923 | |
P-Class | | | 373 | | | | 16,280 | |
Institutional Class | | | 4,427 | | | | 131,210 | |
Shares redeemed | | | | | | | | |
A-Class | | | (69,524 | ) | | | (248,948 | ) |
C-Class | | | (19,352 | ) | | | (119,032 | ) |
P-Class | | | (17,010 | ) | | | (56,280 | ) |
Institutional Class | | | (67,690 | ) | | | (279,603 | ) |
Net decrease in shares | | | (98,572 | ) | | | (195,187 | ) |
22 | THE GUGGENHEIM FUNDS SEMI-ANNUAL REPORT | SEE NOTES TO FINANCIAL STATEMENTS. |
This table is presented to show selected data for a share outstanding throughout each period and to assist shareholders in evaluating a Fund’s performance for the periods presented.
A-Class | | Six Months Ended
March 31, 2023a | | | Year Ended
September 30,
2022 | | | Year Ended
September 30,
2021 | | | Year Ended
September 30,
2020 | | | Year Ended
September 30,
2019 | | | Year Ended
September 30,
2018 | |
Per Share Data |
Net asset value, beginning of period | | $ | 10.69 | | | $ | 14.59 | | | $ | 10.76 | | | $ | 12.00 | | | $ | 12.55 | | | $ | 12.82 | |
Income (loss) from investment operations: |
Net investment income (loss)b | | | .09 | | | | .11 | | | | .27 | | | | .30 | | | | .29 | | | | .23 | |
Net gain (loss) on investments (realized and unrealized) | | | 1.51 | | | | (1.65 | ) | | | 3.99 | | | | (.91 | ) | | | .05 | | | | 1.37 | |
Total from investment operations | | | 1.60 | | | | (1.54 | ) | | | 4.26 | | | | (.61 | ) | | | .34 | | | | 1.60 | |
Less distributions from: |
Net investment income | | | (.07 | ) | | | (.09 | ) | | | (.43 | ) | | | (.31 | ) | | | (.32 | ) | | | (.34 | ) |
Net realized gains | | | — | | | | (2.23 | ) | | | — | | | | (.21 | ) | | | (.57 | ) | | | (1.53 | ) |
Return of capital | | | — | | | | (.04 | ) | | | — | | | | (.11 | ) | | | — | | | | — | |
Total distributions | | | (.07 | ) | | | (2.36 | ) | | | (.43 | ) | | | (.63 | ) | | | (.89 | ) | | | (1.87 | ) |
Net asset value, end of period | | $ | 12.22 | | | $ | 10.69 | | | $ | 14.59 | | | $ | 10.76 | | | $ | 12.00 | | | $ | 12.55 | |
|
Total Returnc | | | 15.00 | % | | | (14.13 | %) | | | 39.75 | % | | | (5.16 | %) | | | 3.41 | % | | | 13.40 | % |
Ratios/Supplemental Data |
Net assets, end of period (in thousands) | | $ | 9,106 | | | $ | 8,103 | | | $ | 11,274 | | | $ | 5,357 | | | $ | 5,860 | | | $ | 5,775 | |
Ratios to average net assets: |
Net investment income (loss) | | | 1.43 | % | | | 0.85 | % | | | 1.89 | % | | | 2.73 | % | | | 2.49 | % | | | 1.84 | % |
Total expensesd | | | 2.10 | % | | | 1.92 | % | | | 1.91 | % | | | 2.04 | % | | | 1.95 | % | | | 2.08 | % |
Net expensese,f,g | | | 1.17 | % | | | 1.20 | % | | | 1.20 | % | | | 1.21 | % | | | 1.22 | % | | | 1.21 | % |
Portfolio turnover rate | | | 35 | % | | | 70 | % | | | 157 | % | | | 114 | % | | | 110 | % | | | 97 | % |
C-Class | | Six Months Ended
March 31, 2023a | | | Year Ended
September 30,
2022 | | | Year Ended
September 30,
2021 | | | Year Ended
September 30,
2020 | | | Year Ended
September 30,
2019 | | | Year Ended
September 30,
2018 | |
Per Share Data |
Net asset value, beginning of period | | $ | 10.83 | | | $ | 14.76 | | | $ | 10.86 | | | $ | 12.06 | | | $ | 12.53 | | | $ | 12.74 | |
Income (loss) from investment operations: |
Net investment income (loss)b | | | .04 | | | | — | | | | .20 | | | | .22 | | | | .20 | | | | .14 | |
Net gain (loss) on investments (realized and unrealized) | | | 1.55 | | | | (1.66 | ) | | | 3.99 | | | | (.92 | ) | | | .07 | | | | 1.35 | |
Total from investment operations | | | 1.59 | | | | (1.66 | ) | | | 4.19 | | | | (.70 | ) | | | .27 | | | | 1.49 | |
Less distributions from: |
Net investment income | | | (.03 | ) | | | — | i | | | (.29 | ) | | | (.18 | ) | | | (.17 | ) | | | (.17 | ) |
Net realized gains | | | — | | | | (2.23 | ) | | | — | | | | (.21 | ) | | | (.57 | ) | | | (1.53 | ) |
Return of capital | | | — | | | | (.04 | ) | | | — | | | | (.11 | ) | | | — | | | | — | |
Total distributions | | | (.03 | ) | | | (2.27 | ) | | | (.29 | ) | | | (.50 | ) | | | (.74 | ) | | | (1.70 | ) |
Net asset value, end of period | | $ | 12.39 | | | $ | 10.83 | | | $ | 14.76 | | | $ | 10.86 | | | $ | 12.06 | | | $ | 12.53 | |
|
Total Returnc | | | 14.68 | % | | | (14.78 | %) | | | 38.60 | % | | | (5.84 | %) | | | 2.66 | % | | | 12.49 | % |
Ratios/Supplemental Data |
Net assets, end of period (in thousands) | | $ | 734 | | | $ | 834 | | | $ | 2,281 | | | $ | 3,651 | | | $ | 5,223 | | | $ | 5,976 | |
Ratios to average net assets: |
Net investment income (loss) | | | 0.67 | % | | | 0.02 | % | | | 1.42 | % | | | 1.92 | % | | | 1.75 | % | | | 1.10 | % |
Total expensesd | | | 2.88 | % | | | 2.67 | % | | | 2.70 | % | | | 2.80 | % | | | 2.64 | % | | | 2.77 | % |
Net expensese,f,g | | | 1.92 | % | | | 1.95 | % | | | 1.95 | % | | | 1.96 | % | | | 1.97 | % | | | 1.96 | % |
Portfolio turnover rate | | | 35 | % | | | 70 | % | | | 157 | % | | | 114 | % | | | 110 | % | | | 97 | % |
SEE NOTES TO FINANCIAL STATEMENTS. | THE GUGGENHEIM FUNDS SEMI-ANNUAL REPORT | 23 |
FINANCIAL HIGHLIGHTS (continued) |
This table is presented to show selected data for a share outstanding throughout each period and to assist shareholders in evaluating a Fund’s performance for the periods presented.
P-Class | | Six Months Ended
March 31, 2023a | | | Year Ended
September 30,
2022 | | | Year Ended
September 30,
2021 | | | Year Ended
September 30,
2020 | | | Year Ended
September 30,
2019 | | | Year Ended
September 30,
2018 | |
Per Share Data |
Net asset value, beginning of period | | $ | 10.82 | | | $ | 14.74 | | | $ | 10.84 | | | $ | 12.13 | | | $ | 12.67 | | | $ | 12.88 | |
Income (loss) from investment operations: |
Net investment income (loss)b | | | .09 | | | | .11 | | | | .27 | | | | .30 | | | | .29 | | | | .23 | |
Net gain (loss) on investments (realized and unrealized) | | | 1.55 | | | | (1.68 | ) | | | 4.02 | | | | (.92 | ) | | | .06 | | | | 1.37 | |
Total from investment operations | | | 1.64 | | | | (1.57 | ) | | | 4.29 | | | | (.62 | ) | | | .35 | | | | 1.60 | |
Less distributions from: |
Net investment income | | | (.08 | ) | | | (.08 | ) | | | (.39 | ) | | | (.35 | ) | | | (.32 | ) | | | (.28 | ) |
Net realized gains | | | — | | | | (2.23 | ) | | | — | | | | (.21 | ) | | | (.57 | ) | | | (1.53 | ) |
Return of capital | | | — | | | | (.04 | ) | | | — | | | | (.11 | ) | | | — | | | | — | |
Total distributions | | | (.08 | ) | | | (2.35 | ) | | | (.39 | ) | | | (.67 | ) | | | (.89 | ) | | | (1.81 | ) |
Net asset value, end of period | | $ | 12.38 | | | $ | 10.82 | | | $ | 14.74 | | | $ | 10.84 | | | $ | 12.13 | | | $ | 12.67 | |
|
Total Return | | | 15.17 | % | | | (14.18 | %) | | | 39.72 | % | | | (5.13 | %) | | | 3.43 | % | | | 13.35 | % |
Ratios/Supplemental Data |
Net assets, end of period (in thousands) | | $ | 694 | | | $ | 784 | | | $ | 1,527 | | | $ | 1,093 | | | $ | 1,444 | | | $ | 1,829 | |
Ratios to average net assets: |
Net investment income (loss) | | | 1.41 | % | | | 0.80 | % | | | 1.87 | % | | | 2.60 | % | | | 2.50 | % | | | 1.84 | % |
Total expensesd | | | 2.28 | % | | | 1.98 | % | | | 1.93 | % | | | 2.06 | % | | | 2.06 | % | | | 2.04 | % |
Net expensese,f,g | | | 1.17 | % | | | 1.20 | % | | | 1.20 | % | | | 1.21 | % | | | 1.22 | % | | | 1.21 | % |
Portfolio turnover rate | | | 35 | % | | | 70 | % | | | 157 | % | | | 114 | % | | | 110 | % | | | 97 | % |
24 | THE GUGGENHEIM FUNDS SEMI-ANNUAL REPORT | SEE NOTES TO FINANCIAL STATEMENTS. |
FINANCIAL HIGHLIGHTS (concluded) |
This table is presented to show selected data for a share outstanding throughout each period and to assist shareholders in evaluating a Fund’s performance for the periods presented.
Institutional Class | | Six Months Ended
March 31, 2023a | | | Year Ended
September 30,
2022 | | | Year Ended
September 30,
2021 | | | Year Ended
September 30,
2020 | | | Year Ended
September 30,
2019 | | | Year Ended
September 30,
2018 | |
Per Share Data |
Net asset value, beginning of period | | $ | 10.29 | | | $ | 14.14 | | | $ | 10.46 | | | $ | 11.70 | | | $ | 12.28 | | | $ | 12.59 | |
Income (loss) from investment operations: |
Net investment income (loss)b | | | .10 | | | | .14 | | | | .30 | | | | .32 | | | | .31 | | | | .25 | |
Net gain (loss) on investments (realized and unrealized) | | | 1.48 | | | | (1.59 | ) | | | 3.86 | | | | (.88 | ) | | | .05 | | | | 1.35 | |
Total from investment operations | | | 1.58 | | | | (1.45 | ) | | | 4.16 | | | | (.56 | ) | | | .36 | | | | 1.60 | |
Less distributions from: |
Net investment income | | | (.09 | ) | | | (.13 | ) | | | (.48 | ) | | | (.36 | ) | | | (.37 | ) | | | (.38 | ) |
Net realized gains | | | — | | | | (2.23 | ) | | | — | | | | (.21 | ) | | | (.57 | ) | | | (1.53 | ) |
Return of capital | | | — | | | | (.04 | ) | | | — | | | | (.11 | ) | | | — | | | | — | |
Total distributions | | | (.09 | ) | | | (2.40 | ) | | | (.48 | ) | | | (.68 | ) | | | (.94 | ) | | | (1.91 | ) |
Net asset value, end of period | | $ | 11.78 | | | $ | 10.29 | | | $ | 14.14 | | | $ | 10.46 | | | $ | 11.70 | | | $ | 12.28 | |
|
Total Return | | | 15.32 | % | | | (13.97 | %) | | | 40.06 | % | | | (4.88 | %) | | | 3.66 | % | | | 13.71 | % |
Ratios/Supplemental Data |
Net assets, end of period (in thousands) | | $ | 6,964 | | | $ | 6,614 | | | $ | 10,101 | | | $ | 6,882 | | | $ | 8,979 | | | $ | 5,203 | |
Ratios to average net assets: |
Net investment income (loss) | | | 1.68 | % | | | 1.08 | % | | | 2.22 | % | | | 2.94 | % | | | 2.76 | % | | | 2.08 | % |
Total expensesd | | | 1.83 | % | | | 1.62 | % | | | 1.62 | % | | | 1.80 | % | | | 1.62 | % | | | 1.78 | % |
Net expensese,f,g | | | 0.92 | % | | | 0.95 | % | | | 0.95 | % | | | 0.96 | % | | | 0.97 | % | | | 0.96 | % |
Portfolio turnover rate | | | 35 | % | | | 70 | % | | | 157 | % | | | 114 | % | | | 110 | % | | | 97 | % |
a | Unaudited figures for the period ended March 31, 2023. Percentage amounts for the period, except total return and portfolio turnover rate, have been annualized. |
b | Net investment income (loss) per share was computed using average shares outstanding throughout the period. |
c | Total return does not reflect the impact of any applicable sales charges. |
d | Does not include expenses of the underlying funds in which the Fund invests. |
e | Net expense information reflects the expense ratios after expense waivers and reimbursements, as applicable. |
f | The portion of the ratios of net expenses to average net assets attributable to recoupments of prior fee reductions or expense reimbursements for the years presented was as follows: |
| 03/31/23a | 09/30/22 | 09/30/21 | 09/30/20 | 09/30/19 | 09/30/18 |
A-Class | — | — | — | 0.00%h | — | — |
C-Class | — | — | — | 0.00%h | — | — |
P-Class | — | — | — | — | — | — |
Institutional Class | — | — | — | — | — | — |
g | Net expenses may include expenses that are excluded from the expense limitation agreement. Excluding these expenses, the net expense ratios for the years presented would be: |
| 03/31/23a | 09/30/22 | 09/30/21 | 09/30/20 | 09/30/19 | 09/30/18 |
A-Class | 1.17% | 1.19% | 1.20% | 1.20% | 1.21% | 1.20% |
C-Class | 1.92% | 1.95% | 1.95% | 1.96% | 1.96% | 1.95% |
P-Class | 1.17% | 1.20% | 1.20% | 1.21% | 1.21% | 1.20% |
Institutional Class | 0.92% | 0.94% | 0.95% | 0.95% | 0.96% | 0.95% |
i | Less than $0.01 per share. |
SEE NOTES TO FINANCIAL STATEMENTS. | THE GUGGENHEIM FUNDS SEMI-ANNUAL REPORT | 25 |
PERFORMANCE REPORT AND FUND PROFILE (Unaudited) | March 31, 2023 |
RBP® LARGE-CAP DEFENSIVE FUND
OBJECTIVE: Seeks to provide investment results that, before fees and expenses, correspond generally to the total return performance of the Guggenheim RBP® Large-Cap Defensive IndexSM (the “Defensive Index” or “Index”).
Holdings Diversification (Market Exposure as % of Net Assets)
“Holdings Diversification (Market Exposure as % of Net Assets)” excludes any temporary cash investments.
Inception Dates: |
A-Class | April 27, 2010 |
C-Class | April 18, 2011 |
P-Class | April 27, 2010 |
Institutional Class | February 15, 2011 |
Ten Largest Holdings | (% of Total
Net Assets) |
Apple, Inc. | 8.0% |
Microsoft Corp. | 7.2% |
Alphabet, Inc. — Class C | 4.6% |
Tesla, Inc. | 3.1% |
Exxon Mobil Corp. | 2.6% |
Visa, Inc. — Class A | 2.4% |
Procter & Gamble Co. | 2.4% |
Mastercard, Inc. — Class A | 2.2% |
Home Depot, Inc. | 2.1% |
Merck & Company, Inc. | 2.1% |
Top Ten Total | 36.7% |
| | |
“Ten Largest Holdings” excludes any temporary cash investments. |
26 | THE GUGGENHEIM FUNDS SEMI-ANNUAL REPORT | |
PERFORMANCE REPORT AND FUND PROFILE (Unaudited)(concluded) | March 31, 2023 |
Average Annual Returns*
Periods Ended March 31, 2023
| 6 Month† | 1 Year | 5 Year | 10 Year |
A-Class Shares | 13.84% | (10.03%) | 5.79% | 8.30% |
A-Class Shares with sales charge‡ | 8.42% | (14.29%) | 4.76% | 7.66% |
C-Class Shares | 13.48% | (10.71%) | 5.01% | 7.54% |
C-Class Shares with CDSC§ | 12.48% | (11.61%) | 5.01% | 7.54% |
P-Class Shares** | 13.87% | (9.99%) | 5.79% | 8.36% |
Institutional Class Shares | 13.95% | (9.82%) | 6.07% | 8.63% |
Guggenheim RBP Large-Cap Defensive IndexSM | 14.56% | (9.04%) | 7.06% | 9.77% |
Dow Jones U.S. Large-Cap Total Stock Market Index | 15.29% | (8.56%) | 10.91% | 12.05% |
* | The performance data above represents past performance that is not predictive of future results. The investment return and principal value of an investment in the Fund will fluctuate so that an investor’s shares, when redeemed, may be worth more or less than their original cost. Returns are historical and include changes in principal and reinvested dividends and capital gains and do not reflect the effect of taxes. The Guggenheim RBP Large-Cap Defensive IndexSM and the Dow Jones U.S Large-Cap Total Stock Market Index are unmanaged indices and, unlike the Fund, have no management fees or operating expenses to reduce their reported return. |
** | F-1 Class shares redesignated as P-Class shares effective May 9, 2016. |
† | 6 month returns are not annualized. |
‡ | Effective May 9, 2016, the maximum sales charge decreased from 5.75% to 4.75%. A 5.75% maximum sales charge is used in the calculation of the Average Annual Return since inception based on subscriptions made prior to May 9, 2016, and a 4.75% maximum sales charge will be used to calculate performance for periods based on subscriptions made on or after May 9, 2016. |
§ | Fund returns include a CDSC of 1% if redeemed within 12 months of purchase. |
| | THE GUGGENHEIM FUNDS SEMI-ANNUAL REPORT | 27 |
SCHEDULE OF INVESTMENTS (Unaudited) | March 31, 2023 |
RBP® LARGE-CAP DEFENSIVE FUND | |
| | Shares | | | Value | |
COMMON STOCKS† - 98.3% |
| | | | | | | | | |
Consumer, Non-cyclical - 23.9% |
Procter & Gamble Co. | | | 1,222 | | | $ | 181,699 | |
Merck & Company, Inc. | | | 1,487 | | | | 158,202 | |
Bristol-Myers Squibb Co. | | | 2,028 | | | | 140,561 | |
Abbott Laboratories | | | 1,372 | | | | 138,929 | |
Mondelez International, Inc. — Class A | | | 1,927 | | | | 134,350 | |
Vertex Pharmaceuticals, Inc.* | | | 406 | | | | 127,918 | |
Hershey Co. | | | 471 | | | | 119,827 | |
McKesson Corp. | | | 326 | | | | 116,072 | |
AmerisourceBergen Corp. — Class A | | | 700 | | | | 112,077 | |
US Foods Holding Corp.* | | | 2,942 | | | | 108,678 | |
Constellation Brands, Inc. — Class A | | | 479 | | | | 108,201 | |
Incyte Corp.* | | | 1,496 | | | | 108,116 | |
Becton Dickinson and Co. | | | 417 | | | | 103,224 | |
Dexcom, Inc.* | | | 785 | | | | 91,201 | |
Waters Corp.* | | | 165 | | | | 51,089 | |
Regeneron Pharmaceuticals, Inc.* | | | 30 | | | | 24,650 | |
Monster Beverage Corp.* | | | 102 | | | | 5,509 | |
PepsiCo, Inc. | | | 28 | | | | 5,105 | |
Total Consumer, Non-cyclical | | | | | | | 1,835,408 | |
| | | | | | | | | |
Technology - 18.6% |
Apple, Inc. | | | 3,710 | | | | 611,779 | |
Microsoft Corp. | | | 1,926 | | | | 555,266 | |
Electronic Arts, Inc. | | | 868 | | | | 104,550 | |
Accenture plc — Class A | | | 221 | | | | 63,164 | |
Adobe, Inc.* | | | 116 | | | | 44,703 | |
Salesforce, Inc.* | | | 179 | | | | 35,761 | |
NVIDIA Corp. | | | 39 | | | | 10,833 | |
Total Technology | | | | | | | 1,426,056 | |
| | | | | | | | | |
Financial - 17.1% |
Visa, Inc. — Class A | | | 814 | | | | 183,524 | |
Mastercard, Inc. — Class A | | | 473 | | | | 171,893 | |
Prologis, Inc. REIT | | | 1,084 | | | | 135,251 | |
Progressive Corp. | | | 865 | | | | 123,747 | |
Cboe Global Markets, Inc. | | | 894 | | | | 120,011 | |
Chubb Ltd. | | | 593 | | | | 115,149 | |
Rexford Industrial Realty, Inc. REIT | | | 1,900 | | | | 113,335 | |
Arch Capital Group Ltd.* | | | 1,651 | | | | 112,053 | |
Travelers Companies, Inc. | | | 642 | | | | 110,045 | |
Everest Re Group Ltd. | | | 302 | | | | 108,122 | |
AGNC Investment Corp. REIT | | | 1,153 | | | | 11,622 | |
Berkshire Hathaway, Inc. — Class B* | | | 17 | | | | 5,249 | |
Total Financial | | | | | | | 1,310,001 | |
| | | | | | | | | |
Communications - 13.6% |
Alphabet, Inc. — Class C* | | | 3,400 | | | | 353,600 | |
Walt Disney Co.* | | | 1,491 | | | | 149,294 | |
AT&T, Inc. | | | 7,254 | | | | 139,639 | |
Arista Networks, Inc.* | | | 767 | | | | 128,749 | |
FactSet Research Systems, Inc. | | | 253 | | | | 105,018 | |
Liberty Media Corporation-Liberty Formula One — Class C* | | | 1,382 | | | | 103,415 | |
Amazon.com, Inc.* | | | 604 | | | | 62,387 | |
Total Communications | | | | | | | 1,042,102 | |
| | | | | | | | | |
Consumer, Cyclical - 11.2% |
Tesla, Inc.* | | | 1,149 | | | | 238,372 | |
Home Depot, Inc. | | | 556 | | | | 164,087 | |
Walmart, Inc. | | | 1,052 | | | | 155,117 | |
TJX Companies, Inc. | | | 1,647 | | | | 129,059 | |
Lululemon Athletica, Inc.* | | | 351 | | | | 127,831 | |
Costco Wholesale Corp. | | | 96 | | | | 47,699 | |
Total Consumer, Cyclical | | | | | | | 862,165 | |
| | | | | | | | | |
Utilities - 7.4% |
NextEra Energy, Inc. | | | 1,680 | | | | 129,494 | |
American Electric Power Company, Inc. | | | 1,304 | | | | 118,651 | |
Evergy, Inc. | | | 1,842 | | | | 112,583 | |
Duke Energy Corp. | | | 1,161 | | | | 112,002 | |
Vistra Corp. | | | 3,878 | | | | 93,072 | |
Exelon Corp. | | | 126 | | | | 5,278 | |
Total Utilities | | | | | | | 571,080 | |
| | | | | | | | | |
Industrial - 3.9% |
Illinois Tool Works, Inc. | | | 512 | | | | 124,647 | |
Northrop Grumman Corp. | | | 238 | | | | 109,889 | |
Snap-on, Inc. | | | 272 | | | | 67,154 | |
Total Industrial | | | | | | | 301,690 | |
| | | | | | | | | |
Energy - 2.6% |
Exxon Mobil Corp. | | | 1,806 | | | | 198,046 | |
| | | | | | | | | |
Total Common Stocks | | | | |
(Cost $7,314,259) | | | | | | | 7,546,548 | |
| | | | | | | | | |
EXCHANGE-TRADED FUNDS† - 1.0% |
Vanguard S&P 500 ETF | | | 99 | | | | 37,231 | |
SPDR S&P 500 ETF Trust | | | 90 | | | | 36,845 | |
Total Exchange-Traded Funds | | | | |
(Cost $70,420) | | | | | | | 74,076 | |
| | | | | | | | | |
Total Investments - 99.3% | | | | |
(Cost $7,384,679) | | $ | 7,620,624 | |
Other Assets & Liabilities, net - 0.7% | | | 55,822 | |
Total Net Assets - 100.0% | | $ | 7,676,446 | |
* | Non-income producing security. |
† | Value determined based on Level 1 inputs — See Note 4. |
| | plc — Public Limited Company |
| | REIT — Real Estate Investment Trust |
| | |
| | See Sector Classification in Other Information section. |
28 | THE GUGGENHEIM FUNDS SEMI-ANNUAL REPORT | SEE NOTES TO FINANCIAL STATEMENTS. |
SCHEDULE OF INVESTMENTS (Unaudited)(concluded) | March 31, 2023 |
RBP® LARGE-CAP DEFENSIVE FUND | |
The following table summarizes the inputs used to value the Fund’s investments at March 31, 2023 (See Note 4 in the Notes to Financial Statements):
Investments in Securities (Assets) | | Level 1
Quoted
Prices | | | Level 2
Significant
Observable
Inputs | | | Level 3
Significant
Unobservable
Inputs | | | Total | |
Common Stocks | | $ | 7,546,548 | | | $ | — | | | $ | — | | | $ | 7,546,548 | |
Exchange-Traded Funds | | | 74,076 | | | | — | | | | — | | | | 74,076 | |
Total Assets | | $ | 7,620,624 | | | $ | — | | | $ | — | | | $ | 7,620,624 | |
SEE NOTES TO FINANCIAL STATEMENTS. | THE GUGGENHEIM FUNDS SEMI-ANNUAL REPORT | 29 |
RBP® LARGE-CAP DEFENSIVE FUND | |
STATEMENT OF ASSETS AND LIABILITIES (Unaudited) |
March 31, 2023 |
Assets: |
Investments, at value (cost $7,384,679) | | $ | 7,620,624 | |
Cash | | | 25,354 | |
Prepaid expenses | | | 34,642 | |
Receivables: |
Securities sold | | | 85,108 | |
Investment Adviser | | | 10,266 | |
Dividends | | | 5,146 | |
Fund shares sold | | | 60 | |
Total assets | | | 7,781,200 | |
| | | | | |
Liabilities: |
Payable for: |
Fund shares redeemed | | | 77,751 | |
Professional fees | | | 15,209 | |
Fund accounting/administration fees | | | 4,244 | |
Transfer agent/maintenance fees | | | 2,481 | |
Distribution and service fees | | | 1,245 | |
Trustees’ fees* | | | 861 | |
Miscellaneous | | | 2,963 | |
Total liabilities | | | 104,754 | |
Net assets | | $ | 7,676,446 | |
| | | | | |
Net assets consist of: |
Paid in capital | | $ | 7,975,235 | |
Total distributable earnings (loss) | | | (298,789 | ) |
Net assets | | $ | 7,676,446 | |
| | | | | |
A-Class: |
Net assets | | $ | 2,613,181 | |
Capital shares outstanding | | | 294,536 | |
Net asset value per share | | $ | 8.87 | |
Maximum offering price per share (Net asset value divided by 95.25%) | | $ | 9.31 | |
| | | | | |
C-Class: |
Net assets | | $ | 445,227 | |
Capital shares outstanding | | | 53,941 | |
Net asset value per share | | $ | 8.25 | |
| | | | | |
P-Class: |
Net assets | | $ | 200,824 | |
Capital shares outstanding | | | 21,643 | |
Net asset value per share | | $ | 9.28 | |
| | | | | |
Institutional Class: |
Net assets | | $ | 4,417,214 | |
Capital shares outstanding | | | 469,409 | |
Net asset value per share | | $ | 9.41 | |
STATEMENT OF OPERATIONS (Unaudited) |
Six Months Ended March 31, 2023 |
Investment Income: |
Dividends | | $ | 54,910 | |
Total investment income | | | 54,910 | |
| | | | | |
Expenses: |
Management fees | | | 29,765 | |
Distribution and service fees: |
A-Class | | | 4,181 | |
C-Class | | | 2,868 | |
P-Class | | | 366 | |
Transfer agent/maintenance fees: |
A-Class | | | 4,508 | |
C-Class | | | 973 | |
P-Class | | | 708 | |
Institutional Class | | | 6,601 | |
Registration fees | | | 35,522 | |
Professional fees | | | 20,798 | |
Trustees’ fees* | | | 6,770 | |
Fund accounting/administration fees | | | 6,223 | |
Custodian fees | | | 1,945 | |
Line of credit fees | | | 154 | |
Miscellaneous | | | 5,605 | |
Total expenses | | | 126,987 | |
Less: |
Expenses reimbursed by Adviser: |
A-Class | | | (18,890 | ) |
C-Class | | | (3,770 | ) |
P-Class | | | (2,138 | ) |
Institutional Class | | | (27,572 | ) |
Expenses waived by Adviser | | | (30,995 | ) |
Earnings credit applied | | | (277 | ) |
Total waived/reimbursed expenses | | | (83,642 | ) |
Net expenses | | | 43,345 | |
Net investment income | | | 11,565 | |
| | | | | |
Net Realized and Unrealized Gain (Loss): |
Net realized gain (loss) on: |
Investments | | | (245,070 | ) |
Net realized loss | | | (245,070 | ) |
Net change in unrealized appreciation (depreciation) on: |
Investments | | | 1,312,449 | |
Net change in unrealized appreciation (depreciation) | | | 1,312,449 | |
Net realized and unrealized gain | | | 1,067,379 | |
Net increase in net assets resulting from operations | | $ | 1,078,944 | |
* | Relates to Trustees not deemed “interested persons” within the meaning of Section 2(a)(19) of the 1940 Act. |
30 | THE GUGGENHEIM FUNDS SEMI-ANNUAL REPORT | SEE NOTES TO FINANCIAL STATEMENTS. |
RBP® LARGE-CAP DEFENSIVE FUND | |
STATEMENTS OF CHANGES IN NET ASSETS |
| | Six Months Ended
March 31, 2023
(Unaudited) | | | Year Ended
September 30,
2022 | |
Increase (Decrease) in Net Assets from Operations: | | | | | | | | |
Net investment income | | $ | 11,565 | | | $ | 6,883 | |
Net realized loss on investments | | | (245,070 | ) | | | (296,542 | ) |
Net change in unrealized appreciation (depreciation) on investments | | | 1,312,449 | | | | (1,578,553 | ) |
Net increase (decrease) in net assets resulting from operations | | | 1,078,944 | | | | (1,868,212 | ) |
| | | | | | | | | |
Distributions to shareholders: | | | | | | | | |
A-Class | | | (3,001 | ) | | | (1,151,650 | ) |
C-Class | | | — | | | | (309,390 | ) |
P-Class | | | — | | | | (76,384 | ) |
Institutional Class | | | (6,932 | ) | | | (1,047,012 | ) |
Total distributions to shareholders | | | (9,933 | ) | | | (2,584,436 | ) |
| | | | | | | | | |
Capital share transactions: | | | | | | | | |
Proceeds from sale of shares | | | | | | | | |
A-Class | | | 132,124 | | | | 960,741 | |
C-Class | | | — | | | | 1,200,914 | |
P-Class | | | 13,484 | | | | 24,317 | |
Institutional Class | | | 1,101,063 | | | | 226,621 | |
Distributions reinvested | | | | | | | | |
A-Class | | | 2,830 | | | | 1,091,588 | |
C-Class | | | — | | | | 309,390 | |
P-Class | | | — | | | | 76,384 | |
Institutional Class | | | 6,871 | | | | 1,036,737 | |
Cost of shares redeemed | | | | | | | | |
A-Class | | | (1,367,149 | ) | | | (1,165,677 | ) |
C-Class | | | (736,182 | ) | | | (1,343,554 | ) |
P-Class | | | (135,788 | ) | | | (2,503 | ) |
Institutional Class | | | (884,137 | ) | | | (524,713 | ) |
Net increase (decrease) from capital share transactions | | | (1,866,884 | ) | | | 1,890,245 | |
Net decrease in net assets | | | (797,873 | ) | | | (2,562,403 | ) |
| | | | | | | | | |
Net assets: | | | | | | | | |
Beginning of period | | | 8,474,319 | | | | 11,036,722 | |
End of period | | $ | 7,676,446 | | | $ | 8,474,319 | |
| | | | | | | | | |
Capital share activity: | | | | | | | | |
Shares sold | | | | | | | | |
A-Class | | | 15,984 | | | | 90,759 | |
C-Class | | | — | | | | 134,858 | |
P-Class | | | 1,554 | | | | 2,310 | |
Institutional Class | | | 128,942 | | | | 25,387 | |
Shares issued from reinvestment of distributions | | | | | | | | |
A-Class | | | 327 | | | | 104,159 | |
C-Class | | | — | | | | 31,474 | |
P-Class | | | — | | | | 6,976 | |
Institutional Class | | | 749 | | | | 93,568 | |
Shares redeemed | | | | | | | | |
A-Class | | | (166,689 | ) | | | (119,868 | ) |
C-Class | | | (96,107 | ) | | | (149,215 | ) |
P-Class | | | (14,961 | ) | | | (263 | ) |
Institutional Class | | | (98,906 | ) | | | (48,717 | ) |
Net increase (decrease) in shares | | | (229,107 | ) | | | 171,428 | |
SEE NOTES TO FINANCIAL STATEMENTS. | THE GUGGENHEIM FUNDS SEMI-ANNUAL REPORT | 31 |
RBP® LARGE-CAP DEFENSIVE FUND | |
This table is presented to show selected data for a share outstanding throughout each period and to assist shareholders in evaluating a Fund’s performance for the periods presented.
A-Class | | Six Months Ended
March 31, 2023a | | | Year Ended
September 30,
2022 | | | Year Ended
September 30,
2021 | | | Year Ended
September 30,
2020 | | | Year Ended
September 30,
2019 | | | Year Ended
September 30,
2018 | |
Per Share Data |
Net asset value, beginning of period | | $ | 7.80 | | | $ | 12.15 | | | $ | 10.46 | | | $ | 11.06 | | | $ | 12.09 | | | $ | 11.77 | |
Income (loss) from investment operations: |
Net investment income (loss)b | | | .01 | | | | .01 | | | | — | | | | .06 | | | | .06 | | | | .04 | |
Net gain (loss) on investments (realized and unrealized) | | | 1.07 | | | | (1.44 | ) | | | 1.96 | | | | .11 | | | | .65 | | | | 1.64 | |
Total from investment operations | | | 1.08 | | | | (1.43 | ) | | | 1.96 | | | | .17 | | | | .71 | | | | 1.68 | |
Less distributions from: |
Net investment income | | | (.01 | ) | | | — | | | | (.03 | ) | | | (.05 | ) | | | (.03 | ) | | | (.04 | ) |
Net realized gains | | | — | | | | (2.92 | ) | | | (.24 | ) | | | (.72 | ) | | | (1.71 | ) | | | (1.32 | ) |
Total distributions | | | (.01 | ) | | | (2.92 | ) | | | (.27 | ) | | | (.77 | ) | | | (1.74 | ) | | | (1.36 | ) |
Net asset value, end of period | | $ | 8.87 | | | $ | 7.80 | | | $ | 12.15 | | | $ | 10.46 | | | $ | 11.06 | | | $ | 12.09 | |
|
Total Returnc | | | 13.84 | % | | | (17.94 | %) | | | 18.97 | % | | | 1.40 | % | | | 8.35 | % | | | 15.27 | % |
Ratios/Supplemental Data |
Net assets, end of period (in thousands) | | $ | 2,613 | | | $ | 3,471 | | | $ | 4,494 | | | $ | 3,821 | | | $ | 4,698 | | | $ | 4,200 | |
Ratios to average net assets: |
Net investment income (loss) | | | 0.18 | % | | | 0.06 | % | | | 0.01 | % | | | 0.56 | % | | | 0.54 | % | | | 0.37 | % |
Total expensesd | | | 3.32 | % | | | 2.81 | % | | | 2.70 | % | | | 2.48 | % | | | 2.26 | % | | | 2.06 | % |
Net expensese,f,g | | | 1.18 | % | | | 1.20 | % | | | 1.20 | % | | | 1.21 | % | | | 1.22 | % | | | 1.21 | % |
Portfolio turnover rate | | | 34 | % | | | 79 | % | | | 123 | % | | | 100 | % | | | 96 | % | | | 117 | % |
C-Class | | Six Months Ended
March 31, 2023a | | | Year Ended
September 30,
2022 | | | Year Ended
September 30,
2021 | | | Year Ended
September 30,
2020 | | | Year Ended
September 30,
2019 | | | Year Ended
September 30,
2018 | |
Per Share Data |
Net asset value, beginning of period | | $ | 7.28 | | | $ | 11.58 | | | $ | 10.03 | | | $ | 10.65 | | | $ | 11.76 | | | $ | 11.52 | |
Income (loss) from investment operations: |
Net investment income (loss)b | | | (.03 | ) | | | (.06 | ) | | | (.08 | ) | | | (.02 | ) | | | (.02 | ) | | | (.04 | ) |
Net gain (loss) on investments (realized and unrealized) | | | 1.00 | | | | (1.32 | ) | | | 1.87 | | | | .12 | | | | .62 | | | | 1.60 | |
Total from investment operations | | | .97 | | | | (1.38 | ) | | | 1.79 | | | | .10 | | | | .60 | | | | 1.56 | |
Less distributions from: |
Net realized gains | | | — | | | | (2.92 | ) | | | (.24 | ) | | | (.72 | ) | | | (1.71 | ) | | | (1.32 | ) |
Total distributions | | | — | | | | (2.92 | ) | | | (.24 | ) | | | (.72 | ) | | | (1.71 | ) | | | (1.32 | ) |
Net asset value, end of period | | $ | 8.25 | | | $ | 7.28 | | | $ | 11.58 | | | $ | 10.03 | | | $ | 10.65 | | | $ | 11.76 | |
|
Total Returnc | | | 13.48 | % | | | (18.60 | %) | | | 18.03 | % | | | 0.74 | % | | | 7.44 | % | | | 14.48 | % |
Ratios/Supplemental Data |
Net assets, end of period (in thousands) | | $ | 445 | | | $ | 1,092 | | | $ | 1,539 | | | $ | 2,595 | | | $ | 3,882 | | | $ | 5,142 | |
Ratios to average net assets: |
Net investment income (loss) | | | (0.68 | %) | | | (0.66 | %) | | | (0.70 | %) | | | (0.19 | %) | | | (0.20 | %) | | | (0.36 | %) |
Total expensesd | | | 4.03 | % | | | 3.54 | % | | | 3.41 | % | | | 3.22 | % | | | 2.94 | % | | | 2.73 | % |
Net expensese,f,g | | | 1.93 | % | | | 1.95 | % | | | 1.95 | % | | | 1.96 | % | | | 1.97 | % | | | 1.95 | % |
Portfolio turnover rate | | | 34 | % | | | 79 | % | | | 123 | % | | | 100 | % | | | 96 | % | | | 117 | % |
32 | THE GUGGENHEIM FUNDS SEMI-ANNUAL REPORT | SEE NOTES TO FINANCIAL STATEMENTS. |
RBP® LARGE-CAP DEFENSIVE FUND | |
FINANCIAL HIGHLIGHTS (continued) |
This table is presented to show selected data for a share outstanding throughout each period and to assist shareholders in evaluating a Fund’s performance for the periods presented.
P-Class | | Six Months Ended
March 31, 2023a | | | Year Ended
September 30,
2022 | | | Year Ended
September 30,
2021 | | | Year Ended
September 30,
2020 | | | Year Ended
September 30,
2019 | | | Year Ended
September 30,
2018 | |
Per Share Data |
Net asset value, beginning of period | | $ | 8.15 | | | $ | 12.58 | | | $ | 10.82 | | | $ | 11.41 | | | $ | 12.41 | | | $ | 12.05 | |
Income (loss) from investment operations: |
Net investment income (loss)b | | | .01 | | | | .01 | | | | — | | | | .06 | | | | .06 | | | | .04 | |
Net gain (loss) on investments (realized and unrealized) | | | 1.12 | | | | (1.52 | ) | | | 2.03 | | | | .12 | | | | .67 | | | | 1.69 | |
Total from investment operations | | | 1.13 | | | | (1.51 | ) | | | 2.03 | | | | .18 | | | | .73 | | | | 1.73 | |
Less distributions from: |
Net investment income | | | — | | | | — | | | | (.03 | ) | | | (.05 | ) | | | (.02 | ) | | | (.05 | ) |
Net realized gains | | | — | | | | (2.92 | ) | | | (.24 | ) | | | (.72 | ) | | | (1.71 | ) | | | (1.32 | ) |
Total distributions | | | — | | | | (2.92 | ) | | | (.27 | ) | | | (.77 | ) | | | (1.73 | ) | | | (1.37 | ) |
Net asset value, end of period | | $ | 9.28 | | | $ | 8.15 | | | $ | 12.58 | | | $ | 10.82 | | | $ | 11.41 | | | $ | 12.41 | |
|
Total Return | | | 13.87 | % | | | (17.97 | %) | | | 18.98 | % | | | 1.44 | % | | | 8.26 | % | | | 15.33 | % |
Ratios/Supplemental Data |
Net assets, end of period (in thousands) | | $ | 201 | | | $ | 286 | | | $ | 327 | | | $ | 318 | | | $ | 443 | | | $ | 585 | |
Ratios to average net assets: |
Net investment income (loss) | | | 0.22 | % | | | 0.07 | % | | | 0.01 | % | | | 0.56 | % | | | 0.53 | % | | | 0.36 | % |
Total expensesd | | | 3.42 | % | | | 2.89 | % | | | 2.76 | % | | | 2.54 | % | | | 2.30 | % | | | 1.98 | % |
Net expensese,f,g | | | 1.18 | % | | | 1.20 | % | | | 1.20 | % | | | 1.21 | % | | | 1.22 | % | | | 1.20 | % |
Portfolio turnover rate | | | 34 | % | | | 79 | % | | | 123 | % | | | 100 | % | | | 96 | % | | | 117 | % |
SEE NOTES TO FINANCIAL STATEMENTS. | THE GUGGENHEIM FUNDS SEMI-ANNUAL REPORT | 33 |
RBP® LARGE-CAP DEFENSIVE FUND | |
FINANCIAL HIGHLIGHTS (concluded) |
This table is presented to show selected data for a share outstanding throughout each period and to assist shareholders in evaluating a Fund’s performance for the periods presented.
Institutional Class | | Six Months Ended
March 31, 2023a | | | Year Ended
September 30,
2022 | | | Year Ended
September 30,
2021 | | | Year Ended
September 30,
2020 | | | Year Ended
September 30,
2019 | | | Year Ended
September 30,
2018 | |
Per Share Data |
Net asset value, beginning of period | | $ | 8.27 | | | $ | 12.69 | | | $ | 10.93 | | | $ | 11.52 | | | $ | 12.52 | | | $ | 12.16 | |
Income (loss) from investment operations: |
Net investment income (loss)b | | | .02 | | | | .03 | | | | .03 | | | | .09 | | | | .09 | | | | .08 | |
Net gain (loss) on investments (realized and unrealized) | | | 1.13 | | | | (1.53 | ) | | | 2.04 | | | | .12 | | | | .68 | | | | 1.68 | |
Total from investment operations | | | 1.15 | | | | (1.50 | ) | | | 2.07 | | | | .21 | | | | .77 | | | | 1.76 | |
Less distributions from: |
Net investment income | | | (.01 | ) | | | — | | | | (.07 | ) | | | (.08 | ) | | | (.06 | ) | | | (.08 | ) |
Net realized gains | | | — | | | | (2.92 | ) | | | (.24 | ) | | | (.72 | ) | | | (1.71 | ) | | | (1.32 | ) |
Total distributions | | | (.01 | ) | | | (2.92 | ) | | | (.31 | ) | | | (.80 | ) | | �� | (1.77 | ) | | | (1.40 | ) |
Net asset value, end of period | | $ | 9.41 | | | $ | 8.27 | | | $ | 12.69 | | | $ | 10.93 | | | $ | 11.52 | | | $ | 12.52 | |
|
Total Return | | | 13.95 | % | | | (17.68 | %) | | | 19.23 | % | | | 1.69 | % | | | 8.62 | % | | | 15.52 | % |
Ratios/Supplemental Data |
Net assets, end of period (in thousands) | | $ | 4,417 | | | $ | 3,626 | | | $ | 4,676 | | | $ | 5,468 | | | $ | 6,286 | | | $ | 8,590 | |
Ratios to average net assets: |
Net investment income (loss) | | | 0.50 | % | | | 0.31 | % | | | 0.26 | % | | | 0.81 | % | | | 0.80 | % | | | 0.64 | % |
Total expensesd | | | 3.00 | % | | | 2.51 | % | | | 2.40 | % | | | 2.23 | % | | | 1.97 | % | | | 1.70 | % |
Net expensese,f,g | | | 0.93 | % | | | 0.95 | % | | | 0.95 | % | | | 0.96 | % | | | 0.97 | % | | | 0.95 | % |
Portfolio turnover rate | | | 34 | % | | | 79 | % | | | 123 | % | | | 100 | % | | | 96 | % | | | 117 | % |
a | Unaudited figures for the period ended March 31, 2023. Percentage amounts for the period, except total return and portfolio turnover rate, have been annualized. |
b | Net investment income (loss) per share was computed using average shares outstanding throughout the period. |
c | Total return does not reflect the impact of any applicable sales charges. |
d | Does not include expenses of the underlying funds in which the Fund invests. |
e | Net expense information reflects the expense ratios after expense waivers and reimbursements, as applicable. |
f | The portion of the ratios of net expenses to average net assets attributable to recoupments of prior fee reductions or expense reimbursements for the years presented was as follows: |
| 03/31/23a | 09/30/22 | 09/30/21 | 09/30/20 | 09/30/19 | 09/30/18 |
A-Class | — | — | — | — | — | — |
C-Class | — | — | — | 0.00%h | — | — |
P-Class | — | — | — | — | — | — |
Institutional Class | — | — | — | — | — | — |
g | Net expenses may include expenses that are excluded from the expense limitation agreement. Excluding these expenses, the net expense ratios for the years presented would be: |
| 03/31/23a | 09/30/22 | 09/30/21 | 09/30/20 | 09/30/19 | 09/30/18 |
A-Class | 1.17% | 1.19% | 1.20% | 1.21% | 1.21% | 1.20% |
C-Class | 1.92% | 1.94% | 1.95% | 1.96% | 1.96% | 1.95% |
P-Class | 1.17% | 1.19% | 1.20% | 1.21% | 1.21% | 1.20% |
Institutional Class | 0.92% | 0.94% | 0.95% | 0.96% | 0.96% | 1.95% |
34 | THE GUGGENHEIM FUNDS SEMI-ANNUAL REPORT | SEE NOTES TO FINANCIAL STATEMENTS. |
PERFORMANCE REPORT AND FUND PROFILE (Unaudited) | March 31, 2023 |
RBP® LARGE-CAP MARKET FUND
OBJECTIVE: Seeks to provide investment results that, before fees and expenses, correspond generally to the total return performance of the Guggenheim RBP® Large-Cap Market IndexSM (the “Market Index” or “Index”).
Holdings Diversification (Market Exposure as % of Net Assets)

“Holdings Diversification (Market Exposure as % of Net Assets)” excludes any temporary cash investments.
Inception Dates: |
A-Class | April 27, 2010 |
C-Class | April 18, 2011 |
P-Class | April 27, 2010 |
Institutional Class | February 15, 2011 |
Ten Largest Holdings | (% of Total
Net Assets) |
Microsoft Corp. | 6.8% |
Apple, Inc. | 5.9% |
Alphabet, Inc. — Class C | 4.1% |
Tesla, Inc. | 2.6% |
Exxon Mobil Corp. | 2.2% |
Visa, Inc. — Class A | 2.0% |
Home Depot, Inc. | 1.7% |
Broadcom, Inc. | 1.7% |
Salesforce, Inc. | 1.6% |
Walmart, Inc. | 1.6% |
Top Ten Total | 30.2% |
| | |
“Ten Largest Holdings” excludes any temporary cash investments. |
| | THE GUGGENHEIM FUNDS SEMI-ANNUAL REPORT | 35 |
PERFORMANCE REPORT AND FUND PROFILE (Unaudited)(concluded) | March 31, 2023 |
Average Annual Returns*
Periods Ended March 31, 2023
| 6 Month† | 1 Year | 5 Year | 10 Year |
A-Class Shares | 11.32% | (12.88%) | 7.11% | 9.53% |
A-Class Shares with sales charge‡ | 6.05% | (17.01%) | 6.07% | 8.88% |
C-Class Shares | 10.87% | (13.48%) | 6.33% | 8.77% |
C-Class Shares with CDSC§ | 9.87% | (14.31%) | 6.33% | 8.77% |
P-Class Shares** | 11.39% | (12.84%) | 7.13% | 9.58% |
Institutional Class Shares | 11.53% | (12.61%) | 7.39% | 9.86% |
Guggenheim RBP Large-Cap Market IndexSM | 11.80% | (12.10%) | 8.44% | 11.03% |
Dow Jones U.S. Large-Cap Total Stock Market Index | 15.29% | (8.56%) | 10.91% | 12.05% |
* | The performance data above represents past performance that is not predictive of future results. The investment return and principal value of an investment in the Fund will fluctuate so that an investor’s shares, when redeemed, may be worth more or less than their original cost. Returns are historical and include changes in principal and reinvested dividends and capital gains and do not reflect the effect of taxes. The Guggenheim RBP Large-Cap Market IndexSM and the Dow Jones U.S. Large-Cap Total Stock Market Index are unmanaged indices and, unlike the Fund, have no management fees or operating expenses to reduce their reported returns. |
** | F-1 Class shares redesignated as P-Class shares effective May 9, 2016. |
† | 6 month returns are not annualized. |
‡ | Effective May 9, 2016, the maximum sales charge decreased from 5.75% to 4.75%. A 5.75% maximum sales charge is used in the calculation of the average annual return since inception based on subscriptions made prior to May 9, 2016, and a 4.75% maximum sales charge will be used to calculate performance for periods based on subscriptions made on or after May 9, 2016. |
§ | Fund returns include a CDSC of 1% if redeemed within 12 months of purchase. |
36 | THE GUGGENHEIM FUNDS SEMI-ANNUAL REPORT | |
SCHEDULE OF INVESTMENTS (Unaudited) | March 31, 2023 |
RBP® LARGE-CAP MARKET FUND | |
| | Shares | | | Value | |
COMMON STOCKS† - 98.9% |
| | | | | | | | | |
Technology - 22.3% |
Microsoft Corp. | | | 2,625 | | | $ | 756,788 | |
Apple, Inc. | | | 3,993 | | | | 658,446 | |
Broadcom, Inc. | | | 294 | | | | 188,613 | |
Salesforce, Inc.* | | | 894 | | | | 178,603 | |
Adobe, Inc.* | | | 423 | | | | 163,012 | |
Applied Materials, Inc. | | | 1,159 | | | | 142,360 | |
ServiceNow, Inc.* | | | 279 | | | | 129,657 | |
Electronic Arts, Inc. | | | 903 | | | | 108,766 | |
NVIDIA Corp. | | | 284 | | | | 78,886 | |
Accenture plc — Class A | | | 215 | | | | 61,449 | |
Total Technology | | | | | | | 2,466,580 | |
| | | | | | | | | |
Consumer, Non-cyclical - 22.0% |
Procter & Gamble Co. | | | 1,145 | | | | 170,250 | |
Bristol-Myers Squibb Co. | | | 2,214 | | | | 153,452 | |
Danaher Corp. | | | 591 | | | | 148,956 | |
Gilead Sciences, Inc. | | | 1,606 | | | | 133,250 | |
Becton Dickinson and Co. | | | 536 | | | | 132,681 | |
IDEXX Laboratories, Inc.* | | | 253 | | | | 126,520 | |
McKesson Corp. | | | 338 | | | | 120,345 | |
Kroger Co. | | | 2,397 | | | | 118,340 | |
Corteva, Inc. | | | 1,928 | | | | 116,278 | |
FleetCor Technologies, Inc.* | | | 551 | | | | 116,178 | |
AmerisourceBergen Corp. — Class A | | | 701 | | | | 112,237 | |
Constellation Brands, Inc. — Class A | | | 495 | | | | 111,815 | |
Incyte Corp.* | | | 1,496 | | | | 108,116 | |
Sysco Corp. | | | 1,343 | | | | 103,720 | |
IQVIA Holdings, Inc.* | | | 438 | | | | 87,114 | |
Equifax, Inc. | | | 418 | | | | 84,787 | |
Encompass Health Corp. | | | 1,537 | | | | 83,152 | |
PayPal Holdings, Inc.* | | | 938 | | | | 71,232 | |
PepsiCo, Inc. | | | 369 | | | | 67,269 | |
Amgen, Inc. | | | 199 | | | | 48,108 | |
Dexcom, Inc.* | | | 384 | | | | 44,613 | |
Merck & Company, Inc. | | | 409 | | | | 43,514 | |
UnitedHealth Group, Inc. | | | 87 | | | | 41,115 | |
Bunge Ltd. | | | 428 | | | | 40,883 | |
US Foods Holding Corp.* | | | 1,027 | | | | 37,937 | |
Johnson & Johnson | | | 98 | | | | 15,190 | |
Total Consumer, Non-cyclical | | | | | | | 2,437,052 | |
| | | | | | | | | |
Financial - 15.2% |
Visa, Inc. — Class A | | | 966 | | | | 217,794 | |
Mastercard, Inc. — Class A | | | 421 | | | | 152,996 | |
Prologis, Inc. REIT | | | 1,163 | | | | 145,108 | |
Chubb Ltd. | | | 622 | | | | 120,780 | |
American Tower Corp. — Class A REIT | | | 562 | | | | 114,839 | |
Travelers Companies, Inc. | | | 652 | | | | 111,759 | |
Discover Financial Services | | | 1,095 | | | | 108,230 | |
Globe Life, Inc. | | | 952 | | | | 104,739 | |
Cboe Global Markets, Inc. | | | 758 | | | | 101,754 | |
Truist Financial Corp. | | | 2,964 | | | | 101,072 | |
American International Group, Inc. | | | 1,950 | | | | 98,202 | |
Webster Financial Corp. | | | 2,223 | | | | 87,631 | |
W R Berkley Corp. | | | 1,324 | | | | 82,432 | |
Berkshire Hathaway, Inc. — Class B* | | | 202 | | | | 62,371 | |
Voya Financial, Inc. | | | 404 | | | | 28,870 | |
MetLife, Inc. | | | 289 | | | | 16,745 | |
Mid-America Apartment Communities, Inc. REIT | | | 103 | | | | 15,557 | |
JPMorgan Chase & Co. | | | 77 | | | | 10,034 | |
Total Financial | | | | | | | 1,680,913 | |
| | | | | | | | | |
Consumer, Cyclical - 11.8% |
Tesla, Inc.* | | | 1,376 | | | | 285,465 | |
Home Depot, Inc. | | | 648 | | | | 191,238 | |
Walmart, Inc. | | | 1,171 | | | | 172,664 | |
NIKE, Inc. — Class B | | | 1,255 | | | | 153,913 | |
Starbucks Corp. | | | 1,347 | | | | 140,263 | |
TJX Companies, Inc. | | | 1,734 | | | | 135,876 | |
Target Corp. | | | 774 | | | | 128,198 | |
Southwest Airlines Co. | | | 3,016 | | | | 98,140 | |
Total Consumer, Cyclical | | | | | | | 1,305,757 | |
| | | | | | | | | |
Communications - 10.4% |
Alphabet, Inc. — Class C* | | | 4,400 | | | | 457,600 | |
Walt Disney Co.* | | | 1,649 | | | | 165,114 | |
Amazon.com, Inc.* | | | 1,491 | | | | 154,006 | |
T-Mobile US, Inc.* | | | 943 | | | | 136,584 | |
Palo Alto Networks, Inc.* | | | 649 | | | | 129,631 | |
Comcast Corp. — Class A | | | 2,313 | | | | 87,686 | |
Meta Platforms, Inc. — Class A* | | | 88 | | | | 18,651 | |
Total Communications | | | | | | | 1,149,272 | |
| | | | | | | | | |
Industrial - 7.2% |
Deere & Co. | | | 343 | | | | 141,618 | |
Caterpillar, Inc. | | | 613 | | | | 140,279 | |
Eaton Corporation plc | | | 728 | | | | 124,735 | |
Northrop Grumman Corp. | | | 248 | | | | 114,507 | |
Keysight Technologies, Inc.* | | | 651 | | | | 105,124 | |
Illinois Tool Works, Inc. | | | 313 | | | | 76,200 | |
Agilent Technologies, Inc. | | | 274 | | | | 37,905 | |
Fortune Brands Innovations, Inc. | | | 643 | | | | 37,763 | |
Builders FirstSource, Inc.* | | | 156 | | | | 13,850 | |
Regal Rexnord Corp. | | | 80 | | | | 11,258 | |
Total Industrial | | | | | | | 803,239 | |
| | | | | | | | | |
Energy - 4.3% |
Exxon Mobil Corp. | | | 2,194 | | | | 240,594 | |
Pioneer Natural Resources Co. | | | 480 | | | | 98,035 | |
EOG Resources, Inc. | | | 688 | | | | 78,865 | |
ConocoPhillips | | | 631 | | | | 62,602 | |
Total Energy | | | | | | | 480,096 | |
| | | | | | | | | |
Utilities - 3.6% |
NextEra Energy, Inc. | | | 1,851 | | | | 142,675 | |
Evergy, Inc. | | | 1,463 | | | | 89,419 | |
Constellation Energy Corp. | | | 895 | | | | 70,257 | |
Vistra Corp. | | | 2,637 | | | | 63,288 | |
Exelon Corp. | | | 895 | | | | 37,492 | |
Total Utilities | | | | | | | 403,131 | |
SEE NOTES TO FINANCIAL STATEMENTS. | THE GUGGENHEIM FUNDS SEMI-ANNUAL REPORT | 37 |
SCHEDULE OF INVESTMENTS (Unaudited)(concluded) | March 31, 2023 |
RBP® LARGE-CAP MARKET FUND | |
| | Shares | | | Value | |
| | | | | | | | | |
Basic Materials - 2.1% |
FMC Corp. | | | 881 | | | $ | 107,597 | |
Mosaic Co. | | | 2,214 | | | | 101,578 | |
Cleveland-Cliffs, Inc.* | | | 1,240 | | | | 22,729 | |
Total Basic Materials | | | | | | | 231,904 | |
| | | | | | | | | |
Total Common Stocks | | | | |
(Cost $10,539,365) | | | | | | | 10,957,944 | |
| | | | | | | | | |
EXCHANGE-TRADED FUNDS† - 0.4% |
SPDR S&P 500 ETF Trust | | | 47 | | | | 19,241 | |
Vanguard S&P 500 ETF | | | 51 | | | | 19,180 | |
Total Exchange-Traded Funds | | | | |
(Cost $37,148) | | | | | | | 38,421 | |
| | | | | | | | | |
Total Investments - 99.3% | | | | |
(Cost $10,576,513) | | $ | 10,996,365 | |
Other Assets & Liabilities, net - 0.7% | | | 78,922 | |
Total Net Assets - 100.0% | | $ | 11,075,287 | |
* | Non-income producing security. |
† | Value determined based on Level 1 inputs — See Note 4. |
| | plc — Public Limited Company |
| | REIT — Real Estate Investment Trust |
| | |
| | See Sector Classification in Other Information section. |
The following table summarizes the inputs used to value the Fund’s investments at March 31, 2023 (See Note 4 in the Notes to Financial Statements):
Investments in Securities (Assets) | | Level 1
Quoted
Prices | | | Level 2
Significant
Observable
Inputs | | | Level 3
Significant
Unobservable
Inputs | | | Total | |
Common Stocks | | $ | 10,957,944 | | | $ | — | | | $ | — | | | $ | 10,957,944 | |
Exchange-Traded Funds | | | 38,421 | | | | — | | | | — | | | | 38,421 | |
Total Assets | | $ | 10,996,365 | | | $ | — | | | $ | — | | | $ | 10,996,365 | |
38 | THE GUGGENHEIM FUNDS SEMI-ANNUAL REPORT | SEE NOTES TO FINANCIAL STATEMENTS. |
RBP® LARGE-CAP MARKET FUND | |
STATEMENT OF ASSETS AND LIABILITIES (Unaudited) |
March 31, 2023 |
Assets: |
Investments, at value (cost $10,576,513) | | $ | 10,996,365 | |
Cash | | | 50,818 | |
Prepaid expenses | | | 34,832 | |
Receivables: |
Investment Adviser | | | 10,712 | |
Dividends | | | 5,581 | |
Total assets | | | 11,098,308 | |
| | | | | |
Liabilities: |
Payable for: |
Professional fees | | | 10,448 | |
Fund accounting and administration fees | | | 4,301 | |
Distribution and service fees | | | 3,100 | |
Transfer agent/maintenance fees | | | 2,321 | |
Printing fees | | | 1,202 | |
Custodian fees | | | 1,165 | |
Fund shares redeemed | | | 2 | |
Miscellaneous | | | 482 | |
Total liabilities | | | 23,021 | |
Net assets | | $ | 11,075,287 | |
| | | | | |
Net assets consist of: |
Paid in capital | | $ | 11,017,923 | |
Total distributable earnings (loss) | | | 57,364 | |
Net assets | | $ | 11,075,287 | |
| | | | | |
A-Class: |
Net assets | | $ | 6,147,568 | |
Capital shares outstanding | | | 658,838 | |
Net asset value per share | | $ | 9.33 | |
Maximum offering price per share (Net asset value divided by 95.25%) | | $ | 9.80 | |
| | | | | |
C-Class: |
Net assets | | $ | 1,503,707 | |
Capital shares outstanding | | | 181,802 | |
Net asset value per share | | $ | 8.27 | |
| | | | | |
P-Class: |
Net assets | | $ | 141,651 | |
Capital shares outstanding | | | 14,503 | |
Net asset value per share | | $ | 9.77 | |
| | | | | |
Institutional Class: |
Net assets | | $ | 3,282,361 | |
Capital shares outstanding | | | 318,718 | |
Net asset value per share | | $ | 10.30 | |
STATEMENT OF OPERATIONS (Unaudited) |
Six Months Ended March 31, 2023 |
Investment Income: |
Dividends (net of foreign withholding tax of $193) | | $ | 87,473 | |
Total investment income | | | 87,473 | |
| | | | | |
Expenses: |
Management fees | | | 41,776 | |
Distribution and service fees: |
A-Class | | | 9,347 | |
C-Class | | | 9,001 | |
P-Class | | | 176 | |
Transfer agent fees: |
A-Class | | | 6,714 | |
C-Class | | | 2,029 | |
P-Class | | | 382 | |
Institutional Class | | | 3,728 | |
Registration fees | | | 35,291 | |
Professional fees | | | 20,222 | |
Fund accounting and administration fees | | | 6,927 | |
Trustees’ fees* | | | 5,079 | |
Custodian fees | | | 1,945 | |
Line of credit fees | | | 193 | |
Miscellaneous | | | 5,577 | |
Total expenses | | | 148,387 | |
Less: Expenses reimbursed by Adviser: |
A-Class | | | (20,034 | ) |
C-Class | | | (5,334 | ) |
P-Class | | | (650 | ) |
Institutional Class | | | (9,779 | ) |
Expenses waived by Adviser | | | (43,503 | ) |
Earnings credit applied | | | (989 | ) |
Total waived/reimbursed expenses | | | (80,289 | ) |
Net expenses | | | 68,098 | |
Net investment income | | | 19,375 | |
| | | | | |
Net Realized and Unrealized Gain (Loss): |
Net realized gain (loss) on: |
Investments | | | (354,248 | ) |
Net realized loss | | | (354,248 | ) |
Net change in unrealized appreciation (depreciation) on: |
Investments | | | 1,504,964 | |
Net change in unrealized appreciation (depreciation) | | | 1,504,964 | |
Net realized and unrealized gain | | | 1,150,716 | |
Net increase in net assets resulting from operations | | $ | 1,170,091 | |
* | Relates to Trustees not deemed “interested persons” within the meaning of Section 2(a)(19) of the 1940 Act. |
SEE NOTES TO FINANCIAL STATEMENTS. | THE GUGGENHEIM FUNDS SEMI-ANNUAL REPORT | 39 |
RBP® LARGE-CAP MARKET FUND | |
STATEMENTS OF CHANGES IN NET ASSETS |
| | Six Months Ended
March 31, 2023
(Unaudited) | | | Year Ended
September 30,
2022 | |
Increase (Decrease) in Net Assets from Operations: | | | | | | | | |
Net investment income | | $ | 19,375 | | | $ | 577 | |
Net realized gain (loss) on investments | | | (354,248 | ) | | | 499,846 | |
Net change in unrealized appreciation (depreciation) on investments | | | 1,504,964 | | | | (2,953,655 | ) |
Net increase (decrease) in net assets resulting from operations | | | 1,170,091 | | | | (2,453,232 | ) |
| | | | | | | | | |
Distributions to shareholders: | | | | | | | | |
A-Class | | | (184,932 | ) | | | (1,517,760 | ) |
C-Class | | | (60,197 | ) | | | (748,307 | ) |
P-Class | | | (4,151 | ) | | | (32,243 | ) |
Institutional Class | | | (98,578 | ) | | | (737,289 | ) |
Total distributions to shareholders | | | (347,858 | ) | | | (3,035,599 | ) |
| | | | | | | | | |
Capital share transactions: | | | | | | | | |
Proceeds from sale of shares | | | | | | | | |
A-Class | | | 252,063 | | | | 1,089,498 | |
C-Class | | | — | | | | 7,145 | |
P-Class | | | 2,025 | | | | 18,655 | |
Institutional Class | | | 239,356 | | | | 554,113 | |
Distributions reinvested | | | | | | | | |
A-Class | | | 166,750 | | | | 1,366,664 | |
C-Class | | | 60,197 | | | | 741,163 | |
P-Class | | | 4,019 | | | | 31,173 | |
Institutional Class | | | 97,091 | | | | 724,849 | |
Cost of shares redeemed | | | | | | | | |
A-Class | | | (331,856 | ) | | | (997,303 | ) |
C-Class | | | (520,905 | ) | | | (1,070,785 | ) |
P-Class | | | (8,940 | ) | | | (87,157 | ) |
Institutional Class | | | (146,685 | ) | | | (502,928 | ) |
Net increase (decrease) from capital share transactions | | | (186,885 | ) | | | 1,875,087 | |
Net increase (decrease) in net assets | | | 635,348 | | | | (3,613,744 | ) |
| | | | | | | | | |
Net assets: | | | | | | | | |
Beginning of period | | | 10,439,939 | | | | 14,053,683 | |
End of period | | $ | 11,075,287 | | | $ | 10,439,939 | |
| | | | | | | | | |
Capital share activity: | | | | | | | | |
Shares sold | | | | | | | | |
A-Class | | | 26,886 | | | | 99,324 | |
C-Class | | | — | | | | 694 | |
P-Class | | | 209 | | | | 1,684 | |
Institutional Class | | | 23,141 | | | | 41,684 | |
Shares issued from reinvestment of distributions | | | | | | | | |
A-Class | | | 18,027 | | | | 119,151 | |
C-Class | | | 7,323 | | | | 72,027 | |
P-Class | | | 415 | | | | 2,600 | |
Institutional Class | | | 9,519 | | | | 57,437 | |
Shares redeemed | | | | | | | | |
A-Class | | | (35,816 | ) | | | (93,004 | ) |
C-Class | | | (63,446 | ) | | | (109,517 | ) |
P-Class | | | (926 | ) | | | (6,314 | ) |
Institutional Class | | | (14,135 | ) | | | (41,877 | ) |
Net increase (decrease) in shares | | | (28,803 | ) | | | 143,889 | |
40 | THE GUGGENHEIM FUNDS SEMI-ANNUAL REPORT | SEE NOTES TO FINANCIAL STATEMENTS. |
RBP® LARGE-CAP MARKET FUND | |
This table is presented to show selected data for a share outstanding throughout each period and to assist shareholders in evaluating a Fund’s performance for the periods presented.
A-Class | | Six Months Ended
March 31, 2023a | | | Year Ended
September 30,
2022 | | | Year Ended
September 30,
2021 | | | Year Ended
September 30,
2020 | | | Year Ended
September 30,
2019 | | | Year Ended
September 30,
2018 | |
Per Share Data |
Net asset value, beginning of period | | $ | 8.64 | | | $ | 13.30 | | | $ | 10.90 | | | $ | 10.71 | | | $ | 12.04 | | | $ | 11.36 | |
Income (loss) from investment operations: |
Net investment income (loss)b | | | .02 | | | | .01 | | | | (.01 | ) | | | .02 | | | | .03 | | | | .01 | |
Net gain (loss) on investments (realized and unrealized) | | | .96 | | | | (1.79 | ) | | | 2.96 | | | | .88 | | | | .25 | | | | 1.84 | |
Total from investment operations | | | .98 | | | | (1.78 | ) | | | 2.95 | | | | .90 | | | | .28 | | | | 1.85 | |
Less distributions from: |
Net investment income | | | (.01 | ) | | | — | | | | — | | | | (.01 | ) | | | — | | | | — | |
Net realized gains | | | (.28 | ) | | | (2.88 | ) | | | (.55 | ) | | | (.70 | ) | | | (1.61 | ) | | | (1.17 | ) |
Total distributions | | | (.29 | ) | | | (2.88 | ) | | | (.55 | ) | | | (.71 | ) | | | (1.61 | ) | | | (1.17 | ) |
Net asset value, end of period | | $ | 9.33 | | | $ | 8.64 | | | $ | 13.30 | | | $ | 10.90 | | | $ | 10.71 | | | $ | 12.04 | |
|
Total Returnc | | | 11.32 | % | | | (18.71 | %) | | | 27.82 | % | | | 8.57 | % | | | 4.34 | % | | | 17.47 | % |
Ratios/Supplemental Data |
Net assets, end of period (in thousands) | | $ | 6,148 | | | $ | 5,614 | | | $ | 6,973 | | | $ | 4,372 | | | $ | 4,651 | | | $ | 4,280 | |
Ratios to average net assets: |
Net investment income (loss) | | | 0.40 | % | | | 0.10 | % | | | (0.11 | %) | | | 0.17 | % | | | 0.32 | % | | | 0.09 | % |
Total expensesd | | | 2.64 | % | | | 2.50 | % | | | 2.48 | % | | | 2.64 | % | | | 2.29 | % | | | 1.86 | % |
Net expensese,f,g | | | 1.19 | % | | | 1.20 | % | | | 1.20 | % | | | 1.21 | % | | | 1.22 | % | | | 1.21 | % |
Portfolio turnover rate | | | 35 | % | | | 67 | % | | | 105 | % | | | 76 | % | | | 81 | % | | | 93 | % |
C-Class | | Six Months Ended
March 31, 2023a | | | Year Ended
September 30,
2022 | | | Year Ended
September 30,
2021 | | | Year Ended
September 30,
2020 | | | Year Ended
September 30,
2019 | | | Year Ended
September 30,
2018 | |
Per Share Data |
Net asset value, beginning of period | | $ | 7.71 | | | $ | 12.23 | | | $ | 10.13 | | | $ | 10.07 | | | $ | 11.50 | | | $ | 10.98 | |
Income (loss) from investment operations: |
Net investment income (loss)b | | | (.01 | ) | | | (.07 | ) | | | (.10 | ) | | | (.06 | ) | | | (.04 | ) | | | (.07 | ) |
Net gain (loss) on investments (realized and unrealized) | | | .85 | | | | (1.57 | ) | | | 2.75 | | | | .82 | | | | .22 | | | | 1.76 | |
Total from investment operations | | | .84 | | | | (1.64 | ) | | | 2.65 | | | | .76 | | | | .18 | | | | 1.69 | |
Less distributions from: |
Net realized gains | | | (.28 | ) | | | (2.88 | ) | | | (.55 | ) | | | (.70 | ) | | | (1.61 | ) | | | (1.17 | ) |
Total distributions | | | (.28 | ) | | | (2.88 | ) | | | (.55 | ) | | | (.70 | ) | | | (1.61 | ) | | | (1.17 | ) |
Net asset value, end of period | | $ | 8.27 | | | $ | 7.71 | | | $ | 12.23 | | | $ | 10.13 | | | $ | 10.07 | | | $ | 11.50 | |
|
Total Returnc | | | 10.87 | % | | | (19.30 | %) | | | 26.94 | % | | | 7.69 | % | | | 3.59 | % | | | 16.55 | % |
Ratios/Supplemental Data |
Net assets, end of period (in thousands) | | $ | 1,504 | | | $ | 1,834 | | | $ | 3,360 | | | $ | 4,859 | | | $ | 6,223 | | | $ | 9,672 | |
Ratios to average net assets: |
Net investment income (loss) | | | (0.36 | %) | | | (0.69 | %) | | | (0.83 | %) | | | (0.57 | %) | | | (0.42 | %) | | | (0.66 | %) |
Total expensesd | | | 3.31 | % | | | 3.16 | % | | | 3.22 | % | | | 3.32 | % | | | 2.92 | % | | | 2.62 | % |
Net expensese,f,g | | | 1.94 | % | | | 1.95 | % | | | 1.95 | % | | | 1.96 | % | | | 1.97 | % | | | 1.96 | % |
Portfolio turnover rate | | | 35 | % | | | 67 | % | | | 105 | % | | | 76 | % | | | 81 | % | | | 93 | % |
SEE NOTES TO FINANCIAL STATEMENTS. | THE GUGGENHEIM FUNDS SEMI-ANNUAL REPORT | 41 |
RBP® LARGE-CAP MARKET FUND | |
FINANCIAL HIGHLIGHTS (continued) |
This table is presented to show selected data for a share outstanding throughout each period and to assist shareholders in evaluating a Fund’s performance for the periods presented.
P-Class | | Six Months Ended
March 31, 2023a | | | Year Ended
September 30,
2022 | | | Year Ended
September 30,
2021 | | | Year Ended
September 30,
2020 | | | Year Ended
September 30,
2019 | | | Year Ended
September 30,
2018 | |
Per Share Data |
Net asset value, beginning of period | | $ | 9.03 | | | $ | 13.78 | | | $ | 11.28 | | | $ | 11.06 | | | $ | 12.37 | | | $ | 11.64 | |
Income (loss) from investment operations: |
Net investment income (loss)b | | | .02 | | | | .01 | | | | (.01 | ) | | | .02 | | | | .04 | | | | .01 | |
Net gain (loss) on investments (realized and unrealized) | | | 1.01 | | | | (1.88 | ) | | | 3.06 | | | | .91 | | | | .26 | | | | 1.89 | |
Total from investment operations | | | 1.03 | | | | (1.87 | ) | | | 3.05 | | | | .93 | | | | .30 | | | | 1.90 | |
Less distributions from: |
Net investment income | | | (.01 | ) | | | — | | | | — | | | | (.01 | ) | | | — | | | | — | |
Net realized gains | | | (.28 | ) | | | (2.88 | ) | | | (.55 | ) | | | (.70 | ) | | | (1.61 | ) | | | (1.17 | ) |
Total distributions | | | (.29 | ) | | | (2.88 | ) | | | (.55 | ) | | | (.71 | ) | | | (1.61 | ) | | | (1.17 | ) |
Net asset value, end of period | | $ | 9.77 | | | $ | 9.03 | | | $ | 13.78 | | | $ | 11.28 | | | $ | 11.06 | | | $ | 12.37 | |
|
Total Return | | | 11.39 | % | | | (18.72 | %) | | | 27.76 | % | | | 8.54 | % | | | 4.39 | % | | | 17.38 | % |
Ratios/Supplemental Data |
Net assets, end of period (in thousands) | | $ | 142 | | | $ | 134 | | | $ | 232 | | | $ | 131 | | | $ | 154 | | | $ | 200 | |
Ratios to average net assets: |
Net investment income (loss) | | | 0.40 | % | | | 0.09 | % | | | (0.10 | %) | | | 0.17 | % | | | 0.35 | % | | | 0.08 | % |
Total expensesd | | | 2.90 | % | | | 2.67 | % | | | 2.61 | % | | | 2.79 | % | | | 2.34 | % | | | 1.97 | % |
Net expensese,f,g | | | 1.19 | % | | | 1.20 | % | | | 1.20 | % | | | 1.21 | % | | | 1.22 | % | | | 1.21 | % |
Portfolio turnover rate | | | 35 | % | | | 67 | % | | | 105 | % | | | 76 | % | | | 81 | % | | | 93 | % |
42 | THE GUGGENHEIM FUNDS SEMI-ANNUAL REPORT | SEE NOTES TO FINANCIAL STATEMENTS. |
RBP® LARGE-CAP MARKET FUND | |
FINANCIAL HIGHLIGHTS (concluded) |
This table is presented to show selected data for a share outstanding throughout each period and to assist shareholders in evaluating a Fund’s performance for the periods presented.
Institutional Class | | Six Months Ended
March 31, 2023a | | | Year Ended
September 30,
2022 | | | Year Ended
September 30,
2021 | | | Year Ended
September 30,
2020 | | | Year Ended
September 30,
2019 | | | Year Ended
September 30,
2018 | |
Per Share Data |
Net asset value, beginning of period | | $ | 9.52 | | | $ | 14.36 | | | $ | 11.70 | | | $ | 11.44 | | | $ | 12.71 | | | $ | 11.91 | |
Income (loss) from investment operations: |
Net investment income (loss)b | | | .03 | | | | .04 | | | | .02 | | | | .05 | | | | .07 | | | | .04 | |
Net gain (loss) on investments (realized and unrealized) | | | 1.07 | | | | (2.00 | ) | | | 3.19 | | | | .95 | | | | .27 | | | | 1.93 | |
Total from investment operations | | | 1.10 | | | | (1.96 | ) | | | 3.21 | | | | 1.00 | | | | .34 | | | | 1.97 | |
Less distributions from: |
Net investment income | | | (.04 | ) | | | — | | | | — | | | | (.04 | ) | | | — | | | | — | |
Net realized gains | | | (.28 | ) | | | (2.88 | ) | | | (.55 | ) | | | (.70 | ) | | | (1.61 | ) | | | (1.17 | ) |
Total distributions | | | (.32 | ) | | | (2.88 | ) | | | (.55 | ) | | | (.74 | ) | | | (1.61 | ) | | | (1.17 | ) |
Net asset value, end of period | | $ | 10.30 | | | $ | 9.52 | | | $ | 14.36 | | | $ | 11.70 | | | $ | 11.44 | | | $ | 12.71 | |
|
Total Return | | | 11.53 | % | | | (18.56 | %) | | | 28.15 | % | | | 8.90 | % | | | 4.62 | % | | | 17.69 | % |
Ratios/Supplemental Data |
Net assets, end of period (in thousands) | | $ | 3,282 | | | $ | 2,859 | | | $ | 3,488 | | | $ | 1,634 | | | $ | 3,747 | | | $ | 5,026 | |
Ratios to average net assets: |
Net investment income (loss) | | | 0.65 | % | | | 0.34 | % | | | 0.13 | % | | | 0.47 | % | | | 0.59 | % | | | 0.35 | % |
Total expensesd | | | 2.34 | % | | | 2.18 | % | | | 2.15 | % | | | 2.25 | % | | | 1.96 | % | | | 1.57 | % |
Net expensese,f,g | | | 0.94 | % | | | 0.95 | % | | | 0.95 | % | | | 0.96 | % | | | 0.97 | % | | | 0.96 | % |
Portfolio turnover rate | | | 35 | % | | | 67 | % | | | 105 | % | | | 76 | % | | | 81 | % | | | 93 | % |
a | Unaudited figures for the period ended March 31, 2023. Percentage amounts for the period, except total return and portfolio turnover rate, have been annualized. |
b | Net investment income (loss) per share was computed using average shares outstanding throughout the period. |
c | Total return does not reflect the impact of any applicable sales charges. |
d | Does not include expenses of the underlying funds in which the Fund invests. |
e | Net expense information reflects the expense ratios after expense waivers and reimbursements, as applicable. |
f | The portion of the ratios of net expenses to average net assets attributable to recoupments of prior fee reductions or expense reimbursements for the years presented was as follows: |
| 03/31/23a | 09/30/22 | 09/30/21 | 09/30/20 | 09/30/19 | 09/30/18 |
A-Class | — | — | — | — | — | — |
C-Class | — | — | — | 0.00%h | — | — |
P-Class | — | — | — | — | — | — |
Institutional Class | — | — | — | — | — | — |
g | Net expenses may include expenses that are excluded from the expense limitation agreement. Excluding these expenses, the net expense ratios for the years presented would be: |
| 03/31/23a | 09/30/22 | 09/30/21 | 09/30/20 | 09/30/19 | 09/30/18 |
A-Class | 1.17% | 1.19% | 1.20% | 1.21% | 1.21% | 1.20% |
C-Class | 1.92% | 1.95% | 1.95% | 1.96% | 1.96% | 1.95% |
P-Class | 1.17% | 1.19% | 1.20% | 1.21% | 1.21% | 1.20% |
Institutional Class | 0.92% | 0.94% | 0.95% | 0.96% | 0.96% | 0.95% |
SEE NOTES TO FINANCIAL STATEMENTS. | THE GUGGENHEIM FUNDS SEMI-ANNUAL REPORT | 43 |
PERFORMANCE REPORT AND FUND PROFILE (Unaudited) | March 31, 2023 |
RBP® LARGE-CAP VALUE FUND
OBJECTIVE: Seeks to provide investment results that, before fees and expenses, correspond generally to the total return performance of the Guggenheim RBP® Large-Cap Value IndexSM (the “Value Index” or “Index”).
Holdings Diversification (Market Exposure as % of Net Assets)

“Holdings Diversification (Market Exposure as % of Net Assets)” excludes any temporary cash investments.
Inception Dates: |
A-Class | April 18, 2011 |
C-Class | April 18, 2011 |
P-Class | April 18, 2011 |
Institutional Class | February 10, 2011 |
Ten Largest Holdings | (% of Total
Net Assets) |
iShares S&P 500 Value ETF | 2.4% |
Home Depot, Inc. | 2.4% |
Chevron Corp. | 2.4% |
Merck & Company, Inc. | 2.2% |
Exxon Mobil Corp. | 2.2% |
Walmart, Inc. | 2.0% |
Procter & Gamble Co. | 2.0% |
Walt Disney Co. | 1.9% |
Berkshire Hathaway, Inc. — Class B | 1.8% |
Abbott Laboratories | 1.7% |
Top Ten Total | 21.0% |
| | |
“Ten Largest Holdings” excludes any temporary cash investments. |
44 | THE GUGGENHEIM FUNDS SEMI-ANNUAL REPORT | |
PERFORMANCE REPORT AND FUND PROFILE (Unaudited)(concluded) | March 31, 2023 |
Average Annual Returns*
Periods Ended March 31, 2023
| 6 Month† | 1 Year | 5 Year | 10 Year |
A-Class Shares | 13.89% | (5.37%) | 5.64% | 8.36% |
A-Class Shares with sales charge‡ | 8.49% | (9.84%) | 4.61% | 7.71% |
C-Class Shares | 13.38% | (6.14%) | 4.84% | 7.56% |
C-Class Shares with CDSC§ | 12.38% | (7.05%) | 4.84% | 7.56% |
P-Class Shares | 13.87% | (5.34%) | 5.62% | 8.39% |
Institutional Class Shares | 14.01% | (5.16%) | 5.90% | 8.68% |
Guggenheim RBP Large-Cap Value IndexSM | 14.33% | (4.61%) | 6.83% | 9.84% |
Dow Jones U.S. Large-Cap Value Total Stock Market Index | 13.62% | (5.62%) | 7.45% | 9.29% |
* | The performance data above represents past performance that is not predictive of future results. The investment return and principal value of an investment in the Fund will fluctuate so that an investor’s shares, when redeemed, may be worth more or less than their original cost. Returns are historical and include changes in principal and reinvested dividends and capital gains and do not reflect the effect of taxes. The Dow Jones U.S. Large-Cap Value Total Stock Market Index and Guggenheim RBP Large-Cap Value IndexSM are unmanaged indices and, unlike the Fund, have no management fees or operating expenses to reduce their reported returns. |
** | F-1 Class shares redesignated as P-Class shares effective May 9, 2016. |
† | 6 month returns are not annualized. |
‡ | Effective May 9, 2016, the maximum sales charge decreased from 5.75% to 4.75%. A 5.75% maximum sales charge is used in the calculation of the average annual return since inception based on subscriptions made prior to May 9, 2016, and a 4.75% maximum sales charge will be used to calculate performance for periods based on subscriptions made on or after May 9, 2016. |
§ | Fund returns include a CDSC of 1% if redeemed within 12 months of purchase. |
| | THE GUGGENHEIM FUNDS SEMI-ANNUAL REPORT | 45 |
SCHEDULE OF INVESTMENTS (Unaudited) | March 31, 2023 |
RBP® LARGE-CAP VALUE FUND | |
| | Shares | | | Value | |
COMMON STOCKS† - 96.0% |
| | | | | | | | | |
Consumer, Non-cyclical - 22.3% |
Merck & Company, Inc. | | | 914 | | | $ | 97,240 | |
Procter & Gamble Co. | | | 588 | | | | 87,430 | |
Abbott Laboratories | | | 737 | | | | 74,629 | |
Philip Morris International, Inc. | | | 726 | | | | 70,604 | |
Bristol-Myers Squibb Co. | | | 992 | | | | 68,756 | |
Gilead Sciences, Inc. | | | 749 | | | | 62,145 | |
Becton Dickinson and Co. | | | 238 | | | | 58,914 | |
Automatic Data Processing, Inc. | | | 237 | | | | 52,763 | |
Amgen, Inc. | | | 210 | | | | 50,767 | |
Kroger Co. | | | 1,001 | | | | 49,419 | |
Constellation Brands, Inc. — Class A | | | 213 | | | | 48,114 | |
Johnson & Johnson | | | 308 | | | | 47,740 | |
Sysco Corp. | | | 608 | | | | 46,956 | |
Bunge Ltd. | | | 470 | | | | 44,894 | |
PepsiCo, Inc. | | | 213 | | | | 38,830 | |
AmerisourceBergen Corp. — Class A | | | 161 | | | | 25,778 | |
AbbVie, Inc. | | | 111 | | | | 17,690 | |
Coca-Cola Co. | | | 164 | | | | 10,173 | |
Pfizer, Inc. | | | 181 | | | | 7,385 | |
Keurig Dr Pepper, Inc. | | | 138 | | | | 4,869 | |
Total Consumer, Non-cyclical | | | | | | | 965,096 | |
| | | | | | | | | |
Financial - 21.0% |
Berkshire Hathaway, Inc. — Class B* | | | 248 | | | | 76,575 | |
Prologis, Inc. REIT | | | 561 | | | | 69,996 | |
Progressive Corp. | | | 414 | | | | 59,227 | |
Chubb Ltd. | | | 283 | | | | 54,953 | |
Cboe Global Markets, Inc. | | | 365 | | | | 48,998 | |
Ameriprise Financial, Inc. | | | 154 | | | | 47,201 | |
Everest Re Group Ltd. | | | 129 | | | | 46,185 | |
Travelers Companies, Inc. | | | 268 | | | | 45,938 | |
Crown Castle, Inc. REIT | | | 336 | | | | 44,970 | |
UDR, Inc. REIT | | | 1,082 | | | | 44,427 | |
Truist Financial Corp. | | | 1,290 | | | | 43,989 | |
Mid-America Apartment Communities, Inc. REIT | | | 286 | | | | 43,198 | |
American International Group, Inc. | | | 836 | | | | 42,101 | |
MetLife, Inc. | | | 699 | | | | 40,500 | |
JPMorgan Chase & Co. | | | 296 | | | | 38,572 | |
American Express Co. | | | 226 | | | | 37,279 | |
Globe Life, Inc. | | | 268 | | | | 29,485 | |
Hartford Financial Services Group, Inc. | | | 345 | | | | 24,043 | |
PNC Financial Services Group, Inc. | | | 141 | | | | 17,921 | |
Equity LifeStyle Properties, Inc. REIT | | | 240 | | | | 16,111 | |
Webster Financial Corp. | | | 325 | | | | 12,811 | |
Bank of America Corp. | | | 422 | | | | 12,069 | |
Intercontinental Exchange, Inc. | | | 60 | | | | 6,257 | |
First Republic Bank | | | 310 | | | | 4,337 | |
American Financial Group, Inc. | | | 12 | | | | 1,458 | |
Total Financial | | | | | | | 908,601 | |
| | | | | | | | | |
Industrial - 13.2% |
Caterpillar, Inc. | | | 297 | | | | 67,965 | |
Eaton Corporation plc | | | 352 | | | | 60,311 | |
TE Connectivity Ltd. | | | 415 | | | | 54,427 | |
Parker-Hannifin Corp. | | | 161 | | | | 54,114 | |
Northrop Grumman Corp. | | | 99 | | | | 45,710 | |
Jacobs Solutions, Inc. | | | 380 | | | | 44,654 | |
Keysight Technologies, Inc.* | | | 272 | | | | 43,923 | |
Regal Rexnord Corp. | | | 283 | | | | 39,827 | |
CSX Corp. | | | 1,225 | | | | 36,676 | |
Allegion plc | | | 323 | | | | 34,474 | |
Fortune Brands Innovations, Inc. | | | 568 | | | | 33,359 | |
Amphenol Corp. — Class A | | | 354 | | | | 28,929 | |
Republic Services, Inc. — Class A | | | 158 | | | | 21,365 | |
Masco Corp. | | | 91 | | | | 4,524 | |
Agilent Technologies, Inc. | | | 15 | | | | 2,075 | |
Total Industrial | | | | | | | 572,333 | |
| | | | | | | | | |
Consumer, Cyclical - 12.2% |
Home Depot, Inc. | | | 351 | | | | 103,587 | |
Walmart, Inc. | | | 599 | | | | 88,323 | |
General Motors Co. | | | 1,411 | | | | 51,756 | |
NIKE, Inc. — Class B | | | 414 | | | | 50,773 | |
Dollar Tree, Inc.* | | | 308 | | | | 44,213 | |
Target Corp. | | | 264 | | | | 43,726 | |
TJX Companies, Inc. | | | 525 | | | | 41,139 | |
Southwest Airlines Co. | | | 1,240 | | | | 40,350 | |
Alaska Air Group, Inc.* | | | 591 | | | | 24,798 | |
Advance Auto Parts, Inc. | | | 198 | | | | 24,079 | |
Starbucks Corp. | | | 124 | | | | 12,912 | |
Delta Air Lines, Inc.* | | | 60 | | | | 2,095 | |
Total Consumer, Cyclical | | | | | | | 527,751 | |
| | | | | | | | | |
Energy - 7.3% |
Chevron Corp. | | | 630 | | | | 102,791 | |
Exxon Mobil Corp. | | | 872 | | | | 95,623 | |
Pioneer Natural Resources Co. | | | 248 | | | | 50,652 | |
Marathon Petroleum Corp. | | | 242 | | | | 32,629 | |
Valero Energy Corp. | | | 172 | | | | 24,011 | |
Occidental Petroleum Corp. | | | 198 | | | | 12,361 | |
Total Energy | | | | | | | 318,067 | |
| | | | | | | | | |
Technology - 5.9% |
Applied Materials, Inc. | | | 536 | | | | 65,837 | |
Analog Devices, Inc. | | | 332 | | | | 65,477 | |
Microchip Technology, Inc. | | | 612 | | | | 51,273 | |
QUALCOMM, Inc. | | | 327 | | | | 41,719 | |
Electronic Arts, Inc. | | | 192 | | | | 23,126 | |
Marvell Technology, Inc. | | | 174 | | | | 7,534 | |
Total Technology | | | | | | | 254,966 | |
| | | | | | | | | |
Utilities - 5.9% |
Exelon Corp. | | | 1,223 | | | | 51,232 | |
NextEra Energy, Inc. | | | 662 | | | | 51,027 | |
FirstEnergy Corp. | | | 1,136 | | | | 45,508 | |
Evergy, Inc. | | | 727 | | | | 44,434 | |
American Electric Power Company, Inc. | | | 352 | | | | 32,029 | |
Duke Energy Corp. | | | 166 | | | | 16,014 | |
CenterPoint Energy, Inc. | | | 492 | | | | 14,494 | |
Total Utilities | | | | | | | 254,738 | |
46 | THE GUGGENHEIM FUNDS SEMI-ANNUAL REPORT | SEE NOTES TO FINANCIAL STATEMENTS. |
SCHEDULE OF INVESTMENTS (Unaudited)(concluded) | March 31, 2023 |
RBP® LARGE-CAP VALUE FUND | |
| | Shares | | | Value | |
| | | | | | | | | |
Communications - 4.9% |
Walt Disney Co.* | | | 844 | | | $ | 84,510 | |
AT&T, Inc. | | | 3,744 | | | | 72,072 | |
Comcast Corp. — Class A | | | 1,364 | | | | 51,709 | |
Omnicom Group, Inc. | | | 50 | | | | 4,717 | |
Total Communications | | | | | | | 213,008 | |
| | | | | | | | | |
Basic Materials - 3.3% |
DuPont de Nemours, Inc. | | | 650 | | | | 46,650 | |
FMC Corp. | | | 376 | | | | 45,921 | |
Mosaic Co. | | | 899 | | | | 41,246 | |
CF Industries Holdings, Inc. | | | 100 | | | | 7,249 | |
Total Basic Materials | | | | | | | 141,066 | |
| | | | | | | | | |
Total Common Stocks | | | | |
(Cost $4,003,413) | | | | | | | 4,155,626 | |
| | | | | | | | | |
EXCHANGE-TRADED FUNDS† - 2.4% |
iShares S&P 500 Value ETF | | | 688 | | | | 104,411 | |
Total Exchange-Traded Funds | | | | |
(Cost $101,550) | | | | | | | 104,411 | |
| | | | | | | | | |
Total Investments - 98.4% | | | | |
(Cost $4,104,963) | | $ | 4,260,037 | |
Other Assets & Liabilities, net - 1.6% | | | 67,896 | |
Total Net Assets - 100.0% | | $ | 4,327,933 | |
* | Non-income producing security. |
† | Value determined based on Level 1 inputs — See Note 4. |
| | plc — Public Limited Company |
| | REIT — Real Estate Investment Trust |
| | |
| | See Sector Classification in Other Information section. |
The following table summarizes the inputs used to value the Fund’s investments at March 31, 2023 (See Note 4 in the Notes to Financial Statements):
Investments in Securities (Assets) | | Level 1
Quoted
Prices | | | Level 2
Significant
Observable
Inputs | | | Level 3
Significant
Unobservable
Inputs | | | Total | |
Common Stocks | | $ | 4,155,626 | | | $ | — | | | $ | — | | | $ | 4,155,626 | |
Exchange-Traded Funds | | | 104,411 | | | | — | | | | — | | | | 104,411 | |
Total Assets | | $ | 4,260,037 | | | $ | — | | | $ | — | | | $ | 4,260,037 | |
SEE NOTES TO FINANCIAL STATEMENTS. | THE GUGGENHEIM FUNDS SEMI-ANNUAL REPORT | 47 |
RBP® LARGE-CAP VALUE FUND | |
STATEMENT OF ASSETS AND LIABILITIES (Unaudited) |
March 31, 2023 |
Assets: |
Investments, at value (cost $4,104,963) | | $ | 4,260,037 | |
Cash | | | 14,463 | |
Prepaid expenses | | | 49,217 | |
Receivables: |
Investment Adviser | | | 16,015 | |
Securities sold | | | 7,659 | |
Dividends | | | 3,388 | |
Total assets | | | 4,350,779 | |
| | | | | |
Liabilities: |
Payable for: |
Professional fees | | | 12,916 | |
Fund accounting and administration fees | | | 4,216 | |
Transfer agent fees | | | 2,109 | |
Printing fees | | | 1,562 | |
Distribution and service fees | | | 476 | |
Miscellaneous | | | 1,567 | |
Total liabilities | | | 22,846 | |
Net assets | | $ | 4,327,933 | |
| | | | | |
Net assets consist of: |
Paid in capital | | $ | 4,152,350 | |
Total distributable earnings (loss) | | | 175,583 | |
Net assets | | $ | 4,327,933 | |
| | | | | |
A-Class: |
Net assets | | $ | 425,555 | |
Capital shares outstanding | | | 42,588 | |
Net asset value per share | | $ | 9.99 | |
Maximum offering price per share (Net asset value divided by 95.25%) | | $ | 10.49 | |
| | | | | |
C-Class: |
Net assets | | $ | 334,075 | |
Capital shares outstanding | | | 33,974 | |
Net asset value per share | | $ | 9.83 | |
| | | | | |
P-Class: |
Net assets | | $ | 300,453 | |
Capital shares outstanding | | | 30,511 | |
Net asset value per share | | $ | 9.85 | |
| | | | | |
Institutional Class: |
Net assets | | $ | 3,267,850 | |
Capital shares outstanding | | | 317,646 | |
Net asset value per share | | $ | 10.29 | |
STATEMENT OF OPERATIONS (Unaudited) |
Six Months Ended March 31, 2023 |
Investment Income: |
Dividends (net of foreign withholding tax of $25) | | $ | 51,024 | |
Interest | | | 8 | |
Total investment income | | | 51,032 | |
| | | | | |
Expenses: |
Management fees | | | 16,223 | |
Distribution and service fees: |
A-Class | | | 662 | |
C-Class | | | 1,702 | |
P-Class | | | 350 | |
Transfer agent fees: |
A-Class | | | 1,407 | |
C-Class | | | 1,099 | |
P-Class | | | 1,049 | |
Institutional Class | | | 9,285 | |
Registration fees | | | 32,351 | |
Professional fees | | | 17,976 | |
Fund accounting and administration fees | | | 5,474 | |
Trustees’ fees* | | | 5,208 | |
Custodian fees | | | 1,624 | |
Line of credit fees | | | 70 | |
Miscellaneous | | | 5,409 | |
Total expenses | | | 99,889 | |
Less: Expenses reimbursed by Adviser: |
A-Class | | | (6,392 | ) |
C-Class | | | (4,804 | ) |
P-Class | | | (4,128 | ) |
Institutional Class | | | (44,729 | ) |
Expenses waived by Adviser | | | (16,894 | ) |
Earnings credit applied | | | (375 | ) |
Total waived/reimbursed expenses | | | 77,322 | |
Net expenses | | | 22,567 | |
Net investment income | | | 28,465 | |
| | | | | |
Net Realized and Unrealized Gain (Loss): |
Net realized gain (loss) on: |
Investments | | | 13,958 | |
Net realized gain | | | 13,958 | |
Net change in unrealized appreciation (depreciation) on: |
Investments | | | 494,764 | |
Net change in unrealized appreciation (depreciation) | | | 494,764 | |
Net realized and unrealized gain | | | 508,722 | |
Net increase in net assets resulting from operations | | $ | 537,187 | |
* | Relates to Trustees not deemed “interested persons” within the meaning of Section 2(a)(19) of the 1940 Act. |
48 | THE GUGGENHEIM FUNDS SEMI-ANNUAL REPORT | SEE NOTES TO FINANCIAL STATEMENTS. |
RBP® LARGE-CAP VALUE FUND | |
STATEMENTS OF CHANGES IN NET ASSETS |
| | Six Months Ended
March 31, 2023
(Unaudited) | | | Year Ended
September 30,
2022 | |
Increase (Decrease) in Net Assets from Operations: | | | | | | | | |
Net investment income | | $ | 28,465 | | | $ | 49,040 | |
Net realized gain on investments | | | 13,958 | | | | 143,975 | |
Net change in unrealized appreciation (depreciation) on investments | | | 494,764 | | | | (668,161 | ) |
Net increase (decrease) in net assets resulting from operations | | | 537,187 | | | | (475,146 | ) |
| | | | | | | | | |
Distributions to shareholders: | | | | | | | | |
A-Class | | | (14,416 | ) | | | (64,288 | ) |
C-Class | | | (10,493 | ) | | | (52,675 | ) |
P-Class | | | (8,672 | ) | | | (31,527 | ) |
Institutional Class | | | (116,795 | ) | | | (463,645 | ) |
Total distributions to shareholders | | | (150,376 | ) | | | (612,135 | ) |
| | | | | | | | | |
Capital share transactions: | | | | | | | | |
Proceeds from sale of shares | | | | | | | | |
A-Class | | | 13,425 | | | | 409,532 | |
C-Class | | | — | | | | 169,869 | |
P-Class | | | 47,756 | | | | 151,821 | |
Institutional Class | | | 195 | | | | 8,315 | |
Distributions reinvested | | | | | | | | |
A-Class | | | 14,416 | | | | 58,119 | |
C-Class | | | 10,493 | | | | 52,675 | |
P-Class | | | 8,513 | | | | 30,705 | |
Institutional Class | | | 116,795 | | | | 463,645 | |
Cost of shares redeemed | | | | | | | | |
A-Class | | | (85,607 | ) | | | (71,115 | ) |
C-Class | | | (30,920 | ) | | | (401,548 | ) |
P-Class | | | (7,627 | ) | | | (205,054 | ) |
Institutional Class | | | (1,844 | ) | | | (1,047 | ) |
Net increase from capital share transactions | | | 85,595 | | | | 665,917 | |
Net increase (decrease) in net assets | | | 472,406 | | | | (421,364 | ) |
| | | | | | | | | |
Net assets: | | | | | | | | |
Beginning of period | | | 3,855,527 | | | | 4,276,891 | |
End of period | | $ | 4,327,933 | | | $ | 3,855,527 | |
| | | | | | | | | |
Capital share activity: | | | | | | | | |
Shares sold | | | | | | | | |
A-Class | | | 1,292 | | | | 34,332 | |
C-Class | | | — | | | | 16,281 | |
P-Class | | | 4,766 | | | | 14,580 | |
Institutional Class | | | 19 | | | | 696 | |
Shares issued from reinvestment of distributions | | | | | | | | |
A-Class | | | 1,400 | | | | 5,327 | |
C-Class | | | 1,033 | | | | 4,855 | |
P-Class | | | 839 | | | | 2,854 | |
Institutional Class | | | 11,029 | | | | 41,176 | |
Shares redeemed | | | | | | | | |
A-Class | | | (8,291 | ) | | | (7,023 | ) |
C-Class | | | (3,127 | ) | | | (34,267 | ) |
P-Class | | | (764 | ) | | | (18,349 | ) |
Institutional Class | | | (185 | ) | | | (93 | ) |
Net increase in shares | | | 8,011 | | | | 60,369 | |
SEE NOTES TO FINANCIAL STATEMENTS. | THE GUGGENHEIM FUNDS SEMI-ANNUAL REPORT | 49 |
RBP® LARGE-CAP VALUE FUND | |
This table is presented to show selected data for a share outstanding throughout each period and to assist shareholders in evaluating a Fund’s performance for the periods presented.
A-Class | | Six Months Ended
March 31, 2023a | | | Year Ended
September 30,
2022 | | | Year Ended
September 30,
2021 | | | Year Ended
September 30,
2020 | | | Year Ended
September 30,
2019 | | | Year Ended
September 30,
2018 | |
Per Share Data |
Net asset value, beginning of period | | $ | 9.05 | | | $ | 11.69 | | | $ | 9.30 | | | $ | 10.28 | | | $ | 11.17 | | | $ | 11.12 | |
Income (loss) from investment operations: |
Net investment income (loss)b | | | .06 | | | | .11 | | | | .08 | | | | .15 | | | | .14 | | | | .10 | |
Net gain (loss) on investments (realized and unrealized) | | | 1.20 | | | | (1.11 | ) | | | 2.69 | | | | (.96 | ) | | | .01 | | | | 1.09 | |
Total from investment operations | | | 1.26 | | | | (1.00 | ) | | | 2.77 | | | | (.81 | ) | | | .15 | | | | 1.19 | |
Less distributions from: |
Net investment income | | | (.08 | ) | | | — | | | | (.38 | ) | | | (.11 | ) | | | (.06 | ) | | | (.20 | ) |
Net realized gains | | | (.24 | ) | | | (1.64 | ) | | | — | | | | (.06 | ) | | | (.98 | ) | | | (.94 | ) |
Total distributions | | | (.32 | ) | | | (1.64 | ) | | | (.38 | ) | | | (.17 | ) | | | (1.04 | ) | | | (1.14 | ) |
Net asset value, end of period | | $ | 9.99 | | | $ | 9.05 | | | $ | 11.69 | | | $ | 9.30 | | | $ | 10.28 | | | $ | 11.17 | |
|
Total Returnc | | | 13.89 | % | | | (11.02 | %) | | | 30.34 | % | | | (8.05 | %) | | | 2.53 | % | | | 11.36 | % |
Ratios/Supplemental Data |
Net assets, end of period (in thousands) | | $ | 426 | | | $ | 436 | | | $ | 182 | | | $ | 53 | | | $ | 86 | | | $ | 106 | |
Ratios to average net assets: |
Net investment income (loss) | | | 1.20 | % | | | 1.06 | % | | | 0.74 | % | | | 1.53 | % | | | 1.41 | % | | | 0.90 | % |
Total expensesd | | | 4.80 | % | | | 5.09 | % | | | 5.90 | % | | | 7.41 | % | | | 6.32 | % | | | 5.49 | % |
Net expensese,f,g | | | 1.19 | % | | | 1.20 | % | | | 1.20 | % | | | 1.21 | % | | | 1.22 | % | | | 1.21 | % |
Portfolio turnover rate | | | 34 | % | | | 73 | % | | | 132 | % | | | 95 | % | | | 101 | % | | | 104 | % |
C-Class | | Six Months Ended
March 31, 2023a | | | Year Ended
September 30,
2022 | | | Year Ended
September 30,
2021 | | | Year Ended
September 30,
2020 | | | Year Ended
September 30,
2019 | | | Year Ended
September 30,
2018 | |
Per Share Data |
Net asset value, beginning of period | | $ | 8.94 | | | $ | 11.79 | | | $ | 9.12 | | | $ | 10.14 | | | $ | 11.09 | | | $ | 10.98 | |
Income (loss) from investment operations: |
Net investment income (loss)b | | | .02 | | | | .02 | | | | — | | | | .07 | | | | .06 | | | | .01 | |
Net gain (loss) on investments (realized and unrealized) | | | 1.19 | | | | (1.08 | ) | | | 2.68 | | | | (.94 | ) | | | .02 | | | | 1.09 | |
Total from investment operations | | | 1.21 | | | | (1.06 | ) | | | 2.68 | | | | (.87 | ) | | | .08 | | | | 1.10 | |
Less distributions from: |
Net investment income | | | (.08 | ) | | | (.15 | ) | | | (.01 | ) | | | (.09 | ) | | | (.05 | ) | | | (.05 | ) |
Net realized gains | | | (.24 | ) | | | (1.64 | ) | | | — | | | | (.06 | ) | | | (.98 | ) | | | (.94 | ) |
Total distributions | | | (.32 | ) | | | (1.79 | ) | | | (.01 | ) | | | (.15 | ) | | | (1.03 | ) | | | (.99 | ) |
Net asset value, end of period | | $ | 9.83 | | | $ | 8.94 | | | $ | 11.79 | | | $ | 9.12 | | | $ | 10.14 | | | $ | 11.09 | |
|
Total Returnc | | | 13.38 | % | | | (11.65 | %) | | | 29.41 | % | | | (8.80 | %) | | | 1.81 | % | | | 10.54 | % |
Ratios/Supplemental Data |
Net assets, end of period (in thousands) | | $ | 334 | | | $ | 322 | | | $ | 580 | | | $ | 447 | | | $ | 317 | | | $ | 516 | |
Ratios to average net assets: |
Net investment income (loss) | | | 0.43 | % | | | 0.21 | % | | | 0.04 | % | | | 0.79 | % | | | 0.65 | % | | | 0.14 | % |
Total expensesd | | | 5.54 | % | | | 5.71 | % | | | 6.52 | % | | | 7.99 | % | | | 6.75 | % | | | 6.14 | % |
Net expensese,f,g | | | 1.94 | % | | | 1.95 | % | | | 1.95 | % | | | 1.96 | % | | | 1.97 | % | | | 1.96 | % |
Portfolio turnover rate | | | 34 | % | | | 73 | % | | | 132 | % | | | 95 | % | | | 101 | % | | | 104 | % |
50 | THE GUGGENHEIM FUNDS SEMI-ANNUAL REPORT | SEE NOTES TO FINANCIAL STATEMENTS. |
RBP® LARGE-CAP VALUE FUND | |
FINANCIAL HIGHLIGHTS (continued) |
This table is presented to show selected data for a share outstanding throughout each period and to assist shareholders in evaluating a Fund’s performance for the periods presented.
P-Class | | Six Months Ended
March 31, 2023a | | | Year Ended
September 30,
2022 | | | Year Ended
September 30,
2021 | | | Year Ended
September 30,
2020 | | | Year Ended
September 30,
2019 | | | Year Ended
September 30,
2018 | |
Per Share Data |
Net asset value, beginning of period | | $ | 8.92 | | | $ | 11.59 | | | $ | 9.28 | | | $ | 10.33 | | | $ | 11.25 | | | $ | 11.12 | |
Income (loss) from investment operations: |
Net investment income (loss)b | | | .06 | | | | .11 | | | | .08 | | | | .15 | | | | .14 | | | | .10 | |
Net gain (loss) on investments (realized and unrealized) | | | 1.19 | | | | (1.09 | ) | | | 2.67 | | | | (.96 | ) | | | — | | | | 1.10 | |
Total from investment operations | | | 1.25 | | | | (.98 | ) | | | 2.75 | | | | (.81 | ) | | | .14 | | | | 1.20 | |
Less distributions from: |
Net investment income | | | (.08 | ) | | | (.05 | ) | | | (.44 | ) | | | (.18 | ) | | | (.08 | ) | | | (.13 | ) |
Net realized gains | | | (.24 | ) | | | (1.64 | ) | | | — | | | | (.06 | ) | | | (.98 | ) | | | (.94 | ) |
Total distributions | | | (.32 | ) | | | (1.69 | ) | | | (.44 | ) | | | (.24 | ) | | | (1.06 | ) | | | (1.07 | ) |
Net asset value, end of period | | $ | 9.85 | | | $ | 8.92 | | | $ | 11.59 | | | $ | 9.28 | | | $ | 10.33 | | | $ | 11.25 | |
|
Total Return | | | 13.87 | % | | | (10.94 | %) | | | 30.31 | % | | | (8.10 | %) | | | 2.47 | % | | | 11.40 | % |
Ratios/Supplemental Data |
Net assets, end of period (in thousands) | | $ | 300 | | | $ | 229 | | | $ | 308 | | | $ | 114 | | | $ | 405 | | | $ | 577 | |
Ratios to average net assets: |
Net investment income (loss) | | | 1.20 | % | | | 1.01 | % | | | 0.75 | % | | | 1.49 | % | | | 1.41 | % | | | 0.90 | % |
Total expensesd | | | 4.92 | % | | | 5.11 | % | | | 5.74 | % | | | 7.18 | % | | | 6.07 | % | | | 5.37 | % |
Net expensese,f,g | | | 1.19 | % | | | 1.20 | % | | | 1.20 | % | | | 1.21 | % | | | 1.22 | % | | | 1.21 | % |
Portfolio turnover rate | | | 34 | % | | | 73 | % | | | 132 | % | | | 95 | % | | | 101 | % | | | 104 | % |
SEE NOTES TO FINANCIAL STATEMENTS. | THE GUGGENHEIM FUNDS SEMI-ANNUAL REPORT | 51 |
RBP® LARGE-CAP VALUE FUND | |
FINANCIAL HIGHLIGHTS (concluded) |
This table is presented to show selected data for a share outstanding throughout each period and to assist shareholders in evaluating a Fund’s performance for the periods presented.
Institutional Class | | Six Months Ended
March 31, 2023a | | | Year Ended
September 30,
2022 | | | Year Ended
September 30,
2021 | | | Year Ended
September 30,
2020 | | | Year Ended
September 30,
2019 | | | Year Ended
September 30,
2018 | |
Per Share Data |
Net asset value, beginning of period | | $ | 9.35 | | | $ | 12.10 | | | $ | 9.40 | | | $ | 10.42 | | | $ | 11.35 | | | $ | 11.22 | |
Income (loss) from investment operations: |
Net investment income (loss)b | | | .07 | | | | .14 | | | | .12 | | | | .17 | | | | .17 | | | | .13 | |
Net gain (loss) on investments (realized and unrealized) | | | 1.26 | | | | (1.15 | ) | | | 2.74 | | | | (.97 | ) | | | — | | | | 1.11 | |
Total from investment operations | | | 1.33 | | | | (1.01 | ) | | | 2.86 | | | | (.80 | ) | | | .17 | | | | 1.24 | |
Less distributions from: |
Net investment income | | | (.15 | ) | | | (.10 | ) | | | (.16 | ) | | | (.16 | ) | | | (.12 | ) | | | (.17 | ) |
Net realized gains | | | (.24 | ) | | | (1.64 | ) | | | — | | | | (.06 | ) | | | (.98 | ) | | | (.94 | ) |
Total distributions | | | (.39 | ) | | | (1.74 | ) | | | (.16 | ) | | | (.22 | ) | | | (1.10 | ) | | | (1.11 | ) |
Net asset value, end of period | | $ | 10.29 | | | $ | 9.35 | | | $ | 12.10 | | | $ | 9.40 | | | $ | 10.42 | | | $ | 11.35 | |
|
Total Return | | | 14.01 | % | | | (10.73 | %) | | | 30.72 | % | | | (7.92 | %) | | | 2.77 | % | | | 11.69 | % |
Ratios/Supplemental Data |
Net assets, end of period (in thousands) | | $ | 3,268 | | | $ | 2,868 | | | $ | 3,207 | | | $ | 2,437 | | | $ | 2,701 | | | $ | 2,915 | |
Ratios to average net assets: |
Net investment income (loss) | | | 1.44 | % | | | 1.24 | % | | | 1.04 | % | | | 1.78 | % | | | 1.66 | % | | | 1.14 | % |
Total expensesd | | | 4.47 | % | | | 4.69 | % | | | 5.49 | % | | | 6.86 | % | | | 5.80 | % | | | 5.07 | % |
Net expensese,f,g | | | 0.94 | % | | | 0.95 | % | | | 0.95 | % | | | 0.96 | % | | | 0.97 | % | | | 0.96 | % |
Portfolio turnover rate | | | 34 | % | | | 73 | % | | | 132 | % | | | 95 | % | | | 101 | % | | | 104 | % |
a | Unaudited figures for the period ended March 31, 2023. Percentage amounts for the period, except total return and portfolio turnover rate, have been annualized. |
b | Net investment income (loss) per share was computed using average shares outstanding throughout the period. |
c | Total return does not reflect the impact of any applicable sales charges. |
d | Does not include expenses of the underlying funds in which the Fund invests. |
e | Net expense information reflects the expense ratios after expense waivers and reimbursements, as applicable. |
f | The portion of the ratios of net expenses to average net assets attributable to recoupments of prior fee reductions or expense reimbursements for the years presented was as follows: |
| | | 03/31/23a | 09/30/22 | 09/30/21 | 09/30/20 | 09/30/19 | 9/30/18 |
| | A-Class | — | — | — | — | — | — |
| | C-Class | — | — | — | 0.01% | — | — |
| | P-Class | — | — | — | 0.00% h | — | — |
| | Institutional Class | — | — | — | 0.01% | — | — |
g | Net expenses may include expenses that are excluded from the expense limitation agreement. Excluding these expenses, the net expense ratios for the years presented would be: |
| | | 03/31/23a | 09/30/22 | 09/30/21 | 09/30/20 | 09/30/19 | 9/30/18 |
| | A-Class | 1.19% | 1.19% | 1.20% | 1.21% | 1.21% | 1.20% |
| | C-Class | 1.94% | 1.94% | 1.95% | 1.96% | 1.96% | 1.95% |
| | P-Class | 1.19% | 1.19% | 1.20% | 1.21% | 1.20% | 1.20% |
| | Institutional Class | 0.94% | 0.94% | 0.95% | 0.96% | 0.96% | 0.95% |
52 | THE GUGGENHEIM FUNDS SEMI-ANNUAL REPORT | SEE NOTES TO FINANCIAL STATEMENTS. |
NOTES TO FINANCIAL STATEMENTS (Unaudited) |
Note 1 – Organization and Significant Accounting Policies
Organization
Transparent Value Trust (the “Trust”), a Delaware statutory trust, is registered with the U.S. Securities and Exchange Commission (the “SEC”) under the Investment Company Act of 1940 (“1940 Act”), as an open-ended investment company of the series type. Each series, in effect, is representing a separate fund (each, a “Fund”). The Trust may issue an unlimited number of authorized shares. The Trust accounts for the assets of each fund separately.
The Trust offers a combination of four separate classes of shares: A-Class shares, C-Class shares, P-Class shares and Institutional Class shares. Sales of shares of each Class are made without a front-end sales charge at the net asset value per share (“NAV”), with the exception of A-Class shares. A-Class shares are sold at the NAV, plus the applicable front-end sales charge. The sales charge varies depending on the amount purchased, but will not exceed 4.75%. A-Class share purchases of $1 million or more are exempt from the front-end sales charge but have a 1.25% contingent deferred sales charge (“CDSC”), if shares are redeemed within 18 months of purchase. C-Class shares have a 1% CDSC if shares are redeemed within 12 months of purchase. C-Class shares of each Fund automatically convert to A-Class shares of the same Fund on or about the 10th day of the month following the 8-year anniversary of the purchase of the C-Class shares. This conversion will be executed without any sales charge, fee or other charge. After the conversion is completed, the shares will be subject to all features and expenses of A-Class shares. Institutional Class shares are offered primarily for direct investment by institutions such as pension and profit sharing plans, endowments, foundations and corporations. Institutional Class shares require a minimum initial investment of $2 million and a minimum account balance of $1 million. At March 31, 2023, the Trust consisted of five funds.
This report covers the following funds (collectively, the “Funds”):
Fund Name | Investment
Company Type |
Directional Allocation Fund | Diversified |
RBP® Dividend Fund | Diversified |
RBP® Large-Cap Defensive Fund | Diversified |
RBP® Large-Cap Market Fund | Diversified |
RBP® Large-Cap Value Fund | Diversified |
The Funds’ investment objectives are to provide investment results that, before fees and expenses, correspond generally to the total return performance of the Index as follows:
Fund | Index |
Directional Allocation Fund | Guggenheim Directional Allocation IndexSM |
RBP® Dividend Fund | Guggenheim RBP® Dividend IndexSM |
RBP® Large-Cap Defensive Fund | Guggenheim RBP® Large-Cap Defensive IndexSM |
RBP® Large-Cap Market Fund | Guggenheim RBP® Large-Cap Market IndexSM |
RBP® Large-Cap Value Fund | Guggenheim RBP® Large-Cap Value IndexSM |
Guggenheim Partners Investment Management, LLC (“GPIM” or the “Adviser”), which operates under the name Guggenheim Investments (“GI”), provides advisory services. Guggenheim Funds Distributors, LLC (“GFD”) acts as principal underwriter for the Trust. GPIM and GFD are affiliated entities.
Significant Accounting Policies
The Funds operate as investment companies and, accordingly, follow the investment company accounting and reporting guidance of the Financial Accounting Standards Board (“FASB”) Accounting Standards Codification Topic 946 Financial Services – Investment Companies.
The following significant accounting policies are in conformity with U.S. generally accepted accounting principles (“U.S. GAAP”) and are consistently followed by the Trust. This requires management to make estimates and assumptions that affect the reported amount of assets and liabilities, contingent assets and liabilities at the date of the financial statements, and the reported amounts of revenues and expenses during the reporting period. Actual results could differ from these estimates. All time references are based on Eastern Time.
The NAV of each Class of a fund is calculated by dividing the market value of a fund’s securities and other assets, less all liabilities, attributable to the Class by the number of outstanding shares of the Class.
| | THE GUGGENHEIM FUNDS SEMI-ANNUAL REPORT | 53 |
NOTES TO FINANCIAL STATEMENTS (Unaudited)(continued) |
(a) Valuation of Investments
The Board of Trustees of the Funds (the “Board”) has adopted policies and procedures for the valuation of the Funds’ investments (the “Valuation Procedures”). The SEC adopted Rule 2a-5 under the 1940 Act (“Rule 2a-5”) which establishes requirements for determining fair value in good faith and became effective September 8, 2022. Rule 2a-5 also defines “readily available market quotations” for purposes of the 1940 Act and establishes requirements for determining whether a fund must fair value a security in good faith.
Pursuant to Rule 2a-5, the Board has designated the Adviser as the valuation designee to perform fair valuation determinations for the Funds with respect to all Fund investments and other assets. As the Funds’ valuation designee pursuant to Rule 2a-5, the Adviser has adopted separate procedures (the “Valuation Designee Procedures”) reasonably designed to prevent violations of the requirements of Rule 2a-5 and Rule 31a-4. The Adviser, in its role as valuation designee, utilizes the assistance of a valuation committee, consisting of representatives from Guggenheim’s investment management, fund administration, legal and compliance departments (the “Valuation Committee”), in determining the fair value of the Funds’ securities and other assets.
Valuations of the Funds’ securities and other assets are supplied primarily by pricing services appointed pursuant to the processes set forth in the Valuation Procedures. The Adviser, with the assistance of the Valuation Committee, convenes monthly, or more frequently as needed, to review the valuation of all assets which have been fair valued for reasonableness. The Adviser, consistent with the monitoring and review responsibilities set forth in the Valuation Designee Procedures, regularly reviews the appropriateness of the inputs, methods, models and assumptions employed by the pricing services. If the pricing service cannot or does not provide a valuation for a particular investment or such valuation is deemed unreliable, the investment is fair valued by the Adviser.
Equity securities listed or traded on a recognized U.S. securities exchange or the National Association of Securities Dealers Automated Quotations (“NASDAQ”) National Market System shall generally be valued on the basis of the last sale price on the primary U.S. exchange or market on which the security is listed or traded; provided, however, that securities listed on NASDAQ will be valued at the NASDAQ official closing price, which may not necessarily represent the last sale price.
Open-end investment companies are valued at their NAV as of the close of business, on the valuation date. Exchange-traded funds are generally valued at the last quoted sale price.
Investments for which market quotations are not readily available are fair valued as determined in good faith by the Adviser. Valuations in accordance with these methods are intended to reflect each security’s (or asset’s or liability’s) “fair value”. Each such determination is based on a consideration of all relevant factors, which are likely to vary from one pricing context to another. Examples of such factors may include, but are not limited to market prices; sale prices; broker quotes; and models which derive prices based on inputs such as prices of securities with comparable maturities and characteristics, or based on inputs such as anticipated cash flows or collateral, spread over U.S. Treasury securities, and other information analysis.
(b) Foreign Taxes
The Funds may be subject to foreign taxes (a portion of which may be reclaimable) on income, stock dividends, capital gains on investments or certain foreign currency transactions. All foreign taxes are recorded in accordance with the applicable foreign tax regulations and rates that exist in the foreign jurisdictions in which the Funds invest. These foreign taxes, if any, are paid by the Funds and reflected in their Statements of Operations as follows: foreign taxes withheld at source are presented as a reduction of income and foreign taxes on capital gains from sales of investments are included with the net realized gain (loss) on investments. Foreign taxes payable or deferred as of March 31, 2023, if any, are disclosed in the Funds’ Statements of Assets and Liabilities.
(c) Security Transactions
Security transactions are recorded on the trade date for financial reporting purposes. Realized gains and losses from securities transactions are recorded using the identified cost basis. Proceeds from lawsuits related to investment holdings are recorded as a reduction to cost if the securities are still held and as realized gains if no longer held in the respective Fund. Dividend income is recorded on the ex-dividend date, net of applicable taxes withheld by foreign countries, if any. Taxable non-cash dividends are recorded as dividend income. Interest income, including amortization of premiums and accretion of discounts, is accrued on a daily basis. Dividend income from Real Estate Investment Trusts (“REITs”) is recorded based on the income included in the distributions received from the REIT investments using published REIT classifications, including some management estimates when actual amounts are not available. Distributions received in excess of this estimated amount are recorded as a reduction of the cost of investments or reclassified to realized gains. The actual amounts of income, return of capital, and realized gains are only determined by each REIT after its fiscal year-end, and may differ from the estimated amounts.
54 | THE GUGGENHEIM FUNDS SEMI-ANNUAL REPORT | |
NOTES TO FINANCIAL STATEMENTS (Unaudited)(continued) |
(d) Distributions
Distributions of net investment income and net realized gains, if any, are declared and paid at least annually. Dividends are reinvested in additional shares, unless shareholders request payment in cash. Distributions are recorded on the ex-dividend date and are determined in accordance with U.S. federal income tax regulations which may differ from U.S. GAAP.
(e) Class Allocations
Interest and dividend income, most expenses, all realized gains and losses, and all unrealized appreciation and depreciation are allocated to the classes based upon the value of the outstanding shares in each Class. Certain costs, such as distribution and service fees are charged directly to specific classes. In addition, certain expenses have been allocated to the individual Funds in the Trust based on the respective net assets of each Fund included in the Trust.
(f) Earnings Credits
Under the fee arrangement with the custodian, the Fund may earn credits based on overnight custody cash balances. These credits are utilized to reduce related custodial expenses. The custodian fees disclosed in the Statements of Operations are before the reduction in expense from the related earnings credits, if any. Earnings credits for the period ended March 31, 2023 are disclosed in the Statements of Operations.
(g) Cash
The Funds may leave cash overnight in their cash account with the custodian. Periodically, a Fund may have cash due to the custodian bank as an overdraft balance. A fee is incurred on this overdraft, calculated by multiplying the overdraft by a rate based on the federal funds rate, which was 4.83% at March 31, 2023.
(h) Indemnifications
Under the Funds’ organizational documents, the Trustees and Officers are indemnified against certain liabilities arising out of the performance of their duties to the Trust. In addition, throughout the normal course of business, the Funds enter into contracts that contain a variety of representations and warranties which provide general indemnifications. The Funds’ maximum exposure under these arrangements is unknown, as this would involve future claims that may be made against the Funds and/or their affiliates that have not yet occurred. However, based on experience, the Funds expect the risk of loss to be remote.
Note 2 – Investment Advisory Agreement and Other Agreements
Under the terms of an investment advisory contract, the Funds pay GI investment advisory fees calculated at the annualized rates below, based on the average daily net assets of the Funds:
Fund | Management Fees
(as a % of Net Assets) |
Directional Allocation Fund | 0.95% |
RBP® Dividend Fund | 0.75% |
RBP® Large-Cap Defensive Fund | 0.75% |
RBP® Large-Cap Market Fund | 0.75% |
RBP® Large-Cap Value Fund | 0.75% |
GI pays operating expenses on behalf of the Trust, such as audit and accounting related services, legal services, custody, printing and mailing, among others, on a pass-through basis. Such expenses are allocated to various Funds within the complex based on relative net assets.
The Trust has adopted Distribution Plans related to the offering of A-Class, C-Class and P-Class shares pursuant to Rule 12b-1 under the 1940 Act. The plans provide for payments at an annual rate of 0.25% of the average daily net assets of each Fund’s A-Class and P-Class shares, and 1.00% of the average daily net assets of each Fund’s C-Class shares.
| | THE GUGGENHEIM FUNDS SEMI-ANNUAL REPORT | 55 |
NOTES TO FINANCIAL STATEMENTS (Unaudited)(continued) |
Contractual expense limitation agreements for the following Funds provide that the total expenses be limited to a percentage of average net assets for each class of shares, exclusive of brokerage costs, dividends or interest on securities sold short, expenses of other investment companies in which a Fund invests, interest, taxes, litigation, indemnification and extraordinary expenses. The limits are listed below:
Fund | | Limit | | | Effective
Date | | | Contract
End Date | |
Directional Allocation Fund – A-Class | | | 1.50 | % | | | 05/09/16 | | | | 02/01/24 | |
Directional Allocation Fund – C-Class | | | 2.10 | % | | | 05/09/16 | | | | 02/01/24 | |
Directional Allocation Fund – P-Class | | | 1.35 | % | | | 05/09/16 | | | | 02/01/24 | |
Directional Allocation Fund – Institutional Class | | | 1.10 | % | | | 05/09/16 | | | | 02/01/24 | |
RBP® Dividend Fund – A-Class | | | 1.20 | % | | | 05/09/16 | | | | 02/01/24 | |
RBP® Dividend Fund – C-Class | | | 1.95 | % | | | 05/09/16 | | | | 02/01/24 | |
RBP® Dividend Fund – P-Class | | | 1.20 | % | | | 05/09/16 | | | | 02/01/24 | |
RBP® Dividend Fund – Institutional Class | | | 0.95 | % | | | 05/09/16 | | | | 02/01/24 | |
RBP® Large-Cap Defensive Fund – A-Class | | | 1.20 | % | | | 05/09/16 | | | | 02/01/24 | |
RBP® Large-Cap Defensive Fund – C-Class | | | 1.95 | % | | | 05/09/16 | | | | 02/01/24 | |
RBP® Large-Cap Defensive Fund – P-Class | | | 1.20 | % | | | 05/09/16 | | | | 02/01/24 | |
RBP® Large-Cap Defensive Fund – Institutional Class | | | 0.95 | % | | | 05/09/16 | | | | 02/01/24 | |
RBP® Large-Cap Market Fund – A-Class | | | 1.20 | % | | | 05/09/16 | | | | 02/01/24 | |
RBP® Large-Cap Market Fund – C-Class | | | 1.95 | % | | | 05/09/16 | | | | 02/01/24 | |
RBP® Large-Cap Market Fund – P-Class | | | 1.20 | % | | | 05/09/16 | | | | 02/01/24 | |
RBP® Large-Cap Market Fund – Institutional Class | | | 0.95 | % | | | 05/09/16 | | | | 02/01/24 | |
RBP® Large-Cap Value Fund – A-Class | | | 1.20 | % | | | 05/09/16 | | | | 02/01/24 | |
RBP® Large-Cap Value Fund – C-Class | | | 1.95 | % | | | 05/09/16 | | | | 02/01/24 | |
RBP® Large-Cap Value Fund – P-Class | | | 1.20 | % | | | 05/09/16 | | | | 02/01/24 | |
RBP® Large-Cap Value Fund – Institutional Class | | | 0.95 | % | | | 05/09/16 | | | | 02/01/24 | |
GPIM is entitled to reimbursement by the Fund for fees waived or expenses reimbursed during any of the previous 36 months, beginning on the date of the expense limitation agreement, if on any day the estimated operating expenses are less than the indicated percentages. For purposes of this arrangement, GPIM is entitled to recoupment of previously waived fees or reimbursed expenses for 36 months from the date of the waiver or reimbursement by GPIM. At March 31, 2023, the amount of fees waived or expenses reimbursed that are subject to recoupment and will expire during the years ended September 30, are presented in the following table:
Fund | | 2023 | | | 2024 | | | 2025 | | | 2026 | | | Fund
Total | |
Directional Allocation Fund | | | | | | | | | | | | | | | | | | | | |
A-Class | | $ | — | | | $ | — | | | $ | 106,248 | | | $ | 54,403 | | | $ | 160,651 | |
C-Class | | | 65,306 | | | | 53,621 | | | | 43,415 | | | | 9,834 | | | | 172,176 | |
P-Class | | | 5,077 | | | | 3,842 | | | | 6,545 | | | | 3,004 | | | | 18,468 | |
Institutional Class | | | 100,718 | | | | 89,377 | | | | 123,748 | | | | 49,565 | | | | 363,408 | |
RBP® Dividend Fund | | | | | | | | | | | | | | | | | | | | |
A-Class | | | 30,576 | | | | 63,294 | | | | 83,754 | | | | 40,382 | | | | 218,006 | |
C-Class | | | 23,202 | | | | 24,180 | | | | 10,456 | | | | 3,947 | | | | 61,785 | |
P-Class | | | 7,559 | | | | 11,082 | | | | 9,488 | | | | 4,032 | | | | 32,161 | |
Institutional Class | | | 42,336 | | | | 60,349 | | | | 65,409 | | | | 31,031 | | | | 199,125 | |
RBP® Large-Cap Defensive Fund | | | | | | | | | | | | | | | | | | | | |
A-Class | | | 35,325 | | | | 61,062 | | | | 71,145 | | | | 29,344 | | | | 196,876 | |
C-Class | | | 26,254 | | | | 31,745 | | | | 23,681 | | | | 5,921 | | | | 87,601 | |
P-Class | | | 3,416 | | | | 5,214 | | | | 5,721 | | | | 3,236 | | | | 17,587 | |
Institutional Class | | | 50,214 | | | | 69,291 | | | | 68,426 | | | | 43,635 | | | | 231,566 | |
RBP® Large-Cap Market Fund | | | | | | | | | | | | | | | | | | | | |
A-Class | | | 45,481 | | | | 73,546 | | | | 89,424 | | | | 42,647 | | | | 251,098 | |
C-Class | | | 50,113 | | | | 56,833 | | | | 32,742 | | | | 12,085 | | | | 151,773 | |
P-Class | | | 1,501 | | | | 2,307 | | | | 2,307 | | | | 1,176 | | | | 7,291 | |
Institutional Class | | | 21,101 | | | | 28,915 | | | | 44,240 | | | | 21,665 | | | | 115,921 | |
RBP® Large-Cap Value Fund | | | | | | | | | | | | | | | | | | | | |
A-Class | | | 4,931 | | | | 4,788 | | | | 15,763 | | | | 8,089 | | | | 33,571 | |
C-Class | | | 21,651 | | | | 25,211 | | | | 17,685 | | | | 6,080 | | | | 70,627 | |
P-Class | | | 11,499 | | | | 9,157 | | | | 9,701 | | | | 5,178 | | | | 35,535 | |
Institutional Class | | | 137,090 | | | | 136,588 | | | | 123,927 | | | | 56,929 | | | | 454,534 | |
56 | THE GUGGENHEIM FUNDS SEMI-ANNUAL REPORT | |
NOTES TO FINANCIAL STATEMENTS (Unaudited)(continued) |
For the period ended March 31, 2023, GI recouped amounts from the Funds as follows:
Directional Allocation Fund | | $ | 69,602 | |
For the period ended March 31, 2023, GFD retained sales charges of $4,925 relating to sales of A-Class shares of the Trust.
Certain trustees and officers of the Trust are also officers of GI and/or GFD. The Trust does not compensate its officers or trustees who are officers, directors and/or employees of GI or GFD.
MUFG Investor Services (US), LLC (“MUIS”) acts as the Funds’ administrator, transfer agent and accounting agent. As administrator, transfer agent and accounting agent, MUIS maintains the books and records of the Funds’ securities and cash. The Bank of New York Mellon Corp. (“BNY”) acts as the Funds’ custodian. As custodian, BNY is responsible for the custody of the Funds’ assets. For providing the aforementioned administrative and accounting services, MUIS is entitled to receive a monthly fee equal to a percentage of the Funds’ average daily net assets and out of pocket expenses. For providing the aforementioned transfer agent and custodian services, MUIS and BNY are entitled to receive a monthly fee based on the number of transactions during the month and the number of accounts under management, subject to certain minimum monthly fees, and out of pocket expenses.
Note 3 – Federal Income Tax Information
The Funds intend to comply with the provisions of Subchapter M of the Internal Revenue Code applicable to regulated investment companies and will distribute substantially all taxable net investment income and capital gains sufficient to relieve the Funds from all, or substantially all, federal income, excise and state income taxes. Therefore, no provision for federal or state income tax or federal excise tax is required.
Tax positions taken or expected to be taken in the course of preparing the Funds’ tax returns are evaluated to determine whether the tax positions are “more-likely-than-not” of being sustained by the applicable tax authority. Tax positions not deemed to meet the more-likely-than-not threshold would be recorded as a tax benefit or expense in the current year. Management has analyzed the Funds’ tax positions taken, or to be taken, on U.S. federal income tax returns for all open tax years, and has concluded that no provision for income tax is required in the Funds’ financial statements. The Funds’ U.S. federal income tax returns are subject to examination by the Internal Revenue Service (“IRS”) for a period of three years after they are filed.
At March 31, 2023, the cost of investments for U.S. federal income tax purposes, the aggregate gross unrealized appreciation for all investments for which there was an excess of value over tax cost, and the aggregate gross unrealized depreciation for all investments for which there was an excess of tax cost over value, were as follows:
Fund | | Tax Cost | | | Tax Unrealized
Appreciation | | | Tax Unrealized
Depreciation | | | Net Tax Unrealized
Appreciation
(Depreciation) | |
Directional Allocation Fund | | $ | 222,878,786 | | | $ | — | | | $ | (15,139 | ) | | $ | (15,139 | ) |
RBP® Dividend Fund | | | 17,374,119 | | | | 953,423 | | | | (915,920 | ) | | | 37,503 | |
RBP® Large-Cap Defensive Fund | | | 7,411,198 | | | | 547,667 | | | | (338,241 | ) | | | 209,426 | |
RBP® Large-Cap Market Fund | | | 10,587,398 | | | | 824,900 | | | | (415,933 | ) | | | 408,967 | |
RBP® Large-Cap Value Fund | | | 4,109,133 | | | | 363,132 | | | | (212,228 | ) | | | 150,904 | |
Note 4 – Fair Value Measurement
In accordance with U.S. GAAP, fair value is defined as the price that the Funds would receive to sell an investment or pay to transfer a liability in an orderly transaction between market participants at the measurement date. U.S. GAAP establishes a three-tier fair value hierarchy based on the types of inputs used to value assets and liabilities and requires corresponding disclosure. The hierarchy and the corresponding inputs are summarized below:
Level 1 — | unadjusted quoted prices in active markets for identical assets or liabilities. |
| | THE GUGGENHEIM FUNDS SEMI-ANNUAL REPORT | 57 |
NOTES TO FINANCIAL STATEMENTS (Unaudited)(continued) |
Level 2 — | significant other observable inputs (for example quoted prices for securities that are similar based on characteristics such as interest rates, prepayment speeds, credit risk, etc.). |
Level 3 — | significant unobservable inputs based on the best information available under the circumstances, to the extent observable inputs are not available, which may include assumptions. |
Rule 2a-5 sets forth a definition of “readily available market quotations,” which is consistent with the definition of a Level 1 input under U.S. GAAP. Rule 2a-5 provides that “a market quotation is readily available only when that quotation is a quoted price (unadjusted) in active markets for identical investments that the fund can access at the measurement date, provided that a quotation will not be readily available if it is not reliable.”
Securities for which market quotations are not readily available must be valued at fair value as determined in good faith. Accordingly, any security priced using inputs other than Level 1 inputs will be subject to fair value requirements. The types of inputs available depend on a variety of factors, such as the type of security and the characteristics of the markets in which it trades, if any. Fair valuation determinations that rely on fewer or no observable inputs require greater judgment. Accordingly, fair value determinations for Level 3 securities require the greatest amount of judgment.
The inputs or methodologies selected and applied for valuing securities are not necessarily an indication of the risk associated with investing in those securities. The suitability, appropriateness and accuracy of the techniques, methodologies and sources employed to determine fair valuation are periodically reviewed and subject to change.
Note 5 – Securities Transactions
For the period ended March 31, 2023, the cost of purchases and proceeds from sales of investment securities, excluding government securities, short-term investments and derivatives, were as follows:
Fund | | Purchases | | | Sales | |
Directional Allocation Fund | | $ | — | | | $ | — | |
RBP® Dividend Fund | | | 6,185,644 | | | | 7,355,530 | |
RBP® Large-Cap Defensive Fund | | | 2,746,568 | | | | 4,615,281 | |
RBP® Large-Cap Market Fund | | | 3,861,389 | | | | 4,393,038 | |
RBP® Large-Cap Value Fund | | | 1,455,031 | | | | 1,533,785 | |
The Funds are permitted to purchase or sell securities from or to certain affiliated funds under specified conditions outlined in procedures adopted by the Board. The procedures have been designed to ensure that any purchase or sale of securities by a Fund from or to another fund or portfolio that is or could be considered an affiliate by virtue of having a common investment adviser (or affiliated investment advisers), common trustees and/or common officers complies with Rule 17a-7 of the 1940 Act. Further, as defined under these procedures, each transaction is effected at the current market price to save costs, where permissible. For the period ended March 31, 2023, the Funds did not engage in purchases and sales of securities, pursuant to Rule 17a-7 of the 1940 Act.
Note 6 – Line of Credit
The Trust, along with other affiliated trusts, secured a 364-day committed, $1,230,000,000 line of credit from Citibank, N.A., which was in place through September 30, 2022, at which time the line of credit was renewed as a 364-day committed, $1,150,000,000 line of credit. A Fund may draw (borrow) from the line of credit as a temporary measure for emergency purposes, to facilitate redemption requests, or for other short-term liquidity purposes consistent with the Fund’s investment objective and program. For example, it may be advantageous for the Fund to borrow money rather than sell existing portfolio positions to meet redemption requests. Fees related to borrowings, if any, vary under this arrangement between the greater of Citibank’s “base rate”, SOFR plus 1%, or the federal funds rate plus ½ of 1%.
The commitment fee that may be paid by the Funds is at an annualized rate of 0.15% of the average daily amount of their allocated unused commitment amount. The commitment fee amount is allocated to the individual Funds based on the respective net assets of each participating Fund and is referenced in the Statement of Operations under “Line of credit fees”. The Funds did not have any borrowings under this agreement as of and for the period ended March 31, 2023.
58 | THE GUGGENHEIM FUNDS SEMI-ANNUAL REPORT | |
NOTES TO FINANCIAL STATEMENTS (Unaudited)(concluded) |
Note 7 – Market Risks
The value of, or income generated by, the investments held by the Funds are subject to the possibility of rapid and unpredictable fluctuation, and loss that may result from various factors. These factors include, among others, developments affecting individual companies, or from broader influences, including real or perceived changes in prevailing interest rates (which have since risen and may continue to rise), changes in inflation rates or expectations about inflation rates (which are currently elevated relative to normal conditions), adverse investor confidence or sentiment, changing economic, political (including geopolitical), social or financial market conditions, increased instability or general uncertainty, environmental disasters, governmental actions, public health emergencies (such as the spread of infectious diseases, pandemics and epidemics), debt crises, actual or threatened wars or other armed conflicts (such as the current Russia-Ukraine conflict and its risk of expansion or collateral economic and other effects) or ratings downgrades, and other similar events, each of which may be temporary or last for extended periods. Moreover, changing economic, political, geopolitical, social, financial market or other conditions in one country or geographic region could adversely affect the value, yield and return of the investments held by the Funds in a different country or geographic region, economy, and market because of the increasingly interconnected global economies and financial markets. The duration and extent of the foregoing types of factors or conditions are highly uncertain and difficult to predict and have in the past, and may in the future, cause volatility and distress in economies and financial markets or other adverse circumstances, which may negatively affect the value of the Funds’ investments and performance of the Funds.
Note 8 – Subsequent Events
The Funds evaluated subsequent events through the date the financial statements are issued and determined there were no material events that would require adjustment to or disclosure in the Funds’ financial statements.
| | THE GUGGENHEIM FUNDS SEMI-ANNUAL REPORT | 59 |
OTHER INFORMATION (Unaudited) |
Delivery of Shareholder Reports
Paper copies of the Funds’ annual and semi-annual shareholder reports are not sent by mail, unless you specifically request paper copies of the reports from a fund or from your financial intermediary. Instead, the reports are made available on a website, and you are notified by mail each time a report is posted and provided with a website link to access the report.
You may elect to receive all future shareholder reports in paper free of charge. If you hold shares of a fund directly, you can inform the Fund that you wish to receive paper copies of reports by calling 800.820.0888. If you hold shares of a fund through a financial intermediary, please contact the financial intermediary to make this election. Your election to receive reports in paper may apply to all Guggenheim Funds in which you are invested and may apply to all Guggenheim funds held with your financial intermediary.
Proxy Voting Information
A description of the policies and procedures that the Trust uses to determine how to vote proxies relating to securities held in the Funds’ portfolios is available, without charge and upon request, by calling 800.820.0888. This information is also available from the EDGAR database on the SEC’s website at https://www.sec.gov.
Information regarding how the Funds’ voted proxies relating to portfolio securities during the most recent 12-month period ended June 30 is available without charge, upon request, by calling 800.820.0888. This information is also available from the EDGAR database on the SEC’s website at https://www.sec.gov.
Sector Classification
Information in the “Schedule of Investments” is categorized by sectors using sector-level Classifications defined by the Bloomberg Industry Classification System, a widely recognized industry classification system provider. Each Fund’s registration statement has investment policies relating to concentration in specific sectors/industries. For purposes of these investment policies, the Funds usually classify sectors/industries based on industry-level Classifications used by widely recognized industry classification system providers such as Bloomberg Industry Classification System, Global Industry Classification Standards and Barclays Global Classification Scheme.
Quarterly Portfolio Schedules Information
The Trust files its complete schedule of portfolio holdings with the SEC for the first and third quarters of each fiscal year as an exhibit to its reports on Form N-PORT, and for reporting periods ended prior to March 31, 2019, filed such information on Form N-Q. The Funds’ Forms N-PORT and N-Q are available on the SEC’s website at https://www.sec.gov. Copies of the portfolio holdings are also available to shareholders, without charge and upon request, by calling 800.820.0888.
60 | THE GUGGENHEIM FUNDS SEMI-ANNUAL REPORT | |
INFORMATION ON BOARD OF TRUSTEES AND OFFICERS (Unaudited) |
A Board of Trustees oversees the Trust, as well as other trusts of GI, in which its members have no stated term of service, and continue to serve after election until resignation. The Statement of Additional Information includes further information about Fund Trustees and Officers, and can be obtained without charge by visiting guggenheiminvestments.com or by calling 800.820.0888.
Name, Address*
and Year of Birth | Position(s)
Held with
Trust | Term of Office
and Length of
Time Served** | Principal Occupation(s)
During Past Five Years | Number of
Portfolios
in Fund
Complex
Overseen | Other
Directorships Held
by Trustees*** |
INDEPENDENT TRUSTEES | | | |
Randall C. Barnes (1951) | Trustee and Chair of the Valuation Oversight Committee | Since 2015 (Trustee) Since 2020 (Chair of the Valuation Oversight Committee) | Current: Private Investor (2001-present). Former: Senior Vice President and Treasurer, PepsiCo, Inc. (1993-1997); President, Pizza Hut International (1991-1993); Senior Vice President, Strategic Planning and New Business Development, PepsiCo, Inc. (1987-1990). | 155 | Current: Advent Convertible and Income Fund (2005-present); Purpose Investments Funds (2013-present). Former: Fiduciary/Claymore Energy Infrastructure Fund (2004-2022); Guggenheim Enhanced Equity Income Fund (2005-2021); Guggenheim Credit Allocation Fund (2013-2021). |
Angela Brock-Kyle (1959) | Trustee | Since 2019 | Current: Founder and Chief Executive Officer, B.O.A.R.D.S. (2013-present); Director, Mutual Fund Directors Forum (2022-present). Former: Senior Leader, TIAA (1987-2012). | 154 | Current: Bowhead Insurance GP, LLC (2020-present); Hunt Companies, Inc. (2019-present). Former: Fiduciary/Claymore Energy Infrastructure Fund (2019-2022); Guggenheim Enhanced Equity Income Fund (2019-2021); Guggenheim Credit Allocation Fund (2019-2021); Infinity Property & Casualty Corp. (2014-2018). |
| | THE GUGGENHEIM FUNDS SEMI-ANNUAL REPORT | 61 |
INFORMATION ON BOARD OF TRUSTEES AND OFFICERS (Unaudited)(continued) |
Name, Address*
and Year of Birth | Position(s)
Held with
Trust | Term of Office
and Length of
Time Served** | Principal Occupation(s)
During Past Five Years | Number of
Portfolios
in Fund
Complex
Overseen | Other
Directorships Held
by Trustees*** |
INDEPENDENT TRUSTEES - continued | | |
Thomas F. Lydon, Jr. (1960) | Trustee and Chair of the Contracts Review Committee | Since 2019 (Trustee) Since 2020 (Chair of the Contracts Review Committee) | Current: President, Global Trends Investments (1996-present); Chief Executive Officer, ETF Flows, LLC (2019-present); Chief Executive Officer, Lydon Media (2016-present); Director, GDX Index Partners, LLC (2021-present); Vice Chairman, VettaFi (2022-present). | 154 | Current: US Global Investors, Inc. (GROW) (1995-present). Former: Fiduciary/Claymore Energy Infrastructure Fund (2019-2022); Guggenheim Enhanced Equity Income Fund (2019-2021); Guggenheim Credit Allocation Fund (2019-2021); Harvest Volatility Edge Trust (3) (2017-2019). |
Ronald A. Nyberg (1953) | Trustee and Chair of the Nominating and Governance Committee | Since 2015 | Current: Of Counsel, Momkus LLP (2016-present). Former: Partner, Nyberg & Cassioppi, LLC (2000-2016); Executive Vice President, General Counsel, and Corporate Secretary, Van Kampen Investments (1982-1999). | 155 | Current: Advent Convertible and Income Fund (2003-present); PPM Funds (2) (2018-present); NorthShore-Edward-Elmhurst Health (2012-present). Former: Fiduciary/Claymore Energy Infrastructure Fund (2004-2022); Guggenheim Enhanced Equity Income Fund (2005-2021); Guggenheim Credit Allocation Fund (2013-2021); Western Asset Inflation-Linked Opportunities & Income Fund (2004-2020); Western Asset Inflation-Linked Income Fund (2003-2020). |
62 | THE GUGGENHEIM FUNDS SEMI-ANNUAL REPORT | |
INFORMATION ON BOARD OF TRUSTEES AND OFFICERS (Unaudited)(continued) |
Name, Address*
and Year of Birth | Position(s)
Held with
Trust | Term of Office
and Length of
Time Served** | Principal Occupation(s)
During Past Five Years | Number of
Portfolios
in Fund
Complex
Overseen | Other
Directorships Held
by Trustees*** |
INDEPENDENT TRUSTEES - concluded | | |
Sandra G. Sponem (1958) | Trustee and Chair of the Audit Committee | Since 2019 (Trustee) Since 2020 (Chair of the Audit Committee) | Current: Retired. Former: Senior Vice President and Chief Financial Officer, M.A. Mortenson-Companies, Inc. (2007-2017). | 154 | Current: SPDR Series Trust (81) (2018-present); SPDR Index Shares Funds (30) (2018-present); SSGA Active Trust (14) (2018-present). Former: Fiduciary/Claymore Energy Infrastructure Fund (2019-2022); Guggenheim Enhanced Equity Income Fund (2019-2021); Guggenheim Credit Allocation Fund (2019-2021); SSGA Master Trust (1) (2018-2020). |
Ronald E. Toupin, Jr. (1958) | Trustee, Chair of the Board and Chair of the Executive Committee | Since 2015 | Current: Portfolio Consultant (2010-present); Member, Governing Council, Independent Directors Council (2013-present); Governor, Board of Governors, Investment Company Institute (2018-present). Former: Member, Executive Committee, Independent Directors Council (2016-2018); Vice President, Manager and Portfolio Manager, Nuveen Asset Management (1998-1999); Vice President, Nuveen Investment Advisory Corp. (1992-1999); Vice President and Manager, Nuveen Unit Investment Trusts (1991-1999); and Assistant Vice President and Portfolio Manager, Nuveen Unit Investment Trusts (1988-1999), each of John Nuveen & Co., Inc. (1982-1999). | 154 | Former: Fiduciary/Claymore Energy Infrastructure Fund (2004-2022); Guggenheim Enhanced Equity Income Fund (2005-2021); Guggenheim Credit Allocation Fund (2013-2021); Western Asset Inflation-Linked Opportunities & Income Fund (2004-2020); Western Asset Inflation-Linked Income Fund (2003-2020). |
| | THE GUGGENHEIM FUNDS SEMI-ANNUAL REPORT | 63 |
INFORMATION ON BOARD OF TRUSTEES AND OFFICERS (Unaudited)(continued) |
Name, Address*
and Year of Birth | Position(s)
Held with
Trust | Term of Office
and Length of
Time Served** | Principal Occupation(s)
During Past Five Years | Number of
Portfolios
in Fund
Complex
Overseen | Other
Directorships Held
by Trustees*** |
INTERESTED TRUSTEE | | | | |
Amy J. Lee**** (1961) | Trustee, Vice President and Chief Legal Officer | Since 2018 (Trustee) Since 2014 (Chief Legal Officer) Since 2015 (Vice President) | Current: Interested Trustee, certain other funds in the Fund Complex (2018-present); Chief Legal Officer, certain other funds in the Fund Complex (2014-present); Vice President, certain other funds in the Fund Complex (2007-present); Senior Managing Director, Guggenheim Investments (2012-present). Former: President and Chief Executive Officer, certain other funds in the Fund Complex (2017-2019); Vice President, Associate General Counsel and Assistant Secretary, Security Benefit Life Insurance Company and Security Benefit Corporation (2004-2012). | 154 | Former: Fiduciary/Claymore Energy Infrastructure Fund (2018-2022); Guggenheim Enhanced Equity Income Fund (2018-2021); Guggenheim Credit Allocation Fund (2018-2021). |
* | The business address of each Trustee is c/o Guggenheim Investments, 227 West Monroe Street, Chicago, Illinois 60606. |
** | Each Trustee serves an indefinite term, until his or her successor is elected and qualified. Time served includes time served in the respective position for the Predecessor Corporation. |
*** | Each Trustee also serves on the Boards of Trustees of Guggenheim Funds Trust, Guggenheim Variable Funds Trust, Guggenheim Strategy Funds Trust, Guggenheim Taxable Municipal Bond & Investment Grade Debt Trust, Guggenheim Strategic Opportunities Fund, Guggenheim Energy & Income Fund, Guggenheim Active Allocation Fund, Rydex Series Funds, Rydex Dynamic Funds, Rydex Variable Trust and Transparent Value Trust. Messrs. Barnes and Nyberg also serve on the Board of Trustees of Advent Convertible & Income Fund. |
**** | This Trustee is deemed to be an “interested person” of the Funds under the 1940 Act by reason of her position with the Funds’ Adviser and/or the parent of the Adviser. |
64 | THE GUGGENHEIM FUNDS SEMI-ANNUAL REPORT | |
INFORMATION ON BOARD OF TRUSTEES AND OFFICERS (Unaudited)(continued) |
Name, Address*
and Year of Birth | Position(s)
Held with
Trust | Term of Office
and Length of
Time Served** | Principal Occupation(s)
During Past Five Years |
OFFICERS | | | |
Brian E. Binder (1972) | President and Chief Executive Officer | Since 2018 | Current: President, Mutual Funds Boards, Guggenheim Investments (2022-present); President and Chief Executive Officer, certain other funds in the Fund Complex (2018-present); President, Mutual Funds Boards, Guggenheim Funds Investment Advisors, LLC and Security Investors, LLC (2018-present); Board Member, Guggenheim Partners Investment Funds plc (2022-present); Board Member, Guggenheim Global Investments plc (2022-present); Board Member of Guggenheim Partners Fund Management (Europe) Limited (2018-present). Former: Senior Managing Director and Chief Administrative Officer, Guggenheim Investments (2018-2022); Managing Director and President, Deutsche Funds, and Head of US Product, Trading and Fund Administration, Deutsche Asset Management (2013-2018);Chairman of North American Executive Committee and Managing Director, Head of Business Management and Consulting, Invesco Ltd. (2010-2012). |
James M. Howley (1972) | Chief Financial Officer, Chief Accounting Officer and Treasurer | Since 2022 | Current: Managing Director, Guggenheim Investments (2004-present); Chief Financial Officer, Chief Accounting Officer, and Treasurer, certain other funds in the Fund Complex (2022-present). Former: Assistant Treasurer, certain other funds in the Fund Complex (2006-2022); Manager, Mutual Fund Administration of Van Kampen Investments, Inc. (1996-2004). |
Mark E. Mathiasen (1978) | Secretary | Since 2015 | Current: Secretary, certain other funds in the Fund Complex (2007-present); Managing Director, Guggenheim Investments (2007-present). |
Glenn McWhinnie (1969) | Assistant Treasurer | Since 2016 | Current: Vice President, Guggenheim Investments (2009-present); Assistant Treasurer, certain other funds in the Fund Complex (2016-present). |
Michael P. Megaris (1984) | Assistant Secretary | Since 2015 | Current: Assistant Secretary, certain other funds in the Fund Complex (2014-present); Managing Director, Guggenheim Investments (2012-present). |
Elisabeth Miller (1968) | Chief Compliance Officer | Since 2016 | Current: Chief Compliance Officer, certain other funds in the Fund Complex (2012-present); Senior Managing Director, Guggenheim Investments (2012-present); Senior Managing Director, Guggenheim Funds Distributors, LLC (2014-present). Former: Chief Compliance Officer, Security Investors, LLC and Guggenheim Funds Investment Advisors, LLC (2012-2018); Chief Compliance Officer, Guggenheim Distributors, LLC (2009-2014); Senior Manager, Security Investors, LLC (2004-2014); Senior Manager, Guggenheim Distributors, LLC (2004-2014). |
Margaux Misantone (1978) | AML Officer | Since 2017 | Current: Chief Compliance Officer, Security Investors, LLC and Guggenheim Funds Investment Advisors, LLC (2018-present); AML Officer, Security Investors, LLC and certain other funds in the Fund Complex (2017-present); Managing Director, Guggenheim Investments (2015-present). Former: Assistant Chief Compliance Officer, Security Investors, LLC and Guggenheim Funds Investments Advisors, LLC (2015-2018). |
| | THE GUGGENHEIM FUNDS SEMI-ANNUAL REPORT | 65 |
INFORMATION ON BOARD OF TRUSTEES AND OFFICERS (Unaudited)(concluded) |
Name, Address*
and Year of Birth | Position(s)
Held with
Trust | Term of Office
and Length of
Time Served** | Principal Occupation(s)
During Past Five Years |
OFFICERS - concluded | |
Kimberly J. Scott (1974) | Assistant Treasurer | Since 2015 | Current: Director, Guggenheim Investments (2012-present); Assistant Treasurer, certain other funds in the Fund Complex (2012-present). Former: Financial Reporting Manager, Invesco, Ltd. (2010-2011); Vice President/Assistant Treasurer, Mutual Fund Administration for Van Kampen Investments, Inc./Morgan Stanley Investment Management (2009-2010); Manager of Mutual Fund Administration, Van Kampen Investments, Inc./Morgan Stanley Investment Management (2005-2009). |
Bryan Stone (1979) | Vice President | Since 2015 | Current: Vice President, certain other funds in the Fund Complex (2014-present); Managing Director, Guggenheim Investments (2013-present). Former: Senior Vice President, Neuberger Berman Group LLC (2009-2013); Vice President, Morgan Stanley (2002-2009). |
Jon Szafran (1989) | Assistant Treasurer | Since 2017 | Current: Director, Guggenheim Investments (2017-present); Assistant Treasurer, certain other funds in the Fund Complex (2017-present). Former: Assistant Treasurer of Henderson Global Funds and Manager of US Fund Administration, Henderson Global Investors (North America) Inc. (“HGINA”), (2017); Senior Analyst of US Fund Administration, HGINA (2014–2017); Senior Associate of Fund Administration, Cortland Capital Market Services, LLC (2013-2014); Experienced Associate, PricewaterhouseCoopers LLP (2012-2013). |
* | The business address of each officer is c/o Guggenheim Investments, 227 West Monroe Street, Chicago, Illinois 60606. |
** | Each officer serves an indefinite term, until his or her successor is duly elected and qualified. |
66 | THE GUGGENHEIM FUNDS SEMI-ANNUAL REPORT | |
GUGGENHEIM INVESTMENTS PRIVACY NOTICE (Unaudited) |
Who We Are
This Privacy Notice describes the data protection practices of Guggenheim Investments. Guggenheim Investments as used herein refers to the affiliated investment management businesses of Guggenheim Partners, LLC: Guggenheim Funds Investment Advisors, LLC, Guggenheim Partners Investment Management, LLC, Guggenheim Funds Distributors, LLC, Security Investors, LLC, Guggenheim Investment Advisors (Europe) Limited, Guggenheim Real Estate, LLC, GS Gamma Advisors, LLC, Guggenheim Partners India Management, LLC, Guggenheim Partners Europe Limited, as well as the funds in the Guggenheim Funds complex (the “Funds”) (“Guggenheim Investments,” “we,” “us,” or “our”).
Guggenheim Partners Investment Management Holdings, LLC, located at 330 Madison Avenue, New York, New York, 10017 is the data controller for your information. The affiliates who are also controllers of certain of your information are: Guggenheim Investment Advisors (Europe) Limited, Guggenheim Partners Europe Limited, Guggenheim Partners, LLC, Guggenheim Funds Investment Advisors, LLC, Guggenheim Partners Investment Management, LLC, Guggenheim Funds Distributors, LLC and Security Investors, LLC, as well as the Funds.
Our Commitment to You
Guggenheim Investments considers your privacy our utmost concern. When you become our client or investor, you entrust us with not only your hard-earned money but also with your personal and financial information. Because we have access to your private information, we hold ourselves to the highest standards in its safekeeping and use. We strictly limit how we share your information with others, whether you are a current or former Guggenheim Investments client or investor.
The Information We Collect About You
We collect certain nonpublic personal information about you from information you provide on applications, other forms, our website, and/or from third parties including investment advisors. This information includes Social Security or other tax identification number, assets, income, tax information, retirement and estate plan information, transaction history, account balance, payment history, bank account information, marital status, family relationships, information that we collect on our website through the use of “cookies,” and other personal information that you or others provide to us. We may also collect such information through your inquiries by mail, e-mail or telephone. We may also collect customer due diligence information, as required by applicable law and regulation, through third party service providers.
How We Handle Your Personal Information
The legal basis for using your information as set out in this Privacy Notice is as follows: (a) use of your personal data is necessary to perform our obligations under any contract with you (such as a contract for us to provide financial services to you); or (b) where use of your personal data is not necessary for performance of a contract, use of your personal data is necessary for our legitimate interests or the legitimate interests of others (for example, to enforce the legal terms governing our services, operate and market our website and other services we offer, ensure safe environments for our personnel and others, make and receive payments, prevent fraud and to know the customer to whom we are providing the services). Some processing is done to comply with applicable law.
In addition to the specific uses described above, we also use your information in the following manner:
| | ● | We use your information in connection with servicing your accounts. |
| | ● | We use information to respond to your requests or questions. For example, we might use your information to respond to your customer feedback. |
| | ● | We use information to improve our products and services. We may use your information to make our website and products better. We may use your information to customize your experience with us. |
| | ● | We use information for security purposes. We may use your information to protect our company and our customers. |
| | ● | We use information to communicate with you. For example, we will communicate with you about your account or our relationship. We may contact you about your feedback. We might also contact you about this Privacy Notice. We may also enroll you in our email newsletter. |
| | THE GUGGENHEIM FUNDS SEMI-ANNUAL REPORT | 67 |
GUGGENHEIM INVESTMENTS PRIVACY NOTICE (Unaudited)(continued) |
| | ● | We use information as otherwise permitted by law, as we may notify you. |
| | ● | Aggregate/Anonymous Data. We may aggregate and/or anonymize any information collected through the website so that such information can no longer be linked to you or your device (“Aggregate/Anonymous Information”). We may use Aggregate/Anonymous Information for any purpose, including without limitation for research and marketing purposes, and may also share such data with any third parties, including advertisers, promotional partners, and sponsors. |
We do not sell information about current or former clients or their accounts to third parties. Nor do we share this information, except when necessary to complete transactions at your request, to make you aware of investment products and services that we or our affiliates offer, or as permitted or required by law.
We provide information about you to companies and individuals not affiliated with Guggenheim Investments to complete certain transactions or account changes, or to perform services for us related to your account. For example, if you ask to transfer assets from another financial institution to Guggenheim Investments, we must provide certain information about you to that company to complete the transaction. We provide the third party with only the information necessary to carry out its responsibilities and only for that purpose. And we require these third parties to treat your private information with the same high degree of confidentiality that we do. To alert you to other Guggenheim Investments products and services, we share your information within our family of affiliated companies. You may limit our sharing with affiliated companies as set out below. We may also share information with any successor to all or part of our business, or in connection with steps leading up to a merger or acquisition. For example, if part of our business was sold we may give customer information as part of that transaction. We may also share information about you with your consent.
We will release information about you if you direct us to do so, if we are compelled by law to do so, or in other circumstances as permitted by law (for example, to protect your account from fraud).
If you close your account(s) or become an inactive client or investor, we will continue to adhere to the privacy policies and practices described in this notice.
Opt-Out Provisions and Your Data Choices
The law allows you to “opt out” of certain kinds of information sharing with third parties. We do not share personal information about you with any third parties that triggers this opt-out right. This means YOU ARE ALREADY OPTED OUT.
When you are no longer our client or investor, we continue to share your information as described in this notice, and you may contact us at any time to limit our sharing by sending an email to CorporateDataPrivacy@GuggenheimPartners.com.
European Union Data Subjects and certain others: In addition to the choices set forth above, residents of the European Union and certain other jurisdictions have certain rights to (1) request access to or rectification or deletion of information we collect about them, (2) request a restriction on the processing of their information, (3) object to the processing of their information, or (4) request the portability of certain information. To exercise these or other rights, please contact us using the contact information below. We will consider all requests and provide our response within the time period stated by applicable law. Please note, however, that certain information may be exempt from such requests in some circumstances, which may include if we need to keep processing your information for our legitimate interests or to comply with a legal obligation. We may request you provide us with information necessary to confirm your identity before responding to your request.
Residents of France and certain other jurisdictions may also provide us with instructions regarding the manner in which we may continue to store, erase and share your information after your death, and where applicable, the person you have designated to exercise these rights after your death.
How We Protect Privacy Online
We take steps to protect your privacy when you use our web site – www.guggenheiminvestments.com – by using secure forms of online communication, including encryption technology, Secure Socket Layer (SSL) protocol, firewalls and user names and passwords. These safeguards vary based on the sensitivity of the information that we collect and store. However, we cannot and do not guarantee that these
68 | THE GUGGENHEIM FUNDS SEMI-ANNUAL REPORT | |
GUGGENHEIM INVESTMENTS PRIVACY NOTICE (Unaudited)(concluded) |
measures will prevent every unauthorized attempt to access, use, or disclose your information since despite our efforts, no Internet and/or other electronic transmissions can be completely secure. Our web site uses “http cookies”—tiny pieces of information that we ask your browser to store. We use cookies for session management and security features on the Guggenheim Investments web site. We do not use them to pull data from your hard drive, to learn your e-mail address, or to view data in cookies created by other web sites. We will not share the information in our cookies or give others access to it. See the legal information area on our web site for more details about web site security and privacy features.
How We Safeguard Your Personal Information and Data Retention
We restrict access to nonpublic personal information about you to our employees and in some cases to third parties (for example, the service providers described above) as permitted by law. We maintain strict physical, electronic and procedural safeguards that comply with federal standards to guard your nonpublic personal information.
We keep your information for no longer than necessary for the purposes for which it is processed. The length of time for which we retain information depends on the purposes for which we collected and use it and/or as required to comply with applicable laws. Information may persist in copies made for backup and business continuity purposes for additional time.
International Visitors
If you are not a resident of the United States, please be aware that your information may be transferred to, stored and processed in the United States where our servers are located and our databases are operated. The data protection and other laws of the United States and other countries might not be as comprehensive as those in your country.
In such cases, we ensure that a legal basis for such a transfer exists and that adequate protection is provided as required by applicable law, for example, by using standard contractual clauses or by transferring your data to a jurisdiction that has obtained an adequacy finding. Individuals whose data may be transferred on the basis of standard contractual clauses may contact us as described below.
We’ll Keep You Informed
If you have any questions or concerns about how we treat your personal data, we encourage you to consult with us first. You may also contact the relevant supervisory authority.
We reserve the right to modify this policy at any time and will inform you promptly of material changes. You may access our privacy policy from our web site at www.guggenheiminvestments.com. Should you have any questions regarding our privacy policy, contact us by email at CorporateDataPrivacy@GuggenheimPartners.com.
| | THE GUGGENHEIM FUNDS SEMI-ANNUAL REPORT | 69 |
Not required at this time.
| Item 3. | Audit Committee Financial Expert. |
Not required at this time.
| Item 4. | Principal Accountant Fees and Services. |
Not required at this time.
| Item 5. | Audit Committee of Listed Registrants. |
Not applicable.
(a) The Schedule of Investments is included under Item 1 of this Form.
(b) Not applicable.
| Item 7. | Disclosure of Proxy Voting Policies and Procedures for Closed-End Management Investment Companies. |
Not applicable.
| Item 8. | Portfolio Managers of Closed-end Management Investment Companies |
Not applicable.
| Item 9. | Purchases of Equity Securities by Closed-End Management Investment Company and Affiliated Purchasers. |
Not applicable.
| Item 10. | Submission of Matters to a Vote of Security Holders. |
The registrant does not currently have in place procedures by which shareholders may recommend nominees to the registrant’s board.
There have been no changes to the procedures by which shareholders may recommend nominees to the registrant’s board.
| Item 11. | Controls and Procedures. |
| (a) | The registrant’s President (principal executive officer) and Treasurer (principal financial officer) have evaluated the registrant’s disclosure controls and procedures (as defined in Rule 30a-3(c) under the Investment Company Act) as of a date within 90 days of this filing and have concluded that based on such evaluation as required by Rule 30a-3(b) under the Investment Company Act, that the registrant’s disclosure controls and procedures were effective as of that date in ensuring that information required to be disclosed by the registrant in this Form N-CSR was recorded, processed, summarized, and reported within the time periods specified in the Securities and Exchange Commission’s rules and forms. |
| (b) | There were no changes in the registrant’s internal control over financial reporting (as defined in Rule 30a-3(d) under the Investment Company Act) that occurred during the period covered by this report that have materially affected, or are reasonably likely to materially affect, the registrant’s internal control over financial reporting. |
| Item 12. | Disclosure of Securities Lending Activities for Closed-End Management Investment Companies. |
Not applicable.
SIGNATURES
Pursuant to the requirements of the Securities Exchange Act of 1934 and the Investment Company Act of 1940, the registrant has duly caused this report to be signed on its behalf by the undersigned, thereunto duly authorized.
| (Registrant) | Transparent Value Trust | |
| | | |
| By (Signature and Title)* | /s/ Brian E. Binder | |
| | Brian E. Binder, President and Chief Executive Officer | |
| | | |
| Date | June 2, 2023 | |
Pursuant to the requirements of the Securities Exchange Act of 1934 and the Investment Company Act of 1940, this report has been signed below by the following persons on behalf of the registrant and in the capacities and on the dates indicated.
| By (Signature and Title)* | /s/ Brian E. Binder | |
| | Brian E. Binder, President and Chief Executive Officer | |
| | | |
| Date | June 2, 2023 | |
| | | |
| By (Signature and Title)* | /s/ James M. Howley | |
| | James M. Howley, Chief Financial Officer, Chief Accounting Officer and Treasurer |
| | | |
| Date | June 2, 2023 | |
| * | Print the name and title of each signing officer under his or her signature. |
