UNITED STATES
SECURITIES AND EXCHANGE COMMISSION
Washington, D.C. 20549
FORM N-CSR
CERTIFIED SHAREHOLDER REPORT OF REGISTERED MANAGEMENT
INVESTMENT COMPANIES
Investment Company Act file number 811- 22309
Transparent Value Trust
(Exact name of registrant as specified in charter)
702 King Farm Boulevard, Suite 200
Rockville, Maryland 20850
(Address of principal executive offices) (Zip code)
Amy J. Lee
Transparent Value Trust
702 King Farm Boulevard, Suite 200
Rockville, Maryland 20850
(Name and address of agent for service)
Registrant's telephone number, including area code: (301) 296-5100
Date of fiscal year end: September 30
Date of reporting period: October 1, 2023 - September 30, 2024
| Item 1. | Reports to Stockholders. |
| (a) | The registrant’s annual report transmitted to shareholders pursuant to Rule 30e-1 under the Investment Company Act of 1940, as amended (the “Investment Company Act”), is as follows: |

Annual Shareholder Report | 9.30.24
This annual shareholder report contains important information about the Guggenheim Directional Allocation Fund for the period of October 1, 2023 to September 30, 2024. You can find additional information about the fund at https://www.guggenheiminvestments.com/mutual-funds/literature. You can also request this information by contacting 800 820 0888 or GuggenheimClientServices@mufg-is.com.
This report describes changes to the fund that occurred during the reporting period.
For the period of October 1, 2023 to September 30, 2024, the fund (Class A shares) returned 35.05%, underperforming the fund's benchmark, the S&P 500 Index, which returned 36.35% for the same period and underperforming the fund's secondary index, the Guggenheim Directional Allocation IndexSM, which returned 37.30% for the same period.
The fund's broad-based securities market index was changed from the Dow Jones U.S. Large-Cap Total Stock Market Index to the S&P 500 Index to comply with the regulation that requires the fund's broad-based securities market index to represent the overall applicable market.
What factors materially affected the fund's performance over the last year?
The fund's negative relative results were primarily the result of activity in the fund's allocation model. The allocation model entered the period with a 100% market position. However, at the December 2023 rebalance, the portfolio took on a 50% market / 50% defensive position, reversing back to 100% market in the March 2024 rebalance. Then, in the June 2024 rebalance, the fund again was positioned 50% market / 50 % defensive. The allocation model was impacted from weaker economic conditions and sentiment during both of these more defensive periods (50% market / 50% defensive), yet the overall market did not experience meaningful relative underperformance. At the end of the period, the portfolio maintained a 100% allocation to the Market portfolio.
Cumulative performance* for the fund's most recently completed 10 years (as of 9.30.24), assuming a $10,000 initial investment.
| 09/30/2014 | 9423 | 10000 | 10000 |
| 12/31/2014 | 9359 | 10493 | 9978 |
| 03/31/2015 | 9529 | 10593 | 10182 |
| 06/30/2015 | 9351 | 10622 | 10028 |
| 09/30/2015 | 8603 | 9939 | 9254 |
| 12/31/2015 | 9055 | 10638 | 9777 |
| 03/31/2016 | 9299 | 10782 | 10094 |
| 06/30/2016 | 9537 | 11047 | 10398 |
| 09/30/2016 | 9751 | 11472 | 10673 |
| 12/31/2016 | 10107 | 11911 | 11103 |
| 03/31/2017 | 10796 | 12633 | 11914 |
| 06/30/2017 | 11226 | 13023 | 12436 |
| 09/30/2017 | 11730 | 13607 | 13035 |
| 12/31/2017 | 12434 | 14511 | 13873 |
| 03/31/2018 | 12760 | 14401 | 14286 |
| 06/30/2018 | 13101 | 14896 | 14721 |
| 09/30/2018 | 13775 | 16044 | 15484 |
| 12/31/2018 | 11491 | 13875 | 12936 |
| 03/31/2019 | 13264 | 15769 | 14991 |
| 06/30/2019 | 13813 | 16447 | 15663 |
| 09/30/2019 | 13931 | 16727 | 15849 |
| 12/31/2019 | 14940 | 18244 | 17065 |
| 03/31/2020 | 10994 | 14668 | 12568 |
| 06/30/2020 | 13016 | 17682 | 14943 |
| 09/30/2020 | 13879 | 19260 | 16017 |
| 12/31/2020 | 15661 | 21600 | 18121 |
| 03/31/2021 | 16673 | 22934 | 19371 |
| 06/30/2021 | 17942 | 24895 | 20920 |
| 09/30/2021 | 17962 | 25040 | 21025 |
| 12/31/2021 | 19888 | 27801 | 23360 |
| 03/31/2022 | 18653 | 26522 | 21976 |
| 06/30/2022 | 16240 | 22252 | 19208 |
| 09/30/2022 | 16274 | 21165 | 19208 |
| 12/31/2022 | 16346 | 22766 | 19208 |
| 03/31/2023 | 16461 | 24473 | 19208 |
| 06/30/2023 | 16702 | 26612 | 19369 |
| 09/30/2023 | 16117 | 25741 | 18749 |
| 12/31/2023 | 18075 | 28750 | 21130 |
| 03/31/2024 | 20154 | 31785 | 23662 |
| 06/30/2024 | 20609 | 33147 | 24282 |
| 09/30/2024 | 21765 | 35098 | 25742 |
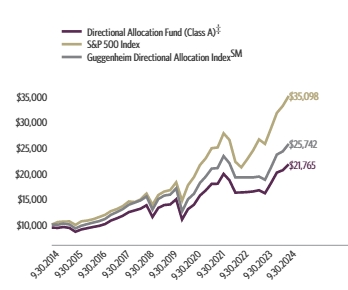
| Class A (without sales charge) | 35.05% | 9.33% | 8.73% |
| Class A (with sales charge)† | 28.63% | 8.28% | 8.09% |
| S&P 500 Index | 36.35% | 15.98% | 13.38% |
| Guggenheim Directional Allocation IndexSMGuggenheim Directional Allocation IndexSM | 37.30% | 10.19% | 9.92% |
The fund's past performance is not a good predictor of the fund's future performance. Visit GuggenheimInvestments.com/mutual-funds/performance for more recent performance information.
| Net Assets | $204,610,948 |
| Total Number of Portfolio Holdings | 140 |
| Portfolio Turnover Rate | 125% |
| Total Advisory Fees Paid | $1,634,512 |
| Guggenheim Directional Allocation Fund | Class A | TVRAX | Annual Shareholder Report | September 30, 2024 |
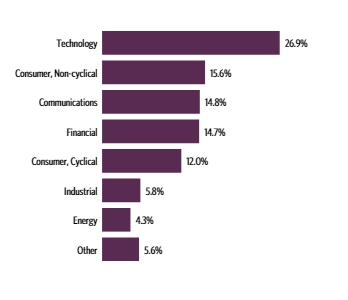
| Technology | 26.9% |
| Consumer, Non-cyclical | 15.6% |
| Communications | 14.8% |
| Financial | 14.7% |
| Consumer, Cyclical | 12.0% |
| Industrial | 5.8% |
| Energy | 4.3% |
| Other | 5.6% |
| Microsoft Corp. | 7.1% |
| Apple, Inc. | 5.4% |
| NVIDIA Corp. | 5.0% |
| Alphabet, Inc. — Class C | 4.4% |
| Meta Platforms, Inc. — Class A | 3.2% |
| Amazon.com, Inc. | 2.3% |
| Tesla, Inc. | 2.1% |
| JPMorgan Chase & Co. | 2.0% |
| Visa, Inc. — Class A | 1.7% |
| Mastercard, Inc. — Class A | 1.7% |
| Top 10 Total | 34.9% |
| |
1 | "Holdings Diversification (Market Exposure as a % of Net Assets)" excludes any temporary cash investments, investments in Guggenheim Strategy Funds Trust mutual funds, or investments in Guggenheim Ultra Short Duration Fund. |
| |
2 | "10 Largest Holdings (as a % of Net Assets)" excludes any temporary cash investments. |
| Microsoft Corp. | 7.1% |
| Apple, Inc. | 5.4% |
| NVIDIA Corp. | 5.0% |
| Alphabet, Inc. — Class C | 4.4% |
| Meta Platforms, Inc. — Class A | 3.2% |
| Amazon.com, Inc. | 2.3% |
| Tesla, Inc. | 2.1% |
| JPMorgan Chase & Co. | 2.0% |
| Visa, Inc. — Class A | 1.7% |
| Mastercard, Inc. — Class A | 1.7% |
| Top 10 Total | 34.9% |
| |
2 | "10 Largest Holdings (as a % of Net Assets)" excludes any temporary cash investments. |
There were no changes in or disagreements with fund accountants for the period.
This is a summary of certain changes to the fund since September 30, 2023.
Subsequent to the September 30, 2024 year-end, on October 25, 2024, the fund was reorganized into New Age Alpha Allocation Fund, a series of New Age Alpha Funds Trust, pursuant to an Agreement and Plan of Reorganization approved by the Board of Trustees and shareholders of the fund.
| |  | Availability of Additional Information. For additional information, including financial information, holdings and proxy voting information, go to https://www.guggenheiminvestments.com/mutual-funds/literature or, call 800 820 0888. |
AR-TVRAX-093024
Annual Shareholder Report | 9.30.24
This annual shareholder report contains important information about the Guggenheim Directional Allocation Fund for the period of October 1, 2023 to September 30, 2024. You can find additional information about the fund at https://www.guggenheiminvestments.com/mutual-funds/literature. You can also request this information by contacting 800 820 0888 or GuggenheimClientServices@mufg-is.com.
This report describes changes to the fund that occurred during the reporting period.
For the period of October 1, 2023 to September 30, 2024, the fund (Class C shares) returned 34.24%, underperforming the fund's benchmark, the S&P 500 Index, which returned 36.35% for the same period and underperforming the fund's secondary index, the Guggenheim Directional Allocation IndexSM, which returned 37.30% for the same period.
The fund's broad-based securities market index was changed from the Dow Jones U.S. Large-Cap Total Stock Market Index to the S&P 500 Index to comply with the regulation that requires the fund's broad-based securities market index to represent the overall applicable market.
What factors materially affected the fund's performance over the last year?
The fund's negative relative results were primarily the result of activity in the fund's allocation model. The allocation model entered the period with a 100% market position. However, at the December 2023 rebalance, the portfolio took on a 50% market / 50% defensive position, reversing back to 100% market in the March 2024 rebalance. Then, in the June 2024 rebalance, the fund again was positioned 50% market / 50 % defensive. The allocation model was impacted from weaker economic conditions and sentiment during both of these more defensive periods (50% market / 50% defensive), yet the overall market did not experience meaningful relative underperformance. At the end of the period, the portfolio maintained a 100% allocation to the Market portfolio.
Cumulative performance* for the fund's most recently completed 10 years (as of 9.30.24), assuming a $10,000 initial investment.
| 09/30/2014 | 10000 | 10000 | 10000 |
| 12/31/2014 | 9916 | 10493 | 9978 |
| 03/31/2015 | 10076 | 10593 | 10182 |
| 06/30/2015 | 9868 | 10622 | 10028 |
| 09/30/2015 | 9063 | 9939 | 9254 |
| 12/31/2015 | 9525 | 10638 | 9777 |
| 03/31/2016 | 9773 | 10782 | 10094 |
| 06/30/2016 | 10004 | 11047 | 10398 |
| 09/30/2016 | 10211 | 11472 | 10673 |
| 12/31/2016 | 10562 | 11911 | 11103 |
| 03/31/2017 | 11272 | 12633 | 11914 |
| 06/30/2017 | 11695 | 13023 | 12436 |
| 09/30/2017 | 12198 | 13607 | 13035 |
| 12/31/2017 | 12908 | 14511 | 13873 |
| 03/31/2018 | 13219 | 14401 | 14286 |
| 06/30/2018 | 13546 | 14896 | 14721 |
| 09/30/2018 | 14208 | 16044 | 15484 |
| 12/31/2018 | 11828 | 13875 | 12936 |
| 03/31/2019 | 13630 | 15769 | 14991 |
| 06/30/2019 | 14170 | 16447 | 15663 |
| 09/30/2019 | 14262 | 16727 | 15849 |
| 12/31/2019 | 15271 | 18244 | 17065 |
| 03/31/2020 | 11212 | 14668 | 12568 |
| 06/30/2020 | 13263 | 17682 | 14943 |
| 09/30/2020 | 14121 | 19260 | 16017 |
| 12/31/2020 | 15890 | 21600 | 18121 |
| 03/31/2021 | 16899 | 22934 | 19371 |
| 06/30/2021 | 18147 | 24895 | 20920 |
| 09/30/2021 | 18147 | 25040 | 21025 |
| 12/31/2021 | 20047 | 27801 | 23360 |
| 03/31/2022 | 18779 | 26522 | 21976 |
| 06/30/2022 | 16319 | 22252 | 19208 |
| 09/30/2022 | 16319 | 21165 | 19208 |
| 12/31/2022 | 16370 | 22766 | 19208 |
| 03/31/2023 | 16458 | 24473 | 19208 |
| 06/30/2023 | 16674 | 26612 | 19369 |
| 09/30/2023 | 16065 | 25741 | 18749 |
| 12/31/2023 | 17991 | 28750 | 21130 |
| 03/31/2024 | 20041 | 31785 | 23662 |
| 06/30/2024 | 20451 | 33147 | 24282 |
| 09/30/2024 | 21566 | 35098 | 25742 |
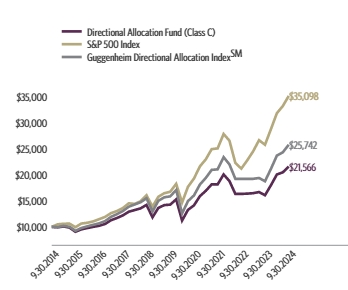
| Class C (without CDSC) | 34.24% | 8.62% | 7.99% |
| Class C (with CDSC)‡ | 33.24% | 8.62% | 7.99% |
| S&P 500 Index | 36.35% | 15.98% | 13.38% |
| Guggenheim Directional Allocation IndexSMGuggenheim Directional Allocation IndexSM | 37.30% | 10.19% | 9.92% |
The fund's past performance is not a good predictor of the fund's future performance. Visit GuggenheimInvestments.com/mutual-funds/performance for more recent performance information.
| Net Assets | $204,610,948 |
| Total Number of Portfolio Holdings | 140 |
| Portfolio Turnover Rate | 125% |
| Total Advisory Fees Paid | $1,634,512 |
| Guggenheim Directional Allocation Fund | Class C | TVRCX | Annual Shareholder Report | September 30, 2024 |
| Technology | 26.9% |
| Consumer, Non-cyclical | 15.6% |
| Communications | 14.8% |
| Financial | 14.7% |
| Consumer, Cyclical | 12.0% |
| Industrial | 5.8% |
| Energy | 4.3% |
| Other | 5.6% |

| Microsoft Corp. | 7.1% |
| Apple, Inc. | 5.4% |
| NVIDIA Corp. | 5.0% |
| Alphabet, Inc. — Class C | 4.4% |
| Meta Platforms, Inc. — Class A | 3.2% |
| Amazon.com, Inc. | 2.3% |
| Tesla, Inc. | 2.1% |
| JPMorgan Chase & Co. | 2.0% |
| Visa, Inc. — Class A | 1.7% |
| Mastercard, Inc. — Class A | 1.7% |
| Top 10 Total | 34.9% |
| |
1 | "Holdings Diversification (Market Exposure as a % of Net Assets)" excludes any temporary cash investments, investments in Guggenheim Strategy Funds Trust mutual funds, or investments in Guggenheim Ultra Short Duration Fund. |
| |
2 | "10 Largest Holdings (as a % of Net Assets)" excludes any temporary cash investments. |
| Microsoft Corp. | 7.1% |
| Apple, Inc. | 5.4% |
| NVIDIA Corp. | 5.0% |
| Alphabet, Inc. — Class C | 4.4% |
| Meta Platforms, Inc. — Class A | 3.2% |
| Amazon.com, Inc. | 2.3% |
| Tesla, Inc. | 2.1% |
| JPMorgan Chase & Co. | 2.0% |
| Visa, Inc. — Class A | 1.7% |
| Mastercard, Inc. — Class A | 1.7% |
| Top 10 Total | 34.9% |
| |
2 | "10 Largest Holdings (as a % of Net Assets)" excludes any temporary cash investments. |
There were no changes in or disagreements with fund accountants for the period.
This is a summary of certain changes to the fund since September 30, 2023.
Subsequent to the September 30, 2024 year-end, on October 25, 2024, the fund was reorganized into New Age Alpha Allocation Fund, a series of New Age Alpha Funds Trust, pursuant to an Agreement and Plan of Reorganization approved by the Board of Trustees and shareholders of the fund.
| |  | Availability of Additional Information. For additional information, including financial information, holdings and proxy voting information, go to https://www.guggenheiminvestments.com/mutual-funds/literature or, call 800 820 0888. |
AR-TVRCX-093024
Annual Shareholder Report | 9.30.24
This annual shareholder report contains important information about the Guggenheim Directional Allocation Fund for the period of October 1, 2023 to September 30, 2024. You can find additional information about the fund at https://www.guggenheiminvestments.com/mutual-funds/literature. You can also request this information by contacting 800 820 0888 or GuggenheimClientServices@mufg-is.com.
This report describes changes to the fund that occurred during the reporting period.
For the period of October 1, 2023 to September 30, 2024, the fund (Class P shares) returned 35.26%, underperforming the fund's benchmark, the S&P 500 Index, which returned 36.35% for the same period and underperforming the fund's secondary index, the Guggenheim Directional Allocation IndexSM, which returned 37.30% for the same period.
The fund's broad-based securities market index was changed from the Dow Jones U.S. Large-Cap Total Stock Market Index to the S&P 500 Index to comply with the regulation that requires the fund's broad-based securities market index to represent the overall applicable market.
What factors materially affected the fund's performance over the last year?
The fund's negative relative results were primarily the result of activity in the fund's allocation model. The allocation model entered the period with a 100% market position. However, at the December 2023 rebalance, the portfolio took on a 50% market / 50% defensive position, reversing back to 100% market in the March 2024 rebalance. Then, in the June 2024 rebalance, the fund again was positioned 50% market / 50 % defensive. The allocation model was impacted from weaker economic conditions and sentiment during both of these more defensive periods (50% market / 50% defensive), yet the overall market did not experience meaningful relative underperformance. At the end of the period, the portfolio maintained a 100% allocation to the Market portfolio.
Cumulative performance* for the fund's most recently completed 10 years (as of 9.30.24), assuming a $10,000 initial investment.
| 09/30/2014 | 10000 | 10000 | 10000 |
| 12/31/2014 | 9931 | 10493 | 9978 |
| 03/31/2015 | 10112 | 10593 | 10182 |
| 06/30/2015 | 9923 | 10622 | 10028 |
| 09/30/2015 | 9139 | 9939 | 9254 |
| 12/31/2015 | 9618 | 10638 | 9777 |
| 03/31/2016 | 9884 | 10782 | 10094 |
| 06/30/2016 | 10135 | 11047 | 10398 |
| 09/30/2016 | 10371 | 11472 | 10673 |
| 12/31/2016 | 10747 | 11911 | 11103 |
| 03/31/2017 | 11485 | 12633 | 11914 |
| 06/30/2017 | 11940 | 13023 | 12436 |
| 09/30/2017 | 12473 | 13607 | 13035 |
| 12/31/2017 | 13226 | 14511 | 13873 |
| 03/31/2018 | 13571 | 14401 | 14286 |
| 06/30/2018 | 13940 | 14896 | 14721 |
| 09/30/2018 | 14646 | 16044 | 15484 |
| 12/31/2018 | 12221 | 13875 | 12936 |
| 03/31/2019 | 14106 | 15769 | 14991 |
| 06/30/2019 | 14695 | 16447 | 15663 |
| 09/30/2019 | 14820 | 16727 | 15849 |
| 12/31/2019 | 15897 | 18244 | 17065 |
| 03/31/2020 | 11695 | 14668 | 12568 |
| 06/30/2020 | 13854 | 17682 | 14943 |
| 09/30/2020 | 14776 | 19260 | 16017 |
| 12/31/2020 | 16664 | 21600 | 18121 |
| 03/31/2021 | 17754 | 22934 | 19371 |
| 06/30/2021 | 19106 | 24895 | 20920 |
| 09/30/2021 | 19127 | 25040 | 21025 |
| 12/31/2021 | 21183 | 27801 | 23360 |
| 03/31/2022 | 19867 | 26522 | 21976 |
| 06/30/2022 | 17308 | 22252 | 19208 |
| 09/30/2022 | 17333 | 21165 | 19208 |
| 12/31/2022 | 17424 | 22766 | 19208 |
| 03/31/2023 | 17545 | 24473 | 19208 |
| 06/30/2023 | 17824 | 26612 | 19369 |
| 09/30/2023 | 17194 | 25741 | 18749 |
| 12/31/2023 | 19296 | 28750 | 21130 |
| 03/31/2024 | 21529 | 31785 | 23662 |
| 06/30/2024 | 22011 | 33147 | 24282 |
| 09/30/2024 | 23257 | 35098 | 25742 |
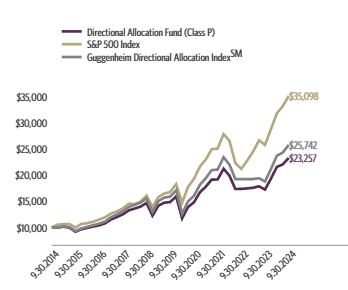
| Class P ** | 35.26% | 9.43% | 8.81% |
| S&P 500 Index | 36.35% | 15.98% | 13.38% |
| Guggenheim Directional Allocation IndexSMGuggenheim Directional Allocation IndexSM | 37.30% | 10.19% | 9.92% |
The fund's past performance is not a good predictor of the fund's future performance. Visit GuggenheimInvestments.com/mutual-funds/performance for more recent performance information.
| Net Assets | $204,610,948 |
| Total Number of Portfolio Holdings | 140 |
| Portfolio Turnover Rate | 125% |
| Total Advisory Fees Paid | $1,634,512 |
| Guggenheim Directional Allocation Fund | Class P | TVFRX | Annual Shareholder Report | September 30, 2024 |
| Technology | 26.9% |
| Consumer, Non-cyclical | 15.6% |
| Communications | 14.8% |
| Financial | 14.7% |
| Consumer, Cyclical | 12.0% |
| Industrial | 5.8% |
| Energy | 4.3% |
| Other | 5.6% |

| Microsoft Corp. | 7.1% |
| Apple, Inc. | 5.4% |
| NVIDIA Corp. | 5.0% |
| Alphabet, Inc. — Class C | 4.4% |
| Meta Platforms, Inc. — Class A | 3.2% |
| Amazon.com, Inc. | 2.3% |
| Tesla, Inc. | 2.1% |
| JPMorgan Chase & Co. | 2.0% |
| Visa, Inc. — Class A | 1.7% |
| Mastercard, Inc. — Class A | 1.7% |
| Top 10 Total | 34.9% |
| |
1 | "Holdings Diversification (Market Exposure as a % of Net Assets)" excludes any temporary cash investments, investments in Guggenheim Strategy Funds Trust mutual funds, or investments in Guggenheim Ultra Short Duration Fund. |
| |
2 | "10 Largest Holdings (as a % of Net Assets)" excludes any temporary cash investments. |
| Microsoft Corp. | 7.1% |
| Apple, Inc. | 5.4% |
| NVIDIA Corp. | 5.0% |
| Alphabet, Inc. — Class C | 4.4% |
| Meta Platforms, Inc. — Class A | 3.2% |
| Amazon.com, Inc. | 2.3% |
| Tesla, Inc. | 2.1% |
| JPMorgan Chase & Co. | 2.0% |
| Visa, Inc. — Class A | 1.7% |
| Mastercard, Inc. — Class A | 1.7% |
| Top 10 Total | 34.9% |
| |
2 | "10 Largest Holdings (as a % of Net Assets)" excludes any temporary cash investments. |
There were no changes in or disagreements with fund accountants for the period.
This is a summary of certain changes to the fund since September 30, 2023.
Subsequent to the September 30, 2024 year-end, on October 25, 2024, the fund was reorganized into New Age Alpha Allocation Fund, a series of New Age Alpha Funds Trust, pursuant to an Agreement and Plan of Reorganization approved by the Board of Trustees and shareholders of the fund.
| |  | Availability of Additional Information. For additional information, including financial information, holdings and proxy voting information, go to https://www.guggenheiminvestments.com/mutual-funds/literature or, call 800 820 0888. |
AR-TVFRX-093024
Annual Shareholder Report | 9.30.24
This annual shareholder report contains important information about the Guggenheim Directional Allocation Fund for the period of October 1, 2023 to September 30, 2024. You can find additional information about the fund at https://www.guggenheiminvestments.com/mutual-funds/literature. You can also request this information by contacting 800 820 0888 or GuggenheimClientServices@mufg-is.com.
This report describes changes to the fund that occurred during the reporting period.
| Institutional Class | $126 | 1.07% |
For the period of October 1, 2023 to September 30, 2024, the fund (Institutional Class shares) returned 35.55%, underperforming the fund's benchmark, the S&P 500 Index, which returned 36.35% for the same period and underperforming the fund's secondary index, the Guggenheim Directional Allocation IndexSM, which returned 37.30% for the same period.
The fund's broad-based securities market index was changed from the Dow Jones U.S. Large-Cap Total Stock Market Index to the S&P 500 Index to comply with the regulation that requires the fund's broad-based securities market index to represent the overall applicable market.
What factors materially affected the fund's performance over the last year?
The fund's negative relative results were primarily the result of activity in the fund's allocation model. The allocation model entered the period with a 100% market position. However, at the December 2023 rebalance, the portfolio took on a 50% market / 50% defensive position, reversing back to 100% market in the March 2024 rebalance. Then, in the June 2024 rebalance, the fund again was positioned 50% market / 50 % defensive. The allocation model was impacted from weaker economic conditions and sentiment during both of these more defensive periods (50% market / 50% defensive), yet the overall market did not experience meaningful relative underperformance. At the end of the period, the portfolio maintained a 100% allocation to the Market portfolio.
Cumulative performance* for the fund's most recently completed 10 years (as of 9.30.24), assuming a $2,000,000 initial investment.
| 09/30/2014 | 2000000 | 2000000 | 2000000 |
| 12/31/2014 | 1987838 | 2098653 | 1995683 |
| 03/31/2015 | 2025257 | 2118603 | 2036428 |
| 06/30/2015 | 1989398 | 2124494 | 2005541 |
| 09/30/2015 | 1831930 | 1987710 | 1850880 |
| 12/31/2015 | 1928593 | 2127695 | 1955411 |
| 03/31/2016 | 1983161 | 2156373 | 2018710 |
| 06/30/2016 | 2036170 | 2209317 | 2079598 |
| 09/30/2016 | 2082943 | 2294422 | 2134535 |
| 12/31/2016 | 2160897 | 2382166 | 2220540 |
| 03/31/2017 | 2310570 | 2526671 | 2382828 |
| 06/30/2017 | 2404115 | 2604699 | 2487166 |
| 09/30/2017 | 2513251 | 2721399 | 2607023 |
| 12/31/2017 | 2667601 | 2902230 | 2774628 |
| 03/31/2018 | 2737760 | 2880198 | 2857260 |
| 06/30/2018 | 2812596 | 2979101 | 2944224 |
| 09/30/2018 | 2957592 | 3208812 | 3096809 |
| 12/31/2018 | 2469201 | 2774986 | 2587157 |
| 03/31/2019 | 2851803 | 3153716 | 2998165 |
| 06/30/2019 | 2972252 | 3289447 | 3132546 |
| 09/30/2019 | 2998821 | 3345311 | 3169841 |
| 12/31/2019 | 3221410 | 3648730 | 3412979 |
| 03/31/2020 | 2370510 | 2933652 | 2513603 |
| 06/30/2020 | 2809417 | 3536320 | 2988697 |
| 09/30/2020 | 2997816 | 3852094 | 3203457 |
| 12/31/2020 | 3384864 | 4320052 | 3624174 |
| 03/31/2021 | 3607061 | 4586814 | 3874249 |
| 06/30/2021 | 3883249 | 4978933 | 4184005 |
| 09/30/2021 | 3891556 | 5007913 | 4204941 |
| 12/31/2021 | 4313578 | 5560141 | 4671909 |
| 03/31/2022 | 4049189 | 5304457 | 4395104 |
| 06/30/2022 | 3527559 | 4450380 | 3841532 |
| 09/30/2022 | 3537086 | 4233086 | 3841532 |
| 12/31/2022 | 3557292 | 4553151 | 3841532 |
| 03/31/2023 | 3583678 | 4894505 | 3841532 |
| 06/30/2023 | 3641247 | 5322389 | 3873721 |
| 09/30/2023 | 3516514 | 5148165 | 3749849 |
| 12/31/2023 | 3948838 | 5750067 | 4225982 |
| 03/31/2024 | 4406639 | 6357039 | 4732447 |
| 06/30/2024 | 4509460 | 6629362 | 4856392 |
| 09/30/2024 | 4766514 | 7019604 | 5148355 |
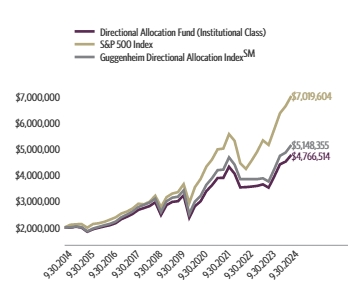
| Institutional Class | 35.55% | 9.71% | 9.07% |
| S&P 500 Index | 36.35% | 15.98% | 13.38% |
| Guggenheim Directional Allocation IndexSMGuggenheim Directional Allocation IndexSM | 37.30% | 10.19% | 9.92% |
The fund's past performance is not a good predictor of the fund's future performance. Visit GuggenheimInvestments.com/mutual-funds/performance for more recent performance information.
| Net Assets | $204,610,948 |
| Total Number of Portfolio Holdings | 140 |
| Portfolio Turnover Rate | 125% |
| Total Advisory Fees Paid | $1,634,512 |
| Guggenheim Directional Allocation Fund | Institutional Class | TVRIX | Annual Shareholder Report | September 30, 2024 |
| Technology | 26.9% |
| Consumer, Non-cyclical | 15.6% |
| Communications | 14.8% |
| Financial | 14.7% |
| Consumer, Cyclical | 12.0% |
| Industrial | 5.8% |
| Energy | 4.3% |
| Other | 5.6% |

| Microsoft Corp. | 7.1% |
| Apple, Inc. | 5.4% |
| NVIDIA Corp. | 5.0% |
| Alphabet, Inc. — Class C | 4.4% |
| Meta Platforms, Inc. — Class A | 3.2% |
| Amazon.com, Inc. | 2.3% |
| Tesla, Inc. | 2.1% |
| JPMorgan Chase & Co. | 2.0% |
| Visa, Inc. — Class A | 1.7% |
| Mastercard, Inc. — Class A | 1.7% |
| Top 10 Total | 34.9% |
| |
1 | "Holdings Diversification (Market Exposure as a % of Net Assets)" excludes any temporary cash investments, investments in Guggenheim Strategy Funds Trust mutual funds, or investments in Guggenheim Ultra Short Duration Fund. |
| |
2 | "10 Largest Holdings (as a % of Net Assets)" excludes any temporary cash investments. |
| Microsoft Corp. | 7.1% |
| Apple, Inc. | 5.4% |
| NVIDIA Corp. | 5.0% |
| Alphabet, Inc. — Class C | 4.4% |
| Meta Platforms, Inc. — Class A | 3.2% |
| Amazon.com, Inc. | 2.3% |
| Tesla, Inc. | 2.1% |
| JPMorgan Chase & Co. | 2.0% |
| Visa, Inc. — Class A | 1.7% |
| Mastercard, Inc. — Class A | 1.7% |
| Top 10 Total | 34.9% |
| |
2 | "10 Largest Holdings (as a % of Net Assets)" excludes any temporary cash investments. |
There were no changes in or disagreements with fund accountants for the period.
This is a summary of certain changes to the fund since September 30, 2023.
Subsequent to the September 30, 2024 year-end, on October 25, 2024, the fund was reorganized into New Age Alpha Allocation Fund, a series of New Age Alpha Funds Trust, pursuant to an Agreement and Plan of Reorganization approved by the Board of Trustees and shareholders of the fund.
| |  | Availability of Additional Information. For additional information, including financial information, holdings and proxy voting information, go to https://www.guggenheiminvestments.com/mutual-funds/literature or, call 800 820 0888. |
AR-TVRIX-093024
Annual Shareholder Report | 9.30.24
This annual shareholder report contains important information about the Guggenheim RBP® Dividend Fund for the period of October 1, 2023 to September 30, 2024. You can find additional information about the fund at https://www.guggenheiminvestments.com/mutual-funds/literature. You can also request this information by contacting 800 820 0888 or GuggenheimClientServices@mufg-is.com.
This report describes changes to the fund that occurred during the reporting period.
For the period of October 1, 2023 to September 30, 2024, the fund (Class A shares) returned 36.91%, outperforming the fund's benchmark, the S&P 500 Index, which returned 36.35% for the same period and underperforming the fund's secondary index, the Guggenheim RBP Dividend IndexSM, which returned 39.03% for the same period.
The fund's broad-based securities market index was changed from the Dow Jones U.S. Large-Cap Total Stock Market Index to the S&P 500 Index to comply with the regulation that requires the fund's broad-based securities market index to represent the overall applicable market.
What factors materially affected the fund's performance over the last year?
The fund's leading contributor was strong security selection in Information Technology and Health Care. An overweight holding in Nvidia Corp. was the largest benefit to the Information Technology sector, up 179% over the period. The biggest contribution to the Health Care sector's strong performance was an overweight position in Eli Lily, which rose 66% over the period. Among detractors was an underweight exposure to Energy and Information Technology. Security selection in Communication Services and Materials also detracted from performance. From a selection standpoint, an underweight in Meta Platforms was the largest negative individual contributor, as the stock soared 91% over the period. At the end of the period, the portfolio was most overweight in Utilities and Real Estate and most underweight in Information Technology and Health Care. Relative to the benchmark and consistent with the investment mandate, the portfolio has a larger exposure to dividend-yielding names, as well as smaller value companies.
Cumulative performance* for the fund's most recently completed 10 years (as of 9.30.24), assuming a $10,000 initial investment.
| 09/30/2014 | 9422 | 10000 | 10000 |
| 12/31/2014 | 9954 | 10493 | 10612 |
| 03/31/2015 | 10055 | 10593 | 10771 |
| 06/30/2015 | 9562 | 10622 | 10272 |
| 09/30/2015 | 9208 | 9939 | 9920 |
| 12/31/2015 | 9748 | 10638 | 10543 |
| 03/31/2016 | 10172 | 10782 | 11058 |
| 06/30/2016 | 10496 | 11047 | 11455 |
| 09/30/2016 | 10578 | 11472 | 11593 |
| 12/31/2016 | 10954 | 11911 | 12051 |
| 03/31/2017 | 11397 | 12633 | 12587 |
| 06/30/2017 | 11662 | 13023 | 12933 |
| 09/30/2017 | 12151 | 13607 | 13531 |
| 12/31/2017 | 13015 | 14511 | 14554 |
| 03/31/2018 | 12915 | 14401 | 14487 |
| 06/30/2018 | 13209 | 14896 | 14864 |
| 09/30/2018 | 13778 | 16044 | 15558 |
| 12/31/2018 | 12032 | 13875 | 13604 |
| 03/31/2019 | 13597 | 15769 | 15435 |
| 06/30/2019 | 13958 | 16447 | 15893 |
| 09/30/2019 | 14248 | 16727 | 16291 |
| 12/31/2019 | 15486 | 18244 | 17779 |
| 03/31/2020 | 10360 | 14668 | 11901 |
| 06/30/2020 | 12720 | 17682 | 14672 |
| 09/30/2020 | 13513 | 19260 | 15668 |
| 12/31/2020 | 16168 | 21600 | 18831 |
| 03/31/2021 | 18587 | 22934 | 21738 |
| 06/30/2021 | 19416 | 24895 | 22781 |
| 09/30/2021 | 18885 | 25040 | 22226 |
| 12/31/2021 | 20996 | 27801 | 24804 |
| 03/31/2022 | 20233 | 26522 | 23953 |
| 06/30/2022 | 17455 | 22252 | 20713 |
| 09/30/2022 | 16216 | 21165 | 19298 |
| 12/31/2022 | 18132 | 22766 | 21667 |
| 03/31/2023 | 18649 | 24473 | 22352 |
| 06/30/2023 | 19598 | 26612 | 23558 |
| 09/30/2023 | 19028 | 25741 | 22939 |
| 12/31/2023 | 21143 | 28750 | 25585 |
| 03/31/2024 | 23531 | 31785 | 28632 |
| 06/30/2024 | 24278 | 33147 | 29633 |
| 09/30/2024 | 26050 | 35098 | 31893 |
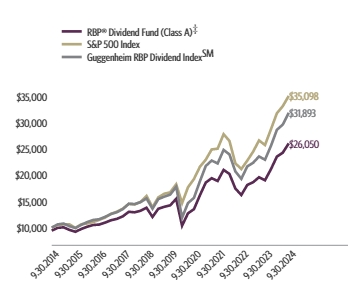
| Class A (without sales charge) | 36.91% | 12.83% | 10.70% |
| Class A (with sales charge)† | 30.39% | 11.73% | 10.05% |
| S&P 500 Index | 36.35% | 15.98% | 13.38% |
| Guggenheim RBP Dividend IndexSMGuggenheim RBP Dividend IndexSM | 39.03% | 14.38% | 12.30% |
The fund's past performance is not a good predictor of the fund's future performance. Visit GuggenheimInvestments.com/mutual-funds/performance for more recent performance information.
| Net Assets | $17,349,060 |
| Total Number of Portfolio Holdings | 108 |
| Portfolio Turnover Rate | 69% |
| Total Advisory Fees Paid | $0 |
The fund incurred $119,773 of advisory fees which were fully waived/reimbursed by the Adviser to ensure each Share Class of the fund operated at its applicable operating expense cap.
| Guggenheim RBP® Dividend Fund | Class A | TVEAX | Annual Shareholder Report | September 30, 2024 |
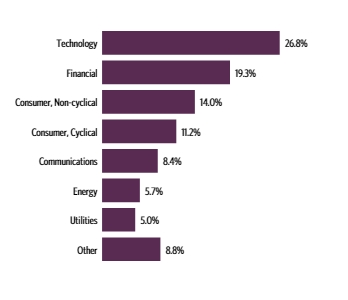
| Technology | 26.8% |
| Financial | 19.3% |
| Consumer, Non-cyclical | 14.0% |
| Consumer, Cyclical | 11.2% |
| Communications | 8.4% |
| Energy | 5.7% |
| Utilities | 5.0% |
| Other | 8.8% |
| Microsoft Corp. | 7.0% |
| NVIDIA Corp. | 6.4% |
| Apple, Inc. | 5.7% |
| Meta Platforms, Inc. — Class A | 3.4% |
| Alphabet, Inc. — Class C | 2.3% |
| Broadcom, Inc. | 2.3% |
| Eli Lilly & Co. | 2.2% |
| Mastercard, Inc. — Class A | 1.7% |
| Walmart, Inc. | 1.6% |
| Oracle Corp. | 1.5% |
| Top 10 Total | 34.1% |
| |
1 | "Holdings Diversification (Market Exposure as a % of Net Assets)" excludes any temporary cash investments, investments in Guggenheim Strategy Funds Trust mutual funds, or investments in Guggenheim Ultra Short Duration Fund. |
| |
2 | "10 Largest Holdings (as a % of Net Assets)" excludes any temporary cash investments. |
| Microsoft Corp. | 7.0% |
| NVIDIA Corp. | 6.4% |
| Apple, Inc. | 5.7% |
| Meta Platforms, Inc. — Class A | 3.4% |
| Alphabet, Inc. — Class C | 2.3% |
| Broadcom, Inc. | 2.3% |
| Eli Lilly & Co. | 2.2% |
| Mastercard, Inc. — Class A | 1.7% |
| Walmart, Inc. | 1.6% |
| Oracle Corp. | 1.5% |
| Top 10 Total | 34.1% |
| |
2 | "10 Largest Holdings (as a % of Net Assets)" excludes any temporary cash investments. |
There were no changes in or disagreements with fund accountants for the period.
This is a summary of certain changes to the fund since September 30, 2023.
Subsequent to the September 30, 2024 year-end, on October 25, 2024, the fund was reorganized into New Age Alpha Large Cap Value Fund, a series of New Age Alpha Funds Trust, pursuant to an Agreement and Plan of Reorganization approved by the Board of Trustees and shareholders of the fund.
| |  | Availability of Additional Information. For additional information, including financial information, holdings and proxy voting information, go to https://www.guggenheiminvestments.com/mutual-funds/literature or, call 800 820 0888. |
AR-TVEAX-093024
Annual Shareholder Report | 9.30.24
This annual shareholder report contains important information about the Guggenheim RBP® Dividend Fund for the period of October 1, 2023 to September 30, 2024. You can find additional information about the fund at https://www.guggenheiminvestments.com/mutual-funds/literature. You can also request this information by contacting 800 820 0888 or GuggenheimClientServices@mufg-is.com.
This report describes changes to the fund that occurred during the reporting period.
For the period of October 1, 2023 to September 30, 2024, the fund (Class C shares) returned 35.81%, underperforming the fund's benchmark, the S&P 500 Index, which returned 36.35% for the same period and underperforming the fund's secondary index, the Guggenheim RBP Dividend IndexSM, which returned 39.03% for the same period.
The fund's broad-based securities market index was changed from the Dow Jones U.S. Large-Cap Total Stock Market Index to the S&P 500 Index to comply with the regulation that requires the fund's broad-based securities market index to represent the overall applicable market.
What factors materially affected the fund's performance over the last year?
The fund's leading contributor was strong security selection in Information Technology and Health Care. An overweight holding in Nvidia Corp. was the largest benefit to the Information Technology sector, up 179% over the period. The biggest contribution to the Health Care sector's strong performance was an overweight position in Eli Lily, which rose 66% over the period. Among detractors was an underweight exposure to Energy and Information Technology. Security selection in Communication Services and Materials also detracted from performance. From a selection standpoint, an underweight in Meta Platforms was the largest negative individual contributor, as the stock soared 91% over the period. At the end of the period, the portfolio was most overweight in Utilities and Real Estate and most underweight in Information Technology and Health Care. Relative to the benchmark and consistent with the investment mandate, the portfolio has a larger exposure to dividend-yielding names, as well as smaller value companies.
Cumulative performance* for the fund's most recently completed 10 years (as of 9.30.24), assuming a $10,000 initial investment.
| 09/30/2014 | 10000 | 10000 | 10000 |
| 12/31/2014 | 10552 | 10493 | 10612 |
| 03/31/2015 | 10641 | 10593 | 10771 |
| 06/30/2015 | 10097 | 10622 | 10272 |
| 09/30/2015 | 9707 | 9939 | 9920 |
| 12/31/2015 | 10277 | 10638 | 10543 |
| 03/31/2016 | 10701 | 10782 | 11058 |
| 06/30/2016 | 11017 | 11047 | 11455 |
| 09/30/2016 | 11093 | 11472 | 11593 |
| 12/31/2016 | 11466 | 11911 | 12051 |
| 03/31/2017 | 11901 | 12633 | 12587 |
| 06/30/2017 | 12156 | 13023 | 12933 |
| 09/30/2017 | 12641 | 13607 | 13531 |
| 12/31/2017 | 13516 | 14511 | 14554 |
| 03/31/2018 | 13385 | 14401 | 14487 |
| 06/30/2018 | 13665 | 14896 | 14864 |
| 09/30/2018 | 14221 | 16044 | 15558 |
| 12/31/2018 | 12395 | 13875 | 13604 |
| 03/31/2019 | 13986 | 15769 | 15435 |
| 06/30/2019 | 14317 | 16447 | 15893 |
| 09/30/2019 | 14599 | 16727 | 16291 |
| 12/31/2019 | 15834 | 18244 | 17779 |
| 03/31/2020 | 10572 | 14668 | 11901 |
| 06/30/2020 | 12965 | 17682 | 14672 |
| 09/30/2020 | 13746 | 19260 | 15668 |
| 12/31/2020 | 16406 | 21600 | 18831 |
| 03/31/2021 | 18829 | 22934 | 21738 |
| 06/30/2021 | 19630 | 24895 | 22781 |
| 09/30/2021 | 19052 | 25040 | 22226 |
| 12/31/2021 | 21152 | 27801 | 24804 |
| 03/31/2022 | 20340 | 26522 | 23953 |
| 06/30/2022 | 17521 | 22252 | 20713 |
| 09/30/2022 | 16236 | 21165 | 19298 |
| 12/31/2022 | 18143 | 22766 | 21667 |
| 03/31/2023 | 18619 | 24473 | 22352 |
| 06/30/2023 | 19519 | 26612 | 23558 |
| 09/30/2023 | 18922 | 25741 | 22939 |
| 12/31/2023 | 20973 | 28750 | 25585 |
| 03/31/2024 | 23316 | 31785 | 28632 |
| 06/30/2024 | 23995 | 33147 | 29633 |
| 09/30/2024 | 25699 | 35098 | 31893 |

| Class C (without CDSC) | 35.81% | 11.97% | 9.90% |
| Class C (with CDSC)‡ | 34.81% | 11.97% | 9.90% |
| S&P 500 Index | 36.35% | 15.98% | 13.38% |
| Guggenheim RBP Dividend IndexSMGuggenheim RBP Dividend IndexSM | 39.03% | 14.38% | 12.30% |
The fund's past performance is not a good predictor of the fund's future performance. Visit GuggenheimInvestments.com/mutual-funds/performance for more recent performance information.
| Net Assets | $17,349,060 |
| Total Number of Portfolio Holdings | 108 |
| Portfolio Turnover Rate | 69% |
| Total Advisory Fees Paid | $0 |
The fund incurred $119,773 of advisory fees which were fully waived/reimbursed by the Adviser to ensure each Share Class of the fund operated at its applicable operating expense cap.
| Guggenheim RBP® Dividend Fund | Class C | TVECX | Annual Shareholder Report | September 30, 2024 |
| Technology | 26.8% |
| Financial | 19.3% |
| Consumer, Non-cyclical | 14.0% |
| Consumer, Cyclical | 11.2% |
| Communications | 8.4% |
| Energy | 5.7% |
| Utilities | 5.0% |
| Other | 8.8% |

| Microsoft Corp. | 7.0% |
| NVIDIA Corp. | 6.4% |
| Apple, Inc. | 5.7% |
| Meta Platforms, Inc. — Class A | 3.4% |
| Alphabet, Inc. — Class C | 2.3% |
| Broadcom, Inc. | 2.3% |
| Eli Lilly & Co. | 2.2% |
| Mastercard, Inc. — Class A | 1.7% |
| Walmart, Inc. | 1.6% |
| Oracle Corp. | 1.5% |
| Top 10 Total | 34.1% |
| |
1 | "Holdings Diversification (Market Exposure as a % of Net Assets)" excludes any temporary cash investments, investments in Guggenheim Strategy Funds Trust mutual funds, or investments in Guggenheim Ultra Short Duration Fund. |
| |
2 | "10 Largest Holdings (as a % of Net Assets)" excludes any temporary cash investments. |
| Microsoft Corp. | 7.0% |
| NVIDIA Corp. | 6.4% |
| Apple, Inc. | 5.7% |
| Meta Platforms, Inc. — Class A | 3.4% |
| Alphabet, Inc. — Class C | 2.3% |
| Broadcom, Inc. | 2.3% |
| Eli Lilly & Co. | 2.2% |
| Mastercard, Inc. — Class A | 1.7% |
| Walmart, Inc. | 1.6% |
| Oracle Corp. | 1.5% |
| Top 10 Total | 34.1% |
| |
2 | "10 Largest Holdings (as a % of Net Assets)" excludes any temporary cash investments. |
There were no changes in or disagreements with fund accountants for the period.
This is a summary of certain changes to the fund since September 30, 2023.
Subsequent to the September 30, 2024 year-end, on October 25, 2024, the fund was reorganized into New Age Alpha Large Cap Value Fund, a series of New Age Alpha Funds Trust, pursuant to an Agreement and Plan of Reorganization approved by the Board of Trustees and shareholders of the fund.
| |  | Availability of Additional Information. For additional information, including financial information, holdings and proxy voting information, go to https://www.guggenheiminvestments.com/mutual-funds/literature or, call 800 820 0888. |
AR-TVECX-093024
Annual Shareholder Report | 9.30.24
This annual shareholder report contains important information about the Guggenheim RBP® Dividend Fund for the period of October 1, 2023 to September 30, 2024. You can find additional information about the fund at https://www.guggenheiminvestments.com/mutual-funds/literature. You can also request this information by contacting 800 820 0888 or GuggenheimClientServices@mufg-is.com.
This report describes changes to the fund that occurred during the reporting period.
| Institutional Class | $109 | 0.92% |
For the period of October 1, 2023 to September 30, 2024, the fund (Institutional Class shares) returned 37.25%, outperforming the fund's benchmark, the S&P 500 Index, which returned 36.35% for the same period and underperforming the fund's secondary index, the Guggenheim RBP Dividend IndexSM, which returned 39.03% for the same period.
The fund's broad-based securities market index was changed from the Dow Jones U.S. Large-Cap Total Stock Market Index to the S&P 500 Index to comply with the regulation that requires the fund's broad-based securities market index to represent the overall applicable market.
What factors materially affected the fund's performance over the last year?
The fund's leading contributor was strong security selection in Information Technology and Health Care. An overweight holding in Nvidia Corp. was the largest benefit to the Information Technology sector, up 179% over the period. The biggest contribution to the Health Care sector's strong performance was an overweight position in Eli Lily, which rose 66% over the period. Among detractors was an underweight exposure to Energy and Information Technology. Security selection in Communication Services and Materials also detracted from performance. From a selection standpoint, an underweight in Meta Platforms was the largest negative individual contributor, as the stock soared 91% over the period. At the end of the period, the portfolio was most overweight in Utilities and Real Estate and most underweight in Information Technology and Health Care. Relative to the benchmark and consistent with the investment mandate, the portfolio has a larger exposure to dividend-yielding names, as well as smaller value companies.
Cumulative performance* for the fund's most recently completed 10 years (as of 9.30.24), assuming a $2,000,000 initial investment.
| 09/30/2014 | 2000000 | 2000000 | 2000000 |
| 12/31/2014 | 2115306 | 2098653 | 2122356 |
| 03/31/2015 | 2140310 | 2118603 | 2154294 |
| 06/30/2015 | 2035644 | 2124494 | 2054336 |
| 09/30/2015 | 1961412 | 1987710 | 1984077 |
| 12/31/2015 | 2080551 | 2127695 | 2108613 |
| 03/31/2016 | 2172022 | 2156373 | 2211674 |
| 06/30/2016 | 2243654 | 2209317 | 2291096 |
| 09/30/2016 | 2265027 | 2294422 | 2318582 |
| 12/31/2016 | 2345682 | 2382166 | 2410262 |
| 03/31/2017 | 2442792 | 2526671 | 2517375 |
| 06/30/2017 | 2500542 | 2604699 | 2586600 |
| 09/30/2017 | 2605729 | 2721399 | 2706126 |
| 12/31/2017 | 2793829 | 2902230 | 2910793 |
| 03/31/2018 | 2775194 | 2880198 | 2897460 |
| 06/30/2018 | 2839095 | 2979101 | 2972706 |
| 09/30/2018 | 2962931 | 3208812 | 3111512 |
| 12/31/2018 | 2591198 | 2774986 | 2720815 |
| 03/31/2019 | 2928496 | 3153716 | 3086932 |
| 06/30/2019 | 3007534 | 3289447 | 3178654 |
| 09/30/2019 | 3071458 | 3345311 | 3258193 |
| 12/31/2019 | 3339374 | 3648730 | 3555815 |
| 03/31/2020 | 2235336 | 2933652 | 2380295 |
| 06/30/2020 | 2747636 | 3536320 | 2934472 |
| 09/30/2020 | 2921566 | 3852094 | 3133565 |
| 12/31/2020 | 3497688 | 4320052 | 3766164 |
| 03/31/2021 | 4021524 | 4586814 | 4347501 |
| 06/30/2021 | 4204134 | 4978933 | 4556291 |
| 09/30/2021 | 4091942 | 5007913 | 4445274 |
| 12/31/2021 | 4552126 | 5560141 | 4960894 |
| 03/31/2022 | 4389335 | 5304457 | 4790585 |
| 06/30/2022 | 3789713 | 4450380 | 4142558 |
| 09/30/2022 | 3520420 | 4233086 | 3859604 |
| 12/31/2022 | 3944552 | 4553151 | 4333370 |
| 03/31/2023 | 4059813 | 4894505 | 4470366 |
| 06/30/2023 | 4266047 | 5322389 | 4711694 |
| 09/30/2023 | 4143048 | 5148165 | 4587853 |
| 12/31/2023 | 4605195 | 5750067 | 5116949 |
| 03/31/2024 | 5134276 | 6357039 | 5726495 |
| 06/30/2024 | 5295898 | 6629362 | 5926613 |
| 09/30/2024 | 5686344 | 7019604 | 6378675 |

| Institutional Class | 37.25% | 13.11% | 11.01% |
| S&P 500 Index | 36.35% | 15.98% | 13.38% |
| Guggenheim RBP Dividend IndexSMGuggenheim RBP Dividend IndexSM | 39.03% | 14.38% | 12.30% |
The fund's past performance is not a good predictor of the fund's future performance. Visit GuggenheimInvestments.com/mutual-funds/performance for more recent performance information.
| Net Assets | $17,349,060 |
| Total Number of Portfolio Holdings | 108 |
| Portfolio Turnover Rate | 69% |
| Total Advisory Fees Paid | $0 |
The fund incurred $119,773 of advisory fees which were fully waived/reimbursed by the Adviser to ensure each Share Class of the fund operated at its applicable operating expense cap.
| Guggenheim RBP® Dividend Fund | Institutional Class | TVEIX | Annual Shareholder Report | September 30, 2024 |
| Technology | 26.8% |
| Financial | 19.3% |
| Consumer, Non-cyclical | 14.0% |
| Consumer, Cyclical | 11.2% |
| Communications | 8.4% |
| Energy | 5.7% |
| Utilities | 5.0% |
| Other | 8.8% |

| Microsoft Corp. | 7.0% |
| NVIDIA Corp. | 6.4% |
| Apple, Inc. | 5.7% |
| Meta Platforms, Inc. — Class A | 3.4% |
| Alphabet, Inc. — Class C | 2.3% |
| Broadcom, Inc. | 2.3% |
| Eli Lilly & Co. | 2.2% |
| Mastercard, Inc. — Class A | 1.7% |
| Walmart, Inc. | 1.6% |
| Oracle Corp. | 1.5% |
| Top 10 Total | 34.1% |
| |
1 | "Holdings Diversification (Market Exposure as a % of Net Assets)" excludes any temporary cash investments, investments in Guggenheim Strategy Funds Trust mutual funds, or investments in Guggenheim Ultra Short Duration Fund. |
| |
2 | "10 Largest Holdings (as a % of Net Assets)" excludes any temporary cash investments. |
| Microsoft Corp. | 7.0% |
| NVIDIA Corp. | 6.4% |
| Apple, Inc. | 5.7% |
| Meta Platforms, Inc. — Class A | 3.4% |
| Alphabet, Inc. — Class C | 2.3% |
| Broadcom, Inc. | 2.3% |
| Eli Lilly & Co. | 2.2% |
| Mastercard, Inc. — Class A | 1.7% |
| Walmart, Inc. | 1.6% |
| Oracle Corp. | 1.5% |
| Top 10 Total | 34.1% |
| |
2 | "10 Largest Holdings (as a % of Net Assets)" excludes any temporary cash investments. |
There were no changes in or disagreements with fund accountants for the period.
This is a summary of certain changes to the fund since September 30, 2023.
Subsequent to the September 30, 2024 year-end, on October 25, 2024, the fund was reorganized into New Age Alpha Large Cap Value Fund, a series of New Age Alpha Funds Trust, pursuant to an Agreement and Plan of Reorganization approved by the Board of Trustees and shareholders of the fund.
| |  | Availability of Additional Information. For additional information, including financial information, holdings and proxy voting information, go to https://www.guggenheiminvestments.com/mutual-funds/literature or, call 800 820 0888. |
AR-TVEIX-093024
Annual Shareholder Report | 9.30.24
This annual shareholder report contains important information about the Guggenheim RBP® Dividend Fund for the period of October 1, 2023 to September 30, 2024. You can find additional information about the fund at https://www.guggenheiminvestments.com/mutual-funds/literature. You can also request this information by contacting 800 820 0888 or GuggenheimClientServices@mufg-is.com.
This report describes changes to the fund that occurred during the reporting period.
For the period of October 1, 2023 to September 30, 2024, the fund (Class P shares) returned 36.88%, outperforming the fund's benchmark, the S&P 500 Index, which returned 36.35% for the same period and underperforming the fund's secondary index, the Guggenheim RBP Dividend IndexSM, which returned 39.03% for the same period.
The fund's broad-based securities market index was changed from the Dow Jones U.S. Large-Cap Total Stock Market Index to the S&P 500 Index to comply with the regulation that requires the fund's broad-based securities market index to represent the overall applicable market.
What factors materially affected the fund's performance over the last year?
The fund's leading contributor was strong security selection in Information Technology and Health Care. An overweight holding in Nvidia Corp. was the largest benefit to the Information Technology sector, up 179% over the period. The biggest contribution to the Health Care sector's strong performance was an overweight position in Eli Lily, which rose 66% over the period. Among detractors was an underweight exposure to Energy and Information Technology. Security selection in Communication Services and Materials also detracted from performance. From a selection standpoint, an underweight in Meta Platforms was the largest negative individual contributor, as the stock soared 91% over the period. At the end of the period, the portfolio was most overweight in Utilities and Real Estate and most underweight in Information Technology and Health Care. Relative to the benchmark and consistent with the investment mandate, the portfolio has a larger exposure to dividend-yielding names, as well as smaller value companies.
Cumulative performance* for the fund's most recently completed 10 years (as of 9.30.24), assuming a $10,000 initial investment.
| 09/30/2014 | 10000 | 10000 | 10000 |
| 12/31/2014 | 10567 | 10493 | 10612 |
| 03/31/2015 | 10685 | 10593 | 10771 |
| 06/30/2015 | 10160 | 10622 | 10272 |
| 09/30/2015 | 9780 | 9939 | 9920 |
| 12/31/2015 | 10373 | 10638 | 10543 |
| 03/31/2016 | 10817 | 10782 | 11058 |
| 06/30/2016 | 11162 | 11047 | 11455 |
| 09/30/2016 | 11258 | 11472 | 11593 |
| 12/31/2016 | 11655 | 11911 | 12051 |
| 03/31/2017 | 12123 | 12633 | 12587 |
| 06/30/2017 | 12412 | 13023 | 12933 |
| 09/30/2017 | 12924 | 13607 | 13531 |
| 12/31/2017 | 13851 | 14511 | 14554 |
| 03/31/2018 | 13738 | 14401 | 14487 |
| 06/30/2018 | 14048 | 14896 | 14864 |
| 09/30/2018 | 14650 | 16044 | 15558 |
| 12/31/2018 | 12805 | 13875 | 13604 |
| 03/31/2019 | 14460 | 15769 | 15435 |
| 06/30/2019 | 14846 | 16447 | 15893 |
| 09/30/2019 | 15152 | 16727 | 16291 |
| 12/31/2019 | 16471 | 18244 | 17779 |
| 03/31/2020 | 11023 | 14668 | 11901 |
| 06/30/2020 | 13539 | 17682 | 14672 |
| 09/30/2020 | 14375 | 19260 | 15668 |
| 12/31/2020 | 17199 | 21600 | 18831 |
| 03/31/2021 | 19765 | 22934 | 21738 |
| 06/30/2021 | 20654 | 24895 | 22781 |
| 09/30/2021 | 20085 | 25040 | 22226 |
| 12/31/2021 | 22337 | 27801 | 24804 |
| 03/31/2022 | 21525 | 26522 | 23953 |
| 06/30/2022 | 18578 | 22252 | 20713 |
| 09/30/2022 | 17236 | 21165 | 19298 |
| 12/31/2022 | 19290 | 22766 | 21667 |
| 03/31/2023 | 19850 | 24473 | 22352 |
| 06/30/2023 | 20852 | 26612 | 23558 |
| 09/30/2023 | 20241 | 25741 | 22939 |
| 12/31/2023 | 22483 | 28750 | 25585 |
| 03/31/2024 | 25026 | 31785 | 28632 |
| 06/30/2024 | 25812 | 33147 | 29633 |
| 09/30/2024 | 27706 | 35098 | 31893 |
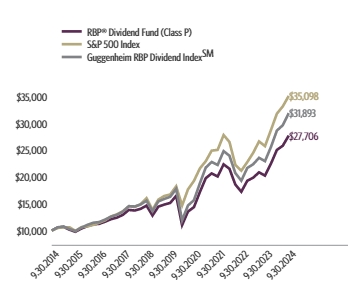
| Class P ** | 36.88% | 12.83% | 10.73% |
| S&P 500 Index | 36.35% | 15.98% | 13.38% |
| Guggenheim RBP Dividend IndexSMGuggenheim RBP Dividend IndexSM | 39.03% | 14.38% | 12.30% |
The fund's past performance is not a good predictor of the fund's future performance. Visit GuggenheimInvestments.com/mutual-funds/performance for more recent performance information.
| Net Assets | $17,349,060 |
| Total Number of Portfolio Holdings | 108 |
| Portfolio Turnover Rate | 69% |
| Total Advisory Fees Paid | $0 |
The fund incurred $119,773 of advisory fees which were fully waived/reimbursed by the Adviser to ensure each Share Class of the fund operated at its applicable operating expense cap.
| Guggenheim RBP® Dividend Fund | Class P | TVEFX | Annual Shareholder Report | September 30, 2024 |
| Technology | 26.8% |
| Financial | 19.3% |
| Consumer, Non-cyclical | 14.0% |
| Consumer, Cyclical | 11.2% |
| Communications | 8.4% |
| Energy | 5.7% |
| Utilities | 5.0% |
| Other | 8.8% |

| Microsoft Corp. | 7.0% |
| NVIDIA Corp. | 6.4% |
| Apple, Inc. | 5.7% |
| Meta Platforms, Inc. — Class A | 3.4% |
| Alphabet, Inc. — Class C | 2.3% |
| Broadcom, Inc. | 2.3% |
| Eli Lilly & Co. | 2.2% |
| Mastercard, Inc. — Class A | 1.7% |
| Walmart, Inc. | 1.6% |
| Oracle Corp. | 1.5% |
| Top 10 Total | 34.1% |
| |
1 | "Holdings Diversification (Market Exposure as a % of Net Assets)" excludes any temporary cash investments, investments in Guggenheim Strategy Funds Trust mutual funds, or investments in Guggenheim Ultra Short Duration Fund. |
| |
2 | "10 Largest Holdings (as a % of Net Assets)" excludes any temporary cash investments. |
| Microsoft Corp. | 7.0% |
| NVIDIA Corp. | 6.4% |
| Apple, Inc. | 5.7% |
| Meta Platforms, Inc. — Class A | 3.4% |
| Alphabet, Inc. — Class C | 2.3% |
| Broadcom, Inc. | 2.3% |
| Eli Lilly & Co. | 2.2% |
| Mastercard, Inc. — Class A | 1.7% |
| Walmart, Inc. | 1.6% |
| Oracle Corp. | 1.5% |
| Top 10 Total | 34.1% |
| |
2 | "10 Largest Holdings (as a % of Net Assets)" excludes any temporary cash investments. |
There were no changes in or disagreements with fund accountants for the period.
This is a summary of certain changes to the fund since September 30, 2023.
Subsequent to the September 30, 2024 year-end, on October 25, 2024, the fund was reorganized into New Age Alpha Large Cap Value Fund, a series of New Age Alpha Funds Trust, pursuant to an Agreement and Plan of Reorganization approved by the Board of Trustees and shareholders of the fund.
| |  | Availability of Additional Information. For additional information, including financial information, holdings and proxy voting information, go to https://www.guggenheiminvestments.com/mutual-funds/literature or, call 800 820 0888. |
AR-TVEFX-093024
Annual Shareholder Report | 9.30.24
This annual shareholder report contains important information about the Guggenheim RBP® Large-Cap Defensive Fund for the period of October 1, 2023 to September 30, 2024. You can find additional information about the fund at https://www.guggenheiminvestments.com/mutual-funds/literature. You can also request this information by contacting 800 820 0888 or GuggenheimClientServices@mufg-is.com.
This report describes changes to the fund that occurred during the reporting period.
For the period of October 1, 2023 to September 30, 2024, the fund (Class A shares) returned 33.50%, underperforming the fund's benchmark, the S&P 500 Index, which returned 36.35% for the same period and underperforming the fund's secondary index, the Guggenheim RBP Large-Cap Defensive IndexSM, which returned 35.29% for the same period.
The fund's broad-based securities market index was changed from the Dow Jones U.S. Large-Cap Total Stock Market Index to the S&P 500 Index to comply with the regulation that requires the fund's broad-based securities market index to represent the overall applicable market.
What factors materially affected the fund's performance over the last year?
The fund's investment strategy targets defensive stocks, which typically offer high quality, lower volatility, and lower beta. However, stocks with these characteristics often lag in periods of strong positive market returns. The fund's leading contributor was strong security selection and an overweight exposure to Utilities, with an overweight holding in Vistra Corp. providing the largest individual benefit, up 262% over the period. Detracting most from performance was an underweight exposure to, and security selection in, Financials. An underweight in Everest Group was the largest individual detractor, as the stock soared 70% over the period. At the end of the period, the portfolio was most overweight in Utilities and Consumer Staples. The largest underweights were Information Technology and Industrials. The portfolio has high quality characteristics compared to the benchmark, with higher exposures to more profitable, less leveraged, and less volatile companies.
Cumulative performance* for the fund's most recently completed 10 years (as of 9.30.24), assuming a $10,000 initial investment.
| 09/30/2014 | 9428 | 10000 | 10000 |
| 12/31/2014 | 10002 | 10493 | 10644 |
| 03/31/2015 | 10056 | 10593 | 10760 |
| 06/30/2015 | 10065 | 10622 | 10810 |
| 09/30/2015 | 9560 | 9939 | 10297 |
| 12/31/2015 | 9830 | 10638 | 10632 |
| 03/31/2016 | 10089 | 10782 | 10977 |
| 06/30/2016 | 10507 | 11047 | 11485 |
| 09/30/2016 | 10388 | 11472 | 11376 |
| 12/31/2016 | 10580 | 11911 | 11626 |
| 03/31/2017 | 11249 | 12633 | 12392 |
| 06/30/2017 | 11645 | 13023 | 12881 |
| 09/30/2017 | 12293 | 13607 | 13658 |
| 12/31/2017 | 13127 | 14511 | 14630 |
| 03/31/2018 | 13056 | 14401 | 14589 |
| 06/30/2018 | 13408 | 14896 | 15036 |
| 09/30/2018 | 14170 | 16044 | 15917 |
| 12/31/2018 | 12382 | 13875 | 13929 |
| 03/31/2019 | 14034 | 15769 | 15842 |
| 06/30/2019 | 14922 | 16447 | 16904 |
| 09/30/2019 | 15353 | 16727 | 17455 |
| 12/31/2019 | 16147 | 18244 | 18416 |
| 03/31/2020 | 12412 | 14668 | 14184 |
| 06/30/2020 | 14659 | 17682 | 16826 |
| 09/30/2020 | 15567 | 19260 | 17977 |
| 12/31/2020 | 17178 | 21600 | 19874 |
| 03/31/2021 | 17758 | 22934 | 20613 |
| 06/30/2021 | 19084 | 24895 | 22228 |
| 09/30/2021 | 18520 | 25040 | 21631 |
| 12/31/2021 | 21022 | 27801 | 24635 |
| 03/31/2022 | 19229 | 26522 | 22563 |
| 06/30/2022 | 16268 | 22252 | 19124 |
| 09/30/2022 | 15196 | 21165 | 17915 |
| 12/31/2022 | 16169 | 22766 | 19125 |
| 03/31/2023 | 17300 | 24473 | 20524 |
| 06/30/2023 | 18373 | 26612 | 21854 |
| 09/30/2023 | 17710 | 25741 | 21132 |
| 12/31/2023 | 19519 | 28750 | 23379 |
| 03/31/2024 | 21786 | 31785 | 26174 |
| 06/30/2024 | 22450 | 33147 | 27083 |
| 09/30/2024 | 23642 | 35098 | 28590 |
| Class A (without sales charge) | 33.50% | 9.02% | 9.63% |
| Class A (with sales charge)† | 27.19% | 7.97% | 8.99% |
| S&P 500 Index | 36.35% | 15.98% | 13.38% |
| Guggenheim RBP Large-Cap Defensive IndexSMGuggenheim RBP Large-Cap Defensive IndexSM | 35.29% | 10.37% | 11.08% |
The fund's past performance is not a good predictor of the fund's future performance. Visit GuggenheimInvestments.com/mutual-funds/performance for more recent performance information.
| Net Assets | $7,529,053 |
| Total Number of Portfolio Holdings | 101 |
| Portfolio Turnover Rate | 72% |
| Total Advisory Fees Paid | $0 |
The fund incurred $57,176 of advisory fees which were fully waived/reimbursed by the Adviser to ensure each Share Class of the fund operated at its applicable operating expense cap.
| Guggenheim RBP® Large-Cap Defensive Fund | Class A | TVDAX | Annual Shareholder Report | September 30, 2024 |
| Technology | 22.4% |
| Consumer, Non-cyclical | 21.7% |
| Communications | 18.2% |
| Financial | 14.6% |
| Utilities | 7.6% |
| Consumer, Cyclical | 6.1% |
| Industrial | 3.8% |
| Other | 4.7% |
| Microsoft Corp. | 7.4% |
| NVIDIA Corp. | 5.2% |
| Apple, Inc. | 5.1% |
| Alphabet, Inc. — Class C | 4.8% |
| Amazon.com, Inc. | 4.2% |
| Meta Platforms, Inc. — Class A | 3.9% |
| Eli Lilly & Co. | 2.7% |
| JPMorgan Chase & Co. | 2.6% |
| Visa, Inc. — Class A | 2.2% |
| Mastercard, Inc. — Class A | 2.2% |
| Top 10 Total | 40.3% |
| |
1 | "Holdings Diversification (Market Exposure as a % of Net Assets)" excludes any temporary cash investments, investments in Guggenheim Strategy Funds Trust mutual funds, or investments in Guggenheim Ultra Short Duration Fund. |
| |
2 | "10 Largest Holdings (as a % of Net Assets)" excludes any temporary cash investments. |
| Microsoft Corp. | 7.4% |
| NVIDIA Corp. | 5.2% |
| Apple, Inc. | 5.1% |
| Alphabet, Inc. — Class C | 4.8% |
| Amazon.com, Inc. | 4.2% |
| Meta Platforms, Inc. — Class A | 3.9% |
| Eli Lilly & Co. | 2.7% |
| JPMorgan Chase & Co. | 2.6% |
| Visa, Inc. — Class A | 2.2% |
| Mastercard, Inc. — Class A | 2.2% |
| Top 10 Total | 40.3% |
| |
2 | "10 Largest Holdings (as a % of Net Assets)" excludes any temporary cash investments. |
There were no changes in or disagreements with fund accountants for the period.
This is a summary of certain changes to the fund since September 30, 2023.
Subsequent to the September 30, 2024 year-end, on October 25, 2024, the fund was reorganized into New Age Alpha Large Cap Value Fund, a series of New Age Alpha Funds Trust, pursuant to an Agreement and Plan of Reorganization approved by the Board of Trustees and shareholders of the fund.
| |  | Availability of Additional Information. For additional information, including financial information, holdings and proxy voting information, go to https://www.guggenheiminvestments.com/mutual-funds/literature or, call 800 820 0888. |
AR-TVDAX-093024
Annual Shareholder Report | 9.30.24
This annual shareholder report contains important information about the Guggenheim RBP® Large-Cap Defensive Fund for the period of October 1, 2023 to September 30, 2024. You can find additional information about the fund at https://www.guggenheiminvestments.com/mutual-funds/literature. You can also request this information by contacting 800 820 0888 or GuggenheimClientServices@mufg-is.com.
This report describes changes to the fund that occurred during the reporting period.
For the period of October 1, 2023 to September 30, 2024, the fund (Class P shares) returned 33.52%, underperforming the fund's benchmark, the S&P 500 Index, which returned 36.35% for the same period and underperforming the fund's secondary index, the Guggenheim RBP Large-Cap Defensive IndexSM, which returned 35.29% for the same period.
The fund's broad-based securities market index was changed from the Dow Jones U.S. Large-Cap Total Stock Market Index to the S&P 500 Index to comply with the regulation that requires the fund's broad-based securities market index to represent the overall applicable market.
What factors materially affected the fund's performance over the last year?
The fund's investment strategy targets defensive stocks, which typically offer high quality, lower volatility, and lower beta. However, stocks with these characteristics often lag in periods of strong positive market returns. The fund's leading contributor was strong security selection and an overweight exposure to Utilities, with an overweight holding in Vistra Corp. providing the largest individual benefit, up 262% over the period. Detracting most from performance was an underweight exposure to, and security selection in, Financials. An underweight in Everest Group was the largest individual detractor, as the stock soared 70% over the period. At the end of the period, the portfolio was most overweight in Utilities and Consumer Staples. The largest underweights were Information Technology and Industrials. The portfolio has high quality characteristics compared to the benchmark, with higher exposures to more profitable, less leveraged, and less volatile companies.
Cumulative performance* for the fund's most recently completed 10 years (as of 9.30.24), assuming a $10,000 initial investment.
| 09/30/2014 | 10000 | 10000 | 10000 |
| 12/31/2014 | 10601 | 10493 | 10644 |
| 03/31/2015 | 10667 | 10593 | 10760 |
| 06/30/2015 | 10686 | 10622 | 10810 |
| 09/30/2015 | 10148 | 9939 | 10297 |
| 12/31/2015 | 10438 | 10638 | 10632 |
| 03/31/2016 | 10728 | 10782 | 10977 |
| 06/30/2016 | 11174 | 11047 | 11485 |
| 09/30/2016 | 11050 | 11472 | 11376 |
| 12/31/2016 | 11247 | 11911 | 11626 |
| 03/31/2017 | 11952 | 12633 | 12392 |
| 06/30/2017 | 12375 | 13023 | 12881 |
| 09/30/2017 | 13070 | 13607 | 13658 |
| 12/31/2017 | 13956 | 14511 | 14630 |
| 03/31/2018 | 13883 | 14401 | 14589 |
| 06/30/2018 | 14260 | 14896 | 15036 |
| 09/30/2018 | 15074 | 16044 | 15917 |
| 12/31/2018 | 13158 | 13875 | 13929 |
| 03/31/2019 | 14917 | 15769 | 15842 |
| 06/30/2019 | 15861 | 16447 | 16904 |
| 09/30/2019 | 16319 | 16727 | 17455 |
| 12/31/2019 | 17181 | 18244 | 18416 |
| 03/31/2020 | 13203 | 14668 | 14184 |
| 06/30/2020 | 15590 | 17682 | 16826 |
| 09/30/2020 | 16554 | 19260 | 17977 |
| 12/31/2020 | 18256 | 21600 | 19874 |
| 03/31/2021 | 18882 | 22934 | 20613 |
| 06/30/2021 | 20291 | 24895 | 22228 |
| 09/30/2021 | 19696 | 25040 | 21631 |
| 12/31/2021 | 22343 | 27801 | 24635 |
| 03/31/2022 | 20440 | 26522 | 22563 |
| 06/30/2022 | 17287 | 22252 | 19124 |
| 09/30/2022 | 16157 | 21165 | 17915 |
| 12/31/2022 | 17188 | 22766 | 19125 |
| 03/31/2023 | 18398 | 24473 | 20524 |
| 06/30/2023 | 19528 | 26612 | 21854 |
| 09/30/2023 | 18814 | 25741 | 21132 |
| 12/31/2023 | 20744 | 28750 | 23379 |
| 03/31/2024 | 23151 | 31785 | 26174 |
| 06/30/2024 | 23867 | 33147 | 27083 |
| 09/30/2024 | 25120 | 35098 | 28590 |
| Class P** | 33.52% | 9.01% | 9.65% |
| S&P 500 Index | 36.35% | 15.98% | 13.38% |
| Guggenheim RBP Large-Cap Defensive IndexSMGuggenheim RBP Large-Cap Defensive IndexSM | 35.29% | 10.37% | 11.08% |
The fund's past performance is not a good predictor of the fund's future performance. Visit GuggenheimInvestments.com/mutual-funds/performance for more recent performance information.
| Net Assets | $7,529,053 |
| Total Number of Portfolio Holdings | 101 |
| Portfolio Turnover Rate | 72% |
| Total Advisory Fees Paid | $0 |
The fund incurred $57,176 of advisory fees which were fully waived/reimbursed by the Adviser to ensure each Share Class of the fund operated at its applicable operating expense cap.
| Guggenheim RBP® Large-Cap Defensive Fund | Class P | TVFDX | Annual Shareholder Report | September 30, 2024 |
| Technology | 22.4% |
| Consumer, Non-cyclical | 21.7% |
| Communications | 18.2% |
| Financial | 14.6% |
| Utilities | 7.6% |
| Consumer, Cyclical | 6.1% |
| Industrial | 3.8% |
| Other | 4.7% |

| Microsoft Corp. | 7.4% |
| NVIDIA Corp. | 5.2% |
| Apple, Inc. | 5.1% |
| Alphabet, Inc. — Class C | 4.8% |
| Amazon.com, Inc. | 4.2% |
| Meta Platforms, Inc. — Class A | 3.9% |
| Eli Lilly & Co. | 2.7% |
| JPMorgan Chase & Co. | 2.6% |
| Visa, Inc. — Class A | 2.2% |
| Mastercard, Inc. — Class A | 2.2% |
| Top 10 Total | 40.3% |
| |
1 | "Holdings Diversification (Market Exposure as a % of Net Assets)" excludes any temporary cash investments, investments in Guggenheim Strategy Funds Trust mutual funds, or investments in Guggenheim Ultra Short Duration Fund. |
| |
2 | "10 Largest Holdings (as a % of Net Assets)" excludes any temporary cash investments. |
| Microsoft Corp. | 7.4% |
| NVIDIA Corp. | 5.2% |
| Apple, Inc. | 5.1% |
| Alphabet, Inc. — Class C | 4.8% |
| Amazon.com, Inc. | 4.2% |
| Meta Platforms, Inc. — Class A | 3.9% |
| Eli Lilly & Co. | 2.7% |
| JPMorgan Chase & Co. | 2.6% |
| Visa, Inc. — Class A | 2.2% |
| Mastercard, Inc. — Class A | 2.2% |
| Top 10 Total | 40.3% |
| |
2 | "10 Largest Holdings (as a % of Net Assets)" excludes any temporary cash investments. |
There were no changes in or disagreements with fund accountants for the period.
This is a summary of certain changes to the fund since September 30, 2023.
Subsequent to the September 30, 2024 year-end, on October 25, 2024, the fund was reorganized into New Age Alpha Large Cap Value Fund, a series of New Age Alpha Funds Trust, pursuant to an Agreement and Plan of Reorganization approved by the Board of Trustees and shareholders of the fund.
| |  | Availability of Additional Information. For additional information, including financial information, holdings and proxy voting information, go to https://www.guggenheiminvestments.com/mutual-funds/literature or, call 800 820 0888. |
AR-TVFDX-093024
Annual Shareholder Report | 9.30.24
This annual shareholder report contains important information about the Guggenheim RBP® Large-Cap Defensive Fund for the period of October 1, 2023 to September 30, 2024. You can find additional information about the fund at https://www.guggenheiminvestments.com/mutual-funds/literature. You can also request this information by contacting 800 820 0888 or GuggenheimClientServices@mufg-is.com.
This report describes changes to the fund that occurred during the reporting period.
For the period of October 1, 2023 to September 30, 2024, the fund (Class C shares) returned 32.42%, underperforming the fund's benchmark, the S&P 500 Index, which returned 36.35% for the same period and underperforming the fund's secondary index, the Guggenheim RBP Large-Cap Defensive IndexSM, which returned 35.29% for the same period.
The fund's broad-based securities market index was changed from the Dow Jones U.S. Large-Cap Total Stock Market Index to the S&P 500 Index to comply with the regulation that requires the fund's broad-based securities market index to represent the overall applicable market.
What factors materially affected the fund's performance over the last year?
The fund's investment strategy targets defensive stocks, which typically offer high quality, lower volatility, and lower beta. However, stocks with these characteristics often lag in periods of strong positive market returns. The fund's leading contributor was strong security selection and an overweight exposure to Utilities, with an overweight holding in Vistra Corp. providing the largest individual benefit, up 262% over the period. Detracting most from performance was an underweight exposure to, and security selection in, Financials. An underweight in Everest Group was the largest individual detractor, as the stock soared 70% over the period. At the end of the period, the portfolio was most overweight in Utilities and Consumer Staples. The largest underweights were Information Technology and Industrials. The portfolio has high quality characteristics compared to the benchmark, with higher exposures to more profitable, less leveraged, and less volatile companies.
Cumulative performance* for the fund's most recently completed 10 years (as of 9.30.24), assuming a $10,000 initial investment.
| 09/30/2014 | 10000 | 10000 | 10000 |
| 12/31/2014 | 10585 | 10493 | 10644 |
| 03/31/2015 | 10633 | 10593 | 10760 |
| 06/30/2015 | 10624 | 10622 | 10810 |
| 09/30/2015 | 10077 | 9939 | 10297 |
| 12/31/2015 | 10344 | 10638 | 10632 |
| 03/31/2016 | 10609 | 10782 | 10977 |
| 06/30/2016 | 11032 | 11047 | 11485 |
| 09/30/2016 | 10884 | 11472 | 11376 |
| 12/31/2016 | 11065 | 11911 | 11626 |
| 03/31/2017 | 11730 | 12633 | 12392 |
| 06/30/2017 | 12118 | 13023 | 12881 |
| 09/30/2017 | 12772 | 13607 | 13658 |
| 12/31/2017 | 13615 | 14511 | 14630 |
| 03/31/2018 | 13515 | 14401 | 14589 |
| 06/30/2018 | 13851 | 14896 | 15036 |
| 09/30/2018 | 14622 | 16044 | 15917 |
| 12/31/2018 | 12745 | 13875 | 13929 |
| 03/31/2019 | 14426 | 15769 | 15842 |
| 06/30/2019 | 15312 | 16447 | 16904 |
| 09/30/2019 | 15710 | 16727 | 17455 |
| 12/31/2019 | 16505 | 18244 | 18416 |
| 03/31/2020 | 12655 | 14668 | 14184 |
| 06/30/2020 | 14927 | 17682 | 16826 |
| 09/30/2020 | 15827 | 19260 | 17977 |
| 12/31/2020 | 17421 | 21600 | 19874 |
| 03/31/2021 | 17986 | 22934 | 20613 |
| 06/30/2021 | 19293 | 24895 | 22228 |
| 09/30/2021 | 18680 | 25040 | 21631 |
| 12/31/2021 | 21145 | 27801 | 24635 |
| 03/31/2022 | 19325 | 26522 | 22563 |
| 06/30/2022 | 16314 | 22252 | 19124 |
| 09/30/2022 | 15205 | 21165 | 17915 |
| 12/31/2022 | 16167 | 22766 | 19125 |
| 03/31/2023 | 17255 | 24473 | 20524 |
| 06/30/2023 | 18280 | 26612 | 21854 |
| 09/30/2023 | 17589 | 25741 | 21132 |
| 12/31/2023 | 19367 | 28750 | 23379 |
| 03/31/2024 | 21563 | 31785 | 26174 |
| 06/30/2024 | 22191 | 33147 | 27083 |
| 09/30/2024 | 23320 | 35098 | 28590 |
| Class C (without CDSC) | 32.42% | 8.22% | 8.84% |
| Class C (with CDSC)‡ | 31.42% | 8.22% | 8.84% |
| S&P 500 Index | 36.35% | 15.98% | 13.38% |
| Guggenheim RBP Large-Cap Defensive IndexSMGuggenheim RBP Large-Cap Defensive IndexSM | 35.29% | 10.37% | 11.08% |
The fund's past performance is not a good predictor of the fund's future performance. Visit GuggenheimInvestments.com/mutual-funds/performance for more recent performance information.
| Net Assets | $7,529,053 |
| Total Number of Portfolio Holdings | 101 |
| Portfolio Turnover Rate | 72% |
| Total Advisory Fees Paid | $0 |
The fund incurred $57,176 of advisory fees which were fully waived/reimbursed by the Adviser to ensure each Share Class of the fund operated at its applicable operating expense cap.
| Guggenheim RBP® Large-Cap Defensive Fund | Class C | TVDCX | Annual Shareholder Report | September 30, 2024 |
| Technology | 22.4% |
| Consumer, Non-cyclical | 21.7% |
| Communications | 18.2% |
| Financial | 14.6% |
| Utilities | 7.6% |
| Consumer, Cyclical | 6.1% |
| Industrial | 3.8% |
| Other | 4.7% |

| Microsoft Corp. | 7.4% |
| NVIDIA Corp. | 5.2% |
| Apple, Inc. | 5.1% |
| Alphabet, Inc. — Class C | 4.8% |
| Amazon.com, Inc. | 4.2% |
| Meta Platforms, Inc. — Class A | 3.9% |
| Eli Lilly & Co. | 2.7% |
| JPMorgan Chase & Co. | 2.6% |
| Visa, Inc. — Class A | 2.2% |
| Mastercard, Inc. — Class A | 2.2% |
| Top 10 Total | 40.3% |
| |
1 | "Holdings Diversification (Market Exposure as a % of Net Assets)" excludes any temporary cash investments, investments in Guggenheim Strategy Funds Trust mutual funds, or investments in Guggenheim Ultra Short Duration Fund. |
| |
2 | "10 Largest Holdings (as a % of Net Assets)" excludes any temporary cash investments. |
| Microsoft Corp. | 7.4% |
| NVIDIA Corp. | 5.2% |
| Apple, Inc. | 5.1% |
| Alphabet, Inc. — Class C | 4.8% |
| Amazon.com, Inc. | 4.2% |
| Meta Platforms, Inc. — Class A | 3.9% |
| Eli Lilly & Co. | 2.7% |
| JPMorgan Chase & Co. | 2.6% |
| Visa, Inc. — Class A | 2.2% |
| Mastercard, Inc. — Class A | 2.2% |
| Top 10 Total | 40.3% |
| |
2 | "10 Largest Holdings (as a % of Net Assets)" excludes any temporary cash investments. |
There were no changes in or disagreements with fund accountants for the period.
This is a summary of certain changes to the fund since September 30, 2023.
Subsequent to the September 30, 2024 year-end, on October 25, 2024, the fund was reorganized into New Age Alpha Large Cap Value Fund, a series of New Age Alpha Funds Trust, pursuant to an Agreement and Plan of Reorganization approved by the Board of Trustees and shareholders of the fund.
| |  | Availability of Additional Information. For additional information, including financial information, holdings and proxy voting information, go to https://www.guggenheiminvestments.com/mutual-funds/literature or, call 800 820 0888. |
AR-TVDCX-093024
Annual Shareholder Report | 9.30.24
This annual shareholder report contains important information about the Guggenheim RBP® Large-Cap Defensive Fund for the period of October 1, 2023 to September 30, 2024. You can find additional information about the fund at https://www.guggenheiminvestments.com/mutual-funds/literature. You can also request this information by contacting 800 820 0888 or GuggenheimClientServices@mufg-is.com.
This report describes changes to the fund that occurred during the reporting period.
| Institutional Class | $108 | 0.92% |
For the period of October 1, 2023 to September 30, 2024, the fund (Institutional Class shares) returned 33.82%, underperforming the fund's benchmark, the S&P 500 Index, which returned 36.35% for the same period and underperforming the fund's secondary index, the Guggenheim RBP Large-Cap Defensive IndexSM, which returned 35.29% for the same period.
The fund's broad-based securities market index was changed from the Dow Jones U.S. Large-Cap Total Stock Market Index to the S&P 500 Index to comply with the regulation that requires the fund's broad-based securities market index to represent the overall applicable market.
What factors materially affected the fund's performance over the last year?
The fund's investment strategy targets defensive stocks, which typically offer high quality, lower volatility, and lower beta. However, stocks with these characteristics often lag in periods of strong positive market returns. The fund's leading contributor was strong security selection and an overweight exposure to Utilities, with an overweight holding in Vistra Corp. providing the largest individual benefit, up 262% over the period. Detracting most from performance was an underweight exposure to, and security selection in, Financials. An underweight in Everest Group was the largest individual detractor, as the stock soared 70% over the period. At the end of the period, the portfolio was most overweight in Utilities and Consumer Staples. The largest underweights were Information Technology and Industrials. The portfolio has high quality characteristics compared to the benchmark, with higher exposures to more profitable, less leveraged, and less volatile companies.
Cumulative performance* for the fund's most recently completed 10 years (as of 9.30.24), assuming a $2,000,000 initial investment.
| 09/30/2014 | 2000000 | 2000000 | 2000000 |
| 12/31/2014 | 2122977 | 2098653 | 2128775 |
| 03/31/2015 | 2136093 | 2118603 | 2151943 |
| 06/30/2015 | 2141715 | 2124494 | 2161922 |
| 09/30/2015 | 2034910 | 1987710 | 2059484 |
| 12/31/2015 | 2094597 | 2127695 | 2126497 |
| 03/31/2016 | 2152266 | 2156373 | 2195331 |
| 06/30/2016 | 2244947 | 2209317 | 2297005 |
| 09/30/2016 | 2220232 | 2294422 | 2275293 |
| 12/31/2016 | 2262578 | 2382166 | 2325133 |
| 03/31/2017 | 2405477 | 2526671 | 2478392 |
| 06/30/2017 | 2492083 | 2604699 | 2576223 |
| 09/30/2017 | 2632818 | 2721399 | 2731521 |
| 12/31/2017 | 2813069 | 2902230 | 2925957 |
| 03/31/2018 | 2798494 | 2880198 | 2917841 |
| 06/30/2018 | 2876230 | 2979101 | 3007289 |
| 09/30/2018 | 3041418 | 3208812 | 3183376 |
| 12/31/2018 | 2658246 | 2774986 | 2785715 |
| 03/31/2019 | 3016693 | 3153716 | 3168338 |
| 06/30/2019 | 3208821 | 3289447 | 3380806 |
| 09/30/2019 | 3303451 | 3345311 | 3491048 |
| 12/31/2019 | 3479073 | 3648730 | 3683173 |
| 03/31/2020 | 2673846 | 2933652 | 2836871 |
| 06/30/2020 | 3162514 | 3536320 | 3365279 |
| 09/30/2020 | 3359211 | 3852094 | 3595321 |
| 12/31/2020 | 3708661 | 4320052 | 3974734 |
| 03/31/2021 | 3838070 | 4586814 | 4122626 |
| 06/30/2021 | 4125294 | 4978933 | 4445544 |
| 09/30/2021 | 4005354 | 5007913 | 4326114 |
| 12/31/2021 | 4548886 | 5560141 | 4927096 |
| 03/31/2022 | 4166158 | 5304457 | 4512651 |
| 06/30/2022 | 3524290 | 4450380 | 3824753 |
| 09/30/2022 | 3297045 | 4233086 | 3583005 |
| 12/31/2022 | 3509576 | 4553151 | 3824934 |
| 03/31/2023 | 3757123 | 4894505 | 4104834 |
| 06/30/2023 | 3988699 | 5322389 | 4370777 |
| 09/30/2023 | 3848955 | 5148165 | 4226461 |
| 12/31/2023 | 4244695 | 5750067 | 4675767 |
| 03/31/2024 | 4741713 | 6357039 | 5234772 |
| 06/30/2024 | 4890017 | 6629362 | 5416674 |
| 09/30/2024 | 5150551 | 7019604 | 5717929 |
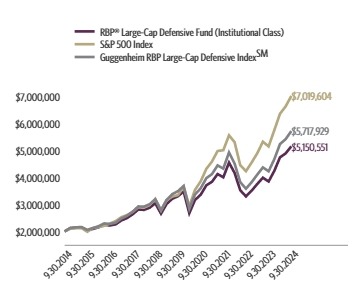
| Institutional Class | 33.82% | 9.29% | 9.92% |
| S&P 500 Index | 36.35% | 15.98% | 13.38% |
| Guggenheim RBP Large-Cap Defensive IndexSMGuggenheim RBP Large-Cap Defensive IndexSM | 35.29% | 10.37% | 11.08% |
The fund's past performance is not a good predictor of the fund's future performance. Visit GuggenheimInvestments.com/mutual-funds/performance for more recent performance information.
| Net Assets | $7,529,053 |
| Total Number of Portfolio Holdings | 101 |
| Portfolio Turnover Rate | 72% |
| Total Advisory Fees Paid | $0 |
The fund incurred $57,176 of advisory fees which were fully waived/reimbursed by the Adviser to ensure each Share Class of the fund operated at its applicable operating expense cap.
| Guggenheim RBP® Large-Cap Defensive Fund | Institutional Class | TVIDX | Annual Shareholder Report | September 30, 2024 |
| Technology | 22.4% |
| Consumer, Non-cyclical | 21.7% |
| Communications | 18.2% |
| Financial | 14.6% |
| Utilities | 7.6% |
| Consumer, Cyclical | 6.1% |
| Industrial | 3.8% |
| Other | 4.7% |

| Microsoft Corp. | 7.4% |
| NVIDIA Corp. | 5.2% |
| Apple, Inc. | 5.1% |
| Alphabet, Inc. — Class C | 4.8% |
| Amazon.com, Inc. | 4.2% |
| Meta Platforms, Inc. — Class A | 3.9% |
| Eli Lilly & Co. | 2.7% |
| JPMorgan Chase & Co. | 2.6% |
| Visa, Inc. — Class A | 2.2% |
| Mastercard, Inc. — Class A | 2.2% |
| Top 10 Total | 40.3% |
| |
1 | "Holdings Diversification (Market Exposure as a % of Net Assets)" excludes any temporary cash investments, investments in Guggenheim Strategy Funds Trust mutual funds, or investments in Guggenheim Ultra Short Duration Fund. |
| |
2 | "10 Largest Holdings (as a % of Net Assets)" excludes any temporary cash investments. |
| Microsoft Corp. | 7.4% |
| NVIDIA Corp. | 5.2% |
| Apple, Inc. | 5.1% |
| Alphabet, Inc. — Class C | 4.8% |
| Amazon.com, Inc. | 4.2% |
| Meta Platforms, Inc. — Class A | 3.9% |
| Eli Lilly & Co. | 2.7% |
| JPMorgan Chase & Co. | 2.6% |
| Visa, Inc. — Class A | 2.2% |
| Mastercard, Inc. — Class A | 2.2% |
| Top 10 Total | 40.3% |
| |
2 | "10 Largest Holdings (as a % of Net Assets)" excludes any temporary cash investments. |
There were no changes in or disagreements with fund accountants for the period.
This is a summary of certain changes to the fund since September 30, 2023.
Subsequent to the September 30, 2024 year-end, on October 25, 2024, the fund was reorganized into New Age Alpha Large Cap Value Fund, a series of New Age Alpha Funds Trust, pursuant to an Agreement and Plan of Reorganization approved by the Board of Trustees and shareholders of the fund.
| |  | Availability of Additional Information. For additional information, including financial information, holdings and proxy voting information, go to https://www.guggenheiminvestments.com/mutual-funds/literature or, call 800 820 0888. |
AR-TVIDX-093024
Annual Shareholder Report | 9.30.24
This annual shareholder report contains important information about the Guggenheim RBP® Large-Cap Value Fund for the period of October 1, 2023 to September 30, 2024. You can find additional information about the fund at https://www.guggenheiminvestments.com/mutual-funds/literature. You can also request this information by contacting 800 820 0888 or GuggenheimClientServices@mufg-is.com.
This report describes changes to the fund that occurred during the reporting period.
For the period of October 1, 2023 to September 30, 2024, the fund (Class A shares) returned 26.49%, underperforming the fund's benchmark, the S&P 500 Index, which returned 36.35% for the same period and underperforming the fund's secondary index, the Guggenheim RBP Large-Cap Value IndexSM, which returned 28.27% for the same period.
The fund's broad-based securities market index was changed from the Dow Jones U.S. Large-Cap Total Stock Market Index to the S&P 500 Index to comply with the regulation that requires the fund's broad-based securities market index to represent the overall applicable market.
What factors materially affected the fund's performance over the last year?
The fund's leading sector contributors were Financials and Utilities. The Financials sector outperformed the benchmark primarily by its overweight holding in Progressive Corp., which was up 83% over the period. The fund's overweight to the Utilities sector also contributed; the sector rose 42% over the period. The largest detractors to performance were a relative underweight to the strongly performing Information Technology sector and a relative overweight to the Energy sector, where performance was flat for the period. At the end of the period, the portfolio was most underweight in Information Technology and most overweight in Industrials and Financials. The portfolio has a noticeable bias toward smaller companies, with a higher exposure to value companies, while having less exposure to growth companies and companies with earnings variability relative to the benchmark.
Cumulative performance* for the fund's most recently completed 10 years (as of 9.30.24), assuming a $10,000 initial investment.
| 09/30/2014 | 9426 | 10000 | 10000 |
| 12/31/2014 | 10043 | 10493 | 10691 |
| 03/31/2015 | 9923 | 10593 | 10590 |
| 06/30/2015 | 9564 | 10622 | 10248 |
| 09/30/2015 | 9086 | 9939 | 9769 |
| 12/31/2015 | 9623 | 10638 | 10386 |
| 03/31/2016 | 9825 | 10782 | 10660 |
| 06/30/2016 | 10080 | 11047 | 10994 |
| 09/30/2016 | 10271 | 11472 | 11227 |
| 12/31/2016 | 10971 | 11911 | 12031 |
| 03/31/2017 | 11462 | 12633 | 12598 |
| 06/30/2017 | 11636 | 13023 | 12842 |
| 09/30/2017 | 12127 | 13607 | 13447 |
| 12/31/2017 | 12816 | 14511 | 14272 |
| 03/31/2018 | 12779 | 14401 | 14288 |
| 06/30/2018 | 12804 | 14896 | 14365 |
| 09/30/2018 | 13505 | 16044 | |
| 12/31/2018 | 11678 | 13875 | 13158 |
| 03/31/2019 | 13308 | 15769 | 15055 |
| 06/30/2019 | 13550 | 16447 | 15372 |
| 09/30/2019 | 13847 | 16727 | 15747 |
| 12/31/2019 | 14634 | 18244 | 16709 |
| 03/31/2020 | 10500 | 14668 | 11930 |
| 06/30/2020 | 12184 | 17682 | 13946 |
| 09/30/2020 | 12731 | 19260 | 14625 |
| 12/31/2020 | 14550 | 21600 | 16771 |
| 03/31/2021 | 15912 | 22934 | 18404 |
| 06/30/2021 | 16991 | 24895 | 19751 |
| 09/30/2021 | 16594 | 25040 | 19345 |
| 12/31/2021 | 18391 | 27801 | 21512 |
| 03/31/2022 | 17770 | 26522 | 20838 |
| 06/30/2022 | 15778 | 22252 | 18521 |
| 09/30/2022 | 14765 | 21165 | 17386 |
| 12/31/2022 | 16917 | 22766 | 19978 |
| 03/31/2023 | 16816 | 24473 | 19878 |
| 06/30/2023 | 17018 | 26612 | 20163 |
| 09/30/2023 | 16278 | 25741 | 19347 |
| 12/31/2023 | 17629 | 28750 | 21007 |
| 03/31/2024 | 19460 | 31785 | 23291 |
| 06/30/2024 | 18861 | 33147 | 22647 |
| 09/30/2024 | 20590 | 35098 | 24815 |
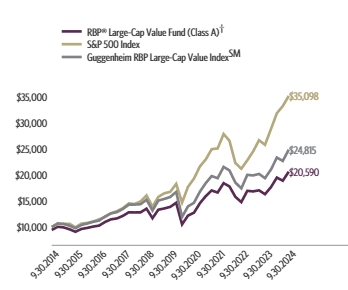
| Class A (without sales charge) | 26.49% | 8.26% | 8.13% |
| Class A (with sales charge)† | 20.51% | 7.22% | 7.49% |
| S&P 500 Index | 36.35% | 15.98% | 13.38% |
| Guggenheim RBP Large-Cap Value IndexSMGuggenheim RBP Large-Cap Value IndexSM | 28.27% | 9.52% | 9.51% |
The fund's past performance is not a good predictor of the fund's future performance. Visit GuggenheimInvestments.com/mutual-funds/performance for more recent performance information.
| Net Assets | $5,009,622 |
| Total Number of Portfolio Holdings | 121 |
| Portfolio Turnover Rate | 73% |
| Total Advisory Fees Paid | $0 |
The fund incurred $32,924 of advisory fees which were fully waived/reimbursed by the Adviser to ensure each Share Class of the fund operated at its applicable operating expense cap.
| Guggenheim RBP® Large-Cap Value Fund | Class A | TVVAX | Annual Shareholder Report | September 30, 2024 |
| Financial | 23.4% |
| Consumer, Non-cyclical | 20.4% |
| Consumer, Cyclical | 14.2% |
| Industrial | 13.3% |
| Technology | 7.4% |
| Energy | 6.7% |
| Utilities | 5.6% |
| Other | 8.2% |

| JPMorgan Chase & Co. | 2.8% |
| Exxon Mobil Corp. | 2.5% |
| Walmart, Inc. | 2.4% |
| Oracle Corp. | 2.1% |
| Coca-Cola Co. | 2.1% |
| Procter & Gamble Co. | 2.1% |
| Merck & Company, Inc. | 2.0% |
| iShares S&P 500 Value ETF | 1.9% |
| PepsiCo, Inc. | 1.9% |
| Wells Fargo & Co. | 1.8% |
| Top 10 Total | 21.6% |
| |
1 | "Holdings Diversification (Market Exposure as a % of Net Assets)" excludes any temporary cash investments, investments in Guggenheim Strategy Funds Trust mutual funds, or investments in Guggenheim Ultra Short Duration Fund. |
| |
2 | "10 Largest Holdings (as a % of Net Assets)" excludes any temporary cash investments. |
| JPMorgan Chase & Co. | 2.8% |
| Exxon Mobil Corp. | 2.5% |
| Walmart, Inc. | 2.4% |
| Oracle Corp. | 2.1% |
| Coca-Cola Co. | 2.1% |
| Procter & Gamble Co. | 2.1% |
| Merck & Company, Inc. | 2.0% |
| iShares S&P 500 Value ETF | 1.9% |
| PepsiCo, Inc. | 1.9% |
| Wells Fargo & Co. | 1.8% |
| Top 10 Total | 21.6% |
| |
2 | "10 Largest Holdings (as a % of Net Assets)" excludes any temporary cash investments. |
There were no changes in or disagreements with fund accountants for the period.
This is a summary of certain changes to the fund since September 30, 2023.
Subsequent to the September 30, 2024 year-end, on October 25, 2024, the fund was reorganized into New Age Alpha Large Cap Value Fund, a series of New Age Alpha Funds Trust, pursuant to an Agreement and Plan of Reorganization approved by the Board of Trustees and shareholders of the fund.
| |  | Availability of Additional Information. For additional information, including financial information, holdings and proxy voting information, go to https://www.guggenheiminvestments.com/mutual-funds/literature or, call 800 820 0888. |
AR-TVVAX-093024
Annual Shareholder Report | 9.30.24
This annual shareholder report contains important information about the Guggenheim RBP® Large-Cap Value Fund for the period of October 1, 2023 to September 30, 2024. You can find additional information about the fund at https://www.guggenheiminvestments.com/mutual-funds/literature. You can also request this information by contacting 800 820 0888 or GuggenheimClientServices@mufg-is.com.
This report describes changes to the fund that occurred during the reporting period.
For the period of October 1, 2023 to September 30, 2024, the fund (Class C shares) returned 25.52%, underperforming the fund's benchmark, the S&P 500 Index, which returned 36.35% for the same period and underperforming the fund's secondary index, the Guggenheim RBP Large-Cap Value IndexSM, which returned 28.27% for the same period.
The fund's broad-based securities market index was changed from the Dow Jones U.S. Large-Cap Total Stock Market Index to the S&P 500 Index to comply with the regulation that requires the fund's broad-based securities market index to represent the overall applicable market.
What factors materially affected the fund's performance over the last year?
The fund's leading sector contributors were Financials and Utilities. The Financials sector outperformed the benchmark primarily by its overweight holding in Progressive Corp., which was up 83% over the period. The fund's overweight to the Utilities sector also contributed; the sector rose 42% over the period. The largest detractors to performance were a relative underweight to the strongly performing Information Technology sector and a relative overweight to the Energy sector, where performance was flat for the period. At the end of the period, the portfolio was most underweight in Information Technology and most overweight in Industrials and Financials. The portfolio has a noticeable bias toward smaller companies, with a higher exposure to value companies, while having less exposure to growth companies and companies with earnings variability relative to the benchmark.
Cumulative performance* for the fund's most recently completed 10 years (as of 9.30.24), assuming a $10,000 initial investment.
| 09/30/2014 | 10000 | 10000 | 10000 |
| 12/31/2014 | 10643 | 10493 | 10691 |
| 03/31/2015 | 10462 | 10593 | 10590 |
| 06/30/2015 | 10078 | 10622 | 10248 |
| 09/30/2015 | 9555 | 9939 | 9769 |
| 12/31/2015 | 10110 | 10638 | 10386 |
| 03/31/2016 | 10302 | 10782 | 10660 |
| 06/30/2016 | 10551 | 11047 | 10994 |
| 09/30/2016 | 10732 | 11472 | 11227 |
| 12/31/2016 | 11438 | 11911 | 12031 |
| 03/31/2017 | 11930 | 12633 | 12598 |
| 06/30/2017 | 12090 | 13023 | 12842 |
| 09/30/2017 | 12571 | 13607 | 13447 |
| 12/31/2017 | 13257 | 14511 | 14272 |
| 03/31/2018 | 13207 | 14401 | 14288 |
| 06/30/2018 | 13207 | 14896 | 14365 |
| 09/30/2018 | 13896 | 16044 | 15223 |
| 12/31/2018 | 11999 | 13875 | 13158 |
| 03/31/2019 | 13646 | 15769 | 15055 |
| 06/30/2019 | 13869 | 16447 | 15372 |
| 09/30/2019 | 14148 | 16727 | 15747 |
| 12/31/2019 | 14926 | 18244 | 16709 |
| 03/31/2020 | 10696 | 14668 | 11930 |
| 06/30/2020 | 12379 | 17682 | 13946 |
| 09/30/2020 | 12903 | 19260 | 14625 |
| 12/31/2020 | 14728 | 21600 | 16771 |
| 03/31/2021 | 16060 | 22934 | 18404 |
| 06/30/2021 | 17136 | 24895 | 19751 |
| 09/30/2021 | 16697 | 25040 | 19345 |
| 12/31/2021 | 18465 | 27801 | 21512 |
| 03/31/2022 | 17822 | 26522 | 20838 |
| 06/30/2022 | 15792 | 22252 | 18521 |
| 09/30/2022 | 14752 | 21165 | 17386 |
| 12/31/2022 | 16863 | 22766 | 19978 |
| 03/31/2023 | 16727 | 24473 | 19878 |
| 06/30/2023 | 16897 | 26612 | 20163 |
| 09/30/2023 | 16131 | 25741 | 19347 |
| 12/31/2023 | 17444 | 28750 | 21007 |
| 03/31/2024 | 19205 | 31785 | 23291 |
| 06/30/2024 | 18589 | 33147 | 22647 |
| 09/30/2024 | 20248 | 35098 | 24815 |
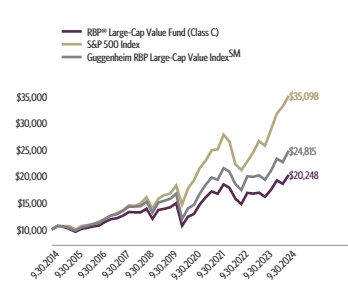
| Class C (without CDSC) | 25.52% | 7.43% | 7.31% |
| Class C (with CDSC)‡ | 24.52% | 7.43% | 7.31% |
| S&P 500 Index | 36.35% | 15.98% | 13.38% |
| Guggenheim RBP Large-Cap Value IndexSMGuggenheim RBP Large-Cap Value IndexSM | 28.27% | 9.52% | 9.51% |
The fund's past performance is not a good predictor of the fund's future performance. Visit GuggenheimInvestments.com/mutual-funds/performance for more recent performance information.
| Net Assets | $5,009,622 |
| Total Number of Portfolio Holdings | 121 |
| Portfolio Turnover Rate | 73% |
| Total Advisory Fees Paid | $0 |
The fund incurred $32,924 of advisory fees which were fully waived/reimbursed by the Adviser to ensure each Share Class of the fund operated at its applicable operating expense cap.
| Guggenheim RBP® Large-Cap Value Fund | Class C | TVVCX | Annual Shareholder Report | September 30, 2024 |
| Financial | 23.4% |
| Consumer, Non-cyclical | 20.4% |
| Consumer, Cyclical | 14.2% |
| Industrial | 13.3% |
| Technology | 7.4% |
| Energy | 6.7% |
| Utilities | 5.6% |
| Other | 8.2% |

| JPMorgan Chase & Co. | 2.8% |
| Exxon Mobil Corp. | 2.5% |
| Walmart, Inc. | 2.4% |
| Oracle Corp. | 2.1% |
| Coca-Cola Co. | 2.1% |
| Procter & Gamble Co. | 2.1% |
| Merck & Company, Inc. | 2.0% |
| iShares S&P 500 Value ETF | 1.9% |
| PepsiCo, Inc. | 1.9% |
| Wells Fargo & Co. | 1.8% |
| Top 10 Total | 21.6% |
| |
1 | "Holdings Diversification (Market Exposure as a % of Net Assets)" excludes any temporary cash investments, investments in Guggenheim Strategy Funds Trust mutual funds, or investments in Guggenheim Ultra Short Duration Fund. |
| |
2 | "10 Largest Holdings (as a % of Net Assets)" excludes any temporary cash investments. |
| JPMorgan Chase & Co. | 2.8% |
| Exxon Mobil Corp. | 2.5% |
| Walmart, Inc. | 2.4% |
| Oracle Corp. | 2.1% |
| Coca-Cola Co. | 2.1% |
| Procter & Gamble Co. | 2.1% |
| Merck & Company, Inc. | 2.0% |
| iShares S&P 500 Value ETF | 1.9% |
| PepsiCo, Inc. | 1.9% |
| Wells Fargo & Co. | 1.8% |
| Top 10 Total | 21.6% |
| |
2 | "10 Largest Holdings (as a % of Net Assets)" excludes any temporary cash investments. |
There were no changes in or disagreements with fund accountants for the period.
This is a summary of certain changes to the fund since September 30, 2023.
Subsequent to the September 30, 2024 year-end, on October 25, 2024, the fund was reorganized into New Age Alpha Large Cap Value Fund, a series of New Age Alpha Funds Trust, pursuant to an Agreement and Plan of Reorganization approved by the Board of Trustees and shareholders of the fund.
| |  | Availability of Additional Information. For additional information, including financial information, holdings and proxy voting information, go to https://www.guggenheiminvestments.com/mutual-funds/literature or, call 800 820 0888. |
AR-TVVCX-093024
Annual Shareholder Report | 9.30.24
This annual shareholder report contains important information about the Guggenheim RBP® Large-Cap Value Fund for the period of October 1, 2023 to September 30, 2024. You can find additional information about the fund at https://www.guggenheiminvestments.com/mutual-funds/literature. You can also request this information by contacting 800 820 0888 or GuggenheimClientServices@mufg-is.com.
This report describes changes to the fund that occurred during the reporting period.
| Institutional Class | $104 | 0.92% |
For the period of October 1, 2023 to September 30, 2024, the fund (Institutional Class shares) returned 26.82%, underperforming the fund's benchmark, the S&P 500 Index, which returned 36.35% for the same period and underperforming the fund's secondary index, the Guggenheim RBP Large-Cap Value IndexSM, which returned 28.27% for the same period.
The fund's broad-based securities market index was changed from the Dow Jones U.S. Large-Cap Total Stock Market Index to the S&P 500 Index to comply with the regulation that requires the fund's broad-based securities market index to represent the overall applicable market.
What factors materially affected the fund's performance over the last year?
The fund's leading sector contributors were Financials and Utilities. The Financials sector outperformed the benchmark primarily by its overweight holding in Progressive Corp., which was up 83% over the period. The fund's overweight to the Utilities sector also contributed; the sector rose 42% over the period. The largest detractors to performance were a relative underweight to the strongly performing Information Technology sector and a relative overweight to the Energy sector, where performance was flat for the period. At the end of the period, the portfolio was most underweight in Information Technology and most overweight in Industrials and Financials. The portfolio has a noticeable bias toward smaller companies, with a higher exposure to value companies, while having less exposure to growth companies and companies with earnings variability relative to the benchmark.
Cumulative performance* for the fund's most recently completed 10 years (as of 9.30.24), assuming a $2,000,000 initial investment.
| 09/30/2014 | 2000000 | 2000000 | 2000000 |
| 12/31/2014 | 2134167 | 2098653 | 2138185 |
| 03/31/2015 | 2108583 | 2118603 | 2117912 |
| 06/30/2015 | 2033962 | 2124494 | 2049532 |
| 09/30/2015 | 1933756 | 1987710 | 1953853 |
| 12/31/2015 | 2051853 | 2127695 | 2077261 |
| 03/31/2016 | 2095218 | 2156373 | 2132061 |
| 06/30/2016 | 2152277 | 2209317 | 2198701 |
| 09/30/2016 | 2193360 | 2294422 | 2245311 |
| 12/31/2016 | 2345143 | 2382166 | 2406156 |
| 03/31/2017 | 2451636 | 2526671 | 2519627 |
| 06/30/2017 | 2490991 | 2604699 | 2568470 |
| 09/30/2017 | 2597484 | 2721399 | 2689354 |
| 12/31/2017 | 2747666 | 2902230 | 2854487 |
| 03/31/2018 | 2742554 | 2880198 | 2857624 |
| 06/30/2018 | 2747666 | 2979101 | 2872970 |
| 09/30/2018 | 2901024 | 3208812 | 3044628 |
| 12/31/2018 | 2509324 | 2774986 | 2631631 |
| 03/31/2019 | 2861259 | 3153716 | 3011029 |
| 06/30/2019 | 2915623 | 3289447 | 3074453 |
| 09/30/2019 | 2981432 | 3345311 | 3149333 |
| 12/31/2019 | 3151091 | 3648730 | 3341886 |
| 03/31/2020 | 2263295 | 2933652 | 2386008 |
| 06/30/2020 | 2628343 | 3536320 | 2789128 |
| 09/30/2020 | 2745158 | 3852094 | 2925033 |
| 12/31/2020 | 3140695 | 4320052 | 3354155 |
| 03/31/2021 | 3437267 | 4586814 | 3680743 |
| 06/30/2021 | 3674524 | 4978933 | 3950235 |
| 09/30/2021 | 3588519 | 5007913 | 3869044 |
| 12/31/2021 | 3977603 | 5560141 | 4302436 |
| 03/31/2022 | 3850841 | 5304457 | 4167566 |
| 06/30/2022 | 3419163 | 4450380 | 3704113 |
| 09/30/2022 | 3203324 | 4233086 | 3477224 |
| 12/31/2022 | 3669898 | 4553151 | 3995544 |
| 03/31/2023 | 3652152 | 4894505 | 3975601 |
| 06/30/2023 | 3694742 | 5322389 | 4032552 |
| 09/30/2023 | 3538577 | 5148165 | 3869381 |
| 12/31/2023 | 3836283 | 5750067 | 4201465 |
| 03/31/2024 | 4235745 | 6357039 | 4658160 |
| 06/30/2024 | 4106190 | 6629362 | 4529310 |
| 09/30/2024 | 4487659 | 7019604 | 4963094 |
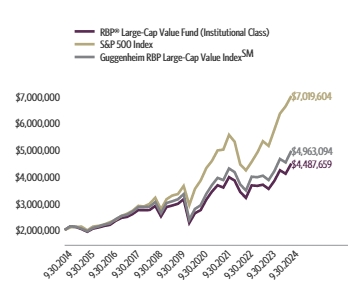
| Institutional Class | 26.82% | 8.52% | 8.42% |
| S&P 500 Index | 36.35% | 15.98% | 13.38% |
| Guggenheim RBP Large-Cap Value IndexSMGuggenheim RBP Large-Cap Value IndexSM | 28.27% | 9.52% | 9.51% |
The fund's past performance is not a good predictor of the fund's future performance. Visit GuggenheimInvestments.com/mutual-funds/performance for more recent performance information.
| Net Assets | $5,009,622 |
| Total Number of Portfolio Holdings | 121 |
| Portfolio Turnover Rate | 73% |
| Total Advisory Fees Paid | $0 |
The fund incurred $32,924 of advisory fees which were fully waived/reimbursed by the Adviser to ensure each Share Class of the fund operated at its applicable operating expense cap.
| Guggenheim RBP® Large-Cap Value Fund | Institutional Class | TVVIX | Annual Shareholder Report | September 30, 2024 |
| Financial | 23.4% |
| Consumer, Non-cyclical | 20.4% |
| Consumer, Cyclical | 14.2% |
| Industrial | 13.3% |
| Technology | 7.4% |
| Energy | 6.7% |
| Utilities | 5.6% |
| Other | 8.2% |

| JPMorgan Chase & Co. | 2.8% |
| Exxon Mobil Corp. | 2.5% |
| Walmart, Inc. | 2.4% |
| Oracle Corp. | 2.1% |
| Coca-Cola Co. | 2.1% |
| Procter & Gamble Co. | 2.1% |
| Merck & Company, Inc. | 2.0% |
| iShares S&P 500 Value ETF | 1.9% |
| PepsiCo, Inc. | 1.9% |
| Wells Fargo & Co. | 1.8% |
| Top 10 Total | 21.6% |
| |
1 | "Holdings Diversification (Market Exposure as a % of Net Assets)" excludes any temporary cash investments, investments in Guggenheim Strategy Funds Trust mutual funds, or investments in Guggenheim Ultra Short Duration Fund. |
| |
2 | "10 Largest Holdings (as a % of Net Assets)" excludes any temporary cash investments. |
| JPMorgan Chase & Co. | 2.8% |
| Exxon Mobil Corp. | 2.5% |
| Walmart, Inc. | 2.4% |
| Oracle Corp. | 2.1% |
| Coca-Cola Co. | 2.1% |
| Procter & Gamble Co. | 2.1% |
| Merck & Company, Inc. | 2.0% |
| iShares S&P 500 Value ETF | 1.9% |
| PepsiCo, Inc. | 1.9% |
| Wells Fargo & Co. | 1.8% |
| Top 10 Total | 21.6% |
| |
2 | "10 Largest Holdings (as a % of Net Assets)" excludes any temporary cash investments. |
There were no changes in or disagreements with fund accountants for the period.
This is a summary of certain changes to the fund since September 30, 2023.
Subsequent to the September 30, 2024 year-end, on October 25, 2024, the fund was reorganized into New Age Alpha Large Cap Value Fund, a series of New Age Alpha Funds Trust, pursuant to an Agreement and Plan of Reorganization approved by the Board of Trustees and shareholders of the fund.
| |  | Availability of Additional Information. For additional information, including financial information, holdings and proxy voting information, go to https://www.guggenheiminvestments.com/mutual-funds/literature or, call 800 820 0888. |
AR-TVVIX-093024
Annual Shareholder Report | 9.30.24
This annual shareholder report contains important information about the Guggenheim RBP® Large-Cap Value Fund for the period of October 1, 2023 to September 30, 2024. You can find additional information about the fund at https://www.guggenheiminvestments.com/mutual-funds/literature. You can also request this information by contacting 800 820 0888 or GuggenheimClientServices@mufg-is.com.
This report describes changes to the fund that occurred during the reporting period.
For the period of October 1, 2023 to September 30, 2024, the fund (Class P shares) returned 26.43%, underperforming the fund's benchmark, the S&P 500 Index, which returned 36.35% for the same period and underperforming the fund's secondary index, the Guggenheim RBP Large-Cap Value IndexSM, which returned 28.27% for the same period.
The fund's broad-based securities market index was changed from the Dow Jones U.S. Large-Cap Total Stock Market Index to the S&P 500 Index to comply with the regulation that requires the fund's broad-based securities market index to represent the overall applicable market.
What factors materially affected the fund's performance over the last year?
The fund's leading sector contributors were Financials and Utilities. The Financials sector outperformed the benchmark primarily by its overweight holding in Progressive Corp., which was up 83% over the period. The fund's overweight to the Utilities sector also contributed; the sector rose 42% over the period. The largest detractors to performance were a relative underweight to the strongly performing Information Technology sector and a relative overweight to the Energy sector, where performance was flat for the period. At the end of the period, the portfolio was most underweight in Information Technology and most overweight in Industrials and Financials. The portfolio has a noticeable bias toward smaller companies, with a higher exposure to value companies, while having less exposure to growth companies and companies with earnings variability relative to the benchmark.
Cumulative performance* for the fund's most recently completed 10 years (as of 9.30.24), assuming a $10,000 initial investment.
| 09/30/2014 | 10000 | 10000 | 10000 |
| 12/31/2014 | 10659 | 10493 | 10691 |
| 03/31/2015 | 10529 | 10593 | 10590 |
| 06/30/2015 | 10152 | 10622 | 10248 |
| 09/30/2015 | 9644 | 9939 | 9769 |
| 12/31/2015 | 10224 | 10638 | 10386 |
| 03/31/2016 | 10443 | 10782 | 10660 |
| 06/30/2016 | 10720 | 11047 | 10994 |
| 09/30/2016 | 10916 | 11472 | 11227 |
| 12/31/2016 | 11662 | 11911 | 12031 |
| 03/31/2017 | 12183 | 12633 | 12598 |
| 06/30/2017 | 12369 | 13023 | 12842 |
| 09/30/2017 | 12890 | 13607 | 13447 |
| 12/31/2017 | 13620 | 14511 | 14272 |
| 03/31/2018 | 13594 | 14401 | 14288 |
| 06/30/2018 | 13620 | 14896 | 14365 |
| 09/30/2018 | 14360 | 16044 | 15223 |
| 12/31/2018 | 12422 | 13875 | 13158 |
| 03/31/2019 | 14159 | 15769 | 15055 |
| 06/30/2019 | 14402 | 16447 | 15372 |
| 09/30/2019 | 14715 | 16727 | 15747 |
| 12/31/2019 | 15562 | 18244 | 16709 |
| 03/31/2020 | 11162 | 14668 | 11930 |
| 06/30/2020 | 12954 | 17682 | 13946 |
| 09/30/2020 | 13522 | 19260 | 14625 |
| 12/31/2020 | 15462 | 21600 | 16771 |
| 03/31/2021 | 16907 | 22934 | 18404 |
| 06/30/2021 | 18047 | 24895 | 19751 |
| 09/30/2021 | 17621 | 25040 | 19345 |
| 12/31/2021 | 19529 | 27801 | 21512 |
| 03/31/2022 | 18878 | 26522 | 20838 |
| 06/30/2022 | 16767 | 22252 | 18521 |
| 09/30/2022 | 15694 | 21165 | 17386 |
| 12/31/2022 | 17960 | 22766 | 19978 |
| 03/31/2023 | 17870 | 24473 | 19878 |
| 06/30/2023 | 18069 | 26612 | 20163 |
| 09/30/2023 | 17307 | 25741 | 19347 |
| 12/31/2023 | 18732 | 28750 | 21007 |
| 03/31/2024 | 20678 | 31785 | 23291 |
| 06/30/2024 | 20048 | 33147 | 22647 |
| 09/30/2024 | 21882 | 35098 | 24815 |
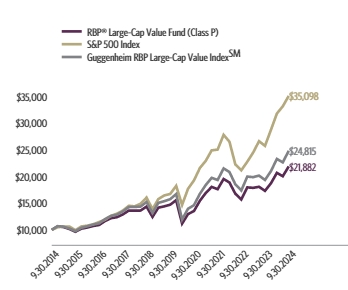
| Class P** | 26.43% | 8.26% | 8.15% |
| S&P 500 Index | 36.35% | 15.98% | 13.38% |
| Guggenheim RBP Large-Cap Value IndexSMGuggenheim RBP Large-Cap Value IndexSM | 28.27% | 9.52% | 9.51% |
The fund's past performance is not a good predictor of the fund's future performance. Visit GuggenheimInvestments.com/mutual-funds/performance for more recent performance information.
| Net Assets | $5,009,622 |
| Total Number of Portfolio Holdings | 121 |
| Portfolio Turnover Rate | 73% |
| Total Advisory Fees Paid | $0 |
The fund incurred $32,924 of advisory fees which were fully waived/reimbursed by the Adviser to ensure each Share Class of the fund operated at its applicable operating expense cap.
| Guggenheim RBP® Large-Cap Value Fund | Class P | TVVFX | Annual Shareholder Report | September 30, 2024 |
| Financial | 23.4% |
| Consumer, Non-cyclical | 20.4% |
| Consumer, Cyclical | 14.2% |
| Industrial | 13.3% |
| Technology | 7.4% |
| Energy | 6.7% |
| Utilities | 5.6% |
| Other | 8.2% |
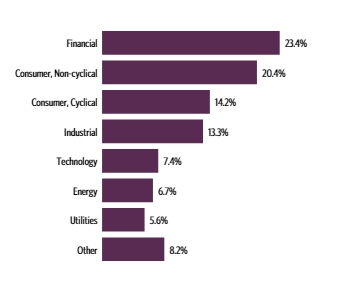
| JPMorgan Chase & Co. | 2.8% |
| Exxon Mobil Corp. | 2.5% |
| Walmart, Inc. | 2.4% |
| Oracle Corp. | 2.1% |
| Coca-Cola Co. | 2.1% |
| Procter & Gamble Co. | 2.1% |
| Merck & Company, Inc. | 2.0% |
| iShares S&P 500 Value ETF | 1.9% |
| PepsiCo, Inc. | 1.9% |
| Wells Fargo & Co. | 1.8% |
| Top 10 Total | 21.6% |
| |
1 | "Holdings Diversification (Market Exposure as a % of Net Assets)" excludes any temporary cash investments, investments in Guggenheim Strategy Funds Trust mutual funds, or investments in Guggenheim Ultra Short Duration Fund. |
| |
2 | "10 Largest Holdings (as a % of Net Assets)" excludes any temporary cash investments. |
| JPMorgan Chase & Co. | 2.8% |
| Exxon Mobil Corp. | 2.5% |
| Walmart, Inc. | 2.4% |
| Oracle Corp. | 2.1% |
| Coca-Cola Co. | 2.1% |
| Procter & Gamble Co. | 2.1% |
| Merck & Company, Inc. | 2.0% |
| iShares S&P 500 Value ETF | 1.9% |
| PepsiCo, Inc. | 1.9% |
| Wells Fargo & Co. | 1.8% |
| Top 10 Total | 21.6% |
| |
2 | "10 Largest Holdings (as a % of Net Assets)" excludes any temporary cash investments. |
There were no changes in or disagreements with fund accountants for the period.
This is a summary of certain changes to the fund since September 30, 2023.
Subsequent to the September 30, 2024 year-end, on October 25, 2024, the fund was reorganized into New Age Alpha Large Cap Value Fund, a series of New Age Alpha Funds Trust, pursuant to an Agreement and Plan of Reorganization approved by the Board of Trustees and shareholders of the fund.
| |  | Availability of Additional Information. For additional information, including financial information, holdings and proxy voting information, go to https://www.guggenheiminvestments.com/mutual-funds/literature or, call 800 820 0888. |
AR-TVVFX-093024
The registrant’s Board of Trustees has adopted a code of ethics that applies to the registrant’s principal executive officer and principal financial officer. No substantive amendments were approved or waivers were granted to the code of ethics during the period covered by this report. The code of ethics is filed as an exhibit to this Form N-CSR.
| Item 3. | Audit Committee Financial Expert. |
The registrant's Board of Trustees has determined that it has at least one audit committee financial expert serving on its audit committee (the “Audit Committee”), Sandra G. Sponem. Ms. Sponem is “independent,” meaning that she is not an “interested person” of the registrant (as that term is defined in Section 2(a)(19) of the Investment Company Act) and she does not accept any consulting, advisory, or other compensatory fee from the registrant (except in her capacity as a Board or committee member).
(Under applicable securities laws, a person who is determined to be an audit committee financial expert will not be deemed an "expert" for any purpose, including without limitation for the purposes of Section 11 of the Securities Act of 1933, as a result of being designated or identified as an audit committee financial expert. The designation or identification of a person as an audit committee financial expert does not impose on such person any duties, obligations, or liabilities that are greater than the duties, obligations, and liabilities imposed on such person as a member of the Audit Committee and Board of Trustees in the absence of such designation or identification. The designation or identification of a person as an audit committee financial expert does not affect the duties, obligations or liability of any other member of the audit committee or Board of Trustees.)
| Item 4. | Principal Accountant Fees and Services. |
| (a) | Audit Fees: the aggregate Audit Fees billed by the registrant’s principal accountant for professional services rendered for the audit of the annual financial statements, or services that are normally provided by the accountant in connection with the statutory and regulatory filings or engagements were $82,909 and $99,113 for the fiscal years ended September 30, 2024 and September 30, 2023, respectively. |
| (b) | Audit-Related Fees: the aggregate Audit-Related Fees billed by the registrant’s principal accountant for assurance and related services that are reasonably related to the performance of the audit of the registrant’s financial statements and are not reported under paragraph (a) of this Item 4 were $2,881 and $0 for fiscal years ended September 30, 2024 and September 30, 2023, respectively. |
| (c) | Tax Fees: the aggregate Tax Fees billed by the registrant’s principal accountant for professional services rendered for tax compliance, tax advice and tax planning including preparation of tax returns and distribution assistance were $35,987 and $49,915 for the fiscal years ended September 30, 2024 and September 30, 2023, respectively. These services consisted of (i) preparation of U.S. federal, state and excise tax returns; (ii) U.S. federal and state tax planning, advice and assistance regarding statutory, regulatory or administrative developments, (iii) tax advice regarding tax qualification matters and/or treatment of various financial instruments held or proposed to be acquired and (iv) review of U.S. federal excise distribution calculations |
| (d) | All Other Fees: the aggregate All Other Fees billed by the registrant’s principal accountant for products and services provided by the principal accountant, other than the services reported in paragraphs (a) through (c) of this Item 4, were $0 and $0 for the fiscal years ended September 30, 2024 and September 30, 2023, respectively. |
| (e) | Audit Committee Pre-Approval Policies and Procedures. |
(1) The registrant’s pre-approval policy requires the Audit Committee to pre-approve any engagement of the registrant’s independent auditors to provide any services, other than “prohibited non-audit services,” to the registrant, including the fees and other compensation to be paid to the independent auditors (unless an exception is available under Rule 2-01 of Regulation S-X). The independent auditors or the Chief Accounting Officer of the registrant (or an officer of the registrant who reports to the Chief Accounting Officer) report to the Audit Committee at each of its regular scheduled meetings all audit, audit-related and permissible non-audit services initiated since the last such report (unless the services were contained in the initial audit plan, as previously presented to, and approved by, the Audit Committee). The report includes a general description of the services and projected fees, and the means by which such services were approved by the Audit Committee. The Audit Committee is also required to pre-approve any engagement of the registrant’s independent auditors, including the fees and other compensation to be paid to the independent auditors, to provide any non-audit services to the registrant’s investment adviser (or any “control affiliate” of the investment adviser providing ongoing services to the registrant), if the engagement relates directly to the operations or financial reporting of the registrant (unless an exception is available under Rule 2-01 of Regulation S-X). (2) None of the services described in each of Items 4(b) through (d) were approved by the Audit Committee pursuant to paragraph (c)(7)(i)(C) of Rule 2-01 of Regulation S-X.
| (g) | Non-Audit Fees. The aggregate non-audit fees billed by the registrant's accountant for the most recent fiscal year and the preceding years for services rendered to the registrant, the investment adviser and any entity controlling, controlled by, or under common control with the adviser that provides ongoing services to the registrant were $38,868 and $49,915, respectively. These aggregate fees were less than the aggregate fees billed for the same periods by the registrant’s principal accountant for audit services rendered to the registrant, the investment advisor, and any entity controlling, controlled by, or under common control with the advisor that provides ongoing services to the registrant. |
| (h) | Auditor Independence. The registrant’s Audit Committee was provided with information relating to the provision of non-audit services by Ernst & Young, LLP to the registrant’s investment adviser (not including any sub adviser whose role is primarily portfolio management and is subcontracted with or overseen by another investment adviser), and any entity controlling, controlled by, or under common control with the investment adviser that provides ongoing services to the registrant that were not pre-approved by the Audit Committee so that a determination could be made whether the provision of such services is compatible with maintaining Ernst & Young, LLP’s independence. |
| Item 5. | Audit Committee of Listed Registrants. |
(a) Not applicable to this registrant.
(b) Not applicable to this registrant
(a) The Schedule of Investments is included under Item 7 of this Form.
(b) Not applicable
| Item 7. | Financial Statements and Financial Highlights for Open-End Management Investment Companies |
9.30.2024
Guggenheim Funds Annual Financial Report
Transparent Value Trust |
Guggenheim Directional Allocation Fund | | |
Guggenheim RBP® Dividend Fund | | |
Guggenheim RBP® Large-Cap Defensive Fund | | |
Guggenheim RBP® Large-Cap Value Fund | | |
GuggenheimInvestments.com | RBP-ANN-0924x0925 |
This report and the financial statements contained herein are submitted for the general information of our shareholders. The report is not authorized for distribution to prospective investors unless preceded or accompanied by an effective prospectus.
Distributed by Guggenheim Funds Distributors, LLC.
| | |
ITEM 7. FINANCIAL STATEMENTS AND FINANCIAL HIGHLIGHTS FOR OPEN -ENDED MANAGEMENT INVESTMENT COMPANIES (ANNUAL FINANCIAL REPORT) | |
DIRECTIONAL ALLOCATION FUND | 2 |
RBP® DIVIDEND FUND | 9 |
RBP® LARGE-CAP DEFENSIVE FUND | 17 |
RBP® LARGE-CAP VALUE FUND | 24 |
NOTES TO FINANCIAL STATEMENTS | 31 |
REPORT OF INDEPENDENT REGISTERED PUBLIC ACCOUNTING FIRM | 40 |
OTHER INFORMATION | 41 |
ITEM 8: CHANGES IN AND DISAGREEMENTS WITH ACCOUNTANTS FOR OPEN-END MANAGEMENT INVESTMENT COMPANIES | 42 |
ITEM 9: PROXY DISCLOSURES FOR OPEN-END MANAGEMENT INVESTMENT COMPANIES | 43 |
ITEM 10: RENUMERATION PAID TO DIRECTORS, OFFICERS, AND OTHERS OF OPEN-END MANAGEMENT INVESTMENT COMPANIES | 44 |
ITEM 11: STATEMENT REGARDING BASIS FOR APPROVAL OF INVESTMENT ADVISORY CONTRACT | 45 |
| | THE GUGGENHEIM FUNDS ANNUAL FINANCIAL REPORT | 1 |
SCHEDULE OF INVESTMENTS | September 30, 2024 |
DIRECTIONAL ALLOCATION FUND | |
| | Shares | | | Value | |
COMMON STOCKS† - 98.3% |
| | | | | | | | | |
Technology - 26.9% |
Microsoft Corp. | | | 33,634 | | | $ | 14,472,710 | |
Apple, Inc. | | | 47,553 | | | | 11,079,849 | |
NVIDIA Corp. | | | 84,287 | | | | 10,235,813 | |
Broadcom, Inc. | | | 19,807 | | | | 3,416,708 | |
Oracle Corp. | | | 18,359 | | | | 3,128,374 | |
ServiceNow, Inc.* | | | 3,037 | | | | 2,716,262 | |
Salesforce, Inc. | | | 9,734 | | | | 2,664,293 | |
Advanced Micro Devices, Inc.* | | | 13,686 | | | | 2,245,599 | |
NetApp, Inc. | | | 13,629 | | | | 1,683,318 | |
Synopsys, Inc.* | | | 1,996 | | | | 1,010,755 | |
Datadog, Inc. — Class A* | | | 4,252 | | | | 489,235 | |
Intuit, Inc. | | | 618 | | | | 383,778 | |
Akamai Technologies, Inc.* | | | 3,441 | | | | 347,369 | |
AppLovin Corp. — Class A* | | | 1,562 | | | | 203,919 | |
Tyler Technologies, Inc.* | | | 345 | | | | 201,383 | |
PTC, Inc.* | | | 981 | | | | 177,228 | |
Amentum Holdings, Inc.* | | | 4,719 | | | | 152,188 | |
Cadence Design Systems, Inc.* | | | 538 | | | | 145,814 | |
Dynatrace, Inc.* | | | 2,554 | | | | 136,562 | |
Leidos Holdings, Inc. | | | 726 | | | | 118,338 | |
Fair Isaac Corp.* | | | 31 | | | | 60,249 | |
Total Technology | | | | | | | 55,069,744 | |
| | | | | | | | | |
Consumer, Non-cyclical - 15.6% |
Merck & Company, Inc. | | | 24,484 | | | | 2,780,403 | |
Abbott Laboratories | | | 23,680 | | | | 2,699,757 | |
Becton Dickinson & Co. | | | 9,519 | | | | 2,295,031 | |
Eli Lilly & Co. | | | 2,579 | | | | 2,284,839 | |
Cigna Group | | | 6,497 | | | | 2,250,821 | |
Constellation Brands, Inc. — Class A | | | 8,084 | | | | 2,083,166 | |
Cencora, Inc. — Class A | | | 8,715 | | | | 1,961,572 | |
Encompass Health Corp. | | | 19,985 | | | | 1,931,350 | |
Global Payments, Inc. | | | 18,785 | | | | 1,923,960 | |
Dexcom, Inc.* | | | 28,563 | | | | 1,914,864 | |
AbbVie, Inc. | | | 7,886 | | | | 1,557,327 | |
Mondelez International, Inc. — Class A | | | 15,228 | | | | 1,121,847 | |
PepsiCo, Inc. | | | 6,573 | | | | 1,117,739 | |
Vertex Pharmaceuticals, Inc.* | | | 2,213 | | | | 1,029,222 | |
Coca-Cola Co. | | | 12,197 | | | | 876,476 | |
UnitedHealth Group, Inc. | | | 1,454 | | | | 850,125 | |
Amgen, Inc. | | | 2,533 | | | | 816,158 | |
Incyte Corp.* | | | 10,280 | | | | 679,508 | |
Boston Scientific Corp.* | | | 6,761 | | | | 566,572 | |
WEX, Inc.* | | | 2,060 | | | | 432,044 | |
Church & Dwight Company, Inc. | | | 2,567 | | | | 268,816 | |
WillScot Holdings Corp.* | | | 6,479 | | | | 243,610 | |
Booz Allen Hamilton Holding Corp. | | | 908 | | | | 147,786 | |
IQVIA Holdings, Inc.* | | | 447 | | | | 105,925 | |
Paylocity Holding Corp.* | | | 433 | | | | 71,432 | |
Total Consumer, Non-cyclical | | | | | | | 32,010,350 | |
| | | | | | | | | |
Communications - 14.8% |
Alphabet, Inc. — Class C | | | 54,362 | | | | 9,088,783 | |
Meta Platforms, Inc. — Class A | | | 11,378 | | | | 6,513,222 | |
Amazon.com, Inc.* | | | 25,289 | | | | 4,712,099 | |
T-Mobile US, Inc. | | | 11,702 | | | | 2,414,825 | |
Palo Alto Networks, Inc.* | | | 6,926 | | | | 2,367,307 | |
Motorola Solutions, Inc. | | | 5,099 | | | | 2,292,663 | |
Walt Disney Co. | | | 15,624 | | | | 1,502,873 | |
Etsy, Inc.* | | | 19,989 | | | | 1,109,989 | |
Netflix, Inc.* | | | 344 | | | | 243,989 | |
Arista Networks, Inc.* | | | 201 | | | | 77,148 | |
Booking Holdings, Inc. | | | 8 | | | | 33,697 | |
Total Communications | | | | | | | 30,356,595 | |
| | | | | | | | | |
Financial - 14.7% |
JPMorgan Chase & Co. | | | 19,392 | | | | 4,088,997 | |
Visa, Inc. — Class A | | | 12,993 | | | | 3,572,425 | |
Mastercard, Inc. — Class A | | | 7,193 | | | | 3,551,903 | |
American Tower Corp. — Class A REIT | | | 10,063 | | | | 2,340,251 | |
Intercontinental Exchange, Inc. | | | 14,417 | | | | 2,315,947 | |
Ameriprise Financial, Inc. | | | 4,729 | | | | 2,221,731 | |
Travelers Companies, Inc. | | | 9,155 | | | | 2,143,369 | |
Hartford Financial Services Group, Inc. | | | 10,844 | | | | 1,275,363 | |
Everest Group Ltd. | | | 2,979 | | | | 1,167,261 | |
Alexandria Real Estate Equities, Inc. REIT | | | 9,411 | | | | 1,117,556 | |
American International Group, Inc. | | | 12,181 | | | | 892,015 | |
Sun Communities, Inc. REIT | | | 6,100 | | | | 824,415 | |
Realty Income Corp. REIT | | | 12,866 | | | | 815,962 | |
Arch Capital Group Ltd.* | | | 6,889 | | | | 770,741 | |
Unum Group | | | 12,650 | | | | 751,916 | |
AvalonBay Communities, Inc. REIT | | | 2,587 | | | | 582,722 | |
Equinix, Inc. REIT | | | 375 | | | | 332,861 | |
State Street Corp. | | | 3,421 | | | | 302,656 | |
LPL Financial Holdings, Inc. | | | 1,220 | | | | 283,809 | |
CoStar Group, Inc.* | | | 3,247 | | | | 244,954 | |
EastGroup Properties, Inc. REIT | | | 751 | | | | 140,302 | |
Equity LifeStyle Properties, Inc. REIT | | | 1,688 | | | | 120,422 | |
Interactive Brokers Group, Inc. — Class A | | | 652 | | | | 90,863 | |
Tradeweb Markets, Inc. — Class A | | | 674 | | | | 83,354 | |
Rexford Industrial Realty, Inc. REIT | | | 1,610 | | | | 80,999 | |
Total Financial | | | | | | | 30,112,794 | |
| | | | | | | | | |
Consumer, Cyclical - 12.0% |
Tesla, Inc.* | | | 16,470 | | | | 4,309,046 | |
Walmart, Inc. | | | 41,080 | | | | 3,317,210 | |
TJX Companies, Inc. | | | 20,825 | | | | 2,447,771 | |
United Airlines Holdings, Inc.* | | | 39,326 | | | | 2,243,941 | |
Hilton Worldwide Holdings, Inc. | | | 8,360 | | | | 1,926,980 | |
Costco Wholesale Corp. | | | 2,110 | | | | 1,870,557 | |
Target Corp. | | | 11,235 | | | | 1,751,087 | |
Yum! Brands, Inc. | | | 12,080 | | | | 1,687,697 | |
Delta Air Lines, Inc. | | | 31,621 | | | | 1,606,031 | |
General Motors Co. | | | 16,252 | | | | 728,740 | |
Domino’s Pizza, Inc. | | | 1,145 | | | | 492,510 | |
Bath & Body Works, Inc. | | | 14,642 | | | | 467,373 | |
WESCO International, Inc. | | | 2,418 | | | | 406,175 | |
Ross Stores, Inc. | | | 1,414 | | | | 212,821 | |
BJ’s Wholesale Club Holdings, Inc.* | | | 2,573 | | | | 212,221 | |
Lennar Corp. — Class A | | | 1,108 | | | | 207,728 | |
DR Horton, Inc. | | | 813 | | | | 155,096 | |
Watsco, Inc. | | | 302 | | | | 148,548 | |
Marriott International, Inc. — Class A | | | 569 | | | | 141,453 | |
PulteGroup, Inc. | | | 366 | | | | 52,532 | |
2 | THE GUGGENHEIM FUNDS ANNUAL FINANCIAL REPORT | SEE NOTES TO FINANCIAL STATEMENTS. |
SCHEDULE OF INVESTMENTS (concluded) | September 30, 2024 |
DIRECTIONAL ALLOCATION FUND | |
| | Shares | | | Value | |
Autoliv, Inc. | | | 504 | | | $ | 47,058 | |
Deckers Outdoor Corp.* | | | 186 | | | | 29,658 | |
Total Consumer, Cyclical | | | | | | | 24,462,233 | |
| | | | | | | | | |
Industrial - 5.8% |
General Electric Co. | | | 15,300 | | | | 2,885,288 | |
Parker-Hannifin Corp. | | | 3,600 | | | | 2,274,552 | |
Dover Corp. | | | 8,183 | | | | 1,569,008 | |
FedEx Corp. | | | 5,575 | | | | 1,525,766 | |
Trane Technologies plc | | | 2,777 | | | | 1,079,503 | |
Jacobs Solutions, Inc. | | | 4,719 | | | | 617,717 | |
Middleby Corp.* | | | 3,594 | | | | 500,033 | |
Sensata Technologies Holding plc | | | 9,394 | | | | 336,869 | |
Donaldson Company, Inc. | | | 3,439 | | | | 253,454 | |
Woodward, Inc. | | | 1,143 | | | | 196,036 | |
Xylem, Inc. | | | 1,322 | | | | 178,510 | |
HEICO Corp. | | | 623 | | | | 162,902 | |
Lincoln Electric Holdings, Inc. | | | 610 | | | | 117,132 | |
Garmin Ltd. | | | 353 | | | | 62,139 | |
EMCOR Group, Inc. | | | 139 | | | | 59,844 | |
Total Industrial | | | | | | | 11,818,753 | |
| | | | | | | | | |
Energy - 4.3% |
EOG Resources, Inc. | | | 18,262 | | | | 2,244,948 | |
Occidental Petroleum Corp. | | | 34,156 | | | | 1,760,400 | |
Targa Resources Corp. | | | 9,667 | | | | 1,430,813 | |
Exxon Mobil Corp. | | | 7,947 | | | | 931,547 | |
Hess Corp. | | | 6,636 | | | | 901,169 | |
Antero Resources Corp.* | | | 19,700 | | | | 564,405 | |
ONEOK, Inc. | | | 5,326 | | | | 485,358 | |
Schlumberger N.V. | | | 8,638 | | | | 362,364 | |
Baker Hughes Co. | | | 2,651 | | | | 95,834 | |
Total Energy | | | | | | | 8,776,838 | |
| | | | | | | | | |
Utilities - 2.8% |
Constellation Energy Corp. | | | 10,042 | | | | 2,611,121 | |
NextEra Energy, Inc. | | | 17,162 | | | | 1,450,704 | |
American Electric Power Company, Inc. | | | 6,320 | | | | 648,432 | |
Southern Co. | | | 6,710 | | | | 605,107 | |
NRG Energy, Inc. | | | 4,230 | | | | 385,353 | |
Total Utilities | | | | | | | 5,700,717 | |
| | | | | | | | | |
Basic Materials - 1.4% |
Sherwin-Williams Co. | | | 2,549 | | | | 972,877 | |
Ecolab, Inc. | | | 3,785 | | | | 966,424 | |
DuPont de Nemours, Inc. | | | 8,938 | | | | 796,465 | |
Eastman Chemical Co. | | | 904 | | | | 101,203 | |
Royal Gold, Inc. | | | 322 | | | | 45,176 | |
Total Basic Materials | | | | | | | 2,882,145 | |
| | | | | | | | | |
Total Common Stocks | | | | |
(Cost $171,443,394) | | | | | | | 201,190,169 | |
| | | | | | | | | |
EXCHANGE-TRADED FUNDS***,† - 1.4% |
SPDR S&P 500 ETF Trust | | | 2,453 | | | | 1,407,434 | |
Vanguard S&P 500 ETF | | | 2,663 | | | | 1,405,185 | |
Total Exchange-Traded Funds | | | | |
(Cost $2,745,757) | | | | | | | 2,812,619 | |
| | | | | | | | | |
Total Investments - 99.7% | | | | |
(Cost $174,189,151) | | $ | 204,002,788 | |
Other Assets & Liabilities, net - 0.3% | | | 608,160 | |
Total Net Assets - 100.0% | | $ | 204,610,948 | |
* | Non-income producing security. |
*** | A copy of each underlying unaffiliated fund’s financial statements is available at the SEC’s website at www.sec.gov. |
† | Value determined based on Level 1 inputs — See Note 4. |
| | plc — Public Limited Company |
| | REIT — Real Estate Investment Trust |
| | |
| | See Sector Classification in Other Information section. |
The following table summarizes the inputs used to value the Fund’s investments at September 30, 2024 (See Note 4 in the Notes to Financial Statements):
Investments in Securities (Assets) | | Level 1
Quoted
Prices | | | Level 2
Significant
Observable
Inputs | | | Level 3
Significant
Unobservable
Inputs | | | Total | |
Common Stocks | | $ | 201,190,169 | | | $ | — | | | $ | — | | | $ | 201,190,169 | |
Exchange-Traded Funds | | | 2,812,619 | | | | — | | | | — | | | | 2,812,619 | |
Total Assets | | $ | 204,002,788 | | | $ | — | | | $ | — | | | $ | 204,002,788 | |
SEE NOTES TO FINANCIAL STATEMENTS. | THE GUGGENHEIM FUNDS ANNUAL FINANCIAL REPORT | 3 |
DIRECTIONAL ALLOCATION FUND | |
STATEMENT OF ASSETS AND LIABILITIES |
September 30, 2024 |
Assets: |
Investments, at value (cost $174,189,151) | | $ | 204,002,788 | |
Cash | | | 767,198 | |
Prepaid expenses | | | 51,201 | |
Receivables: |
Dividends | | | 105,624 | |
Fund shares sold | | | 19,279 | |
Total assets | | | 204,946,090 | |
| | | | | |
Liabilities: |
Payable for: |
Management fees | | | 114,218 | |
Professional fees | | | 79,739 | |
Distribution and service fees | | | 78,860 | |
Fund shares redeemed | | | 12,876 | |
Transfer agent fees | | | 11,611 | |
Fund accounting and administration fees | | | 4,099 | |
Trustees’ fees* | | | 1,405 | |
Due to Investment Adviser | | | 196 | |
Miscellaneous | | | 32,138 | |
Total liabilities | | | 335,142 | |
Net assets | | $ | 204,610,948 | |
| | | | | |
Net assets consist of: |
Paid in capital | | $ | 154,012,555 | |
Total distributable earnings (loss) | | | 50,598,393 | |
Net assets | | $ | 204,610,948 | |
| | | | | |
Class A: |
Net assets | | $ | 128,383,228 | |
Capital shares outstanding | | | 6,887,500 | |
Net asset value per share | | $ | 18.64 | |
Maximum offering price per share (Net asset value divided by 95.25%) | | $ | 19.57 | |
| | | | | |
Class C: |
Net assets | | $ | 9,877,574 | |
Capital shares outstanding | | | 587,062 | |
Net asset value per share | | $ | 16.83 | |
| | | | | |
Class P: |
Net assets | | $ | 4,659,783 | |
Capital shares outstanding | | | 247,266 | |
Net asset value per share | | $ | 18.85 | |
| | | | | |
Institutional Class: |
Net assets | | $ | 61,690,363 | |
Capital shares outstanding | | | 3,168,538 | |
Net asset value per share | | $ | 19.47 | |
STATEMENT OF OPERATIONS |
Year Ended September 30, 2024 |
Investment Income: |
Dividends | | $ | 2,314,595 | |
Total investment income | | | 2,314,595 | |
| | | | | |
Expenses: |
Management fees | | | 1,878,464 | |
Distribution and service fees: |
Class A | | | 419,234 | |
Class C | | | 116,307 | |
Class P | | | 11,296 | |
Transfer agent fees: |
Class A | | | 15,624 | |
Class C | | | 8,659 | |
Class P | | | 1,685 | |
Institutional Class | | | 17,195 | |
Professional fees | | | 226,555 | |
Fund accounting and administration fees | | | 85,066 | |
Trustees’ fees* | | | 17,263 | |
Line of credit fees | | | 4,947 | |
Custodian fees | | | 656 | |
Tax expense | | | 396 | |
Miscellaneous | | | 117,470 | |
Recoupment of previously waived fees: |
Class C | | | 197 | |
Class P | | | 46 | |
Institutional Class | | | 517 | |
Total expenses | | | 2,921,577 | |
Less: |
Expenses reimbursed by Adviser |
Class A | | | (19,260 | ) |
Class C | | | (9,646 | ) |
Class P | | | (2,072 | ) |
Institutional Class | | | (22,570 | ) |
Expenses waived by Adviser | | | (190,404 | ) |
Total waived/reimbursed expenses | | | (243,952 | ) |
Net expenses | | | 2,677,625 | |
Net investment loss | | | (363,030 | ) |
| | | | | |
Net Realized and Unrealized Gain (Loss): |
Net realized gain (loss) on: |
Investments | | | 24,352,158 | |
Net realized gain | | | 24,352,158 | |
Net change in unrealized appreciation (depreciation) on: |
Investments | | | 35,413,934 | |
Net change in unrealized appreciation (depreciation) | | | 35,413,934 | |
Net realized and unrealized gain | | | 59,766,092 | |
Net increase in net assets resulting from operations | | $ | 59,403,062 | |
* | Relates to Trustees not deemed “interested persons” within the meaning of Section 2(a)(19) of the 1940 Act. |
4 | THE GUGGENHEIM FUNDS ANNUAL FINANCIAL REPORT | SEE NOTES TO FINANCIAL STATEMENTS. |
DIRECTIONAL ALLOCATION FUND | |
STATEMENTS OF CHANGES IN NET ASSETS |
| | Year Ended
September 30,
2024 | | | Year Ended
September 30,
2023 | |
Increase (Decrease) in Net Assets from Operations: | | | | | | | | |
Net investment income (loss) | | $ | (363,030 | ) | | $ | 4,303,940 | |
Net realized gain on investments | | | 24,352,158 | | | | 417,366 | |
Net change in unrealized appreciation (depreciation) on investments | | | 35,413,934 | | | | (5,634,128 | ) |
Net increase (decrease) in net assets resulting from operations | | | 59,403,062 | | | | (912,822 | ) |
| | | | | | | | | |
Distributions to shareholders: | | | | | | | | |
Class A | | | (1,985,508 | ) | | | (482,969 | ) |
Class C | | | (124,629 | ) | | | — | |
Class P | | | (77,623 | ) | | | (21,150 | ) |
Institutional Class | | | (1,275,935 | ) | | | (613,597 | ) |
Total distributions to shareholders | | | (3,463,695 | ) | | | (1,117,716 | ) |
| | | | | | | | | |
Capital share transactions: | | | | | | | | |
Proceeds from sale of shares | | | | | | | | |
Class A | | | 4,655,019 | | | | 8,602,374 | |
Class C | | | 55,823 | | | | 263,002 | |
Class P | | | 60,986 | | | | 252,521 | |
Institutional Class | | | 1,903,271 | | | | 4,363,264 | |
Distributions reinvested | | | | | | | | |
Class A | | | 1,793,021 | | | | 435,304 | |
Class C | | | 124,341 | | | | — | |
Class P | | | 76,734 | | | | 20,861 | |
Institutional Class | | | 1,226,048 | | | | 595,770 | |
Cost of shares redeemed | | | | | | | | |
Class A | | | (23,069,675 | ) | | | (32,110,070 | ) |
Class C | | | (5,075,017 | ) | | | (9,430,576 | ) |
Class P | | | (1,111,314 | ) | | | (1,297,530 | ) |
Institutional Class | | | (22,260,703 | ) | | | (34,353,013 | ) |
Net decrease from capital share transactions | | | (41,621,466 | ) | | | (62,658,093 | ) |
Net increase (decrease) in net assets | | | 14,317,901 | | | | (64,688,631 | ) |
| | | | | | | | | |
Net assets: | | | | | | | | |
Beginning of year | | | 190,293,047 | | | | 254,981,678 | |
End of year | | $ | 204,610,948 | | | $ | 190,293,047 | |
| | | | | | | | | |
Capital share activity: | | | | | | | | |
Shares sold | | | | | | | | |
Class A | | | 279,154 | | | | 601,315 | |
Class C | | | 3,771 | | | | 20,312 | |
Class P | | | 3,751 | | | | 17,480 | |
Institutional Class | | | 109,757 | | | | 292,370 | |
Shares issued from reinvestment of distributions | | | | | | | | |
Class A | | | 117,575 | | | | 30,612 | |
Class C | | | 8,991 | | | | — | |
Class P | | | 4,983 | | | | 1,453 | |
Institutional Class | | | 77,207 | | | | 40,255 | |
Shares redeemed | | | | | | | | |
Class A | | | (1,426,867 | ) | | | (2,239,043 | ) |
Class C | | | (337,058 | ) | | | (727,685 | ) |
Class P | | | (68,841 | ) | | | (89,190 | ) |
Institutional Class | | | (1,330,967 | ) | | | (2,298,507 | ) |
Net decrease in shares | | | (2,558,544 | ) | | | (4,350,628 | ) |
SEE NOTES TO FINANCIAL STATEMENTS. | THE GUGGENHEIM FUNDS ANNUAL FINANCIAL REPORT | 5 |
DIRECTIONAL ALLOCATION FUND | |
This table is presented to show selected data for a share outstanding throughout each period and to assist shareholders in evaluating a Fund’s performance for the periods presented.
Class A | | Year Ended
September 30,
2024 | | | Year Ended
September 30,
2023 | | | Year Ended
September 30,
2022 | | | Year Ended
September 30,
2021 | | | Year Ended
September 30,
2020 | |
Per Share Data |
Net asset value, beginning of period | | $ | 14.04 | | | $ | 14.23 | | | $ | 18.11 | | | $ | 14.00 | | | $ | 16.50 | |
Income (loss) from investment operations: |
Net investment income (loss)a | | | (.04 | ) | | | .26 | | | | (.01 | ) | | | (.06 | ) | | | .02 | |
Net gain (loss) on investments (realized and unrealized) | | | 4.90 | | | | (.40 | ) | | | (1.27 | ) | | | 4.18 | | | | .07 | i |
Total from investment operations | | | 4.86 | | | | (.14 | ) | | | (1.28 | ) | | | 4.12 | | | | .09 | |
Less distributions from: |
Net investment income | | | (.26 | ) | | | (.05 | ) | | | — | | | | (.01 | ) | | | — | |
Net realized gains | | | — | | | | — | | | | (2.60 | ) | | | — | | | | (2.59 | ) |
Total distributions | | | (.26 | ) | | | (.05 | ) | | | (2.60 | ) | | | (.01 | ) | | | (2.59 | ) |
Net asset value, end of period | | $ | 18.64 | | | $ | 14.04 | | | $ | 14.23 | | | $ | 18.11 | | | $ | 14.00 | |
|
Total Returnc | | | 35.05 | % | | | (0.97 | %) | | | (9.40 | %) | | | 29.42 | % | | | (0.38 | %) |
Ratios/Supplemental Data |
Net assets, end of period (in thousands) | | $ | 128,383 | | | $ | 111,157 | | | $ | 135,504 | | | $ | 152,598 | | | $ | 106,549 | |
Ratios to average net assets: |
Net investment income (loss) | | | (0.25 | %) | | | 1.81 | % | | | (0.03 | %) | | | (0.38 | %) | | | 0.16 | % |
Total expensesd | | | 1.54 | % | | | 1.58 | % | | | 1.48 | % | | | 1.44 | % | | | 1.43 | % |
Net expensese,f,g | | | 1.43 | % | | | 1.47 | % | | | 1.39 | % | | | 1.42 | % | | | 1.40 | % |
Portfolio turnover rate | | | 125 | % | | | 130 | % | | | 149 | % | | | 131 | % | | | 313 | % |
Class C | | Year Ended
September 30,
2024 | | | Year Ended
September 30,
2023 | | | Year Ended
September 30,
2022 | | | Year Ended
September 30,
2021 | | | Year Ended
September 30,
2020 | |
Per Share Data |
Net asset value, beginning of period | | $ | 12.67 | | | $ | 12.87 | | | $ | 16.72 | | | $ | 13.01 | | | $ | 15.59 | |
Income (loss) from investment operations: |
Net investment income (loss)a | | | (.13 | ) | | | .16 | | | | (.12 | ) | | | (.16 | ) | | | (.07 | ) |
Net gain (loss) on investments (realized and unrealized) | | | 4.44 | | | | (.36 | ) | | | (1.13 | ) | | | 3.87 | | | | .08 | i |
Total from investment operations | | | 4.31 | | | | (.20 | ) | | | (1.25 | ) | | | 3.71 | | | | .01 | |
Less distributions from: |
Net investment income | | | (.15 | ) | | | — | | | | — | | | | — | | | | — | |
Net realized gains | | | — | | | | — | | | | (2.60 | ) | | | — | | | | (2.59 | ) |
Total distributions | | | (.15 | ) | | | — | | | | (2.60 | ) | | | — | | | | (2.59 | ) |
Net asset value, end of period | | $ | 16.83 | | | $ | 12.67 | | | $ | 12.87 | | | $ | 16.72 | | | $ | 13.01 | |
|
Total Returnc | | | 34.24 | % | | | (1.55 | %) | | | (10.08 | %) | | | 28.52 | % | | | (0.99 | %) |
Ratios/Supplemental Data |
Net assets, end of period (in thousands) | | $ | 9,878 | | | $ | 11,548 | | | $ | 20,835 | | | $ | 60,153 | | | $ | 98,656 | |
Ratios to average net assets: |
Net investment income (loss) | | | (0.91 | %) | | | 1.25 | % | | | (0.82 | %) | | | (1.02 | %) | | | (0.53 | %) |
Total expensesd | | | 2.25 | % | | | 2.21 | % | | | 2.21 | % | | | 2.15 | % | | | 2.15 | % |
Net expensese,f,g | | | 2.08 | % | | | 2.08 | % | | | 2.08 | % | | | 2.09 | % | | | 2.10 | % |
Portfolio turnover rate | | | 125 | % | | | 130 | % | | | 149 | % | | | 131 | % | | | 313 | % |
6 | THE GUGGENHEIM FUNDS ANNUAL FINANCIAL REPORT | SEE NOTES TO FINANCIAL STATEMENTS. |
DIRECTIONAL ALLOCATION FUND | |
FINANCIAL HIGHLIGHTS (continued) |
This table is presented to show selected data for a share outstanding throughout each period and to assist shareholders in evaluating a Fund’s performance for the periods presented.
Class P | | Year Ended
September 30,
2024 | | | Year Ended
September 30,
2023 | | | Year Ended
September 30,
2022 | | | Year Ended
September 30,
2021 | | | Year Ended
September 30,
2020 | |
Per Share Data |
Net asset value, beginning of period | | $ | 14.19 | | | $ | 14.36 | | | $ | 18.25 | | | $ | 14.10 | | | $ | 16.59 | |
Income (loss) from investment operations: |
Net investment income (loss)a | | | (.03 | ) | | | .28 | | | | — | b | | | (.05 | ) | | | .03 | |
Net gain (loss) on investments (realized and unrealized) | | | 4.97 | | | | (.39 | ) | | | (1.29 | ) | | | 4.20 | | | | .07 | i |
Total from investment operations | | | 4.94 | | | | (.11 | ) | | | (1.29 | ) | | | 4.15 | | | | .10 | |
Less distributions from: |
Net investment income | | | (.28 | ) | | | (.06 | ) | | | — | | | | — | b | | | — | |
Net realized gains | | | — | | | | — | | | | (2.60 | ) | | | — | | | | (2.59 | ) |
Total distributions | | | (.28 | ) | | | (.06 | ) | | | (2.60 | ) | | | — | | | | (2.59 | ) |
Net asset value, end of period | | $ | 18.85 | | | $ | 14.19 | | | $ | 14.36 | | | $ | 18.25 | | | $ | 14.10 | |
|
Total Return | | | 35.26 | % | | | (0.80 | %) | | | (9.38 | %) | | | 29.45 | % | | | (0.30 | %) |
Ratios/Supplemental Data |
Net assets, end of period (in thousands) | | $ | 4,660 | | | $ | 4,363 | | | $ | 5,424 | | | $ | 8,533 | | | $ | 9,143 | |
Ratios to average net assets: |
Net investment income (loss) | | | (0.16 | %) | | | 1.96 | % | | | (0.01 | %) | | | (0.28 | %) | | | 0.22 | % |
Total expensesd | | | 1.47 | % | | | 1.47 | % | | | 1.43 | % | | | 1.38 | % | | | 1.40 | % |
Net expensee,f,g | | | 1.32 | % | | | 1.33 | % | | | 1.33 | % | | | 1.34 | % | | | 1.35 | % |
Portfolio turnover rate | | | 125 | % | | | 130 | % | | | 149 | % | | | 131 | % | | | 313 | % |
SEE NOTES TO FINANCIAL STATEMENTS. | THE GUGGENHEIM FUNDS ANNUAL FINANCIAL REPORT | 7 |
DIRECTIONAL ALLOCATION FUND | |
FINANCIAL HIGHLIGHTS (concluded) |
This table is presented to show selected data for a share outstanding throughout each period and to assist shareholders in evaluating a Fund’s performance for the periods presented.
Institutional Class | | Year Ended
September 30,
2024 | | | Year Ended
September 30,
2023 | | | Year Ended
September 30,
2022 | | | Year Ended
September 30,
2021 | | | Year Ended
September 30,
2020 | |
Per Share Data |
Net asset value, beginning of period | | $ | 14.66 | | | $ | 14.85 | | | $ | 18.74 | | | $ | 14.48 | | | $ | 16.93 | |
Income (loss) from investment operations: |
Net investment income (loss)a | | | .02 | | | | .33 | | | | .04 | | | | (.01 | ) | | | .07 | |
Net gain (loss) on investments (realized and unrealized) | | | 5.12 | | | | (.42 | ) | | | (1.33 | ) | | | 4.32 | | | | .07 | i |
Total from investment operations | | | 5.14 | | | | (.09 | ) | | | (1.29 | ) | | | 4.31 | | | | .14 | |
Less distributions from: |
Net investment income | | | (.33 | ) | | | (.10 | ) | | | — | | | | (.05 | ) | | | — | |
Net realized gains | | | — | | | | — | | | | (2.60 | ) | | | — | | | | (2.59 | ) |
Total distributions | | | (.33 | ) | | | (.10 | ) | | | (2.60 | ) | | | (.05 | ) | | | (2.59 | ) |
Net asset value, end of period | | $ | 19.47 | | | $ | 14.66 | | | $ | 14.85 | | | $ | 18.74 | | | $ | 14.48 | |
|
Total Return | | | 35.55 | % | | | (0.58 | %) | | | (9.11 | %) | | | 29.81 | % | | | (0.03 | %) |
Ratios/Supplemental Data |
Net assets, end of period (in thousands) | | $ | 61,690 | | | $ | 63,225 | | | $ | 93,219 | | | $ | 137,682 | | | $ | 152,083 | |
Ratios to average net assets: |
Net investment income (loss) | | | 0.10 | % | | | 2.22 | % | | | 0.25 | % | | | (0.04 | %) | | | 0.47 | % |
Total expensesd | | | 1.21 | % | | | 1.22 | % | | | 1.20 | % | | | 1.15 | % | | | 1.15 | % |
Net expensese,f,g | | | 1.07 | % | | | 1.08 | % | | | 1.08 | % | | | 1.09 | % | | | 1.10 | % |
Portfolio turnover rate | | | 125 | % | | | 130 | % | | | 149 | % | | | 131 | % | | | 313 | % |
a | Net investment income (loss) per share was computed using average shares outstanding throughout the period. |
b | Less than $0.01 per share. |
c | Total return does not reflect the impact of any applicable sales charges. |
d | Does not include expenses of the underlying funds in which the Fund invests. |
e | Net expense information reflects the expense ratios after expense waivers and reimbursements, as applicable. |
f | The portion of the ratios of net expenses to average net assets attributable to recoupments of prior fee reductions or expense reimbursements for the years presented was as follows: |
| | | 09/30/24 | 09/30/23 | 09/30/22 | 09/30/21 | 09/30/20 |
| | Class A | — | 0.09% | 0.01% | — | — |
| | Class C | 0.00%h | 0.01% | 0.01% | — | 0.01% |
| | Class P | 0.00%h | 0.00%h,i | 0.01% | — | 0.00%h,i |
| | Institutional Class | 0.00%h | 0.01% | 0.01% | — | 0.01% |
g | Net expenses may include expenses that are excluded from the expense limitation agreement. Excluding these expenses, the net expense ratios for the years presented would be: |
| | | 09/30/24 | 09/30/23 | 09/30/22 | 09/30/21 | 09/30/20 |
| | Class A | 1.43% | 1.46% | 1.38% | 1.41% | 1.40% |
| | Class C | 2.07% | 2.07% | 2.08% | 2.08% | 2.10% |
| | Class P | 1.32% | 1.32% | 1.33% | 1.34% | 1.35% |
| | Institutional Class | 1.07% | 1.07% | 1.08% | 1.09% | 1.10% |
i | The amount shown for a share outstanding throughout the year does not agree with the aggregate net loss on investments for the year because of the sales and purchases of fund shares in relation to fluctuating market value of the investments of the Fund. |
8 | THE GUGGENHEIM FUNDS ANNUAL FINANCIAL REPORT | SEE NOTES TO FINANCIAL STATEMENTS. |
SCHEDULE OF INVESTMENTS | September 30, 2024 |
RBP® DIVIDEND FUND | |
| | Shares | | | Value | |
COMMON STOCKS† - 97.3% |
| | | | | | | | | |
Technology - 26.8% |
Microsoft Corp. | | | 2,814 | | | $ | 1,210,864 | |
NVIDIA Corp. | | | 9,171 | | | | 1,113,726 | |
Apple, Inc. | | | 4,226 | | | | 984,658 | |
Broadcom, Inc. | | | 2,325 | | | | 401,062 | |
Oracle Corp. | | | 1,544 | | | | 263,098 | |
Intuit, Inc. | | | 344 | | | | 213,624 | |
Accenture plc — Class A | | | 559 | | | | 197,595 | |
NetApp, Inc. | | | 1,332 | | | | 164,516 | |
KLA Corp. | | | 129 | | | | 99,899 | |
Total Technology | | | | | | | 4,649,042 | |
| | | | | | | | | |
Financial - 19.3% |
Mastercard, Inc. — Class A | | | 605 | | | | 298,749 | |
Intercontinental Exchange, Inc. | | | 1,213 | | | | 194,856 | |
Truist Financial Corp. | | | 4,393 | | | | 187,889 | |
Realty Income Corp. REIT | | | 2,924 | | | | 185,440 | |
Invesco Ltd. | | | 10,485 | | | | 184,117 | |
Popular, Inc. | | | 1,696 | | | | 170,058 | |
AGNC Investment Corp. REIT | | | 16,247 | | | | 169,944 | |
Rexford Industrial Realty, Inc. REIT | | | 3,343 | | | | 168,186 | |
Annaly Capital Management, Inc. REIT | | | 8,257 | | | | 165,718 | |
Corebridge Financial, Inc. | | | 5,630 | | | | 164,171 | |
Alexandria Real Estate Equities, Inc. REIT | | | 1,247 | | | | 148,081 | |
Unum Group | | | 2,283 | | | | 135,701 | |
U.S. Bancorp | | | 2,735 | | | | 125,071 | |
Prosperity Bancshares, Inc. | | | 1,663 | | | | 119,852 | |
American Tower Corp. — Class A REIT | | | 418 | | | | 97,210 | |
American International Group, Inc. | | | 1,317 | | | | 96,444 | |
Pinnacle Financial Partners, Inc. | | | 928 | | | | 90,916 | |
Rithm Capital Corp. REIT | | | 7,705 | | | | 87,452 | |
Kimco Realty Corp. REIT | | | 3,421 | | | | 79,436 | |
State Street Corp. | | | 891 | | | | 78,827 | |
Erie Indemnity Co. — Class A | | | 140 | | | | 75,575 | |
Sun Communities, Inc. REIT | | | 354 | | | | 47,843 | |
Visa, Inc. — Class A | | | 169 | | | | 46,467 | |
JPMorgan Chase & Co. | | | 145 | | | | 30,575 | |
EastGroup Properties, Inc. REIT | | | 136 | | | | 25,408 | |
STAG Industrial, Inc. REIT | | | 628 | | | | 24,548 | |
Allstate Corp. | | | 123 | | | | 23,327 | |
AvalonBay Communities, Inc. REIT | | | 89 | | | | 20,047 | |
Welltower, Inc. REIT | | | 150 | | | | 19,204 | |
New York Community Bancorp, Inc. | | | 1,651 | | | | 18,541 | |
Bank OZK | | | 384 | | | | 16,508 | |
American Homes 4 Rent — Class A REIT | | | 356 | | | | 13,667 | |
Hanover Insurance Group, Inc. | | | 90 | | | | 13,330 | |
Everest Group Ltd. | | | 23 | | | | 9,012 | |
Tradeweb Markets, Inc. — Class A | | | 48 | | | | 5,936 | |
Starwood Property Trust, Inc. REIT | | | 145 | | | | 2,955 | |
Travelers Companies, Inc. | | | 8 | | | | 1,873 | |
Total Financial | | | | | | | 3,342,934 | |
| | | | | | | | | |
Consumer, Non-cyclical - 14.0% |
Eli Lilly & Co. | | | 436 | | | | 386,270 | |
Coca-Cola Co. | | | 3,239 | | | | 232,754 | |
Merck & Company, Inc. | | | 2,029 | | | | 230,413 | |
Abbott Laboratories | | | 1,802 | | | | 205,446 | |
Automatic Data Processing, Inc. | | | 730 | | | | 202,013 | |
Cigna Group | | | 533 | | | | 184,652 | |
PepsiCo, Inc. | | | 981 | | | | 166,819 | |
AbbVie, Inc. | | | 795 | | | | 156,997 | |
Becton Dickinson & Co. | | | 589 | | | | 142,008 | |
Amgen, Inc. | | | 421 | | | | 135,650 | |
Global Payments, Inc. | | | 1,300 | | | | 133,146 | |
Constellation Brands, Inc. — Class A | | | 442 | | | | 113,899 | |
Encompass Health Corp. | | | 715 | | | | 69,098 | |
Booz Allen Hamilton Holding Corp. | | | 388 | | | | 63,151 | |
UnitedHealth Group, Inc. | | | 23 | | | | 13,448 | |
Total Consumer, Non-cyclical | | | | | | | 2,435,764 | |
| | | | | | | | | |
Consumer, Cyclical - 11.2% |
Walmart, Inc. | | | 3,473 | | | | 280,445 | |
Costco Wholesale Corp. | | | 266 | | | | 235,814 | |
TJX Companies, Inc. | | | 1,751 | | | | 205,813 | |
Las Vegas Sands Corp. | | | 3,760 | | | | 189,278 | |
Yum! Brands, Inc. | | | 1,330 | | | | 185,814 | |
DR Horton, Inc. | | | 945 | | | | 180,278 | |
General Motors Co. | | | 3,741 | | | | 167,746 | |
PACCAR, Inc. | | | 1,645 | | | | 162,329 | |
Target Corp. | | | 969 | | | | 151,028 | |
Tractor Supply Co. | | | 239 | | | | 69,532 | |
Autoliv, Inc. | | | 668 | | | | 62,371 | |
Ross Stores, Inc. | | | 250 | | | | 37,628 | |
Darden Restaurants, Inc. | | | 32 | | | | 5,252 | |
Lennar Corp. — Class A | | | 13 | | | | 2,437 | |
Total Consumer, Cyclical | | | | | | | 1,935,765 | |
| | | | | | | | | |
Communications - 8.4% |
Meta Platforms, Inc. — Class A | | | 1,022 | | | | 585,034 | |
Alphabet, Inc. — Class C | | | 2,429 | | | | 406,104 | |
New York Times Co. — Class A | | | 3,091 | | | | 172,076 | |
T-Mobile US, Inc. | | | 710 | | | | 146,516 | |
Motorola Solutions, Inc. | | | 308 | | | | 138,486 | |
Total Communications | | | | | | | 1,448,216 | |
| | | | | | | | | |
Energy - 5.7% |
Exxon Mobil Corp. | | | 2,144 | | | | 251,320 | |
EOG Resources, Inc. | | | 1,572 | | | | 193,246 | |
Williams Companies, Inc. | | | 4,074 | | | | 185,978 | |
ONEOK, Inc. | | | 2,002 | | | | 182,442 | |
Schlumberger N.V. | | | 4,125 | | | | 173,044 | |
Baker Hughes Co. | | | 227 | | | | 8,206 | |
Total Energy | | | | | | | 994,236 | |
| | | | | | | | | |
Utilities - 5.0% |
NextEra Energy, Inc. | | | 2,622 | | | | 221,637 | |
Constellation Energy Corp. | | | 836 | | | | 217,377 | |
Southern Co. | | | 1,510 | | | | 136,172 | |
American Electric Power Company, Inc. | | | 1,113 | | | | 114,194 | |
DTE Energy Co. | | | 858 | | | | 110,176 | |
AES Corp. | | | 3,625 | | | | 72,717 | |
Total Utilities | | | | | | | 872,273 | |
SEE NOTES TO FINANCIAL STATEMENTS. | THE GUGGENHEIM FUNDS ANNUAL FINANCIAL REPORT | 9 |
SCHEDULE OF INVESTMENTS (concluded) | September 30, 2024 |
RBP® DIVIDEND FUND | |
| | Shares | | | Value | |
Industrial - 4.9% |
FedEx Corp. | | | 652 | | | $ | 178,452 | |
Garmin Ltd. | | | 1,009 | | | | 177,614 | |
Dover Corp. | | | 686 | | | | 131,534 | |
Oshkosh Corp. | | | 1,030 | | | | 103,216 | |
Trane Technologies plc | | | 261 | | | | 101,459 | |
Hexcel Corp. | | | 966 | | | | 59,728 | |
Donaldson Company, Inc. | | | 516 | | | | 38,029 | |
Sensata Technologies Holding plc | | | 549 | | | | 19,687 | |
Parker-Hannifin Corp. | | | 22 | | | | 13,900 | |
Lincoln Electric Holdings, Inc. | | | 62 | | | | 11,905 | |
Flowserve Corp. | | | 183 | | | | 9,459 | |
Illinois Tool Works, Inc. | | | 19 | | | | 4,980 | |
Total Industrial | | | | | | | 849,963 | |
| | | | | | | | | |
Basic Materials - 2.0% |
Newmont Corp. | | | 3,457 | | | | 184,777 | |
Dow, Inc. | | | 3,089 | | | | 168,752 | |
Total Basic Materials | | | | | | | 353,529 | |
| | | | | | | | | |
Total Common Stocks | | | | |
(Cost $13,267,516) | | | | | | | 16,881,722 | |
| | | | | | | | | |
EXCHANGE-TRADED FUNDS***,† - 1.9% |
Vanguard Dividend Appreciation ETF | | | 811 | | | | 160,627 | |
iShares Select Dividend ETF | | | 1,189 | | | | 160,598 | |
Total Exchange-Traded Funds | | | | |
(Cost $304,200) | | | | | | | 321,225 | |
| | | | | | | | | |
Total Investments - 99.2% | | | | |
(Cost $13,571,716) | | $ | 17,202,947 | |
Other Assets & Liabilities, net - 0.8% | | | 146,113 | |
Total Net Assets - 100.0% | | $ | 17,349,060 | |
*** | A copy of each underlying unaffiliated fund’s financial statements is available at the SEC’s website at www.sec.gov. |
† | Value determined based on Level 1 inputs — See Note 4. |
| | plc — Public Limited Company |
| | REIT — Real Estate Investment Trust |
| | |
| | See Sector Classification in Other Information section. |
The following table summarizes the inputs used to value the Fund’s investments at September 30, 2024 (See Note 4 in the Notes to Financial Statements):
Investments in Securities (Assets) | | Level 1
Quoted
Prices | | | Level 2
Significant
Observable
Inputs | | | Level 3
Significant
Unobservable
Inputs | | | Total | |
Common Stocks | | $ | 16,881,722 | | | $ | — | | | $ | — | | | $ | 16,881,722 | |
Exchange-Traded Funds | | | 321,225 | | | | — | | | | — | | | | 321,225 | |
Total Assets | | $ | 17,202,947 | | | $ | — | | | $ | — | | | $ | 17,202,947 | |
10 | THE GUGGENHEIM FUNDS ANNUAL FINANCIAL REPORT | SEE NOTES TO FINANCIAL STATEMENTS. |
STATEMENT OF ASSETS AND LIABILITIES |
September 30, 2024 |
Assets: |
Investments, at value (cost $13,571,716) | | $ | 17,202,947 | |
Cash | | | 125,030 | |
Prepaid expenses | | | 30,042 | |
Receivables: |
Dividends | | | 23,094 | |
Investment Adviser | | | 17,917 | |
Fund shares sold | | | 27 | |
Total assets | | | 17,399,057 | |
| | | | | |
Liabilities: |
Payable for: |
Professional fees | | | 28,265 | |
Distribution and service fees | | | 4,452 | |
Fund shares redeemed | | | 3,872 | |
Fund accounting and administration fees | | | 3,831 | |
Transfer agent fees | | | 3,081 | |
Printing fees | | | 2,928 | |
Trustees’ fees* | | | 384 | |
Distributions to shareholders | | | 58 | |
Miscellaneous | | | 3,126 | |
Total liabilities | | | 49,997 | |
Net assets | | $ | 17,349,060 | |
| | | | | |
Net assets consist of: |
Paid in capital | | $ | 12,961,440 | |
Total distributable earnings (loss) | | | 4,387,620 | |
Net assets | | $ | 17,349,060 | |
| | | | | |
Class A: |
Net assets | | $ | 8,425,405 | |
Capital shares outstanding | | | 500,617 | |
Net asset value per share | | $ | 16.83 | |
Maximum offering price per share (Net asset value divided by 95.25%) | | $ | 17.67 | |
| | | | | |
Class C: |
Net assets | | $ | 726,668 | |
Capital shares outstanding | | | 42,635 | |
Net asset value per share | | $ | 17.04 | |
| | | | | |
Class P: |
Net assets | | $ | 660,758 | |
Capital shares outstanding | | | 38,801 | |
Net asset value per share | | $ | 17.03 | |
| | | | | |
Institutional Class: |
Net assets | | $ | 7,536,229 | |
Capital shares outstanding | | | 464,790 | |
Net asset value per share | | $ | 16.21 | |
STATEMENT OF OPERATIONS |
Year Ended September 30, 2024 |
Investment Income: |
Dividends (net of foreign withholding tax of $631) | | $ | 343,536 | |
Total investment income | | | 343,536 | |
| | | | | |
Expenses: |
Management fees | | | 119,773 | |
Distribution and service fees: |
Class A | | | 26,616 | |
Class C | | | 6,980 | |
Class P | | | 1,418 | |
Transfer agent fees: |
Class A | | | 12,371 | |
Class C | | | 2,023 | |
Class P | | | 1,912 | |
Institutional Class | | | 10,555 | |
Registration fees | | | 60,320 | |
Professional fees | | | 48,373 | |
Fund accounting and administration fees | | | 15,166 | |
Trustees’ fees* | | | 13,034 | |
Custodian fees | | | 2,181 | |
Line of credit fees | | | 417 | |
Miscellaneous | | | 13,149 | |
Recoupment of previously waived fees: |
Class A | | | 70 | |
Class C | | | 10 | |
Class P | | | 5 | |
Institutional Class | | | 48 | |
Total expenses | | | 334,421 | |
Less: Expenses reimbursed by Adviser |
Class A | | | (31,847 | ) |
Class C | | | (3,094 | ) |
Class P | | | (2,839 | ) |
Institutional Class | | | (21,467 | ) |
Expenses waived by Adviser | | | (99,598 | ) |
Total waived/reimbursed expenses | | | (158,845 | ) |
Net expenses | | | 175,576 | |
Net investment income | | | 167,960 | |
| | | | | |
Net Realized and Unrealized Gain (Loss): |
Net realized gain (loss) on: |
Investments | | | 1,238,967 | |
Net realized gain | | | 1,238,967 | |
Net change in unrealized appreciation (depreciation) on: |
Investments | | | 3,555,672 | |
Net change in unrealized appreciation (depreciation) | | | 3,555,672 | |
Net realized and unrealized gain | | | 4,794,639 | |
Net increase in net assets resulting from operations | | $ | 4,962,599 | |
* | Relates to Trustees not deemed “interested persons” within the meaning of Section 2(a)(19) of the 1940 Act. |
SEE NOTES TO FINANCIAL STATEMENTS. | THE GUGGENHEIM FUNDS ANNUAL FINANCIAL REPORT | 11 |
STATEMENTS OF CHANGES IN NET ASSETS |
| | Year Ended
September 30,
2024 | | | Year Ended
September 30,
2023 | |
Increase (Decrease) in Net Assets from Operations: | | | | | | | | |
Net investment income | | $ | 167,960 | | | $ | 220,759 | |
Net realized gain (loss) on investments | | | 1,238,967 | | | | (163,225 | ) |
Net change in unrealized appreciation (depreciation) on investments | | | 3,555,672 | | | | 2,747,153 | |
Net increase in net assets resulting from operations | | | 4,962,599 | | | | 2,804,687 | |
| | | | | | | | | |
Distributions to shareholders: | | | | | | | | |
Class A | | | (67,696 | ) | | | (96,839 | ) |
Class C | | | (1,283 | ) | | | (2,833 | ) |
Class P | | | (4,920 | ) | | | (7,333 | ) |
Institutional Class | | | (78,297 | ) | | | (89,510 | ) |
Return of Capital: | | | | | | | | |
Class A | | | — | | | | (9,216 | ) |
Class C | | | — | | | | (269 | ) |
Class P | | | — | | | | (698 | ) |
Institutional Class | | | — | | | | (8,520 | ) |
Total distributions to shareholders | | | (152,196 | ) | | | (215,218 | ) |
| | | | | | | | | |
Capital share transactions: | | | | | | | | |
Proceeds from sale of shares | | | | | | | | |
Class A | | | 219,861 | | | | 745,296 | |
Class C | | | 69,941 | | | | 27,027 | |
Class P | | | 114,269 | | | | 37,316 | |
Institutional Class | | | 394,133 | | | | 179,708 | |
Distributions reinvested | | | | | | | | |
Class A | | | 67,236 | | | | 105,382 | |
Class C | | | 1,283 | | | | 3,048 | |
Class P | | | 4,904 | | | | 7,942 | |
Institutional Class | | | 77,830 | | | | 97,642 | |
Cost of shares redeemed | | | | | | | | |
Class A | | | (3,341,363 | ) | | | (1,073,586 | ) |
Class C | | | (207,195 | ) | | | (345,240 | ) |
Class P | | | (164,724 | ) | | | (413,008 | ) |
Institutional Class | | | (1,645,308 | ) | | | (1,348,820 | ) |
Net decrease from capital share transactions | | | (4,409,133 | ) | | | (1,977,293 | ) |
Net increase in net assets | | | 401,270 | | | | 612,176 | |
| | | | | | | | | |
Net assets: | | | | | | | | |
Beginning of year | | | 16,947,790 | | | | 16,335,614 | |
End of year | | $ | 17,349,060 | | | $ | 16,947,790 | |
| | | | | | | | | |
12 | THE GUGGENHEIM FUNDS ANNUAL FINANCIAL REPORT | SEE NOTES TO FINANCIAL STATEMENTS. |
STATEMENTS OF CHANGES IN NET ASSETS (concluded) |
| | Year Ended
September 30,
2024 | | | Year Ended
September 30,
2023 | |
Capital share activity: | | | | | | | | |
Shares sold | | | | | | | | |
Class A | | | 15,003 | | | | 61,231 | |
Class C | | | 4,566 | | | | 2,146 | |
Class P | | | 7,239 | | | | 2,876 | |
Institutional Class | | | 28,117 | | | | 15,749 | |
Shares issued from reinvestment of distributions | | | | | | | | |
Class A | | | 4,487 | | | | 8,554 | |
Class C | | | 91 | | | | 245 | |
Class P | | | 323 | | | | 638 | |
Institutional Class | | | 5,378 | | | | 8,229 | |
Shares redeemed | | | | | | | | |
Class A | | | (258,658 | ) | | | (88,251 | ) |
Class C | | | (13,730 | ) | | | (27,717 | ) |
Class P | | | (11,277 | ) | | | (33,443 | ) |
Institutional Class | | | (120,503 | ) | | | (114,602 | ) |
Net decrease in shares | | | (338,964 | ) | | | (164,345 | ) |
SEE NOTES TO FINANCIAL STATEMENTS. | THE GUGGENHEIM FUNDS ANNUAL FINANCIAL REPORT | 13 |
This table is presented to show selected data for a share outstanding throughout each period and to assist shareholders in evaluating a Fund’s performance for the periods presented.
Class A | | Year Ended
September 30,
2024 | | | Year Ended
September 30,
2023 | | | Year Ended
September 30,
2022 | | | Year Ended
September 30,
2021 | | | Year Ended
September 30,
2020 | |
Per Share Data |
Net asset value, beginning of period | | $ | 12.40 | | | $ | 10.69 | | | $ | 14.59 | | | $ | 10.76 | | | $ | 12.00 | |
Income (loss) from investment operations: |
Net investment income (loss)a | | | .14 | | | | .15 | | | | .11 | | | | .27 | | | | .30 | |
Net gain (loss) on investments (realized and unrealized) | | | 4.42 | | | | 1.70 | | | | (1.65 | ) | | | 3.99 | | | | (.91 | ) |
Total from investment operations | | | 4.56 | | | | 1.85 | | | | (1.54 | ) | | | 4.26 | | | | (.61 | ) |
Less distributions from: |
Net investment income | | | (.13 | ) | | | (.13 | ) | | | (.09 | ) | | | (.43 | ) | | | (.31 | ) |
Net realized gains | | | — | | | | — | | | | (2.23 | ) | | | — | | | | (.21 | ) |
Return of capital | | | — | | | | (.01 | ) | | | (.04 | ) | | | — | | | | (.11 | ) |
Total distributions | | | (.13 | ) | | | (.14 | ) | | | (2.36 | ) | | | (.43 | ) | | | (.63 | ) |
Net asset value, end of period | | $ | 16.83 | | | $ | 12.40 | | | $ | 10.69 | | | $ | 14.59 | | | $ | 10.76 | |
|
Total Returnb | | | 36.91 | % | | | 17.34 | % | | | (14.13 | %) | | | 39.75 | % | | | (5.16 | %) |
Ratios/Supplemental Data |
Net assets, end of period (in thousands) | | $ | 8,425 | | | $ | 9,174 | | | $ | 8,103 | | | $ | 11,274 | | | $ | 5,357 | |
Ratios to average net assets: |
Net investment income (loss) | | | 0.97 | % | | | 1.18 | % | | | 0.85 | % | | | 1.89 | % | | | 2.73 | % |
Total expensesc | | | 2.21 | % | | | 2.10 | % | | | 1.92 | % | | | 1.91 | % | | | 2.04 | % |
Net expensesd,e,f | | | 1.17 | % | | | 1.17 | % | | | 1.20 | % | | | 1.20 | % | | | 1.21 | % |
Portfolio turnover rate | | | 69 | % | | | 73 | % | | | 70 | % | | | 157 | % | | | 114 | % |
Class C | | Year Ended
September 30,
2024 | | | Year Ended
September 30,
2023 | | | Year Ended
September 30,
2022 | | | Year Ended
September 30,
2021 | | | Year Ended
September 30,
2020 | |
Per Share Data |
Net asset value, beginning of period | | $ | 12.57 | | | $ | 10.83 | | | $ | 14.76 | | | $ | 10.86 | | | $ | 12.06 | |
Income (loss) from investment operations: |
Net investment income (loss)a | | | .03 | | | | .05 | | | | — | | | | .20 | | | | .22 | |
Net gain (loss) on investments (realized and unrealized) | | | 4.47 | | | | 1.74 | | | | (1.66 | ) | | | 3.99 | | | | (.92 | ) |
Total from investment operations | | | 4.50 | | | | 1.79 | | | | (1.66 | ) | | | 4.19 | | | | (.70 | ) |
Less distributions from: |
Net investment income | | | (.03 | ) | | | (.04 | ) | | | — | h | | | (.29 | ) | | | (.18 | ) |
Net realized gains | | | — | | | | — | | | | (2.23 | ) | | | — | | | | (.21 | ) |
Return of capital | | | — | | | | (.01 | ) | | | (.04 | ) | | | — | | | | (.11 | ) |
Total distributions | | | (.03 | ) | | | (.05 | ) | | | (2.27 | ) | | | (.29 | ) | | | (.50 | ) |
Net asset value, end of period | | $ | 17.04 | | | $ | 12.57 | | | $ | 10.83 | | | $ | 14.76 | | | $ | 10.86 | |
|
Total Returnb | | | 35.81 | % | | | 16.55 | % | | | (14.78 | %) | | | 38.60 | % | | | (5.84 | %) |
Ratios/Supplemental Data |
Net assets, end of period (in thousands) | | $ | 727 | | | $ | 650 | | | $ | 834 | | | $ | 2,281 | | | $ | 3,651 | |
Ratios to average net assets: |
Net investment income (loss) | | | 0.22 | % | | | 0.44 | % | | | 0.02 | % | | | 1.42 | % | | | 1.92 | % |
Total expensesc | | | 2.99 | % | | | 2.90 | % | | | 2.67 | % | | | 2.70 | % | | | 2.80 | % |
Net expensesd,e,f | | | 1.93 | % | | | 1.92 | % | | | 1.95 | % | | | 1.95 | % | | | 1.96 | % |
Portfolio turnover rate | | | 69 | % | | | 73 | % | | | 70 | % | | | 157 | % | | | 114 | % |
14 | THE GUGGENHEIM FUNDS ANNUAL FINANCIAL REPORT | SEE NOTES TO FINANCIAL STATEMENTS. |
FINANCIAL HIGHLIGHTS (continued) |
This table is presented to show selected data for a share outstanding throughout each period and to assist shareholders in evaluating a Fund’s performance for the periods presented.
Class P | | Year Ended
September 30,
2024 | | | Year Ended
September 30,
2023 | | | Year Ended
September 30,
2022 | | | Year Ended
September 30,
2021 | | | Year Ended
September 30,
2020 | |
Per Share Data |
Net asset value, beginning of period | | $ | 12.55 | | | $ | 10.82 | | | $ | 14.74 | | | $ | 10.84 | | | $ | 12.13 | |
Income (loss) from investment operations: |
Net investment income (loss)a | | | .14 | | | | .15 | | | | .11 | | | | .27 | | | | .30 | |
Net gain (loss) on investments (realized and unrealized) | | | 4.47 | | | | 1.73 | | | | (1.68 | ) | | | 4.02 | | | | (.92 | ) |
Total from investment operations | | | 4.61 | | | | 1.88 | | | | (1.57 | ) | | | 4.29 | | | | (.62 | ) |
Less distributions from: |
Net investment income | | | (.13 | ) | | | (.14 | ) | | | (.08 | ) | | | (.39 | ) | | | (.35 | ) |
Net realized gains | | | — | | | | — | | | | (2.23 | ) | | | — | | | | (.21 | ) |
Return of capital | | | — | | | | (.01 | ) | | | (.04 | ) | | | — | | | | (.11 | ) |
Total distributions | | | (.13 | ) | | | (.15 | ) | | | (2.35 | ) | | | (.39 | ) | | | (.67 | ) |
Net asset value, end of period | | $ | 17.03 | | | $ | 12.55 | | | $ | 10.82 | | | $ | 14.74 | | | $ | 10.84 | |
|
Total Return | | | 36.88 | % | | | 17.43 | % | | | (14.18 | %) | | | 39.72 | % | | | (5.13 | %) |
Ratios/Supplemental Data |
Net assets, end of period (in thousands) | | $ | 661 | | | $ | 534 | | | $ | 784 | | | $ | 1,527 | | | $ | 1,093 | |
Ratios to average net assets: |
Net investment income (loss) | | | 0.97 | % | | | 1.18 | % | | | 0.80 | % | | | 1.87 | % | | | 2.60 | % |
Total expensesc | | | 2.30 | % | | | 2.25 | % | | | 1.98 | % | | | 1.93 | % | | | 2.06 | % |
Net expensesd,e,f | | | 1.17 | % | | | 1.17 | % | | | 1.20 | % | | | 1.20 | % | | | 1.21 | % |
Portfolio turnover rate | | | 69 | % | | | 73 | % | | | 70 | % | | | 157 | % | | | 114 | % |
SEE NOTES TO FINANCIAL STATEMENTS. | THE GUGGENHEIM FUNDS ANNUAL FINANCIAL REPORT | 15 |
FINANCIAL HIGHLIGHTS (concluded) |
This table is presented to show selected data for a share outstanding throughout each period and to assist shareholders in evaluating a Fund’s performance for the periods presented.
Institutional Class | | Year Ended
September 30,
2024 | | | Year Ended
September 30,
2023 | | | Year Ended
September 30,
2022 | | | Year Ended
September 30,
2021 | | | Year Ended
September 30,
2020 | |
Per Share Data |
Net asset value, beginning of period | | $ | 11.94 | | | $ | 10.29 | | | $ | 14.14 | | | $ | 10.46 | | | $ | 11.70 | |
Income (loss) from investment operations: |
Net investment income (loss)a | | | .17 | | | | .17 | | | | .14 | | | | .30 | | | | .32 | |
Net gain (loss) on investments (realized and unrealized) | | | 4.26 | | | | 1.65 | | | | (1.59 | ) | | | 3.86 | | | | (.88 | ) |
Total from investment operations | | | 4.43 | | | | 1.82 | | | | (1.45 | ) | | | 4.16 | | | | (.56 | ) |
Less distributions from: |
Net investment income | | | (.16 | ) | | | (.16 | ) | | | (.13 | ) | | | (.48 | ) | | | (.36 | ) |
Net realized gains | | | — | | | | — | | | | (2.23 | ) | | | — | | | | (.21 | ) |
Return of capital | | | — | | | | (.01 | ) | | | (.04 | ) | | | — | | | | (.11 | ) |
Total distributions | | | (.16 | ) | | | (.17 | ) | | | (2.40 | ) | | | (.48 | ) | | | (.68 | ) |
Net asset value, end of period | | $ | 16.21 | | | $ | 11.94 | | | $ | 10.29 | | | $ | 14.14 | | | $ | 10.46 | |
|
Total Return | | | 37.25 | % | | | 17.69 | % | | | (13.97 | %) | | | 40.06 | % | | | (4.88 | %) |
Ratios/Supplemental Data |
Net assets, end of period (in thousands) | | $ | 7,536 | | | $ | 6,591 | | | $ | 6,614 | | | $ | 10,101 | | | $ | 6,882 | |
Ratios to average net assets: |
Net investment income (loss) | | | 1.24 | % | | | 1.43 | % | | | 1.08 | % | | | 2.22 | % | | | 2.94 | % |
Total expensesc | | | 1.86 | % | | | 1.81 | % | | | 1.62 | % | | | 1.62 | % | | | 1.80 | % |
Net expensesd,e,f | | | 0.92 | % | | | 0.92 | % | | | 0.95 | % | | | 0.95 | % | | | 0.96 | % |
Portfolio turnover rate | | | 69 | % | | | 73 | % | | | 70 | % | | | 157 | % | | | 114 | % |
a | Net investment income (loss) per share was computed using average shares outstanding throughout the period. |
b | Total return does not reflect the impact of any applicable sales charges. |
c | Does not include expenses of the underlying funds in which the Fund invests. |
d | Net expense information reflects the expense ratios after expense waivers and reimbursements, as applicable. |
e | The portion of the ratios of net expenses to average net assets attributable to recoupments of prior fee reductions or expense reimbursements for the years presented was as follows: |
| | | 09/30/24 | 09/30/23 | 09/30/22 | 09/30/21 | 09/30/20 |
| | Class A | 0.00%g | — | — | — | 0.00%g |
| | Class C | 0.00%g | — | — | — | 0.00%g |
| | Class P | 0.00%g | — | — | — | — |
| | Institutional Class | 0.00%g | — | — | — | — |
f | Net expenses may include expenses that are excluded from the expense limitation agreement. Excluding these expenses, the net expense ratios for the years presented would be: |
| | | 09/30/24 | 09/30/23 | 09/30/22 | 09/30/21 | 09/30/20 |
| | Class A | 1.17% | 1.17% | 1.19% | 1.20% | 1.20% |
| | Class C | 1.92% | 1.92% | 1.95% | 1.95% | 1.96% |
| | Class P | 1.17% | 1.17% | 1.20% | 1.20% | 1.21% |
| | Institutional Class | 0.92% | 0.92% | 0.94% | 0.95% | 0.95% |
| | h | Less than $0.01 per share. |
16 | THE GUGGENHEIM FUNDS ANNUAL FINANCIAL REPORT | SEE NOTES TO FINANCIAL STATEMENTS. |
SCHEDULE OF INVESTMENTS | September 30, 2024 |
RBP® LARGE-CAP DEFENSIVE FUND | |
| | Shares | | | Value | |
COMMON STOCKS† - 95.9% |
| | | | | | | | | |
Technology - 22.4% |
Microsoft Corp. | | | 1,290 | | | $ | 555,087 | |
NVIDIA Corp. | | | 3,256 | | | | 395,409 | |
Apple, Inc. | | | 1,655 | | | | 385,615 | |
Oracle Corp. | | | 391 | | | | 66,626 | |
ServiceNow, Inc.* | | | 74 | | | | 66,185 | |
Intuit, Inc. | | | 95 | | | | 58,995 | |
Broadcom, Inc. | | | 325 | | | | 56,062 | |
Synopsys, Inc.* | | | 87 | | | | 44,056 | |
Cadence Design Systems, Inc.* | | | 63 | | | | 17,075 | |
Leidos Holdings, Inc. | | | 71 | | | | 11,573 | |
CACI International, Inc. — Class A* | | | 18 | | | | 9,082 | |
Fair Isaac Corp.* | | | 4 | | | | 7,774 | |
Amentum Holdings, Inc.* | | | 128 | | | | 4,128 | |
NetApp, Inc. | | | 31 | | | | 3,829 | |
Tyler Technologies, Inc.* | | | 6 | | | | 3,502 | |
PTC, Inc.* | | | 16 | | | | 2,891 | |
Total Technology | | | | | | | 1,687,889 | |
| | | | | | | | | |
Consumer, Non-cyclical - 21.7% |
Eli Lilly & Co. | | | 226 | | | | 200,222 | |
Abbott Laboratories | | | 1,160 | | | | 132,252 | |
Merck & Company, Inc. | | | 1,150 | | | | 130,594 | |
Boston Scientific Corp.* | | | 1,503 | | | | 125,951 | |
Becton Dickinson & Co. | | | 487 | | | | 117,416 | |
PepsiCo, Inc. | | | 629 | | | | 106,961 | |
Cencora, Inc. — Class A | | | 474 | | | | 106,688 | |
Mondelez International, Inc. — Class A | | | 1,414 | | | | 104,170 | |
Constellation Brands, Inc. — Class A | | | 382 | | | | 98,438 | |
Coca-Cola Co. | | | 1,356 | | | | 97,442 | |
UnitedHealth Group, Inc. | | | 141 | | | | 82,440 | |
AbbVie, Inc. | | | 312 | | | | 61,614 | |
Vertex Pharmaceuticals, Inc.* | | | 121 | | | | 56,275 | |
Cigna Group | | | 136 | | | | 47,116 | |
Colgate-Palmolive Co. | | | 451 | | | | 46,818 | |
Dexcom, Inc.* | | | 594 | | | | 39,822 | |
Encompass Health Corp. | | | 258 | | | | 24,933 | |
Zoetis, Inc. | | | 103 | | | | 20,124 | |
Amgen, Inc. | | | 51 | | | | 16,433 | |
United Therapeutics Corp.* | | | 19 | | | | 6,808 | |
Church & Dwight Company, Inc. | | | 58 | | | | 6,074 | |
Booz Allen Hamilton Holding Corp. | | | 34 | | | | 5,534 | |
ResMed, Inc. | | | 11 | | | | 2,685 | |
Total Consumer, Non-cyclical | | | | | | | 1,636,810 | |
| | | | | | | | | |
Communications - 18.2% |
Alphabet, Inc. — Class C | | | 2,165 | | | | 361,966 | |
Amazon.com, Inc.* | | | 1,701 | | | | 316,947 | |
Meta Platforms, Inc. — Class A | | | 510 | | | | 291,945 | |
Arista Networks, Inc.* | | | 332 | | | | 127,428 | |
T-Mobile US, Inc. | | | 594 | | | | 122,578 | |
Motorola Solutions, Inc. | | | 134 | | | | 60,250 | |
Netflix, Inc.* | | | 71 | | | | 50,358 | |
Walt Disney Co. | | | 156 | | | | 15,006 | |
Booking Holdings, Inc. | | | 3 | | | | 12,636 | |
Palo Alto Networks, Inc.* | | | 28 | | | | 9,571 | |
GoDaddy, Inc. — Class A* | | | 25 | | | | 3,920 | |
Total Communications | | | | | | | 1,372,605 | |
| | | | | | | | | |
Financial - 14.6% |
JPMorgan Chase & Co. | | | 920 | | | | 193,991 | |
Visa, Inc. — Class A | | | 605 | | | | 166,345 | |
Mastercard, Inc. — Class A | | | 336 | | | | 165,917 | |
Intercontinental Exchange, Inc. | | | 750 | | | | 120,480 | |
Travelers Companies, Inc. | | | 480 | | | | 112,378 | |
Arch Capital Group Ltd.* | | | 1,004 | | | | 112,328 | |
Everest Group Ltd. | | | 244 | | | | 95,606 | |
Tradeweb Markets, Inc. — Class A | | | 241 | | | | 29,804 | |
Welltower, Inc. REIT | | | 228 | | | | 29,191 | |
Realty Income Corp. REIT | | | 394 | | | | 24,988 | |
Ameriprise Financial, Inc. | | | 30 | | | | 14,094 | |
American Homes 4 Rent — Class A REIT | | | 342 | | | | 13,129 | |
AvalonBay Communities, Inc. REIT | | | 52 | | | | 11,713 | |
Erie Indemnity Co. — Class A | | | 9 | | | | 4,858 | |
Hartford Financial Services Group, Inc. | | | 34 | | | | 3,999 | |
EastGroup Properties, Inc. REIT | | | 15 | | | | 2,802 | |
Total Financial | | | | | | | 1,101,623 | |
| | | | | | | | | |
Utilities - 7.6% |
Constellation Energy Corp. | | | 528 | | | | 137,291 | |
Southern Co. | | | 1,345 | | | | 121,292 | |
FirstEnergy Corp. | | | 1,856 | | | | 82,314 | |
NextEra Energy, Inc. | | | 860 | | | | 72,696 | |
CMS Energy Corp. | | | 956 | | | | 67,522 | |
American Electric Power Company, Inc. | | | 474 | | | | 48,632 | |
Alliant Energy Corp. | | | 229 | | | | 13,898 | |
NRG Energy, Inc. | | | 148 | | | | 13,483 | |
Vistra Corp. | | | 99 | | | | 11,735 | |
Total Utilities | | | | | | | 568,863 | |
| | | | | | | | | |
Consumer, Cyclical - 6.1% |
Walmart, Inc. | | | 1,954 | | | | 157,786 | |
Costco Wholesale Corp. | | | 172 | | | | 152,481 | |
TJX Companies, Inc. | | | 1,060 | | | | 124,592 | |
Hilton Worldwide Holdings, Inc. | | | 55 | | | | 12,677 | |
Deckers Outdoor Corp.* | | | 24 | | | | 3,827 | |
Yum! Brands, Inc. | | | 25 | | | | 3,493 | |
Total Consumer, Cyclical | | | | | | | 454,856 | |
| | | | | | | | | |
Industrial - 3.8% |
Illinois Tool Works, Inc. | | | 332 | | | | 87,007 | |
FedEx Corp. | | | 100 | | | | 27,368 | |
Trane Technologies plc | | | 69 | | | | 26,822 | |
Republic Services, Inc. — Class A | | | 115 | | | | 23,097 | |
General Electric Co. | | | 116 | | | | 21,875 | |
Jacobs Solutions, Inc. | | | 128 | | | | 16,755 | |
Dover Corp. | | | 87 | | | | 16,681 | |
HEICO Corp. | | | 49 | | | | 12,813 | |
Amphenol Corp. — Class A | | | 182 | | | | 11,859 | |
Garmin Ltd. | | | 60 | | | | 10,562 | |
Ingersoll Rand, Inc. | | | 105 | | | | 10,307 | |
Parker-Hannifin Corp. | | | 16 | | | | 10,109 | |
SEE NOTES TO FINANCIAL STATEMENTS. | THE GUGGENHEIM FUNDS ANNUAL FINANCIAL REPORT | 17 |
SCHEDULE OF INVESTMENTS (concluded) | September 30, 2024 |
RBP® LARGE-CAP DEFENSIVE FUND | |
| | Shares | | | Value | |
Xylem, Inc. | | | 51 | | | $ | 6,887 | |
EMCOR Group, Inc. | | | 15 | | | | 6,458 | |
Total Industrial | | | | | | | 288,600 | |
| | | | | | | | | |
Basic Materials - 1.3% |
Sherwin-Williams Co. | | | 129 | | | | 49,235 | |
Ecolab, Inc. | | | 187 | | | | 47,747 | |
Total Basic Materials | | | | | | | 96,982 | |
| | | | | | | | | |
Energy - 0.2% |
Exxon Mobil Corp. | | | 70 | | | | 8,205 | |
Occidental Petroleum Corp. | | | 53 | | | | 2,732 | |
Total Energy | | | | | | | 10,937 | |
| | | | | | | | | |
Total Common Stocks | | | | |
(Cost $5,640,985) | | | | | | | 7,219,165 | |
| | | | | | | | | |
EXCHANGE-TRADED FUNDS***,† - 3.2% |
Vanguard S&P 500 ETF | | | 230 | | | | 121,364 | |
SPDR S&P 500 ETF Trust | | | 211 | | | | 121,063 | |
Total Exchange-Traded Funds | | | | |
(Cost $235,732) | | | | | | | 242,427 | |
| | | | | | | | | |
Total Investments - 99.1% | | | | |
(Cost $5,876,717) | | | 7,461,592 | |
Other Assets & Liabilities, net - 0.9% | | | 67,461 | |
Total Net Assets - 100.0% | | $ | 7,529,053 | |
* | Non-income producing security. |
*** | A copy of each underlying unaffiliated fund’s financial statements is available at the SEC’s website at www.sec.gov. |
† | Value determined based on Level 1 inputs — See Note 4. |
| | plc — Public Limited Company |
| | REIT — Real Estate Investment Trust |
| | |
| | See Sector Classification in Other Information section. |
The following table summarizes the inputs used to value the Fund’s investments at September 30, 2024 (See Note 4 in the Notes to Financial Statements):
Investments in Securities (Assets) | | Level 1
Quoted
Prices | | | Level 2
Significant
Observable
Inputs | | | Level 3
Significant
Unobservable
Inputs | | | Total | |
Common Stocks | | $ | 7,219,165 | | | $ | — | | | $ | — | | | $ | 7,219,165 | |
Exchange-Traded Funds | | | 242,427 | | | | — | | | | — | | | | 242,427 | |
Total Assets | | $ | 7,461,592 | | | $ | — | | | $ | — | | | $ | 7,461,592 | |
18 | THE GUGGENHEIM FUNDS ANNUAL FINANCIAL REPORT | SEE NOTES TO FINANCIAL STATEMENTS. |
RBP® LARGE-CAP DEFENSIVE FUND | |
STATEMENT OF ASSETS AND LIABILITIES |
September 30, 2024 |
Assets: |
Investments, at value (cost $5,876,717) | | $ | 7,461,592 | |
Cash | | | 35,485 | |
Prepaid expenses | | | 33,441 | |
Receivables: |
Investment Adviser | | | 38,012 | |
Dividends | | | 4,048 | |
Total assets | | | 7,572,578 | |
| | | | | |
Liabilities: |
Payable for: |
Professional fees | | | 30,315 | |
Fund accounting and administration fees | | | 3,812 | |
Transfer agent fees | | | 2,333 | |
Printing fees | | | 2,272 | |
Distribution and service fees | | | 1,530 | |
Trustees’ fees* | | | 515 | |
Fund shares redeemed | | | 25 | |
Miscellaneous | | | 2,723 | |
Total liabilities | | | 43,525 | |
Net assets | | $ | 7,529,053 | |
| | | | | |
Net assets consist of: |
Paid in capital | | $ | 5,475,469 | |
Total distributable earnings (loss) | | | 2,053,584 | |
Net assets | | $ | 7,529,053 | |
| | | | | |
Class A: |
Net assets | | $ | 2,647,683 | |
Capital shares outstanding | | | 218,894 | |
Net asset value per share | | $ | 12.10 | |
Maximum offering price per share (Net asset value divided by 95.25%) | | $ | 12.70 | |
| | | | | |
Class C: |
Net assets | | $ | 231,086 | |
Capital shares outstanding | | | 20,725 | |
Net asset value per share | | $ | 11.15 | |
| | | | | |
Class P: |
Net assets | | $ | 211,125 | |
Capital shares outstanding | | | 16,715 | |
Net asset value per share | | $ | 12.63 | |
| | | | | |
Institutional Class: |
Net assets | | $ | 4,439,159 | |
Capital shares outstanding | | | 345,462 | |
Net asset value per share | | $ | 12.85 | |
STATEMENT OF OPERATIONS |
Year Ended September 30, 2024 |
Investment Income: |
Dividends | | $ | 91,424 | |
Total investment income | | | 91,424 | |
| | | | | |
Expenses: |
Management fees | | | 57,176 | |
Distribution and service fees: |
Class A | | | 8,050 | |
Class C | | | 4,030 | |
Class P | | | 544 | |
Transfer agent fees: |
Class A | | | 9,162 | |
Class C | | | 1,544 | |
Class P | | | 1,195 | |
Institutional Class | | | 13,858 | |
Registration fees | | | 76,644 | |
Professional fees | | | 41,387 | |
Trustees’ fees* | | | 13,615 | |
Fund accounting and administration fees | | | 11,959 | |
Custodian fees | | | 3,839 | |
Line of credit fees | | | 190 | |
Miscellaneous | | | 11,636 | |
Recoupment of previously waived fees: |
Class A | | | 24 | |
Class C | | | 5 | |
Class P | | | 2 | |
Institutional Class | | | 30 | |
Total expenses | | | 254,890 | |
Less: |
Expenses reimbursed by Adviser |
Class A | | | (38,932 | ) |
Class C | | | (5,444 | ) |
Class P | | | (3,418 | ) |
Institutional Class | | | (59,266 | ) |
Expenses waived by Adviser | | | (66,059 | ) |
Total waived/reimbursed expenses | | | (173,119 | ) |
Net expenses | | | 81,771 | |
Net investment income | | | 9,653 | |
| | | | | |
Net Realized and Unrealized Gain (Loss): |
Net realized gain (loss) on: |
Investments | | | 902,818 | |
Net realized gain | | | 902,818 | |
Net change in unrealized appreciation (depreciation) on: |
Investments | | | 1,297,927 | |
Net change in unrealized appreciation (depreciation) | | | 1,297,927 | |
Net realized and unrealized gain | | | 2,200,745 | |
Net increase in net assets resulting from operations | | $ | 2,210,398 | |
* | Relates to Trustees not deemed “interested persons” within the meaning of Section 2(a)(19) of the 1940 Act. |
SEE NOTES TO FINANCIAL STATEMENTS. | THE GUGGENHEIM FUNDS ANNUAL FINANCIAL REPORT | 19 |
RBP® LARGE-CAP DEFENSIVE FUND | |
STATEMENTS OF CHANGES IN NET ASSETS |
| | Year Ended
September 30,
2024 | | | Year Ended
September 30,
2023 | |
Increase (Decrease) in Net Assets from Operations: | | | | | | | | |
Net investment income | | $ | 9,653 | | | $ | 22,545 | |
Net realized gain (loss) on investments | | | 902,818 | | | | (121,571 | ) |
Net change in unrealized appreciation (depreciation) on investments | | | 1,297,927 | | | | 1,363,452 | |
Net increase in net assets resulting from operations | | | 2,210,398 | | | | 1,264,426 | |
| | | | | | | | | |
Distributions to shareholders: | | | | | | | | |
Class A | | | (4,708 | ) | | | (3,001 | ) |
Class P | | | (661 | ) | | | — | |
Institutional Class | | | (17,623 | ) | | | (6,932 | ) |
Total distributions to shareholders | | | (22,992 | ) | | | (9,933 | ) |
| | | | | | | | | |
Capital share transactions: | | | | | | | | |
Proceeds from sale of shares | | | | | | | | |
Class A | | | 189,233 | | | | 245,999 | |
Class C | | | 61,285 | | | | 14,005 | |
Class P | | | 13,703 | | | | 33,949 | |
Institutional Class | | | 8,895 | | | | 1,101,063 | |
Distributions reinvested | | | | | | | | |
Class A | | | 4,429 | | | | 2,830 | |
Class P | | | 661 | | | | — | |
Institutional Class | | | 17,443 | | | | 6,871 | |
Cost of shares redeemed | | | | | | | | |
Class A | | | (856,787 | ) | | | (1,613,695 | ) |
Class C | | | (352,657 | ) | | | (796,595 | ) |
Class P | | | (53,601 | ) | | | (172,016 | ) |
Institutional Class | | | (1,017,045 | ) | | | (1,225,135 | ) |
Net decrease from capital share transactions | | | (1,984,441 | ) | | | (2,402,724 | ) |
Net increase (decrease) in net assets | | | 202,965 | | | | (1,148,231 | ) |
| | | | | | | | | |
Net assets: | | | | | | | | |
Beginning of year | | | 7,326,088 | | | | 8,474,319 | |
End of year | | $ | 7,529,053 | | | $ | 7,326,088 | |
| | | | | | | | | |
Capital share activity: | | | | | | | | |
Shares sold | | | | | | | | |
Class A | | | 17,754 | | | | 28,433 | |
Class C | | | 5,995 | | | | 1,685 | |
Class P | | | 1,222 | | | | 3,671 | |
Institutional Class | | | 735 | | | | 128,942 | |
Shares issued from reinvestment of distributions | | | | | | | | |
Class A | | | 450 | | | | 327 | |
Class P | | | 65 | | | | — | |
Institutional Class | | | 1,671 | | | | 749 | |
Shares redeemed | | | | | | | | |
Class A | | | (79,233 | ) | | | (193,751 | ) |
Class C | | | (33,660 | ) | | | (103,343 | ) |
Class P | | | (4,578 | ) | | | (18,715 | ) |
Institutional Class | | | (91,261 | ) | | | (133,998 | ) |
Net decrease in shares | | | (180,840 | ) | | | (286,000 | ) |
20 | THE GUGGENHEIM FUNDS ANNUAL FINANCIAL REPORT | SEE NOTES TO FINANCIAL STATEMENTS. |
RBP® LARGE-CAP DEFENSIVE FUND | |
This table is presented to show selected data for a share outstanding throughout each period and to assist shareholders in evaluating a Fund’s performance for the periods presented.
Class A | | Year Ended
September 30,
2024 | | | Year Ended
September 30,
2023 | | | Year Ended
September 30,
2022 | | | Year Ended
September 30,
2021 | | | Year Ended
September 30,
2020 | |
Per Share Data |
Net asset value, beginning of period | | $ | 9.08 | | | $ | 7.80 | | | $ | 12.15 | | | $ | 10.46 | | | $ | 11.06 | |
Income (loss) from investment operations: |
Net investment income (loss)a | | | — | e | | | .02 | | | | .01 | | | | — | | | | .06 | |
Net gain (loss) on investments (realized and unrealized) | | | 3.04 | | | | 1.27 | | | | (1.44 | ) | | | 1.96 | | | | .11 | |
Total from investment operations | | | 3.04 | | | | 1.29 | | | | (1.43 | ) | | | 1.96 | | | | .17 | |
Less distributions from: |
Net investment income | | | (.02 | ) | | | (.01 | ) | | | — | | | | (.03 | ) | | | (.05 | ) |
Net realized gains | | | — | | | | — | | | | (2.92 | ) | | | (.24 | ) | | | (.72 | ) |
Total distributions | | | (.02 | ) | | | (.01 | ) | | | (2.92 | ) | | | (.27 | ) | | | (.77 | ) |
Net asset value, end of period | | $ | 12.10 | | | $ | 9.08 | | | $ | 7.80 | | | $ | 12.15 | | | $ | 10.46 | |
|
Total Returnb | | | 33.50 | % | | | 16.54 | % | | | (17.94 | %) | | | 18.97 | % | | | 1.40 | % |
Ratios/Supplemental Data |
Net assets, end of period (in thousands) | | $ | 2,648 | | | $ | 2,541 | | | $ | 3,471 | | | $ | 4,494 | | | $ | 3,821 | |
Ratios to average net assets: |
Net investment income (loss) | | | 0.02 | % | | | 0.18 | % | | | 0.06 | % | | | 0.01 | % | | | 0.56 | % |
Total expensesc | | | 3.49 | % | | | 3.14 | % | | | 2.81 | % | | | 2.70 | % | | | 2.48 | % |
Net expensesd,f,g | | | 1.17 | % | | | 1.17 | % | | | 1.20 | % | | | 1.20 | % | | | 1.21 | % |
Portfolio turnover rate | | | 72 | % | | | 68 | % | | | 79 | % | | | 123 | % | | | 100 | % |
Class C | | Year Ended
September 30,
2024 | | | Year Ended
September 30,
2023 | | | Year Ended
September 30,
2022 | | | Year Ended
September 30,
2021 | | | Year Ended
September 30,
2020 | |
Per Share Data |
Net asset value, beginning of period | | $ | 8.42 | | | $ | 7.28 | | | $ | 11.58 | | | $ | 10.03 | | | $ | 10.65 | |
Income (loss) from investment operations: |
Net investment income (loss)a | | | (.07 | ) | | | (.05 | ) | | | (.06 | ) | | | (.08 | ) | | | (.02 | ) |
Net gain (loss) on investments (realized and unrealized) | | | 2.80 | | | | 1.19 | | | | (1.32 | ) | | | 1.87 | | | | .12 | |
Total from investment operations | | | 2.73 | | | | 1.14 | | | | (1.38 | ) | | | 1.79 | | | | .10 | |
Less distributions from: |
Net realized gains | | | — | | | | — | | | | (2.92 | ) | | | (.24 | ) | | | (.72 | ) |
Total distributions | | | — | | | | — | | | | (2.92 | ) | | | (.24 | ) | | | (.72 | ) |
Net asset value, end of period | | $ | 11.15 | | | $ | 8.42 | | | $ | 7.28 | | | $ | 11.58 | | | $ | 10.03 | |
|
Total Returnb | | | 32.42 | % | | | 15.66 | % | | | (18.60 | %) | | | 18.03 | % | | | 0.74 | % |
Ratios/Supplemental Data |
Net assets, end of period (in thousands) | | $ | 231 | | | $ | 407 | | | $ | 1,092 | | | $ | 1,539 | | | $ | 2,595 | |
Ratios to average net assets: |
Net investment income (loss) | | | (0.73 | %) | | | (0.62 | %) | | | (0.66 | %) | | | (0.70 | %) | | | (0.19 | %) |
Total expensesc | | | 4.14 | % | | | 3.88 | % | | | 3.54 | % | | | 3.41 | % | | | 3.22 | % |
Net expensesd,f,g | | | 1.93 | % | | | 1.93 | % | | | 1.95 | % | | | 1.95 | % | | | 1.96 | % |
Portfolio turnover rate | | | 72 | % | | | 68 | % | | | 79 | % | | | 123 | % | | | 100 | % |
SEE NOTES TO FINANCIAL STATEMENTS. | THE GUGGENHEIM FUNDS ANNUAL FINANCIAL REPORT | 21 |
RBP® LARGE-CAP DEFENSIVE FUND | |
FINANCIAL HIGHLIGHTS (continued) |
This table is presented to show selected data for a share outstanding throughout each period and to assist shareholders in evaluating a Fund’s performance for the periods presented.
Class P | | Year Ended
September 30,
2024 | | | Year Ended
September 30,
2023 | | | Year Ended
September 30,
2022 | | | Year Ended
September 30,
2021 | | | Year Ended
September 30,
2020 | |
Per Share Data |
Net asset value, beginning of period | | $ | 9.50 | | | $ | 8.15 | | | $ | 12.58 | | | $ | 10.82 | | | $ | 11.41 | |
Income (loss) from investment operations: |
Net investment income (loss)a | | | — | e | | | .02 | | | | .01 | | | | — | | | | .06 | |
Net gain (loss) on investments (realized and unrealized) | | | 3.16 | | | | 1.33 | | | | (1.52 | ) | | | 2.03 | | | | .12 | |
Total from investment operations | | | 3.16 | | | | 1.35 | | | | (1.51 | ) | | | 2.03 | | | | .18 | |
Less distributions from: |
Net investment income | | | (.03 | ) | | | — | | | | — | | | | (.03 | ) | | | (.05 | ) |
Net realized gains | | | — | | | | — | | | | (2.92 | ) | | | (.24 | ) | | | (.72 | ) |
Total distributions | | | (.03 | ) | | | — | | | | (2.92 | ) | | | (.27 | ) | | | (.77 | ) |
Net asset value, end of period | | $ | 12.63 | | | $ | 9.50 | | | $ | 8.15 | | | $ | 12.58 | | | $ | 10.82 | |
|
Total Return | | | 33.52 | % | | | 16.56 | % | | | (17.97 | %) | | | 18.98 | % | | | 1.44 | % |
Ratios/Supplemental Data |
Net assets, end of period (in thousands) | | $ | 211 | | | $ | 190 | | | $ | 286 | | | $ | 327 | | | $ | 318 | |
Ratios to average net assets: |
Net investment income (loss) | | | 0.02 | % | | | 0.21 | % | | | 0.07 | % | | | 0.01 | % | | | 0.56 | % |
Total expensesc | | | 3.61 | % | | | 3.32 | % | | | 2.89 | % | | | 2.76 | % | | | 2.54 | % |
Net expensesd,f,g | | | 1.17 | % | | | 1.18 | % | | | 1.20 | % | | | 1.20 | % | | | 1.21 | % |
Portfolio turnover rate | | | 72 | % | | | 68 | % | | | 79 | % | | | 123 | % | | | 100 | % |
22 | THE GUGGENHEIM FUNDS ANNUAL FINANCIAL REPORT | SEE NOTES TO FINANCIAL STATEMENTS. |
RBP® LARGE-CAP DEFENSIVE FUND | |
FINANCIAL HIGHLIGHTS (concluded) |
This table is presented to show selected data for a share outstanding throughout each period and to assist shareholders in evaluating a Fund’s performance for the periods presented.
Institutional Class | | Year Ended
September 30,
2024 | | | Year Ended
September 30,
2023 | | | Year Ended
September 30,
2022 | | | Year Ended
September 30,
2021 | | | Year Ended
September 30,
2020 | |
Per Share Data |
Net asset value, beginning of period | | $ | 9.64 | | | $ | 8.27 | | | $ | 12.69 | | | $ | 10.93 | | | $ | 11.52 | |
Income (loss) from investment operations: |
Net investment income (loss)a | | | .03 | | | | .04 | | | | .03 | | | | .03 | | | | .09 | |
Net gain (loss) on investments (realized and unrealized) | | | 3.22 | | | | 1.34 | | | | (1.53 | ) | | | 2.04 | | | | .12 | |
Total from investment operations | | | 3.25 | | | | 1.38 | | | | (1.50 | ) | | | 2.07 | | | | .21 | |
Less distributions from: |
Net investment income | | | (.04 | ) | | | (.01 | ) | | | — | | | | (.07 | ) | | | (.08 | ) |
Net realized gains | | | — | | | | — | | | | (2.92 | ) | | | (.24 | ) | | | (.72 | ) |
Total distributions | | | (.04 | ) | | | (.01 | ) | | | (2.92 | ) | | | (.31 | ) | | | (.80 | ) |
Net asset value, end of period | | $ | 12.85 | | | $ | 9.64 | | | $ | 8.27 | | | $ | 12.69 | | | $ | 10.93 | |
|
Total Return | | | 33.82 | % | | | 16.74 | % | | | (17.68 | %) | | | 19.23 | % | | | 1.69 | % |
Ratios/Supplemental Data |
Net assets, end of period (in thousands) | | $ | 4,439 | | | $ | 4,188 | | | $ | 3,626 | | | $ | 4,676 | | | $ | 5,468 | |
Ratios to average net assets: |
Net investment income (loss) | | | 0.28 | % | | | 0.46 | % | | | 0.31 | % | | | 0.26 | % | | | 0.81 | % |
Total expensesc | | | 3.16 | % | | | 2.82 | % | | | 2.51 | % | | | 2.40 | % | | | 2.23 | % |
Net expensesd,f,g | | | 0.92 | % | | | 0.92 | % | | | 0.95 | % | | | 0.95 | % | | | 0.96 | % |
Portfolio turnover rate | | | 72 | % | | | 68 | % | | | 79 | % | | | 123 | % | | | 100 | % |
a | Net investment income (loss) per share was computed using average shares outstanding throughout the period. |
b | Total return does not reflect the impact of any applicable sales charges. |
c | Does not include expenses of the underlying funds in which the Fund invests. |
d | Net expense information reflects the expense ratios after expense waivers and reimbursements, as applicable. |
e | Less than $0.01 per share. |
f | The portion of the ratios of net expenses to average net assets attributable to recoupments of prior fee reductions or expense reimbursements for the years presented was as follows: |
| | | 09/30/24 | 09/30/23 | 09/30/22 | 09/30/21 | 09/30/20 |
| | Class A | 0.00%h | — | — | — | — |
| | Class C | 0.00%h | 0.00%h | — | — | 0.00%h |
| | Class P | 0.00%h | — | — | — | — |
| | Institutional Class | 0.00%h | — | — | — | — |
g | Net expenses may include expenses that are excluded from the expense limitation agreement. Excluding these expenses, the net expense ratios for the years presented would be: |
| | | 09/30/24 | 09/30/23 | 09/30/22 | 09/30/21 | 09/30/20 |
| | Class A | 1.17% | 1.17% | 1.19% | 1.20% | 1.21% |
| | Class C | 1.92% | 1.92% | 1.94% | 1.95% | 1.96% |
| | Class P | 1.17% | 1.17% | 1.19% | 1.20% | 1.21% |
| | Institutional Class | 0.92% | 0.92% | 0.94% | 0.95% | 0.96% |
SEE NOTES TO FINANCIAL STATEMENTS. | THE GUGGENHEIM FUNDS ANNUAL FINANCIAL REPORT | 23 |
SCHEDULE OF INVESTMENTS | September 30, 2024 |
RBP® LARGE-CAP VALUE FUND | |
| | Shares | | | Value | |
COMMON STOCKS† - 97.3% |
| | | | | | | | | |
Financial - 23.4% |
JPMorgan Chase & Co. | | | 654 | | | $ | 137,902 | |
Wells Fargo & Co. | | | 1,628 | | | | 91,966 | |
American Tower Corp. — Class A REIT | | | 297 | | | | 69,070 | |
Intercontinental Exchange, Inc. | | | 415 | | | | 66,666 | |
Prologis, Inc. REIT | | | 514 | | | | 64,908 | |
Ameriprise Financial, Inc. | | | 129 | | | | 60,605 | |
Travelers Companies, Inc. | | | 248 | | | | 58,062 | |
Arch Capital Group Ltd.* | | | 504 | | | | 56,388 | |
Hartford Financial Services Group, Inc. | | | 475 | | | | 55,865 | |
American International Group, Inc. | | | 752 | | | | 55,069 | |
U.S. Bancorp | | | 1,202 | | | | 54,968 | |
Unum Group | | | 905 | | | | 53,793 | |
Truist Financial Corp. | | | 1,186 | | | | 50,725 | |
Globe Life, Inc. | | | 477 | | | | 50,519 | |
Sun Communities, Inc. REIT | | | 345 | | | | 46,627 | |
State Street Corp. | | | 358 | | | | 31,672 | |
Realty Income Corp. REIT | | | 437 | | | | 27,715 | |
Invesco Ltd. | | | 1,418 | | | | 24,900 | |
Equity LifeStyle Properties, Inc. REIT | | | 349 | | | | 24,898 | |
Alexandria Real Estate Equities, Inc. REIT | | | 164 | | | | 19,475 | |
Erie Indemnity Co. — Class A | | | 28 | | | | 15,115 | |
Welltower, Inc. REIT | | | 96 | | | | 12,291 | |
Bank of America Corp. | | | 277 | | | | 10,991 | |
Equity Residential REIT | | | 125 | | | | 9,307 | |
W R Berkley Corp. | | | 139 | | | | 7,885 | |
Corebridge Financial, Inc. | | | 207 | | | | 6,036 | |
AvalonBay Communities, Inc. REIT | | | 23 | | | | 5,181 | |
SEI Investments Co. | | | 30 | | | | 2,076 | |
Iron Mountain, Inc. REIT | | | 15 | | | | 1,782 | |
Total Financial | | | | | | | 1,172,457 | |
| | | | | | | | | |
Consumer, Non-cyclical - 20.4% |
Coca-Cola Co. | | | 1,469 | | | | 105,562 | |
Procter & Gamble Co. | | | 596 | | | | 103,227 | |
Merck & Company, Inc. | | | 865 | | | | 98,229 | |
PepsiCo, Inc. | | | 554 | | | | 94,208 | |
Abbott Laboratories | | | 777 | | | | 88,586 | |
Boston Scientific Corp.* | | | 874 | | | | 73,241 | |
Automatic Data Processing, Inc. | | | 257 | | | | 71,120 | |
Mondelez International, Inc. — Class A | | | 912 | | | | 67,187 | |
Becton Dickinson & Co. | | | 264 | | | | 63,651 | |
AbbVie, Inc. | | | 317 | | | | 62,601 | |
Cencora, Inc. — Class A | | | 226 | | | | 50,868 | |
Global Payments, Inc. | | | 485 | | | | 49,674 | |
Amgen, Inc. | | | 149 | | | | 48,009 | |
Johnson & Johnson | | | 211 | | | | 34,195 | |
Booz Allen Hamilton Holding Corp. | | | 33 | | | | 5,371 | |
Keurig Dr Pepper, Inc. | | | 92 | | | | 3,448 | |
Quanta Services, Inc. | | | 8 | | | | 2,385 | |
Agilent Technologies, Inc. | | | 15 | | | | 2,227 | |
Total Consumer, Non-cyclical | | | | | | | 1,023,789 | |
| | | | | | | | | |
Consumer, Cyclical - 14.2% |
Walmart, Inc. | | | 1,479 | | | | 119,429 | |
TJX Companies, Inc. | | | 633 | | | | 74,403 | |
Yum! Brands, Inc. | | | 416 | | | | 58,119 | |
Target Corp. | | | 362 | | | | 56,421 | |
Las Vegas Sands Corp. | | | 1,110 | | | | 55,877 | |
United Airlines Holdings, Inc.* | | | 967 | | | | 55,177 | |
Delta Air Lines, Inc. | | | 1,050 | | | | 53,330 | |
General Motors Co. | | | 1,187 | | | | 53,225 | |
NIKE, Inc. — Class B | | | 601 | | | | 53,128 | |
Bath & Body Works, Inc. | | | 1,256 | | | | 40,092 | |
Home Depot, Inc. | | | 80 | | | | 32,416 | |
Darden Restaurants, Inc. | | | 107 | | | | 17,562 | |
McDonald’s Corp. | | | 40 | | | | 12,180 | |
Burlington Stores, Inc.* | | | 35 | | | | 9,222 | |
Lennar Corp. — Class A | | | 40 | | | | 7,499 | |
BJ’s Wholesale Club Holdings, Inc.* | | | 74 | | | | 6,104 | |
Royal Caribbean Cruises Ltd. | | | 15 | | | | 2,660 | |
Autoliv, Inc. | | | 21 | | | | 1,961 | |
Ross Stores, Inc. | | | 5 | | | | 753 | |
Total Consumer, Cyclical | | | | | | | 709,558 | |
| | | | | | | | | |
Industrial - 13.3% |
Caterpillar, Inc. | | | 207 | | | | 80,962 | |
Parker-Hannifin Corp. | | | 107 | | | | 67,605 | |
FedEx Corp. | | | 214 | | | | 58,567 | |
Lockheed Martin Corp. | | | 100 | | | | 58,456 | |
Amphenol Corp. — Class A | | | 895 | | | | 58,319 | |
Dover Corp. | | | 286 | | | | 54,838 | |
Jacobs Solutions, Inc. | | | 348 | | | | 45,553 | |
Middleby Corp.* | | | 308 | | | | 42,852 | |
Fortive Corp. | | | 490 | | | | 38,676 | |
Trane Technologies plc | | | 94 | | | | 36,541 | |
Illinois Tool Works, Inc. | | | 135 | | | | 35,379 | |
Johnson Controls International plc | | | 295 | | | | 22,895 | |
Ball Corp. | | | 269 | | | | 18,268 | |
Republic Services, Inc. — Class A | | | 89 | | | | 17,875 | |
Ingersoll Rand, Inc. | | | 126 | | | | 12,368 | |
HEICO Corp. | | | 26 | | | | 6,798 | |
AECOM | | | 50 | | | | 5,164 | |
Lincoln Electric Holdings, Inc. | | | 23 | | | | 4,416 | |
Total Industrial | | | | | | | 665,532 | |
| | | | | | | | | |
Technology - 7.4% |
Oracle Corp. | | | 625 | | | | 106,500 | |
Applied Materials, Inc. | | | 355 | | | | 71,728 | |
Manhattan Associates, Inc.* | | | 189 | | | | 53,181 | |
NetApp, Inc. | | | 396 | | | | 48,910 | |
Akamai Technologies, Inc.* | | | 386 | | | | 38,966 | |
Jack Henry & Associates, Inc. | | | 181 | | | | 31,954 | |
Amentum Holdings, Inc.* | | | 348 | | | | 11,223 | |
QUALCOMM, Inc. | | | 23 | | | | 3,911 | |
Leidos Holdings, Inc. | | | 13 | | | | 2,119 | |
Total Technology | | | | | | | 368,492 | |
| | | | | | | | | |
Energy - 6.7% |
Exxon Mobil Corp. | | | 1,050 | | | | 123,081 | |
Schlumberger N.V. | | | 1,373 | | | | 57,597 | |
ONEOK, Inc. | | | 625 | | | | 56,956 | |
Occidental Petroleum Corp. | | | 879 | | | | 45,304 | |
24 | THE GUGGENHEIM FUNDS ANNUAL FINANCIAL REPORT | SEE NOTES TO FINANCIAL STATEMENTS. |
SCHEDULE OF INVESTMENTS (concluded) | September 30, 2024 |
RBP® LARGE-CAP VALUE FUND | |
| | Shares | | | Value | |
Antero Resources Corp.* | | | 1,255 | | | $ | 35,956 | |
Marathon Oil Corp. | | | 436 | | | | 11,611 | |
Williams Companies, Inc. | | | 95 | | | | 4,337 | |
Chevron Corp. | | | 16 | | | | 2,356 | |
Total Energy | | | | | | | 337,198 | |
| | | | | | | | | |
Utilities - 5.6% |
NextEra Energy, Inc. | | | 990 | | | | 83,685 | |
American Electric Power Company, Inc. | | | 568 | | | | 58,277 | |
Entergy Corp. | | | 420 | | | | 55,276 | |
FirstEnergy Corp. | | | 1,153 | | | | 51,135 | |
NRG Energy, Inc. | | | 289 | | | | 26,328 | |
Vistra Corp. | | | 40 | | | | 4,742 | |
Southern Co. | | | 33 | | | | 2,976 | |
Total Utilities | | | | | | | 282,419 | |
| | | | | | | | | |
Communications - 3.8% |
Walt Disney Co. | | | 906 | | | | 87,148 | |
Motorola Solutions, Inc. | | | 143 | | | | 64,297 | |
AT&T, Inc. | | | 1,267 | | | | 27,874 | |
Match Group, Inc.* | | | 166 | | | | 6,281 | |
Fox Corp. — Class A | | | 86 | | | | 3,641 | |
Total Communications | | | | | | | 189,241 | |
| | | | | | | | | |
Basic Materials - 2.5% |
Ecolab, Inc. | | | 180 | | | | 45,959 | |
DuPont de Nemours, Inc. | | | 418 | | | | 37,248 | |
Newmont Corp. | | | 218 | | | | 11,652 | |
Dow, Inc. | | | 204 | | | | 11,144 | |
PPG Industries, Inc. | | | 71 | | | | 9,405 | |
Axalta Coating Systems Ltd.* | | | 183 | | | | 6,623 | |
Royal Gold, Inc. | | | 36 | | | | 5,051 | |
Total Basic Materials | | | | | | | 127,082 | |
| | | | | | | | | |
Total Common Stocks | | | | |
(Cost $4,202,261) | | | | | | | 4,875,768 | |
| | | | | | | | | |
EXCHANGE-TRADED FUNDS***,† - 1.9% |
iShares S&P 500 Value ETF | | | 481 | | | | 94,839 | |
Total Exchange-Traded Funds | | | | |
(Cost $90,159) | | | | | | | 94,839 | |
| | | | | | | | | |
Total Investments - 99.2% | | | | |
(Cost $4,292,420) | | $ | 4,970,607 | |
Other Assets & Liabilities, net - 0.8% | | | 39,015 | |
Total Net Assets - 100.0% | | $ | 5,009,622 | |
* | Non-income producing security. |
*** | A copy of each underlying unaffiliated fund’s financial statements is available at the SEC’s website at www.sec.gov. |
† | Value determined based on Level 1 inputs — See Note 4. |
| | plc — Public Limited Company |
| | REIT — Real Estate Investment Trust |
| | |
| | See Sector Classification in Other Information section. |
The following table summarizes the inputs used to value the Fund’s investments at September 30, 2024 (See Note 4 in the Notes to Financial Statements):
Investments in Securities (Assets) | | Level 1
Quoted
Prices | | | Level 2
Significant
Observable
Inputs | | | Level 3
Significant
Unobservable
Inputs | | | Total | |
Common Stocks | | $ | 4,875,768 | | | $ | — | | | $ | — | | | $ | 4,875,768 | |
Exchange-Traded Funds | | | 94,839 | | | | — | | | | — | | | | 94,839 | |
Total Assets | | $ | 4,970,607 | | | $ | — | | | $ | — | | | $ | 4,970,607 | |
SEE NOTES TO FINANCIAL STATEMENTS. | THE GUGGENHEIM FUNDS ANNUAL FINANCIAL REPORT | 25 |
RBP® LARGE-CAP VALUE FUND | |
STATEMENT OF ASSETS AND LIABILITIES |
September 30, 2024 |
Assets: |
Investments, at value (cost $4,292,420) | | $ | 4,970,607 | |
Cash | | | 12,106 | |
Prepaid expenses | | | 29,675 | |
Receivables: |
Investment Adviser | | | 27,132 | |
Dividends | | | 5,578 | |
Total assets | | | 5,045,098 | |
| | | | | |
Liabilities: |
Payable for: |
Professional fees | | | 25,477 | |
Fund accounting and administration fees | | | 3,810 | |
Transfer agent fees | | | 2,377 | |
Trustees’ fees* | | | 384 | |
Distribution and service fees | | | 377 | |
Miscellaneous | | | 3,051 | |
Total liabilities | | | 35,476 | |
Net assets | | $ | 5,009,622 | |
| | | | | |
Net assets consist of: |
Paid in capital | | $ | 3,982,202 | |
Total distributable earnings (loss) | | | 1,027,420 | |
Net assets | | $ | 5,009,622 | |
| | | | | |
Class A: |
Net assets | | $ | 391,766 | |
Capital shares outstanding | | | 32,565 | |
Net asset value per share | | $ | 12.03 | |
Maximum offering price per share (Net asset value divided by 95.25%) | | $ | 12.63 | |
| | | | | |
Class C: |
Net assets | | $ | 320,565 | |
Capital shares outstanding | | | 27,069 | |
Net asset value per share | | $ | 11.84 | |
| | | | | |
Class P: |
Net assets | | $ | 156,663 | |
Capital shares outstanding | | | 13,270 | |
Net asset value per share | | $ | 11.81 | |
| | | | | |
Institutional Class: |
Net assets | | $ | 4,140,628 | |
Capital shares outstanding | | | 332,124 | |
Net asset value per share | | $ | 12.47 | |
STATEMENT OF OPERATIONS |
Year Ended September 30, 2024 |
Investment Income: |
Dividends | | $ | 85,498 | |
Total investment income | | | 85,498 | |
| | | | | |
Expenses: |
Management fees | | | 32,924 | |
Distribution and service fees: |
Class A | | | 1,016 | |
Class C | | | 3,078 | |
Class P | | | 377 | |
Transfer agent fees: |
Class A | | | 2,194 | |
Class C | | | 1,945 | |
Class P | | | 1,291 | |
Institutional Class | | | 20,285 | |
Registration fees | | | 60,285 | |
Professional fees | | | 36,935 | |
Trustees’ fees* | | | 13,500 | |
Fund accounting and administration fees | | | 10,712 | |
Custodian fees | | | 1,325 | |
Line of credit fees | | | 112 | |
Miscellaneous | | | 10,503 | |
Recoupment of previously waived fees: |
Class A | | | 4 | |
Class C | | | 24 | |
Class P | | | 10 | |
Institutional Class | | | 273 | |
Total expenses | | | 196,793 | |
Less: |
Expenses reimbursed by Adviser: |
Class A | | | (9,968 | ) |
Class C | | | (8,714 | ) |
Class P | | | (4,617 | ) |
Institutional Class | | | (100,561 | ) |
Expenses waived by Adviser | | | (28,025 | ) |
Total waived/reimbursed expenses | | | (151,885 | ) |
Net expenses | | | 44,908 | |
Net investment income | | | 40,590 | |
| | | | | |
Net Realized and Unrealized Gain (Loss): |
Net realized gain (loss) on: |
Investments | | | 329,763 | |
Net realized gain | | | 329,763 | |
Net change in unrealized appreciation (depreciation) on: |
Investments | | | 672,851 | |
Net change in unrealized appreciation (depreciation) | | | 672,851 | |
Net realized and unrealized gain | | | 1,002,614 | |
Net increase in net assets resulting from operations | | $ | 1,043,204 | |
* | Relates to Trustees not deemed “interested persons” within the meaning of Section 2(a)(19) of the 1940 Act. |
26 | THE GUGGENHEIM FUNDS ANNUAL FINANCIAL REPORT | SEE NOTES TO FINANCIAL STATEMENTS. |
RBP® LARGE-CAP VALUE FUND | |
STATEMENTS OF CHANGES IN NET ASSETS |
| | Year Ended
September 30,
2024 | | | Year Ended
September 30,
2023 | |
Increase (Decrease) in Net Assets from Operations: | | | | | | | | |
Net investment income | | $ | 40,590 | | | $ | 52,140 | |
Net realized gain on investments | | | 329,763 | | | | 13,290 | |
Net change in unrealized appreciation (depreciation) on investments | | | 672,851 | | | | 345,026 | |
Net increase in net assets resulting from operations | | | 1,043,204 | | | | 410,456 | |
| | | | | | | | | |
Distributions to shareholders: | | | | | | | | |
Class A | | | (5,657 | ) | | | (14,416 | ) |
Class C | | | (1,550 | ) | | | (10,493 | ) |
Class P | | | (3,243 | ) | | | (8,672 | ) |
Institutional Class | | | (47,128 | ) | | | (116,795 | ) |
Total distributions to shareholders | | | (57,578 | ) | | | (150,376 | ) |
| | | | | | | | | |
Capital share transactions: | | | | | | | | |
Proceeds from sale of shares | | | | | | | | |
Class A | | | 42,178 | | | | 33,676 | |
Class C | | | 2 | | | | 273 | |
Class P | | | 1,347 | | | | 50,642 | |
Institutional Class | | | 127,078 | | | | 300 | |
Distributions reinvested | | | | | | | | |
Class A | | | 5,657 | | | | 14,416 | |
Class C | | | 1,550 | | | | 10,493 | |
Class P | | | 3,089 | | | | 8,513 | |
Institutional Class | | | 47,128 | | | | 116,795 | |
Cost of shares redeemed | | | | | | | | |
Class A | | | (49,679 | ) | | | (203,406 | ) |
Class C | | | (41,578 | ) | | | (62,017 | ) |
Class P | | | (24,170 | ) | | | (161,937 | ) |
Institutional Class | | | (9,782 | ) | | | (2,179 | ) |
Net increase (decrease) from capital share transactions | | | 102,820 | | | | (194,431 | ) |
Net increase in net assets | | | 1,088,446 | | | | 65,649 | |
| | | | | | | | | |
Net assets: | | | | | | | | |
Beginning of year | | | 3,921,176 | | | | 3,855,527 | |
End of year | | $ | 5,009,622 | | | $ | 3,921,176 | |
| | | | | | | | | |
Capital share activity: | | | | | | | | |
Shares sold | | | | | | | | |
Class A | | | 3,740 | | | | 3,341 | |
Class C | | | — | | | | 28 | |
Class P | | | 128 | | | | 5,061 | |
Institutional Class | | | 10,933 | | | | 29 | |
Shares issued from reinvestment of distributions | | | | | | | | |
Class A | | | 550 | | | | 1,400 | |
Class C | | | 152 | | | | 1,033 | |
Class P | | | 306 | | | | 839 | |
Institutional Class | | | 4,433 | | | | 11,029 | |
Shares redeemed | | | | | | | | |
Class A | | | (4,545 | ) | | | (20,108 | ) |
Class C | | | (3,885 | ) | | | (6,327 | ) |
Class P | | | (2,276 | ) | | | (16,458 | ) |
Institutional Class | | | (866 | ) | | | (217 | ) |
Net increase (decrease) in shares | | | 8,670 | | | | (20,350 | ) |
SEE NOTES TO FINANCIAL STATEMENTS. | THE GUGGENHEIM FUNDS ANNUAL FINANCIAL REPORT | 27 |
RBP® LARGE-CAP VALUE FUND | |
This table is presented to show selected data for a share outstanding throughout each period and to assist shareholders in evaluating a Fund’s performance for the periods presented.
Class A | | Year Ended
September 30,
2024 | | | Year Ended
September 30,
2023 | | | Year Ended
September 30,
2022 | | | Year Ended
September 30,
2021 | | | Year Ended
September 30,
2020 | |
Per Share Data |
Net asset value, beginning of period | | $ | 9.67 | | | $ | 9.05 | | | $ | 11.69 | | | $ | 9.30 | | | $ | 10.28 | |
Income (loss) from investment operations: |
Net investment income (loss)a | | | .08 | | | | .11 | | | | .11 | | | | .08 | | | | .15 | |
Net gain (loss) on investments (realized and unrealized) | | | 2.45 | | | | .83 | | | | (1.11 | ) | | | 2.69 | | | | (.96 | ) |
Total from investment operations | | | 2.53 | | | | .94 | | | | (1.00 | ) | | | 2.77 | | | | (.81 | ) |
Less distributions from: |
Net investment income | | | (.15 | ) | | | (.08 | ) | | | — | | | | (.38 | ) | | | (.11 | ) |
Net realized gains | | | (.02 | ) | | | (.24 | ) | | | (1.64 | ) | | | — | | | | (.06 | ) |
Total distributions | | | (.17 | ) | | | (.32 | ) | | | (1.64 | ) | | | (.38 | ) | | | (.17 | ) |
Net asset value, end of period | | $ | 12.03 | | | $ | 9.67 | | | $ | 9.05 | | | $ | 11.69 | | | $ | 9.30 | |
|
Total Returnb | | | 26.49 | % | | | 10.24 | % | | | (11.02 | %) | | | 30.34 | % | | | (8.05 | %) |
Ratios/Supplemental Data |
Net assets, end of period (in thousands) | | $ | 392 | | | $ | 317 | | | $ | 436 | | | $ | 182 | | | $ | 53 | |
Ratios to average net assets: |
Net investment income (loss) | | | 0.78 | % | | | 1.11 | % | | | 1.06 | % | | | 0.74 | % | | | 1.53 | % |
Total expensesc | | | 4.74 | % | | | 4.76 | % | | | 5.09 | % | | | 5.90 | % | | | 7.41 | % |
Net expensesd,e,f | | | 1.18 | % | | | 1.18 | % | | | 1.20 | % | | | 1.20 | % | | | 1.21 | % |
Portfolio turnover rate | | | 73 | % | | | 68 | % | | | 73 | % | | | 132 | % | | | 95 | % |
Class C | | Year Ended
September 30,
2024 | | | Year Ended
September 30,
2023 | | | Year Ended
September 30,
2022 | | | Year Ended
September 30,
2021 | | | Year Ended
September 30,
2020 | |
Per Share Data |
Net asset value, beginning of period | | $ | 9.48 | | | $ | 8.94 | | | $ | 11.79 | | | $ | 9.12 | | | $ | 10.14 | |
Income (loss) from investment operations: |
Net investment income (loss)a | | | — | h | | | .03 | | | | .02 | | | | — | h | | | .07 | |
Net gain (loss) on investments (realized and unrealized) | | | 2.41 | | | | .83 | | | | (1.08 | ) | | | 2.68 | | | | (.94 | ) |
Total from investment operations | | | 2.41 | | | | .86 | | | | (1.06 | ) | | | 2.68 | | | | (.87 | ) |
Less distributions from: |
Net investment income | | | (.03 | ) | | | (.08 | ) | | | (.15 | ) | | | (.01 | ) | | | (.09 | ) |
Net realized gains | | | (.02 | ) | | | (.24 | ) | | | (1.64 | ) | | | — | | | | (.06 | ) |
Total distributions | | | (.05 | ) | | | (.32 | ) | | | (1.79 | ) | | | (.01 | ) | | | (.15 | ) |
Net asset value, end of period | | $ | 11.84 | | | $ | 9.48 | | | $ | 8.94 | | | $ | 11.79 | | | $ | 9.12 | |
|
Total Returnb | | | 25.52 | % | | | 9.35 | % | | | (11.65 | %) | | | 29.41 | % | | | (8.80 | %) |
Ratios/Supplemental Data |
Net assets, end of period (in thousands) | | $ | 321 | | | $ | 292 | | | $ | 322 | | | $ | 580 | | | $ | 447 | |
Ratios to average net assets: |
Net investment income (loss) | | | 0.02 | % | | | 0.34 | % | | | 0.21 | % | | | 0.04 | % | | | 0.79 | % |
Total expensesc | | | 5.40 | % | | | 5.50 | % | | | 5.71 | % | | | 6.52 | % | | | 7.99 | % |
Net expensesd,e,f | | | 1.93 | % | | | 1.93 | % | | | 1.95 | % | | | 1.95 | % | | | 1.96 | % |
Portfolio turnover rate | | | 73 | % | | | 68 | % | | | 73 | % | | | 132 | % | | | 95 | % |
28 | THE GUGGENHEIM FUNDS ANNUAL FINANCIAL REPORT | SEE NOTES TO FINANCIAL STATEMENTS. |
RBP® LARGE-CAP VALUE FUND | |
FINANCIAL HIGHLIGHTS (continued) |
This table is presented to show selected data for a share outstanding throughout each period and to assist shareholders in evaluating a Fund’s performance for the periods presented.
Class P | | Year Ended
September 30,
2024 | | | Year Ended
September 30,
2023 | | | Year Ended
September 30,
2022 | | | Year Ended
September 30,
2021 | | | Year Ended
September 30,
2020 | |
Per Share Data |
Net asset value, beginning of period | | $ | 9.54 | | | $ | 8.92 | | | $ | 11.59 | | | $ | 9.28 | | | $ | 10.33 | |
Income (loss) from investment operations: |
Net investment income (loss)a | | | .08 | | | | .11 | | | | .11 | | | | .08 | | | | .15 | |
Net gain (loss) on investments (realized and unrealized) | | | 2.40 | | | | .83 | | | | (1.09 | ) | | | 2.67 | | | | (.96 | ) |
Total from investment operations | | | 2.48 | | | | .94 | | | | (.98 | ) | | | 2.75 | | | | (.81 | ) |
Less distributions from: |
Net investment income | | | (.19 | ) | | | (.08 | ) | | | (.05 | ) | | | (.44 | ) | | | (.18 | ) |
Net realized gains | | | (.02 | ) | | | (.24 | ) | | | (1.64 | ) | | | — | | | | (.06 | ) |
Total distributions | | | (.21 | ) | | | (.32 | ) | | | (1.69 | ) | | | (.44 | ) | | | (.24 | ) |
Net asset value, end of period | | $ | 11.81 | | | $ | 9.54 | | | $ | 8.92 | | | $ | 11.59 | | | $ | 9.28 | |
|
Total Return | | | 26.43 | % | | | 10.28 | % | | | (10.94 | %) | | | 30.31 | % | | | (8.10 | %) |
Ratios/Supplemental Data |
Net assets, end of period (in thousands) | | $ | 157 | | | $ | 144 | | | $ | 229 | | | $ | 308 | | | $ | 114 | |
Ratios to average net assets: |
Net investment income (loss) | | | 0.78 | % | | | 1.12 | % | | | 1.01 | % | | | 0.75 | % | | | 1.49 | % |
Total expensesc | | | 4.87 | % | | | 4.94 | % | | | 5.11 | % | | | 5.74 | % | | | 7.18 | % |
Net expensesd,e,f | | | 1.18 | % | | | 1.18 | % | | | 1.20 | % | | | 1.20 | % | | | 1.21 | % |
Portfolio turnover rate | | | 73 | % | | | 68 | % | | | 73 | % | | | 132 | % | | | 95 | % |
SEE NOTES TO FINANCIAL STATEMENTS. | THE GUGGENHEIM FUNDS ANNUAL FINANCIAL REPORT | 29 |
RBP® LARGE-CAP VALUE FUND | |
FINANCIAL HIGHLIGHTS (concluded) |
This table is presented to show selected data for a share outstanding throughout each period and to assist shareholders in evaluating a Fund’s performance for the periods presented.
Institutional Class | | Year Ended
September 30,
2024 | | | Year Ended
September 30,
2023 | | | Year Ended
September 30,
2022 | | | Year Ended
September 30,
2021 | | | Year Ended
September 30,
2020 | |
Per Share Data |
Net asset value, beginning of period | | $ | 9.97 | | | $ | 9.35 | | | $ | 12.10 | | | $ | 9.40 | | | $ | 10.42 | |
Income (loss) from investment operations: |
Net investment income (loss)a | | | .11 | | | | .14 | | | | .14 | | | | .12 | | | | .17 | |
Net gain (loss) on investments (realized and unrealized) | | | 2.54 | | | | .87 | | | | (1.15 | ) | | | 2.74 | | | | (.97 | ) |
Total from investment operations | | | 2.65 | | | | 1.01 | | | | (1.01 | ) | | | 2.86 | | | | (.80 | ) |
Less distributions from: |
Net investment income | | | (.13 | ) | | | (.15 | ) | | | (.10 | ) | | | (.16 | ) | | | (.16 | ) |
Net realized gains | | | (.02 | ) | | | (.24 | ) | | | (1.64 | ) | | | — | | | | (.06 | ) |
Total distributions | | | (.15 | ) | | | (.39 | ) | | | (1.74 | ) | | | (.16 | ) | | | (.22 | ) |
Net asset value, end of period | | $ | 12.47 | | | $ | 9.97 | | | $ | 9.35 | | | $ | 12.10 | | | $ | 9.40 | |
|
Total Return | | | 26.82 | % | | | 10.47 | % | | | (10.73 | %) | | | 30.72 | % | | | (7.92 | %) |
Ratios/Supplemental Data |
Net assets, end of period (in thousands) | | $ | 4,141 | | | $ | 3,167 | | | $ | 2,868 | | | $ | 3,207 | | | $ | 2,437 | |
Ratios to average net assets: |
Net investment income (loss) | | | 1.02 | % | | | 1.34 | % | | | 1.24 | % | | | 1.04 | % | | | 1.78 | % |
Total expensesc | | | 4.36 | % | | | 4.41 | % | | | 4.69 | % | | | 5.49 | % | | | 6.86 | % |
Net expensesd,e,f | | | 0.92 | % | | | 0.92 | % | | | 0.95 | % | | | 0.95 | % | | | 0.96 | % |
Portfolio turnover rate | | | 73 | % | | | 68 | % | | | 73 | % | | | 132 | % | | | 95 | % |
a | Net investment income (loss) per share was computed using average shares outstanding throughout the period. |
b | Total return does not reflect the impact of any applicable sales charges. |
c | Does not include expenses of the underlying funds in which the Fund invests. |
d | Net expense information reflects the expense ratios after expense waivers and reimbursements, as applicable. |
e | The portion of the ratios of net expenses to average net assets attributable to recoupments of prior fee reductions or expense reimbursements for the years presented was as follows: |
| | | 09/30/24 | 09/30/23 | 09/30/22 | 09/30/21 | 09/30/20 |
| | Class A | 0.00%g | 0.00%g | — | — | — |
| | Class C | 0.01% | — | — | — | 0.01% |
| | Class P | 0.01% | — | — | — | 0.00%g |
| | Institutional Class | 0.01% | — | — | — | 0.01% |
f | Net expenses may include expenses that are excluded from the expense limitation agreement. Excluding these expenses, the net expense ratios for the years presented would be: |
| | | 09/30/24 | 09/30/23 | 09/30/22 | 09/30/21 | 09/30/20 |
| | Class A | 1.17% | 1.17% | 1.19% | 1.20% | 1.21% |
| | Class C | 1.92% | 1.92% | 1.94% | 1.95% | 1.96% |
| | Class P | 1.17% | 1.18% | 1.19% | 1.20% | 1.21% |
| | Institutional Class | 0.92% | 0.92% | 0.94% | 0.95% | 0.96% |
h | Less than $0.01 per share. |
30 | THE GUGGENHEIM FUNDS ANNUAL FINANCIAL REPORT | SEE NOTES TO FINANCIAL STATEMENTS. |
NOTES TO FINANCIAL STATEMENTS |
Note 1 – Organization and Significant Accounting Policies
Organization
Transparent Value Trust (the “Trust”), a Delaware statutory trust, is registered with the U.S. Securities and Exchange Commission (the “SEC”) under the Investment Company Act of 1940 (“1940 Act”), as an open-ended investment company of the series type. Each series, in effect, is representing a separate fund (each, a “Fund”). The Trust may issue an unlimited number of authorized shares. The Trust accounts for the assets of each Fund separately.
The Trust offers a combination of four separate classes of shares: Class A shares, Class C shares, Class P shares and Institutional Class shares. Sales of shares of each Class are made without a front-end sales charge at the net asset value per share (“NAV”), with the exception of Class A shares. Class A shares are sold at the NAV, plus the applicable front-end sales charge. The sales charge varies depending on the amount purchased, but will not exceed 4.75%. Class A share purchases of $1 million or more are exempt from the front-end sales charge but have a 1.25% contingent deferred sales charge (“CDSC”), if shares are redeemed within 18 months of purchase. Class C shares have a 1% CDSC if shares are redeemed within 12 months of purchase. Class C shares of each Fund automatically convert to Class A shares of the same Fund on or about the 10th day of the month following the 8-year anniversary of the purchase of the Class C shares. This conversion will be executed without any sales charge, fee or other charge. After the conversion is completed, the shares will be subject to all features and expenses of Class A shares. Institutional Class shares are offered primarily for direct investment by institutions such as pension and profit sharing plans, endowments, foundations and corporations. Institutional Class shares require a minimum initial investment of $2 million and a minimum account balance of $1 million. At September 30, 2024, the Trust consisted of four funds.
This report covers the following funds (collectively, the “Funds”):
Fund Name | Investment
Company Type |
Directional Allocation Fund | Diversified |
RBP® Dividend Fund | Diversified |
RBP® Large-Cap Defensive Fund | Diversified |
RBP® Large-Cap Value Fund | Diversified |
The Funds’ investment objectives are to provide investment results that, before fees and expenses, correspond generally to the total return performance of the Index as follows:
Fund | Index |
Directional Allocation Fund | Guggenheim Directional Allocation IndexSM |
RBP® Dividend Fund | Guggenheim RBP® Dividend IndexSM |
RBP® Large-Cap Defensive Fund | Guggenheim RBP® Large-Cap Defensive IndexSM |
RBP® Large-Cap Value Fund | Guggenheim RBP® Large-Cap Value IndexSM |
Guggenheim Partners Investment Management, LLC (“GPIM” or the “Adviser”), which operates under the name Guggenheim Investments (“GI”), provides advisory services. Guggenheim Funds Distributors, LLC (“GFD”) serves as distributor of the Funds’ shares. GPIM and GFD are affiliated entities.
Significant Accounting Policies
The Funds operate as investment companies and, accordingly, follow the investment company accounting and reporting guidance of the Financial Accounting Standards Board (“FASB”) Accounting Standards Codification Topic 946 Financial Services – Investment Companies.
The following significant accounting policies are in conformity with U.S. generally accepted accounting principles (“U.S. GAAP”) and are consistently followed by the Trust. This requires management to make estimates and assumptions that affect the reported amount of assets and liabilities, contingent assets and liabilities at the date of the financial statements, and the reported amounts of revenues and expenses during the reporting period. Actual results could differ from these estimates. All time references are based on Eastern Time.
The NAV of each share class of a Fund is calculated by dividing the market value of a fund’s securities and other assets, less all liabilities attributable to the share class by the number of outstanding shares of the share class.
(a) Valuation of Investments
The Board of Trustees of the Funds (the “Board”) adopted policies and procedures for the valuation of the Funds’ investments (the “Fund Valuation Procedures”).
Pursuant to Rule 2a-5, the Board designated the Adviser as the valuation designee to perform fair valuation determinations for the Funds with respect to all Fund investments and other assets. As the Funds’ valuation designee pursuant to Rule 2a-5, the Adviser has adopted separate procedures (the “Valuation Designee Procedures” and collectively with the Fund Valuation
| | THE GUGGENHEIM FUNDS ANNUAL FINANCIAL REPORT | 31 |
NOTES TO FINANCIAL STATEMENTS (continued) |
Procedures, the “Valuation Procedures”) reasonably designed to prevent violations of the requirements of Rule 2a-5 and Rule 31a-4 under the 1940 Act. The Adviser, in its role as valuation designee, utilizes the assistance of a valuation committee, consisting of representatives from Guggenheim’s investment management, fund administration, legal and compliance departments (the “Valuation Committee”), in determining the fair value of the Funds’ securities and/or other assets. The Valuation Procedures may be amended and potentially adversely affected as the Funds seek to comply with regulations that apply to the valuation practices of registered investment companies.
Valuations of the Funds’ securities and other assets are supplied primarily by independent third-party pricing services appointed pursuant to the processes set forth in the Valuation Procedures. The Adviser, with the assistance of the Valuation Committee, convenes monthly, or more frequently as needed, to review the valuation of all assets which have been fair valued. The Adviser, consistent with the monitoring and review responsibilities set forth in the Valuation Procedures, regularly reviews the appropriateness of the inputs, methods, models and assumptions employed by the independent third-party pricing services.
If an independent third-party pricing service cannot or does not provide a valuation for a particular investment or such valuation is deemed unreliable, such investment is fair valued by the Adviser.
Equity securities listed or traded on a recognized U.S. securities exchange or the Nasdaq Stock Market (“NASDAQ”) will generally be valued on the basis of the last sale price on the primary U.S. exchange or market on which the security is listed or traded; provided, however, that securities listed on NASDAQ will be valued at the NASDAQ official closing price, which may not necessarily represent the last sale price.
Open-end investment companies are valued at their NAV as of the close of business, on the valuation date. Exchange-traded funds and closed-end investment companies are generally valued at the last quoted sale price.
Investments for which market quotations are not readily available are fair valued as determined in good faith by the Adviser. Valuations in accordance with these methods are intended to reflect each security’s (or asset’s or liability’s) “fair value”. Each such determination is based on a consideration of all relevant factors, which are likely to vary from one pricing context to another. Examples of such factors may include, but are not limited to market prices; sale prices; broker quotes; and models which derive prices based on inputs such as anticipated cash flows or collateral, spread over U.S. Treasury securities, and other information analysis.
(b) Foreign Taxes
The Funds may be subject to foreign taxes (a portion of which may be reclaimable) on income, stock dividends, capital gains on investments or certain foreign currency transactions. All foreign taxes are recorded in accordance with the applicable foreign tax regulations and rates that exist in the foreign jurisdictions in which the Funds invest. These foreign taxes, if any, are paid by the Funds and reflected in their Statements of Operations as follows: foreign taxes withheld at source are presented as a reduction of income and foreign taxes on capital gains from sales of investments are included with the net realized gain (loss) on investments. Foreign taxes payable or deferred as of September 30, 2024, if any, are disclosed in the Funds’ Statements of Assets and Liabilities.
(c) Security Transactions
Security transactions are recorded on the trade date for financial reporting purposes. Realized gains and losses from securities transactions are recorded using the identified cost basis. Proceeds from lawsuits related to investment holdings are recorded as a reduction to cost if the securities are still held and as realized gains if no longer held in the respective Fund. Dividend income is recorded on the ex-dividend date, net of applicable taxes withheld by foreign countries, if any. Taxable non-cash dividends are recorded as dividend income. Interest income, including amortization of premiums and accretion of discounts, is accrued on a daily basis. Dividend income from Real Estate Investment Trusts (“REITs”) is recorded based on the income included in the distributions received from the REIT investments using published REIT classifications, including some management estimates when actual amounts are not available. Distributions received in excess of this estimated amount are recorded as a reduction of the cost of investments or reclassified to realized gains. The actual amounts of income, return of capital, and realized gains are only determined by each REIT after its fiscal year-end, and may differ from the estimated amounts.
(d) Distributions
Distributions of net investment income and net realized gains, if any, are declared and paid at least annually. Dividends are reinvested in additional shares, unless shareholders request payment in cash. Distributions are recorded on the ex-dividend date and are determined in accordance with U.S. federal income tax regulations which may differ from U.S. GAAP.
(e) Class Allocations
Interest and dividend income, most expenses, all realized gains and losses, and all unrealized appreciation and depreciation are allocated to the share classes based upon the value of the outstanding shares in each share class. Certain costs, such as distribution and service fees are charged directly to specific share
32 | THE GUGGENHEIM FUNDS ANNUAL FINANCIAL REPORT | |
NOTES TO FINANCIAL STATEMENTS (continued) |
classes. In addition, certain expenses have been allocated to the individual Funds in the Trust based on the respective net assets of each Fund included in the Trust.
(f) Earnings Credits
Under the fee arrangement with the custodian, the Fund may earn credits based on overnight custody cash balances. These credits are utilized to reduce related custodial expenses. The custodian fees disclosed in the Funds’ Statements of Operations are before the reduction in expense from the related earnings credits, if any. Earnings credits for the year ended September 30, 2024 are disclosed in the Funds’ Statements of Operations.
(g) Cash
The Funds may leave cash overnight in their cash account with the custodian. Periodically, a Fund may have cash due to the custodian bank as an overdraft balance. A fee is incurred on this overdraft, calculated by multiplying the overdraft by a rate based on the federal funds rate, which was 4.83% at September 30, 2024.
(h) Indemnifications
Under the Funds’ organizational documents, the Trustees and Officers are indemnified against certain liabilities arising out of the performance of their duties to the Trust. In addition, throughout the normal course of business, the Funds enter into contracts that contain a variety of representations and warranties which provide general indemnifications. The Funds’ maximum exposure under these arrangements is unknown, as this would involve future claims that may be made against the Funds and/or their affiliates that have not yet occurred. However, based on experience, the Funds expect the risk of loss to be remote.
Note 2 – Investment Advisory Agreement and Other Agreements
Under the terms of an investment advisory contract, the Funds pay GI investment advisory fees on a monthly basis calculated daily at the annualized rates below, based on the average daily net assets of the Funds:
Fund | Management Fees
(as a % of Net Assets) |
Directional Allocation Fund | 0.95% |
RBP® Dividend Fund | 0.75% |
RBP® Large-Cap Defensive Fund | 0.75% |
RBP® Large-Cap Value Fund | 0.75% |
GI pays operating expenses on behalf of the Trust, such as audit and accounting related services, legal services, custody, printing and mailing, among others, on a pass-through basis. Such expenses are allocated to various Funds within the complex based on relative net assets.
The Board has adopted Distribution Plans related to the offering of Class A, Class C and Class P shares pursuant to Rule 12b-1 under the 1940 Act. The plans provide for payments at an annual rate of 0.25% of the average daily net assets of each Fund’s Class A and Class P shares, and 1.00% of the average daily net assets of each Fund’s Class C shares.
| | THE GUGGENHEIM FUNDS ANNUAL FINANCIAL REPORT | 33 |
NOTES TO FINANCIAL STATEMENTS (continued) |
Contractual expense limitation agreements for the following Funds provide that the total expenses be limited to a percentage of average net assets for each class of shares, exclusive of brokerage costs, dividends or interest on securities sold short, expenses of other investment companies in which a Fund invests, interest, taxes, litigation, indemnification and extraordinary expenses. The limits are listed below:
Fund | | Limit | | | Effective
Date | | | Contract
End Date | |
Directional Allocation Fund – Class A* | | | 1.50 | % | | | 05/09/16 | | | | 02/01/25 | |
Directional Allocation Fund – Class C* | | | 2.10 | % | | | 05/09/16 | | | | 02/01/25 | |
Directional Allocation Fund – Class P* | | | 1.35 | % | | | 05/09/16 | | | | 02/01/25 | |
Directional Allocation Fund – Institutional Class* | | | 1.10 | % | | | 05/09/16 | | | | 02/01/25 | |
RBP® Dividend Fund – Class A* | | | 1.20 | % | | | 05/09/16 | | | | 02/01/25 | |
RBP® Dividend Fund – Class C* | | | 1.95 | % | | | 05/09/16 | | | | 02/01/25 | |
RBP® Dividend Fund – Class P* | | | 1.20 | % | | | 05/09/16 | | | | 02/01/25 | |
RBP® Dividend Fund – Institutional Class* | | | 0.95 | % | | | 05/09/16 | | | | 02/01/25 | |
RBP® Large-Cap Defensive Fund – Class A* | | | 1.20 | % | | | 05/09/16 | | | | 02/01/25 | |
RBP® Large-Cap Defensive Fund – Class C * | | | 1.95 | % | | | 05/09/16 | | | | 02/01/25 | |
RBP® Large-Cap Defensive Fund – Class P* | | | 1.20 | % | | | 05/09/16 | | | | 02/01/25 | |
RBP® Large-Cap Defensive Fund – Institutional Class* | | | 0.95 | % | | | 05/09/16 | | | | 02/01/25 | |
RBP® Large-Cap Value Fund – Class A* | | | 1.20 | % | | | 05/09/16 | | | | 02/01/25 | |
RBP® Large-Cap Value Fund – Class C* | | | 1.95 | % | | | 05/09/16 | | | | 02/01/25 | |
RBP® Large-Cap Value Fund – Class P* | | | 1.20 | % | | | 05/09/16 | | | | 02/01/25 | |
RBP® Large-Cap Value Fund – Institutional Class* | | | 0.95 | % | | | 05/09/16 | | | | 02/01/25 | |
* | Subsequent to September 30, 2024, the Fund was reorganized into a series of New Age Alpha Funds Trust at which time the existing investment advisory contract and contractual expense limitation agreement were terminated. Please see Note 8 - Subsequent Events for additional information. |
GPIM is entitled to reimbursement by the Fund for fees waived or expenses reimbursed during any of the previous 36 months, beginning on the date of the expense limitation agreement, if on any day the estimated operating expenses are less than the indicated percentages. For purposes of this arrangement, GPIM is entitled to recoupment of previously waived fees or reimbursed expenses for 36 months from the date of the waiver or reimbursement by GPIM. At September 30, 2024, the amount of fees waived or expenses reimbursed that are subject to recoupment and will expire during the years ended September 30, are presented in the following table:
Fund | | 2025 | | | 2026 | | | 2027 | | | Fund
Total | |
Directional Allocation Fund | | | | | | | | | | | | | | | | |
Class A | | $ | 58,252 | | | $ | 68,787 | | | $ | 98,311 | | | $ | 225,350 | |
Class C | | | 43,415 | | | | 12,966 | | | | 16,925 | | | | 73,306 | |
Class P | | | 6,545 | | | | 4,852 | | | | 5,032 | | | | 16,429 | |
Institutional Class | | | 123,748 | | | | 68,857 | | | | 62,106 | | | | 254,711 | |
RBP® Dividend Fund | | | | | | | | | | | | | | | | |
Class A | | | 83,754 | | | | 82,212 | | | | 82,152 | | | | 248,118 | |
Class C | | | 10,456 | | | | 7,299 | | | | 7,566 | | | | 25,321 | |
Class P | | | 9,488 | | | | 7,307 | | | | 6,483 | | | | 23,278 | |
Institutional Class | | | 65,409 | | | | 60,158 | | | | 65,719 | | | | 191,286 | |
RBP® Large-Cap Defensive Fund | | | | | | | | | | | | | | | | |
Class A | | | 71,145 | | | | 49,476 | | | | 58,944 | | | | 179,565 | |
Class C | | | 23,681 | | | | 9,054 | | | | 8,453 | | | | 41,188 | |
Class P | | | 5,721 | | | | 5,016 | | | | 5,042 | | | | 15,779 | |
Institutional Class | | | 68,426 | | | | 75,382 | | | | 91,487 | | | | 235,295 | |
RBP® Large-Cap Value Fund | | | | | | | | | | | | | | | | |
Class A | | | 15,763 | | | | 15,417 | | | | 12,520 | | | | 43,700 | |
Class C | | | 17,685 | | | | 11,905 | | | | 11,023 | | | | 40,613 | |
Class P | | | 9,701 | | | | 8,524 | | | | 5,749 | | | | 23,974 | |
Institutional Class | | | 123,927 | | | | 116,589 | | | | 127,491 | | | | 368,007 | |
34 | THE GUGGENHEIM FUNDS ANNUAL FINANCIAL REPORT | |
NOTES TO FINANCIAL STATEMENTS (continued) |
During the year ended September 30, 2024, GI recouped amounts from the Funds as follows:
Directional Allocation Fund | | $ | 760 | |
RBP® Dividend Fund | | | 133 | |
RBP® Large-Cap Defensive Fund | | | 61 | |
RBP® Large-Cap Value Fund | | | 311 | |
For the year ended September 30, 2024, GFD retained sales charges of $2,949 relating to sales of Class A shares of the Trust.
Certain trustees and officers of the Trust are also officers of GI and/or GFD. The Trust does not compensate its officers or trustees who are officers, directors and/or employees of GI or GFD.
MUFG Investor Services (US), LLC (“MUIS”) acts as the Funds’ administrator, transfer agent and accounting agent. As administrator, transfer agent and accounting agent, MUIS maintains the books and records of the Funds’ securities and cash. The Bank of New York Mellon Corp. (“BNY”) acts as the Funds’ custodian. As custodian, BNY is responsible for the custody of the Funds’ assets. For providing the aforementioned administrative and accounting services, MUIS is entitled to receive a monthly fee equal to a percentage of the Funds’ average daily net assets and out of pocket expenses. For providing the aforementioned transfer agent and custodian services, MUIS and BNY are entitled to receive a monthly fee based on the number of transactions during the month and the number of accounts under management, subject to certain minimum monthly fees, and out of pocket expenses.
Note 3 – Federal Income Tax Information
The Funds intend to comply with the provisions of Subchapter M of the Internal Revenue Code of 1986, as amended (the “Internal Revenue Code”), applicable to regulated investment companies and will distribute substantially all taxable net investment income and capital gains sufficient to relieve the Funds from all, or substantially all, federal income, excise and state income taxes. Therefore, no provision for federal or state income tax or federal excise tax is required.
Tax positions taken or expected to be taken in the course of preparing the Funds’ tax returns are evaluated to determine whether the tax positions are “more-likely-than-not” of being sustained by the applicable tax authority. Tax positions not deemed to meet the “more-likely-than-not” threshold would be recorded as a tax benefit or expense in the current year. Management has analyzed the Funds’ tax positions taken, or to be taken, on U.S. federal income tax returns for all open tax years, and has concluded that no provision for income tax is required in the Funds’ financial statements. The Funds’ U.S. federal income tax returns are subject to examination by the Internal Revenue Service (“IRS”) for a period of three years after they are filed.
If a Fund makes a distribution to its shareholders in excess of its current and accumulated “earnings and profits” in any taxable year, the excess distribution will be treated as a return of capital to the extent of each shareholder’s basis (for tax purposes) in its shares, and any distribution in excess of basis will be treated as capital gain. A return of capital is not taxable, but it reduces the shareholder’s basis in its shares, which reduces the loss (or increases the gain) on a subsequent taxable disposition by such shareholder of the shares.
The tax character of distributions paid during the year ended September 30, 2024 was as follows:
Fund | | Ordinary
Income | | | Long-Term
Capital Gain | | | Total
Distributions | |
Directional Allocation Fund | | $ | 3,463,695 | | | $ | — | | | $ | 3,463,695 | |
RBP® Dividend Fund | | | 152,196 | | | | — | | | | 152,196 | |
RBP® Large-Cap Defensive Fund | | | 22,992 | | | | — | | | | 22,992 | |
RBP® Large-Cap Value Fund | | | 57,578 | | | | — | | | | 57,578 | |
The tax character of distributions paid during the year ended September 30, 2023 was as follows:
| | THE GUGGENHEIM FUNDS ANNUAL FINANCIAL REPORT | 35 |
NOTES TO FINANCIAL STATEMENTS (continued) |
Fund | | Ordinary
Income | | | Long-Term
Capital Gain | | | Return
of Capital | | | Total
Distributions | |
Directional Allocation Fund | | $ | 1,117,716 | | | $ | — | | | $ | — | | | $ | 1,117,716 | |
RBP® Dividend Fund | | | 196,515 | | | | — | | | | 18,703 | | | | 215,218 | |
RBP® Large-Cap Defensive Fund | | | 9,933 | | | | — | | | | — | | | | 9,933 | |
RBP® Large-Cap Value Fund | | | 52,987 | | | | 97,389 | | | | — | | | | 150,376 | |
Note: For U.S. federal income tax purposes, short-term capital gain distributions are treated as ordinary income distributions.
The tax components of distributable earnings/(loss) as of September 30, 2024 were as follows:
Fund | | Undistributed
Ordinary
Income | | | Undistributed
Long-Term
Capital Gain | | | Net Unrealized
Appreciation
(Depreciation) | | | Accumulated
Capital and
Other Losses | | | Other
Temporary
Differences | | | Total | |
Directional Allocation Fund | | $ | 17,131,610 | | | $ | 3,805,681 | | | $ | 29,661,102 | | | $ | — | | | $ | — | | | $ | 50,598,393 | |
RBP® Dividend Fund | | | 362,491 | | | | 449,596 | | | | 3,606,552 | | | | — | | | | (31,019 | ) | | | 4,387,620 | |
RBP® Large-Cap Defensive Fund | | | 18,796 | | | | 464,961 | | | | 1,569,827 | | | | — | | | | — | | | | 2,053,584 | |
RBP® Large-Cap Value Fund | | | 92,803 | | | | 262,396 | | | | 672,221 | | | | — | | | | — | | | | 1,027,420 | |
For U.S. federal income tax purposes, capital loss carryforwards represent realized losses of the Funds that may be carried forward and applied against future capital gains. The Funds are permitted to carry forward capital losses for an unlimited period and such capital loss carryforwards retain their character as either short-term or long-term capital losses. As of September 30, 2024, the Funds had no capital loss carryforwards.
For the year ended September 30, 2024, the following capital loss carryforward amounts were utilized:
Fund | | Utilized | |
Directional Allocation Fund | | $ | 1,526,340 | |
RBP® Dividend Fund | | | 346,823 | |
RBP® Large-Cap Defensive Fund | | | 393,741 | |
Net investment income and net realized gains (losses) may differ for financial statement and tax purposes because of temporary or permanent book/tax differences. These differences are primarily due to losses deferred due to wash sales, distributions in connection with redemption of fund shares, and reclassification of distributions. Additional differences may result from the tax treatment of net operating losses, non-deductible expenses, and dividends payable. To the extent these differences are permanent and would require a reclassification between Paid in Capital and Total Distributable Earnings (Loss), such reclassifications are made in the period that the differences arise. These reclassifications have no effect on net assets or NAV per share.
The following adjustments were made on the Statements of Assets and Liabilities as of September 30, 2024 for permanent book/tax differences:
Fund | | Paid In Capital | | | Total
Distributable
Earnings/(Loss) | |
Directional Allocation Fund | | $ | 1,431,358 | | | $ | (1,431,358 | ) |
RBP® Dividend Fund | | | 28,561 | | | | (28,561 | ) |
RBP® Large-Cap Defensive Fund | | | 23,196 | | | | (23,196 | ) |
RBP® Large-Cap Value Fund | | | 3,703 | | | | (3,703 | ) |
36 | THE GUGGENHEIM FUNDS ANNUAL FINANCIAL REPORT | |
NOTES TO FINANCIAL STATEMENTS (continued) |
At September 30, 2024, the cost of investments for U.S. federal income tax purposes, the aggregate gross unrealized appreciation for all investments for which there was an excess of value over tax cost and the aggregate gross unrealized depreciation for all investments for which there was an excess of tax cost over value, were as follows:
Fund | | Tax
Cost | | | Tax
Unrealized
Appreciation | | | Tax
Unrealized
Depreciation | | | Net Tax
Unrealized
Appreciation/
(Depreciation) | |
Directional Allocation Fund | | $ | 174,341,686 | | | $ | 31,766,940 | | | $ | (2,105,838 | ) | | $ | 29,661,102 | |
RBP® Dividend Fund | | | 13,596,395 | | | | 3,827,522 | | | | (220,970 | ) | | | 3,606,552 | |
RBP® Large-Cap Defensive Fund | | | 5,891,765 | | | | 1,622,323 | | | | (52,496 | ) | | | 1,569,827 | |
RBP® Large-Cap Value Fund | | | 4,298,386 | | | | 759,266 | | | | (87,045 | ) | | | 672,221 | |
Note 4 – Fair Value Measurement
In accordance with U.S. GAAP, fair value is defined as the price that the Funds would receive to sell an investment or pay to transfer a liability in an orderly transaction between market participants at the measurement date. U.S. GAAP establishes a three-tier fair value hierarchy based on the types of inputs used to value assets and liabilities and requires corresponding disclosure. The hierarchy and the corresponding inputs are summarized below:
Level 1 — | unadjusted quoted prices in active markets for identical assets or liabilities. |
Level 2 — | significant other observable inputs (for example quoted prices for securities that are similar based on characteristics such as interest rates, prepayment speeds, credit risk, etc.). |
Level 3 — | significant unobservable inputs based on the best information available under the circumstances, to the extent observable inputs are not available, which may include assumptions. |
Rule 2a-5 sets forth a definition of “readily available market quotations,” which is consistent with the definition of a Level 1 input under U.S. GAAP. Rule 2a-5 provides that “a market quotation is readily available only when that quotation is a quoted price (unadjusted) in active markets for identical investments that the fund can access at the measurement date, provided that a quotation will not be readily available if it is not reliable.”
Securities for which market quotations are not readily available must be valued at fair value as determined in good faith. Accordingly, any security priced using inputs other than Level 1 inputs will be subject to fair value requirements. The types of inputs available depend on a variety of factors, such as the type of security and the characteristics of the markets in which it trades, if any. Fair valuation determinations that rely on fewer or no observable inputs require greater judgment. Accordingly, fair value determinations for Level 3 securities require the greatest amount of judgment.
The inputs or methodologies selected and applied for valuing securities or other assets are not necessarily an indication of the risk associated with investing in those securities. The suitability, appropriateness and accuracy of the techniques, methodologies and sources employed to determine fair valuation are periodically reviewed and subject to change.
Note 5 – Securities Transactions
For the year ended September 30, 2024, the cost of purchases and proceeds from sales of investment securities, excluding short-term investments, were as follows:
Fund | | Purchases | | | Sales | |
Directional Allocation Fund | | $ | 245,679,994 | | | $ | 291,117,262 | |
RBP® Dividend Fund | | | 10,941,556 | | | | 15,433,196 | |
RBP® Large-Cap Defensive Fund | | | 5,429,808 | | | | 7,492,472 | |
RBP® Large-Cap Value Fund | | | 3,246,449 | | | | 3,172,587 | |
| | THE GUGGENHEIM FUNDS ANNUAL FINANCIAL REPORT | 37 |
NOTES TO FINANCIAL STATEMENTS (continued) |
The Funds are permitted to purchase or sell securities from or to certain affiliated funds under specified conditions outlined in procedures adopted by the Board. The procedures have been designed to ensure that any purchase or sale of securities by a Fund from or to another fund or portfolio that is or could be considered an affiliate by virtue of having a common investment adviser (or affiliated investment advisers), common trustees and/or common officers complies with Rule 17a-7 of the 1940 Act. Further, as defined under these procedures, each transaction is effected at the current market price. For the year ended September 30, 2024, the Funds did not engage in purchases and sales of securities pursuant to Rule 17a-7 of the 1940 Act.
Note 6 – Line of Credit
The Trust, along with other affiliated trusts, secured a 364-day committed, $1,165,000,000 line of credit from Citibank, N.A., which was in place through September 27, 2024, at which time the line of credit was renewed as a 364-day committed, $1,115,000,000 line of credit. A Fund may draw (borrow) from the line of credit as a temporary measure for emergency purposes, to facilitate redemption requests, or for other short-term liquidity purposes consistent with the Fund’s investment objective and program. For example, it may be advantageous for the Fund to borrow money rather than sell existing portfolio positions to meet redemption requests. Fees related to borrowings, if any, vary under this arrangement between the greater of Citibank’s “base rate”, SOFR plus 1%, or the federal funds rate plus 1/2 of 1%.
The commitment fee that may be paid by the Funds is at an annualized rate of 0.15% of the average daily amount of their allocated unused commitment amount. The commitment fee amount is allocated to the individual Funds based on the respective net assets of each participating Fund and is referenced in the Funds’ Statements of Operations under “Line of credit fees”. The Funds did not have any borrowings under this agreement as of and for the year ended September 30, 2024.
Note 7 – Market Risks
The value of, or income generated by, the investments held by the Funds are subject to the possibility of rapid and unpredictable fluctuation, and loss that may result from various factors. These factors include, among others, developments affecting individual companies, or issuers or particular industries, or from broader influences, including real or perceived changes in prevailing interest rates (which may change at any time based on changes in monetary policies and various market and other economic conditions), changes in inflation rates or expectations about inflation rates, adverse investor confidence or sentiment, changing economic, political (including geopolitical), social or financial market conditions, increased instability or general uncertainty, extreme weather, natural/environmental or man made disasters, governmental actions, public health emergencies (such as the spread of infectious diseases, pandemics and epidemics), debt crises, actual or threatened wars or other armed conflicts (such as the escalated conflict in the Middle East and the ongoing Russia-Ukraine conflict and its collateral economic and other effects, including, but not limited to, sanctions and other international trade barriers) or ratings downgrades, and other similar events, each of which may be temporary or last for extended periods. Different sectors, industries and security types may react differently to such developments. Moreover, changing economic, political, geopolitical, social, financial market or other conditions in one country, geographic region or industry could adversely affect the value, yield and return of the investments held by the Funds in a different country, geographic region, economy, industry or market because of the increasingly interconnected global economies and financial markets. The duration and extent of the foregoing types of factors or conditions are highly uncertain and difficult to predict and have in the past, and may in the future, cause volatility and distress in economies and financial markets or other adverse circumstances, which may negatively affect the value of the Funds’ investments and performance of the Funds.
38 | THE GUGGENHEIM FUNDS ANNUAL FINANCIAL REPORT | |
NOTES TO FINANCIAL STATEMENTS (concluded) |
Note 8 – Subsequent Events
On October 25, 2024, the Funds identified below (the “Acquired Funds”) were reorganized into the series of New Age Alpha Funds Trust identified below (the “Acquiring Funds”) (each, a “Reorganization” and collectively, the “Reorganizations”), pursuant to Agreements and Plans of Reorganization approved by the Board and by shareholders. Upon completion of the Reorganizations, shareholders of the Acquired Funds became shareholders of the Acquiring Funds and own shares of the Acquiring Funds equal in value to the shares of the Acquired Funds immediately prior to the Reorganizations.
Acquired Fund | Acquiring Fund |
Guggenheim RBP® Large-Cap Defensive Fund | |
Guggenheim RBP® Dividend Fund | New Age Alpha Large Cap Value Fund* |
Guggenheim RBP® Large-Cap Value Fund | |
Guggenheim Directional Allocation Fund | New Age Alpha Large Cap Value Fund* |
* | Guggenheim Large Cap Value Fund, a series of Guggenheim Funds Trust, which was part of the Guggenheim Family of Funds, was concurrently reorganized into New Age Alpha Large Cap Value Fund. |
The Funds evaluated subsequent events through the date the financial statements are issued and determined there were no additional material events that would require adjustment to or disclosure in the Funds’ financial statements.
| | THE GUGGENHEIM FUNDS ANNUAL FINANCIAL REPORT | 39 |
REPORT OF INDEPENDENT REGISTERED PUBLIC ACCOUNTING FIRM |
To the Shareholders and the Board of Trustees of Transparent Value Trust
Opinion on the Financial Statements
We have audited the accompanying statements of assets and liabilities of Transparent Value Trust (the “Trust”) (comprising Guggenheim Directional Allocation Fund, Guggenheim RBP® Dividend Fund, Guggenheim RBP® Large-Cap Defensive Fund and Guggenheim RBP® Large-Cap Value Fund (collectively referred to as the “Funds”)), including the schedules of investments, as of September 30, 2024, and the related statements of operations for the year then ended, the statements of changes in net assets for each of the two years in the period then ended, the financial highlights for each of the five years in the period then ended and the related notes (collectively referred to as the “financial statements”). In our opinion, the financial statements present fairly, in all material respects, the financial position of each of the Funds comprising Transparent Value Trust at September 30, 2024, the results of their operations for the year then ended, the changes in their net assets for each of the two years in the period then ended and their financial highlights for each of the five years in the period then ended, in conformity with U.S. generally accepted accounting principles.
Basis for Opinion
These financial statements are the responsibility of the Trust’s management. Our responsibility is to express an opinion on each of the Funds’ financial statements based on our audits. We are a public accounting firm registered with the Public Company Accounting Oversight Board (United States) (“PCAOB”) and are required to be independent with respect to the Trust in accordance with the U.S. federal securities laws and the applicable rules and regulations of the Securities and Exchange Commission and the PCAOB.
We conducted our audits in accordance with the standards of the PCAOB. Those standards require that we plan and perform the audit to obtain reasonable assurance about whether the financial statements are free of material misstatement, whether due to error or fraud. The Trust is not required to have, nor were we engaged to perform, an audit of the Trust’s internal control over financial reporting. As part of our audits, we are required to obtain an understanding of internal control over financial reporting but not for the purpose of expressing an opinion on the effectiveness of the Trust’s internal control over financial reporting. Accordingly, we express no such opinion.
Our audits included performing procedures to assess the risks of material misstatement of the financial statements, whether due to error or fraud, and performing procedures that respond to those risks. Such procedures included examining, on a test basis, evidence regarding the amounts and disclosures in the financial statements. Our procedures included confirmation of securities owned as of September 30, 2024, by correspondence with the custodian and brokers. Our audits also included evaluating the accounting principles used and significant estimates made by management, as well as evaluating the overall presentation of the financial statements. We believe that our audits provide a reasonable basis for our opinion.

We have served as the auditor of one or more Guggenheim investment companies since 1979.
Tysons, Virginia
November 27, 2024
40 | THE GUGGENHEIM FUNDS ANNUAL FINANCIAL REPORT | |
OTHER INFORMATION (Unaudited) |
Federal Income Tax Information
This information is being provided as required by the Internal Revenue Code. Amounts shown may differ from those elsewhere in the report because of differences in tax and financial reporting practice.
In January 2025, shareholders will be advised on IRS Form 1099 DIV or substitute 1099 DIV as to the federal tax status of the distributions received by shareholders in the calendar year 2024.
The Funds’ investment income (dividend income plus short-term capital gains, if any) qualifies as follows:
Of the taxable ordinary income distributions paid during the fiscal year ended September 30, 2024, the following funds had the corresponding percentages qualify for the reduced tax rate pursuant to the Jobs and Growth Tax Relief and Reconciliation Act of 2003 or for the dividends received deduction for corporations. See the qualified dividend income and dividend received deduction columns, respectively, in the table below.
Additionally, of the taxable ordinary income distributions paid during the fiscal year ended September 30, 2024, the following funds had the corresponding percentages qualify as interest related dividends and qualified short-term capital gains as permitted by IRC Section 871(k)(1) and IRC Section 871(k)(2), respectively. See the qualified interest income and qualified short-term capital gain columns, respectively, in the table below.
Fund | | Qualified
Dividend
Income | | | Dividend
Received
Deduction | | | Qualified
Interest
Income | | | Qualified
Short-Term
Capital Gain | |
Directional Allocation Fund | | | 13.56 | % | | | 12.16 | % | | | 84.38 | % | | | 0.00 | % |
RBP® Dividend Fund | | | 48.03 | % | | | 43.96 | % | | | 0.00 | % | | | 0.00 | % |
RBP® Large-Cap Defensive Fund | | | 100.00 | % | | | 100.00 | % | | | 0.00 | % | | | 0.00 | % |
RBP® Large-Cap Value Fund | | | 93.04 | % | | | 92.09 | % | | | 0.00 | % | | | 100.00 | % |
With respect to the taxable year ended September 30, 2024, the Funds hereby designate as capital gain dividends the amounts listed below, or, if subsequently determined to be different, the net capital gain of such year:
Fund | | From long-term
capital gain: | | | From long-term capital
gain, using proceeds
from shareholder
redemptions: | |
Directional Allocation Fund | | $ | — | | | $ | 1,431,754 | |
RBP® Dividend Fund | | | — | | | | 21,866 | |
RBP® Large-Cap Defensive Fund | | | — | | | | 23,196 | |
RBP® Large-Cap Value Fund | | | — | | | | 3,703 | |
Sector Classification
Information in the “Schedule of Investments” is categorized by sectors using sector-level Classifications defined by the Bloomberg Industry Classification System, a widely recognized industry classification system provider. Each Fund’s registration statement has investment policies relating to concentration in specific sectors/industries. For purposes of these investment policies, the Funds usually classify sectors/industries based on industry-level Classifications used by widely recognized industry classification system providers such as Bloomberg Industry Classification System, Global Industry Classification Standards and Barclays Global Classification Scheme.
Quarterly Portfolio Schedules Information
The Trust files its complete schedule of portfolio holdings with the SEC for the first and third quarters of each fiscal year as an exhibit to its reports on Form N-PORT. The Funds’ Form N-PORT is available on the SEC’s website at https://www.sec.gov. The Funds’ complete schedules of securities holdings as of the end of each fiscal quarter will be made available to the public on the SEC’s website at www.sec.gov and on our website at www.guggenheiminvestments.com, and will be made available, upon request and without charge, by calling 800.820.0888.
| | THE GUGGENHEIM FUNDS ANNUAL FINANCIAL REPORT | 41 |
ITEM 8: CHANGES IN AND DISAGREEMENTS WITH ACCOUNTANTS FOR OPEN-END MANAGEMENT INVESTMENT COMPANIES |
Note: This is not applicable for any fund included in this document.
42 | THE GUGGENHEIM FUNDS ANNUAL FINANCIAL REPORT | |
ITEM 9: PROXY DISCLOSURES FOR OPEN-END MANAGEMENT INVESTMENT COMPANIES |
At a special meeting of shareholders held on October 24, 2024, the following matters were voted upon and approved by shareholders:
| | ● | An agreement and plan of reorganization providing for the reorganization of Guggenheim RBP® Dividend Fund into NAA Large Cap Value Fund (469,538 votes for; 406 votes against; 11,700 votes abstain); |
| | ● | an agreement and plan of reorganization providing for the reorganization of Guggenheim RBP® Large-Cap Defensive Fund into NAA Large Cap Value Fund (445,303 votes for; 1,226 votes against; 3,300 votes abstain); |
| | ● | an agreement and plan of reorganization providing for the reorganization of Guggenheim RBP® Large-Cap Value Fund into NAA Large Cap Value Fund (324,941 votes for; 0 votes against; 784 votes abstain); and |
| | ● | An agreement and plan of reorganization providing for the reorganization of Guggenheim Directional Allocation Fund into NAA Allocation Fund (3,126,939 votes for; 74,511 votes against; 528,646 votes abstain). |
| | THE GUGGENHEIM FUNDS ANNUAL FINANCIAL REPORT | 43 |
ITEM 10: RENUMERATION PAID TO DIRECTORS, OFFICERS, AND OTHERS OF OPEN-END MANAGEMENT INVESTMENT COMPANIES
The remuneration paid to directors, officers, and others, if applicable, are included as part of the financial statements included under Item 7 of this Form.
44 | THE GUGGENHEIM FUNDS ANNUAL FINANCIAL REPORT | |
ITEM 11: STATEMENT REGARDING BASIS FOR APPROVAL OF INVESTMENT ADVISORY CONTRACT
Report of the Transparent Value Trust Board of Trustees
The Board of Trustees of Transparent Value Trust (the “Trust”), including the Independent Trustees, approved the renewal of the investment management agreement (the “Advisory Agreement”) with Guggenheim Partners Investment Management, LLC (“GPIM” or the “Adviser”) on behalf of the series of the Trust listed below (each a “Fund” and collectively, the “Funds”):
● Guggenheim RBP® Large-Cap Defensive Fund
(“RBP Large-Cap Defensive Fund”) ● Guggenheim RBP® Large-Cap Market Fund
(“RBP Large-Cap Market Fund”) ● Guggenheim Directional Allocation Fund
(“Directional Allocation Fund”) | ● Guggenheim RBP® Dividend Fund
(“RBP Dividend Fund”) ● Guggenheim RBP® Large-Cap Value Fund
(“RBP Large-Cap Value Fund”) |
GPIM is an indirect subsidiary of Guggenheim Partners, LLC, a privately-held, global investment and advisory firm (“Guggenheim Partners”). Guggenheim Partners, GPIM and their affiliates may be referred to herein collectively as “Guggenheim.” “Guggenheim Investments” refers to the global asset management and investment advisory division of Guggenheim Partners and includes GPIM, Guggenheim Funds Investment Advisors, LLC, Security Investors, LLC and other affiliated investment management businesses of Guggenheim Partners.
At meetings held in person on April 16, 2024 (the “April Meeting”) and on May 20-21, 2024 (the “May Meeting”), the Contracts Review Committee of the Board (the “Committee”), consisting solely of the Independent Trustees, met separately from Guggenheim to consider the proposed renewal of the Advisory Agreement. As part of its review process, the Committee was represented by independent legal counsel to the Independent Trustees (“Independent Legal Counsel”), from whom the Independent Trustees received separate legal advice and with whom they met separately. Independent Legal Counsel reviewed and discussed with the Committee various key aspects of the Trustees’ legal responsibilities relating to the proposed renewal of the Advisory Agreement and other principal contracts. The Committee took into account various materials received from Guggenheim and Independent Legal Counsel. The Committee also considered the variety of written materials, reports and oral presentations the Board received throughout the year regarding performance and operating results of the Funds, and other information relevant to its evaluation of the Advisory Agreement.
In connection with the contract review process, FUSE Research Network LLC (“FUSE”), an independent, third-party research provider, was engaged to prepare advisory contract renewal reports designed specifically to help the Board fulfill its advisory contract renewal responsibilities. The objective of the FUSE reports is to present the subject fund’s relative position regarding fees, expenses and total return performance, with peer group and universe comparisons. The Committee assessed the data provided in the FUSE reports as well as commentary presented by Guggenheim, including, among other things, a summary of notable distinctions between certain Funds and the applicable peer group identified in the FUSE reports and explanations for custom peer groups created for certain Funds that do not fit well into any particular category. The Committee noted that although FUSE’s process typically results in the identification for each Fund of a universe of similar funds for performance comparisons and a narrower group of similar funds from the universe based on asset levels for comparative fee and expense data evaluation (i.e., the peer group), in light of Directional Allocation Fund’s unique strategy, the peer group constituent funds identified by FUSE, which were categorized as “U.S. equity long/cash funds” with risk management and/or rotational/timing strategies similar to that of the Fund, were the same as the performance universe constituent funds.
As part of its evaluation of the Adviser and the proposed renewal of the Advisory Agreement, the Committee took into account that each Fund seeks to track the performance (before fees and expenses) of an index that is constructed with a proprietary methodology. Specifically, the investment objective of each of RBP Large-Cap Defensive Fund, RBP Dividend Fund, RBP Large-Cap Market Fund and RBP Large-Cap Value Fund is to provide investment results that, before fees and expenses, correspond generally to the total return performance of the applicable Guggenheim RBP® Index—i.e., the Guggenheim RBP® Large-Cap Defensive IndexSM, the Guggenheim RBP® Dividend IndexSM, the Guggenheim RBP® Large-Cap Market IndexSM and the Guggenheim RBP® Large-Cap Value IndexSM, respectively (each, an “RBP Index” and collectively, the “RBP Indexes”). The investment objective of Directional Allocation Fund is to provide investment results that, before fees and expenses, correspond generally to the performance of the Guggenheim Directional Allocation IndexSM (the “Directional Allocation Index” and together with the RBP Indexes, the “Indexes” and individually, an “Index”). Each Index consists of securities currently selected for inclusion by the Adviser’s index calculation agent, based on Required Business Performance® (RBP®) Probability scores derived from Guggenheim Investments’ quantitative process. In this regard, the Committee noted that the Indexes and Index construction processes were previously
| | THE GUGGENHEIM FUNDS ANNUAL FINANCIAL REPORT | 45 |
ITEM 11: STATEMENT REGARDING BASIS FOR APPROVAL OF INVESTMENT ADVISORY CONTRACT (continued)
owned and implemented by an affiliate of the Adviser, and that, in August 2018, such affiliate was reorganized into Guggenheim Investments, and the Indexes and Index construction processes were acquired by Guggenheim Investments. The Committee noted that the FUSE reports for the Funds included performance relative to the applicable Index and tracking error data.
In addition, Guggenheim provided materials and data in response to formal requests for information sent by Independent Legal Counsel on behalf of the Committee. Guggenheim also made a presentation at the April Meeting. Throughout the process, the Committee asked questions of management and requested certain additional information, which Guggenheim provided (collectively with the foregoing reports and materials, the “Contract Review Materials”). The Committee considered the Contract Review Materials in the context of its accumulated experience governing the Trust and other funds in the Guggenheim fund complex and weighed the factors and standards discussed with Independent Legal Counsel.
As a part of its analysis, the Committee considered that Guggenheim had engaged in a strategic review of the Guggenheim fund line-up beginning in 2023, which resulted in recommendations to the Board in 2024 for certain Funds1 to be reorganized into new funds sponsored by a third-party manager (the “Proposed Reorganizations”) and for RBP Large-Cap Market Fund to be liquidated and terminated (the “Proposed Liquidation”). The Committee noted that the Board was engaged in an extensive due diligence process to evaluate the Proposed Reorganizations and the Proposed Liquidation, which was ongoing at the time of the May Board Meeting (defined below), at which meeting the Advisory Agreement was being considered for renewal. The Committee considered the potential timing of the Proposed Reorganizations and the Proposed Liquidation and that the continuation of the Advisory Agreement for the Funds would allow the Funds to operate until the completion of the Proposed Reorganizations or the Proposed Liquidation, if approved by the Board and by shareholders (as applicable), and would provide for the operation of the Funds to continue in the event the Board or shareholders (as applicable) do not approve the Proposed Reorganizations or the Proposed Liquidation.
Following an analysis and discussion of relevant factors, including those identified below, and in the exercise of its business judgment, the Committee concluded that it was in the best interest of each Fund to recommend that the Board approve the renewal of the Advisory Agreement for an additional annual term. Following its review of the Committee’s recommendation, the Board approved the renewal of the Advisory Agreement for each Fund for a one-year period ending August 1, 2025 at a meeting held on May 20-21, 2024 (the “May Board Meeting” and together with the May Meeting, the “May Meetings”) and determined to adopt the Committee’s considerations and conclusions, which follow.
Nature, Extent and Quality of Services Provided by the Adviser: With respect to the nature, extent and quality of services currently provided by the Adviser, the Committee considered the qualifications, experience and skills of key personnel performing services for the Funds, including those personnel providing compliance and risk oversight, as well as the supervisors and reporting lines for such personnel. The Committee also considered other information, including Guggenheim’s resources and related efforts to retain, attract and motivate capable personnel to serve the Funds. In evaluating Guggenheim’s resources and capabilities, the Committee considered Guggenheim’s discussions with the Committee and the Board regarding the Proposed Reorganizations and the Proposed Liquidation, including at the April Meeting and the May Meetings. In this regard, the Committee considered Guggenheim’s representation that it continues to manage each Fund included in the Proposed Reorganizations or the Proposed Liquidation in the best interest of such Fund and its shareholders and will continue to do so for so long as it serves as investment adviser to such Fund, including until the Proposed Reorganization or the Proposed Liquidation of such Fund, if approved by the Board and by shareholders (as applicable), is completed. In addition, the Committee considered the acceptability of the terms of the Advisory Agreement, including the scope of services required to be performed by the Adviser.
The Committee’s review of the services provided by Guggenheim to the Funds included consideration of Guggenheim’s investment and Index construction processes and resulting performance, portfolio oversight and risk management, and the related regular quarterly reports and presentations received by the Board. The Committee took into account the risks borne by Guggenheim in sponsoring and providing services to the Funds, including regulatory, operational, legal and entrepreneurial risks. The Committee considered the resources dedicated by Guggenheim to compliance functions and the reporting made to the Board by Guggenheim compliance personnel regarding Guggenheim’s adherence to regulatory requirements. The Committee also considered the regular reports the Board receives from the Trust’s Chief Compliance Officer regarding compliance policies and procedures established pursuant to Rule 38a-1 under the Investment Company Act of 1940, as amended. In connection with the Committee’s evaluation of the overall package of services provided by Guggenheim, the Committee considered Guggenheim’s administrative services, including its role in supervising, monitoring, coordinating and evaluating the various services provided
1 | RBP Large-Cap Defensive Fund, RBP Dividend Fund, RBP Large-Cap Value Fund and Directional Allocation Fund. |
46 | THE GUGGENHEIM FUNDS ANNUAL FINANCIAL REPORT | |
ITEM 11: STATEMENT REGARDING BASIS FOR APPROVAL OF INVESTMENT ADVISORY CONTRACT (continued)
by the fund administrator, transfer agent, distributor, custodian and other service providers to the Funds. The Committee evaluated the Office of Chief Financial Officer (the “OCFO”), which oversees the fund administration, accounting and transfer agency services provided to the Funds and other funds in the Guggenheim fund complex, including the OCFO’s resources, personnel and services provided.
With respect to Guggenheim’s resources and the ability of the Adviser to carry out its responsibilities under the Advisory Agreement, the Chief Financial Officer of Guggenheim Investments reviewed with the Committee financial information concerning the holding company for Guggenheim Investments, Guggenheim Partners Investment Management Holdings, LLC (“GPIMH”), and the various entities comprising Guggenheim Investments, and provided the audited consolidated financial statements of GPIMH. (Thereafter, the Committee received the audited consolidated financial statements of GPIM.)
Based on the foregoing, and based on other information received (both oral and written) at the April Meeting and the May Meetings, as well as other considerations, including the Committee’s knowledge of how the Adviser performs its duties obtained through Board meetings, discussions and reports throughout the year, the Committee concluded that the Adviser and its personnel were qualified to serve the Funds in such capacity and may reasonably be expected to continue to provide a high quality of services under the Advisory Agreement with respect to the Funds.
Investment Performance: The Committee received, for each Fund, investment returns for the since-inception, ten-year, five-year, three-year, one-year and three-month periods ended December 31, 2023. In addition, the Committee received a comparison of each Fund’s performance to the performance of a universe of funds and a narrower peer group of similar funds based on asset levels as identified by FUSE (except as noted above with respect to Directional Allocation Fund), in each case for the same periods. The Committee also received from FUSE a description of the methodology for identifying each Fund’s peer group and universe for performance and expense comparisons. In addition, as noted above, the FUSE reports included each Fund’s total return over various time periods compared to the results of the Index that the Fund tracks, as well as tracking error results. The Committee also received certain performance information as of March 31, 2024. In assessing each Fund’s performance, the Committee considered that the Board receives regular reporting from Guggenheim regarding performance and evaluates performance throughout the year.
In seeking to evaluate Fund performance over a full market cycle, the Committee focused its attention on five-year and three-year performance rankings as compared to the relevant universe or, as applicable, peer group of funds. Except as to the individual Funds discussed below, the Committee observed that the returns of each Fund’s Institutional Class shares ranked in the third quartile or better of such Fund’s performance universe or peer group, as applicable, for each of the five-year and three-year periods considered. The Committee also considered the tracking error information received and determined that each Fund tracked its Index within an acceptable range for each of the five-year and three-year periods considered. In addition, the Committee made the following observations:
RBP Large-Cap Market Fund: The returns of the Fund’s Institutional Class shares ranked in the 86th and 90th percentiles of its performance universe for the five-year and three-year periods ended December 31, 2023, respectively.
RBP Large-Cap Defensive Fund: The returns of the Fund’s Institutional Class shares ranked in the 98th and 97th percentiles of its performance universe for the five-year and three-year periods ended December 31, 2023, respectively.
RBP Large-Cap Value Fund: The returns of the Fund’s Institutional Class shares ranked in the 92nd percentile of its performance universe for the five-year and three-year periods ended December 31, 2023.
RBP Large-Cap Market Fund, RBP Large-Cap Defensive Fund and RBP Large-Cap Value Fund: The Committee considered management’s explanation that each Fund’s relative underperformance over the five-year and three-year time periods can be attributed to the methodology, used prior to September 2021, by which the RBP® process had historically weighted stocks in the Fund during the stock selection process, which resulted in an implicit underweight to the largest stocks, especially mega-cap stocks which outperformed during the relevant periods, and an overweight to relatively smaller large-cap stocks, which underperformed during the relevant periods, within the Fund’s investment universe. The Committee noted management’s statement that starting in the third quarter of 2021, to address unintended implicit risk exposures such as market cap, each Fund updated its portfolio construction process to leverage a proprietary equity risk model and utilize optimization techniques to weight positions and limit active exposures to equity characteristics that are not explicitly intended. The Committee considered management’s statement that although the updated portfolio construction process is designed to allow for the RBP® Probability signal to be the main driver of Fund performance, the whipsaw effect caused by the COVID-19 pandemic proved to be a particularly challenging economic environment for the
| | THE GUGGENHEIM FUNDS ANNUAL FINANCIAL REPORT | 47 |
ITEM 11: STATEMENT REGARDING BASIS FOR APPROVAL OF INVESTMENT ADVISORY CONTRACT (continued)
RBP® Probability signal to gauge companies’ fundamentals. The Committee took into consideration management’s statement that as the growth environment has recently normalized, so has the signal’s efficacy, which should lead to renewed positive contributions to performance for the Funds going forward.
Based on the foregoing, and based on other information received (both oral and written) at the April Meeting and the May Meetings, as well as other considerations, the Committee concluded that: (i) each Fund’s performance was acceptable; or (ii) it was satisfied with Guggenheim’s responses and/or efforts to improve investment performance.
Comparative Fees, Costs of Services Provided and the Benefits Realized by the Adviser from Its Relationship with the Funds: The Committee compared each Fund’s contractual advisory fee, net effective management fee2 and total net expense ratio to the applicable peer group. The Committee also reviewed the median advisory fees and expense ratios, including expense ratio components (e.g., transfer agency fees, administration fees, other operating expenses, distribution fees and fee waivers/reimbursements), of the peer group. In addition, the Committee considered information regarding Guggenheim’s process for evaluating the competitiveness of each Fund’s fees and expenses, noting Guggenheim’s statement that evaluations seek to incorporate a variety of factors with a general focus on ensuring fees and expenses: (i) are competitive; (ii) give consideration to resource support requirements; and (iii) ensure Funds are able to deliver on shareholder return expectations.
The Committee also noted Guggenheim’s statement that it does not provide advisory services to other clients that have investment strategies similar to those of the Funds and, as a result, the Committee did not consider it relevant to compare the Funds’ advisory fees to the advisory fees charged to other clients of Guggenheim.
In further considering the comparative fee and expense data presented in the Contract Review Materials and addressed by Guggenheim, the Committee took into account those Funds with currently effective expense limitation agreements with the Adviser. Except as to the individual Funds discussed below, the Committee observed that the contractual advisory fee, net effective management fee and total net expense ratio for each Fund’s Institutional Class shares each rank in the third quartile or better of such Fund’s peer group. In addition, the Committee made the following observations:
RBP Large-Cap Market Fund: The contractual advisory fee for the Fund’s Institutional Class shares ranks in the fourth quartile (92nd percentile) of its peer group. Although the total net expense ratio for the Fund’s Institutional Class shares ranks in the fourth quartile (85th percentile) of its peer group, the Committee considered that the net effective management fee for the Fund’s Institutional Class shares ranks in the first quartile (1st percentile) of its peer group. The Committee took into account the Fund’s currently effective expense limitation agreement with the Adviser.
RBP Large-Cap Value Fund: The contractual advisory fee for the Fund’s Institutional Class shares ranks in the fourth quartile (79th percentile) of its peer group. The net effective management fee for the Fund’s Institutional Class shares ranks in the first quartile (1st percentile) of its peer group. The total net expense ratio for the Fund’s Institutional Class shares ranks in the third quartile (57th percentile) of its peer group. The Committee took into account the Fund’s currently effective expense limitation agreement with the Adviser.
With respect to the costs of services provided and benefits realized by Guggenheim Investments from its relationship with the Funds, the Committee reviewed a profitability analysis and data from management for each Fund setting forth the average assets under management for the twelve months ended December 31, 2023, gross revenues received, and expenses incurred directly or through allocations, by Guggenheim Investments, expense waivers, earnings and the operating margin/profitability rate, including variance information relative to the foregoing amounts as of December 31, 2022 and December 31, 2021. In addition, the Chief Financial Officer of Guggenheim Investments reviewed with, and addressed questions from, the Committee concerning the expense allocation methodology employed in producing the profitability analysis. In the course of its review of Guggenheim Investments’ profitability, the Committee took into account the methods used by Guggenheim Investments to determine expenses and profit and the representation by the Chief Financial Officer of Guggenheim Investments that such methods provided a reasonable basis for determining the profitability of the Adviser with respect to each Fund. The Committee considered all of the foregoing, among other things, in evaluating the costs of services provided, the profitability to Guggenheim Investments and the profitability rates presented.
2 | The “net effective management fee” for each Fund represents the combined effective advisory fee and administration fee as a percentage of average net assets for the latest fiscal year, after any waivers and/or reimbursements. |
48 | THE GUGGENHEIM FUNDS ANNUAL FINANCIAL REPORT | |
ITEM 11: STATEMENT REGARDING BASIS FOR APPROVAL OF INVESTMENT ADVISORY CONTRACT (concluded)
The Committee also considered other benefits available to the Adviser because of its relationship with the Funds and noted Guggenheim’s statement that it does not believe the Adviser derives any such “fall-out” benefits. In this regard, the Committee noted Guggenheim’s statement that, although it does not consider such benefits to be fall-out benefits, the Adviser may benefit from certain economies of scale and synergies, such as enhanced visibility of the Adviser, enhanced leverage in fee negotiations and other synergies arising from offering a broad spectrum of products, including the Funds.
Based on the foregoing, and based on other information received (both oral and written) at the April Meeting and the May Meetings, as well as other considerations, the Committee concluded that the comparative fees and the benefits realized by the Adviser from its relationship with the Funds were appropriate and that the Adviser’s profitability from its relationship with the Funds was not unreasonable.
Economies of Scale: The Committee received and considered information regarding whether there have been economies of scale with respect to the management of the Funds as Fund assets grow, whether the Funds have appropriately benefited from any economies of scale, and whether there is potential for realization of any further economies of scale. The Committee considered whether economies of scale in the provision of services to the Funds were being passed along to and shared with the shareholders. In evaluating economies of scale, the Committee considered that all of the Funds, other than the Directional Allocation Fund, had very small average net assets. The Committee considered that Guggenheim believes it is appropriately sharing potential economies of scale and that Guggenheim’s decrease in overall expenses in 2023 was attributable to decreased product and distribution related costs driven by lower average assets under management (which also resulted in decreased revenue from the funds in the Guggenheim fund complex), decreased expense waivers and reimbursements, and decreased expenses associated with non-recurring items.
The Committee also noted the process employed by the Adviser to evaluate whether it would be appropriate to institute a new breakpoint for a Fund, with consideration given to, among other things: (i) the Fund’s size and trends in asset levels over recent years; (ii) the competitiveness of the expense levels; (iii) whether expense waivers are in place; (iv) changes and trends in revenue and expenses; (v) whether there are any anticipated expenditures that may benefit the Fund in the future; (vi) Fund profit level margins; (vii) relative Fund performance; (viii) the nature, extent and quality of services management provides to the Fund; and (ix) the complexity of the Fund’s investment strategy and the resources required to support the Fund.
As part of its assessment of economies of scale, the Committee took into account Guggenheim’s representation that it seeks to share economies of scale through a number of means, including advisory fees set at competitive rates pre-assuming future asset growth, expense waivers and limitations, and investments in personnel, operations and infrastructure to support the fund business. The Committee also received information regarding amounts that had been shared with shareholders through such expense waivers and limitations. Thus, the Committee considered the size of the Funds and the competitiveness of and/or other determinations made regarding the current advisory fee for each Fund, as well as whether a Fund is subject to an expense limitation.
Based on the foregoing, and based on other information received (both oral and written) at the April Meeting and the May Meetings, as well as other considerations, the Committee concluded that the advisory fee for each Fund was reasonable.
Overall Conclusions
The Committee concluded that the investment advisory fees are fair and reasonable in light of the extent and quality of the services provided and other benefits received and that the renewal of the Advisory Agreement is in the best interest of each Fund. In reaching this conclusion, no single factor was determinative or conclusive and each Committee member, in the exercise of their informed business judgment, may afford different weights to different factors.
Following its review of the Committee’s analysis and determinations, the Board adopted the considerations and conclusions of the Committee and determined to approve the renewal of the Advisory Agreement. As a part of its considerations, the Board noted its ongoing evaluation of the Proposed Reorganizations for certain Funds and the Proposed Liquidation for RBP Large-Cap Market Fund and determined that the renewal of the Advisory Agreement for the Funds would allow the Funds to operate until the completion of the Proposed Reorganizations or the Proposed Liquidation, if approved by the Board and by shareholders (as applicable), and would provide for the operation of the Funds to continue in the event the Board or shareholders (as applicable) do not approve the Proposed Reorganizations or the Proposed Liquidation. (Following the May Board Meeting, the Board approved the Proposed Reorganizations, subject to shareholder approval, and the Proposed Liquidation at a reconvening of the May Board Meeting held by videoconference on May 24, 2024.)
| | THE GUGGENHEIM FUNDS ANNUAL FINANCIAL REPORT | 49 |
This page intentionally left blank.
This page intentionally left blank.
This page intentionally left blank.
This page intentionally left blank.
| Item 8. | Changes in and Disagreements with Accountants for Open-End Management Investment Companies. |
Not applicable.
| Item 9. | Proxy Disclosures for Open-End Management Investment Companies. |
The information is included as part of the material filed under Item 7 of this Form.
| Item 10. | Remuneration Paid to Directors, Officers, and Others of Open-End Management Investment Companies. |
The information is included as part of the material filed under Item 7 of this Form.
| Item 11. | Statement Regarding Basis for Approval of Investment Advisory Contract. |
The information is included as part of the material filed under Item 7 of this Form.
| Item 12. | Disclosure of Proxy Voting Policies and Procedures for Closed-End Management Investment Companies. |
Not applicable to this registrant.
| Item 13. | Portfolio Managers of Closed-End Management Investment Companies. |
Not applicable to this registrant.
| Item 14. | Purchases of Equity Securities by Closed-End Management Investment Company and Affiliated Purchases. |
Not applicable to this registrant.
| Item 15. | Submission of Matters to a Vote of Security Holders. |
There have been no changes to the procedures by which shareholders may recommend nominees to the registrant’s board of trustees.
| Item 16. | Controls and Procedures. |
| (a) | The registrant’s President (principal executive officer) and Treasurer (principal financial officer) have evaluated the registrant’s disclosure controls and procedures (as defined in Rule 30a-3(c) under the Investment Company Act) as of a date within 90 days of this filing and have concluded that based on such evaluation as required by Rule 30a-3(b) under the Investment Company Act, that the registrant’s disclosure controls and procedures were effective as of that date in ensuring that information required to be disclosed by the registrant in this Form N-CSR was recorded, processed, summarized, and reported within the time periods specified in the Securities and Exchange Commission’s rules and forms. |
| (b) | There were no changes in the registrant’s internal control over financial reporting (as defined in Rule 30a-3(d) under the Investment Company Act) that occurred during the period covered by this report that the officers listed above believe to have materially affected, or to be reasonably likely to materially affect, the registrant’s internal control over financial reporting. |
| Item 17. | Disclosure of Securities Lending Activities for Closed-End Management Investment Companies. |
Not applicable to this registrant.
| Item 18. | Recovery of Erroneously Awarded Compensation. |
SIGNATURES
Pursuant to the requirements of the Securities Exchange Act of 1934 and the Investment Company Act of 1940, the registrant has duly caused this report to be signed on its behalf by the undersigned, thereunto duly authorized.
| (Registrant) | Transparent Value Trust | |
| | | |
| By (Signature and Title)* | /s/ Brian E. Binder | |
| | Brian E. Binder, President and Chief Executive Officer | |
| | | |
| Date | December 6, 2024 | |
Pursuant to the requirements of the Securities Exchange Act of 1934 and the Investment Company Act of 1940, this report has been signed below by the following persons on behalf of the registrant and in the capacities and on the dates indicated.
| By (Signature and Title)* | /s/ Brian E. Binder | |
| | Brian E. Binder, President and Chief Executive Officer | |
| | | |
| Date | December 6, 2024 | |
| | | |
| By (Signature and Title)* | /s/ James Howley | |
| | James Howley, Chief Financial Officer, Chief Accounting Officer and Treasurer | |
| | | |
| Date | December 6, 2024 | |
| * | Print the name and title of each signing officer under his or her signature. |
