Exhibit 99.2

1 Midland States Bancorp, Inc. NASDAQ: MSBI Third Quarter 2019 Earnings Call

2 Forward - Looking Statements. This presentation may contain forward - looking statements within the meaning of the federal securities laws. Forward - looking statements express management’s current expectations, forecasts of future events or long - term goals, including with respect to pending acquisitions, and may be based upon beliefs, expectations and assumptions of Midland ’s management, are generally identifiable by the use of words such as “believe,” “expect,” “anticipate,” “plan,” “intend,” “esti mat e,” “may,” “will,” “would,” “could,” “should” or other similar expressions. All statements in this presentation speak only as of th e date they are made, and Midland undertakes no obligation to update any statement. A number of factors, many of which are beyond th e ability of Midland to control or predict, could cause actual results to differ materially from those in its forward - looking statements. These risks and uncertainties should be considered in evaluating forward - looking statements and undue reliance shou ld not be placed on such statements. Additional information concerning Midland and its respective businesses, including addition al factors that could materially affect Midland’s financial results, are included in Midland’s filings with the Securities and E xch ange Commission. Use of Non - GAAP Financial Measures. This presentation may contain certain financial information determined by methods other than in accordance with accounting principles generally accepted in the United States (“GAAP”). These non - GAAP financial measure s include “Adjusted Earnings,” “Adjusted Diluted Earnings Per Share,” “Adjusted Return on Average Assets,” “Adjusted Return on Average Shareholders’ Equity,” “Adjusted Return on Average Tangible Common Equity,” “Efficiency Ratio,” “Tangible Common Equ ity to Tangible Assets,” “Tangible Book Value Per Share” and “Return on Average Tangible Common Equity.” The Company believes tha t these non - GAAP financial measures provide both management and investors a more complete understanding of the Company’s funding profile and profitability. These non - GAAP financial measures are supplemental and are not a substitute for any analysis based on GAAP financial measures. Not all companies use the same calculation of these measures; therefore this presentation m ay not be comparable to other similarly titled measures as presented by other companies. Reconciliations of these non - GAAP measures are provided in the Appendix section of this presentation.

3 Overview of 3Q19 3 Solid Execution on Strategic Priorities 3Q19 Earnings Capital Management • Strong inflows of core deposits – growth of $153.2 million • Efficiency ratio (1) improved to 60.6% from 61.6% in prior quarter • Relatively stable net interest margin (excluding accretion income) • Issuance of $100 million in subordinated notes provides flexibility to reduce borrowing costs • Authorization of $25 million stock repurchase program • Long track record of increasing dividend by at least 10% annually HomeStar Acquisition • Closed on July 17, 2019 • System conversion completed in mid - October • Provides low - cost deposit base and leading position in Kankakee, Illinois market • Net income of $12.7 million, or $0.51 diluted EPS • Integration and acquisition expenses of $5.3 million impacted net income by $0.15 per diluted share • Adjusted earnings (1) of $0.66 per diluted share Notes: (1) Represents a non - GAAP financial measure. See “Non - GAAP Reconciliation” in the appendix.

4 3Q 2019 2Q 2019 3Q 2018 Commercial loans and leases $ 1,293 $ 1,149 $ 1,035 Commercial real estate 1,622 1,524 1,712 Construction and land development 216 250 239 Residential real estate 588 552 586 Consumer 610 597 584 Total Loans $ 4,329 $ 4,074 $ 4,156 $4,156 $4,138 $4,092 $4,074 $4,329 3Q 2018 4Q 2018 1Q 2019 2Q 2019 3Q 2019 Loan Portfolio Total Loans 4 • Total loans increased $255.3 million, or 6.3%, to $4.33 billion • Increase primarily attributable to addition of HomeStar loan portfolio • Organic loan growth of $44.1 million, or 1.1%, during 3Q19, primarily due to growth in commercial portfolio • Equipment finance balances increased $57.1 million, or 11.2%, from June 30, 2019 Loan Portfolio Mix (in millions, as of quarter - end) (in millions, as of quarter - end) JB [2]7

5 3Q 2019 2Q 2019 3Q 2018 Noninterest - bearing demand $ 1,015 $ 902 $ 991 Interest - bearing: Checking 1,223 1,009 1,047 Money market 754 733 836 Savings 527 442 446 Time 833 785 634 Brokered time 94 140 189 Total Deposits $ 4,445 $ 4,011 $ 4,143 $4,143 $4,074 $4,036 $4,011 $4,445 3Q 2018 4Q 2018 1Q 2019 2Q 2019 3Q 2019 Total Deposits Total Deposits 5 • Total deposits increased $434.0 million, or 10.8%, to $4.45 billion • Increase in deposits primarily attributable to addition of HomeStar deposits • Organic deposit growth of $112.2 million, or 2.8%, during 3Q19, driven by $153.2 million increase in core deposits • Continued intentional run - off of brokered time deposits Deposit Mix (in millions, as of quarter - end) (in millions, as of quarter - end)
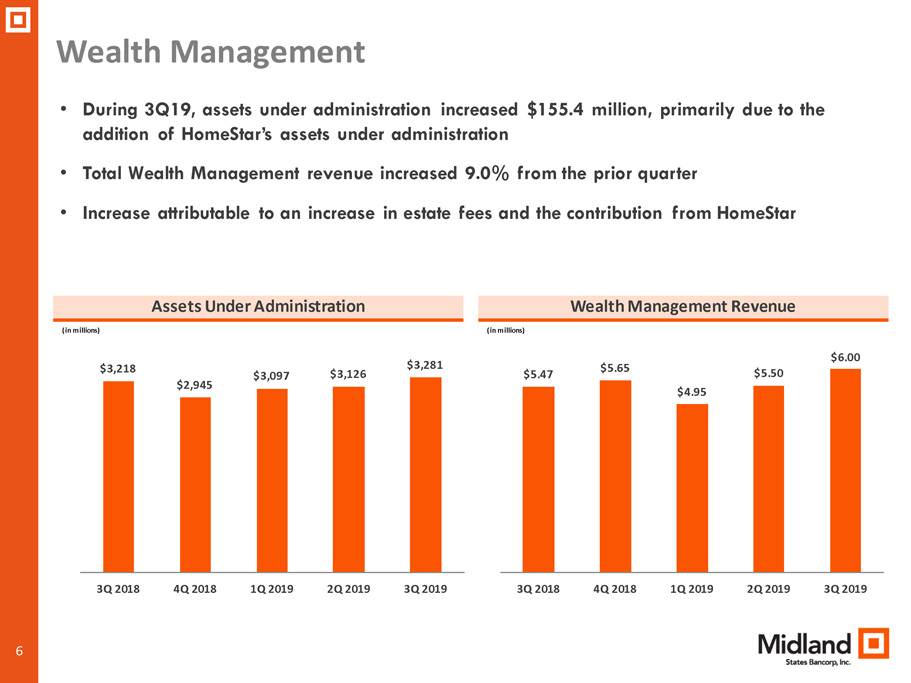
6 $5.47 $5.65 $4.95 $5.50 $6.00 3Q 2018 4Q 2018 1Q 2019 2Q 2019 3Q 2019 $3,218 $2,945 $3,097 $3,126 $3,281 3Q 2018 4Q 2018 1Q 2019 2Q 2019 3Q 2019 • During 3Q19, assets under administration increased $155.4 million, primarily due to the addition of HomeStar’s assets under administration • Total Wealth Management revenue increased 9.0% from the prior quarter • Increase attributable to an increase in estate fees and the contribution from HomeStar Wealth Management Wealth Management Revenue 6 Assets Under Administration (in millions) (in millions )

7 $1.7 $4.3 $2.5 $3.4 $3.1 $49.5 $45.1 $48.5 $45.6 $46.1 3Q 2018 4Q 2018 1Q 2019 2Q 2019 3Q 2019 NII Accretion Income 0.10% 0.31% 0.17% 0.25% 0.20% 3.70% 3.59% 3.85% 3.73% 3.76% 3Q 2018 4Q 2018 1Q 2019 2Q 2019 3Q 2019 NIM Accretion Income • Net interest income increased 7.3%, primarily due to contribution from HomeStar • Excluding the impact of accretion income, net interest margin was relatively unchanged • Average rate on new and renewed loans was 5.39% • Expected scheduled accretion income: $2.4 million in 4Q19 Net Interest Income/Margin Net Interest Margin 7 Net Interest Income (in millions) $5.

8 Noninterest Income 8 • Noninterest income unchanged from prior quarter • Wealth management remains largest single contributor to noninterest income • Commercial FHA revenue negatively impacted by $1.1 million MSR impairment Noninterest Income (in millions) $18.3 $21.2 $17.1 $19.6 $19.6 3Q 2018 4Q 2018 1Q 2019 2Q 2019 3Q 2019 All Other Community Banking Revenue Residential Mortgage Commercial FHA Wealth Management Notes: (1) Represents service charges, interchange revenue, net gain (loss) on sale of investment securities, and other income (1)

9 Noninterest Expense and Operating Efficiency 9 • Efficiency Ratio (1) was 60.6% in 3Q19 vs. 61.6% in 2Q19 • Adjustments to non - interest expense: • Excluding these adjustments, noninterest expense increased 5.9% on a linked - quarter basis • Increase in noninterest expense primarily attributable to addition of HomeStar’s operations • Branch network to be reduced by six locations, which includes three related to the HomeStar acquisition, by the end of the first quarter of 2020 Noninterest Expense and Efficiency Ratio (1) (Noninterest expense in millions) $9.8 $0.6 $0.2 $(0.2) $5.2 63.0% 65.5% 64.7% 61.6% 60.6% $50.3 $45.5 $41.1 $40.2 $48.0 3Q 2018 4Q 2018 1Q 2019 2Q 2019 3Q 2019 Total Noninterest Expense Adjustments to Noninterest Expense Efficiency Ratio Notes: (1) Represents a non - GAAP financial measure. See “Non - GAAP Reconciliation” in the appendix. ($ in millions) 3Q19 2Q19 Integration and acquisition related expenses ($5.3) ($0.3) Gain on MSRs held for sale $0.1 $0.5 JB [2]9

10 Asset Quality NCO / Average Loans 10 • Net charge - offs for 3Q19 was 0.49% of average loans on an annualized basis, driven by the resolution of nonperforming loans • Provision for loan losses of $4.4 million in 3Q19 includes an additional $2.3 million specific reserve allocated to an existing nonperforming loan • ALLL/total loans of 0.58% and credit marks/total loans of 0.51% at September 30, 2019 Nonperforming Loans / Total Loans (Total Loans as of quarter - end) 0.93% 1.04% 1.20% 1.24% 1.04% 3Q 2018 4Q 2018 1Q 2019 2Q 2019 3Q 2019 0.07% 0.21% 0.10% 0.12% 0.49% 3Q 2018 4Q 2018 1Q 2019 2Q 2019 3Q 2019

11 Outlook • Focus on integrating HomeStar acquisition and fully capitalizing on synergies • All cost savings from HomeStar acquisition expected to be phased in by start of 2020 • Additional branch consolidation efforts will further enhance efficiencies • Continue to generate low - single - digit organic loan growth • Earnings accretion from HomeStar acquisition and continued efficiency improvements expected to drive earnings growth in 2020 11

12 APPENDIX

13 13 Adjusted Earnings Reconciliation (dollars in thousands, except per share data) Income before income taxes - GAAP $ 16,670 $ 21,394 $ 18,336 $ 20,863 $ 10,933 Adjustments to noninterest income: Gain on sales of investment securities, net 25 14 - 469 - Other - (23) - (1) (12) Total adjustments to noninterest income 25 (9) - 468 (12) Adjustments to noninterest expense: (Gain) loss on mortgage servicing rights held for sale (70) (515) - - 270 Integration and acquisition expenses 5,292 286 160 553 9,559 Total adjustments to noninterest expense 5,222 (229) 160 553 9,829 Adjusted earnings pre tax 21,867 21,174 18,496 20,948 20,774 Adjusted earnings tax 5,445 4,978 4,398 4,551 5,142 Adjusted earnings - non-GAAP 16,422 16,196 14,098 16,397 15,632 Preferred stock dividends, net (22) 34 34 34 35 Adjusted earnings available to common shareholders - non-GAAP $ 16,444 $ 16,162 $ 14,064 $ 16,363 $ 15,597 Adjusted diluted earnings per common share $ 0.66 $ 0.66 $ 0.58 $ 0.67 $ 0.64 Adjusted return on average assets 1.09 % 1.16 % 1.02 % 1.14 % 1.09 % Adjusted return on average shareholders' equity 10.01 % 10.33 % 9.31 % 10.85 % 10.45 % Adjusted return on average tangible common equity 14.52 % 15.19 % 13.90 % 16.46 % 16.02 % MIDLAND STATES BANCORP, INC. RECONCILIATIONS OF NON-GAAP FINANCIAL MEASURES For the Quarter Ended 2019 2019 2019 2018 2018 September 30, June 30, March 31, December 31, September 30,

14 14 Efficiency Ratio Reconciliation (dollars in thousands) Noninterest expense - GAAP $ 48,025 $ 40,194 $ 41,097 $ 45,375 $ 50,317 Gain (loss) on mortgage servicing rights held for sale 70 515 - - (270) Integration and acquisition expenses (5,292) (286) (160) (553) (9,559) Adjusted noninterest expense $ 42,803 $ 40,423 $ 40,937 $ 44,822 $ 40,488 Net interest income - GAAP $ 49,450 $ 46,077 $ 45,601 $ 48,535 $ 45,081 Effect of tax-exempt income 502 526 543 574 585 Adjusted net interest income 49,952 46,603 46,144 49,109 45,666 Noninterest income - GAAP $ 19,606 $ 19,587 $ 17,075 $ 21,170 $ 18,272 Loan servicing rights impairment (recapture) 1,060 (559) 25 (1,380) 297 Gain on sales of investment securities, net (25) (14) - (469) - Other - 23 - 1 12 Adjusted noninterest income 20,641 19,037 17,100 19,322 18,581 Adjusted total revenue $ 70,593 $ 65,640 $ 63,244 $ 68,431 $ 64,247 Efficiency ratio 60.63 % 61.58 % 64.73 % 65.50 % 63.02 % MIDLAND STATES BANCORP, INC. RECONCILIATIONS OF NON-GAAP FINANCIAL MEASURES (continued) For the Quarter Ended 2019 2019 2019 2018 2018 September 30, June 30, March 31, December 31, September 30,
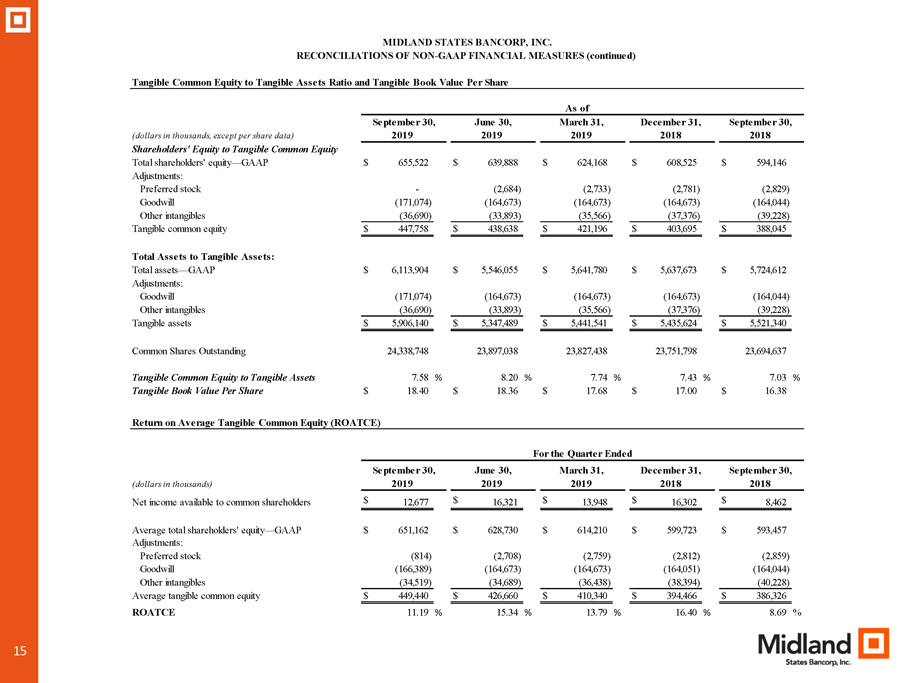
15 15 Tangible Common Equity to Tangible Assets Ratio and Tangible Book Value Per Share (dollars in thousands, except per share data) Shareholders' Equity to Tangible Common Equity Total shareholders' equity—GAAP $ 655,522 $ 639,888 $ 624,168 $ 608,525 $ 594,146 Adjustments: Preferred stock - (2,684) (2,733) (2,781) (2,829) Goodwill (171,074) (164,673) (164,673) (164,673) (164,044) Other intangibles (36,690) (33,893) (35,566) (37,376) (39,228) Tangible common equity $ 447,758 $ 438,638 $ 421,196 $ 403,695 $ 388,045 Total Assets to Tangible Assets: Total assets—GAAP $ 6,113,904 $ 5,546,055 $ 5,641,780 $ 5,637,673 $ 5,724,612 Adjustments: Goodwill (171,074) (164,673) (164,673) (164,673) (164,044) Other intangibles (36,690) (33,893) (35,566) (37,376) (39,228) Tangible assets $ 5,906,140 $ 5,347,489 $ 5,441,541 $ 5,435,624 $ 5,521,340 Common Shares Outstanding 24,338,748 23,897,038 23,827,438 23,751,798 23,694,637 Tangible Common Equity to Tangible Assets 7.58 % 8.20 % 7.74 % 7.43 % 7.03 % Tangible Book Value Per Share $ 18.40 $ 18.36 $ 17.68 $ 17.00 $ 16.38 Return on Average Tangible Common Equity (ROATCE) (dollars in thousands) Net income available to common shareholders $ 12,677 $ 16,321 $ 13,948 $ 16,302 $ 8,462 Average total shareholders' equity—GAAP $ 651,162 $ 628,730 $ 614,210 $ 599,723 $ 593,457 Adjustments: Preferred stock (814) (2,708) (2,759) (2,812) (2,859) Goodwill (166,389) (164,673) (164,673) (164,051) (164,044) Other intangibles (34,519) (34,689) (36,438) (38,394) (40,228) Average tangible common equity $ 449,440 $ 426,660 $ 410,340 $ 394,466 $ 386,326 ROATCE 11.19 % 15.34 % 13.79 % 16.40 % 8.69 % MIDLAND STATES BANCORP, INC. RECONCILIATIONS OF NON-GAAP FINANCIAL MEASURES (continued) As of September 30, June 30, March 31, December 31, September 30, 2019 2019 2019 2018 2018 For the Quarter Ended 2019 2019 2019 2018 2018 September 30, June 30, March 31, December 31, September 30,