Exhibit 99.2

1 Midland States Bancorp, Inc. NASDAQ: MSBI Fourth Quarter 2020 Earnings Call
2 Forward - Looking Statements. This presentation may contain forward - looking statements within the meaning of the federal securities laws. Forward - looking statements expressing management’s current expectations, forecasts of future events or long - te rm goals may be based upon beliefs, expectations and assumptions of Midland’s management, and are generally identifiable by the use of words such as “believe,” “expect,” “anticipate,” “plan,” “intend,” “estimate,” “may,” “will,” “would,” “could,” “should” o r o ther similar expressions. All statements in this presentation speak only as of the date they are made, and Midland undertakes no obligation to update any statement. A number of factors, many of which are beyond the ability of Midland to control or predic t, could cause actual results to differ materially from those in its forward - looking statements including the effects of the Corona virus Disease 2019 (COVID - 19) pandemic, including its potential effects on the economic environment, our customers and our operations, as well as any changes to federal, state or local government laws, regulations or orders in connection with the pandemic. These risks and uncertainties should be considered in evaluating forward - looking statements, and undue reliance should not be placed o n such statements. Additional information concerning Midland and its businesses, including additional factors that could materi all y affect Midland’s financial results, are included in Midland’s filings with the Securities and Exchange Commission. Use of Non - GAAP Financial Measures. This presentation may contain certain financial information determined by methods other than in accordance with accounting principles generally accepted in the United States (“GAAP”). These non - GAAP financial measure s include “Adjusted Earnings,” “Pre - Tax, Pre - Provision Income,” “Adjusted Diluted Earnings Per Share,” “Adjusted Return on Average Assets,” “Adjusted Return on Average Shareholders’ Equity,” “Adjusted Return on Average Tangible Common Equity,” “Adjusted P re - Tax, Provision Return on Average Assets,” “Efficiency Ratio,” “Tangible Common Equity to Tangible Assets,” “Tangible Book Val ue Per Share,” and “Return on Average Tangible Common Equity.” The Company believes that these non - GAAP financial measures provide both management and investors a more complete understanding of the Company’s funding profile and profitability. These non - GAAP financial measures are supplemental and are not a substitute for any analysis based on GAAP financial measures. Not all compa nie s use the same calculation of these measures; therefore this presentation may not be comparable to other similarly titled measu res as presented by other companies. Reconciliations of these non - GAAP measures are provided in the Appendix section of this presentation.
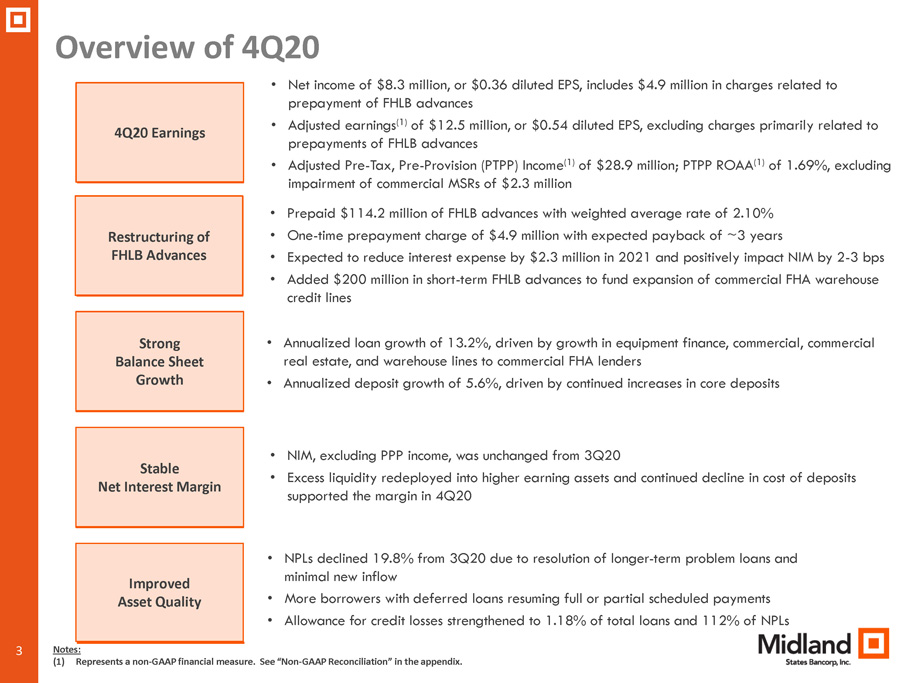
3 Overview of 4Q20 3 Stable Net Interest Margin 4Q20 Earnings Improved Asset Quality • NIM, excluding PPP income, was unchanged from 3Q20 • Excess liquidity redeployed into higher earning assets and continued decline in cost of deposits supported the margin in 4Q20 • NPLs declined 19.8% from 3Q20 due to resolution of longer - term problem loans and minimal new inflow • More borrowers with deferred loans resuming full or partial scheduled payments • Allowance for credit losses strengthened to 1.18% of total loans and 112% of NPLs Strong Balance Sheet Growth • Annualized loan growth of 13.2%, driven by growth in equipment finance, commercial, commercial real estate, and warehouse lines to commercial FHA lenders • Annualized deposit growth of 5.6%, driven by continued increases in core deposits • Net income of $8.3 million, or $0.36 diluted EPS, includes $4.9 million in charges related to prepayment of FHLB advances • Adjusted earnings (1) of $12.5 million, or $0.54 diluted EPS, excluding charges primarily related to prepayments of FHLB advances • Adjusted Pre - Tax, Pre - Provision (PTPP) Income (1) of $28.9 million; PTPP ROAA (1) of 1.69%, excluding impairment of commercial MSRs of $2.3 million Notes: (1) Represents a non - GAAP financial measure. See “Non - GAAP Reconciliation” in the appendix. Restructuring of FHLB Advances • Prepaid $114.2 million of FHLB advances with weighted average rate of 2.10% • One - time prepayment charge of $4.9 million with expected payback of ~3 years • Expected to reduce interest expense by $2.3 million in 2021 and positively impact NIM by 2 - 3 bps • Added $200 million in short - term FHLB advances to fund expansion of commercial FHA warehouse credit lines
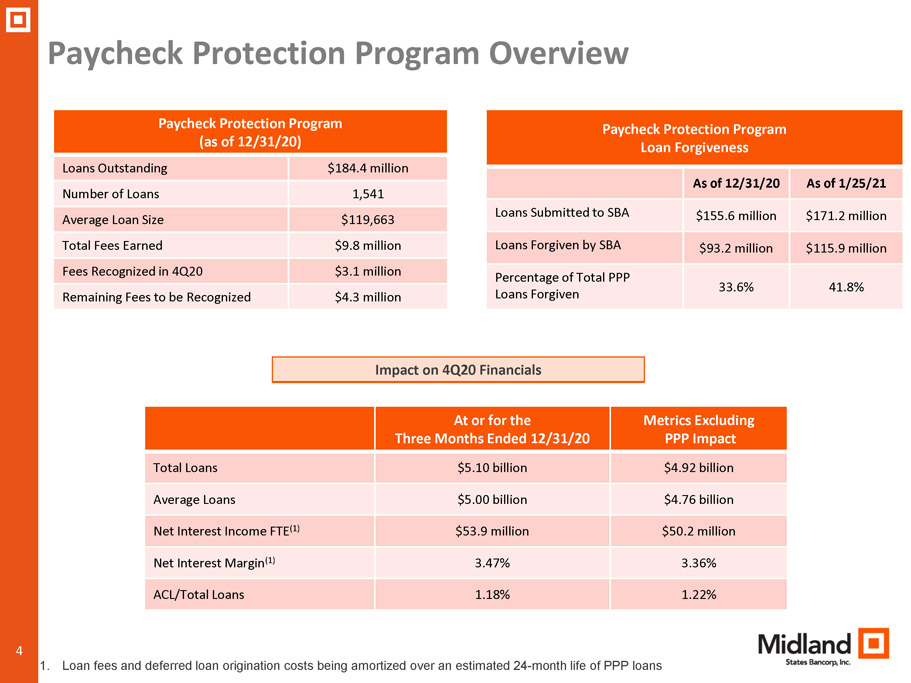
4 Paycheck Protection Program Overview Paycheck Protection Program (as of 12/31/20) Loans Outstanding $184.4 million Number of Loans 1,541 Average Loan Size $119,663 Total Fees Earned $9.8 million Fees Recognized in 4Q20 $3.1 million Remaining Fees to be Recognized $4.3 million Impact on 4Q20 Financials At or for the Three Months Ended 12/31/20 Metrics Excluding PPP Impact Total Loans $5.10 billion $4.92 billion Average Loans $5.00 billion $4.76 billion Net Interest Income FTE (1) $53.9 million $50.2 million Net Interest Margin (1) 3.47% 3.36% ACL/Total Loans 1.18% 1.22% 1. Loan fees and deferred loan origination costs being amortized over an estimated 24 - month life of PPP loans Paycheck Protection Program Loan Forgiveness As of 12/31/20 As of 1/25/21 Loans Submitted to SBA $155.6 million $171.2 million Loans Forgiven by SBA $93.2 million $115.9 million Percentage of Total PPP Loans Forgiven 33.6% 41.8%
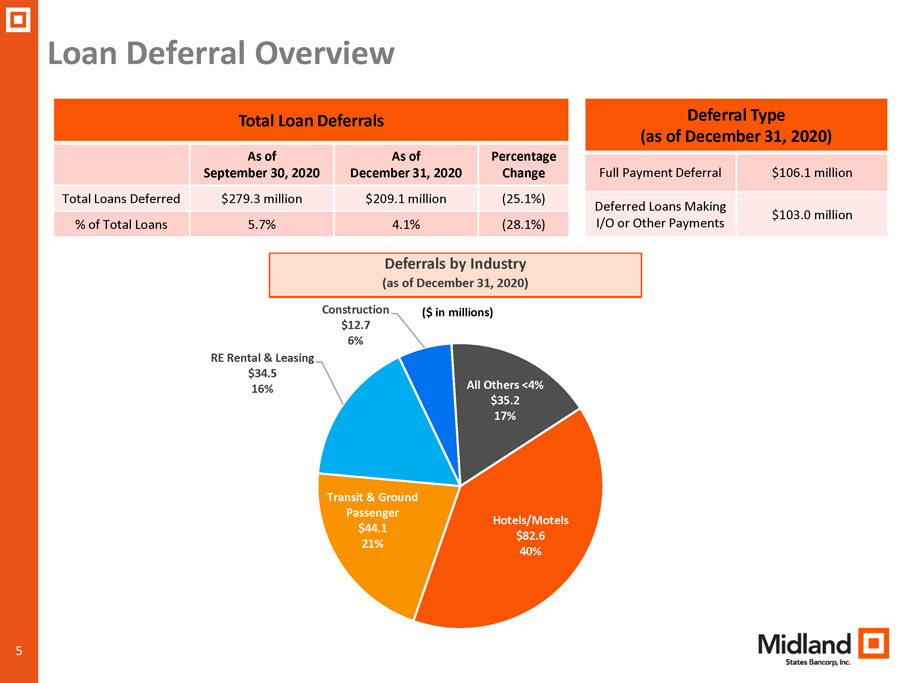
5 Loan Deferral Overview Total Loan Deferrals As of September 30, 2020 As of December 31, 2020 Percentage Change Total Loans Deferred $279.3 million $209.1 million (25.1%) % of Total Loans 5.7% 4.1% (28.1%) Deferrals by Industry (as of December 31, 2020) Hotels/Motels $82.6 40% Transit & Ground Passenger $44.1 21% RE Rental & Leasing $34.5 16% Construction $12.7 6% All Others <4% $35.2 17% ($ in millions) Deferral Type (as of December 31, 2020) Full Payment Deferral $106.1 million Deferred Loans Making I/O or Other Payments $103.0 million
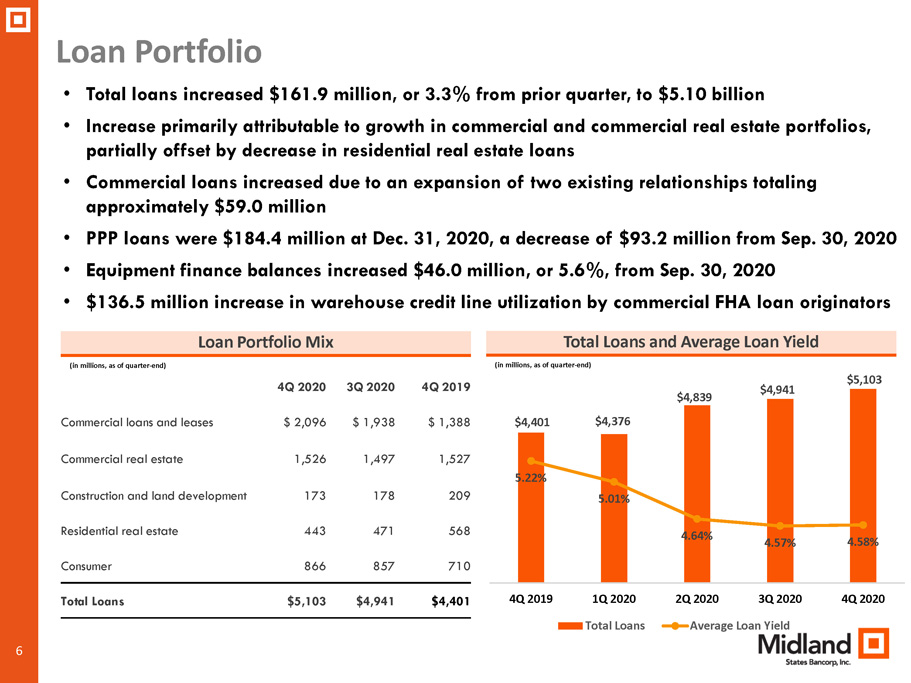
6 4Q 2020 3Q 2020 4Q 2019 Commercial loans and leases $ 2,096 $ 1,938 $ 1,388 Commercial real estate 1,526 1,497 1,527 Construction and land development 173 178 209 Residential real estate 443 471 568 Consumer 866 857 710 Total Loans $5,103 $4,941 $4,401 Loan Portfolio Total Loans and Average Loan Yield • Total loans increased $161.9 million, or 3.3% from prior quarter, to $5.10 billion • Increase primarily attributable to growth in commercial and commercial real estate portfolios, partially offset by decrease in residential real estate loans • Commercial loans increased due to an expansion of two existing relationships totaling approximately $59.0 million • PPP loans were $184.4 million at Dec. 31, 2020, a decrease of $93.2 million from Sep. 30, 2020 • Equipment finance balances increased $46.0 million, or 5.6%, from Sep. 30, 2020 • $136.5 million increase in warehouse credit line utilization by commercial FHA loan originators Loan Portfolio Mix (in millions, as of quarter - end) (in millions, as of quarter - end) $4,401 $4,376 $4,839 $4,941 $5,103 5.22% 5.01% 4.64% 4.57% 4.58% 4Q 2019 1Q 2020 2Q 2020 3Q 2020 4Q 2020 Total Loans Average Loan Yield
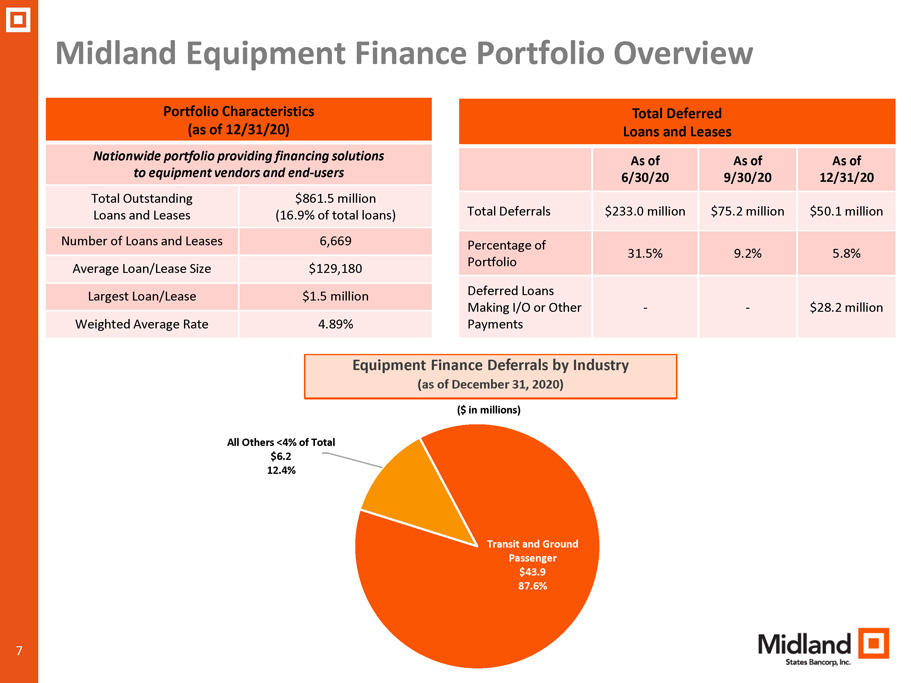
7 Midland Equipment Finance Portfolio Overview ($ in millions) Portfolio Characteristics (as of 12/31/20) Nationwide portfolio providing financing solutions to equipment vendors and end - users Total Outstanding Loans and Leases $861.5 million (16.9% of total loans) Number of Loans and Leases 6,669 Average Loan/Lease Size $129,180 Largest Loan/Lease $1.5 million Weighted Average Rate 4.89% Avg. FICO Score 604 Transit and Ground Passenger $43.9 87.6% All Others <4% of Total $6.2 12.4% Total Deferred Loans and Leases As of 6/30/20 As of 9/30/20 As of 12/31/20 Total Deferrals $233.0 million $75.2 million $50.1 million Percentage of Portfolio 31.5% 9.2% 5.8% Deferred Loans Making I/O or Other Payments - - $28.2 million Equipment Finance Deferrals by Industry (as of December 31, 2020)
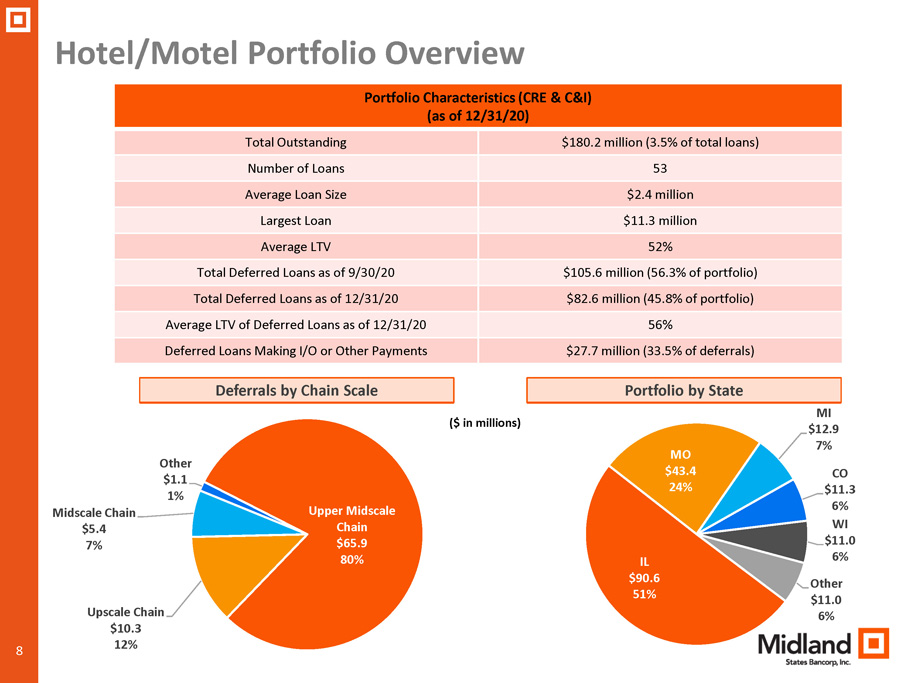
8 Hotel/Motel Portfolio Overview Deferrals by Chain Scale ($ in millions) Upper Midscale Chain $65.9 80% Upscale Chain $10.3 12% Midscale Chain $5.4 7% Other $1.1 1% Portfolio Characteristics (CRE & C&I) (as of 12/31/20) Total Outstanding $180.2 million (3.5% of total loans) Number of Loans 53 Average Loan Size $2.4 million Largest Loan $11.3 million Average LTV 52% Total Deferred Loans as of 9/30/20 $105.6 million (56.3% of portfolio) Total Deferred Loans as of 12/31/20 $82.6 million (45.8% of portfolio) Average LTV of Deferred Loans as of 12/31/20 56% Deferred Loans Making I/O or Other Payments $27.7 million (33.5% of deferrals) Portfolio by State IL $90.6 51% MO $43.4 24% MI $12.9 7% CO $11.3 6% WI $11.0 6% Other $11.0 6%
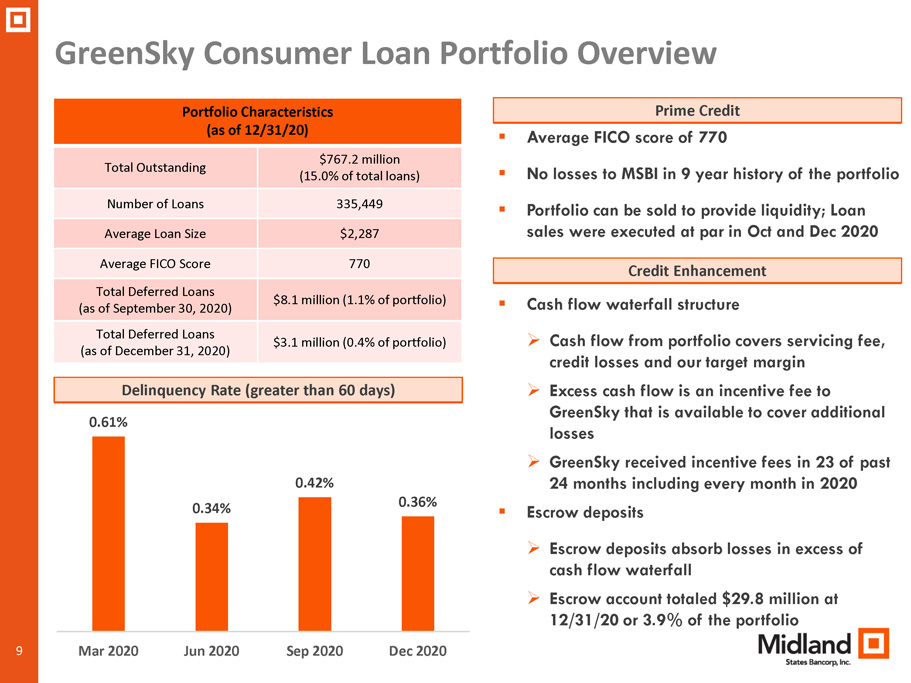
9 GreenSky Consumer Loan Portfolio Overview Delinquency Rate (greater than 60 days) Portfolio Characteristics (as of 12/31/20) Total Outstanding $767.2 million (15.0% of total loans) Number of Loans 335,449 Average Loan Size $2,287 Average FICO Score 770 Total Deferred Loans (as of September 30, 2020) $8.1 million (1.1% of portfolio) Total Deferred Loans (as of December 31, 2020) $3.1 million (0.4% of portfolio) ▪ Average FICO score of 770 ▪ No losses to MSBI in 9 year history of the portfolio ▪ Portfolio can be sold to provide liquidity; Loan sales were executed at par in Oct and Dec 2020 Prime Credit 0.61% 0.34% 0.42% 0.36% Mar 2020 Jun 2020 Sep 2020 Dec 2020 ▪ Cash flow waterfall structure » Cash flow from portfolio covers servicing fee, credit losses and our target margin » Excess cash flow is an incentive fee to GreenSky that is available to cover additional losses » GreenSky received incentive fees in 23 of past 24 months including every month in 2020 ▪ Escrow deposits » Escrow deposits absorb losses in excess of cash flow waterfall » Escrow account totaled $29.8 million at 12/31/20 or 3.9% of the portfolio Credit Enhancement
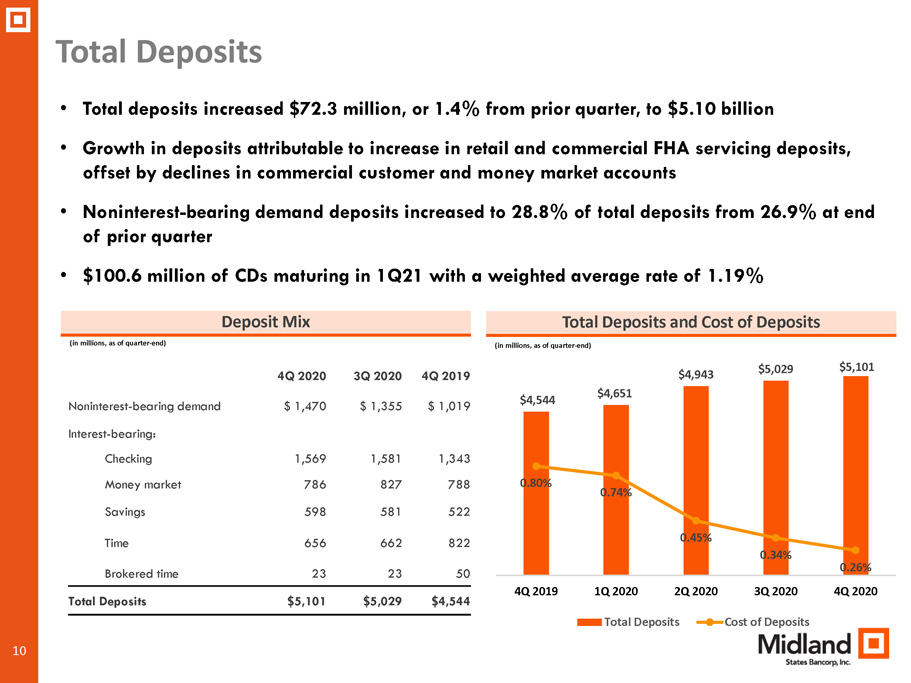
10 4Q 2020 3Q 2020 4Q 2019 Noninterest - bearing demand $ 1,470 $ 1,355 $ 1,019 Interest - bearing: Checking 1,569 1,581 1,343 Money market 786 827 788 Savings 598 581 522 Time 656 662 822 Brokered time 23 23 50 Total Deposits $5,101 $5,029 $4,544 Total Deposits Total Deposits and Cost of Deposits • Total deposits increased $72.3 million, or 1.4% from prior quarter, to $5.10 billion • Growth in deposits attributable to increase in retail and commercial FHA servicing deposits, offset by declines in commercial customer and money market accounts • Noninterest - bearing demand deposits increased to 28.8% of total deposits from 26.9% at end of prior quarter • $100.6 million of CDs maturing in 1Q21 with a weighted average rate of 1.19% Deposit Mix (in millions, as of quarter - end) (in millions, as of quarter - end) $4,544 $4,651 $4,943 $5,029 $5,101 0.80% 0.74% 0.45% 0.34% 0.26% 4Q 2019 1Q 2020 2Q 2020 3Q 2020 4Q 2020 Total Deposits Cost of Deposits
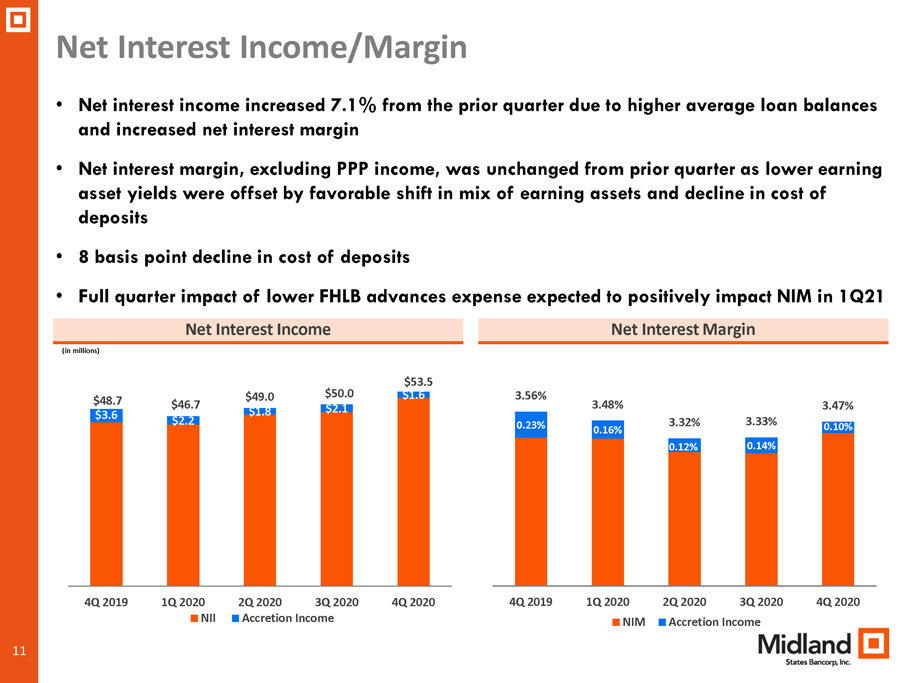
11 $3.6 $2.2 $1.8 $2.1 $1.6 $48.7 $46.7 $49.0 $50.0 $53.5 4Q 2019 1Q 2020 2Q 2020 3Q 2020 4Q 2020 NII Accretion Income 0.23% 0.16% 0.12% 0.14% 0.10% 3.56% 3.48% 3.32% 3.33% 3.47% 4Q 2019 1Q 2020 2Q 2020 3Q 2020 4Q 2020 NIM Accretion Income • Net interest income increased 7.1% from the prior quarter due to higher average loan balances and increased net interest margin • Net interest margin, excluding PPP income, was unchanged from prior quarter as lower earning asset yields were offset by favorable shift in mix of earning assets and decline in cost of deposits • 8 basis point decline in cost of deposits • Full quarter impact of lower FHLB advances expense expected to positively impact NIM in 1Q21 Net Interest Income/Margin Net Interest Margin Net Interest Income (in millions)
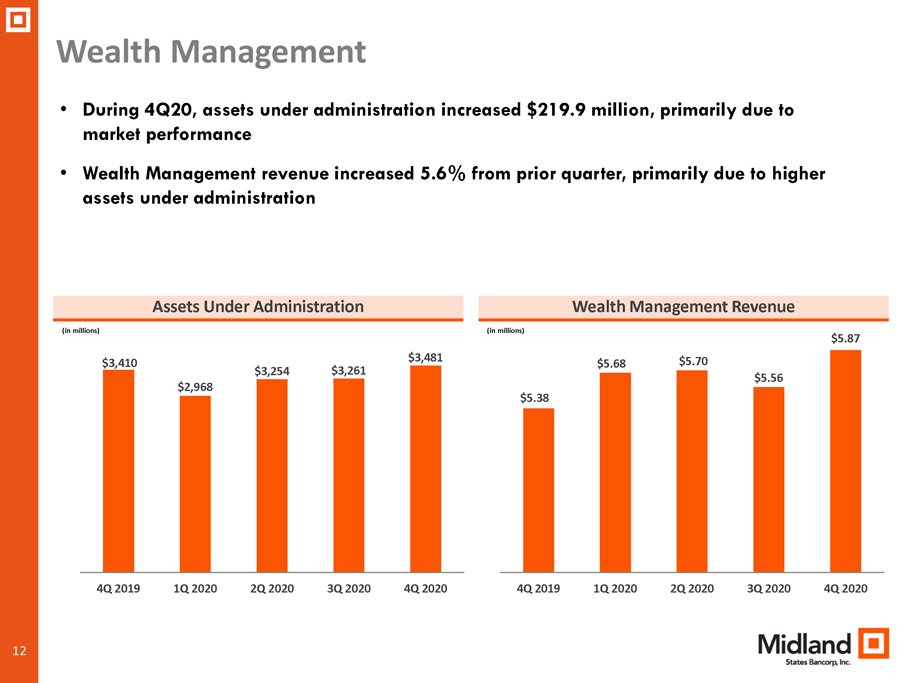
12 $5.38 $5.68 $5.70 $5.56 $5.87 4Q 2019 1Q 2020 2Q 2020 3Q 2020 4Q 2020 $3,410 $2,968 $3,254 $3,261 $3,481 4Q 2019 1Q 2020 2Q 2020 3Q 2020 4Q 2020 • During 4Q20, assets under administration increased $219.9 million, primarily due to market performance • Wealth Management revenue increased 5.6% from prior quarter, primarily due to higher assets under administration Wealth Management Wealth Management Revenue Assets Under Administration (in millions) (in millions )
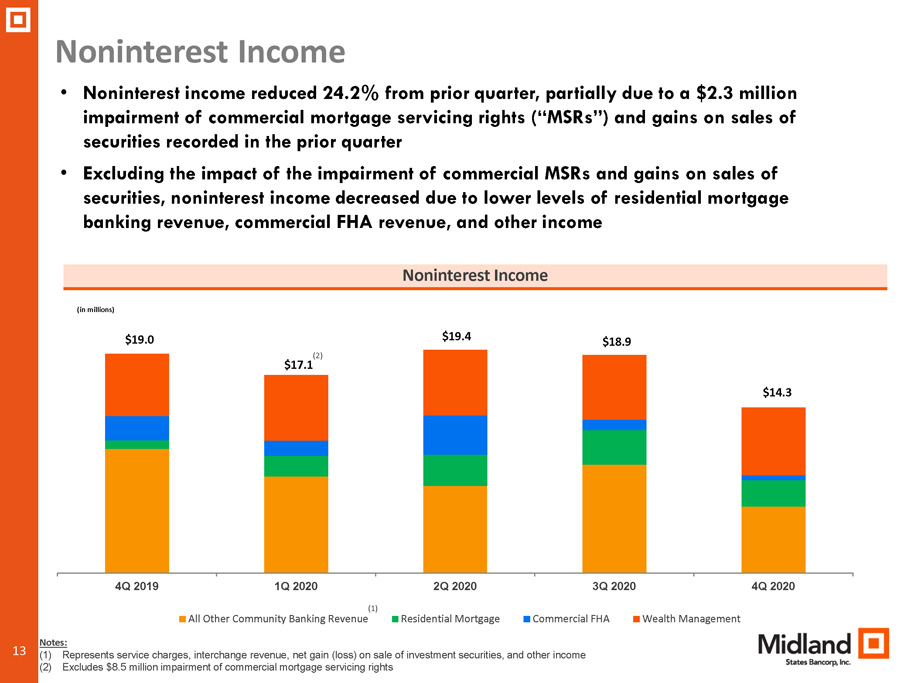
13 Noninterest Income • Noninterest income reduced 24.2% from prior quarter, partially due to a $2.3 million impairment of commercial mortgage servicing rights (“MSRs”) and gains on sales of securities recorded in the prior quarter • Excluding the impact of the impairment of commercial MSRs and gains on sales of securities, noninterest income decreased due to lower levels of residential mortgage banking revenue, commercial FHA revenue, and other income Noninterest Income (in millions) $19.0 $17.1 $19.4 $18.9 $14.3 4Q 2019 1Q 2020 2Q 2020 3Q 2020 4Q 2020 All Other Community Banking Revenue Residential Mortgage Commercial FHA Wealth Management Notes: (1) Represents service charges, interchange revenue, net gain (loss) on sale of investment securities, and other income (2) Excludes $8.5 million impairment of commercial mortgage servicing rights (1) (2)
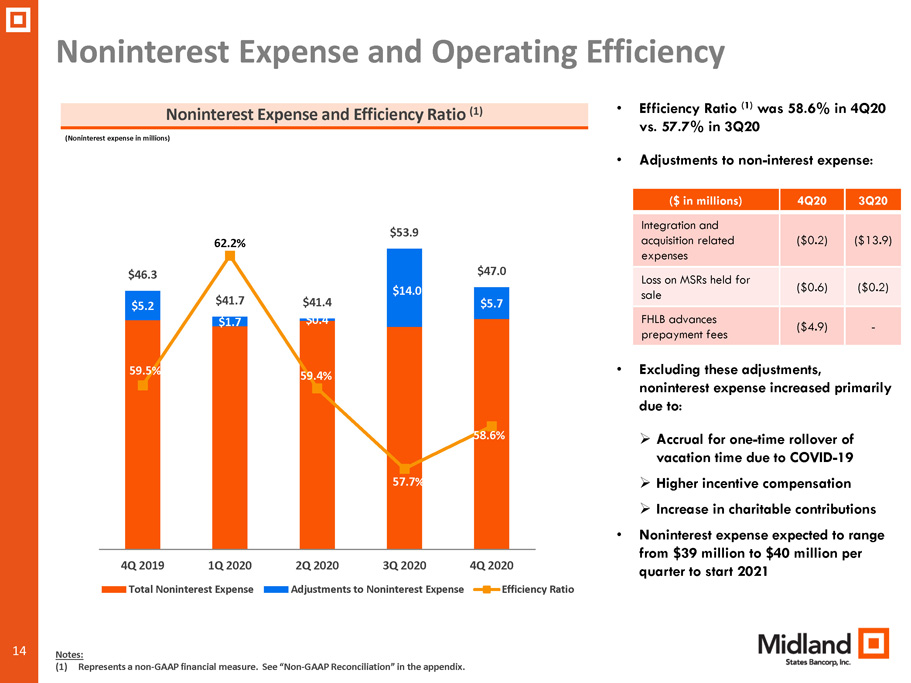
14 Noninterest Expense and Operating Efficiency • Efficiency Ratio (1) was 58.6% in 4Q20 vs. 57.7% in 3Q20 • Adjustments to non - interest expense: • Excluding these adjustments, noninterest expense increased primarily due to: » Accrual for one - time rollover of vacation time due to COVID - 19 » Higher incentive compensation » Increase in charitable contributions • Noninterest expense expected to range from $39 million to $40 million per quarter to start 2021 Noninterest Expense and Efficiency Ratio (1) (Noninterest expense in millions) $5.2 $1.7 $0.4 $14.0 $5.7 $46.3 $41.7 $41.4 $53.9 $47.0 59.5% 62.2% 59.4% 57.7% 58.6% 56.0% 4Q 2019 1Q 2020 2Q 2020 3Q 2020 4Q 2020 Total Noninterest Expense Adjustments to Noninterest Expense Efficiency Ratio Notes: (1) Represents a non - GAAP financial measure. See “Non - GAAP Reconciliation” in the appendix. ($ in millions) 4 Q20 3Q20 Integration and acquisition related expenses ($0.2) ($13.9) Loss on MSRs held for sale ($0.6) ($0.2) FHLB advances prepayment fees ($4.9) -
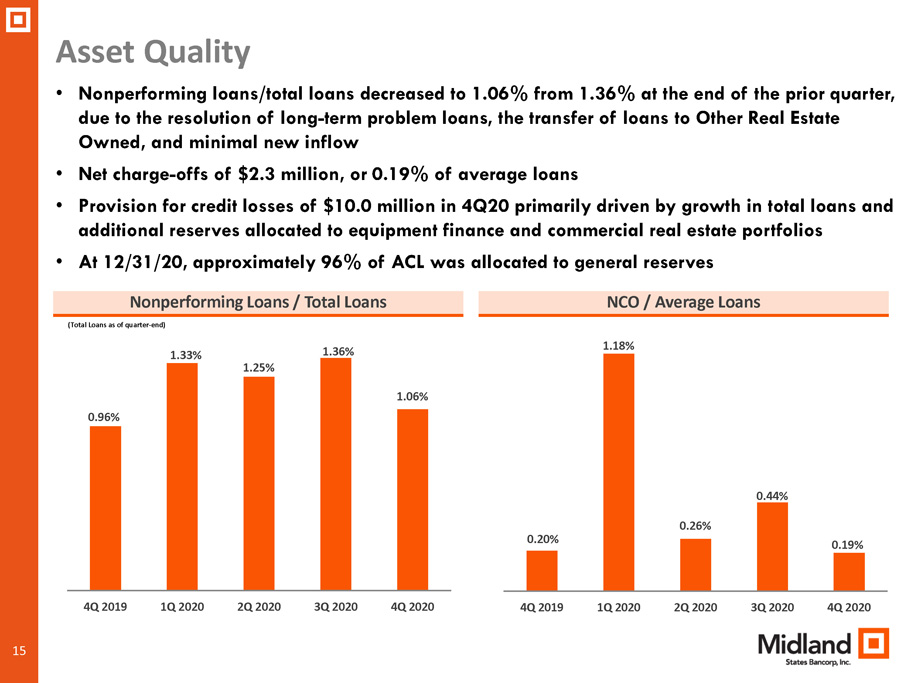
15 Asset Quality NCO / Average Loans • Nonperforming loans/total loans decreased to 1.06% from 1.36% at the end of the prior quarter, due to the resolution of long - term problem loans, the transfer of loans to Other Real Estate Owned, and minimal new inflow • Net charge - offs of $2.3 million, or 0.19% of average loans • Provision for credit losses of $10.0 million in 4Q20 primarily driven by growth in total loans and additional reserves allocated to equipment finance and commercial real estate portfolios • At 12/31/20, approximately 96% of ACL was allocated to general reserves Nonperforming Loans / Total Loans (Total Loans as of quarter - end) 0.96% 1.33% 1.25% 1.36% 1.06% 4Q 2019 1Q 2020 2Q 2020 3Q 2020 4Q 2020 0.20% 1.18% 0.26% 0.44% 0.19% 4Q 2019 1Q 2020 2Q 2020 3Q 2020 4Q 2020

16 Changes in Allowance for Credit Losses ACL 9/30/20 ACL 12/31/20 ($ in thousands) Specific Reserves Portfolio Changes Economic Factors ▪ Changes to specific reserves ▪ New loans ▪ Changes in credit quality including risk downgrades and deferrals ▪ Changes in allocations to COVID - 19 impacted segments ▪ Aging of existing portfolio ▪ Other charge - offs and recoveries ▪ Changes to macro - economic variables and forecasts ▪ Changes to other economic qualitative factors
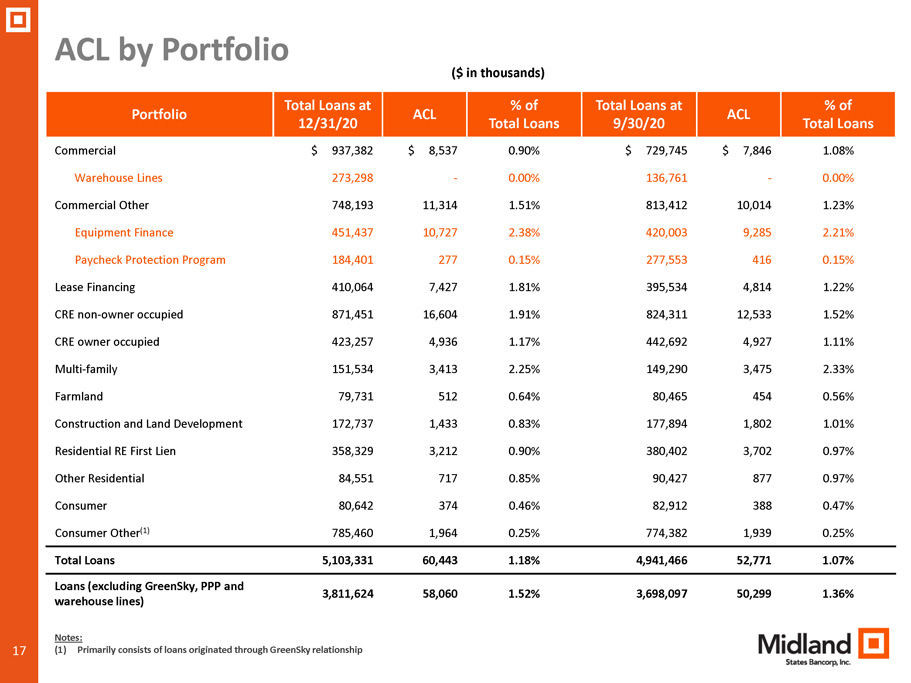
17 ACL by Portfolio Portfolio Total Loans at 12/31/20 ACL % of Total Loans Total Loans at 9/30/20 ACL % of Total Loans Commercial $ 937,382 $ 8,537 0.90% $ 729,745 $ 7,846 1.08% Warehouse Lines 273,298 - 0.00% 136,761 - 0.00% Commercial Other 748,193 11,314 1.51% 813,412 10,014 1.23% Equipment Finance 451,437 10,727 2.38% 420,003 9,285 2.21% Paycheck Protection Program 184,401 277 0.15% 277,553 416 0.15% Lease Financing 410,064 7,427 1.81% 395,534 4,814 1.22% CRE non - owner occupied 871,451 16,604 1.91% 824,311 12,533 1.52% CRE owner occupied 423,257 4,936 1.17% 442,692 4,927 1.11% Multi - family 151,534 3,413 2.25% 149,290 3,475 2.33% Farmland 79,731 512 0.64% 80,465 454 0.56% Construction and Land Development 172,737 1,433 0.83% 177,894 1,802 1.01% Residential RE First Lien 358,329 3,212 0.90% 380,402 3,702 0.97% Other Residential 84,551 717 0.85% 90,427 877 0.97% Consumer 80,642 374 0.46% 82,912 388 0.47% Consumer Other (1) 785,460 1,964 0.25% 774,382 1,939 0.25% Total Loans 5,103,331 60,443 1.18% 4,941,466 52,771 1.07% Loans (excluding GreenSky, PPP and warehouse lines) 3,811,624 58,060 1.52% 3,698,097 50,299 1.36% ($ in thousands) Notes: (1) Primarily consists of loans originated through GreenSky relationship
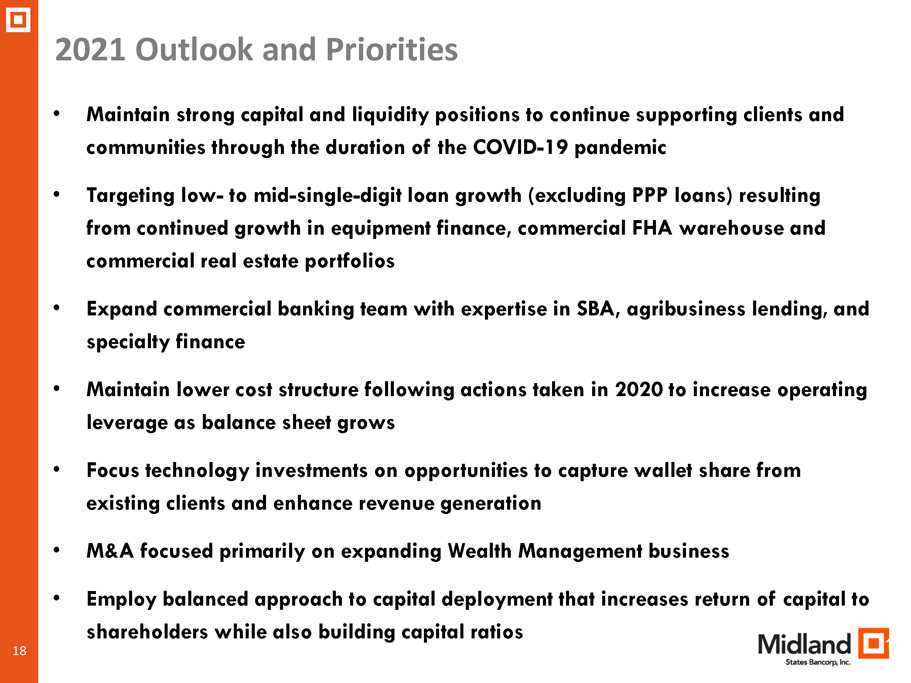
18 2021 Outlook and Priorities • Maintain strong capital and liquidity positions to continue supporting clients and communities through the duration of the COVID - 19 pandemic • Targeting low - to mid - single - digit loan growth (excluding PPP loans) resulting from continued growth in equipment finance, commercial FHA warehouse and commercial real estate portfolios • Expand commercial banking team with expertise in SBA, agribusiness lending, and specialty finance • Maintain lower cost structure following actions taken in 2020 to increase operating leverage as balance sheet grows • Focus technology investments on opportunities to capture wallet share from existing clients and enhance revenue generation • M&A focused primarily on expanding Wealth Management business • Employ balanced approach to capital deployment that increases return of capital to shareholders while also building capital ratios 18

19 APPENDIX
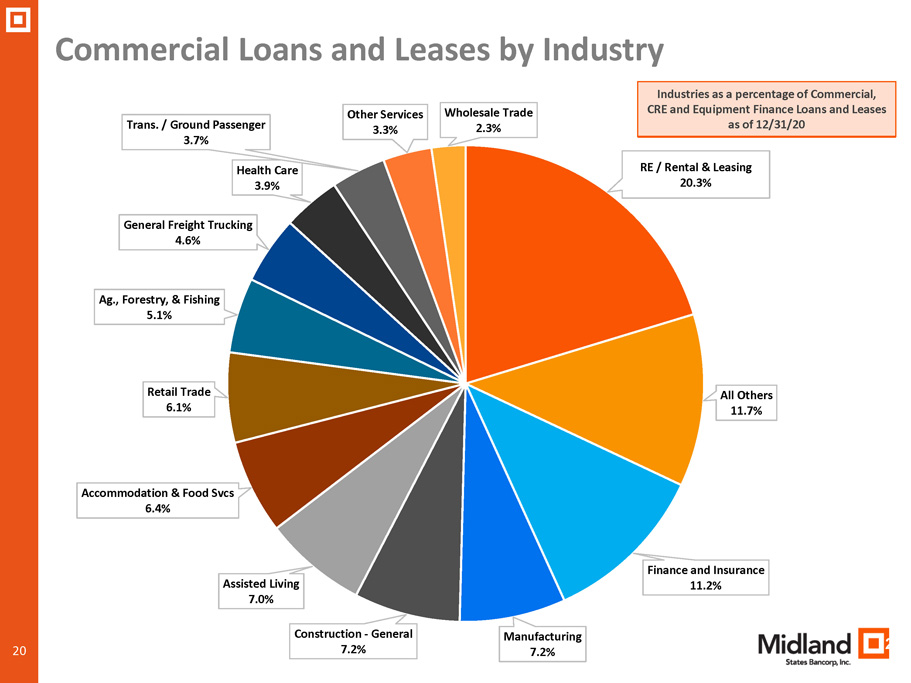
20 Commercial Loans and Leases by Industry 20 RE / Rental & Leasing 20.3% All Others 11.7% Finance and Insurance 11.2% Manufacturing 7.2% Construction - General 7.2% Assisted Living 7.0% Accommodation & Food Svcs 6.4% Retail Trade 6.1% Ag., Forestry, & Fishing 5.1% General Freight Trucking 4.6% Health Care 3.9% Trans. / Ground Passenger 3.7% Other Services 3.3% Wholesale Trade 2.3% Industries as a percentage of Commercial, CRE and Equipment Finance Loans and Leases as of 12/31/20
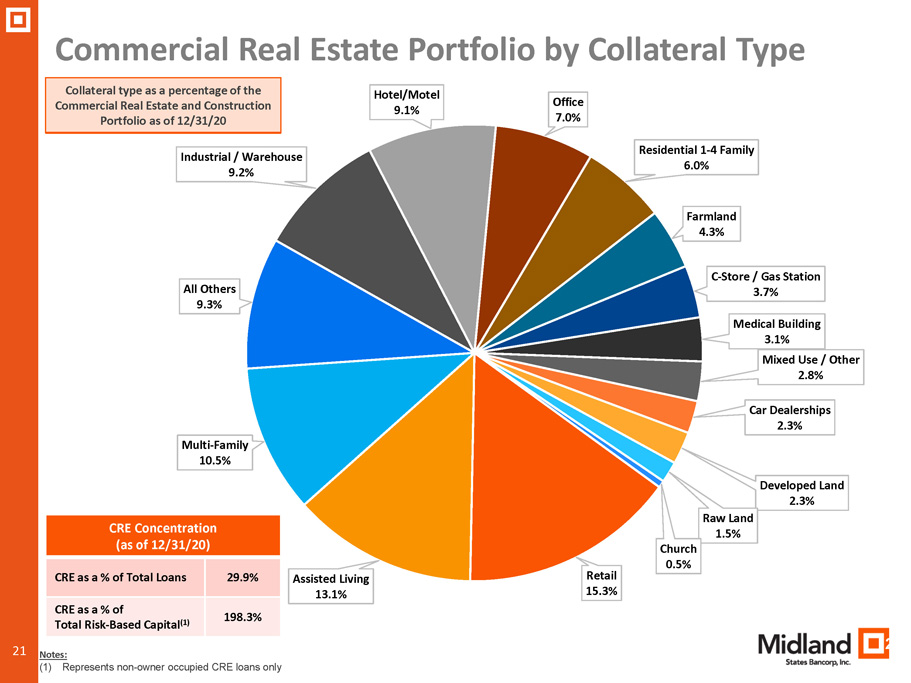
21 Commercial Real Estate Portfolio by Collateral Type 21 Retail 15.3% Assisted Living 13.1% Multi - Family 10.5% All Others 9.3% Industrial / Warehouse 9.2% Hotel/Motel 9.1% Office 7.0% Residential 1 - 4 Family 6.0% Farmland 4.3% C - Store / Gas Station 3.7% Medical Building 3.1% Mixed Use / Other 2.8% Car Dealerships 2.3% Developed Land 2.3% Raw Land 1.5% Church 0.5% Collateral type as a percentage of the Commercial Real Estate and Construction Portfolio as of 12/31/20 CRE Concentration (as of 12/31/20) CRE as a % of Total Loans 29.9% CRE as a % of Total Risk - Based Capital (1) 198.3% Notes: (1) Represents non - owner occupied CRE loans only
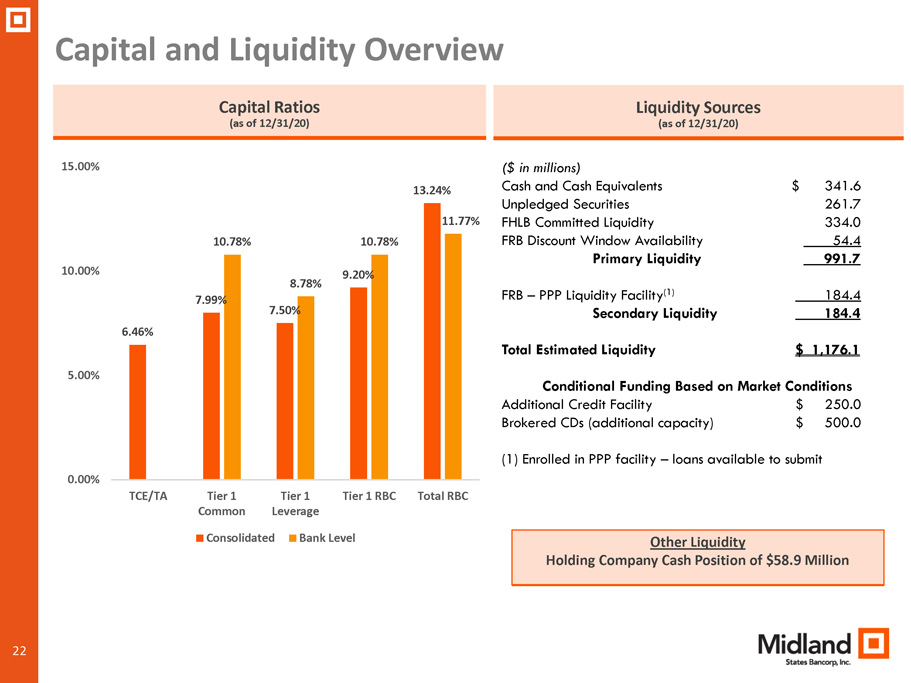
22 Capital and Liquidity Overview Capital Ratios (as of 12/31/20) Liquidity Sources (as of 12/31/20) 6.46% 7.99% 7.50% 9.20% 13.24% 10.78% 8.78% 10.78% 11.77% 0.00% 5.00% 10.00% 15.00% TCE/TA Tier 1 Common Tier 1 Leverage Tier 1 RBC Total RBC Consolidated Bank Level ($ in millions) Cash and Cash Equivalents $ 341.6 Unpledged Securities 261.7 FHLB Committed Liquidity 334.0 FRB Discount Window Availability 54.4 Primary Liquidity 991.7 FRB – PPP Liquidity Facility (1) 184.4 Secondary Liquidity 184.4 Total Estimated Liquidity $ 1,176.1 Conditional Funding Based on Market Conditions Additional Credit Facility $ 250.0 Brokered CDs (additional capacity) $ 500.0 (1) Enrolled in PPP facility – loans available to submit Other Liquidity Holding Company Cash Position of $58.9 Million

23 Adjusted Earnings Reconciliation (dollars in thousands, except per share data) Income before income taxes - GAAP $ 10,746 $ 3,270 $ 15,993 $ 2,005 $ 16,071 Adjustments to noninterest income: Gain on sales of investment securities, net - 1,721 - - 635 Other 3 (17) 11 (13) (6) Total adjustments to noninterest income 3 1,704 11 (13) 629 Adjustments to noninterest expense: Loss on mortgage servicing rights held for sale 617 188 391 496 95 Loss on repurchase of subordinated debt - - - 193 1,778 Impairment related to facilities optimization (10) 12,651 60 146 - FHLB advances prepayment fees 4,872 - - - - Integration and acquisition expenses 231 1,200 (6) 886 3,333 Total adjustments to noninterest expense 5,710 14,039 445 1,721 5,206 Adjusted earnings pre tax 16,453 15,605 16,427 3,739 20,648 Adjusted earnings tax 3,982 3,582 3,543 933 4,538 Adjusted earnings - non-GAAP $ 12,471 $ 12,023 $ 12,884 $ 2,806 $ 16,110 Adjusted diluted earnings per common share $ 0.54 $ 0.52 $ 0.55 $ 0.11 $ 0.64 Adjusted return on average assets 0.73 % 0.72 % 0.78 % 0.19 % 1.04 % Adjusted return on average shareholders' equity 7.97 % 7.56 % 8.20 % 1.73 % 9.71 % Adjusted return on average tangible common equity 11.50 % 11.04 % 12.14 % 2.53 % 14.15 % Adjusted Pre-Tax, Pre-Provision Earnings Reconciliation (dollars in thousands) Adjusted earnings pre tax - non- GAAP $ 16,453 $ 15,605 $ 16,427 $ 3,739 $ 20,648 Provision for credit losses 10,058 11,728 10,997 11,578 5,305 Impairment on commercial mortgage servicing rights 2,344 1,418 107 8,468 1,613 Adjusted pre-tax, pre-provision earnings - non-GAAP $ 28,855 $ 28,751 $ 27,531 $ 23,785 $ 27,566 Adjusted pre-tax, pre-provision return on average assets 1.69 % 1.72 % 1.68 % 1.58 % 1.79 % For the Quarter Ended 2020 2020 2020 2020 2019 December 31, September 30, June 30, March 31, December 31, MIDLAND STATES BANCORP, INC.RECONCILIATIONS OF NON-GAAP FINANCIAL MEASURES (unaudited) For the Quarter Ended March 31, 2020 December 31, 2019 December 31, 2020 September 30, 2020 June 30, 2020
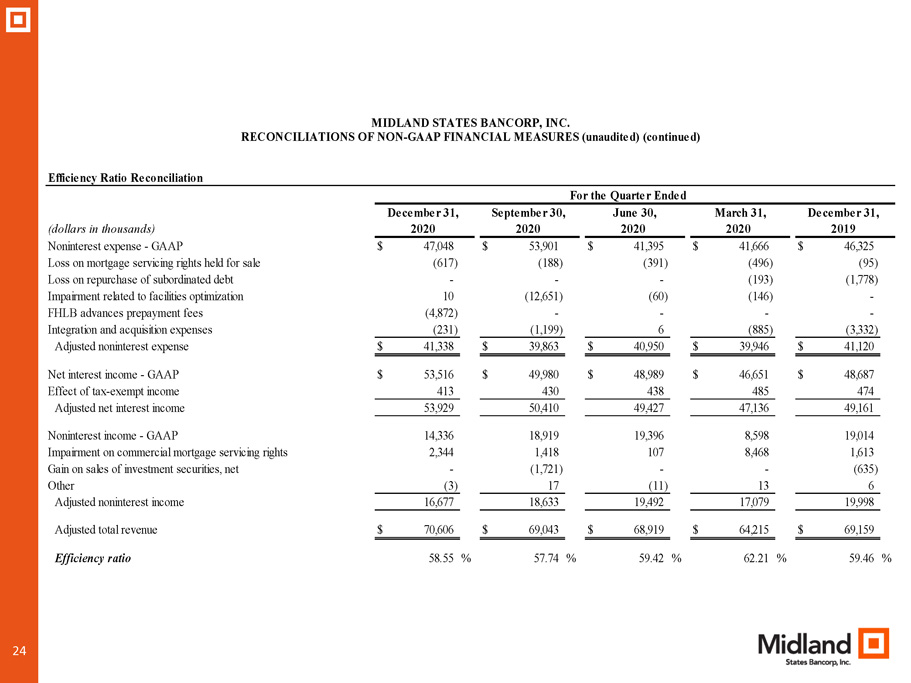
24 Efficiency Ratio Reconciliation (dollars in thousands) Noninterest expense - GAAP $ 47,048 $ 53,901 $ 41,395 $ 41,666 $ 46,325 Loss on mortgage servicing rights held for sale (617) (188) (391) (496) (95) Loss on repurchase of subordinated debt - - - (193) (1,778) Impairment related to facilities optimization 10 (12,651) (60) (146) - FHLB advances prepayment fees (4,872) - - - - Integration and acquisition expenses (231) (1,199) 6 (885) (3,332) Adjusted noninterest expense $ 41,338 $ 39,863 $ 40,950 $ 39,946 $ 41,120 Net interest income - GAAP $ 53,516 $ 49,980 $ 48,989 $ 46,651 $ 48,687 Effect of tax-exempt income 413 430 438 485 474 Adjusted net interest income 53,929 50,410 49,427 47,136 49,161 Noninterest income - GAAP 14,336 18,919 19,396 8,598 19,014 Impairment on commercial mortgage servicing rights 2,344 1,418 107 8,468 1,613 Gain on sales of investment securities, net - (1,721) - - (635) Other (3) 17 (11) 13 6 Adjusted noninterest income 16,677 18,633 19,492 17,079 19,998 Adjusted total revenue $ 70,606 $ 69,043 $ 68,919 $ 64,215 $ 69,159 Efficiency ratio 58.55 % 57.74 % 59.42 % 62.21 % 59.46 % MIDLAND STATES BANCORP, INC.RECONCILIATIONS OF NON-GAAP FINANCIAL MEASURES (unaudited) (continued) For the Quarter Ended 2020 2020 2020 2020 2019 December 31, September 30, June 30, March 31, December 31,
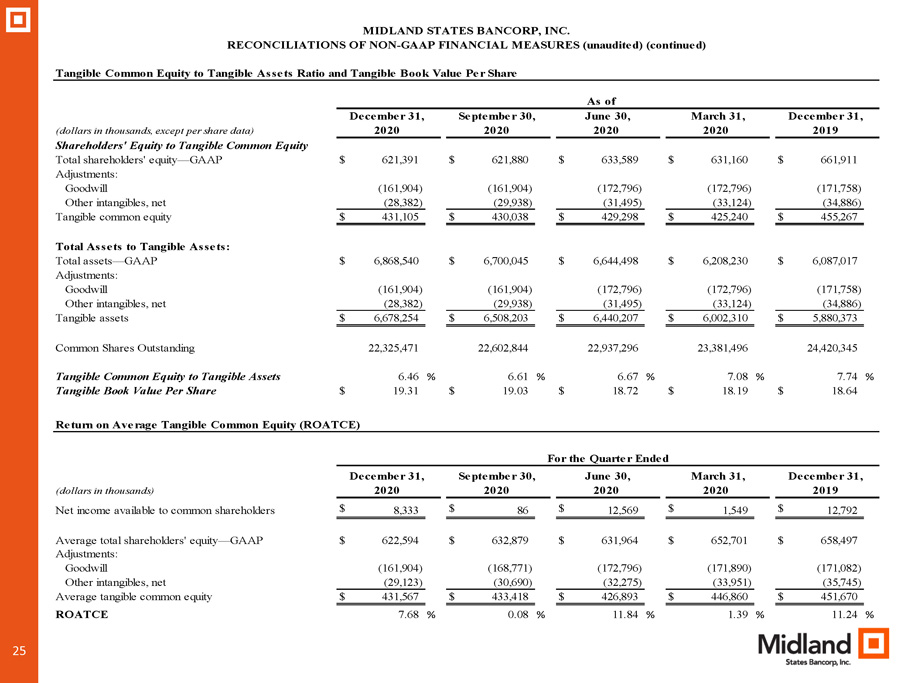
25 Tangible Common Equity to Tangible Assets Ratio and Tangible Book Value Per Share (dollars in thousands, except per share data) Shareholders' Equity to Tangible Common Equity Total shareholders' equity—GAAP $ 621,391 $ 621,880 $ 633,589 $ 631,160 $ 661,911 Adjustments: Goodwill (161,904) (161,904) (172,796) (172,796) (171,758) Other intangibles, net (28,382) (29,938) (31,495) (33,124) (34,886) Tangible common equity $ 431,105 $ 430,038 $ 429,298 $ 425,240 $ 455,267 Total Assets to Tangible Assets: Total assets—GAAP $ 6,868,540 $ 6,700,045 $ 6,644,498 $ 6,208,230 $ 6,087,017 Adjustments: Goodwill (161,904) (161,904) (172,796) (172,796) (171,758) Other intangibles, net (28,382) (29,938) (31,495) (33,124) (34,886) Tangible assets $ 6,678,254 $ 6,508,203 $ 6,440,207 $ 6,002,310 $ 5,880,373 Common Shares Outstanding 22,325,471 22,602,844 22,937,296 23,381,496 24,420,345 Tangible Common Equity to Tangible Assets 6.46 % 6.61 % 6.67 % 7.08 % 7.74 % Tangible Book Value Per Share $ 19.31 $ 19.03 $ 18.72 $ 18.19 $ 18.64 Return on Average Tangible Common Equity (ROATCE) (dollars in thousands) Net income available to common shareholders $ 8,333 $ 86 $ 12,569 $ 1,549 $ 12,792 Average total shareholders' equity—GAAP $ 622,594 $ 632,879 $ 631,964 $ 652,701 $ 658,497 Adjustments: Goodwill (161,904) (168,771) (172,796) (171,890) (171,082) Other intangibles, net (29,123) (30,690) (32,275) (33,951) (35,745) Average tangible common equity $ 431,567 $ 433,418 $ 426,893 $ 446,860 $ 451,670 ROATCE 7.68 % 0.08 % 11.84 % 1.39 % 11.24 % For the Quarter Ended 2020 2020 2020 2020 2019 December 31, September 30, June 30, March 31, December 31, 2020 2020 2020 2020 2019 MIDLAND STATES BANCORP, INC. RECONCILIATIONS OF NON-GAAP FINANCIAL MEASURES (unaudited) (continued) As of December 31, September 30, June 30, March 31, December 31,