Exhibit 99.2

1 Midland States Bancorp, Inc. NASDAQ: MSBI First Quarter 2021 Earnings Call
2 Forward - Looking Statements. This presentation may contain forward - looking statements within the meaning of the federal securities laws. Forward - looking statements expressing management’s current expectations, forecasts of future events or long - te rm goals may be based upon beliefs, expectations and assumptions of Midland’s management, and are generally identifiable by the use of words such as “believe,” “expect,” “anticipate,” “plan,” “intend,” “estimate,” “may,” “will,” “would,” “could,” “should” o r o ther similar expressions. All statements in this presentation speak only as of the date they are made, and Midland undertakes no obligation to update any statement. A number of factors, many of which are beyond the ability of Midland to control or predic t, could cause actual results to differ materially from those in its forward - looking statements including the effects of the Corona virus Disease 2019 (“COVID - 19”) pandemic, including its potential effects on the economic environment, our customers and our operations, as well as any changes to federal, state or local government laws, regulations or orders in connection with the pandemic. These risks and uncertainties should be considered in evaluating forward - looking statements, and undue reliance shoul d not be placed on such statements. Additional information concerning Midland and its businesses, including additional factors tha t could materially affect Midland’s financial results, are included in Midland’s filings with the Securities and Exchange Commi ssi on. Use of Non - GAAP Financial Measures. This presentation may contain certain financial information determined by methods other than in accordance with accounting principles generally accepted in the United States (“GAAP”). These non - GAAP financial measure s include “Adjusted Earnings,” “Adjusted Pre - Tax, Pre - Provision Income,” “Adjusted Diluted Earnings Per Share,” “Adjusted Return o n Average Assets,” “Adjusted Return on Average Shareholders’ Equity,” “Adjusted Return on Average Tangible Common Equity,” “Adjusted Pre - Tax, Provision Return on Average Assets,” “Efficiency Ratio,” “Tangible Common Equity to Tangible Assets,” “Tangib le Book Value Per Share,” and “Return on Average Tangible Common Equity.” The Company believes that these non - GAAP financial measures provide both management and investors a more complete understanding of the Company’s funding profile and profitability. These non - GAAP financial measures are supplemental and are not a substitute for any analysis based on GAAP financ ial measures. Not all companies use the same calculation of these measures; therefore this presentation may not be comparable to other similarly titled measures as presented by other companies. Reconciliations of these non - GAAP measures are provided in the Appendix section of this presentation.
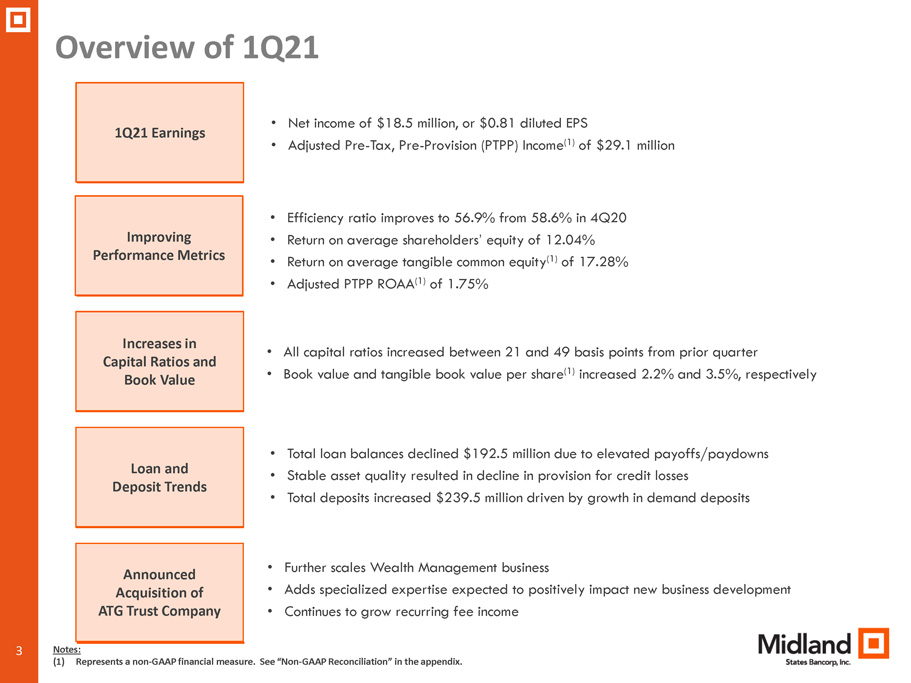
3 Overview of 1Q21 3 Loan and Deposit Trends 1Q21 Earnings Announced Acquisition of ATG Trust Company • Total loan balances declined $192.5 million due to elevated payoffs/paydowns • Stable asset quality resulted in decline in provision for credit losses • Total deposits increased $239.5 million driven by growth in demand deposits • Further scales Wealth Management business • Adds specialized expertise expected to positively impact new business development • Continues to grow recurring fee income Increases in Capital Ratios and Book Value • All capital ratios increased between 21 and 49 basis points from prior quarter • Book value and tangible book value per share (1) increased 2.2% and 3.5%, respectively • Net income of $18.5 million, or $0.81 diluted EPS • Adjusted Pre - Tax, Pre - Provision (PTPP) Income (1) of $29.1 million Notes: (1) Represents a non - GAAP financial measure. See “Non - GAAP Reconciliation” in the appendix. Improving Performance Metrics • Efficiency ratio improves to 56.9% from 58.6% in 4Q20 • Return on average shareholders’ equity of 12.04% • Return on average tangible common equity (1) of 17.28% • Adjusted PTPP ROAA (1) of 1.75%
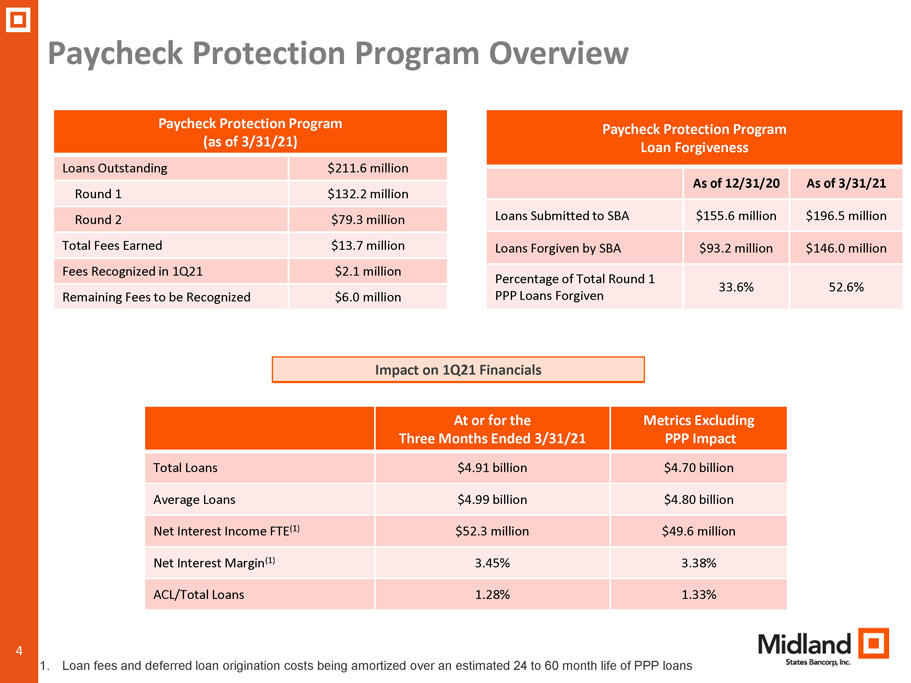
4 Paycheck Protection Program Overview Paycheck Protection Program (as of 3/31/21) Loans Outstanding $211.6 million Round 1 $132.2 million Round 2 $79.3 million Total Fees Earned $13.7 million Fees Recognized in 1Q21 $2.1 million Remaining Fees to be Recognized $6.0 million Impact on 1Q21 Financials At or for the Three Months Ended 3/31/21 Metrics Excluding PPP Impact Total Loans $4.91 billion $4.70 billion Average Loans $4.99 billion $4.80 billion Net Interest Income FTE (1) $52.3 million $49.6 million Net Interest Margin (1) 3.45% 3.38% ACL/Total Loans 1.28% 1.33% 1. Loan fees and deferred loan origination costs being amortized over an estimated 24 to 60 month life of PPP loans Paycheck Protection Program Loan Forgiveness As of 12/31/20 As of 3/31/21 Loans Submitted to SBA $155.6 million $196.5 million Loans Forgiven by SBA $93.2 million $146.0 million Percentage of Total Round 1 PPP Loans Forgiven 33.6% 52.6%
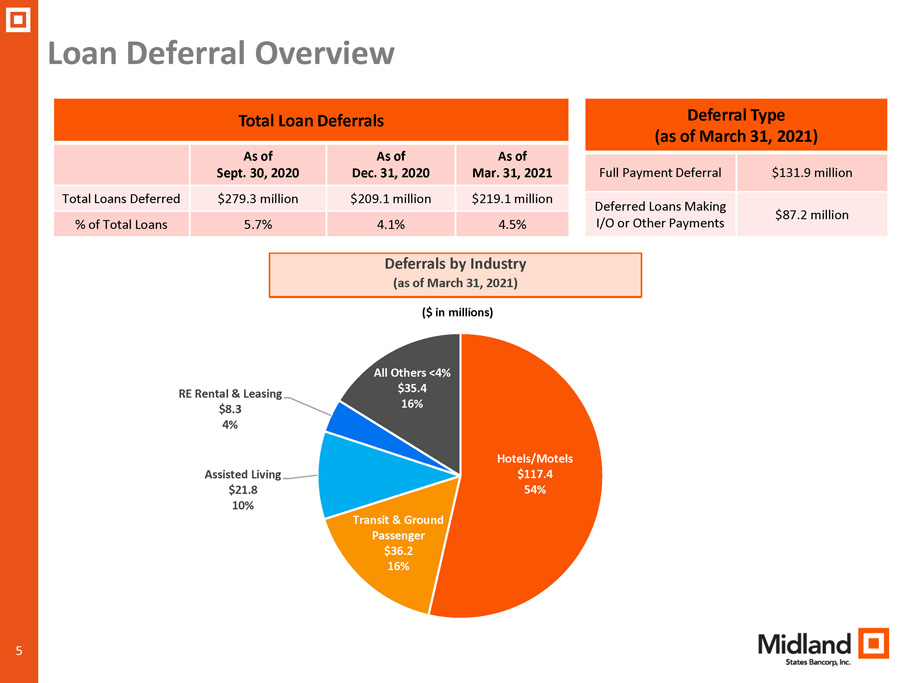
5 Loan Deferral Overview Total Loan Deferrals As of Sept. 30, 2020 As of Dec. 31, 2020 As of Mar. 31, 2021 Total Loans Deferred $279.3 million $209.1 million $219.1 million % of Total Loans 5.7% 4.1% 4.5% Deferrals by Industry (as of March 31, 2021) Hotels/Motels $117.4 54% Transit & Ground Passenger $36.2 16% Assisted Living $21.8 10% RE Rental & Leasing $8.3 4% All Others <4% $35.4 16% ($ in millions) Deferral Type (as of March 31, 2021) Full Payment Deferral $131.9 million Deferred Loans Making I/O or Other Payments $87.2 million
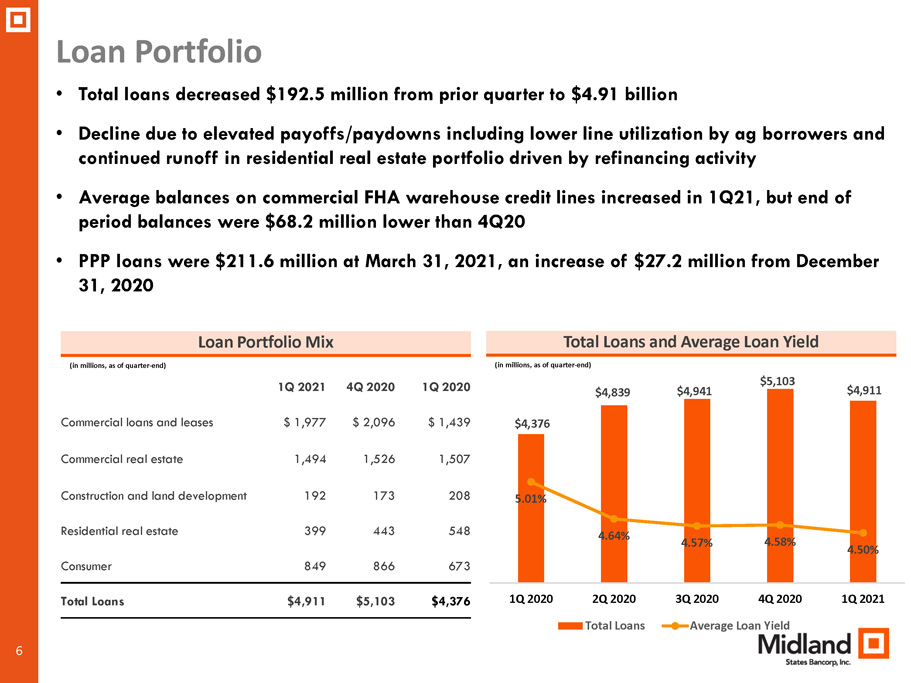
6 1Q 2021 4Q 2020 1Q 2020 Commercial loans and leases $ 1,977 $ 2,096 $ 1,439 Commercial real estate 1,494 1,526 1,507 Construction and land development 192 173 208 Residential real estate 399 443 548 Consumer 849 866 673 Total Loans $4,911 $5,103 $4,376 Loan Portfolio Total Loans and Average Loan Yield • Total loans decreased $192.5 million from prior quarter to $4.91 billion • Decline due to elevated payoffs/paydowns including lower line utilization by ag borrowers and continued runoff in residential real estate portfolio driven by refinancing activity • Average balances on commercial FHA warehouse credit lines increased in 1Q21, but end of period balances were $68.2 million lower than 4Q20 • PPP loans were $211.6 million at March 31, 2021, an increase of $27.2 million from December 31, 2020 Loan Portfolio Mix (in millions, as of quarter - end) (in millions, as of quarter - end) $4,376 $4,839 $4,941 $5,103 $4,911 5.01% 4.64% 4.57% 4.58% 4.50% 1Q 2020 2Q 2020 3Q 2020 4Q 2020 1Q 2021 Total Loans Average Loan Yield

7 Midland Equipment Finance Portfolio Overview ($ in millions) Portfolio Characteristics (as of 3/31/21) Nationwide portfolio providing financing solutions to equipment vendors and end - users Total Outstanding Loans and Leases $858.6 million (17.5% of total loans) Number of Loans and Leases 6,904 Average Loan/Lease Size $122,291 Largest Loan/Lease $1.5 million Weighted Average Rate 4.89% Avg. FICO Score 604 Transit and Ground Passenger $36.2 78.5% All Others <4% of Total $9.9 21.5% Total Deferred Loans and Leases As of 9/30/20 As of 12/31/20 As of 3/31/21 Total Deferrals $75.2 million $50.1 million $46.1 million Percentage of Portfolio 9.2% 5.8% 5.4% Deferred Loans Making I/O or Other Payments - $28.2 million $35.8 million Equipment Finance Deferrals by Industry (as of March 31, 2021)

8 Hotel/Motel Portfolio Overview Deferrals by Chain Scale ($ in millions) Upper Midscale Chain $96.0 82% Upscale Chain $11.7 10% Midscale Chain $8.7 7% Other $1.0 1% Portfolio Characteristics (CRE & C&I) (as of 3/31/21) Total Outstanding $167.0 million (3.4% of total loans) Number of Loans 46 Average Loan Size $3.6 million Largest Loan $11.3 million Average LTV 57% Total Deferred Loans as of 12/31/20 $82.6 million (45.8% of portfolio) Total Deferred Loans as of 3/31/21 $117.4 million (70.3% of portfolio) Average LTV of Deferred Loans as of 3/31/21 59% Deferred Loans Making I/O or Other Payments $24.8 million (21.1% of deferrals) Portfolio by State IL $90.0 54% MO $33.5 20% MI $13.9 8% CO $11.3 7% WI $9.2 6% Other $9.1 5%
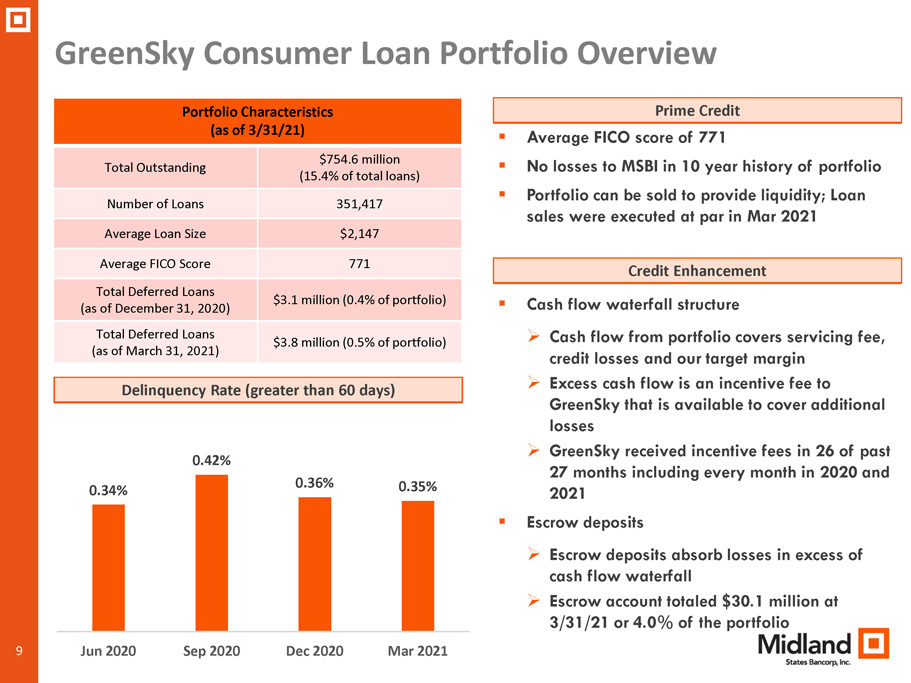
9 GreenSky Consumer Loan Portfolio Overview Delinquency Rate (greater than 60 days) Portfolio Characteristics (as of 3/31/21) Total Outstanding $754.6 million (15.4% of total loans) Number of Loans 351,417 Average Loan Size $2,147 Average FICO Score 771 Total Deferred Loans (as of December 31, 2020) $3.1 million (0.4% of portfolio) Total Deferred Loans (as of March 31, 2021) $3.8 million (0.5% of portfolio) ▪ Average FICO score of 771 ▪ No losses to MSBI in 10 year history of portfolio ▪ Portfolio can be sold to provide liquidity; Loan sales were executed at par in Mar 2021 Prime Credit 0.34% 0.42% 0.36% 0.35% Jun 2020 Sep 2020 Dec 2020 Mar 2021 ▪ Cash flow waterfall structure » Cash flow from portfolio covers servicing fee, credit losses and our target margin » Excess cash flow is an incentive fee to GreenSky that is available to cover additional losses » GreenSky received incentive fees in 26 of past 27 months including every month in 2020 and 2021 ▪ Escrow deposits » Escrow deposits absorb losses in excess of cash flow waterfall » Escrow account totaled $30.1 million at 3/31/21 or 4.0% of the portfolio Credit Enhancement
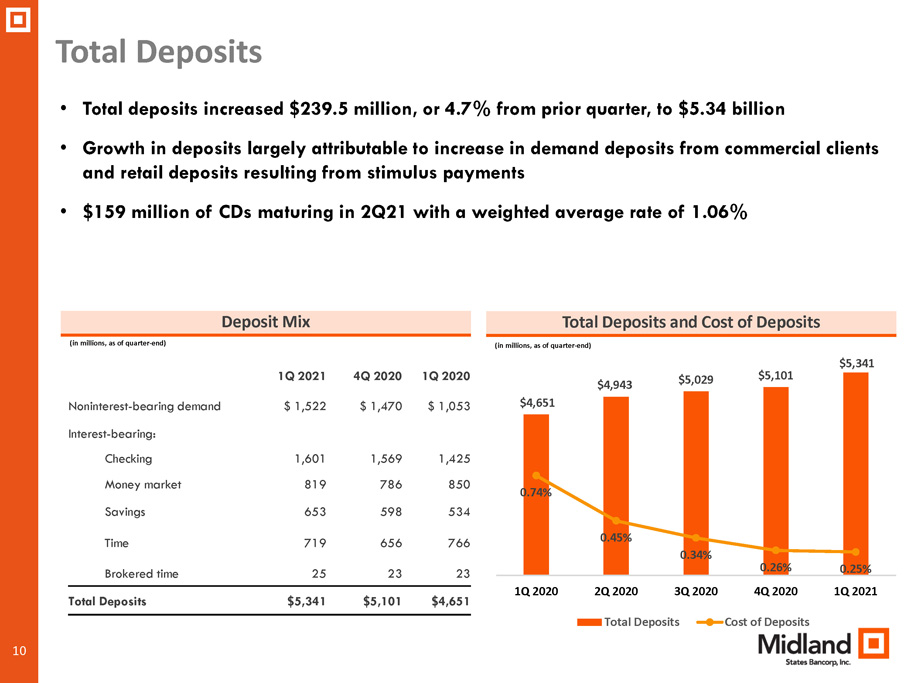
10 1Q 2021 4Q 2020 1Q 2020 Noninterest - bearing demand $ 1,522 $ 1,470 $ 1,053 Interest - bearing: Checking 1,601 1,569 1,425 Money market 819 786 850 Savings 653 598 534 Time 719 656 766 Brokered time 25 23 23 Total Deposits $5,341 $5,101 $4,651 Total Deposits Total Deposits and Cost of Deposits • Total deposits increased $239.5 million, or 4.7% from prior quarter, to $5.34 billion • Growth in deposits largely attributable to increase in demand deposits from commercial clients and retail deposits resulting from stimulus payments • $159 million of CDs maturing in 2Q21 with a weighted average rate of 1.06% Deposit Mix (in millions, as of quarter - end) (in millions, as of quarter - end) $4,651 $4,943 $5,029 $5,101 $5,341 0.74% 0.45% 0.34% 0.26% 0.25% 1Q 2020 2Q 2020 3Q 2020 4Q 2020 1Q 2021 Total Deposits Cost of Deposits

11 $2.2 $1.8 $2.1 $1.6 $1.2 $46.7 $49.0 $50.0 $53.5 $51.9 1Q 2020 2Q 2020 3Q 2020 4Q 2020 1Q 2021 NII Accretion Income 0.16% 0.12% 0.14% 0.10% 0.08% 3.48% 3.32% 3.33% 3.47% 3.45% 1Q 2020 2Q 2020 3Q 2020 4Q 2020 1Q 2021 NIM Accretion Income • Net interest income decreased 3.1% from the prior quarter due to lower accretion income and lower PPP income • Net interest margin, excluding accretion income, was unchanged from prior quarter as a favorable shift in the mix of earning assets and a reduction in the average cost of funds were offset by a decline in the average yield on loans and securities • Redeployment of excess liquidity and higher rates on new securities purchases expected to keep NIM relatively stable, excluding impact of accretion and PPP income Net Interest Income/Margin Net Interest Margin Net Interest Income (in millions)

12 $5.68 $5.70 $5.56 $5.87 $5.93 1Q 2020 2Q 2020 3Q 2020 4Q 2020 1Q 2021 $2,968 $3,254 $3,261 $3,481 $3,560 1Q 2020 2Q 2020 3Q 2020 4Q 2020 1Q 2021 • During 1Q21, assets under administration increased $79.7 million, primarily due to market performance • Wealth Management revenue increased 1.1% from prior quarter, primarily due to higher assets under administration and seasonal impact of fees related to tax preparation Wealth Management Wealth Management Revenue Assets Under Administration (in millions) (in millions )
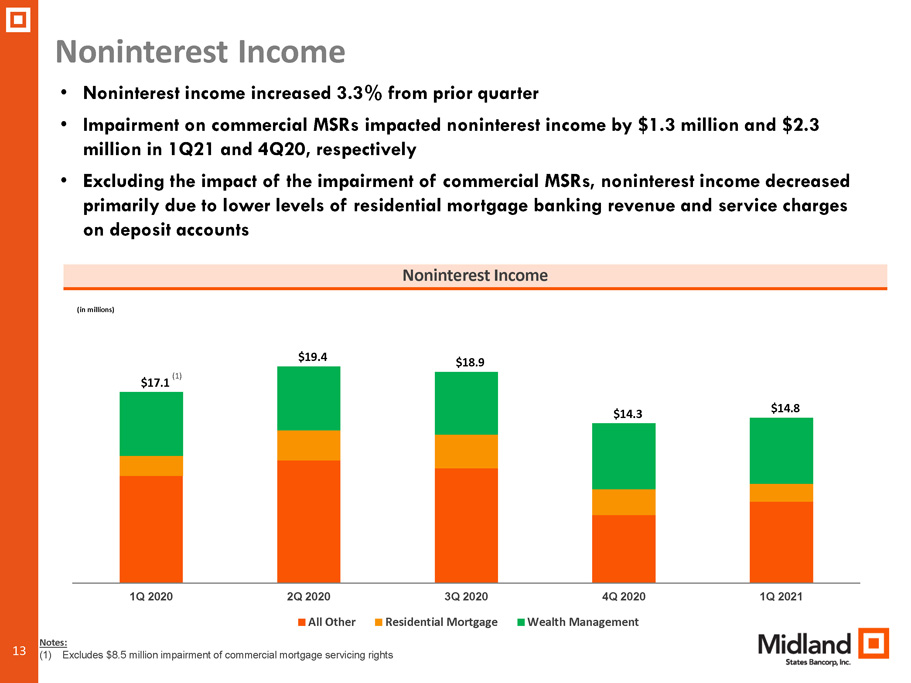
13 Noninterest Income • Noninterest income increased 3.3% from prior quarter • Impairment on commercial MSRs impacted noninterest income by $1.3 million and $2.3 million in 1Q21 and 4Q20, respectively • Excluding the impact of the impairment of commercial MSRs, noninterest income decreased primarily due to lower levels of residential mortgage banking revenue and service charges on deposit accounts Noninterest Income (in millions) Notes: (1) Excludes $8.5 million impairment of commercial mortgage servicing rights $17.1 $19.4 $18.9 $14.3 $14.8 1Q 2020 2Q 2020 3Q 2020 4Q 2020 1Q 2021 All Other Residential Mortgage Wealth Management (1)
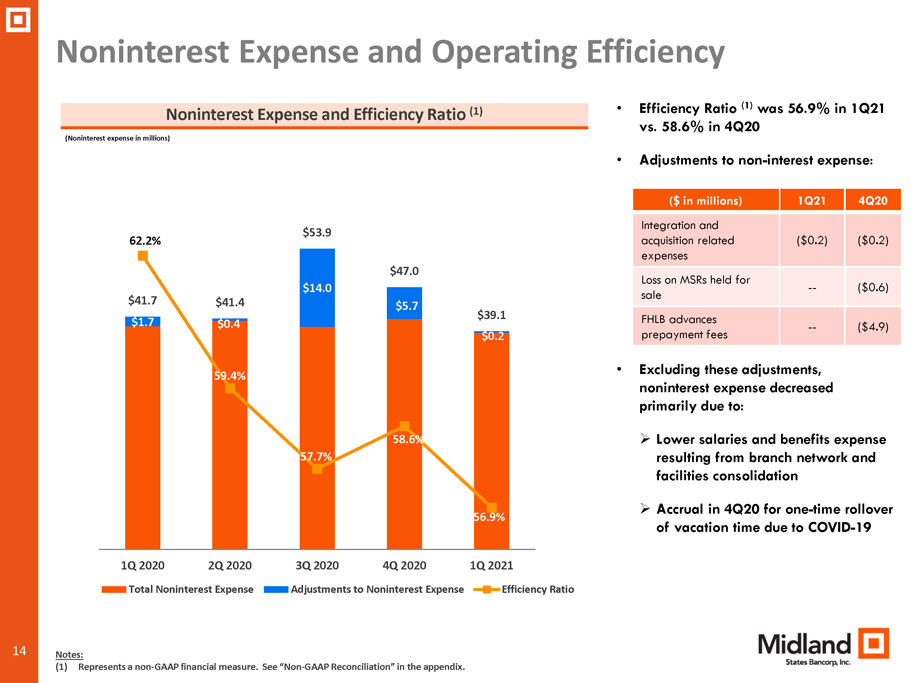
14 Noninterest Expense and Operating Efficiency • Efficiency Ratio (1) was 56.9% in 1Q21 vs. 58.6% in 4Q20 • Adjustments to non - interest expense: • Excluding these adjustments, noninterest expense decreased primarily due to: » Lower salaries and benefits expense resulting from branch network and facilities consolidation » Accrual in 4Q20 for one - time rollover of vacation time due to COVID - 19 Noninterest Expense and Efficiency Ratio (1) (Noninterest expense in millions) $1.7 $0.4 $14.0 $5.7 $0.2 $41.7 $41.4 $53.9 $47.0 $39.1 62.2% 59.4% 57.7% 58.6% 56.9% 56.0% 1Q 2020 2Q 2020 3Q 2020 4Q 2020 1Q 2021 Total Noninterest Expense Adjustments to Noninterest Expense Efficiency Ratio Notes: (1) Represents a non - GAAP financial measure. See “Non - GAAP Reconciliation” in the appendix. ($ in millions) 1Q21 4Q20 Integration and acquisition related expenses ($0.2) ($0.2) Loss on MSRs held for sale -- ($0.6) FHLB advances prepayment fees -- ($4.9)
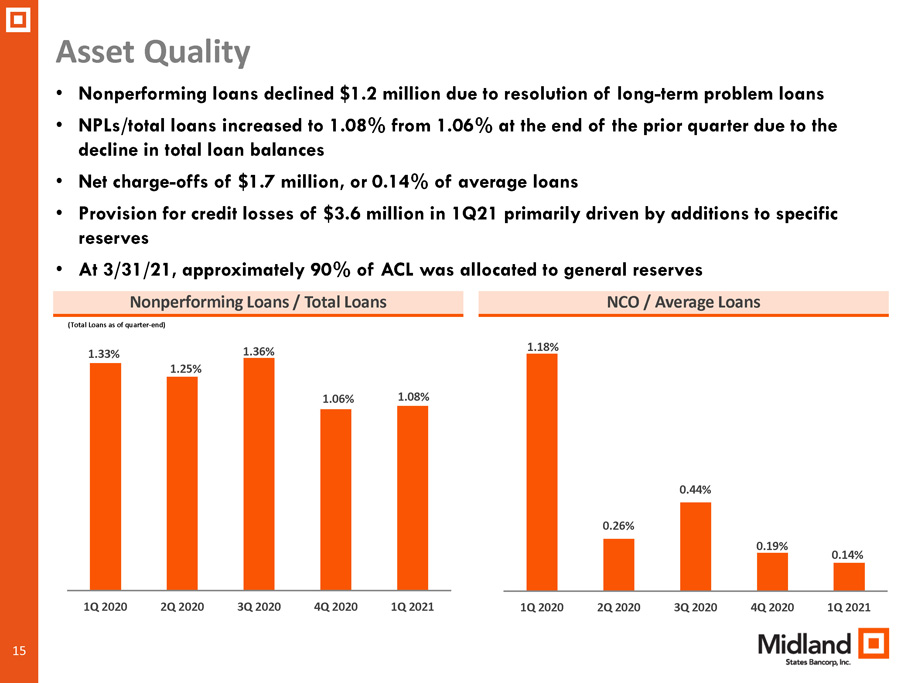
15 Asset Quality NCO / Average Loans • Nonperforming loans declined $1.2 million due to resolution of long - term problem loans • NPLs/total loans increased to 1.08% from 1.06% at the end of the prior quarter due to the decline in total loan balances • Net charge - offs of $1.7 million, or 0.14% of average loans • Provision for credit losses of $3.6 million in 1Q21 primarily driven by additions to specific reserves • At 3/31/21, approximately 90% of ACL was allocated to general reserves Nonperforming Loans / Total Loans (Total Loans as of quarter - end) 1.33% 1.25% 1.36% 1.06% 1.08% 1Q 2020 2Q 2020 3Q 2020 4Q 2020 1Q 2021 1.18% 0.26% 0.44% 0.19% 0.14% 1Q 2020 2Q 2020 3Q 2020 4Q 2020 1Q 2021
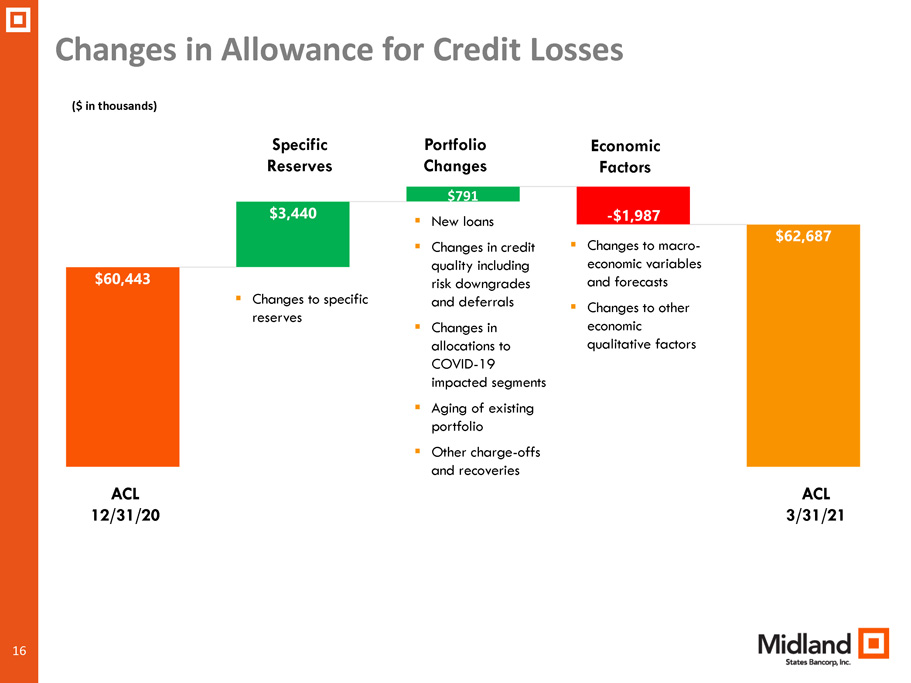
16 Changes in Allowance for Credit Losses ACL 12/31/20 ACL 3/31/21 ($ in thousands) Specific Reserves Portfolio Changes Economic Factors ▪ Changes to specific reserves ▪ New loans ▪ Changes in credit quality including risk downgrades and deferrals ▪ Changes in allocations to COVID - 19 impacted segments ▪ Aging of existing portfolio ▪ Other charge - offs and recoveries ▪ Changes to macro - economic variables and forecasts ▪ Changes to other economic qualitative factors
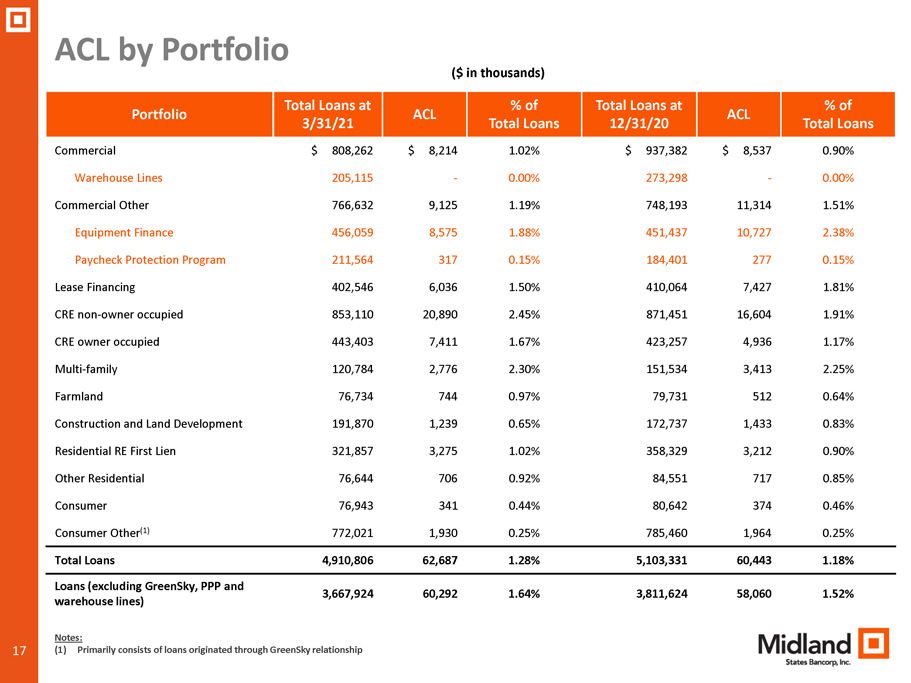
17 ACL by Portfolio Portfolio Total Loans at 3/31/21 ACL % of Total Loans Total Loans at 12/31/20 ACL % of Total Loans Commercial $ 808,262 $ 8,214 1.02% $ 937,382 $ 8,537 0.90% Warehouse Lines 205,115 - 0.00% 273,298 - 0.00% Commercial Other 766,632 9,125 1.19% 748,193 11,314 1.51% Equipment Finance 456,059 8,575 1.88% 451,437 10,727 2.38% Paycheck Protection Program 211,564 317 0.15% 184,401 277 0.15% Lease Financing 402,546 6,036 1.50% 410,064 7,427 1.81% CRE non - owner occupied 853,110 20,890 2.45% 871,451 16,604 1.91% CRE owner occupied 443,403 7,411 1.67% 423,257 4,936 1.17% Multi - family 120,784 2,776 2.30% 151,534 3,413 2.25% Farmland 76,734 744 0.97% 79,731 512 0.64% Construction and Land Development 191,870 1,239 0.65% 172,737 1,433 0.83% Residential RE First Lien 321,857 3,275 1.02% 358,329 3,212 0.90% Other Residential 76,644 706 0.92% 84,551 717 0.85% Consumer 76,943 341 0.44% 80,642 374 0.46% Consumer Other (1) 772,021 1,930 0.25% 785,460 1,964 0.25% Total Loans 4,910,806 62,687 1.28% 5,103,331 60,443 1.18% Loans (excluding GreenSky, PPP and warehouse lines) 3,667,924 60,292 1.64% 3,811,624 58,060 1.52% ($ in thousands) Notes: (1) Primarily consists of loans originated through GreenSky relationship

18 Outlook • Improving economic conditions and stronger financial performance among borrowers impacted by the pandemic should lead to continued reductions in deferrals over next two quarters and relatively stable ACL/total loans • Growing loan pipeline should lead to stronger loan production and loan growth as the year progresses • Stronger loan growth and redeployment of excess liquidity into higher yielding earning assets will further increase operating leverage and level of profitability • Completion of ATG Trust Company acquisition will further increase revenue generated from Wealth Management • Further strengthen capital ratios to support continued organic and acquisitive growth in the future 18

19 APPENDIX
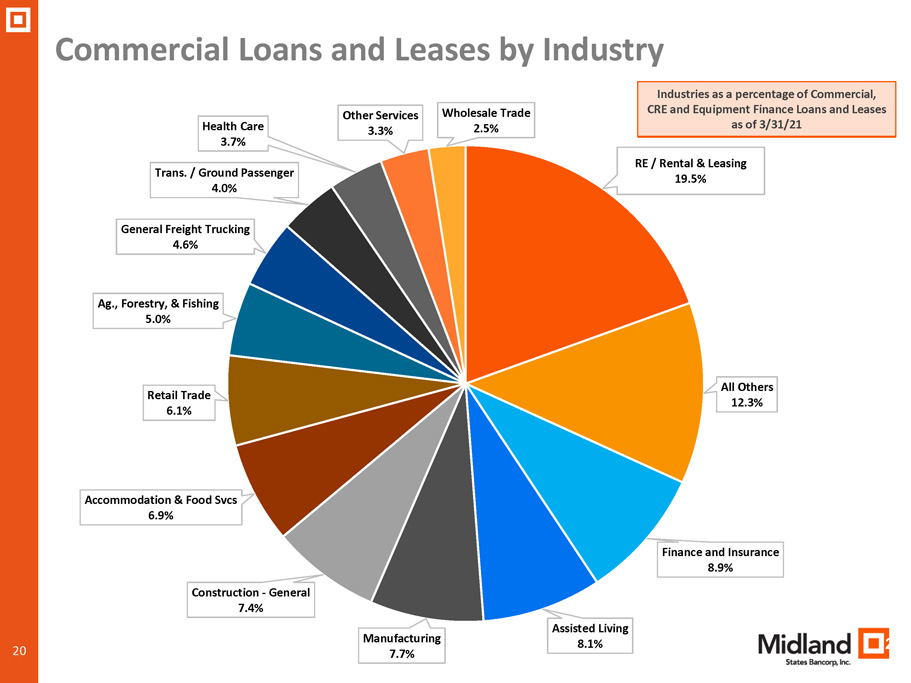
20 Commercial Loans and Leases by Industry 20 RE / Rental & Leasing 19.5% All Others 12.3% Finance and Insurance 8.9% Assisted Living 8.1% Manufacturing 7.7% Construction - General 7.4% Accommodation & Food Svcs 6.9% Retail Trade 6.1% Ag., Forestry, & Fishing 5.0% General Freight Trucking 4.6% Trans. / Ground Passenger 4.0% Health Care 3.7% Other Services 3.3% Wholesale Trade 2.5% Industries as a percentage of Commercial, CRE and Equipment Finance Loans and Leases as of 3/31/21
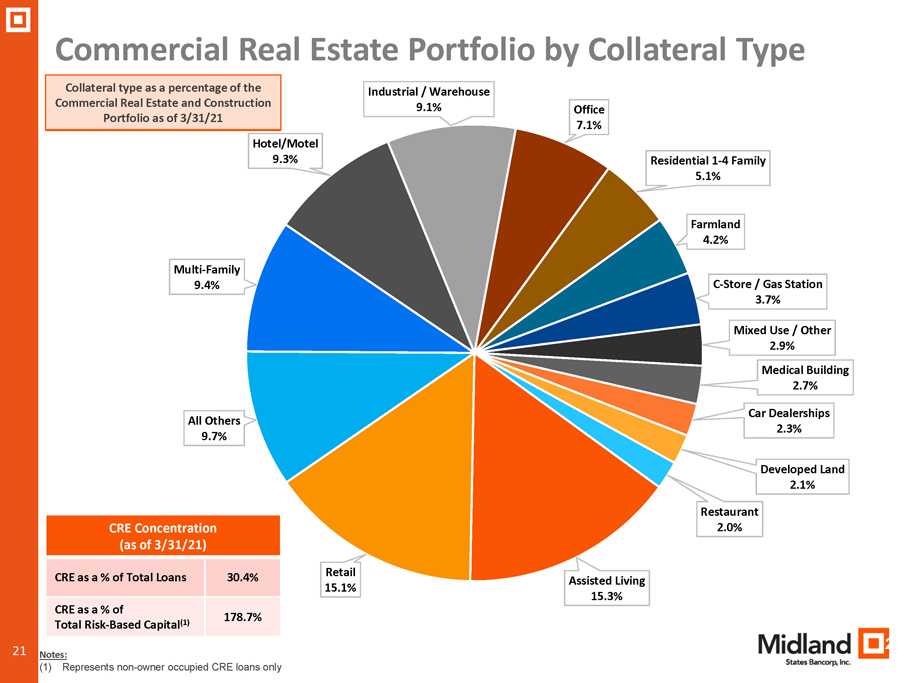
21 Commercial Real Estate Portfolio by Collateral Type 21 Assisted Living 15.3% Retail 15.1% All Others 9.7% Multi - Family 9.4% Hotel/Motel 9.3% Industrial / Warehouse 9.1% Office 7.1% Residential 1 - 4 Family 5.1% Farmland 4.2% C - Store / Gas Station 3.7% Mixed Use / Other 2.9% Medical Building 2.7% Car Dealerships 2.3% Developed Land 2.1% Restaurant 2.0% Collateral type as a percentage of the Commercial Real Estate and Construction Portfolio as of 3/31/21 CRE Concentration (as of 3/31/21) CRE as a % of Total Loans 30.4% CRE as a % of Total Risk - Based Capital (1) 178.7% Notes: (1) Represents non - owner occupied CRE loans only
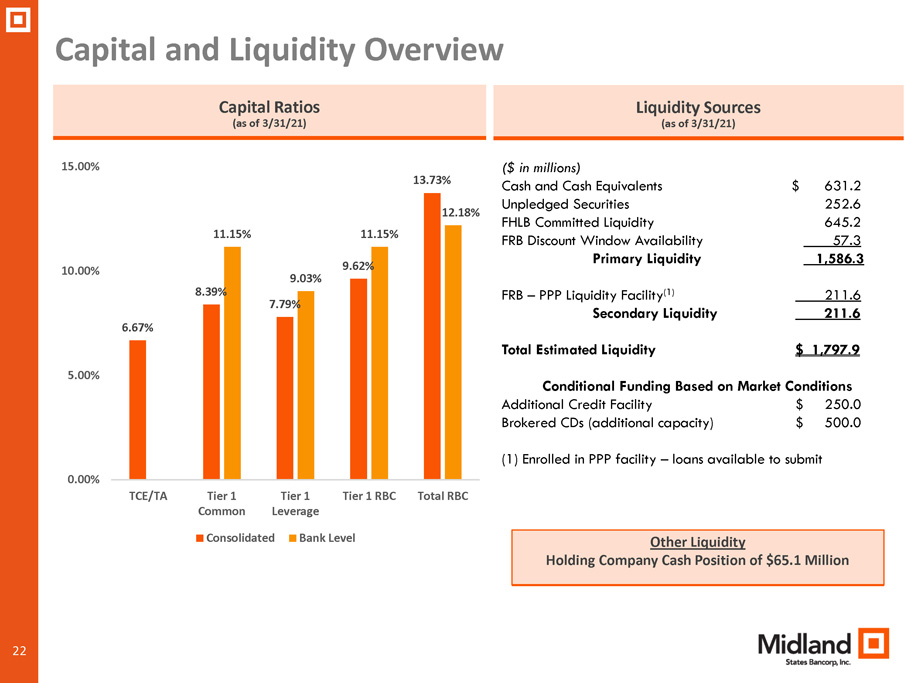
22 Capital and Liquidity Overview Capital Ratios (as of 3/31/21) Liquidity Sources (as of 3/31/21) 6.67% 8.39% 7.79% 9.62% 13.73% 11.15% 9.03% 11.15% 12.18% 0.00% 5.00% 10.00% 15.00% TCE/TA Tier 1 Common Tier 1 Leverage Tier 1 RBC Total RBC Consolidated Bank Level ($ in millions) Cash and Cash Equivalents $ 631.2 Unpledged Securities 252.6 FHLB Committed Liquidity 645.2 FRB Discount Window Availability 57.3 Primary Liquidity 1,586.3 FRB – PPP Liquidity Facility (1) 211.6 Secondary Liquidity 211.6 Total Estimated Liquidity $ 1,797.9 Conditional Funding Based on Market Conditions Additional Credit Facility $ 250.0 Brokered CDs (additional capacity) $ 500.0 (1) Enrolled in PPP facility – loans available to submit Other Liquidity Holding Company Cash Position of $65.1 Million
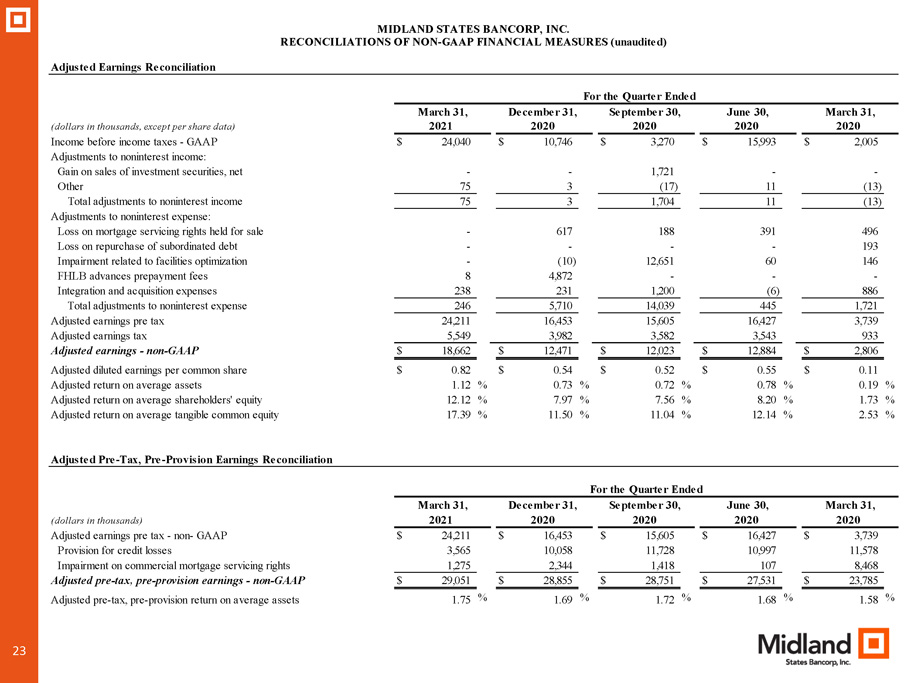
23 Adjusted Earnings Reconciliation (dollars in thousands, except per share data) Income before income taxes - GAAP $ 24,040 $ 10,746 $ 3,270 $ 15,993 $ 2,005 Adjustments to noninterest income: Gain on sales of investment securities, net - - 1,721 - - Other 75 3 (17) 11 (13) Total adjustments to noninterest income 75 3 1,704 11 (13) Adjustments to noninterest expense: Loss on mortgage servicing rights held for sale - 617 188 391 496 Loss on repurchase of subordinated debt - - - - 193 Impairment related to facilities optimization - (10) 12,651 60 146 FHLB advances prepayment fees 8 4,872 - - - Integration and acquisition expenses 238 231 1,200 (6) 886 Total adjustments to noninterest expense 246 5,710 14,039 445 1,721 Adjusted earnings pre tax 24,211 16,453 15,605 16,427 3,739 Adjusted earnings tax 5,549 3,982 3,582 3,543 933 Adjusted earnings - non-GAAP $ 18,662 $ 12,471 $ 12,023 $ 12,884 $ 2,806 Adjusted diluted earnings per common share $ 0.82 $ 0.54 $ 0.52 $ 0.55 $ 0.11 Adjusted return on average assets 1.12 % 0.73 % 0.72 % 0.78 % 0.19 % Adjusted return on average shareholders' equity 12.12 % 7.97 % 7.56 % 8.20 % 1.73 % Adjusted return on average tangible common equity 17.39 % 11.50 % 11.04 % 12.14 % 2.53 % Adjusted Pre-Tax, Pre-Provision Earnings Reconciliation (dollars in thousands) Adjusted earnings pre tax - non- GAAP $ 24,211 $ 16,453 $ 15,605 $ 16,427 $ 3,739 Provision for credit losses 3,565 10,058 11,728 10,997 11,578 Impairment on commercial mortgage servicing rights 1,275 2,344 1,418 107 8,468 Adjusted pre-tax, pre-provision earnings - non-GAAP $ 29,051 $ 28,855 $ 28,751 $ 27,531 $ 23,785 Adjusted pre-tax, pre-provision return on average assets 1.75 % 1.69 % 1.72 % 1.68 % 1.58 % For the Quarter Ended 2021 2020 2020 2020 2020 March 31, December 31, September 30, June 30, March 31, MIDLAND STATES BANCORP, INC.RECONCILIATIONS OF NON-GAAP FINANCIAL MEASURES (unaudited) For the Quarter Ended June 30, 2020 March 31, 2020 March 31, 2021 December 31, 2020 September 30, 2020

24 Efficiency Ratio Reconciliation (dollars in thousands) Noninterest expense - GAAP $ 39,079 $ 47,048 $ 53,901 $ 41,395 $ 41,666 Loss on mortgage servicing rights held for sale - (617) (188) (391) (496) Loss on repurchase of subordinated debt - - - - (193) Impairment related to facilities optimization - 10 (12,651) (60) (146) FHLB advances prepayment fees (8) (4,872) - - - Integration and acquisition expenses (238) (231) (1,200) 6 (885) Adjusted noninterest expense $ 38,833 $ 41,338 $ 39,862 $ 40,950 $ 39,946 Net interest income - GAAP $ 51,868 $ 53,516 $ 49,980 $ 48,989 $ 46,651 Effect of tax-exempt income 386 413 430 438 485 Adjusted net interest income 52,254 53,929 50,410 49,427 47,136 Noninterest income - GAAP 14,816 14,336 18,919 19,396 8,598 Impairment on commercial mortgage servicing rights 1,275 2,344 1,418 107 8,468 Gain on sales of investment securities, net - - (1,721) - - Other (75) (3) 17 (11) 13 Adjusted noninterest income 16,016 16,677 18,633 19,492 17,079 Adjusted total revenue $ 68,270 $ 70,606 $ 69,043 $ 68,919 $ 64,215 Efficiency ratio 56.88 % 58.55 % 57.74 % 59.42 % 62.21 % MIDLAND STATES BANCORP, INC.RECONCILIATIONS OF NON-GAAP FINANCIAL MEASURES (unaudited) (continued) For the Quarter Ended 2021 2020 2020 2020 2020 March 31, December 31, September 30, June 30, March 31,
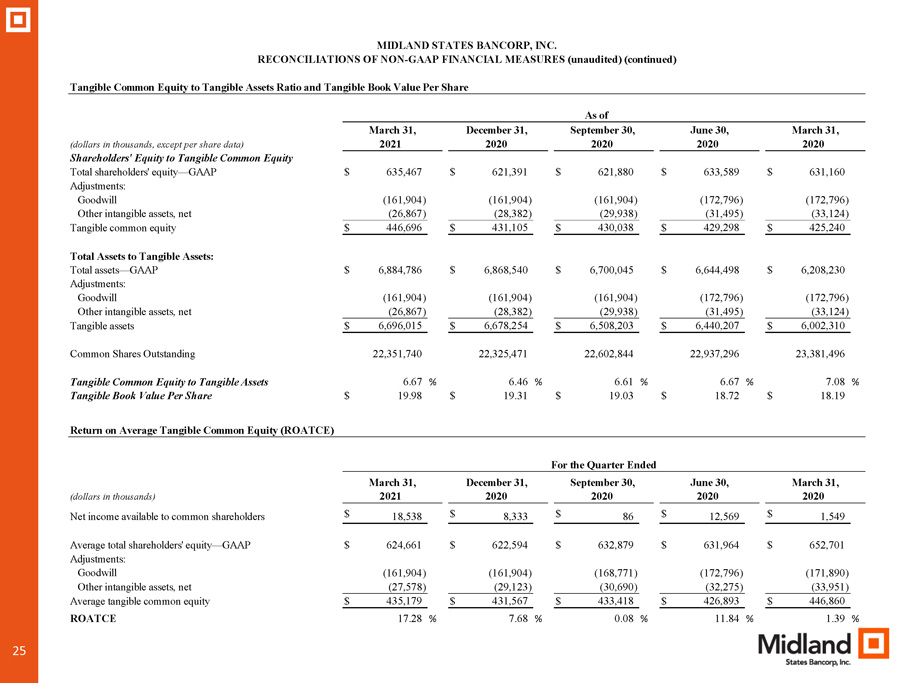
25 Tangible Common Equity to Tangible Assets Ratio and Tangible Book Value Per Share (dollars in thousands, except per share data) Shareholders' Equity to Tangible Common Equity Total shareholders' equity—GAAP $ 635,467 $ 621,391 $ 621,880 $ 633,589 $ 631,160 Adjustments: Goodwill (161,904) (161,904) (161,904) (172,796) (172,796) Other intangible assets, net (26,867) (28,382) (29,938) (31,495) (33,124) Tangible common equity $ 446,696 $ 431,105 $ 430,038 $ 429,298 $ 425,240 Total Assets to Tangible Assets: Total assets—GAAP $ 6,884,786 $ 6,868,540 $ 6,700,045 $ 6,644,498 $ 6,208,230 Adjustments: Goodwill (161,904) (161,904) (161,904) (172,796) (172,796) Other intangible assets, net (26,867) (28,382) (29,938) (31,495) (33,124) Tangible assets $ 6,696,015 $ 6,678,254 $ 6,508,203 $ 6,440,207 $ 6,002,310 Common Shares Outstanding 22,351,740 22,325,471 22,602,844 22,937,296 23,381,496 Tangible Common Equity to Tangible Assets 6.67 % 6.46 % 6.61 % 6.67 % 7.08 % Tangible Book Value Per Share $ 19.98 $ 19.31 $ 19.03 $ 18.72 $ 18.19 Return on Average Tangible Common Equity (ROATCE) (dollars in thousands) Net income available to common shareholders $ 18,538 $ 8,333 $ 86 $ 12,569 $ 1,549 Average total shareholders' equity—GAAP $ 624,661 $ 622,594 $ 632,879 $ 631,964 $ 652,701 Adjustments: Goodwill (161,904) (161,904) (168,771) (172,796) (171,890) Other intangible assets, net (27,578) (29,123) (30,690) (32,275) (33,951) Average tangible common equity $ 435,179 $ 431,567 $ 433,418 $ 426,893 $ 446,860 ROATCE 17.28 % 7.68 % 0.08 % 11.84 % 1.39 % MIDLAND STATES BANCORP, INC. RECONCILIATIONS OF NON-GAAP FINANCIAL MEASURES (unaudited) (continued) As of March 31, December 31, September 30, June 30, March 31, 2021 2020 2020 2020 2020 For the Quarter Ended 2021 2020 2020 2020 2020 March 31, December 31, September 30, June 30, March 31,