Exhibit 99.1
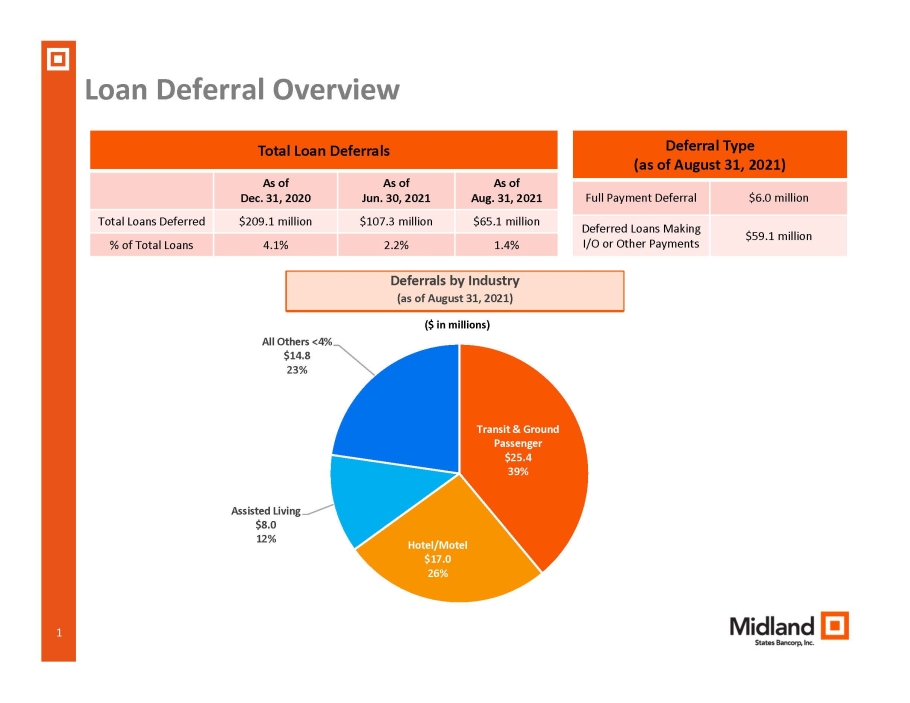
1 Loan Deferral Overview Total Loan Deferrals As of Dec. 31, 2020 As of Jun. 30, 2021 As of Aug. 31, 2021 Total Loans Deferred $209.1 million $107.3 million $65.1 million % of Total Loans 4.1% 2.2% 1.4% Deferrals by Industry (as of August 31, 2021) Transit & Ground Passenger $25.4 39% Hotel/Motel $17.0 26% Assisted Living $8.0 12% All Others <4% $14.8 23% ($ in millions) Deferral Type (as of August 31, 2021) Full Payment Deferral $6.0 million Deferred Loans Making I/O or Other Payments $59.1 million
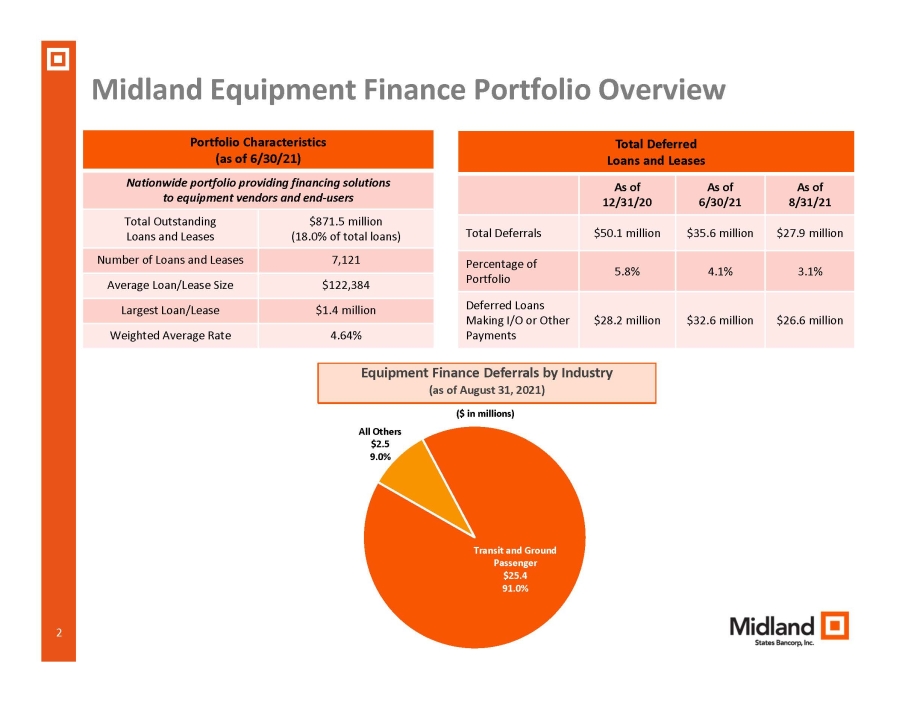
2 Midland Equipment Finance Portfolio Overview ($ in millions) Portfolio Characteristics (as of 6/30/21) Nationwide portfolio providing financing solutions to equipment vendors and end - users Total Outstanding Loans and Leases $871.5 million (18.0% of total loans) Number of Loans and Leases 7,121 Average Loan/Lease Size $122,384 Largest Loan/Lease $1.4 million Weighted Average Rate 4.64% Avg. FICO Score 604 Transit and Ground Passenger $25.4 91.0% All Others $2.5 9.0% Total Deferred Loans and Leases As of 12/31/20 As of 6/30/21 As of 8/31/21 Total Deferrals $50.1 million $35.6 million $27.9 million Percentage of Portfolio 5.8% 4.1% 3.1% Deferred Loans Making I/O or Other Payments $28.2 million $32.6 million $26.6 million Equipment Finance Deferrals by Industry (as of August 31, 2021)

3 Hotel/Motel Portfolio Overview ($ in millions) Portfolio Characteristics (CRE & C&I) (as of 6/30/21 or 8/31/21) Total Outstanding as of 6/30/21 $180.4 million (3.7% of total loans) Number of Loans as of 6/30/21 64 Average Loan Size as of 6/30/21 $2.8 million Largest Loan as of 6/30/21 $11.3 million Average LTV as of 6/30/21 52% Total Deferred Loans as of 6/30/21 $39.4 million (21.8% of portfolio)* Total Deferred Loans as of 8/31/21 $17.0 million (9.4% of portfolio)* Average LTV of Deferred Loans as of 8/31/21 68% Deferred Loans Making I/O or Other Payments $7.1 million (41.8% of deferrals) Portfolio by State IL $103.5 58% MO $28.6 16% MI $14.2 8% CO $11.3 6% WI $9.6 5% Other $13.2 7% * All remaining loan deferrals are Upper Midscale chains