|
Exhibit 99.1 
|
Exhibit 99.1
Creating a Leading Multifamily REIT
September 2015
Disclosure Notices
This presentation may include “forward-looking statements” within the meaning of Section 27A of the Securities Act of 1933, as amended, and Section 21E of the Securities Exchange Act of 1934, as amended. These forward-looking statements which are based on current expectations, estimates and projections about the industry and markets in which Independence Realty Trust, Inc. (“IRT”) operates and beliefs of and assumptions made by IRT management, involve uncertainties that could significantly affect the financial results of IRT. Words such as “expects,” “anticipates,” “intends,” “plans,” “believes,” “seeks,” “estimates,” variations of such words and similar expressions are intended to identify such forward-looking statements, which generally are not historical in nature. Such forward-looking statements include, but are not limited to, statements about the anticipated impact of IRT’s acquisition of Trade Street Residential, Inc. (“TSRE”), including future financial and operating results (such as FFO and Core FFO), and IRT’s plans, objectives, expectations and intentions. All statements that address operating performance, events or developments that IRT expects or anticipates will occur in the future – including statements relating to expected synergies, improved liquidity and balance sheet strength – are forward-looking statements. These statements are not guarantees of future performance and involve certain risks, uncertainties and assumptions that are difficult to predict. Although IRT believes the expectations reflected in any forward-looking statements are based on reasonable assumptions, IRT can give no assurance that IRT’s expectations will be attained and therefore, actual outcomes and results may differ materially from what is expressed or forecasted in such forward-looking statements. Some of the factors that may affect outcomes and results include, but are not limited to: (i) national, regional and local economic climates, (ii) changes in financial markets and interest rates, or to the business or financial condition of IRT (iii) changes in market demand for rental apartment homes and competitive pricing, (iv) risks associated with acquisitions, including the integration of the IRT’s and TSRE’s businesses, (v) maintenance of real estate investment trust (“REIT”) status, (vi) availability of financing and capital, (vii) risks associated with achieving expected revenue synergies or cost savings, (viii) dividends are subject to the discretion of IRT’s Board of Directors, and will depend on IRT’s financial condition, results of operations, capital requirements, compliance with applicable laws and agreements and any other factors deemed relevant by IRT’s Board, (x) risks associated with pursuing additional strategic acquisitions, including risks associated with the need to raise large amounts of additional capital to fund the acquisitions, and (xi) those additional risks and factors discussed in reports filed with the Securities and Exchange Commission (“SEC”) by IRT from time to time, including those discussed under the heading “Risk Factors” in IRT’s most recently filed reports on Forms 10-K and 10-Q. IRT does not undertake any duty to update any forward-looking statements appearing in this presentation.
This document and the related presentation may contain non-U.S. generally accepted accounting principles (“GAAP”) financial measures. A reconciliation of these non-GAAP financial measures to the most directly comparable GAAP financial measure is included in this document and/or IRT’s reports filed with the SEC. This document and the related presentation contain summary unaudited pro forma condensed consolidated balance sheet data and operating data intended to give effect to
IRT’s acquisition of TSRE. Such balance sheet data and operating data and the related presentation have been derived from and should be read in conjunction with the more detailed unaudited pro forma condensed consolidated financial statements, including the notes thereto (the “Pro Formas”), included as Exhibit 99.4 to IRT’s current report on Form 8-K filed with the SEC on September 18, 2015 and with the documents referenced in such Exhibit. The Pro Formas and such documents include the assumptions, estimates, adjustments and other important information relating to the preparation of such balance sheet data and operating data. IRT’s SEC filings, including such current report and such documents, are available on IRT’s website at www.irtreit.com.
This presentation is for informational purposes only and does not constitute an offer to sell or a solicitation of an offer to buy any securities of IRT.
Who are we
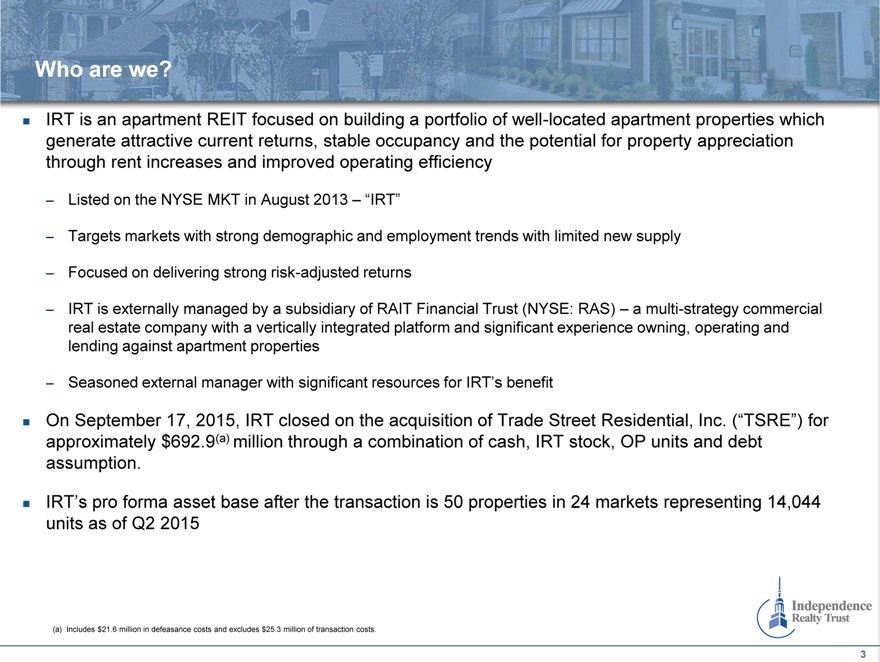
IRT is an apartment REIT focused on building a portfolio of well-located apartment properties which generate attractive current returns, stable occupancy and the potential for property appreciation through rent increases and improved operating efficiency
– Listed on the NYSE MKT in August 2013 – “IRT”
– Targets markets with strong demographic and employment trends with limited new supply
– Focused on delivering strong risk-adjusted returns
– IRT is externally managed by a subsidiary of RAIT Financial Trust (NYSE: RAS) – a multi-strategy commercial real estate company with a vertically integrated platform and significant experience owning, operating and lending against apartment properties
– Seasoned external manager with significant resources for IRT’s benefit
On September 17, 2015, IRT closed on the acquisition of Trade Street Residential, Inc. (“TSRE”) for approximately $692.9(a) million through a combination of cash, IRT stock, OP units and debt assumption.
IRT’s pro forma asset base after the transaction is 50 properties in 24 markets representing 14,044 units as of Q2 2015
(a) | | Includes $21.6 million in defeasance costs and excludes $25.3 million of transaction costs. |
Management team
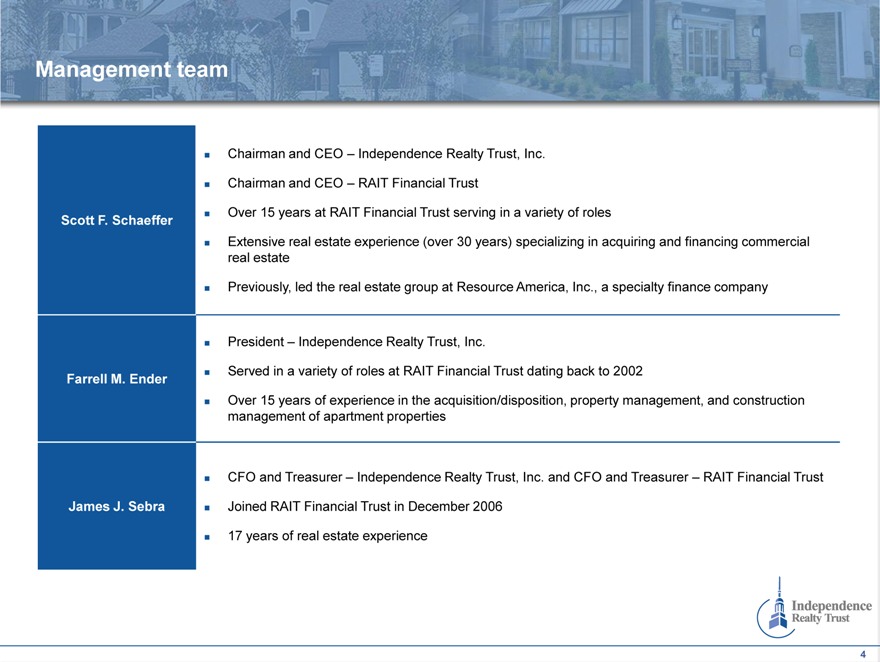
Chairman and CEO – Independence Realty Trust, Inc.
Chairman and CEO – RAIT Financial Trust
Scott F. Schaeffer Over 15 years at RAIT Financial Trust serving in a variety of roles
Extensive real estate experience (over 30 years) specializing in acquiring and financing commercial
real estate
Previously, led the real estate group at Resource America, Inc., a specialty finance company
President – Independence Realty Trust, Inc.
Farrell M. Ender Served in a variety of roles at RAIT Financial Trust dating back to 2002
Over 15 years of experience in the acquisition/disposition, property management, and construction
management of apartment properties
CFO and Treasurer – Independence Realty Trust, Inc. and CFO and Treasurer – RAIT Financial Trust
James J. Sebra Joined RAIT Financial Trust in December 2006
17 | | years of real estate experience |
Sponsor: RAIT Financial Trust (NYSE: RAS)
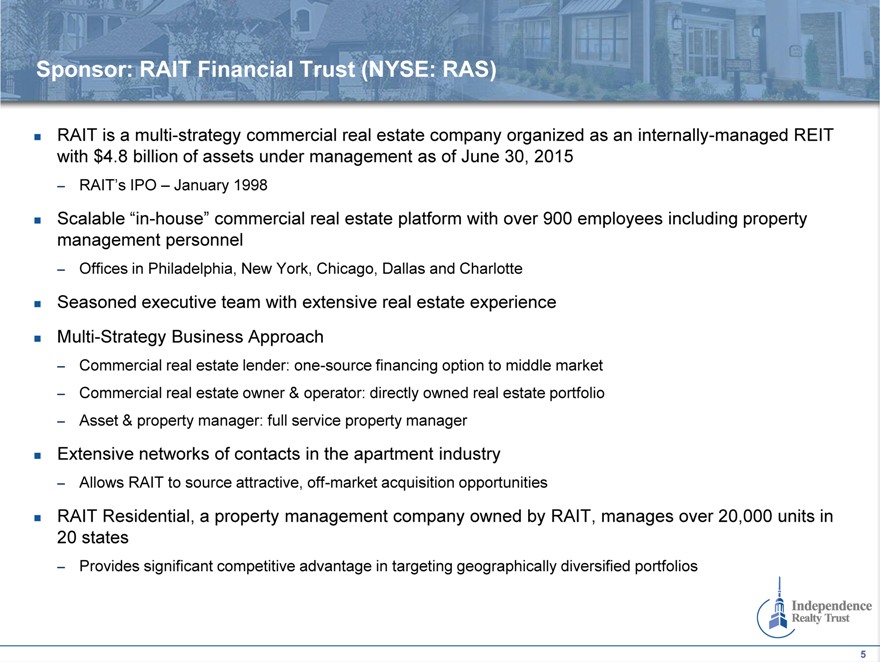
RAIT is a multi-strategy commercial real estate company organized as an internally-managed REIT with $4.8 billion of assets under management as of June 30, 2015
– RAIT’s IPO – January 1998
Scalable “in-house” commercial real estate platform with over 900 employees including property management personnel
– Offices in Philadelphia, New York, Chicago, Dallas and Charlotte
Seasoned executive team with extensive real estate experience Multi-Strategy Business Approach
– Commercial real estate lender: one-source financing option to middle market
– Commercial real estate owner & operator: directly owned real estate portfolio
– Asset & property manager: full service property manager
Extensive networks of contacts in the apartment industry
– Allows RAIT to source attractive, off-market acquisition opportunities
RAIT Residential, a property management company owned by RAIT, manages over 20,000 units in 20 states
– Provides significant competitive advantage in targeting geographically diversified portfolios
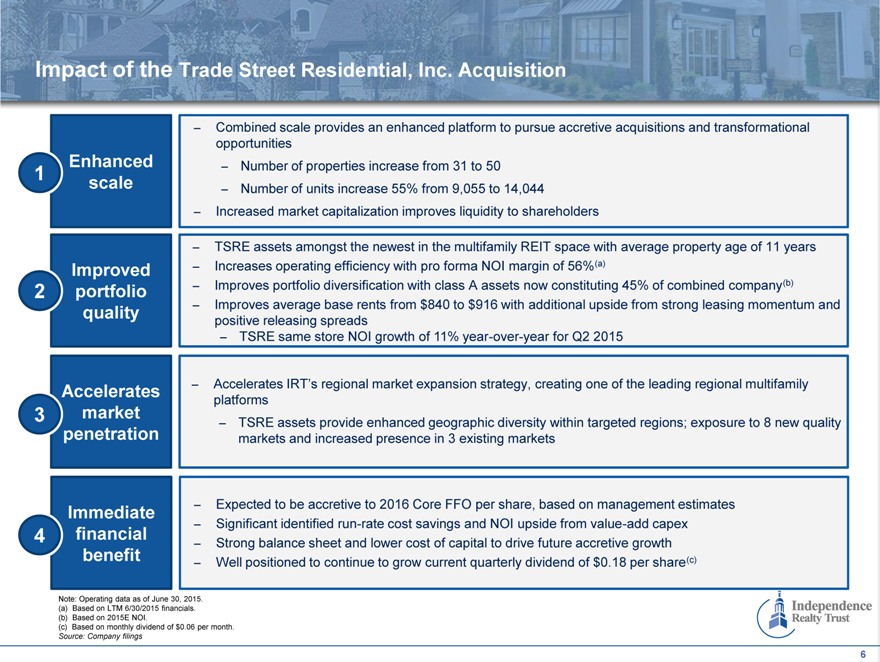
Impact of the Trade Street Residential, Inc. Acquisition
– Combined scale provides an enhanced platform to pursue accretive acquisitions and transformational
opportunities
Enhanced – Number of properties increase from 31 to 50
1 | | scale – Number of units increase 55% from 9,055 to 14,044 |
– Increased market capitalization improves liquidity to shareholders
– TSRE assets amongst the newest in the multifamily REIT space with average property age of 11 years
Improved – Increases operating efficiency with pro forma NOI margin of 56%(a)
2 | | portfolio – Improves portfolio diversification with class A assets now constituting 45% of combined company(b) |
quality – Improves average base rents from $840 to $916 with additional upside from strong leasing momentum and
positive releasing spreads
– TSRE same store NOI growth of 11% year-over-year for Q2 2015
Accelerates – Accelerates IRT’s regional market expansion strategy, creating one of the leading regional multifamily
platforms
3 | | market – TSRE assets provide enhanced geographic diversity within targeted regions; exposure to 8 new quality |
penetration markets and increased presence in 3 existing markets
Immediate – Expected to be accretive to 2016 Core FFO per share, based on management estimates
– Significant identified run-rate cost savings and NOI upside from value-add capex
4 | | financial – Strong balance sheet and lower cost of capital to drive future accretive growth |
benefit – Well positioned to continue to grow current quarterly dividend of $0.18 per share(c)
Note: Operating data as of June 30, 2015. (a) Based on LTM 6/30/2015 financials. (b) Based on 2015E NOI.
(c) | | Based on monthly dividend of $0.06 per month. |
Source: Company filings
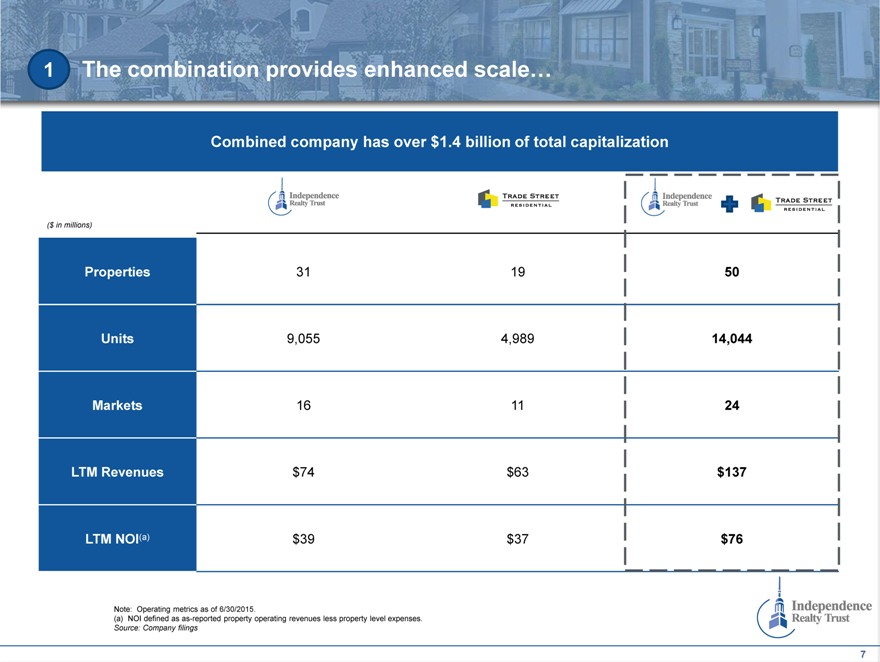
1 | | The combination provides enhanced scale… |
Combined company has over $1.4 billion of total capitalization
($ in millions)
Properties 31 19 50
Units 9,055 4,989 14,044
Markets 16 11 24
LTM Revenues $ 74 $ 63 $137
LTM NOI(a) $ 39 $ 37 $76
Note: Operating metrics as of 6/30/2015.
(a) | | NOI defined as as-reported property operating revenues less property level expenses. |
Source: Company filings
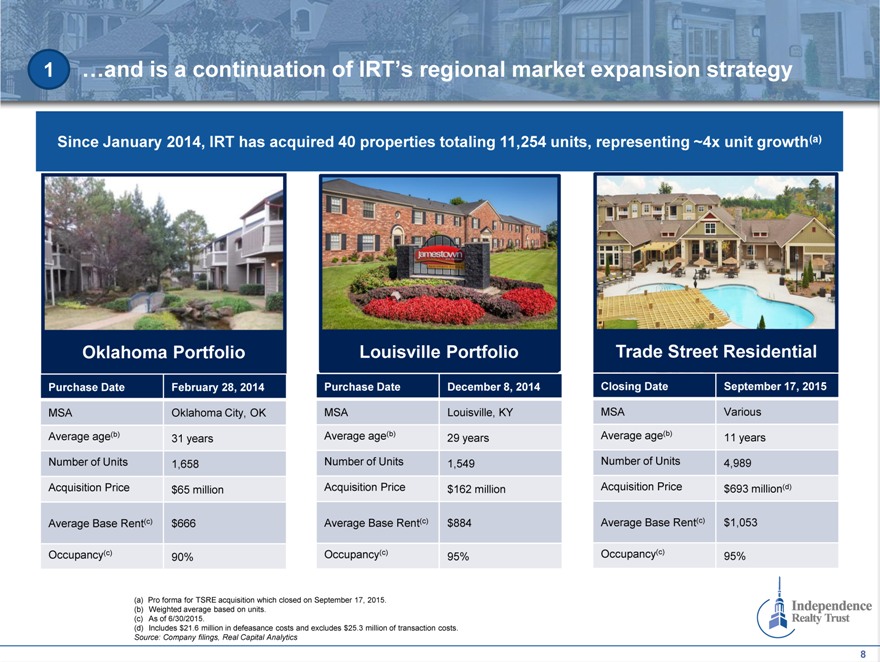
1 | | …and is a continuation of IRT’s regional market expansion strategy |
Since January 2014, IRT has acquired 40 properties totaling 11,254 units, representing ~4x unit growth(a)
Oklahoma Portfolio Louisville Portfolio Trade Street Residential
Purchase Date February 28, 2014 Purchase Date December 8, 2014 Closing Date September 17, 2015
MSA Oklahoma City, OK MSA Louisville, KY MSA Various
Average age(b) 31 years Average age(b) 29 years Average age(b) 11 years
Number of Units 1,658 Number of Units 1,549 Number of Units 4,989
Acquisition Price $65 million Acquisition Price $162 million Acquisition Price $693 million(d)
Average Base Rent(c) $666 Average Base Rent(c) $884 Average Base Rent(c) $1,053
Occupancy(c) 90% Occupancy(c) 95% Occupancy(c) 95%
(a) | | Pro forma for TSRE acquisition which closed on September 17, 2015. (b) Weighted average based on units. |
(d) | | Includes $21.6 million in defeasance costs and excludes $25.3 million of transaction costs. |
Source: Company filings, Real Capital Analytics
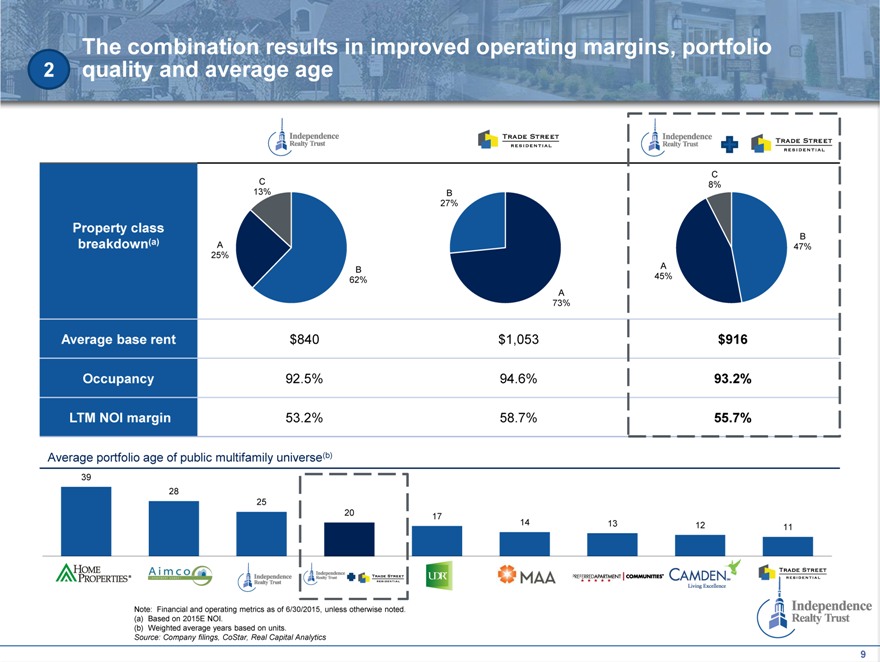
The combination results in improved operating margins, portfolio 2 quality and average age
C
C 8%
13% B
27%
Property class
B
breakdown(a) A 47%
25%
B A
62% 45%
A
73%
Average base rent $840 $1,053 $916
Occupancy 92.5% 94.6% 93.2%
LTM NOI margin 53.2% 58.7% 55.7%
Average portfolio age of public multifamily universe(b)
39
28
25
20 17
14 13 12 11
Note: Financial and operating metrics as of 6/30/2015, unless otherwise noted. (a) Based on 2015E NOI.
(b) | | Weighted average years based on units. |
Source: Company filings, CoStar, Real Capital Analytics
9
2 | | New assets have high occupancy and average base rents… |
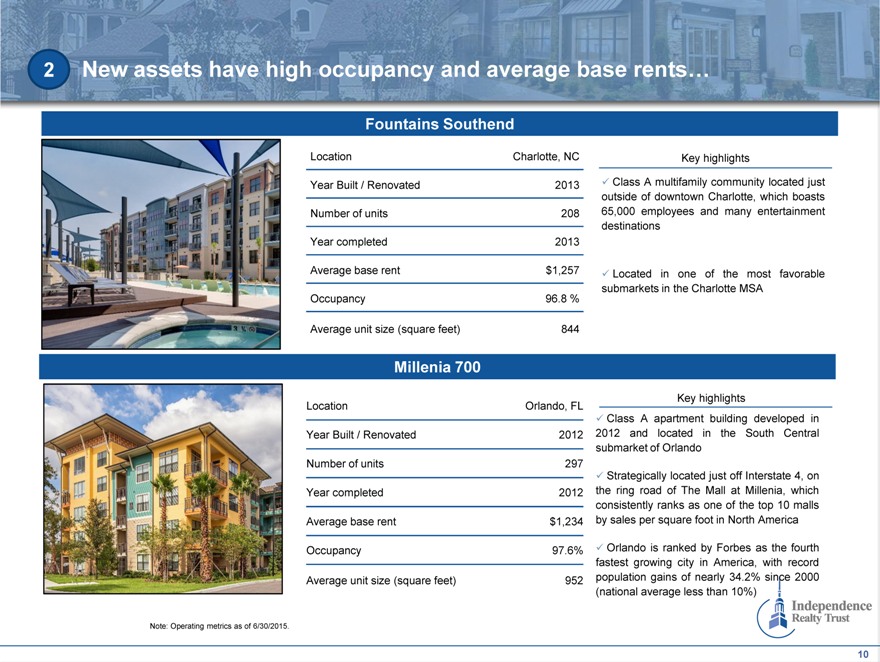
Fountains Southend
Location Charlotte, NC
Year Built / Renovated 2013
Number of units 208
Year completed 2013
Average base rent $1,257
Occupancy 96.8 %
Average unit size (square feet) 844
Key highlights
Class A multifamily community located just outside of downtown Charlotte, which boasts 65,000 employees and many entertainment destinations
Located in one of the most favorable submarkets in the Charlotte MSA
Millenia 700
Location Orlando, FL
Year Built / Renovated 2012
Number of units 297
Year completed 2012
Average base rent $1,234
Occupancy 97.6%
Average unit size (square feet) 952
Key highlights
Class A apartment building developed in 2012 and located in the South Central submarket of Orlando
Strategically located just off Interstate 4, on the ring road of The Mall at Millenia, which consistently ranks as one of the top 10 malls by sales per square foot in North America
Orlando is ranked by Forbes as the fourth fastest growing city in America, with record population gains of nearly 34.2% since 2000 (national average less than 10%)
Note: Operating metrics as of 6/30/2015.
10
2 | | …and enhances IRT’s portfolio quality |
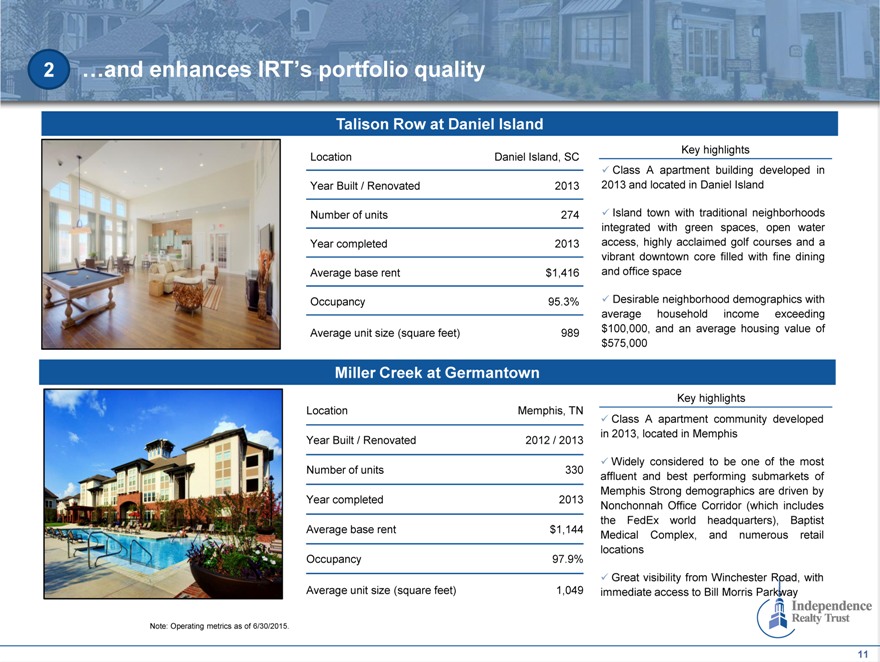
Talison Row at Daniel Island
Location Daniel Island, SC
Year Built / Renovated 2013
Number of units 274
Year completed 2013
Average base rent $1,416
Occupancy 95.3%
Average unit size (square feet) 989
Miller Creek at Germantown
Location Memphis, TN
Year Built / Renovated 2012 / 2013
Number of units 330
Year completed 2013
Average base rent $1,144
Occupancy 97.9%
Average unit size (square feet) 1,049
Key highlights
Class A apartment building developed in 2013 and located in Daniel Island
Island town with traditional neighborhoods integrated with green spaces, open water access, highly acclaimed golf courses and a vibrant downtown core filled with fine dining and office space
Desirable neighborhood demographics with average household income exceeding $100,000, and an average housing value of $575,000
Key highlights
Class A apartment community developed in 2013, located in Memphis
Widely considered to be one of the most affluent and best performing submarkets of Memphis Strong demographics are driven by Nonchonnah Office Corridor (which includes the FedEx world headquarters), Baptist
Medical Complex, and numerous retail locations
Great visibility from Winchester Road, with immediate access to Bill Morris Parkway
Note: Operating metrics as of 6/30/2015.
11
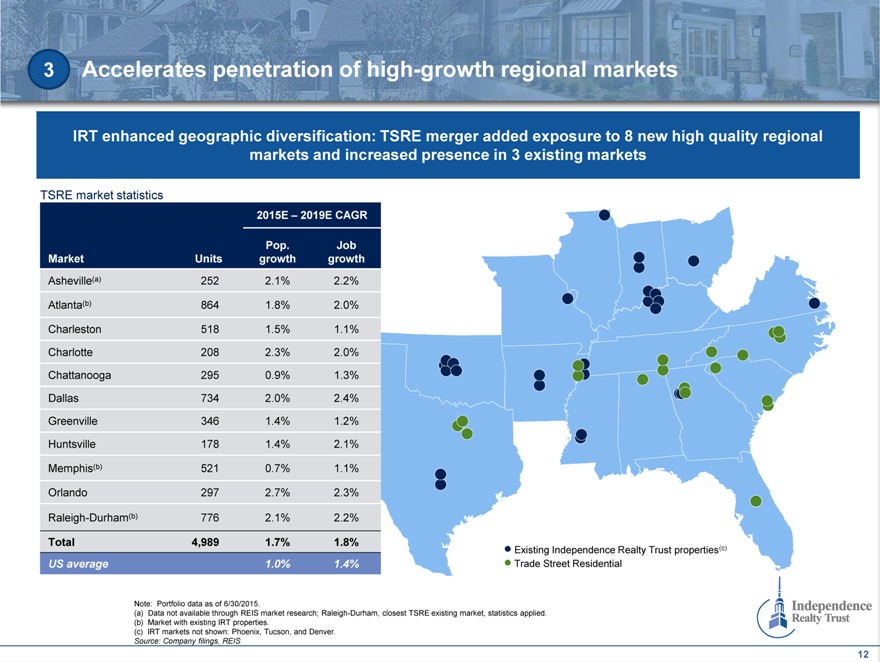
3 | | Accelerates penetration of high-growth regional markets |
IRT enhanced geographic diversification: TSRE merger added exposure to 8 new high quality regional markets and increased presence in 3 existing markets
TSRE market statistics
2015E – 2019E CAGR
Pop. Job
Market Units growth growth
Asheville(a) 252 2.1% 2.2%
Atlanta(b) 864 1.8% 2.0%
Charleston 518 1.5% 1.1%
Charlotte 208 2.3% 2.0%
Chattanooga 295 0.9% 1.3%
Dallas 734 2.0% 2.4%
Greenville 346 1.4% 1.2%
Huntsville 178 1.4% 2.1%
Memphis(b) 521 0.7% 1.1%
Orlando 297 2.7% 2.3%
Raleigh-Durham(b) 776 2.1% 2.2%
Total 4,989 1.7% 1.8%
US average 1.0% 1.4%
Existing Independence Realty Trust properties(c) Trade Street Residential
Note: Portfolio data as of 6/30/2015.
(a) Data not available through REIS market research; Raleigh-Durham, closest TSRE existing market, statistics applied. (b) Market with existing IRT properties.
(c) | | IRT markets not shown: Phoenix, Tucson, and Denver. |
Source: Company filings, REIS
12
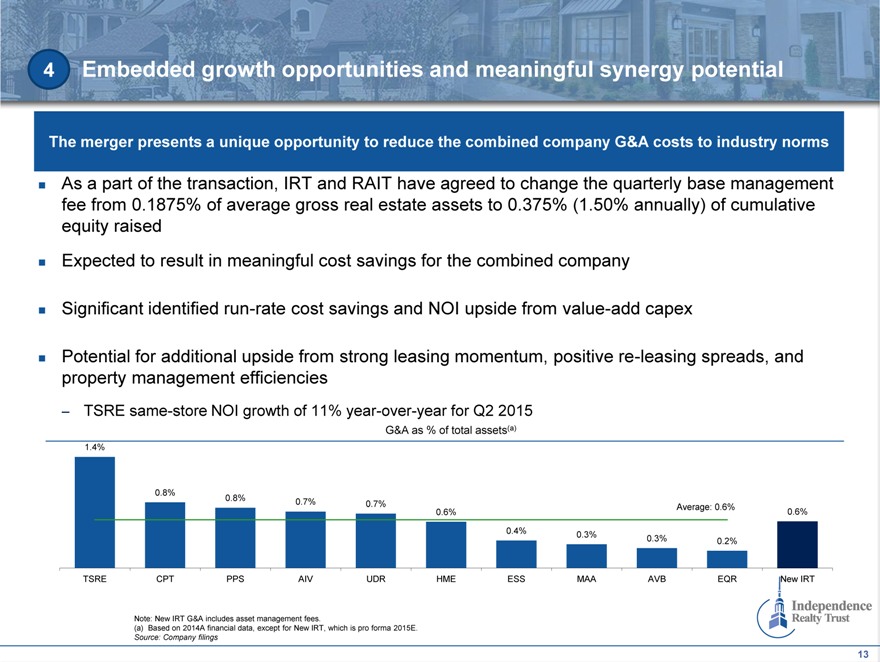
4 | | Embedded growth opportunities and meaningful synergy potential |
The merger presents a unique opportunity to reduce the combined company G&A costs to industry norms
As a part of the transaction, IRT and RAIT have agreed to change the quarterly base management fee from 0.1875% of average gross real estate assets to 0.375% (1.50% annually) of cumulative equity raised
Expected to result in meaningful cost savings for the combined company
Significant identified run-rate cost savings and NOI upside from value-add capex
Potential for additional upside from strong leasing momentum, positive re-leasing spreads, and property management efficiencies
– TSRE same-store NOI growth of 11% year-over-year for Q2 2015
G&A as % of total assets(a)
1.4%
0.8%
0.8% 0.7% 0.7% Average: 0.6%
0.6% 0.6%
0.4% 0.3%
0.3% 0.2%
TSRE CPT PPS AIV UDR HME ESS MAA AVB EQR New IRT
Note: New IRT G&A includes asset management fees.
(a) | | Based on 2014A financial data, except for New IRT, which is pro forma 2015E. |
Source: Company filings
13
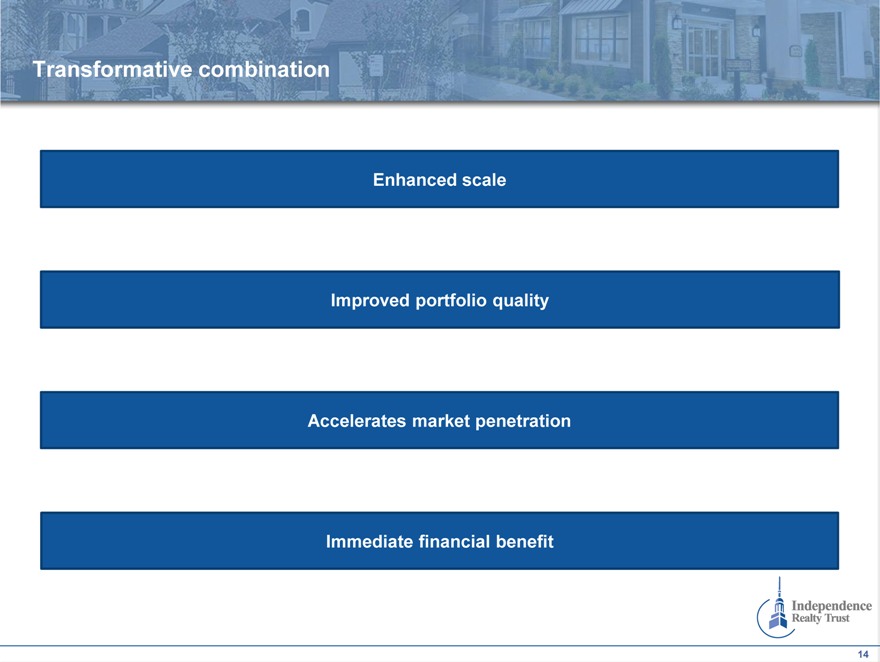
Transformative combination
Enhanced scale
Improved portfolio quality
Accelerates market penetration
Immediate financial benefit
14
Appendix
15
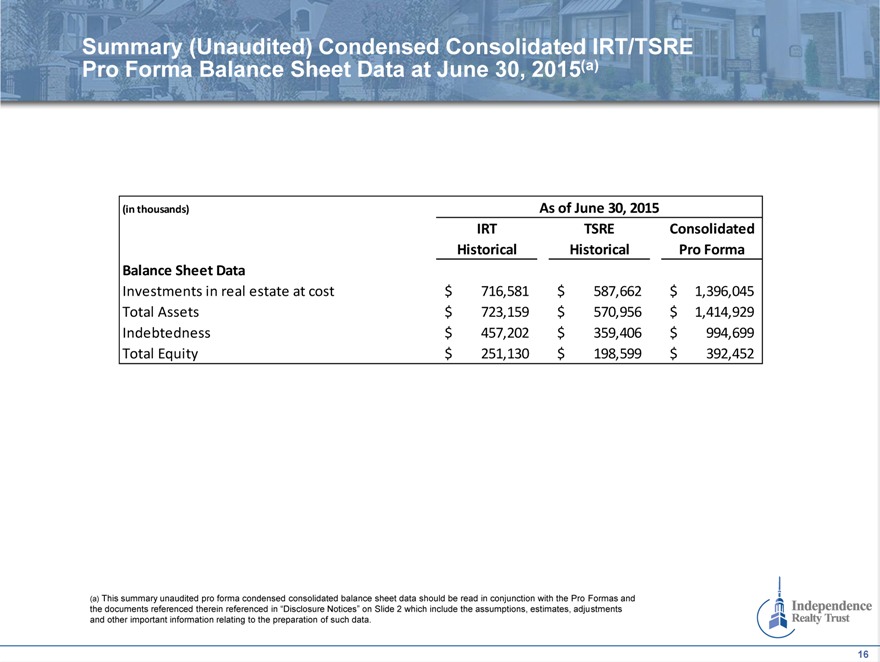
Summary (Unaudited) Condensed Consolidated IRT/TSRE Pro Forma Balance Sheet Data at June 30, 2015(a)
(in thousands) As of June 30, 2015
IRT TSRE Consolidated
Historical Historical Pro Forma
Balance Sheet Data
Investments in real estate at cost $ 716,581 $ 587,662 $ 1,396,045
Total Assets $ 723,159 $ 570,956 $ 1,414,929
Indebtedness $ 457,202 $ 359,406 $ 994,699
Total Equity $ 251,130 $ 198,599 $ 392,452
(a) This summary unaudited pro forma condensed consolidated balance sheet data should be read in conjunction with the Pro Formas and the documents referenced therein referenced in “Disclosure Notices” on Slide 2 which include the assumptions, estimates, adjustments and other important information relating to the preparation of such data.
16
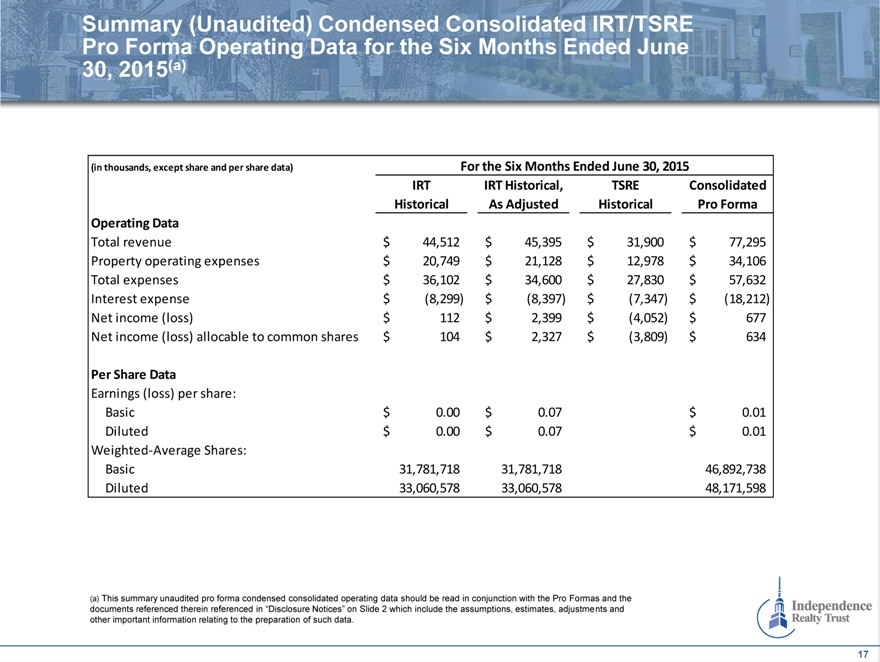
Summary (Unaudited) Condensed Consolidated IRT/TSRE Pro Forma Operating Data for the Six Months Ended June 30, 2015(a)
(in thousands, except share and per share data) For the Six Months Ended June 30, 2015
IRT IRT Historical, TSRE Consolidated
Historical As Adjusted Historical Pro Forma
Operating Data
Total revenue $ 44,512 $ 45,395 $ 31,900 $ 77,295
Property operating expenses $ 20,749 $ 21,128 $ 12,978 $ 34,106
Total expenses $ 36,102 $ 34,600 $ 27,830 $ 57,632
Interest expense $ (8,299) $ (8,397) $ (7,347) $ (18,212)
Net income (loss) $ 112 $ 2,399 $ (4,052) $ 677
Net income (loss) allocable to common shares $ 104 $ 2,327 $ (3,809) $ 634
Per Share Data
Earnings (loss) per share:
Basic $ 0.00 $ 0.07 $ 0.01
Diluted $ 0.00 $ 0.07 $ 0.01
Weighted-Average Shares:
Basic 31,781,718 31,781,718 46,892,738
Diluted 33,060,578 33,060,578 48,171,598
(a) This summary unaudited pro forma condensed consolidated operating data should be read in conjunction with the Pro Formas and the documents referenced therein referenced in “Disclosure Notices” on Slide 2 which include the assumptions, estimates, adjustments and other important information relating to the preparation of such data.
17