Exhibit 99.2
NYSE: IRT
WWW.IRTLIVING.COM
TABLE OF CONTENTS
Independence Realty Trust
March 31, 2022
Company Information:
Independence Realty Trust, Inc. (NYSE: IRT) is a real estate investment trust that owns and operates multifamily apartment properties, across non-gateway U.S. markets including Atlanta, GA, Dallas, TX, Denver, CO, Columbus, OH, Indianapolis, IN, Oklahoma City, OK, Raleigh-Durham, NC, Houston, TX , Nashville, TN, and Memphis, TN. IRT’s investment strategy is focused on gaining scale within key amenity rich submarkets that offer good school districts, high-quality retail and major employment centers. IRT aims to provide stockholders attractive risk-adjusted returns through diligent portfolio management, strong operational performance, and a consistent return on capital through distributions and capital appreciation. More information may be found on the Company’s website www.irtliving.com.
| | | | | |
| Corporate Headquarters | 1835 Market Street, Suite 2601 |
| Philadelphia, PA 19103 |
| 267.270.4800 |
| |
| Trading Symbol | NYSE: “IRT” |
| |
| Investor Relations Contact | Edelman Financial Communications & Capital Markets |
| Ted McHugh and Lauren Torres |
| 917-365-7979 |
| IRT@edelman.com |
Forward-Looking Statements
This supplemental package contains certain forward-looking statements within the meaning of Section 27A of the Securities Act of 1933, as amended, and Section 21E of the Securities Exchange Act of 1934, as amended. Such forward-looking statements can generally be identified by our use of forward-looking terminology such as “will,” “strategy,” “expects,” “seeks,” “believes,” “potential,” or other similar words. These forward-looking statements include, without limitation, our expectations with respect to our operating performance and financial results, including our 2022 earnings guidance, timing and amount of future dividends, timing and terms of property acquisitions, dispositions, joint venture investments, developments and redevelopments and other capital expenditures, timing and terms of capital raising and other financing activity, lease pricing, revenue and expense growth, occupancy levels, supply levels, job growth, interest rates and other economic expectations, and anticipated benefits of our recently completed merger (the “STAR Merger”) with Steadfast Apartment REIT, Inc. (“STAR”), including as to the amount of synergies from the STAR Merger. Such forward-looking statements involve risks, uncertainties, estimates and assumptions and our actual results may differ materially from the expectations, intentions, beliefs, plans or predictions of the future expressed or implied by such forward-looking statements. These forward-looking statements are based upon the current beliefs and expectations of our management and are inherently subject to significant business, economic and competitive uncertainties and contingencies, many of which are difficult to predict and not within our control. In addition, these forward-looking statements are subject to assumptions with respect to future business strategies and decisions that are subject to change. Risks and uncertainties that might cause our future actual results and/or future dividends to differ materially from those expressed or implied by forward-looking statements include, but are not limited to: (i) risks related to the impact of COVID-19 and other potential outbreaks of infectious diseases on our financial condition, results of operations, cash flows and the impact of such risks on the financial condition of our residents and their ability to pay rent; (ii) the nature and duration of measures taken by federal, state and local government authorities to combat the spread of disease; (iii) changes in market demand for rental apartment homes and pricing pressures, including from competitors, that could limit our ability to lease units or increase rents or that could lead to declines in occupancy and rent levels; (iv) uncertainty and volatility in capital and credit markets, including changes that reduce availability, and increase costs, of capital; (v) increased costs on account of inflation; (vi) inability of tenants to meet their rent and other lease obligations and charge-offs in excess of our allowance for bad debt; (vii) legislative restrictions that may regulate rents or delay or limit collections of past due rents; (viii) risks endemic to real estate and the real estate industry generally; (ix) impairment charges; (x) the effects of natural and other disasters; (xi) delays in completing, and cost overruns incurred in connection with, our value add initiatives and failure to achieve projected rent increases and occupancy levels on account of the initiatives; (xii) failure to realize the cost savings, synergies and other benefits expected to result from the STAR Merger; (xiii) unexpected costs or delays in integration of the IRT and STAR businesses; (xiv) unknown or unexpected liabilities related to the STAR Merger; (xv) unexpected costs of REIT qualification compliance; (xvi) unexpected changes in our intention or ability to repay certain debt prior to maturity; (xvii) inability to sell certain assets within the time frames or at the pricing levels expected; (xviii) costs and disruptions as the result of a cybersecurity incident or other technology disruption; and (xix) share price fluctuations. Please refer to the documents filed by us with the SEC, including specifically the “Risk Factors” sections of our Annual Report on Form 10-K for the year ended December 31, 2021, and our other filings with the SEC, which identify additional factors that could cause actual results to differ from those contained in forward-looking statements. We undertake no obligation to update these forward-looking statements to reflect events or circumstances after the date hereof or to reflect the occurrence of unanticipated events, except as may be required by law. In addition, the declaration of dividends on our common stock is subject to the discretion of our Board of Directors and depends upon a broad range of factors, including our results of operations, financial condition, capital requirements, the annual distribution requirements under the REIT provisions of the Internal Revenue Code of 1986, as amended, applicable legal requirements and such other factors as our Board of Directors may from time to time deem relevant.
Independence Realty Trust Announces First Quarter 2022 Financial Results
Raises Full Year 2022 Guidance
PHILADELPHIA – (BUSINESS WIRE) – May 3, 2022 Independence Realty Trust, Inc. (“IRT”) (NYSE: IRT), a multifamily apartment REIT, today announced its first quarter 2022 financial results.
First Quarter Highlights
•Net income available to common shares of $74.6 million for the quarter ended March 31, 2022 compared to $1.1 million for the quarter ended March 31, 2021.
•Earnings per diluted share of $0.34 for the quarter ended March 31, 2022 compared to $0.01 for the quarter ended March 31, 2021.
•Combined same-store net operating income (“NOI”) growth of 16.2% for the quarter ended March 31, 2022 compared to the quarter ended March 31, 2021.
•Core Funds from Operations (“CFFO”) of $57.7 million for the quarter ended March 31, 2022 compared to $18.0 million for the quarter ended March 31, 2021. CFFO per share was $0.25 for the first quarter of 2022, as compared to $0.18 for the first quarter of 2021.
•Adjusted EBITDA of $81.4 million for the quarter ended March 31, 2022 compared to $26.4 million for the quarter ended March 31, 2021.
•Value add program for the quarter ended March 31, 2022, has completed renovations at 143 units, achieving a weighted average return on investment during the quarter of 32.0%.
Included later in this press release are definitions of NOI, CFFO, Adjusted EBITDA and other Non-GAAP financial measures and reconciliations of such measures to their most comparable financial measures as calculated and presented in accordance with GAAP.
Management Commentary
“We are pleased with the outstanding results our newly combined portfolio generated during the first quarter of 2022,” said Scott Schaeffer, Chairman and CEO of IRT. “For the first quarter of 2022, combined same-store NOI increased by 16.2%, led by blended lease over lease rental growth of 12.8%. Our merger integration is complete, and we have secured $31 million in annual synergies. We continue to evaluate accretive joint venture opportunities, including a new investment in a single-family rental development. Overall, we are excited for what lies ahead in 2022 and the years to come, as we remain confident in our strategy focused on multifamily properties in the high-growth Sunbelt region.”
Combined Same-Store Property Operating Results
| | | | | | |
| First Quarter 2022 Compared to First Quarter 2021(1) | |
| Rental and other property revenue | 11.0% increase | |
| Property operating expenses | 3.2% increase | |
| Net operating income (“NOI”) | 16.2% increase | |
| Portfolio average occupancy | 10 bps increase to 95.4% | |
| Portfolio average rental rate | 10.4% increase to $1,373 | |
| NOI Margin | 280 bps increase to 62.9% | |
(1)Combined same-store portfolio for the three months ended March 31, 2022 includes 113 properties, which represent 33,804 units.
Operating Metrics
The table below summarizes operating metrics for the combined same-store portfolio for the applicable periods.
| | | | | | | | |
| 1Q 2022 | 2Q 2022(3) |
| | |
| | |
| | |
| | |
| | |
| | |
| | |
| | |
| | |
| | |
| | |
| | |
| | |
| | |
Combined Same-Store Portfolio(1) | | |
| Average Occupancy | 95.4 | % | 95.4 | % |
Lease Over Lease Effective Rental Rate Growth:(2) | | |
| New Leases | 15.7 | % | 15.8 | % |
| Renewal Leases | 10.2 | % | 9.5 | % |
| Blended | 12.8 | % | 11.5 | % |
| Resident retention rate | 50.9 | % | 54.6 | % |
(1)Combined same-store portfolio for the three months ended March 31, 2022 includes 113 properties, which represent 33,804 units.
(2)Lease-over-lease effective rent growth represents the change in effective monthly rent, as adjusted for concessions, for each unit that had a prior lease and current lease that are for a term of 9-13 months.
(3)2Q 2022 average occupancy and resident retention rates are as through May 1, 2022. 2Q 2022 new lease and renewal rates are for leases commencing during 2Q 2022 that were signed as of May 1, 2022.
Value Add Program
We completed renovations on 143 units during the quarter ended March 31, 2022, achieving a return on investment of 32.0%, with an average cost per unit renovated of $12,436, and average rent increase per renovated unit of $331. See the Value Add Summary page of our supplemental for additional information.
Investment Activity
Acquisitions
Subsequent to quarter-end, on April 6, 2022, we purchased for $25.4 million the Views of Music City (Phase 1), a 96-unit community in Nashville, TN from one of our unconsolidated joint ventures. The property was developed by our joint venture partner and was completed in January 2022. The Views of Music City (Phase 1) has an average rent per occupied unit of $1,451 and is currently in lease-up with stabilization expected to occur in June 2022. The acquisition represents the exercise of our purchase option under the terms of the joint venture agreement entered into on September 3, 2021. Development of Phase 2, which consists of 209 units, is expected to be completed during Q4 2023.
Dispositions
In connection with our merger with STAR and during the three months ended March 31, 2022, we completed the following dispositions and used net proceeds from these sales to repay debt of the combined company.
•Riverchase in Indianapolis, IN: sold on January 18, 2022 and recognized a gain on sale of $12.9 million.
•Haverford Place in Louisville, KY: sold on February 2, 2022 and recognized a gain on sale of $16.7 million.
•Heritage Park in Oklahoma City, OK: sold on February 2, 2022 and recognized a gain on sale of $31.4 million.
•Raindance in Oklahoma City, OK: sold on February 2, 2022 and recognized a gain on sale of $33.7 million.
Held for Sale
As of March 31, 2022, in connection with our ongoing capital recycling program, we identified two properties, Meadows Apartments in Louisville, KY and Sycamore Terrace in Terra Haute, IN, as held for sale. We expect these dispositions to close in the third quarter of 2022. We intend to recycle the net proceeds from the sales into the acquisition of properties in markets that we believe have better long-term growth prospects.
Virtuoso Joint Venture Investment
On March 31, 2022, we formed a joint venture to acquire and own a project comprised of 400 single family home rental units in Huntsville, AL. Development of phase one of this project (comprised of 178 homes) was completed in 2021 and was acquired by the joint venture on March 31, 2022. Upon acquisition of phase one by the joint venture, 85% of the homes were leased. The joint venture expects to acquire phase two of the project (comprised of 222 homes), currently expected to occur in the second quarter of 2022. We have committed to invest an aggregate $37.1 million in this joint venture, of which $16.4 million was funded on March 31, 2022.
Capital Expenditures
For the three months ended March 31, 2022, recurring capital expenditures for the total portfolio were $3.9 million, or $106 per unit.
At-the-Market Offering
On November 13, 2020 we entered into an equity distribution agreement pursuant to which we may from time to time offer and sell shares of our common stock having an aggregate offering price of up to $150 million (the “ATM Program”) in negotiated transactions or transactions that are deemed to be “at the market” offerings. Under the ATM Program, we may also enter into one or more forward sale transactions for the sale of shares of our common stock on a forward basis. During the three months ended March 31, 2022, we entered into a forward sale transaction under the ATM Program for the forward sale of 1,000,000 shares of our common stock. We expect to physically settle the forward sale transaction by the maturity date (March 31, 2023) of the forward sale transaction. Assuming the forward sale transaction is physically settled in full utilizing the current forward sale price of $26.86 per share, we expect to receive proceeds, net of sales commissions, of approximately $26.5 million, subject to adjustment in accordance with the forward sale transaction.
Distributions
On March 14, 2022, our Board of Directors declared a quarterly cash dividend of $0.12 per share of our common stock, which was paid on April 22, 2022 to stockholders of record at the close of business on April 1, 2022.
2022 EPS and CFFO Guidance
We are raising our 2022 full year guidance. Earnings per diluted share is now projected to be in the range of $0.50 to $0.52. A reconciliation of IRT's projected net income allocable to common shares to its projected CFFO per share is included below. See the schedules and definitions at the end of this release for further information regarding how IRT calculates CFFO and for management’s definition and rationale for the usefulness of CFFO.
| | | | | | | | | | | | | | | | | | | | | | | |
| Previous Guidance | | Current Guidance |
2022 Full Year EPS and CFFO Guidance (1)(2) | Low | | High | | Low | | High |
| Earnings per share | $0.32 | | $0.36 | | $0.50 | | $0.52 |
| Adjustments: | | | | | | | |
Depreciation and amortization (3) | 1.10 | | 1.10 | | 1.12 | | 1.12 |
Gain on sale of real estate assets (4) | (0.42) | | (0.42) | | (0.58) | | (0.58) |
| Core FFO per share allocated to common shareholders | $1.00 | | $1.04 | | $1.04 | | $1.06 |
(1)This guidance, including the underlying assumptions presented in the table below, constitutes forward-looking information. Actual full year 2022 EPS and CFFO could vary significantly from the projections presented. See “Forward-Looking Statements” below. Our guidance is based on the key guidance assumptions detailed below.
(2)Per share guidance is based on 228.0 million weighted average shares and units outstanding.
(3)Depreciation and amortization includes $53.3 million ($0.23 per share) of amortization related to STAR in-place lease intangibles that are a result of GAAP purchase accounting. These intangibles are expected to be amortized over less than one year.
(4)Gains on sale of real estate assets include the four asset sales that occurred during the first quarter of 2022 and the two properties identified as held for sale as of March 31, 2022.
2022 Guidance Assumptions
Our key guidance assumptions for 2022 are enumerated below. See definitions at the end of this release for further information regarding our same-store definitions.
| | | | | | | | |
| Combined Same-Store Portfolio | Previous 2022 Outlook | Current 2022 Outlook(1) |
| Number of properties/units | 115 properties / 34,454 units | 113 properties / 33,804 units |
| Property revenue growth | 8.1% to 9.1% | 9.1% to 10.1% |
| Controllable operating expense growth | 2.5% to 3.5% | 3.0% to 4.0% |
| Real estate tax and insurance expense growth | 6.5% to 8.5% | 6.5% to 8.5% |
| Total operating expense growth | 4.0% to 5.5% | 4.25% to 5.75% |
| Property NOI growth | 10.0% to 12.0% | 11.5% to 13.5% |
| | |
| General and administrative & Property management expenses | $48.0 million to $51.0 million | $48.0 million to $51.0 million |
Interest expense(2) | $100.0 million to $103.0 million | $98.0 million to $100.0 million |
| | |
Transaction/Investment Volume(3) | | |
| Acquisition volume | None assumed | $25 to $250 million |
| Disposition volume | $157 million | $157 to $400 million |
| | |
| Capital Expenditures | | |
| Recurring | $18.5 million to $21.5 million | $18.5 million to $21.5 million |
| Value add & non-recurring | $42.5 million to $47.5 million | $42.5 million to $47.5 million |
| Development | $65.0 million to $75.0 million | $65.0 million to $75.0 million |
(1)This guidance, including the underlying assumptions, constitutes forward-looking information. Actual results could vary significantly from the projections presented. See “Forward-Looking Statements” below.
(2)Interest expense includes amortization of deferred financing costs but excludes loan premium accretion, net. As a result of purchase accounting, we recorded a $72.1 million loan premium, net, related to STAR debt. This loan premium will be accreted into and reduce GAAP interest expense over the remaining term of the associated debt. However, loan premium accretion will be excluded from CFFO.
(3)We continue to evaluate our portfolio for capital recycling opportunities so actual acquisitions and dispositions could vary significantly from our projections. We undertake no duty to update these assumptions. See “Forward-Looking Statements” below.
Selected Financial Information
See the schedules at the end of this earnings release for selected financial information for IRT.
Non-GAAP Financial Measures and Definitions
We disclose the following non-GAAP financial measures in this earnings release: FFO, CFFO, NOI and Adjusted EBITDA. Included at the end of this release are definitions of these non-GAAP financial measures and a reconciliation of our reported net income to our FFO and CFFO, a reconciliation of our same-store NOI to our reported net income, a reconciliation of our Adjusted EBITDA to net income, and management’s rationales for the usefulness of each of these and other non-GAAP financial measures used in this release.
Conference Call
All interested parties can listen to the live conference call webcast at 9:00 AM ET on Wednesday, May 4, 2022 from the investor relations section of the IRT website at www.irtliving.com or by dialing 1.844.200.6205, access code 594917. For those who are not available to listen to the live call, the replay will be available shortly following the live call from the investor relations section of IRT’s website until the next earnings release. A playback of the conference call can also be accessed telephonically until Wednesday, May 11, 2022 by dialing 1.866.813.9403, access code 681002.
Supplemental Information
We produce supplemental information that includes details regarding the performance of the portfolio, financial information, non-GAAP financial measures, same-store information and other useful information for investors. The supplemental information is available via our website, www.irtliving.com, through the "Investor Relations" section.
About Independence Realty Trust, Inc.
Independence Realty Trust, Inc. (NYSE: IRT) is a real estate investment trust that owns and operates multifamily apartment properties, across non-gateway U.S. markets including Atlanta, GA, Dallas, TX, Denver, CO, Columbus, OH, Indianapolis, IN, Oklahoma City, OK, Raleigh-Durham, NC, Houston, TX , Nashville, TN, and Memphis, TN. IRT’s investment strategy is focused on gaining scale within key amenity rich submarkets that offer good school districts, high-quality retail and major employment centers. IRT aims to provide stockholders attractive risk-adjusted returns through diligent portfolio management, strong operational performance, and a consistent return on capital through distributions and capital appreciation. More information may be found on the Company’s website www.irtliving.com.
Forward-Looking Statements
This press release contains certain forward-looking statements within the meaning of Section 27A of the Securities Act of 1933, as amended, and Section 21E of the Securities Exchange Act of 1934, as amended. Such forward-looking statements can generally be identified by our use of forward-looking terminology such as “will,” “strategy,” “expects,” “seeks,” “believes,” “potential,” or other similar words. These forward-looking statements include, without limitation, our expectations with respect to our operating performance and financial results, including our 2022 earnings guidance, timing and amount of future dividends, timing and terms of property acquisitions, dispositions, joint venture investments, developments and redevelopments and other capital expenditures, timing and terms of capital raising and other financing activity, lease pricing, revenue and expense growth, occupancy levels, supply levels, job growth, interest rates and other economic expectations, and anticipated benefits of our recently completed merger (the “STAR Merger”) with Steadfast Apartment REIT, Inc. (“STAR”), including as to the amount of synergies from the STAR Merger. Such forward-looking statements involve risks, uncertainties, estimates and assumptions and our actual results may differ materially from the expectations, intentions, beliefs, plans or predictions of the future expressed or implied by such forward-looking statements. These forward-looking statements are based upon the current beliefs and expectations of our management and are inherently subject to significant business, economic and competitive uncertainties and contingencies, many of which are difficult to predict and not within our control. In addition, these forward-looking statements are subject to assumptions with respect to future business strategies and decisions that are subject to change. Risks and uncertainties that might cause our future actual results and/or future dividends to differ materially from those expressed or implied by forward-looking statements include, but are not limited to: (i) risks related to the impact of COVID-19 and other potential outbreaks of infectious diseases on our financial condition, results of operations, cash flows and the impact of such risks on the financial condition of our residents and their ability to pay rent; (ii) the nature and duration of measures taken by federal, state and local government authorities to combat the spread of disease; (iii) changes in market demand for rental apartment homes and pricing pressures, including from competitors, that could limit our ability to lease units or increase rents or that could lead to declines in occupancy and rent levels; (iv) uncertainty and volatility in capital and credit markets, including changes that reduce availability, and increase costs, of capital; (v) increased costs on account of inflation; (vi) inability of tenants to meet their rent and other lease obligations and charge-offs in excess of our allowance for bad debt; (vii) legislative restrictions that may regulate rents or delay or limit collections of past due rents; (viii) risks endemic to real estate and the real estate industry generally; (ix) impairment charges; (x) the effects of natural and other disasters; (xi) delays in completing, and cost overruns incurred in connection with, our value add initiatives and failure to achieve projected rent increases and occupancy levels on account of the initiatives; (xii) failure to realize the cost savings, synergies and other benefits expected to result from the STAR Merger; (xiii) unexpected costs or delays in integration of the IRT and STAR businesses; (xiv) unknown or unexpected liabilities related to the STAR Merger; (xv) unexpected costs of REIT qualification compliance; (xvi) unexpected changes in our intention or ability to repay certain debt prior to maturity; (xvii) inability to sell certain assets within the time frames or at the pricing levels expected; (xviii) costs and disruptions as the result of a cybersecurity incident or other technology disruption; and (xix) share price fluctuations. Please refer to the documents filed by us with the SEC, including specifically the “Risk Factors” sections of our Annual Report on Form 10-K for the year ended December 31, 2021, and our other filings with the SEC, which identify additional factors that could cause actual results to differ from those contained in forward-looking statements. We undertake no obligation to update these forward-looking statements to reflect events or circumstances after the date hereof or to reflect the occurrence of unanticipated events, except as may be required by law. In addition, the declaration of dividends on our common stock is subject to the discretion of our Board of Directors and depends upon a broad range of factors, including our results of operations, financial condition, capital requirements, the annual distribution requirements under the REIT provisions of the Internal Revenue Code of 1986, as amended, applicable legal requirements and such other factors as our Board of Directors may from time to time deem relevant.
FINANCIAL & OPERATING HIGHLIGHTS
Dollars in thousands, except per share data
| | | | | | | | | | | | | | | | | | | | | | | | | | | | | |
| For the Three Months Ended |
| March 31, 2022 | | December 31, 2021 | | September 30, 2021 | | June 30, 2021 | | March 31, 2021 |
| Selected Financial Information: | | | | | | | | | |
| Operating Statistics: | | | | | | | | | |
| Net income available to common shares | $ | 74,600 | | | $ | 28,615 | | | $ | 11,502 | | | $ | 3,386 | | | $ | 1,086 | |
| Earnings (loss) per share -- diluted | $ | 0.34 | | | $ | 0.23 | | | $ | 0.11 | | | $ | 0.03 | | | $ | 0.01 | |
| Rental and other property revenue | $ | 149,977 | | | $ | 76,803 | | | $ | 60,592 | | | $ | 57,286 | | | $ | 54,811 | |
| Property operating expenses | $ | 55,883 | | | $ | 26,952 | | | $ | 23,164 | | | $ | 22,298 | | | $ | 20,838 | |
| Net operating income | $ | 94,094 | | | $ | 49,851 | | | $ | 37,428 | | | $ | 34,988 | | | $ | 33,973 | |
| NOI margin | 62.7 | % | | 64.9 | % | | 61.8 | % | | 61.1 | % | | 62.0 | % |
| Adjusted EBITDA | $ | 81,375 | | | $ | 42,301 | | | $ | 31,432 | | | $ | 28,729 | | | $ | 26,389 | |
| CORE FFO per share | $ | 0.25 | | | $ | 0.24 | | | $ | 0.21 | | | $ | 0.20 | | | $ | 0.18 | |
| Dividends per share | $ | 0.12 | | | $ | 0.12 | | | $ | 0.12 | | | $ | 0.12 | | | $ | 0.12 | |
| CORE FFO payout ratio | 48.0 | % | | 50.0 | % | | 57.1 | % | | 60.0 | % | | 66.7 | % |
| Portfolio Data: | | | | | | | | | |
| Total gross assets | $ | 6,731,377 | | | $ | 6,785,648 | | | $ | 2,114,743 | | | $ | 2,133,021 | | | $ | 1,970,979 | |
| Total number of operating properties | 119 | | | 123 | | | 57 | | | 58 | | | 56 | |
| Total units | 35,498 | | | 36,831 | | | 16,109 | | | 16,261 | | | 15,667 | |
| Period end occupancy | 95.4 | % | | 95.6 | % | | 96.0 | % | | 95.6 | % | | 95.5 | % |
| Total portfolio average occupancy | 95.2 | % | | 96.0 | % | | 96.1 | % | | 95.9 | % | | 95.4 | % |
Total portfolio average effective monthly rent,
per unit | $ | 1,374 | | | $ | 1,329 | | | $ | 1,212 | | | $ | 1,171 | | | $ | 1,142 | |
Combined same store period end occupancy(a) | 95.5 | % | | 95.7 | % | | 96.2 | % | | 96.1 | % | | 95.5 | % |
Combined same store portfolio average occupancy(a) | 95.4 | % | | 96.0 | % | | 96.5 | % | | 96.2 | % | | 95.3 | % |
Combined same store portfolio average effective monthly rent, per unit(a) | $ | 1,373 | | | $ | 1,346 | | | $ | 1,305 | | | $ | 1,261 | | | $ | 1,244 | |
| Capitalization: | | | | | | | | | |
Total debt(b) | $ | 2,542,088 | | | $ | 2,705,336 | | | $ | 996,270 | | | $ | 1,036,841 | | | $ | 947,631 | |
| Common share price, period end | $ | 26.44 | | | $ | 25.83 | | | $ | 20.35 | | | $ | 18.23 | | | $ | 15.20 | |
| Market equity capitalization | $ | 6,031,873 | | | $ | 5,882,410 | | | $ | 2,150,162 | | | $ | 1,926,218 | | | $ | 1,561,165 | |
| Total market capitalization | $ | 8,573,961 | | | $ | 8,587,746 | | | $ | 3,146,432 | | | $ | 2,963,059 | | | $ | 2,508,796 | |
| Total debt/total gross assets | 37.8 | % | | 39.9 | % | | 47.1 | % | | 48.6 | % | | 48.1 | % |
Net debt to Adjusted EBITDA (pro forma)(c) | 7.6x | | 7.7x | | 8.2x | | 8.5x | | 8.2x |
| Interest coverage | 4.0x | | 3.9x | | 3.6x | | 3.4x | | 3.1x |
| Common shares and OP Units: | | | | | | | | | |
| Shares outstanding | 221,163,391 | | | 220,753,735 | | | 105,106,714 | | | 105,109,649 | | | 102,033,733 | |
| OP units outstanding | 6,970,993 | | | 6,981,841 | | | 552,360 | | | 552,360 | | | 674,515 | |
| Common shares and OP units outstanding | 228,134,384 | | | 227,735,577 | | | 105,659,074 | | | 105,662,009 | | | 102,708,248 | |
Weighted average common shares and OP
units | 227,778,484 | | | 127,046,225 | | | 107,094,044 | | | 102,584,809 | | | 102,353,380 | |
(a)Combined same-store portfolio consists of 113 properties, which represent 33,804 units.
(b)Includes indebtedness associated with real estate held for sale.
(c)Reflects pro forma net debt to Adjusted EBITDA for each period presented, which includes adjustments for the timing of acquisitions, the full quarter effect of current value add initiatives, the completion of capital recycling activities including paydown of associated indebtedness, and the normalization of items impacting quarterly EBITDA. Actual net debt to Adjusted EBITDA multiples for the five quarters ended March 31, 2021 were 7.5x, 15.4x, 8.0x, 9.1x, and 8.9x, respectively.
BALANCE SHEETS
Dollars in thousands, except per share data
| | | | | | | | | | | | | | | | | | | | | | | | | | | | | |
| As of |
| March 31, 2022 | | December 31, 2021 | | September 30, 2021 | | June 30, 2021 | | March 31, 2021 |
| Assets: | | | | | | | | | |
| Real estate held for investment, at cost | $ | 6,382,324 | | | $ | 6,462,355 | | | $ | 1,904,760 | | | $ | 2,035,988 | | | $ | 1,922,071 | |
| Less: accumulated depreciation | (283,666) | | | (243,475) | | | (223,244) | | | (231,866) | | | (223,187) | |
| Real estate held for investment, net | 6,098,658 | | | 6,218,880 | | | 1,681,516 | | | 1,804,122 | | | 1,698,884 | |
| Real estate held for sale | 80,992 | | | 61,560 | | | 120,409 | | | 27,910 | | | — | |
| Real estate under development | 48,959 | | | 41,777 | | | — | | | — | | | — | |
| Cash and cash equivalents | 23,971 | | | 35,972 | | | 8,720 | | | 7,566 | | | 8,653 | |
| Restricted cash | 26,789 | | | 29,699 | | | 6,138 | | | 6,441 | | | 4,449 | |
Investment in unconsolidated real estate
entities | 43,541 | | | 24,999 | | | 13,561 | | | 10,205 | | | — | |
| Other assets | 27,281 | | | 38,052 | | | 15,053 | | | 17,311 | | | 12,824 | |
| Derivative assets | 12,944 | | | 2,488 | | | 1,168 | | | 853 | | | 2,810 | |
| Intangible assets, net | 24,187 | | | 53,269 | | | 346 | | | 714 | | | 396 | |
| Total assets | $ | 6,387,322 | | | $ | 6,506,696 | | | $ | 1,846,911 | | | $ | 1,875,122 | | | $ | 1,728,016 | |
| Liabilities and Equity: | | | | | | | | | |
| Indebtedness, net | $ | 2,495,410 | | | $ | 2,705,336 | | | $ | 996,270 | | | $ | 1,036,841 | | | $ | 947,631 | |
Indebtedness associated with real estate
held for sale, net | 46,678 | | | — | | | 22,459 | | | 19,622 | | | — | |
| Accounts payable and accrued expenses | 81,498 | | | 106,332 | | | 39,593 | | | 30,530 | | | 24,535 | |
| Accrued interest payable | 6,955 | | | 7,175 | | | 1,708 | | | 1,909 | | | 1,888 | |
| Dividends payable | 27,345 | | | 16,792 | | | 12,648 | | | 12,648 | | | 12,293 | |
| Derivative liabilities | 128 | | | 11,896 | | | 17,492 | | | 19,386 | | | 19,540 | |
| Other liabilities | 15,921 | | | 17,089 | | | 6,756 | | | 6,903 | | | 6,991 | |
| Total liabilities | 2,673,935 | | | 2,864,620 | | | 1,096,926 | | | 1,127,839 | | | 1,012,878 | |
| Equity: | | | | | | | | | |
| Shareholders' Equity: | | | | | | | | | |
| Preferred shares, $0.01 par value per share | — | | | — | | | — | | | — | | | — | |
| Common shares, $0.01 par value per share | 2,212 | | | 2,208 | | | 1,051 | | | 1,051 | | | 1,018 | |
| Additional paid in capital | 3,678,478 | | | 3,678,903 | | | 965,018 | | | 963,754 | | | 920,042 | |
Accumulated other comprehensive income
(loss) | 9,958 | | | (11,940) | | | (19,507) | | | (22,011) | | | (20,497) | |
| Retained earnings (deficit) | (140,643) | | | (188,410) | | | (200,429) | | | (199,350) | | | (190,151) | |
| Total shareholders' equity | 3,550,005 | | | 3,480,761 | | | 746,133 | | | 743,444 | | | 710,412 | |
| Noncontrolling Interests | 163,382 | | | 161,315 | | | 3,852 | | | 3,839 | | | 4,726 | |
| Total equity | 3,713,387 | | | 3,642,076 | | | 749,985 | | | 747,283 | | | 715,138 | |
| Total liabilities and equity | $ | 6,387,322 | | | $ | 6,506,696 | | | $ | 1,846,911 | | | $ | 1,875,122 | | | $ | 1,728,016 | |
STATEMENTS OF OPERATIONS, FFO & CORE FFO
TRAILING FIVE QUARTERS
Dollars in thousands, except per share data
| | | | | | | | | | | | | | | | | | | | | | | | | | | | | |
| For the Three-Months Ended |
| March 31, 2022 | | December 31, 2021 | | September 30, 2021 | | June 30, 2021 | | March 31, 2021 |
| Revenue: | | | | | | | | | |
| Rental and other property revenue | $ | 149,977 | | | $ | 76,803 | | | $ | 60,592 | | | $ | 57,286 | | | $ | 54,811 | |
| Other revenue | 385 | | 113 | | 188 | | 158 | | 301 |
| Total revenue | 150,362 | | 76,916 | | 60,780 | | 57,444 | | 55,112 |
| Expenses: | | | | | | | | | |
| Property operating expenses | 55,883 | | 26,952 | | 23,164 | | 22,298 | | 20,838 |
| Property management expenses | 5,556 | | 3,221 | | 2,199 | | 2,176 | | 1,943 |
General and administrative expenses(a) | 7,928 | | 4,442 | | 3,985 | | 4,241 | | 5,942 |
| Depreciation and amortization expense | 78,174 | | 26,210 | | 17,384 | | 16,763 | | 16,552 |
| | | | | | | | | |
| Casualty (gains) losses, net | (1,393) | | — | | — | | — | | 359 |
| Total expenses | 146,148 | | 60,825 | | 46,732 | | 45,478 | | 45,634 |
| Other income (expense), net | 380 | | — | | — | | — | | — |
| Interest expense | (20,531) | | (10,757) | | (8,700) | | (8,559) | | (8,385) |
| Gain on sale of real estate assets, net | 94,712 | | 76,179 | | 11,492 | | — | | — |
| Loss on extinguishment of debt | — | | (10,261) | | — | | — | | — |
| Merger and integration costs | (1,895) | | (41,787) | | (5,276) | | — | | — |
| Net income (loss) | $ | 76,880 | | | $ | 29,465 | | | $ | 11,564 | | | $ | 3,407 | | | $ | 1,093 | |
(Income) loss allocated to noncontrolling
interests | (2,280) | | (850) | | (62) | | (21) | | (7) |
| Net income (loss) available to common shares | $ | 74,600 | | | $ | 28,615 | | | $ | 11,502 | | | $ | 3,386 | | | $ | 1,086 | |
| EPS - basic | $ | 0.34 | | | $ | 0.23 | | | $ | 0.11 | | | $ | 0.03 | | | $ | 0.01 | |
| Weighted-average shares outstanding - Basic | 220,798,692 | | 125,375,694 | | 104,918,674 | | 102,023,204 | | 101,678,865 |
| EPS - diluted | $ | 0.34 | | | $ | 0.23 | | | $ | 0.11 | | | $ | 0.03 | | | $ | 0.01 | |
| Weighted-average shares outstanding - Diluted | 222,045,286 | | 126,675,551 | | 107,668,675 | | 102,923,924 | | 102,763,106 |
| Funds From Operations (FFO): | | | | | | | | | |
| Net income (loss) | $ | 76,880 | | | $ | 29,465 | | | $ | 11,564 | | | $ | 3,407 | | | $ | 1,093 | |
| Add-Back (Deduct): | | | | | | | | | |
Real estate depreciation and
amortization | 77,943 | | 26,068 | | 17,263 | | 16,683 | | 16,472 |
Gain on sale of real estate assets, net,
excluding debt extinguishment costs | (94,712) | | (78,490) | | (11,788) | | — | | — |
| FFO | $ | 60,111 | | | $ | (22,957) | | | $ | 17,039 | | | $ | 20,090 | | | $ | 17,565 | |
| FFO per share | $ | 0.26 | | | $ | (0.18) | | | $ | 0.16 | | | $ | 0.20 | | | $ | 0.17 | |
| CORE Funds From Operations (CFFO): | | | | | | | | | |
| FFO | $ | 60,111 | | | $ | (22,957) | | | $ | 17,039 | | | $ | 20,090 | | | $ | 17,565 | |
| Add-Back (Deduct): | | | | | | | | | |
| Other depreciation and amortization | 231 | | 142 | | 121 | | 80 | | 80 |
| | | | | | | | | |
| Casualty (gains) losses, net | (1,393) | | — | | — | | — | | 359 |
Loan (premium accretion) discount
amortization, net | (2,754) | | (501) | | — | | — | | — |
Prepayment penalties on asset
dispositions | — | | 2,312 | | 295 | | — | | — |
| Loss on extinguishment of debt | — | | 10,261 | | — | | — | | — |
| Other (income) expense, net | (380) | | — | | — | | — | | — |
| Merger and integration costs | 1,895 | | 41,787 | | 5,276 | | — | | — |
| CFFO | $ | 57,710 | | | $ | 31,044 | | | $ | 22,731 | | | $ | 20,170 | | | $ | 18,004 | |
| CFFO per share | $ | 0.25 | | | $ | 0.24 | | | $ | 0.21 | | | $ | 0.20 | | | $ | 0.18 | |
Weighted-average shares and units
outstanding | 227,778,484 | | 127,046,225 | | 107,094,044 | | 102,584,809 | | 102,353,380 |
(a)Included in the three-months ended March 31, 2022 and 2021 is $2.4 million and $2.1 million, respectively, of stock compensation expense recorded with respect to stock awards granted during the respective period to retirement eligible employees.
STATEMENTS OF OPERATIONS, FFO & CORE FFO
THREE MONTHS ENDED MARCH 31, 2022 and 2021
Dollars in thousands, except per share data
| | | | | | | | | | | | | | | |
| For the Three Months Ended March 31, | | |
| 2022 | | 2021 | | | | |
| Revenue: | | | | | | | |
| Rental and other property revenue | $ | 149,977 | | | $ | 54,811 | | | | | |
| Other revenue | 385 | | 301 | | | | |
| Total revenue | 150,362 | | 55,112 | | | | |
| Expenses: | | | | | | | |
| Property operating expenses | 55,883 | | 20,838 | | | | |
| Property management expenses | 5,556 | | 1,943 | | | | |
General and administrative expenses(a) | 7,928 | | 5,942 | | | | |
| Depreciation and amortization expense | 78,174 | | 16,552 | | | | |
| | | | | | | |
| Casualty (gains) losses, net | (1,393) | | 359 | | | | |
| Total expenses | 146,148 | | 45,634 | | | | |
| Other income (expense), net | 380 | | — | | | | |
| Interest expense | (20,531) | | (8,385) | | | | |
| Gain on sale of real estate assets, net | 94,712 | | — | | | | |
| | | | | | | |
| Merger and integration costs | (1,895) | | — | | | | |
| Net income (loss) | 76,880 | | | 1,093 | | | | | |
(Income) loss allocated to noncontrolling
interests | (2,280) | | (7) | | | | |
| Net income (loss) available to common shares | $ | 74,600 | | | $ | 1,086 | | | | | |
| EPS - basic | $ | 0.34 | | | $ | 0.01 | | | | | |
| Weighted-average shares outstanding - Basic | 220,798,692 | | 101,678,865 | | | | |
| EPS - diluted | $ | 0.34 | | | $ | 0.01 | | | | | |
| Weighted-average shares outstanding - Diluted | 222,045,286 | | 102,763,106 | | | | |
| Funds From Operations (FFO): | | | | | | | |
| Net income (loss) | $ | 76,880 | | | $ | 1,093 | | | | | |
| Add-Back (Deduct): | | | | | | | |
| Real estate depreciation and amortization | 77,943 | | 16,472 | | | | |
| Gain on sale of real estate assets, net, excluding debt extinguishment costs | (94,712) | | — | | | | |
| FFO | $ | 60,111 | | | $ | 17,565 | | | | | |
| FFO per share | $ | 0.26 | | | $ | 0.17 | | | | | |
| CORE Funds From Operations (CFFO): | | | | | | | |
| FFO | $ | 60,111 | | | $ | 17,565 | | | | | |
| Add-Back (Deduct): | | | | | | | |
| Other depreciation and amortization | 231 | | 80 | | | | |
| | | | | | | |
| Casualty (gains) losses, net | (1,393) | | 359 | | | | |
| Loan (premium accretion) discount amortization, net | (2,754) | | — | | | | |
| | | | | | | |
| | | | | | | |
| Other (income) expense, net | (380) | | — | | | | |
| Merger and integration costs | 1,895 | | — | | | | |
| CFFO | $ | 57,710 | | | $ | 18,004 | | | | | |
| CFFO per share | $ | 0.25 | | | $ | 0.18 | | | | | |
Weighted-average shares and units
outstanding | 227,778,484 | | 102,353,380 | | | | |
(a)Included in the three-months ended March 31, 2022 and 2021 is $2.4 million and $2.1 million, respectively, of stock compensation expense recorded with respect to stock awards granted during the respective period to retirement eligible employees.
ADJUSTED EBITDA RECONCILIATION AND COVERAGE RATIO
Dollars in thousands
| | | | | | | | | | | | | | | | | | | | | | | | | | | | | |
| Three Months Ended |
| ADJUSTED EBITDA: | March 31, 2022 | | December 31, 2021 | | September 30, 2021 | | June 30, 2021 | | March 31, 2021 |
| Net income (loss) | $ | 76,880 | | | $ | 29,465 | | | $ | 11,564 | | | $ | 3,407 | | | $ | 1,093 | |
| Add-Back (Deduct): | | | | | | | | | |
| Depreciation and amortization | 78,174 | | | 26,210 | | | 17,384 | | | 16,763 | | | 16,552 | |
| | | | | | | | | |
| Casualty (gains) losses, net | (1,393) | | | — | | | — | | | — | | | 359 | |
| Interest expense | 20,531 | | | 10,757 | | | 8,700 | | | 8,559 | | | 8,385 | |
| Gain on sale of real estate assets | (94,712) | | | (76,179) | | | (11,492) | | | — | | | — | |
| Loss on extinguishment of debt | — | | | 10,261 | | | — | | | — | | | — | |
| Merger and integration costs | 1,895 | | | 41,787 | | | 5,276 | | | — | | | — | |
| Adjusted EBITDA | $ | 81,375 | | | $ | 42,301 | | | $ | 31,432 | | | $ | 28,729 | | | $ | 26,389 | |
| | | | | | | | | |
| INTEREST COST: | | | | | | | | | |
| Interest expense | $ | 20,531 | | | $ | 10,757 | | | $ | 8,700 | | | $ | 8,559 | | | $ | 8,385 | |
| | | | | | | | | |
| INTEREST COVERAGE: | 4.0x | | 3.9x | | 3.6x | | 3.4x | | 3.1x |
COMBINED SAME-STORE PORTFOLIO NET OPERATING INCOME
TRAILING FIVE QUARTERS
Dollars in thousands, except per unit data
| | | | | | | | | | | | | | | | | | | | | | | | | | | | | |
| For the Three-Months Ended |
| March 31, 2022 | | December 31, 2021 | | September 30, 2021 | | June 30, 2021 | | March 31, 2021 |
| Revenue: | | | | | | | | | |
| Rental and other property revenue | $ | 141,706 | | | $ | 138,712 | | | $ | 136,563 | | | $ | 131,544 | | | $ | 127,667 | |
| Property Operating Expenses: | | | | | | | | | |
| Real estate taxes | 18,726 | | | 16,488 | | | 16,143 | | | 18,917 | | | 18,132 | |
| Property insurance | 2,784 | | | 3,027 | | | 3,170 | | | 2,712 | | | 2,660 | |
| Personnel expenses | 12,052 | | | 12,233 | | | 12,064 | | | 11,758 | | | 11,460 | |
| Utilities | 7,308 | | | 7,069 | | | 7,244 | | | 6,719 | | | 7,207 | |
| Repairs and maintenance | 4,209 | | | 5,282 | | | 5,399 | | | 4,574 | | | 4,250 | |
| Contract services | 4,722 | | | 4,787 | | | 4,915 | | | 4,726 | | | 4,365 | |
| Advertising expenses | 1,180 | | | 1,323 | | | 1,334 | | | 1,308 | | | 1,258 | |
| Other expenses | 1,556 | | | 1,489 | | | 1,488 | | | 1,515 | | | 1,588 | |
| Total property operating expenses | $ | 52,537 | | | $ | 51,698 | | | $ | 51,757 | | | $ | 52,229 | | | $ | 50,920 | |
Combined same-store net operating income (a) | $ | 89,169 | | | $ | 87,014 | | | $ | 84,806 | | | $ | 79,315 | | | $ | 76,747 | |
| Combined same-store NOI margin | 62.9 | % | | 62.7 | % | | 62.1 | % | | 60.3 | % | | 60.1 | % |
| Average occupancy | 95.4 | % | | 96.0 | % | | 96.5 | % | | 96.2 | % | | 95.3 | % |
| Average effective monthly rent, per unit | $ | 1,373 | | | $ | 1,346 | | | $ | 1,305 | | | $ | 1,261 | | | $ | 1,244 | |
Reconciliation of combined same-store
net operating income to net income
(loss) | | | | | | | | | |
Combined same-store portfolio net
operating income | $ | 89,169 | | | $ | 87,014 | | | $ | 84,806 | | | $ | 79,315 | | | $ | 76,747 | |
Combined non same-store net operating
income | 4,925 | | | 7,923 | | | 7,054 | | | 5,179 | | | 4,805 | |
| Pre-Merger STAR Portfolio NOI | — | | | (45,086) | | | (54,433) | | | (49,506) | | | (47,579) | |
| Other revenue | 385 | | | 113 | | | 188 | | | 158 | | | 301 | |
| Other income (expense), net | 380 | | | — | | | — | | | — | | | — | |
| Property management expenses | (5,556) | | | (3,221) | | | (2,199) | | | (2,176) | | | (1,943) | |
| General and administrative expenses | (7,928) | | | (4,442) | | | (3,985) | | | (4,241) | | | (5,942) | |
| Depreciation and amortization expense | (78,174) | | | (26,210) | | | (17,384) | | | (16,763) | | | (16,552) | |
| | | | | | | | | |
| Casualty gains (losses), net | 1,393 | | | — | | | — | | | — | | | (359) | |
| Interest expense | (20,531) | | | (10,757) | | | (8,700) | | | (8,559) | | | (8,385) | |
| Gain on sale of real estate assets, net | 94,712 | | | 76,179 | | | 11,492 | | | — | | | — | |
| Loss on extinguishment of debt | — | | | (10,261) | | | — | | | — | | | — | |
| Merger and integration costs | (1,895) | | | (41,787) | | | (5,276) | | | — | | | — | |
| Net income (loss) | $ | 76,880 | | | $ | 29,465 | | | $ | 11,564 | | | $ | 3,407 | | | $ | 1,093 | |
(a)Combined same-store portfolio consists of 113 properties, which represent 33,804 units.
COMBINED SAME-STORE PORTFOLIO NET OPERATING INCOME
THREE MONTHS ENDED MARCH 31, 2022 and 2021
Dollars in thousands, except per unit data
| | | | | | | | | | | | | | | | | | | | | | | |
| For the Three Months Ended March 31, | | |
| 2022 | | 2021 | | % change | | | | | | |
| Revenue: | | | | | | | | | | | |
| Rental and other property revenue | $ | 141,706 | | | $ | 127,667 | | | 11.0 | % | | | | | | |
| Property Operating Expenses: | | | | | | | | | | | |
| Real estate taxes | 18,726 | | | 18,132 | | | 3.3 | % | | | | | | |
| Property insurance | 2,784 | | | 2,660 | | | 4.7 | % | | | | | | |
| Personnel expenses | 12,052 | | | 11,460 | | | 5.2 | % | | | | | | |
| Utilities | 7,308 | | | 7,207 | | | 1.4 | % | | | | | | |
| Repairs and maintenance | 4,209 | | | 4,250 | | | (1.0) | % | | | | | | |
| Contract services | 4,722 | | | 4,365 | | | 8.2 | % | | | | | | |
| Advertising expenses | 1,180 | | | 1,258 | | | (6.2) | % | | | | | | |
| Other expenses | 1,556 | | | 1,588 | | | (2.0) | % | | | | | | |
| Total property operating expenses | $ | 52,537 | | | $ | 50,920 | | | 3.2 | % | | | | | | |
Combined same-store net operating income (a) | $ | 89,169 | | | $ | 76,747 | | | 16.2 | % | | | | | | |
| Combined same-store NOI margin | 62.9 | % | | 60.1 | % | | 2.8 | % | | | | | | |
| Average occupancy | 95.4 | % | | 95.3 | % | | 0.1 | % | | | | | | |
| Average effective monthly rent, per unit | $ | 1,373 | | | $ | 1,244 | | | 10.4 | % | | | | | | |
Reconciliation of combined same-store net
operating income to net income (loss) | | | | | | | | | | | |
| Combined same-store portfolio net operating income | $ | 89,169 | | | $ | 76,747 | | | | | | | | | |
| Combined non same-store net operating income | 4,925 | | | 4,805 | | | | | | | | | |
| Pre-Merger STAR Portfolio NOI | — | | | (47,579) | | | | | | | | | |
| Other revenue | 385 | | | 301 | | | | | | | | | |
| Other income (expense), net | 380 | | | — | | | | | | | | | |
| Property management expenses | (5,556) | | | (1,943) | | | | | | | | | |
| General and administrative expenses | (7,928) | | | (5,942) | | | | | | | | | |
| Depreciation and amortization expense | (78,174) | | | (16,552) | | | | | | | | | |
| | | | | | | | | | | |
| Casualty gains (losses), net | 1,393 | | | (359) | | | | | | | | | |
| Interest expense | (20,531) | | | (8,385) | | | | | | | | | |
| Gain on sale of real estate assets, net | 94,712 | | | — | | | | | | | | | |
| | | | | | | | | | | |
| Merger and integration costs | (1,895) | | | — | | | | | | | | | |
| Net income (loss) | $ | 76,880 | | | $ | 1,093 | | | | | | | | | |
(a)Combined same-store portfolio consists of 113 properties, which represent 33,804 units.
NET OPERATING INCOME BRIDGE
TRAILING FIVE QUARTERS
Dollars in thousands
| | | | | | | | | | | | | | | | | | | | | | | | | | | | | |
| For the Three Months Ended |
| March 31, 2022 | | December 31, 2021 | | September 30, 2021 | | June 30, 2021 | | March 31, 2021 |
| Rental and other property revenue | | | | | | | | | |
Combined same-store (a) | $ | 141,706 | | | $ | 138,712 | | | $ | 136,563 | | | $ | 131,544 | | | $ | 127,667 | |
| Combined non same-store | 8,271 | | | 12,546 | | | 12,517 | | | 9,260 | | | 8,279 | |
| Total rental and other property revenue | 149,977 | | | 151,258 | | | 149,080 | | | 140,803 | | | 135,946 | |
| Property operating expenses | | | | | | | | | |
Combined same-store (a) | 52,537 | | | 51,698 | | | 51,757 | | | 52,229 | | | 50,920 | |
| Combined non same-store | 3,346 | | | 4,623 | | | 5,463 | | | 4,081 | | | 3,474 | |
| Total property operating expenses | 55,883 | | | 56,321 | | | 57,220 | | | 56,310 | | | 54,394 | |
| Net operating income | | | | | | | | | |
Combined same-store (a) | 89,169 | | | 87,014 | | | 84,806 | | | 79,315 | | | 76,747 | |
| Combined non same-store | 4,925 | | | 7,923 | | | 7,054 | | | 5,179 | | | 4,805 | |
| Total property net operating income | $ | 94,094 | | | $ | 94,937 | | | $ | 91,860 | | | $ | 84,494 | | | $ | 81,552 | |
Reconciliation of NOI to net income
(loss) | | | | | | | | | |
| Total property net operating income | $ | 94,094 | | | $ | 94,937 | | | $ | 91,860 | | | $ | 84,494 | | | $ | 81,552 | |
| Pre-Merger STAR Portfolio NOI | — | | | (45,086) | | | (54,433) | | | (49,506) | | | (47,579) | |
| Other revenue | 385 | | | 113 | | | 188 | | | 158 | | | 301 | |
| Other income (expense), net | 380 | | | — | | | — | | | — | | | — | |
| Property management expenses | (5,556) | | | (3,221) | | | (2,199) | | | (2,176) | | | (1,943) | |
| General and administrative expenses | (7,928) | | | (4,442) | | | (3,985) | | | (4,241) | | | (5,942) | |
| Depreciation and amortization expense | (78,174) | | | (26,210) | | | (17,384) | | | (16,763) | | | (16,552) | |
| | | | | | | | | |
| Casualty gains (losses), net | 1,393 | | | — | | | — | | | — | | | (359) | |
| Interest expense | (20,531) | | | (10,757) | | | (8,700) | | | (8,559) | | | (8,385) | |
| Gain on sale of real estate assets, net | 94,712 | | | 76,179 | | | 11,492 | | | — | | | — | |
| Loss on extinguishment of debt | — | | | (10,261) | | | — | | | — | | | — | |
| Merger and integration costs | (1,895) | | | (41,787) | | | (5,276) | | | — | | | — | |
| Net income (loss) | $ | 76,880 | | | $ | 29,465 | | | $ | 11,564 | | | $ | 3,407 | | | $ | 1,093 | |
(a)Combined same-store portfolio consists of 113 properties, which represent 33,804 units.
COMBINED SAME-STORE PORTFOLIO NET OPERATING INCOME BY MARKET
THREE MONTHS ENDED MARCH 31, 2022
Dollars in thousands, except rent per unit
| | | | | | | | | | | | | | | | | | | | | | | | | | | | | | | | | | | | | | | | | | | | | | | | | | | | | | | | | | | | | | | | | | | | | | | | | | | | | | | | | | | | | | | | | | | | | | | | | | | | | | | | |
| | | | | | Rental and Other Property Revenue | | Property Operating Expenses | | Net Operating Income | | Average Occupancy | | Average Effective Monthly Rent per Unit |
| Market | | Number of Properties | | Units | | 2022 | | 2021 | | % Change | | 2022 | | 2021 | | % Change | | 2022 | | 2021 | | % Change | | 2022 | | 2021 | | % Change | | 2022 | | 2021 | | % Change |
| Atlanta, GA | | 13 | | 5,180 | | $ | 22,243 | | | $ | 20,035 | | | 11.0 | % | | $ | 7,596 | | | $ | 7,354 | | | 3.3 | % | | $ | 14,647 | | | $ | 12,681 | | | 15.5 | % | | 94.6 | % | | 95.9 | % | | (1.3) | % | | $ | 1,458 | | | $ | 1,293 | | | 12.7 | % |
| Dallas, TX | | 13 | | 3,685 | | 18,058 | | | 16,367 | | | 10.3 | % | | 7,673 | | | 7,738 | | | (0.8) | % | | 10,385 | | | 8,629 | | | 20.4 | % | | 96.0 | % | | 95.2 | % | | 0.8 | % | | 1,601 | | | 1,479 | | | 8.2 | % |
| Denver, CO | | 9 | | 2,292 | | 10,856 | | | 9,768 | | | 11.1 | % | | 3,337 | | | 3,314 | | | 0.7 | % | | 7,519 | | | 6,454 | | | 16.5 | % | | 95.7 | % | | 95.0 | % | | 0.7 | % | | 1,557 | | | 1,428 | | | 9.0 | % |
| Columbus, OH | | 10 | | 2,510 | | 9,499 | | | 8,477 | | | 12.1 | % | | 3,644 | | | 3,684 | | | (1.1) | % | | 5,855 | | | 4,794 | | | 22.1 | % | | 95.9 | % | | 94.3 | % | | 1.6 | % | | 1,234 | | | 1,134 | | | 8.8 | % |
| Indianapolis, IN | | 8 | | 2,256 | | 8,306 | | | 7,420 | | | 11.9 | % | | 3,171 | | | 2,923 | | | 8.5 | % | | 5,135 | | | 4,497 | | | 14.2 | % | | 95.4 | % | | 96.3 | % | | (0.9) | % | | 1,188 | | | 1,062 | | | 11.9 | % |
| Oklahoma City, OK | | 8 | | 2,147 | | 7,084 | | | 6,430 | | | 10.2 | % | | 2,452 | | | 2,465 | | | (0.5) | % | | 4,631 | | | 3,964 | | | 16.8 | % | | 95.4 | % | | 95.9 | % | | (0.5) | % | | 1,054 | | | 955 | | | 10.4 | % |
| Raleigh - Durham, NC | | 6 | | 1,690 | | 6,741 | | | 6,322 | | | 6.6 | % | | 2,440 | | | 2,106 | | | 15.9 | % | | 4,301 | | | 4,216 | | | 2.0 | % | | 95.2 | % | | 95.6 | % | | (0.4) | % | | 1,320 | | | 1,203 | | | 9.7 | % |
| Houston, TX | | 7 | | 1,932 | | 7,954 | | | 7,440 | | | 6.9 | % | | 3,788 | | | 3,877 | | | (2.3) | % | | 4,166 | | | 3,563 | | | 16.9 | % | | 94.4 | % | | 95.5 | % | | (1.2) | % | | 1,339 | | | 1,277 | | | 4.8 | % |
| Memphis, TN | | 4 | | 1,383 | | 5,548 | | | 5,110 | | | 8.6 | % | | 1,897 | | | 1,794 | | | 5.7 | % | | 3,651 | | | 3,316 | | | 10.1 | % | | 94.2 | % | | 96.7 | % | | (2.5) | % | | 1,373 | | | 1,207 | | | 13.7 | % |
| Nashville, TN | | 3 | | 1,236 | | 5,493 | | | 4,940 | | | 11.2 | % | | 1,908 | | | 1,814 | | | 5.2 | % | | 3,586 | | | 3,126 | | | 14.7 | % | | 95.8 | % | | 95.3 | % | | 0.5 | % | | 1,439 | | | 1,300 | | | 10.7 | % |
| Tampa-St. Petersburg, FL | | 4 | | 1,104 | | 5,080 | | | 4,302 | | | 18.1 | % | | 1,973 | | | 1,809 | | | 9.1 | % | | 3,107 | | | 2,492 | | | 24.7 | % | | 94.4 | % | | 93.6 | % | | 0.8 | % | | 1,532 | | | 1,311 | | | 16.8 | % |
| Birmingham, AL | | 2 | | 1,074 | | 4,603 | | | 4,211 | | | 9.3 | % | | 1,637 | | | 1,708 | | | (4.1) | % | | 2,965 | | | 2,504 | | | 18.4 | % | | 93.7 | % | | 94.3 | % | | (0.6) | % | | 1,397 | | | 1,278 | | | 9.3 | % |
| Louisville, KY | | 4 | | 1,150 | | 4,280 | | | 3,773 | | | 13.4 | % | | 1,804 | | | 1,542 | | | 17.0 | % | | 2,476 | | | 2,231 | | | 11.0 | % | | 95.2 | % | | 92.6 | % | | 2.6 | % | | 1,156 | | | 1,056 | | | 9.5 | % |
| Lexington, KY | | 3 | | 886 | | 3,353 | | | 2,886 | | | 16.2 | % | | 1,183 | | | 1,130 | | | 4.6 | % | | 2,170 | | | 1,756 | | | 23.6 | % | | 95.3 | % | | 95.3 | % | | — | % | | 1,166 | | | 1,022 | | | 14.1 | % |
| Huntsville, AL | | 2 | | 599 | | 2,559 | | | 2,416 | | | 5.9 | % | | 715 | | | 560 | | | 27.6 | % | | 1,844 | | | 1,856 | | | (0.6) | % | | 96.4 | % | | 97.5 | % | | (1.1) | % | | 1,394 | | | 1,274 | | | 9.5 | % |
| Cincinnati, OH | | 2 | | 542 | | 2,450 | | | 2,042 | | | 20.0 | % | | 848 | | | 785 | | | 8.0 | % | | 1,603 | | | 1,258 | | | 27.4 | % | | 96.8 | % | | 95.0 | % | | 1.8 | % | | 1,413 | | | 1,260 | | | 12.2 | % |
| Myrtle Beach, SC - Wilmington, NC | | 3 | | 628 | | 2,287 | | | 1,998 | | | 14.5 | % | | 711 | | | 654 | | | 8.6 | % | | 1,577 | | | 1,343 | | | 17.4 | % | | 96.8 | % | | 94.7 | % | | 2.1 | % | | 1,178 | | | 1,057 | | | 11.4 | % |
| Greenville, SC | | 1 | | 702 | | 2,346 | | | 2,094 | | | 12.0 | % | | 855 | | | 901 | | | (5.1) | % | | 1,491 | | | 1,193 | | | 24.9 | % | | 95.2 | % | | 93.2 | % | | 2.0 | % | | 1,132 | | | 1,023 | | | 10.7 | % |
| Charleston, SC | | 2 | | 518 | | 2,277 | | | 2,134 | | | 6.7 | % | | 935 | | | 924 | | | 1.3 | % | | 1,342 | | | 1,210 | | | 10.9 | % | | 96.5 | % | | 95.7 | % | | 0.8 | % | | 1,408 | | | 1,319 | | | 6.8 | % |
| Chicago, IL | | 1 | | 374 | | 1,877 | | | 1,660 | | | 13.1 | % | | 770 | | | 683 | | | 12.7 | % | | 1,107 | | | 976 | | | 13.4 | % | | 95.4 | % | | 94.3 | % | | 1.1 | % | | 1,645 | | | 1,523 | | | 8.1 | % |
| San Antonio, TX | | 1 | | 306 | | 1,444 | | | 1,184 | | | 21.9 | % | | 616 | | | 557 | | | 10.6 | % | | 828 | | | 627 | | | 32.0 | % | | 96.9 | % | | 90.4 | % | | 6.5 | % | | 1,454 | | | 1,291 | | | 12.6 | % |
| Orlando, FL | | 1 | | 297 | | 1,372 | | | 1,302 | | | 5.4 | % | | 562 | | | 545 | | | 3.0 | % | | 810 | | | 757 | | | 7.1 | % | | 96.8 | % | | 96.1 | % | | 0.6 | % | | 1,534 | | | 1,438 | | | 6.7 | % |
| Charlotte, NC | | 1 | | 208 | | 1,104 | | | 1,024 | | | 7.8 | % | | 347 | | | 317 | | | 9.6 | % | | 757 | | | 708 | | | 7.0 | % | | 96.1 | % | | 95.9 | % | | 0.2 | % | | 1,641 | | | 1,514 | | | 8.4 | % |
| Austin, TX | | 1 | | 256 | | 1,258 | | | 1,099 | | | 14.4 | % | | 524 | | | 562 | | | (6.7) | % | | 733 | | | 537 | | | 36.5 | % | | 97.0 | % | | 94.4 | % | | 2.6 | % | | 1,567 | | | 1,422 | | | 10.2 | % |
| Asheville, NC | | 1 | | 252 | | 976 | | | 888 | | | 10.0 | % | | 272 | | | 263 | | | 3.5 | % | | 705 | | | 625 | | | 12.7 | % | | 97.7 | % | | 97.0 | % | | 0.7 | % | | 1,272 | | | 1,148 | | | 10.8 | % |
| Norfolk, VA | | 1 | | 183 | | 941 | | | 861 | | | 9.3 | % | | 272 | | | 296 | | | (8.2) | % | | 670 | | | 565 | | | 18.5 | % | | 95.6 | % | | 97.0 | % | | (1.3) | % | | 1,730 | | | 1,521 | | | 13.7 | % |
| Fort Wayne, IN | | 1 | | 222 | | 920 | | | 796 | | | 15.7 | % | | 307 | | | 297 | | | 3.5 | % | | 613 | | | 499 | | | 22.9 | % | | 94.7 | % | | 96.8 | % | | (2.1) | % | | 1,312 | | | 1,157 | | | 13.4 | % |
| Chattanooga, TN | | 1 | | 192 | | 795 | | | 688 | | | 15.6 | % | | 301 | | | 319 | | | (5.9) | % | | 495 | | | 368 | | | 34.5 | % | | 97.3 | % | | 97.5 | % | | (0.2) | % | | 1,327 | | | 1,134 | | | 17.1 | % |
| Total/Weighted Average | | 113 | | 33,804 | | $ | 141,706 | | | $ | 127,667 | | | 11.0 | % | | $ | 52,537 | | | $ | 50,920 | | | 3.2 | % | | $ | 89,169 | | | $ | 76,747 | | | 16.2 | % | | 95.4 | % | | 95.3 | % | | 0.1 | % | | $ | 1,373 | | | $ | 1,244 | | | 10.4 | % |
TOTAL PORTFOLIO NOI EXPOSURE BY MARKET
Dollars in thousands, except rent per unit
| | | | | | | | | | | | | | | | | | | | | | | | | | | | | | | | | | | | | | | | | | | | |
| | | | | | | | | | For the Three Months Ended March 31, 2022 |
| Market | | Number of Properties | | Units | | Gross Real
Estate
Assets | | Period End
Occupancy | | Average Effective Monthly Rent per Unit | | Net Operating
Income | | % of NOI |
| Atlanta, GA | | 13 | | 5,180 | | $ | 1,048,599 | | | 94.3 | % | | $ | 1,459 | | | $ | 14,650 | | | 15.6 | % |
| Dallas, TX | | 14 | | 4,007 | | 842,070 | | | 96.0 | % | | 1,609 | | | 11,333 | | | 12.1 | % |
Denver, CO (1) | | 9 | | 2,292 | | 599,241 | | | 96.3 | % | | 1,559 | | | 7,519 | | | 8.0 | % |
| Columbus, OH | | 10 | | 2,510 | | 359,129 | | | 96.0 | % | | 1,236 | | | 5,855 | | | 6.3 | % |
| Indianapolis, IN | | 8 | | 2,256 | | 320,547 | | | 95.6 | % | | 1,192 | | | 5,135 | | | 5.5 | % |
| Oklahoma City, OK | | 8 | | 2,147 | | 311,974 | | | 95.6 | % | | 1,057 | | | 4,631 | | | 4.9 | % |
| Raleigh - Durham, NC | | 6 | | 1,690 | | 251,966 | | | 95.6 | % | | 1,322 | | | 4,298 | | | 4.6 | % |
| Houston, TX | | 7 | | 1,932 | | 320,307 | | | 95.1 | % | | 1,337 | | | 4,166 | | | 4.4 | % |
| Nashville, TN | | 4 | | 1,412 | | 337,784 | | | 96.0 | % | | 1,456 | | | 4,157 | | | 4.4 | % |
| Memphis, TN | | 4 | | 1,383 | | 155,310 | | | 94.1 | % | | 1,372 | | | 3,651 | | | 3.9 | % |
| Louisville, KY | | 5 | | 1,550 | | 191,543 | | | 94.5 | % | | 1,102 | | | 3,145 | | | 3.4 | % |
| Tampa-St. Petersburg, FL | | 4 | | 1,104 | | 188,646 | | | 94.8 | % | | 1,539 | | | 3,107 | | | 3.3 | % |
| Birmingham, AL | | 2 | | 1,074 | | 231,035 | | | 94.9 | % | | 1,338 | | | 2,965 | | | 3.2 | % |
| Huntsville, AL | | 3 | | 873 | | 189,757 | | | 94.6 | % | | 1,442 | | | 2,665 | | | 2.8 | % |
| Lexington, KY | | 3 | | 886 | | 159,099 | | | 96.4 | % | | 1,164 | | | 2,170 | | | 2.3 | % |
| Cincinnati, OH | | 2 | | 542 | | 121,391 | | | 96.0 | % | | 1,370 | | | 1,603 | | | 1.7 | % |
| Myrtle Beach, SC - Wilmington, NC | | 3 | | 628 | | 66,381 | | | 95.5 | % | | 1,184 | | | 1,577 | | | 1.7 | % |
| Charlotte, NC | | 2 | | 480 | | 109,233 | | | 95.2 | % | | 1,530 | | | 1,544 | | | 1.6 | % |
| Greenville, SC | | 1 | | 702 | | 122,606 | | | 97.2 | % | | 1,129 | | | 1,491 | | | 1.6 | % |
| Charleston, SC | | 2 | | 518 | | 80,793 | | | 96.3 | % | | 1,418 | | | 1,342 | | | 1.4 | % |
| Chicago, IL | | 1 | | 374 | | 89,785 | | | 95.2 | % | | 1,649 | | | 1,107 | | | 1.2 | % |
| Orlando, FL | | 1 | | 297 | | 49,972 | | | 97.3 | % | | 1,539 | | | 810 | | | 0.9 | % |
| San Antonio, TX | | 1 | | 306 | | 56,955 | | | 95.8 | % | | 1,455 | | | 828 | | | 0.9 | % |
| Terra Haute, IN | | 1 | | 250 | | 45,795 | | | 90.0 | % | | 1,390 | | | 659 | | | 0.7 | % |
| Norfolk, VA | | 1 | | 183 | | 53,876 | | | 96.2 | % | | 1,728 | | | 670 | | | 0.7 | % |
| Asheville, NC | | 1 | | 252 | | 29,123 | | | 97.2 | % | | 1,274 | | | 705 | | | 0.8 | % |
| Austin, TX | | 1 | | 256 | | 54,374 | | | 97.6 | % | | 1,569 | | | 733 | | | 0.8 | % |
| Fort Wayne, IN | | 1 | | 222 | | 43,920 | | | 95.5 | % | | 1,316 | | | 613 | | | 0.7 | % |
| Chattanooga, TN | | 1 | | 192 | | 36,772 | | | 95.8 | % | | 1,338 | | | 495 | | | 0.5 | % |
| Total/Weighted Average | | 119 | | 35,498 | | $ | 6,467,983 | | | 95.4 | % | | $ | 1,374 | | | $ | 93,624 | | | 100.0 | % |
(1)Includes properties in our Fort Collins, CO and Colorado Springs, CO markets.
VALUE ADD SUMMARY
PROJECT LIFE TO DATE AS OF MARCH 31, 2022
| | | | | | | | | | | | | | | | | | | | | | | | | | | | | | | | | | | | | | |
| | | | | | | | Renovation Costs per Unit (b) | | |
| Property | Market | Percentage Complete | Total
Units To Be Renovated | Units Complete | Units
Leased | Rent Premium (a) | % Rent Increase | Interior | Exterior | Total | ROI - Interior Costs(c) | ROI - Total Costs (d) |
| | | | | | | | | | | | |
| Ongoing | | | | | | | | | | | | |
Stonebridge
Crossing | Memphis, TN | 81.6 | % | 500 | 408 | 393 | $ | 153 | | 18.1 | % | $ | 10,122 | | $ | 1,131 | | $ | 11,253 | | 18.4 | % | 16.3 | % |
The Commons at
Canal Winchester | Columbus, OH | 79.5 | % | 264 | 210 | 197 | 214 | | 24.4 | % | 10,564 | | 402 | | 10,965 | | 24.3 | % | 23.5 | % |
Vantage at
Hillsborough | Tampa-St.
Petersburg, FL | 79.3 | % | 348 | 276 | 264 | 204 | | 17.6 | % | 13,890 | | 2,155 | | 16,045 | | 18.5 | % | 15.2 | % |
| Avalon Oaks | Columbus, OH | 73.2 | % | 235 | 172 | 163 | 289 | | 30.7 | % | 11,309 | | 1,021 | | 12,330 | | 32.1 | % | 28.1 | % |
| Lucerne | Tampa-St.
Petersburg, FL | 72.1 | % | 276 | 199 | 195 | 260 | | 23.4 | % | 13,346 | | 634 | | 13,980 | | 24.8 | % | 22.3 | % |
| Waterford Landing | Atlanta, GA | 66.5 | % | 260 | 173 | 163 | 204 | | 28.5 | % | 8,599 | | 685 | | 9,284 | | 28.3 | % | 26.4 | % |
| North Park | Atlanta, GA | 63.8 | % | 224 | 143 | 137 | 215 | | 32.0 | % | 8,052 | | 268 | | 8,320 | | 32.1 | % | 31.0 | % |
| Rocky Creek | Tampa-St.
Petersburg, FL | 45.8 | % | 264 | 121 | 124 | 407 | | 40.0 | % | 12,204 | | 960 | | 13,165 | | 42.1 | % | 37.1 | % |
| Walnut Hill | Memphis, TN | 37.6 | % | 362 | 136 | 132 | 477 | | 43.7 | % | 13,096 | | 807 | | 13,903 | | 51.8 | % | 41.2 | % |
| Thornhill | Raleigh Durham,
NC | 34.6 | % | 318 | 110 | 106 | 178 | | 15.5 | % | 13,802 | | 1,046 | | 14,848 | | 17.1 | % | 14.4 | % |
| Meadows | Louisville, KY | 20.8 | % | 400 | 83 | 75 | 150 | | 15.6 | % | 11,552 | | 415 | | 11,967 | | 23.1 | % | 15.1 | % |
| Collier Park | Columbus, OH | 0.4 | % | 232 | 1 | 3 | 382 | | 37.4 | % | 12,226 | | 660 | | 12,887 | | 44.1 | % | 35.5 | % |
Total/Weighted
Average | | 66.8 | % | 3,683 | 2,032 | 1,952 | $ | 236 | | 24.8 | % | $ | 11,416 | | $ | 974 | | $ | 12,390 | | 26.7 | % | 22.9 | % |
| | | | | | | | | | | | |
| Future 2022 Projects (e) | | | | | | | | | | | | |
| Bayview Club | Indianapolis,
IN | — | | 236 | — | | — | | — | | — | | — | | — | | — | | — | | — | |
| Augusta | Oklahoma
City, OK | — | | 197 | — | | — | | — | | — | | — | | — | | — | | — | | — | |
| Invitational | Oklahoma
City, OK | — | | 344 | — | | — | | — | | — | | — | | — | | — | | — | | — | |
| Fox Trails | Dallas, TX | — | | 286 | — | | — | | — | | — | | — | | — | | — | | — | | — | |
| Hilliard Grand | Columbus, OH | — | | 314 | — | | — | | — | | — | | — | | — | | — | | — | | — | |
| Canyon Resort | Austin, TX | — | | 256 | — | | — | | — | | — | | — | | — | | — | | — | | — | |
The Pointe at Vista
Ridge | Dallas, TX | — | | 300 | — | | — | | — | | — | | — | | — | | — | | — | | — | |
Landings of
Brentwood | Nashville, TN | — | | 724 | — | | — | | — | | — | | — | | — | | — | | — | | — | |
Jefferson at the
Perimeter | Atlanta, GA | — | | 504 | — | | — | | — | | — | | — | | — | | — | | — | | — | |
| Park Valley | Atlanta, GA | — | | 496 | — | | — | | — | | — | | — | | — | | — | | — | | — | |
Total/Weighted
Average | | — | | 3,657 | — | | — | | — | | — | | — | | — | | — | | — | | — | |
| | | | | | | | | | | | |
| Completed (f) | | | | | | | | | | | | |
The Village at
Auburn | Raleigh-
Durham, NC | 99.1 | % | 328 | 325 | 308 | 183 | | 15.2 | % | 14,460 | | 2,108 | | 16,569 | | 15.2 | % | 13.3 | % |
Pointe at Canyon
Ridge | Atlanta, GA | 90.1 | % | 494 | 445 | 428 | 177 | | 23.5 | % | 9,009 | | 1,773 | | 10,782 | | 23.1 | % | 19.7 | % |
| Oxmoor | Louisville, KY | 90.3 | % | 432 | 390 | 384 | 181 | | 14.1 | % | 15,372 | | 127 | | 15,498 | | 14.2 | % | 14.0 | % |
| Jamestown | Louisville, KY | 94.3 | % | 296 | 279 | 283 | 279 | | 21.3 | % | 15,677 | | 5,161 | | 20,838 | | 21.8 | % | 16.0 | % |
| Schirm Farms | Columbus, OH | 87.5 | % | 264 | 231 | 222 | 99 | | 15.3 | % | 7,815 | | 613 | | 8,428 | | 15.3 | % | 14.2 | % |
| Arbors River Oaks | Memphis, TN | 87.4 | % | 191 | 167 | 163 | 260 | | 28.3 | % | 11,029 | | 561 | | 11,590 | | 28.6 | % | 27.0 | % |
| Brunswick Point | Wilmington,
NC | 85.4 | % | 288 | 246 | 238 | 64 | | 10.9 | % | 7,003 | | 56 | | 7,058 | | 10.7 | % | 10.8 | % |
Total/Weighted
Average | | 91.0 | % | 2,293 | 2,083 | 2,026 | $ | 178 | | 18.1 | % | $ | 11,771 | | $ | 1,559 | | $ | 13,330 | | 18.3 | % | 16.0 | % |
| | | | | | | | | | | | |
Grand Total/
Weighted
Average | Current Total/
Weighted
Average | | 9,633 | 4,115 | 3,978 | $ | 206 | | 21.4 | % | $ | 11,597 | | $ | 1,162 | | $ | 12,759 | | 22.5 | % | 19.4 | % |
| | | | | | | | | | | | |
| Sold Properties (g) | | | 812 | 700 | 675 | $ | 155 | | 20.0 | % | $ | 9,328 | | $ | 2,976 | | $ | 12,304 | | 20.1 | % | 15.1 | % |
(a)The rent premium reflects the per unit per month difference between the rental rate on the renovated unit and the market rent for an unrenovated unit as of the date presented, as determined by management consistent with its customary rent-setting and evaluation procedures.
(b)Includes all costs to renovate the interior units and make certain exterior renovations, including clubhouses and amenities. Interior costs per unit are based on units leased. Exterior costs per unit are based on total units at the community. Excludes overhead costs to support and manage the value add program as those costs relate to the entire program and cannot be allocated to individual projects.
(c)Calculated using the rent premium per unit per month, multiplied by 12, divided by the interior renovation costs per unit.
(d)Calculated using the rent premium per unit per month, multiplied by 12, divided by the total renovation costs per unit.
(e)The Collier Park project commenced during Q1 2022 and we expect the other future projects to commence in mid-2022.
(f)We consider value add projects completed when over 85% of the property’s units to be renovated have been completed. We continue to renovate remaining unrenovated units as leases expire until we complete 100% of the property’s units.
(g)Includes the Haverford, Crestmont and Creekside properties that were formerly a part of the value add program but were sold in February 2022 and December 2021, respectively.
INVESTMENT AND DEVELOPMENT ACTIVITY
Dollars in thousands with respect to Contract Price and Price per Unit
| | | | | | | | | | | | | | | | | | | | | | | | | | | | | | | | | | | | | | |
| Property | | Market | | Units | | Acquisition Date | | Purchase Price | | Price per Unit | | Average Rent Per Unit |
Views of Music City (Phase I)(1) | | Nashville, TN | | 96 | | April 6, 2022 | | $ | 25,440 | | | 265 | | $ | 1,451 | |
| | | | | | | | | | | | |
| | | | | | | | | | | | |
| | | | | | | | | | | | |
| | | | | | | | | | | | | | | | | | | | | | | | | | | | | | | | | | | | | | |
| Property | | Location | | Units | | Disposition Date | | Sale Price | | Price per Unit | | Average Rent Per Unit |
| Riverchase | | Indianapolis, IN | | 216 | | January 18, 2022 | | $ | 31,000 | | | $ | 144 | | | $ | 1,028 | |
| Heritage Park | | Oklahoma City, OK | | 453 | | February 2, 2022 | | 48,500 | | | 107 | | | 767 | |
| Raindance | | Oklahoma City, OK | | 504 | | February 2, 2022 | | 47,500 | | | 94 | | | 669 | |
| Haverford | | Louisville, KY | | 160 | | February 2, 2022 | | 31,050 | | | 194 | | | 1,146 | |
| Total | | | | 1,333 | | | | $ | 158,050 | | | $ | 119 | | | $ | 818 | |
| | | | | | | | | | | | | | |
| ASSETS HELD FOR SALE AS OF MARCH 31, 2022 |
| | | | | | | | | | | | | | | | |
| Property | | Location | | Units | | |
| Meadows Apartments | | Louisville, KY | | 400 | | |
| Sycamore Terrace | | Terra Haute, IN | | 250 | | |
| | | | | | |
| Total | | | | 650 | | |
| | | | | | | | | | | | | | |
| REAL ESTATE UNDER DEVELOPMENT |
| | | | | | | | | | | | | | | | | | | | | | | | | | | | | | | | | | | | | | | | | | | | | | | | | | | | | | | | |
| | | | | | | | Projected | | Development Costs |
| Property | | Location | | Planned Units | | Start Date | | Initial Occupancy Date | | Completion Date | | Stabilization Date | | Total Estimated | | Total through 3/31/22 | | Remaining |
| Destination Arista | | Denver,
CO | | 325 | | 3Q 2021 | | 2Q 2023 | | 4Q 2023 | | 1Q 2025 | | $ | 101,900 | | | $ | 38,779 | | | $ | 63,121 | |
| Flatirons Apartments | | Denver,
CO | | 296 | | 3Q 2022 | | 3Q 2024 | | 3Q 2024 | | 2Q 2026 | | 108,500 | | | 10,181 | | | 98,319 | |
| | | | | | | | | | | | | | | | | | |
| Total | | | | 621 | | | | | | | | | | $ | 210,400 | | | $ | 48,960 | | | $ | 161,440 | |
| | | | | | | | | | | | | | |
| INVESTMENTS IN UNCONSOLIDATED REAL ESTATE ENTITIES |
| | | | | | | | | | | | | | | | | | | | | | | | | | | | | | | | | | | | | | | | | | | | | | | | | | |
| Property | | Location | | Units | | Estimated Delivery Date | | Total Construction Budget | | Total Project Debt | | IRT Equity Interest in JV | | Remaining Expected IRT Investment | | Carrying Value of IRT’s Investment |
| Metropolis at Innsbrook | | Richmond, VA | | 402 | | | 2Q 2023 | | $ | 83,383 | | | $ | 64,000 | | | 84.8 | % | | $ | — | | | $ | 16,804 | |
Views of Music City I & II / The Jackson(1) | | Nashville, TN | | 504 | | | 4Q 2022 & 4Q 2023 | | 83,074 | | | 54,275 | | | 50.0 | % | | 4,015 | | | 10,385 | |
Virtuoso(2) | | Huntsville, AL | | 400 | | | Q1 2022 & Q2 2022 | | 127,500 | | | 86,381 | | | 90.0 | % | | 20,749 | | | 16,351 | |
| Total | | | | 1,306 | | | | | $ | 293,957 | | | $ | 204,656 | | | | | $ | 24,764 | | | $ | 43,540 | |
(1)Views of Music City consists of 96 Phase 1 units, which we acquired from the joint venture on April 6, 2022 and 209 Phase 2 units with an estimated delivery date of Q4 2023. The Jackson consists of 199 units with an estimated delivery date of year-end 2022.
(2)Virtuoso consists of 178 phase one single family homes acquired by the joint venture on March 31, 2022 and 222 phase two single family homes estimated to be completed and acquired by the joint venture in the second quarter of 2022.
DEBT SUMMARY AS OF MARCH 31, 2022
Dollars in thousands
| | | | | | | | | | | | | | | | | | | | | | | | | | |
| | Amount | | Weighted Average Rate (d) | | Type | | Weighted Average Maturity (in years) |
| Debt: | | | | | | | | |
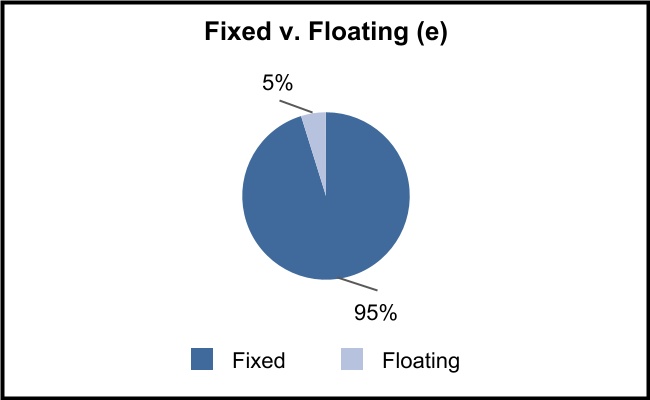
Unsecured revolver (a) | | $ | 117,503 | | | 1.7 | % | | Floating | | 3.8 |
Unsecured term loans (b) | | 500,000 | | | 1.6 | % | | Floating | | 2.9 |
Secured credit facilities (c) | | 635,128 | | | 4.0 | % | | Floating/Fixed | | 6.7 |
| Mortgages | | 1,236,748 | | | 3.9 | % | | Fixed | | 5.9 |
| Total Principal | | 2,489,379 | | | 3.4 | % | | | | 5.4 |
| Loan premiums (discounts), net | | 68,832 | | | | | | | |
| Unamortized deferred financing costs | | (16,123) | | | | | | | |
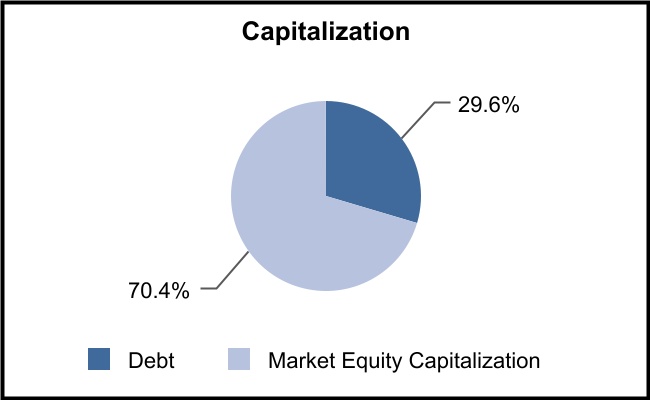
| Total Debt | | 2,542,088 | | | | | | | |
| Market Equity Capitalization, at period end | | 6,031,873 | | | | | | | |
| Total Capitalization | | $ | 8,573,961 | | | | | | | |
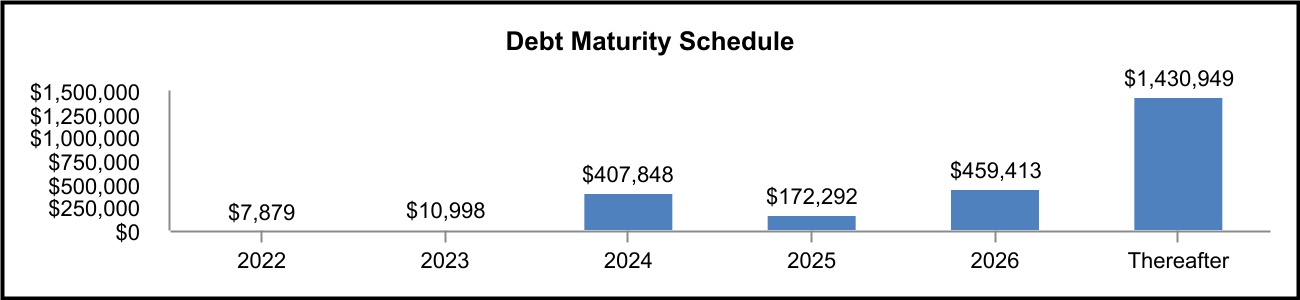
(a)Unsecured revolver total capacity is $500,000, of which $117,503 was drawn as of March 31, 2022. The maturity date of borrowings under the unsecured revolver is January 31, 2026.
(b)Consisted of a (i) $200,000 unsecured term loan with a maturity date of January 17, 2024, a (ii) $100,000 unsecured term loan with a maturity date of November 20, 2024, and a (iii) $200,000 unsecured term loan with a maturity date of May 18, 2026.
(c)Consists of a (i) $558,880 secured credit facility, three tranches of which, in an aggregate principal amount of $518,412, have a maturity date of August 1, 2028 and the fourth tranche of which, in the principal amount of $40,468, has a maturity date of March 1, 2030 and a (ii) $76,248 secured credit facility with a maturity date of July 1, 2030.
(d)Represents the weighted average of the contractual interest rates in effect as of quarter-end without regard to any interest rate swaps or collars. Our total weighted average effective interest rate during the three months ended March 31, 2022, after giving effect to the impact of interest rate swaps and collars, and excluding the impact of loan premium amortization and discount accretion was 3.8%.
(e)As of March 31, 2022, we maintained the following hedges that have effectively fixed a portion of our floating rates debt. Fixed v. Floating percentage above includes impact of future starting swaps.
Hedges
| | | | | | | | | | | | | | | | | | | | | | | | | | | | | | | | | | | | | | |
| | Notional | | Start | | End | | Swap Rate | | Floor Rate | | Cap Rate |
| Collar | | $ | 100,000 | | | 11/17/2017 | | 11/17/2024 | | — | | | 1.25 | % | | 2.00 | % |
| Collar | | $ | 150,000 | | | 10/17/2018 | | 1/17/2024 | | — | | | 2.25 | % | | 2.50 | % |
| Swap | | $ | 150,000 | | | 6/17/2021 | | 6/17/2026 | | 2.176 | % | | — | | | — | |
| Forward starting swap | | $ | 150,000 | | | 5/17/2022 | | 5/17/2027 | | 0.985 | % | | — | | | — | |
DEBT COVENANT AND UNENCUMBERED ASSET STATS AS OF MARCH 31, 2022
Dollars in thousands
Debt Covenant Summary(a) | | | | | | | | | | | | | | | | | | | | |
| | Requirement | | Actual | | Compliance |
| Consolidated leverage ratio | | ≤ 60% | | 34.6% | | Yes |
| Consolidated fixed charge coverage ratio | | ≥ 1.5x | | 3.5x | | Yes |
| Unsecured leverage ratio | | ≤ 60% | | 21.1% | | Yes |
(a)For a complete listing of all debt covenants along with definitions of each covenant calculation see the Third Amended, Restated and Consolidated Credit Agreement, which is included as exhibit 10.1 of the Form 8-K filed on December 14, 2021.
Encumbered & Unencumbered Statistics
| | | | | | | | | | | | | | | | | | | | | | | | | | | | | | | | | | | | | | |
| | Total Units | | % of Total | | Gross Assets | | % of Total | | Q1 2022 NOI | | % of Total |
| Unencumbered assets | | 17,486 | | | 49.3 | % | | $ | 3,050,656 | | | 45.3 | % | | $ | 44,591 | | | 47.6 | % |
| Encumbered assets | | 18,012 | | | 50.7 | % | | 3,680,721 | | | 54.7 | % | | 49,033 | | | 52.4 | % |
| | 35,498 | | | 100.0 | % | | $ | 6,731,377 | | | 100.0 | % | | $ | 93,624 | | | 100.0 | % |
DEFINITIONS
Average Effective Monthly Rent per Unit
Average effective rent per unit represents the average of gross rent amounts, divided by the average occupancy (in units) for the period presented. We believe average effective rent is a helpful measurement in evaluating average pricing. This metric, when presented, reflects the average effective rent per month.
Average Occupancy
Average occupancy represents the average occupied units for the reporting period divided by the average of total units available for rent for the reporting period.
EBITDA and Adjusted EBITDA
Each of EBITDA and Adjusted EBITDA is a non-GAAP financial measure. EBITDA is defined as net income before interest expense including amortization of deferred financing costs, income tax expense, and depreciation and amortization expenses. Adjusted EBITDA is EBITDA before certain other non-cash or non-operating gains or losses related to items such as asset sales, debt extinguishments and acquisition related debt extinguishment expenses, casualty losses, and abandoned deal costs. We consider each of EBITDA and Adjusted EBITDA to be an appropriate supplemental measure of performance because it eliminates interest, income taxes, depreciation and amortization, and other non-cash or non-operating gains and losses, which permits investors to view income from operations without these non-cash or non-operating items. Our calculation of Adjusted EBITDA differs from the methodology used for calculating Adjusted EBITDA by certain other REITs and, accordingly, our Adjusted EBITDA may not be comparable to Adjusted EBITDA reported by other REITs.
Funds From Operations (“FFO”) and Core Funds From Operations (“CFFO”)
We believe that FFO and Core FFO (“CFFO”), each of which is a non-GAAP financial measure, are additional appropriate measures of the operating performance of a REIT and us in particular. We compute FFO in accordance with the standards established by the National Association of Real Estate Investment Trusts (“NAREIT”), as net income or loss allocated to common shares (computed in accordance with GAAP), excluding real estate-related depreciation and amortization expense, gains or losses on sales of real estate and the cumulative effect of changes in accounting principles. While our calculation of FFO is in accordance with NAREIT’s definition, it may differ from the methodology for calculating FFO utilized by other REITs and, accordingly, may not be comparable to FFO computations of such other REITs.
CFFO is a computation made by analysts and investors to measure a real estate company’s operating performance by removing the effect of items that do not reflect ongoing property operations, including depreciation and amortization of other items not included in FFO, and other non-cash or non-operating gains or losses related to items such as merger and integration costs, casualty losses, abandoned deal costs and debt extinguishment costs from the determination of FFO.
Our calculation of CFFO may differ from the methodology used for calculating CFFO by other REITs and, accordingly, our CFFO may not be comparable to CFFO reported by other REITs. Our management utilizes FFO and CFFO as measures of our operating performance, and believe they are also useful to investors, because they facilitate an understanding of our operating performance after adjustment for certain non-cash or non-recurring items that are required by GAAP to be expensed but may not necessarily be indicative of current operating performance and our operating performance between periods. Furthermore, although FFO, CFFO and other supplemental performance measures are defined in various ways throughout the REIT industry, we believe that FFO and CFFO may provide us and our investors with an additional useful measure to compare our financial performance to certain other REITs. Neither FFO nor CFFO is equivalent to net income or cash generated from operating activities determined in accordance with GAAP. Furthermore, FFO and CFFO do not represent amounts available for management’s discretionary use because of needed capital replacement or expansion, debt service obligations or other commitments or uncertainties. Accordingly, FFO and CFFO do not measure whether cash flow is sufficient to fund all of our cash needs, including principal amortization and capital improvements. Neither FFO nor CFFO should be considered as an alternative to net income or any other
GAAP measurement as an indicator of our operating performance or as an alternative to cash flow from operating, investing, and financing activities as a measure of our liquidity.
Interest Coverage
Interest coverage is a ratio computed by dividing Adjusted EBITDA by interest expense.
Net Debt
Net debt, a non-GAAP financial measure, equals total debt less cash and cash equivalents and loan premiums and discounts. The following table provides a reconciliation of total debt to net debt (Dollars in thousands).
We present net debt because management believes it is a useful measure of our credit position and progress toward reducing leverage. The calculation is limited because we may not always be able to use cash to repay debt on a dollar for dollar basis.
| | | | | | | | | | | | | | | | | | | | | | | | | | | | | | | | |
| | As of |
| | March 31,
2022 | | December 31,
2021 | | September 30,
2021 | | June 30,
2021 | | March 31,
2021 |
| Total debt | | $ | 2,542,088 | | | $ | 2,705,336 | | | $ | 1,018,729 | | | $ | 1,056,463 | | | $ | 947,631 | |
| Less: cash and cash equivalents | | (23,971) | | | (35,972) | | | (8,720) | | | (7,566) | | | (8,653) | |
| Less: loan discounts and premiums, net | | (68,832) | | | (71,586) | | | — | | | — | | | — | |
| Total net debt | | $ | 2,449,285 | | | $ | 2,597,778 | | | $ | 1,010,009 | | | $ | 1,048,897 | | | $ | 938,978 | |
| | | | | | | | | | |
Net Operating IncomeWe believe that Net Operating Income (“NOI”), a non-GAAP financial measure, is a useful measure of our operating performance. We define NOI as total property revenues less total property operating expenses, excluding depreciation and amortization, casualty related costs, property management expenses, general administrative expenses, interest expense, and net gains on sale of assets.
Other REITs may use different methodologies for calculating NOI, and accordingly, our NOI may not be comparable to other REITs. We believe that this measure provides an operating perspective not immediately apparent from GAAP operating income or net income. We use NOI to evaluate our performance on a same-store and non same-store basis because NOI measures the core operations of property performance by excluding corporate level expenses and other items not related to property operating performance and captures trends in rental housing and property operating expenses. However, NOI should only be used as an alternative measure of our financial performance.
Same-Store Properties and Same-Store Portfolio
We review our same-store portfolio at the beginning of each calendar year. Properties are added into the same-store portfolio if they were owned at the beginning of the previous year. Properties that are held-for-sale or have been sold are excluded from the same-store portfolio. Because our portfolio of properties changed significantly as a result of our STAR Merger, which closed on December 16, 2021, we also present, as described below, information on the IRT Same-Store Portfolio, STAR Same-Store Portfolio and Combined Same-Store Portfolio.
IRT Same-Store Portfolio
IRT Same-Store Portfolio represents the 48 properties that IRT owned and consolidated as of January 1, 2021 and through March 31, 2022 (other than properties held for sale as of March 31, 2022).
STAR Same-Store Portfolio
STAR Same-Store Portfolio represents the 65 properties that STAR owned and consolidated as of January 1, 2021 and that, following the consummation of the Merger on December 16, 2021, continued to be owned and consolidated by IRT through March 31, 2022 (other than properties held for sale as of March 31, 2022).
Combined Same-Store Portfolio
Combined Same-Store Portfolio represents the combination of the IRT Same-Store Portfolio and the STAR Same-Store Portfolio considered as a single portfolio of 113 properties.
Pre-Merger STAR Portfolio NOI
In order to reconcile Combined Same-Store NOI to net income for periods prior to our December 16, 2021 merger with STAR, our reconciliation excludes NOI generated by the STAR Portfolio because IRT did not own these properties prior to December 16, 2021.
Total Gross Assets
Total Gross Assets equals total assets plus accumulated depreciation and accumulated amortization, including fully depreciated or amortized real estate and real estate related assets. The following table provides a reconciliation of total assets to total gross assets (dollars in thousands).
| | | | | | | | | | | | | | | | | | | | | | | | | | | | | | | | |
| | As of |
| | March 31,
2022 | | December 31,
2021 | | September 30,
2021 | | June 30,
2021 | | March 31,
2021 |
| Total assets | | $ | 6,387,322 | | | $ | 6,506,696 | | | $ | 1,846,911 | | | $ | 1,875,122 | | | $ | 1,728,016 | |
Plus: accumulated depreciation(a) | | 291,199 | | | 254,123 | | | 247,563 | | | 237,684 | | | 223,187 | |
| Plus: accumulated amortization | | 52,856 | | | 24,829 | | | 20,269 | | | 20,215 | | | 19,776 | |
| Total gross assets | | $ | 6,731,377 | | | $ | 6,785,648 | | | $ | 2,114,743 | | | $ | 2,133,021 | | | $ | 1,970,979 | |
(a)Includes accumulated depreciation associated with real estate held for sale.
APPENDIX A
COMBINED SAME-STORE PORTFOLIO NET OPERATING INCOME
FOR THE THREE MONTHS ENDED MARCH 31, 2022 and 2021
Dollars in thousands
| | | | | | | | | | | | | | | | | | | | | | | | | | | | | | | | | | | |
| IRT Same-Store Portfolio(a) | | STAR Same-Store Portfolio(b) | | Combined Same-Store(c) |
| | | | | | | | | | | |
| 2022 | 2021 | % Change | | 2022 | 2021 | % Change | | 2022 | 2021 | % Change |
| Revenue: | | | | | | | | | | | |
Rental and other property
revenue | $52,290 | | 47,487 | | 10.1 | % | | 89,416 | | $80,180 | | 11.5 | % | | $141,706 | | $127,667 | | 11.0 | % |
| Property Operating Expenses: | | | | | | | | | | |
| Real estate taxes | 6,229 | | 6,084 | | 2.4 | % | | 12,497 | | 12,048 | | 3.7 | % | | 18,726 | | 18,132 | | 3.3 | % |
| Property insurance | 1,145 | | 1,054 | | 8.6 | % | | 1,639 | | 1,606 | | 2.1 | % | | 2,784 | | 2,660 | | 4.7 | % |
| Personnel expenses | 4,665 | | 3,993 | | 16.8 | % | | 7,387 | | 7,467 | | (1.1) | % | | 12,052 | | 11,460 | | 5.2 | % |
| Utilities | 2,689 | | 2,501 | | 7.5 | % | | 4,619 | | 4,706 | | (1.8) | % | | 7,308 | | 7,207 | | 1.4 | % |
| Repairs and maintenance | 1,658 | | 1,465 | | 13.2 | % | | 2,551 | | 2,785 | | (8.4) | % | | 4,209 | | 4,250 | | (1.0) | % |
| Contract services | 1,812 | | 1,764 | | 2.7 | % | | 2,910 | | 2,601 | | 11.9 | % | | 4,722 | | 4,365 | | 8.2 | % |
| Advertising expenses | 446 | | 459 | | (2.8) | % | | 734 | | 799 | | (8.1) | % | | 1,180 | | 1,258 | | (6.2) | % |
| Other expenses | 594 | | 504 | | 17.9 | % | | 962 | | 1,084 | | (11.3) | % | | 1,556 | | 1,588 | | (2.0) | % |
Total property operating
expenses | 19,238 | | 17,824 | | 7.9 | % | | 33,299 | | 33,096 | | 0.6 | % | | 52,537 | | 50,920 | | 3.2 | % |
Same-store net
operating income | $33,052 | | 29,663 | | 11.4 | % | | 56,117 | | $47,084 | | 19.2 | % | | $89,169 | | $76,747 | | 16.2 | % |
| | | | | | | | | | | | | | | | | | | | | | | | | | | | | | | | | | | |
| | | | | | | | | | | |
| Same-store NOI margin | 63.2 | % | 62.5 | % | 0.7 | % | | 62.8 | % | 58.7 | % | 4.0 | % | | 62.9 | % | 60.1 | % | 2.8 | % |
| Average occupancy | 95.5 | % | 95.3 | % | 0.2 | % | | 95.3 | % | 95.3 | % | — | % | | 95.4 | % | 95.3 | % | 0.1 | % |
| | | | | | | | | | | | | | | | | | | | | | | | | | | | | | | | | | | |
Average effective monthly
rent, per unit | $ | 1,312 | | $ | 1,182 | | 11.0 | % | | $ | 1,411 | | $ | 1,283 | | 10.0 | % | | $ | 1,373 | | $ | 1,244 | | 10.4 | % |
(a)IRT Same-Store Portfolio consists of 48 properties, which represent 13,110 units.
(b)STAR Same-Store Portfolio consists of 65 properties, which represent 20,694 units.
(c)Combined Same-Store Portfolio consists of 113 properties, which represent 33,804 units.