
2.60 1.80 2.15 3.30 3.75 5.10 0.15 5.10 4.50 - logo 0.15 June 2016 www.irtreit.com Exhibit 99.1
This presentation may include “forward-looking statements” within the meaning of Section 27A of the Securities Act of 1933, as amended, and Section 21E of the Securities Exchange Act of 1934, as amended. These forward-looking statements are based on current expectations, estimates and projections about the industry and markets in which Independence Realty Trust, Inc. (“IRT”) operates and beliefs of and assumptions made by IRT management, and involve uncertainties that could significantly affect the financial results of IRT. Words such as “expects,” “anticipates,” “intends,” “plans,” “believes,” “seeks,” “estimates,” “focused,” variations of such words and similar expressions are intended to identify such forward-looking statements, which generally are not historical in nature. Such forward-looking statements include, but are not limited to, statements about the anticipated impact of IRT’s acquisition of Trade Street Residential, Inc. (“TSRE”), future financial and operating results (such as FFO and Core FFO), IRT’s plans, objectives, expectations and intentions and statements that address operating performance, events or developments that IRT expects or anticipates will occur in the future. These statements are not guarantees of future performance and involve certain risks, uncertainties and assumptions that are difficult to predict. Although IRT believes the expectations reflected in any forward-looking statements are based on reasonable assumptions, IRT can give no assurance that IRT’s expectations will be attained and therefore, actual outcomes and results may differ materially from what is expressed or forecasted in such forward-looking statements. Some of the factors that may affect outcomes and results include, but are not limited to: (i) national, regional and local economic climates, (ii) changes in financial markets and interest rates, or to the business or financial condition of IRT, (iii) changes in market demand for rental apartment homes and competitive pricing, (iv) risks associated with acquisitions, including the integration of IRT’s and TSRE’s businesses, (v) IRT’s maintenance of real estate investment trust (“REIT”) status, (vi) availability of financing and capital, (vii) risks associated with achieving expected revenue synergies or cost savings, (viii) dividends are subject to the discretion of IRT’s Board of Directors, and will depend on IRT’s financial condition, results of operations, capital requirements, compliance with applicable laws and agreements and any other factors deemed relevant by IRT’s Board, (x) risks associated with pursuing additional strategic acquisitions, including risks associated with the need to raise additional capital to fund the acquisitions, (xi) whether IRT will be able to pay down IRT’s Interim Term Loan or other indebtedness, and (xii) those additional risks and factors discussed in reports filed with the Securities and Exchange Commission (“SEC”) by IRT from time to time, including those discussed under the heading “Risk Factors” in IRT’s most recently filed reports on Forms 10-K and 10-Q. IRT does not undertake any duty to update any forward-looking statements appearing in this presentation. This document and the related presentation may contain non-U.S. generally accepted accounting principles (“GAAP”) financial measures. A reconciliation of these non-GAAP financial measures to the most directly comparable GAAP financial measure is included in this document and/or IRT’s reports filed or furnished with the SEC available at IRT’s website www.IRTREIT.com under Investor Relations. IRT’s other SEC filings are also available through this link. This presentation is for informational purposes only and does not constitute an offer to sell or a solicitation of an offer to buy any securities of IRT. Disclosure Notices
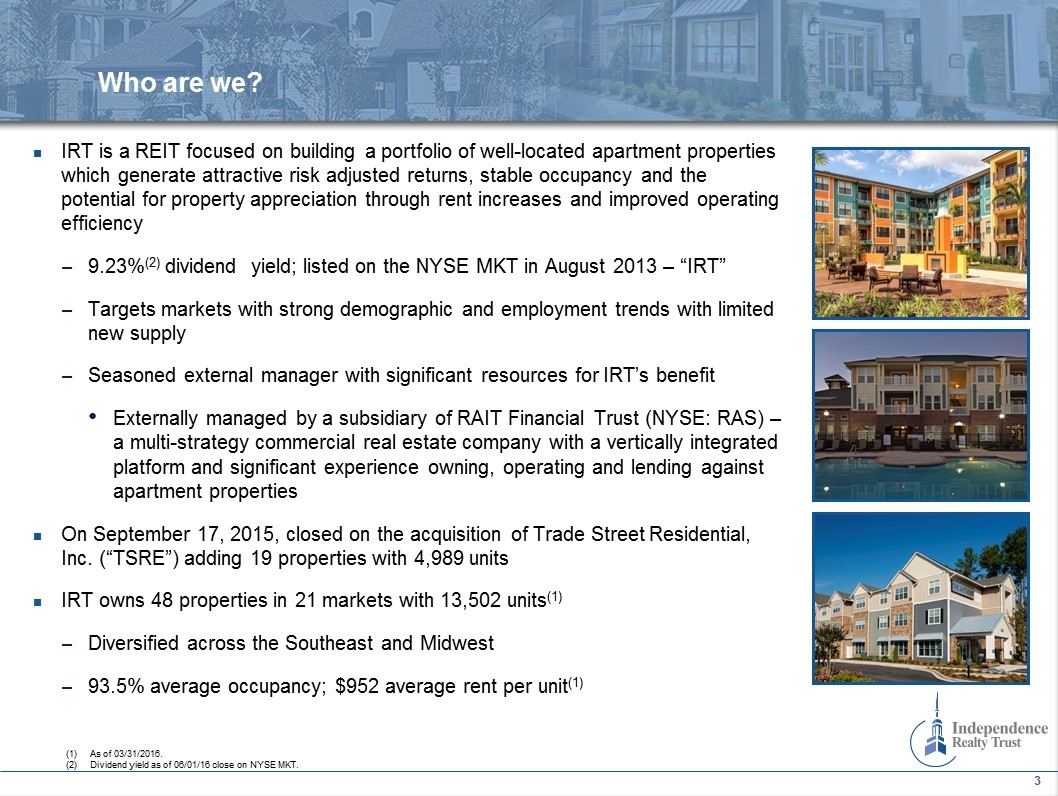
IRT is a REIT focused on building a portfolio of well-located apartment properties which generate attractive risk adjusted returns, stable occupancy and the potential for property appreciation through rent increases and improved operating efficiency 9.23%(2) dividend yield; listed on the NYSE MKT in August 2013 – “IRT” Targets markets with strong demographic and employment trends with limited new supply Seasoned external manager with significant resources for IRT’s benefit Externally managed by a subsidiary of RAIT Financial Trust (NYSE: RAS) – a multi-strategy commercial real estate company with a vertically integrated platform and significant experience owning, operating and lending against apartment properties On September 17, 2015, closed on the acquisition of Trade Street Residential, Inc. (“TSRE”) adding 19 properties with 4,989 units IRT owns 48 properties in 21 markets with 13,502 units(1) Diversified across the Southeast and Midwest 93.5% average occupancy; $952 average rent per unit(1) Who are we? As of 03/31/2016. Dividend yield as of 06/01/16 close on NYSE MKT.
Scott F. Schaeffer Chairman & CEO Chairman and CEO – Independence Realty Trust, Inc. Over 16 years at RAIT Financial Trust serving in a variety of roles Extensive real estate experience (over 30 years) specializing in acquiring and financing commercial real estate Previously, led the real estate group at Resource America, Inc., a specialty finance company Farrell M. Ender President President – Independence Realty Trust, Inc. Served in a variety of roles at RAIT Financial Trust dating back to 2002 Over 15 years of experience in the acquisition/disposition, property management, and construction management of apartment properties James J. Sebra CFO & Treasurer CFO and Treasurer – Independence Realty Trust, Inc. Joined RAIT Financial Trust in December 2006 17 years of real estate experience IRT is led by a management team with significant multifamily and real estate experience (15 - 30+ years of industry experience) Senior Management
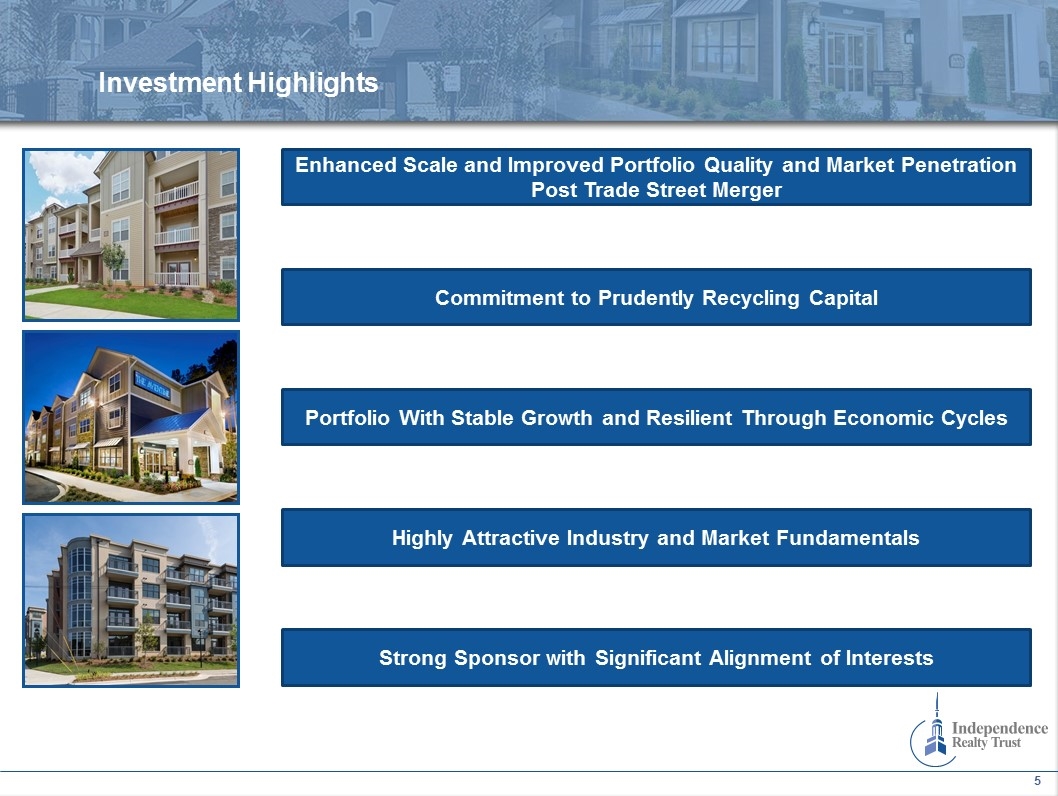
Portfolio With Stable Growth and Resilient Through Economic Cycles Highly Attractive Industry and Market Fundamentals Commitment to Prudently Recycling Capital Enhanced Scale and Improved Portfolio Quality and Market Penetration Post Trade Street Merger Strong Sponsor with Significant Alignment of Interests Investment Highlights

2.60 1.80 2.15 3.30 3.75 5.10 0.15 5.10 4.50 - logo 0.15 Enhanced Scale and Improved Portfolio Quality and Market Penetration Post Trade Street Merger
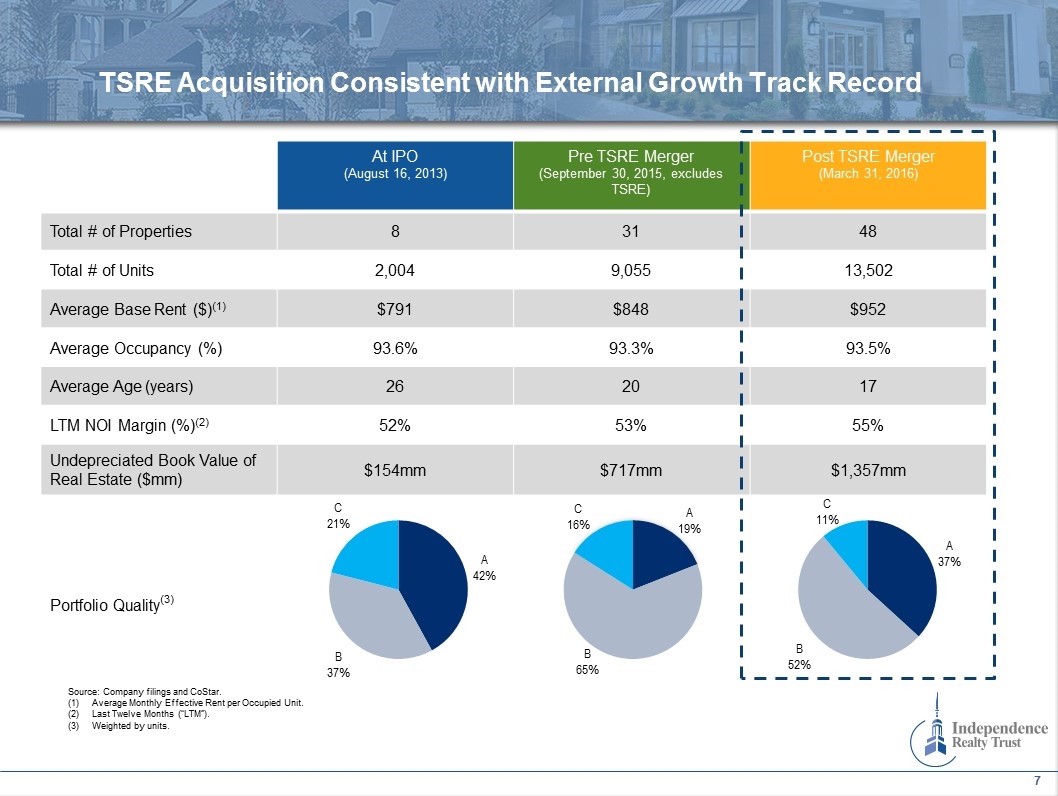
TSRE Acquisition Consistent with External Growth Track Record At IPO (August 16, 2013) Pre TSRE Merger (September 30, 2015, excludes TSRE) Post TSRE Merger (March 31, 2016) Total # of Properties 8 31 48 Total # of Units 2,004 9,055 13,502 Average Base Rent ($)(1) $791 $848 $952 Average Occupancy (%) 93.6% 93.3% 93.5% Average Age (years) 26 20 17 LTM NOI Margin (%)(2) 52% 53% 55% Undepreciated Book Value of Real Estate ($mm) $154mm $717mm $1,357mm Portfolio Quality(3) Source: Company filings and CoStar. Average Monthly Effective Rent per Occupied Unit. Last Twelve Months (“LTM”). Weighted by units.
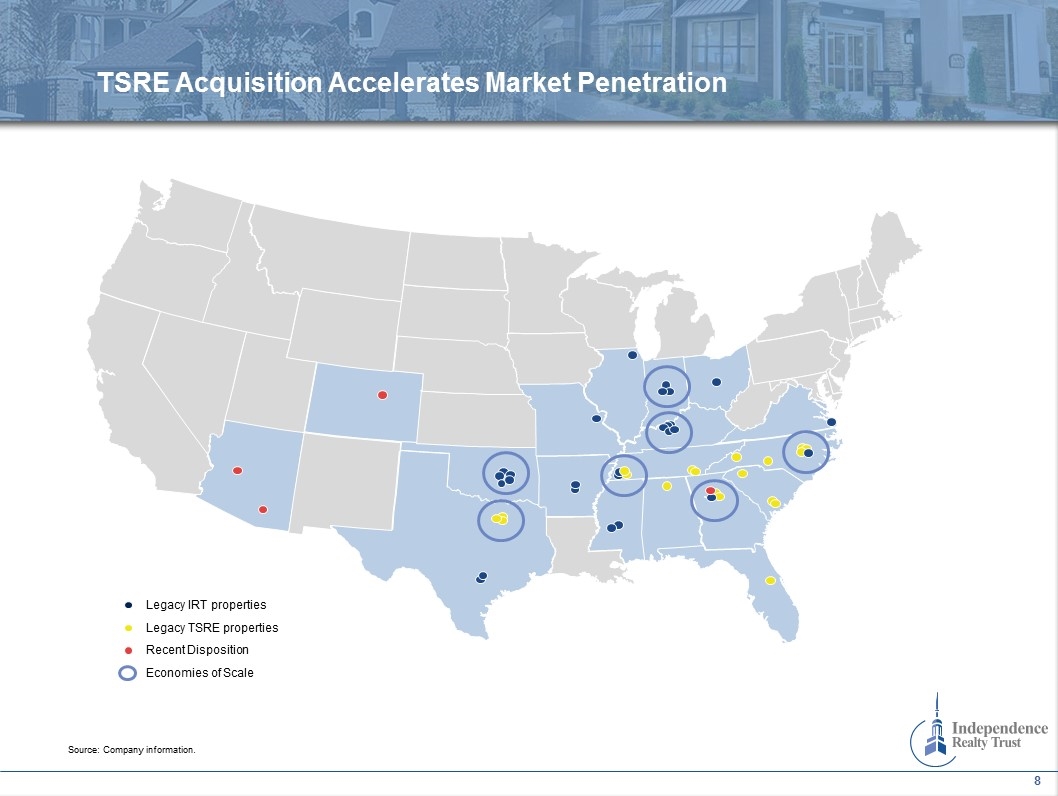
TSRE Acquisition Accelerates Market Penetration Legacy IRT properties Recent Disposition Economies of Scale Legacy TSRE properties Source: Company information.

2.60 1.80 2.15 3.30 3.75 5.10 0.15 5.10 4.50 - logo 0.15 Commitment to Prudently Recycling Capital
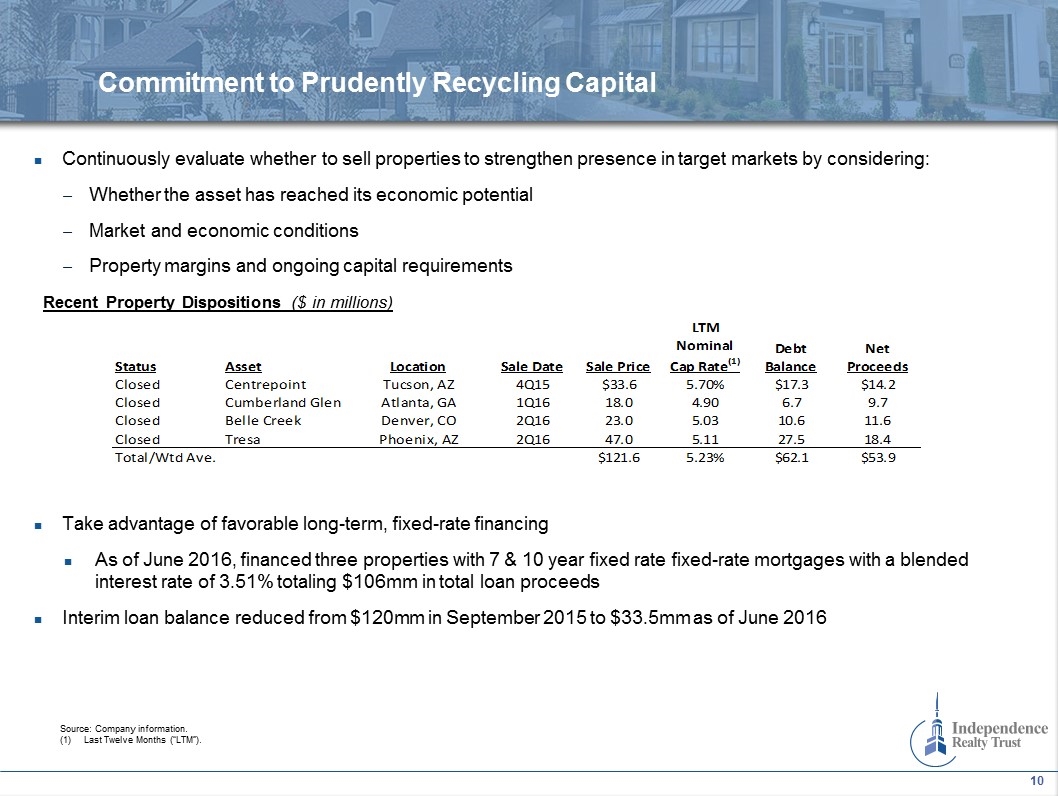
Commitment to Prudently Recycling Capital Continuously evaluate whether to sell properties to strengthen presence in target markets by considering: Whether the asset has reached its economic potential Market and economic conditions Property margins and ongoing capital requirements Source: Company information. Last Twelve Months (“LTM”). Recent Property Dispositions ($ in millions) Take advantage of favorable long-term, fixed-rate financing As of June 2016, financed three properties with 7 & 10 year fixed rate fixed-rate mortgages with a blended interest rate of 3.51% totaling $106mm in total loan proceeds Interim loan balance reduced from $120mm in September 2015 to $33.5mm as of June 2016

2.60 1.80 2.15 3.30 3.75 5.10 0.15 5.10 4.50 - logo 0.15 Portfolio With Stable Growth and Resilient Through Economic Cycles
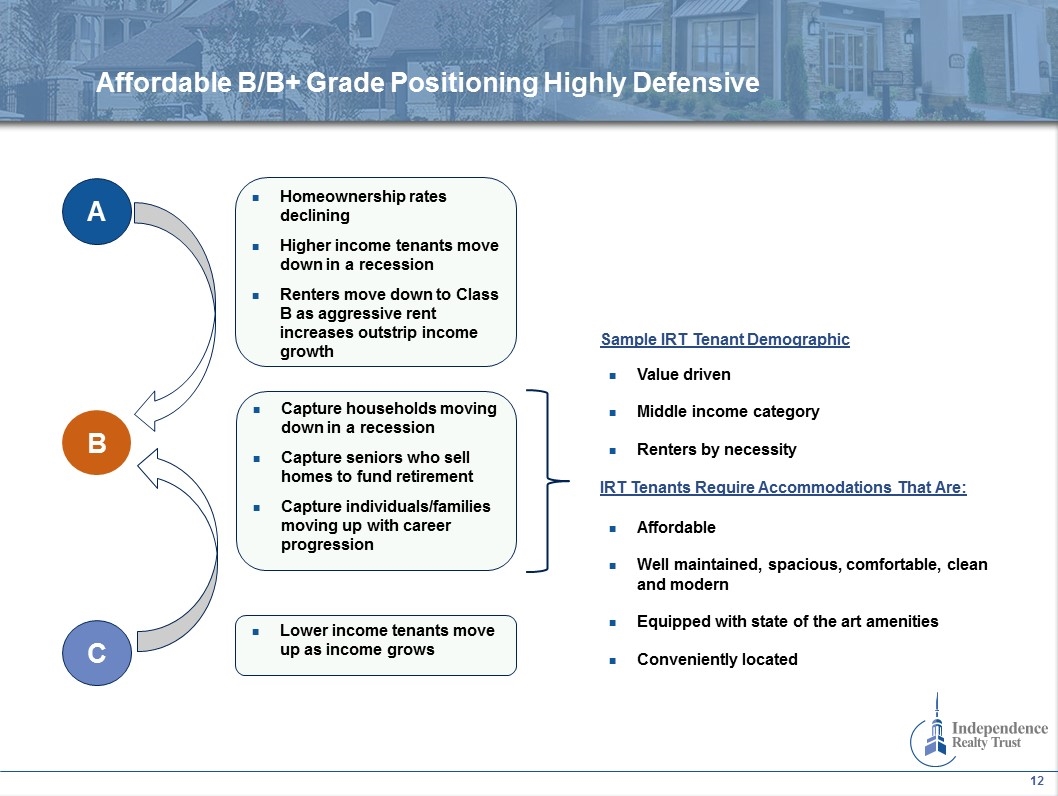
Affordable B/B+ Grade Positioning Highly Defensive A B C Homeownership rates declining Higher income tenants move down in a recession Renters move down to Class B as aggressive rent increases outstrip income growth Capture households moving down in a recession Capture seniors who sell homes to fund retirement Capture individuals/families moving up with career progression Lower income tenants move up as income grows Sample IRT Tenant Demographic Value driven Middle income category Renters by necessity IRT Tenants Require Accommodations That Are: Affordable Well maintained, spacious, comfortable, clean and modern Equipped with state of the art amenities Conveniently located
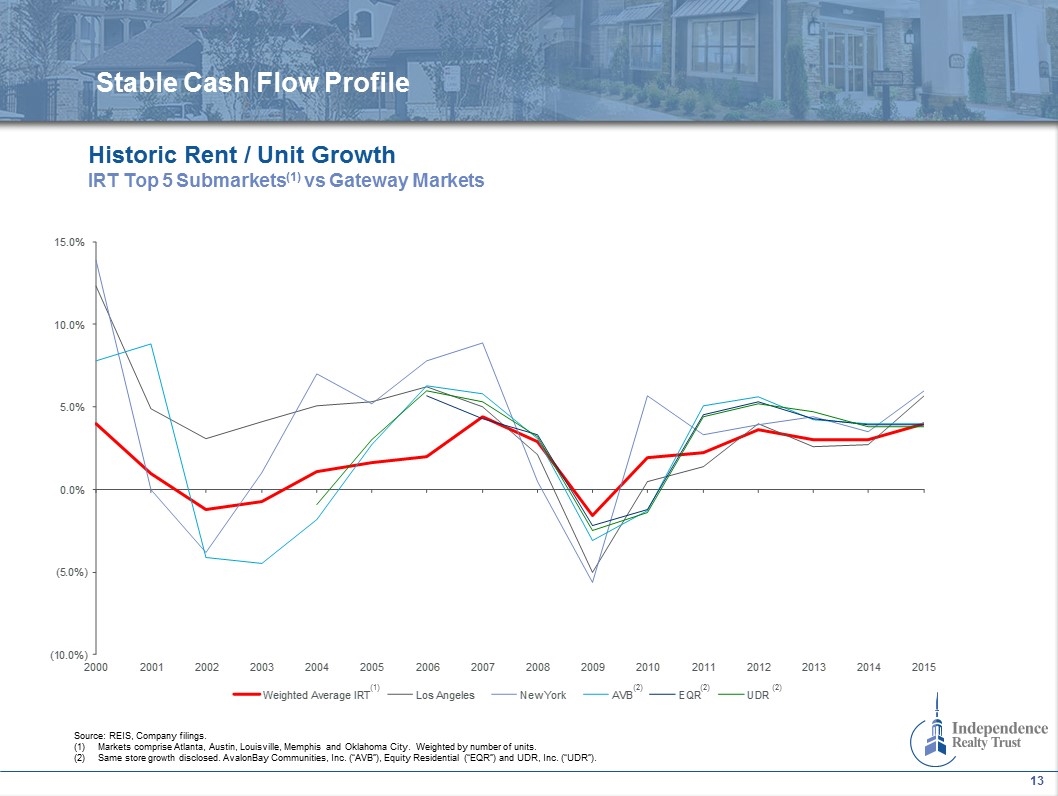
Stable Cash Flow Profile Historic Rent / Unit Growth IRT Top 5 Submarkets(1) vs Gateway Markets Source: REIS, Company filings. Markets comprise Atlanta, Austin, Louisville, Memphis and Oklahoma City. Weighted by number of units. Same store growth disclosed. AvalonBay Communities, Inc. (“AVB”), Equity Residential (“EQR”) and UDR, Inc. (“UDR”). (1) (2) (2) (2)

2.60 1.80 2.15 3.30 3.75 5.10 0.15 5.10 4.50 - logo 0.15 Highly Attractive Industry and Market Fundamentals
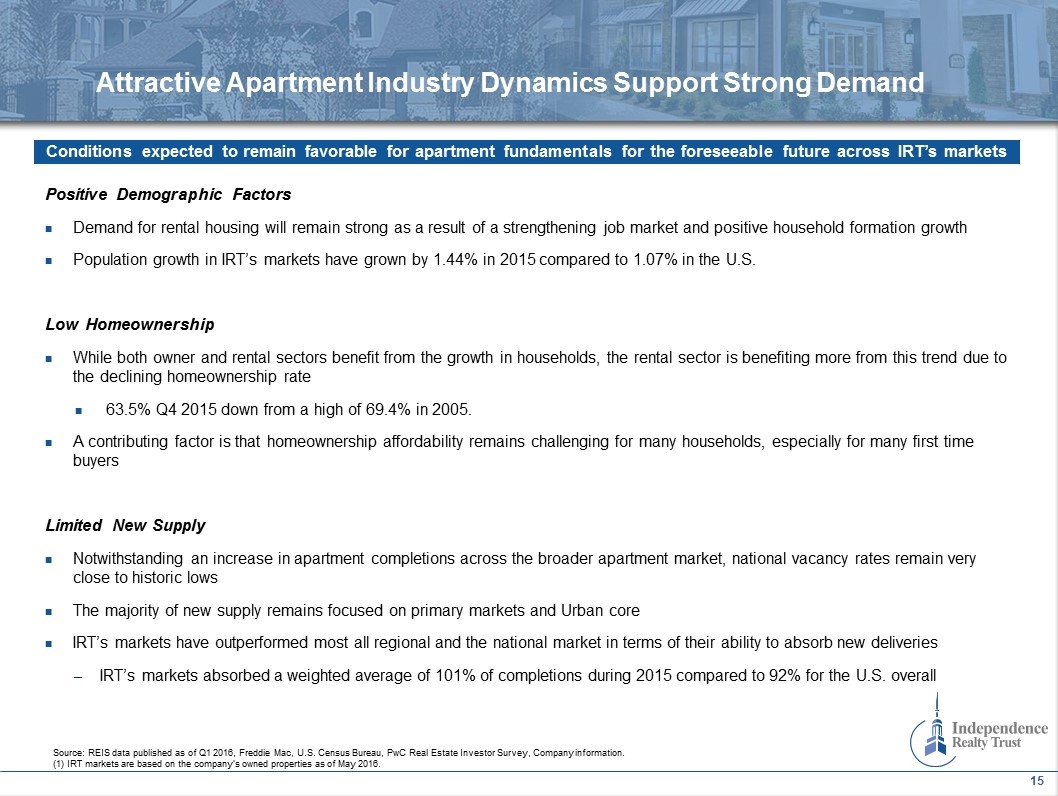
Attractive Apartment Industry Dynamics Support Strong Demand Positive Demographic Factors Demand for rental housing will remain strong as a result of a strengthening job market and positive household formation growth Population growth in IRT’s markets have grown by 1.44% in 2015 compared to 1.07% in the U.S. Low Homeownership While both owner and rental sectors benefit from the growth in households, the rental sector is benefiting more from this trend due to the declining homeownership rate 63.5% Q4 2015 down from a high of 69.4% in 2005. A contributing factor is that homeownership affordability remains challenging for many households, especially for many first time buyers Limited New Supply Notwithstanding an increase in apartment completions across the broader apartment market, national vacancy rates remain very close to historic lows The majority of new supply remains focused on primary markets and Urban core IRT’s markets have outperformed most all regional and the national market in terms of their ability to absorb new deliveries IRT’s markets absorbed a weighted average of 101% of completions during 2015 compared to 92% for the U.S. overall Source: REIS data published as of Q1 2016, Freddie Mac, U.S. Census Bureau, PwC Real Estate Investor Survey, Company information. (1) IRT markets are based on the company’s owned properties as of May 2016. Conditions expected to remain favorable for apartment fundamentals for the foreseeable future across IRT’s markets
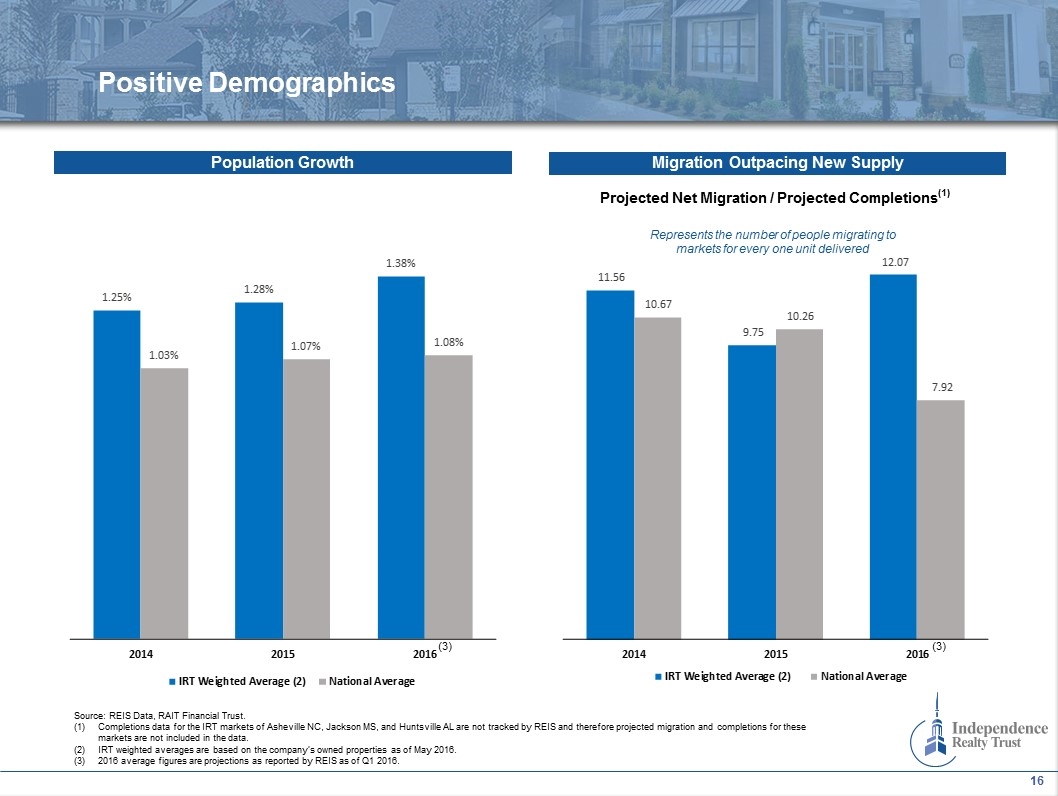
Positive Demographics Migration Outpacing New Supply Projected Net Migration / Projected Completions(1) Represents the number of people migrating to markets for every one unit delivered Population Growth Source: REIS Data, RAIT Financial Trust. Completions data for the IRT markets of Asheville NC, Jackson MS, and Huntsville AL are not tracked by REIS and therefore projected migration and completions for these markets are not included in the data. IRT weighted averages are based on the company’s owned properties as of May 2016. 2016 average figures are projections as reported by REIS as of Q1 2016. (3) (3)
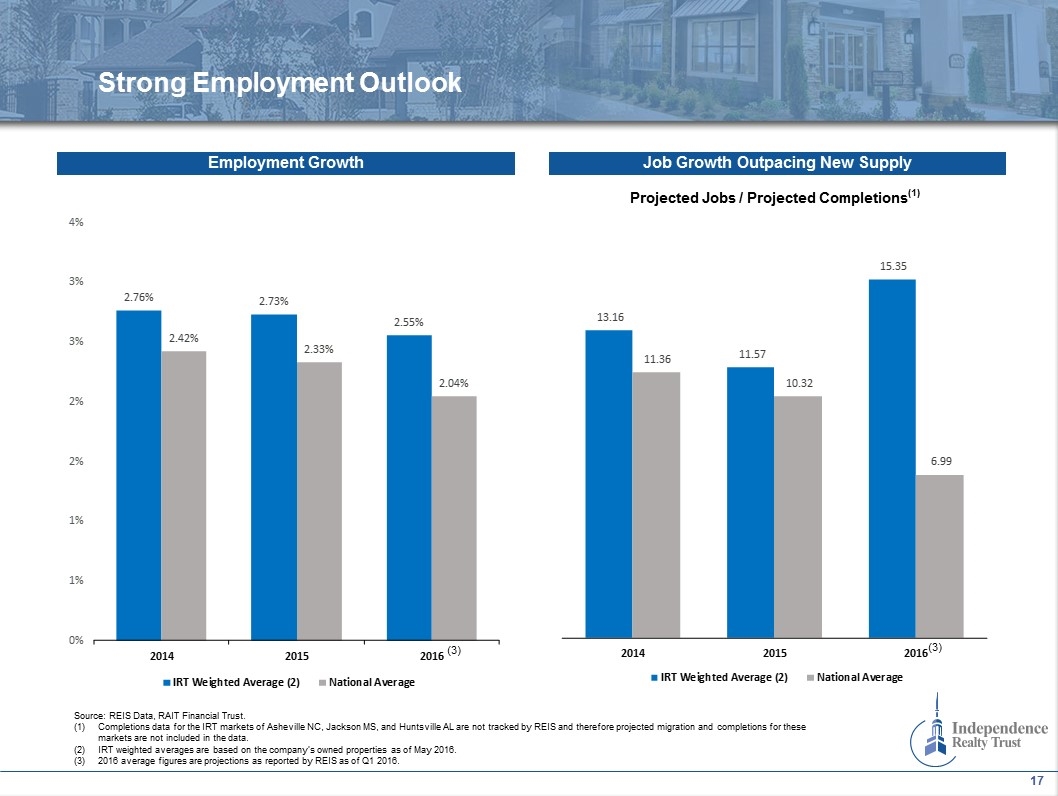
Strong Employment Outlook Job Growth Outpacing New Supply Projected Jobs / Projected Completions(1) Employment Growth Source: REIS Data, RAIT Financial Trust. Completions data for the IRT markets of Asheville NC, Jackson MS, and Huntsville AL are not tracked by REIS and therefore projected migration and completions for these markets are not included in the data. IRT weighted averages are based on the company’s owned properties as of May 2016. 2016 average figures are projections as reported by REIS as of Q1 2016. (3) (3)
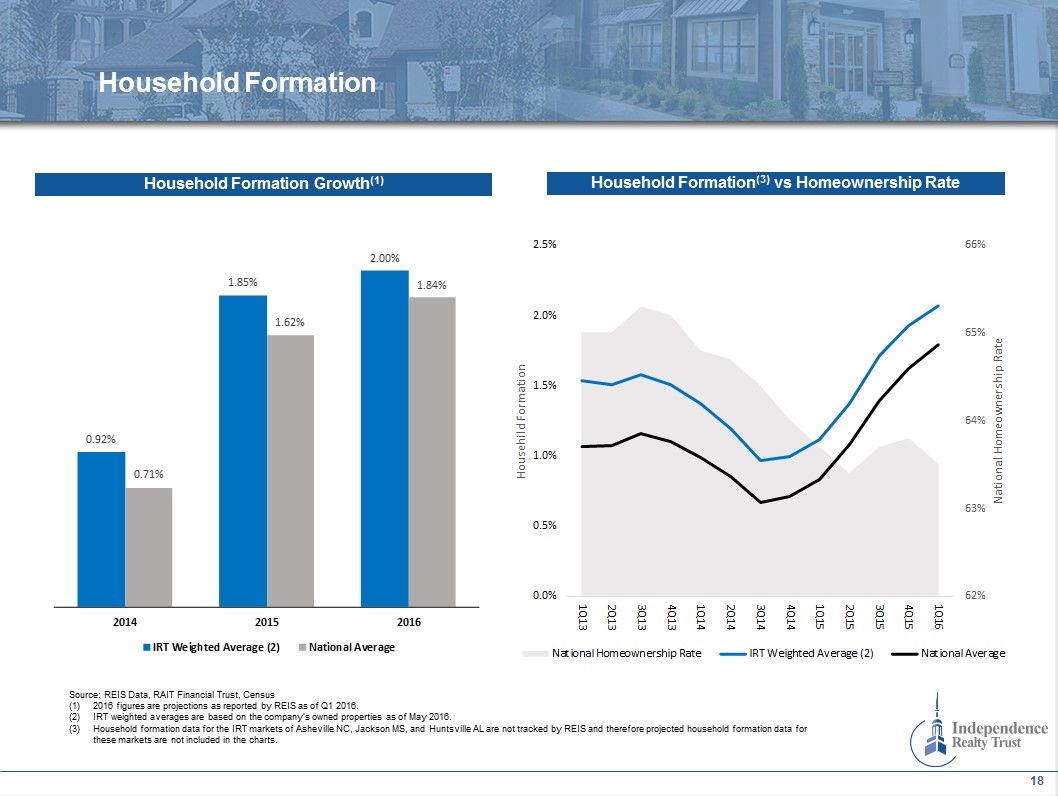
Household Formation Household Formation Growth(1) Source: REIS Data, RAIT Financial Trust, Census 2016 figures are projections as reported by REIS as of Q1 2016. IRT weighted averages are based on the company’s owned properties as of May 2016. Household formation data for the IRT markets of Asheville NC, Jackson MS, and Huntsville AL are not tracked by REIS and therefore projected household formation data for these markets are not included in the charts. Household Formation(3) vs Homeownership Rate

2.60 1.80 2.15 3.30 3.75 5.10 0.15 5.10 4.50 - logo 0.15 Strong Sponsor with Significant Alignment of Interests
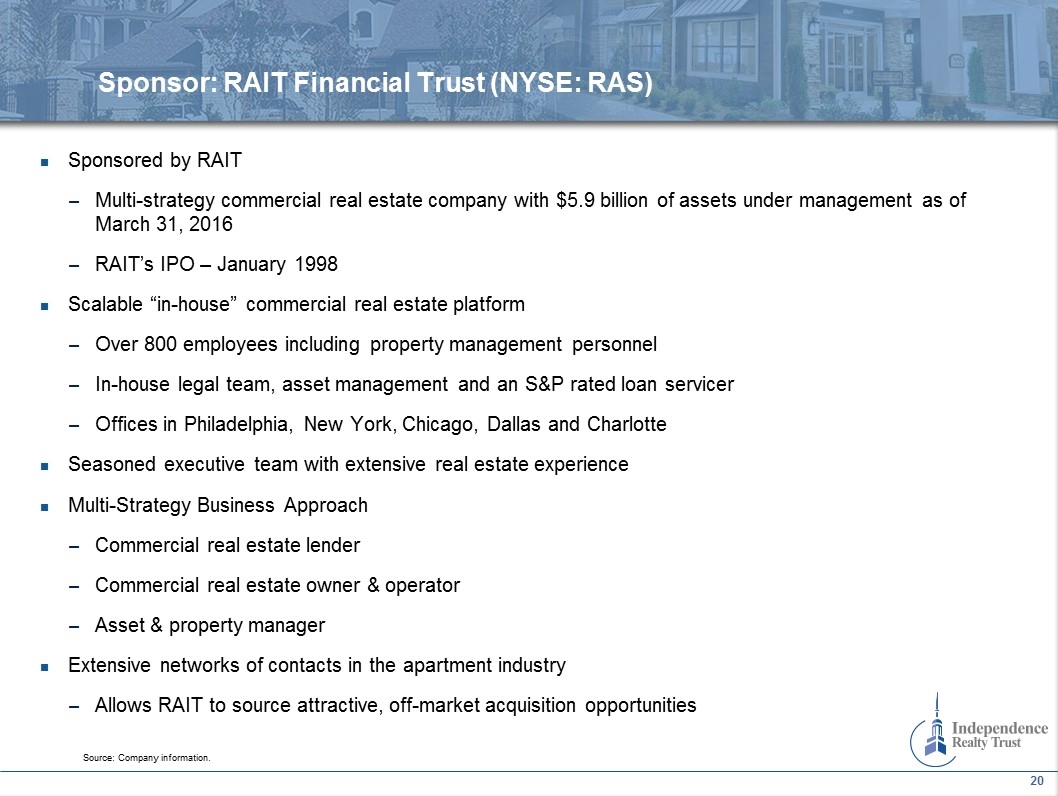
Sponsored by RAIT Multi-strategy commercial real estate company with $5.9 billion of assets under management as of March 31, 2016 RAIT’s IPO – January 1998 Scalable “in-house” commercial real estate platform Over 800 employees including property management personnel In-house legal team, asset management and an S&P rated loan servicer Offices in Philadelphia, New York, Chicago, Dallas and Charlotte Seasoned executive team with extensive real estate experience Multi-Strategy Business Approach Commercial real estate lender Commercial real estate owner & operator Asset & property manager Extensive networks of contacts in the apartment industry Allows RAIT to source attractive, off-market acquisition opportunities Sponsor: RAIT Financial Trust (NYSE: RAS) Source: Company information.
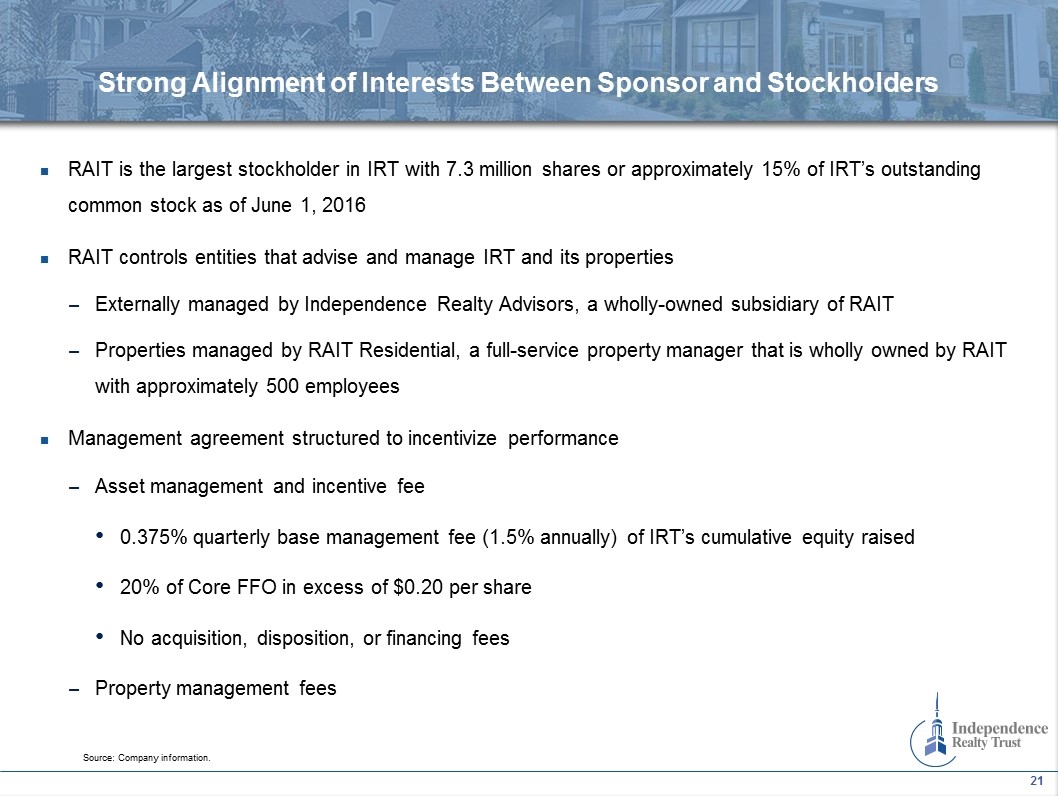
RAIT is the largest stockholder in IRT with 7.3 million shares or approximately 15% of IRT’s outstanding common stock as of June 1, 2016 RAIT controls entities that advise and manage IRT and its properties Externally managed by Independence Realty Advisors, a wholly-owned subsidiary of RAIT Properties managed by RAIT Residential, a full-service property manager that is wholly owned by RAIT with approximately 500 employees Management agreement structured to incentivize performance Asset management and incentive fee 0.375% quarterly base management fee (1.5% annually) of IRT’s cumulative equity raised 20% of Core FFO in excess of $0.20 per share No acquisition, disposition, or financing fees Property management fees Strong Alignment of Interests Between Sponsor and Stockholders Source: Company information.
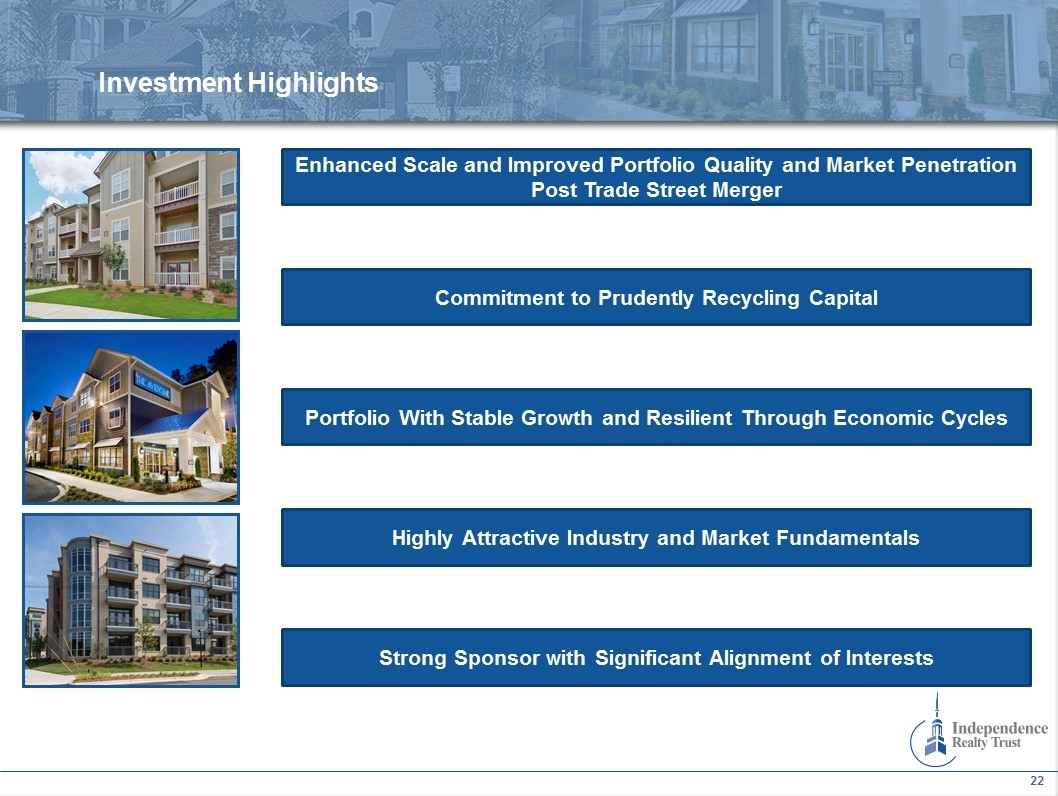
Portfolio With Stable Growth and Resilient Through Economic Cycles Highly Attractive Industry and Market Fundamentals Commitment to Prudently Recycling Capital Enhanced Scale and Improved Portfolio Quality and Market Penetration Post Trade Street Merger Strong Sponsor with Significant Alignment of Interests Investment Highlights

2.60 1.80 2.15 3.30 3.75 5.10 0.15 5.10 4.50 - logo 0.15 Appendix
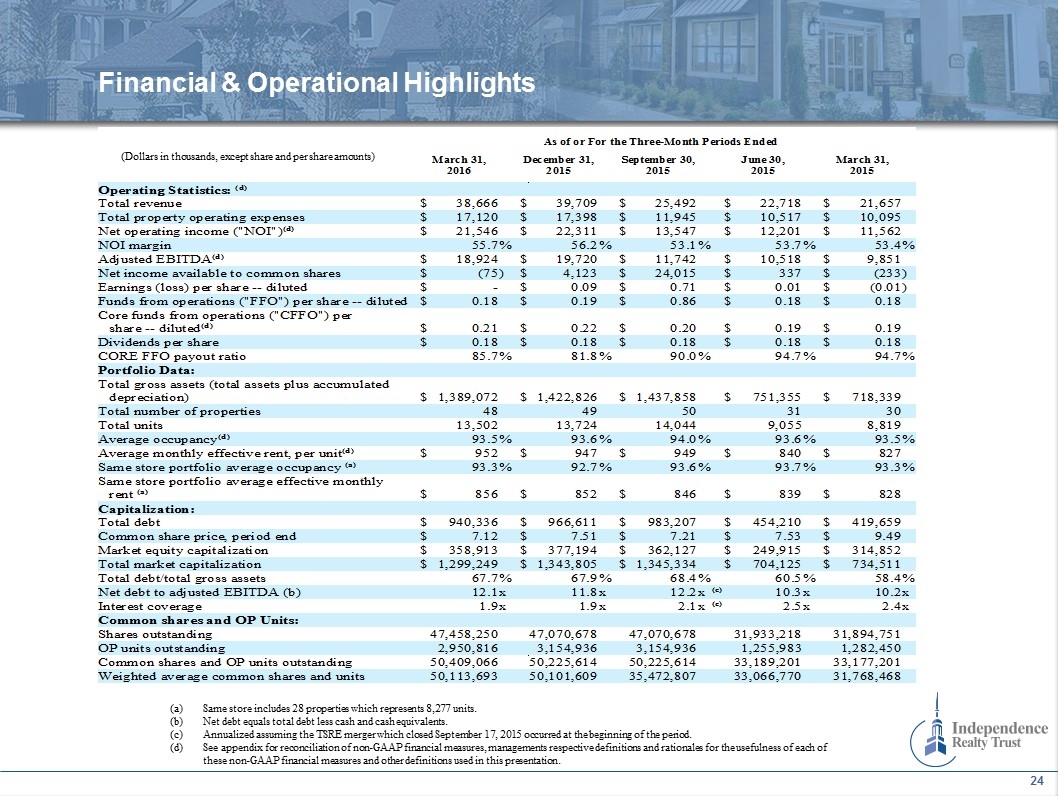
Financial & Operational Highlights (a)Same store includes 28 properties which represents 8,277 units. (b)Net debt equals total debt less cash and cash equivalents. Annualized assuming the TSRE merger which closed September 17, 2015 occurred at the beginning of the period. See appendix for reconciliation of non-GAAP financial measures, managements respective definitions and rationales for the usefulness of each of these non-GAAP financial measures and other definitions used in this presentation. (Dollars in thousands, except share and per share amounts) As of or For the Three-Month Periods Ended March 31,2016 December 31,2015 September 30,2015 June 30,2015 March 31,2015 Operating Statistics: (d) Total revenue $38,666 $39,709 $25,492 $22,718 $21,657 Total property operating expenses $17,120 $17,398 $11,945 $10,517 $10,095 Net operating income ("NOI")(d) $21,546 $22,311 $13,547 $12,201 $11,562 NOI margin 55.7% 56.2% 53.1% 53.7% 53.4%Adjusted EBITDA(d) $18,924 $19,720 $11,742 $10,518 $9,851 Net income available to common shares $(75) $4,123 $24,015 $337 $(233)Earnings (loss) per share -- diluted $- $0.09 $0.71 $0.01 $(0.01)Funds from operations ("FFO") per share -- diluted $0.18 $0.19 $0.86 $0.18 $0.18 Core funds from operations ("CFFO") per share -- diluted(d) $0.21 $0.22 $0.20 $0.19 $0.19 Dividends per share $0.18 $0.18 $0.18 $0.18 $0.18 CORE FFO payout ratio 85.7% 81.8% 90.0% 94.7% 94.7%Portfolio Data: Total gross assets (total assets plus accumulated depreciation) $1,389,072 $1,422,826 $1,437,858 $751,355 $718,339 Total number of properties 48 49 50 31 30 Total units 13,502 13,724 14,044 9,055 8,819 Average occupancy(d) 93.5% 93.6% 94.0% 93.6% 93.5%Average monthly effective rent, per unit(d) $952 $947 $949 $840 $827 Same store portfolio average occupancy (a) 93.3% 92.7% 93.6% 93.7% 93.3%Same store portfolio average effective monthly rent (a) $856 $852 $846 $839 $828 Capitalization: Total debt $940,336 $966,611 $983,207 $454,210 $419,659 Common share price, period end $7.12 $7.51 $7.21 $7.53 $9.49 Market equity capitalization $358,913 $377,194 $362,127 $249,915 $314,852 Total market capitalization $1,299,249 $1,343,805 $1,345,334 $704,125 $734,511 Total debt/total gross assets 67.7% 67.9% 68.4% 60.5% 58.4%Net debt to adjusted EBITDA (b) 12.1x 11.8x 12.2x(c) 10.3x 10.2xInterest coverage 1.9x 1.9x 2.1x(c) 2.5x 2.4xCommon shares and OP Units: Shares outstanding 47,458,250 47,070,678 47,070,678 31,933,218 31,894,751 OP units outstanding 2,950,816 3,154,936 3,154,936 1,255,983 1,282,450 Common shares and OP units outstanding 50,409,066 50,225,614 50,225,614 33,189,201 33,177,201 Weighted average common shares and units 50,113,693 50,101,609 35,472,807 33,066,770 31,768,468
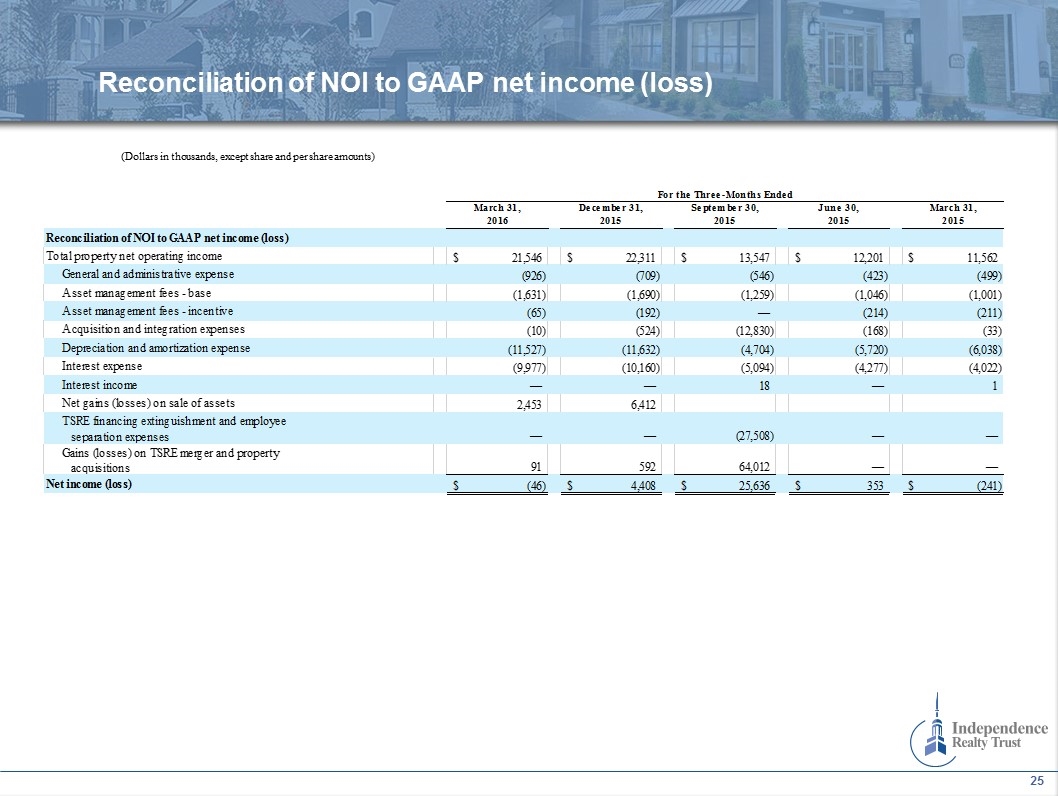
Reconciliation of NOI to GAAP net income (loss) (Dollars in thousands, except share and per share amounts) NET OPERATING INCOME (NOI) BRIDGE Dollars in thousands For the Three-Months Ended March 31, 2016 December 31, 2015 September 30, 2015 June 30, 2015 March 31, 2015 Reconciliation of NOI to GAAP net income (loss) Total property net operating income $21,546 $22,311 $13,547 $12,201 $11,562 General and administrative expense -,926 -,709 -,546 -,423 -,499 Asset management fees - base -1,631 -1,690 -1,259 -1,046 -1,001 Asset management fees - incentive -65 -,192 0 -,214 -,211 Acquisition and integration expenses -10 -,524 ,-12,830 -,168 -33 Depreciation and amortization expense ,-11,527 ,-11,632 -4,704 -5,720 -6,038 Interest expense -9,977 ,-10,160 -5,094 -4,277 -4,022 Interest income 0 0 18 0 1 Net gains (losses) on sale of assets 2,453 6,412 TSRE financing extinguishment and employee separation expenses 0 0 ,-27,508 0 0 Gains (losses) on TSRE merger and property acquisitions 91 592 64,012 0 0 Net income (loss) $-46 $4,408 $25,636 $353 $-,241
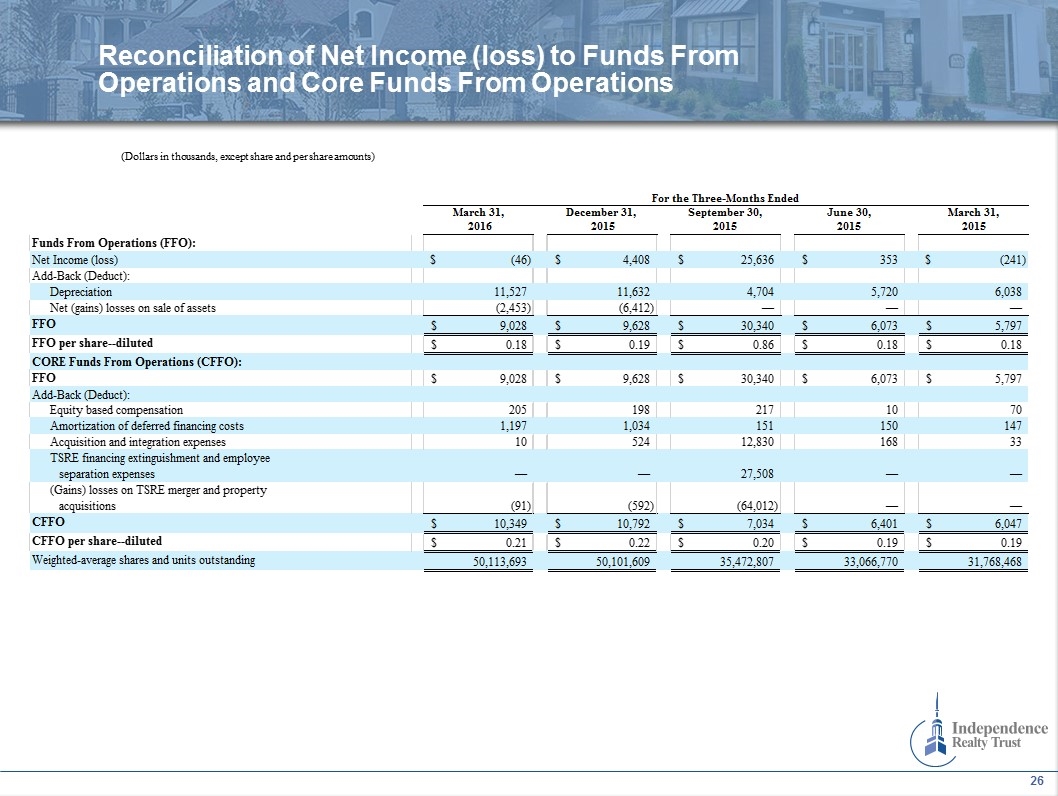
Reconciliation of Net Income (loss) to Funds From Operations and Core Funds From Operations (Dollars in thousands, except share and per share amounts) STATEMENTS OF OPERATIONS, FFO & CORE FFO TRAILING 5 QUARTERS Dollars in thousands, except per share data For the Three-Months Ended March 31, 2016 December 31, 2015 September 30, 2015 June 30, 2015 March 31, 2015 Funds From Operations (FFO): Net Income (loss) $-46 $4,408 $25,636 $353 $-,241 Add-Back (Deduct): Depreciation 11,527 11,632 4,704 5,720 6,038 Net (gains) losses on sale of assets -2,453 -6,412 0 0 0 FFO $9,028 $9,628 $30,340 $6,073 $5,797 FFO per share--diluted $0.18015036366361906 $0.19216947703216478 $0.85530305181856481 $0.18365870026011008 $0.18247653616787562 CORE Funds From Operations (CFFO): FFO $9,028 $9,628 $30,340 $6,073 $5,797 Add-Back (Deduct): Equity based compensation 205 198 217 10 70 Amortization of deferred financing costs 1,197 1,034 151 150 147 Acquisition and integration expenses 10 524 12,830 168 33 TSRE financing extinguishment and employee separation expenses 0 0 27,508 0 0 (Gains) losses on TSRE merger and property acquisitions -91 -,592 ,-64,012 0 0 CFFO $10,349 $10,792 $7,034 $6,401 $6,047 CFFO per share--diluted $0.21 $0.22 $0.2 $0.19 $0.19 Weighted-average shares and units outstanding 50,113,692.897435896 50,101,609 35,472,806.902173914 33,066,770 31,768,468
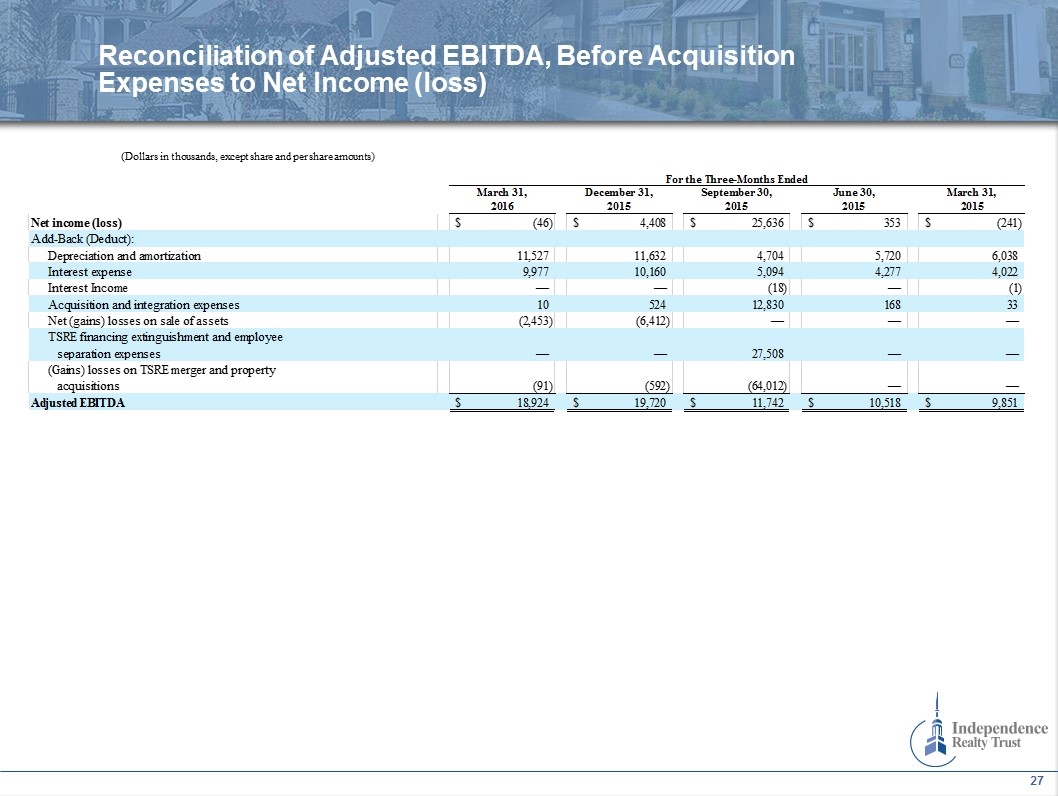
Reconciliation of Adjusted EBITDA, Before Acquisition Expenses to Net Income (loss) (Dollars in thousands, except share and per share amounts) ADJUSTED EBITDA RECONCILIATIONS Dollars in thousands For the Three-Months Ended March 31, 2016 December 31, 2015 September 30, 2015 June 30, 2015 March 31, 2015 Net income (loss) $-46 $4,408 $25,636 $353 $-,241 Add-Back (Deduct): Depreciation and amortization 11,527 11,632 4,704 5,720 6,038 Interest expense 9,977 10,160 5,094 4,277 4,022 Interest Income 0 0 -18 0 -1 Acquisition and integration expenses 10 524 12,830 168 33 Net (gains) losses on sale of assets -2,453 -6,412 0 0 0 TSRE financing extinguishment and employee separation expenses 0 0 27,508 0 0 (Gains) losses on TSRE merger and property acquisitions -91 -,592 ,-64,012 0 0 Adjusted EBITDA $18,924 $19,720 $11,742 $10,518 $9,851
Definitions Average Effective Monthly Rent per Unit Average effective rent per unit represents the average of gross rent amounts, divided by the average occupancy (in units) for the period presented. We believe average effective rent is a helpful measurement in evaluating average pricing. This metric, when presented, reflects the average effective rent per month. Average Occupancy Average occupancy represents the average of the daily physical occupancy for the period presented. Adjusted EBITDA EBITDA is defined as net income before gains or losses on asset sales, gains or losses on debt extinguishments, depreciation and amortization expenses, interest expense, income taxes, and amortization of deferred financing costs. Adjusted EBITDA is EBITDA before acquisition expenses and gains. EBITDA and Adjusted EBITDA are each non-GAAP measures. We consider EBITDA and Adjusted EBITDA to be an appropriate supplemental measure of our performance because it eliminates depreciation, income taxes, interest and acquisition expenses and gains relating to IRT’s acquisition of TSRE, which permits investors to view income from operations without non-cash items such as depreciation, amortization, the cost of debt or items specific to the TSRE acquisition. The table is a reconciliation of net income applicable to common stockholders to Adjusted EBITDA. IRT’s calculation of Adjusted EBITDA differs from the methodology used for calculating Adjusted EBITDA by certain other REITs and, accordingly, IRT’s Adjusted EBITDA may not be comparable to Adjusted EBITDA reported by other REITs. Funds From Operations (“FFO”) and Core Funds From Operations (“CFFO”) IRT believes that FFO and CFFO, each of which is a non-GAAP measure, are additional appropriate measures of the operating performance of a REIT and IRT in particular. IRT computes FFO in accordance with the standards established by the National Association of Real Estate Investment Trusts, or NAREIT, as net income or loss allocated to common stock (computed in accordance with GAAP), excluding real estate-related depreciation and amortization expense, gains or losses on sales of real estate and the cumulative effect of changes in accounting principles. CFFO is a computation made by analysts and investors to measure a real estate company’s operating performance by removing the effect of items that do not reflect ongoing property operations, including acquisition and integration expenses, expensed costs related to the issuance of shares of our common stock, gains or losses on real estate transactions and equity-based compensation expenses, from the determination of FFO. IRT incurs acquisition expenses in connection with acquisitions of real estate properties and expenses those costs when incurred in accordance with U.S. GAAP. As these expenses are one-time and reflective of investing activities rather than operating performance, IRT adds back these costs to FFO in determining CFFO. In connection with the TSRE transaction, IRT modified the calculation of CFFO to adjust for amortization of deferred financing costs and TSRE financing extinguishment and employee separation expenses because these are non-cash items or reflective of investing activities rather than operating performance similar to the other CFFO adjustments. The effect of these modifications on prior periods is reflected in the reconciliation of IRT’s reported net income (loss) allocable to common shares to its FFO and CFFO included herein. IRT’s calculation of CFFO differs from the methodology used for calculating CFFO by certain other REITs and, accordingly, IRT’s CFFO may not be comparable to CFFO reported by other REITs. IRT’s management utilizes FFO and CFFO as measures of IRT’s operating performance, and believes they are also useful to investors, because they facilitate an understanding of IRT’s operating performance after adjustment for certain non-cash items, such as depreciation and amortization expenses, equity based compensation, amortization of deferred financing fees, TSRE financing extinguishment and employee separation costs, gains (loss) on TSRE transaction and property acquisitions and acquisition expenses and pursuit costs that are required by GAAP to be expensed but may not necessarily be indicative of current operating performance and that may not accurately compare IRT’s operating performance between periods. Furthermore, although FFO, CFFO and other supplemental performance measures are defined in various ways throughout the REIT industry, IRT also believes that FFO and CFFO may provide IRT and our investors with an additional useful measure to compare IRT’s financial performance to certain other REITs. IRT also uses CFFO for purposes of determining the quarterly incentive fee, if any, payable to our advisor. Neither FFO nor CFFO is equivalent to net income or cash generated from operating activities determined in accordance with GAAP. Furthermore, FFO and CFFO do not represent amounts available for management’s discretionary use because of needed capital replacement or expansion, debt service obligations or other commitments or uncertainties. Neither FFO nor CFFO should be considered as an alternative to net income as an indicator of IRT’s operating performance or as an alternative to cash flow from operating activities as a measure of IRT’s liquidity. Net Operating Income IRT believes that Net Operating Income (“NOI”), a non-GAAP measure, is a useful measure of its operating performance. IRT defines NOI as total property revenues less total property operating expenses, excluding depreciation and amortization, asset management fees, acquisition expenses and general administrative expenses. Other REITs may use different methodologies for calculating NOI, and accordingly, our NOI may not be comparable to other REITs. We believe that this measure provides an operating perspective not immediately apparent from GAAP operating income or net income. We use NOI to evaluate our performance on a same store and non-same store basis because NOI measures the core operations of property performance by excluding corporate level expenses and other items not related to property operating performance and captures trends in rental housing and property operating expenses. However, NOI should only be used as an alternative measure of our financial performance. Same Store Properties and Same Store Portfolio IRT reviews its same store properties or portfolio at the beginning of each calendar year. Properties are added into the same store portfolio if they were owned at the beginning of the previous year. Properties that have been sold are excluded from the same store portfolio.


