Exhibit 99.2

TABLE OF CONTENTS
Company Information | | 3 |
| | |
Forward-Looking Statements | | 4 |
| | |
Earnings Release Text | | 5 |
| | |
Financial Highlights | | 9 |
| | |
Balance Sheets | | 10 |
| | |
Statements of Operations, FFO & CORE FFO | | |
Trailing 5 Quarters | | 11 |
Three and Nine Months Ended September 30, 2016 | | 12 |
| | |
Adjusted EBITDA Reconciliations | | |
Trailing 5 Quarters | | 13 |
Three and Nine Months Ended September 30, 2016 | | 13 |
| | |
Same-Store Portfolio Net Operating Income | | |
Trailing 5 Quarters | | 14 |
Three and Nine Months Ended September 30, 2016 | | 15 |
| | |
Net Operating Income Bridge | | 16 |
| | |
Debt and Capitalization Overview | | 17 |
| | |
Property Summary | | 18 |
| | |
NOI Exposure by Market | | 19 |
| | |
Definitions | | 20 |
2
Independence Realty Trust
September 30, 2016
Company Information:
Independence Realty Trust, Inc. (“IRT”) (NYSE MKT: IRT) is a real estate investment trust that seeks to own well-located apartment properties in geographic submarkets that it believes support strong occupancy and the potential for growth in rental rates. IRT seeks to provide stockholders with attractive risk-adjusted returns, with an emphasis on distributions and capital appreciation. While IRT is currently externally advised by a wholly-owned subsidiary of RAIT Financial Trust (“RAIT”) (NYSE: RAS), IRT expects to internalize its management by the end of 2016.
Corporate Headquarters | | Two Logan Square |
| | 100 N. 18th Street, 23rd Floor |
| | Philadelphia, Pa 19103 |
| | 215.207.2100 |
| |
Trading Symbol | | NYSE MKT: “IRT” |
| |
Investor Relations Contact | | Andres Viroslav |
| | Two Logan Square |
| | 100 N. 18th Street, 23rd Floor |
| | Philadelphia, Pa 19103 |
| | 215.207.2100 |
| | For the Three Months Ended | |
| | September 30, 2016 | | | June 30, 2016 | | | March 31, 2016 | | | December 31, 2015 | | | September 30, 2015 | |
Common Shares & Units: | | | | | | | | | | | | | | | | | | | | |
Share Price, period end | | $ | 9.00 | | | $ | 8.18 | | | $ | 7.12 | | | $ | 7.51 | | | $ | 7.21 | |
Share Price, high | | $ | 10.70 | | | $ | 8.21 | | | $ | 7.78 | | | $ | 8.13 | | | $ | 8.57 | |
Share Price, low | | $ | 8.05 | | | $ | 6.75 | | | $ | 5.97 | | | $ | 6.88 | | | $ | 6.95 | |
Dividends declared | | $ | 0.18 | | | $ | 0.18 | | | $ | 0.18 | | | $ | 0.18 | | | $ | 0.18 | |
Dividend yield, period end | | | 8.0 | % | | | 8.8 | % | | | 10.1 | % | | | 9.6 | % | | | 10.0 | % |
3
Forward-Looking Statements
This supplemental information may contain certain forward-looking statements within the meaning of Section 27A of the Securities Act of 1933, as amended, and Section 21E of the Securities Exchange Act of 1934, as amended. Such forward-looking statements can generally be identified by our use of forward-looking terminology such as "may," “trend”, "will," "expect," "intend," "anticipate," "estimate," "believe," "continue," “seek,” “outlook,” “project,” “guidance” or other similar words. Because such statements include risks, uncertainties and contingencies, actual results may differ materially from the expectations, intentions, beliefs, plans or predictions of the future expressed or implied by such forward-looking statements. These forward looking statements are based upon the current beliefs and expectations of IRT’s management and are inherently subject to significant business, economic and competitive uncertainties and contingencies, many of which are difficult to predict and generally not within IRT’s control. In addition, these forward-looking statements are subject to assumptions with respect to future business strategies and decisions that are subject to change. These risks, uncertainties and contingencies include, but are not limited to, whether and when we will be able to complete the Internalization; whether we can manage the Internalization effectively or realize its anticipated benefits; whether IRT can maintain its property operating expense growth; whether the TSRE portfolio of properties achieves projected NOI growth, revenue growth, improved operating margins and reduced operating expenses for property insurance; whether IRT will not make any property acquisitions in 2016; whether general and administrative expenses can be limited to projected levels; and whether the weighted average number of shares outstanding at December 31, 2016 will be at the assumed levels; and those disclosed in IRT’s filings with the Securities and Exchange Commission. IRT undertakes no obligation to update these forward-looking statements to reflect events or circumstances after the date hereof or to reflect the occurrence of unanticipated events, except as may be required by law.
4
Independence Realty Trust Announces Third Quarter 2016 Financial Results
PHILADELPHIA, PA — October 28, 2016 — Independence Realty Trust, Inc. (“IRT”) (NYSE MKT: IRT) today announced its third quarter 2016 financial results. All per share results are reported on a diluted basis.
Results for the Quarter
| • | Earnings per share (“EPS”) was $0.05 for the quarter ended September 30, 2016 as compared to $0.71 for the quarter ended September 30, 2015. |
| • | Core Funds from Operations (“CFFO”) per share increased 5.0% to $0.21 for the quarter ended September 30, 2016 from $0.20 for the quarter ended September 30, 2015. |
| • | Earnings before interest, taxes, depreciation and amortization and before acquisition expenses (“Adjusted EBITDA”), increased 56.5% to $18.4 million for the quarter ended September 30, 2016 from $11.7 million for the quarter ended September 30, 2015. |
Results for the Nine Months
| • | EPS was $0.66 for the nine months ended September 30, 2016 as compared to $0.74 for the nine months ended September 30, 2015. |
| • | CFFO per share increased 10.5% to $0.63 for the nine months ended September 30, 2016 from $0.57 for the nine months ended September 30, 2015. |
| • | Adjusted EBITDA increased 74.3% to $56.0 million for the nine months ended September 30, 2016 from $32.1 million for the nine months ended September 30, 2015. |
Management Internalization Transaction
On September 27, 2016, IRT entered an agreement (the “Internalization Agreement”) with RAIT Financial Trust (“RAIT”) to repurchase 7,269,719 shares of IRT common stock from RAIT subsidiaries, representing all of the shares of IRT common stock owned by RAIT, and for IRT to complete a management internalization and separation (the “Internalization”) from RAIT and certain of its affiliates.
On October 5, 2016, IRT paid approximately $62.2 million to RAIT to repurchase (the “IRT Stock Repurchase”) and retire RAIT’s shares of IRT common stock at a purchase price of $8.55 per share. This price was equal to the price to the public in the public offering described below less underwriting discounts or commissions.
The Internalization consists of two parts: (i) the acquisition of IRT’s external advisor, which is a subsidiary of RAIT, and (ii) the acquisition of certain assets and the assumption of certain liabilities relating to the multifamily property management business of RAIT, including property management contracts relating to apartment properties owned by IRT, RAIT and third parties. The purchase price IRT will pay RAIT for the Internalization is $43.0 million, subject to certain prorations at closing. The Internalization Agreement provides that the Internalization will occur, subject to its terms and conditions, no earlier than December 20, 2016 and IRT expects it to occur by year end.
Upon closing of the Internalization, each of Scott F. Schaeffer, IRT’s Chief Executive Officer, Farrell Ender, IRT’s President, and James J. Sebra, IRT’s Chief Financial Officer, are expected to enter into employment agreements with IRT. Messrs. Schaeffer and Ender are expected to become employees of IRT upon closing. Mr. Sebra is expected to remain the CFO of RAIT until the later to occur of March 31, 2017 or the filing of RAIT’s Form 10-K for the fiscal year ending December 31, 2016 with the U.S. Securities and Exchange Commission. In addition, more than 400 current employees of RAIT and the property manager are expected to become employees of IRT.
5
Common Stock Offering
On October 5, 2016, IRT closed an underwritten public offering of 25,000,000 shares of IRT common stock at a public offering price of $9.00 per share for total net proceeds of approximately $211.8 million. On October 21, 2016, IRT closed on the underwriters’ option to purchase 3,750,000 additional shares of IRT common stock at the public offering price, less underwriting discounts and commissions netting IRT an additional $32.1 million of proceeds. In the aggregate, IRT received approximately $245.8 million of net proceeds from this offering, before offering expenses and after underwriting discounts and commissions. IRT used the net proceeds from the offering plus available cash as follows: $40.0 million was used to repay IRT’s $40.0 million senior secured term loan facility; $43.0 million was reserved for the Internalization; $62.2 million was used for the IRT Stock Repurchase; and $107.3 million was used to repay outstanding borrowings under IRT’s $325.0 million senior secured credit facility.
Scott Schaeffer, IRT’s Chairman and CEO said, “During the quarter, IRT’s portfolio of apartment communities delivered strong same store operating results and remains well positioned for further NOI growth. At the end of the quarter we took steps to strengthen IRT’s market position by entering into an agreement with RAIT, which owns our external advisor, to internalize IRT’s management. This milestone transaction delivers continuity of management and other key benefits which will enhance shareholder value. The proceeds from the completion of our previously announced equity offering will be used to pay for the internalization, reduce debt and repurchase and retire our common stock from RAIT. We are excited about the market opportunity and look forward to completing the internalization later this year.”
Same-Store Property Operating Results
| | |
| Third Quarter 2016 Compared to Third Quarter 2015(1) | Nine Months Ended 9/30/16 Compared to Nine Months Ended 9/30/15(2) |
Rental income | 3.4% increase | 3.2% increase |
Total revenues | 4.1% increase | 3.5% increase |
Property level operating expenses | 2.1% increase | 2.2% increase |
Net operating income (“NOI”) | 6.0% increase | 4.6% increase |
Portfolio average occupancy | 93.2%, 0.2% decrease | 93.4%, no change |
Portfolio average rental rate | 3.5% increase to $867 | 3.1% increase to $857 |
NOI Margin | 0.9% increase to 51.7% | 0.6% increase to 52.7% |
| (1) | Same store portfolio for the three months ended September 30, 2016 and 2015 consists of 26 properties with 7,757 apartment units. |
| (2) | Same store portfolio for the nine months ended September 30, 2016 and 2015 consists of 26 properties with 7,757 apartment units. |
Capital Expenditures
For the three months ended September 30, 2016, our recurring capital expenditures for the total portfolio was $2.1 million, or $161 per unit. For the nine months ended September 30, 2016, our recurring capital expenditures for the total portfolio was $5.6 million, or $420 per unit.
2016 Net Income and CFFO Guidance
IRT is updating prior guidance to reflect impact from the previously announced internalization transaction, debt reduction, stock repurchase and common stock offering for full year EPS and CFFO per share, with EPS now projected to be in a range of ($0.12)-($0.10), a decrease from the prior guidance range of $0.54-$0.58, due largely from the ($0.78) per common share internalization expense expected in the fourth quarter. CFFO per share is now projected to be in the range of $0.77-$0.79 per common share, a decrease from the prior guidance range of $0.84-$0.88 per common share. A reconciliation of IRT's projected net income (loss) allocable to common shares to its projected CFFO per share, a non-GAAP financial measure, is included below. Also included below are the primary assumptions underlying this estimate. See Schedule II to this release for further information regarding how IRT calculates CFFO and Schedule V to this release for management’s definition and rationale for the usefulness of CFFO.
6
| | | | | | | | | | | | | | | | | | | | |
| | | | | | | | | | | | | | | | | | | | |
| | | | | | | | | 2016 Full Year Net Income and CFFO Guidance (1) |
| 2016 Net Income Guidance (1) | | Low | | High | |
| Net income (loss) available to common shares | | $(0.12) | - | $(0.10) | |
| 2016 CFFO Guidance (1) | | | | | |
| Net income (loss) available to common shares | | | | | $(0.12) | - | $(0.10) | |
| Adjustments: | | | | | | | | |
| Depreciation and amortization | 0.61 | - | 0.61 | |
| Gains on asset sales | (0.57) | - | (0.57) | |
| Share base compensation | 0.02 | - | 0.02 | |
| Internalization | | | | | | 0.78 | - | 0.78 | |
| Amortization of deferred financing fees and other items | | | | | | 0.05 | - | 0.05 | |
| CORE FFO per diluted share allocated to common shareholders | | | | | $0.77 | - | $0.79 | |
| (1) | This guidance, including the underlying assumptions, constitutes forward-looking information. Actual full 2016 CFFO could vary significantly from the projections presented. Our estimate is based on the following key operating assumptions: |
| (a) | For 2016, a same store pool of 26 properties totaling 7,757 units. |
| (b) | Same store NOI growth of 4.5% to 5.5%, driven by revenue growth of 4% to 5% and property operating expense growth of 2% to 3%. |
| (c) | The portfolio of properties acquired from TSRE, which is not included in the same store pool, experiences NOI growth of 6% to 7%, driven by revenue growth of 4% to 5% and an improved operating margin of 56%, up from 54% in 2015. The improved operating margin is driven through reduced operating expenses for property insurance. |
| (d) | No property acquisitions in 2016. |
| (e) | General and administrative expenses of approximately $1.8 million to $2.3 million. |
| (f) | 55.1 million weighted average shares outstanding for fiscal year 2016. |
Selected Financial Information
See Schedule I to this Release for selected financial information for IRT.
Non-GAAP Financial Measures and Definitions
IRT discloses the following non-GAAP financial measures in this release: funds from operations (“FFO”), CFFO, Adjusted EBITDA and NOI. A reconciliation of IRT’s reported net income (loss) to its FFO and CFFO is included as Schedule II to this release. A reconciliation of IRT’s same store NOI to its reported net income (loss) is included as Schedule III to this release. A reconciliation of IRT’s Adjusted EBITDA, to net income (loss) is included as Schedule IV to this release. See Schedule V to this release for management’s respective definitions and rationales for the usefulness of each of these non-GAAP financial measures and other definitions used in this release.
Distributions
On October 12, 2016, IRT’s Board of Directors declared monthly cash dividends for the fourth quarter of 2016 on IRT’s shares of common stock in the amount of $0.06 per share per month. The monthly dividends total $0.18 per share for the fourth quarter. The month for which each dividend was declared is set forth below, with the relevant amount per share, record date and payment date set forth opposite the month:
| | | | | | | | | | | | |
Month | | | | Amount | | | | Record Date | | | | Payment Date |
October 2016 | | | | $0.06 | | | | 10/31/2016 | | | | 11/15/2016 |
November 2016 | | | | $0.06 | | | | 11/30/2016 | | | | 12/15/2016 |
December 2016 | | | | $0.06 | | | | 12/30/2016 | | | | 01/17/2017 |
7
Conference Call
All interested parties can listen to the live conference call webcast at 9:30 AM ET on Friday, October 28, 2016 from the investor relations section of the IRT website at www.irtreit.com or by dialing 1.844.775.2542, access code 96007206. For those who are not available to listen to the live call, the replay will be available shortly following the live call on IRT’s website and telephonically until Friday, November 4, 2016, by dialing 855.859.2056, access code 96007206.
Supplemental Information
IRT produces supplemental information that includes details regarding the performance of the portfolio, financial information, non-GAAP financial measures, same-store information and other useful information for investors. The supplemental information is available via the Company's website, www.irtreit.com, through the "Investor Relations" section.
About Independence Realty Trust, Inc.
Independence Realty Trust, Inc. (‘IRT”) (NYSE MKT: IRT) is a real estate investment trust that seeks to own well-located apartment properties in geographic submarkets that it believes support strong occupancy and the potential for growth in rental rates. IRT seeks to provide stockholders with attractive risk-adjusted returns, with an emphasis on distributions and capital appreciation. While IRT is currently externally advised by a wholly-owned subsidiary of RAIT Financial Trust (“RAIT”) (NYSE: RAS), IRT expects to internalize its management by the end of 2016.
Forward-Looking Statements
This press release may contain certain forward-looking statements within the meaning of Section 27A of the Securities Act of 1933, as amended, and Section 21E of the Securities Exchange Act of 1934, as amended. Such forward-looking statements can generally be identified by our use of forward-looking terminology such as "may," “trend”, "will," "expect," "intend," "anticipate," "estimate," "believe," "continue," “seek,” “outlook,” “in the process,” “assumption,” “project,” “guidance” or other similar words. Because such statements include risks, uncertainties and contingencies, actual results may differ materially from the expectations, intentions, beliefs, plans or predictions of the future expressed or implied by such forward-looking statements. These forward looking statements are based upon the current beliefs and expectations of IRT’s management and are inherently subject to significant business, economic and competitive uncertainties and contingencies, many of which are difficult to predict and generally not within IRT’s control. In addition, these forward-looking statements are subject to assumptions with respect to future business strategies and decisions that are subject to change. These risks, uncertainties and contingencies include, but are not limited to whether and when we will be able to complete the Internalization; whether we can manage the Internalization effectively or realize its anticipated benefits; whether IRT can maintain its assumed same store pool in 2016; whether it can achieve projected same store NOI growth and revenue growth and limit projected property operating expense growth; whether the TSRE portfolio of properties achieves projected NOI growth, revenue growth, improved operating margins and reduced operating expenses for property insurance; whether IRT will not make any property acquisitions in 2016; whether general and administrative expenses can be limited to projected levels ; and whether the weighted average number of shares outstanding at December 31, 2016 will be at the assumed levels; and those disclosed in IRT’s filings with the Securities and Exchange Commission. IRT undertakes no obligation to update these forward-looking statements to reflect events or circumstances after the date hereof or to reflect the occurrence of unanticipated events, except as may be required by law.
Independence Realty Trust, Inc. Contact
Andres Viroslav
215.207.2100
aviroslav@irtreit.com
8
HIGHLIGHTS
| | For the Three Months Ended | | |
| | September 30, 2016 | | | June 30, 2016 | | | March 31, 2016 | | | December 31, 2015 | | | September 30, 2015 | | |
Selected Financial Information: | | | | | | | | | | | | | | | | | | | | | |
Operating Statistics: | | | | | | | | | | | | | | | | | | | | | |
Net income available to common shares | | $ | 2,267 | | | $ | 28,987 | | | $ | (75 | ) | | $ | 4,123 | | | $ | 24,015 | | |
Earnings (loss) per share -- diluted | | $ | 0.05 | | | $ | 0.61 | | | $ | - | | | $ | 0.09 | | | $ | 0.71 | | |
Total revenue | | $ | 38,364 | | | $ | 38,327 | | | $ | 38,666 | | | $ | 39,709 | | | $ | 25,492 | | |
Total property operating expenses | | $ | 17,326 | | | $ | 16,852 | | | $ | 17,120 | | | $ | 17,398 | | | $ | 11,945 | | |
Net operating income | | $ | 21,038 | | | $ | 21,475 | | | $ | 21,546 | | | $ | 22,311 | | | $ | 13,547 | | |
NOI margin | | | 54.8 | % | | | 56.0 | % | | | 55.7 | % | | | 56.2 | % | | | 53.1 | % | |
Adjusted EBITDA | | $ | 18,373 | | | $ | 18,688 | | | $ | 18,924 | | | $ | 19,720 | | | $ | 11,742 | | |
FFO per share -- diluted | | $ | 0.20 | | | $ | 0.18 | | | $ | 0.18 | | | $ | 0.19 | | | $ | 0.86 | | |
CORE FFO per share -- diluted | | $ | 0.21 | | | $ | 0.22 | | | $ | 0.21 | | | $ | 0.22 | | | $ | 0.20 | | |
Dividends per share | | $ | 0.18 | | | $ | 0.18 | | | $ | 0.18 | | | $ | 0.18 | | | $ | 0.18 | | |
CORE FFO payout ratio | | | 85.7 | % | | | 81.8 | % | | | 85.7 | % | | | 81.8 | % | | | 90.0 | % | |
Portfolio Data: | | | | | | | | | | | | | | | | | | | | | |
Total gross assets | | $ | 1,374,353 | | | $ | 1,368,217 | | | $ | 1,404,359 | | | $ | 1,434,377 | | | $ | 1,445,601 | | |
Total number of properties | | | 46 | | | | 46 | | | | 48 | | | | 49 | | | | 50 | | |
Total units | | | 12,982 | | | | 12,982 | | | | 13,502 | | | | 13,724 | | | | 14,044 | | |
Total portfolio average occupancy | | | 94.1 | % | | | 94.4 | % | | | 93.5 | % | | | 93.6 | % | | | 94.0 | % | |
Total portfolio average effective monthly rent, per unit | | $ | 977 | | | $ | 961 | | | $ | 952 | | | $ | 947 | | | $ | 949 | | |
Same store portfolio average occupancy (a) | | | 93.2 | % | | | 93.9 | % | | | 92.9 | % | | | 92.4 | % | | | 93.4 | % | |
Same store portfolio average effective monthly rent, per unit (a) | | $ | 867 | | | $ | 856 | | | $ | 848 | | | $ | 844 | | | $ | 838 | | |
Capitalization (c): | | | | | | | | | | | | | | | | | | | | | |
Total debt | | $ | 880,581 | | | $ | 880,288 | | | $ | 940,336 | | | $ | 966,611 | | | $ | 983,207 | | |
Common share price, period end | | $ | 9.00 | | | $ | 8.18 | | | $ | 7.12 | | | $ | 7.51 | | | $ | 7.21 | | |
Market equity capitalization | | $ | 453,823 | | | $ | 412,493 | | | $ | 358,913 | | | $ | 377,194 | | | $ | 362,127 | | |
Total market capitalization | | $ | 1,334,404 | | | $ | 1,292,781 | | | $ | 1,299,249 | | | $ | 1,343,805 | | | $ | 1,345,334 | | |
Total debt/total gross assets | | | 64.1 | % | | | 64.3 | % | | | 67.0 | % | | | 67.4 | % | | | 68.0 | % | |
Net debt to adjusted EBITDA | | | 11.6 | x | | | 11.4 | x | | | 12.1 | x | | | 11.8 | x | | | 12.2 | x | (b) |
Interest coverage | | | 2.1 | x | | | 2.1 | x | | | 1.9 | x | | | 1.9 | x | | | 2.1 | x | (b) |
Common shares and OP Units: | | | | | | | | | | | | | | | | | | | | | |
Shares outstanding | | | 47,509,731 | | | | 47,476,250 | | | | 47,458,250 | | | | 47,070,678 | | | | 47,070,678 | | |
OP units outstanding | | | 2,915,008 | | | | 2,950,816 | | | | 2,950,816 | | | | 3,154,936 | | | | 3,154,936 | | |
Common shares and OP units outstanding | | | 50,424,739 | | | | 50,427,066 | | | | 50,409,066 | | | | 50,225,614 | | | | 50,225,614 | | |
Weighted average common shares and units | | | 50,229,637 | | | | 50,134,620 | | | | 50,113,693 | | | | 50,101,609 | | | | 35,472,807 | | |
(a) | Same store portfolio includes 26 properties which represents 7,757 units. |
(b) | Annualized assuming the TSRE merger which closed September 17, 2015 occurred at the beginning of the period. |
(c) On September 29, 2016, IRT priced a $25 million common share offering at $9.00 per share. The proceeds of this offering will be used to repay indebtedness, repurchase shares and fund the internalization payment later in 2016. As a result of this offering, IRT’s leverage and capitalization have improved.
9
BALANCE SHEETS
Dollars in thousands, except per share data
| | As of | |
| | September 30, 2016 | | | June 30, 2016 | | | March 31, 2016 | | | December 31, 2015 | | | September 30, 2015 | |
Assets | | | | | | | | | | | | | | | | | | | | |
Investments in real estate at cost | | $ | 1,316,725 | | | $ | 1,314,115 | | | $ | 1,357,338 | | | $ | 1,372,015 | | | $ | 1,400,892 | |
Less: accumulated depreciation | | | (52,824 | ) | | | (45,059 | ) | | | (44,422 | ) | | | (39,638 | ) | | | (35,304 | ) |
Investments in real estate, net | | | 1,263,901 | | | | 1,269,056 | | | | 1,312,916 | | | | 1,332,377 | | | | 1,365,588 | |
Cash and cash equivalents | | | 29,247 | | | | 28,051 | | | | 21,924 | | | | 38,301 | | | | 16,939 | |
Restricted cash | | | 8,028 | | | | 6,779 | | | | 7,015 | | | | 5,413 | | | | 7,330 | |
Accounts receivable and other assets | | | 5,066 | | | | 3,985 | | | | 2,795 | | | | 3,362 | | | | 5,153 | |
Intangible assets, net | | | - | | | | - | | | | - | | | | 3,735 | | | | 7,544 | |
Total assets | | $ | 1,306,242 | | | $ | 1,307,871 | | | $ | 1,344,650 | | | $ | 1,383,188 | | | $ | 1,402,554 | |
Liabilities and Equity | | | | | | | | | | | | | | | | | | | | |
Total indebtedness | | $ | 880,581 | | | $ | 880,288 | | | $ | 940,336 | | | $ | 966,611 | | | $ | 983,207 | |
Accounts payable and accrued expenses | | | 22,231 | | | | 17,807 | | | | 16,089 | | | | 19,304 | | | | 18,724 | |
Accrued interest payable | | | 830 | | | | 701 | | | | 1,175 | | | | 1,239 | | | | 558 | |
Dividends payable | | | 3,009 | | | | 3,009 | | | | 3,007 | | | | 3,006 | | | | 2,427 | |
Derivative liabilities | | | 696 | | | | 1,163 | | | | — | | | | — | | | | — | |
Other liabilities | | | 2,857 | | | | 2,955 | | | | 3,071 | | | | 2,998 | | | | 3,183 | |
Total liabilities | | | 910,204 | | | | 905,923 | | | | 963,678 | | | | 993,158 | | | | 1,008,099 | |
Equity | | | | | | | | | | | | | | | | | | | | |
Shareholders' Equity: | | | | | | | | | | | | | | | | | | | | |
Preferred shares, $0.01 par value per share | | | — | | | | — | | | | — | | | | — | | | | — | |
Common shares, $0.01 par value per share | | | 475 | | | | 475 | | | | 475 | | | | 471 | | | | 471 | |
Additional paid in capital | | | 381,106 | | | | 380,532 | | | | 380,152 | | | | 378,187 | | | | 377,989 | |
Accumulated other comprehensive income (loss) | | | (727 | ) | | | (1,195 | ) | | | (26 | ) | | | (8 | ) | | | 5 | |
Retained earnings (deficit) | | | (8,833 | ) | | | (2,601 | ) | | | (23,094 | ) | | | (14,500 | ) | | | (10,174 | ) |
Total shareholders' equity | | | 372,021 | | | | 377,211 | | | | 357,507 | | | | 364,150 | | | | 368,291 | |
Noncontrolling Interests | | | 24,017 | | | | 24,737 | | | | 23,465 | | | | 25,880 | | | | 26,164 | |
Total equity | | | 396,038 | | | | 401,948 | | | | 380,972 | | | | 390,030 | | | | 394,455 | |
Total liabilities and equity | | $ | 1,306,242 | | | $ | 1,307,871 | | | $ | 1,344,650 | | | $ | 1,383,188 | | | $ | 1,402,554 | |
10
STATEMENTS OF OPERATIONS, FFO & CORE FFO
TRAILING 5 QUARTERS
Dollars in thousands, except per share data
| | For the Three Months Ended | |
| | September 30, 2016 | | | June 30, 2016 | | | March 31, 2016 | | | December 31, 2015 | | | September 30, 2015 | |
Revenue: | | | | | | | | | | | | | | | | | | | | |
Rental income | | $ | 34,333 | | | $ | 34,185 | | | $ | 34,753 | | | $ | 35,747 | | | $ | 22,758 | |
Reimbursement and other income | | | 4,031 | | | | 4,142 | | | | 3,913 | | | | 3,962 | | | | 2,734 | |
Total revenue | | | 38,364 | | | | 38,327 | | | | 38,666 | | | | 39,709 | | | | 25,492 | |
Expenses: | | | | | | | | | | | | | | | | | | | | |
Real estate operating expenses | | | 17,326 | | | | 16,852 | | | | 17,120 | | | | 17,398 | | | | 11,945 | |
General and administrative expenses | | | 485 | | | | 544 | | | | 721 | | | | 511 | | | | 329 | |
Stock compensation expense | | | 247 | | | | 380 | | | | 205 | | | | 198 | | | | 217 | |
Asset management fees - Base | | | 1,727 | | | | 1,784 | | | | 1,631 | | | | 1,690 | | | | 1,259 | |
Asset management fees - Incentive | | | 206 | | | | 79 | | | | 65 | | | | 192 | | | | - | |
Acquisition and integration expenses | | | 19 | | | | 8 | | | | 10 | | | | 524 | | | | 12,830 | |
Depreciation and amortization expense | | | 7,765 | | | | 7,635 | | | | 11,527 | | | | 11,632 | | | | 4,704 | |
Total expenses | | | 27,775 | | | | 27,282 | | | | 31,279 | | | | 32,145 | | | | 31,284 | |
Operating Income (loss) | | | 10,589 | | | | 11,045 | | | | 7,387 | | | | 7,564 | | | | (5,792 | ) |
Interest expense | | | (8,820 | ) | | | (9,018 | ) | | | (9,977 | ) | | | (10,160 | ) | | | (5,094 | ) |
Other income (expense) | | | (2 | ) | | | — | | | | — | | | | — | | | | 18 | |
Net gains (losses) on sale of assets | | | (1 | ) | | | 29,321 | | | | 2,453 | | | | 6,412 | | | | — | |
TSRE financing extinguishment and employee separation expenses | | | — | | | | — | | | | — | | | | — | | | | (27,508 | ) |
Gains (losses) on extinguishment of debt | | | — | | | | (558 | ) | | | — | | | | — | | | | — | |
Gains (losses) on TSRE merger and property acquisitions | | | 641 | | | | — | | | | 91 | | | | 592 | | | | 64,012 | |
Net income (loss) | | | 2,407 | | | | 30,790 | | | | (46 | ) | | | 4,408 | | | | 25,636 | |
(Income) loss allocated to noncontrolling interests | | | (140 | ) | | | (1,803 | ) | | | (29 | ) | | | (285 | ) | | | (1,621 | ) |
Net income (loss) available to common shares | | $ | 2,267 | | | $ | 28,987 | | | $ | (75 | ) | | $ | 4,123 | | | $ | 24,015 | |
EPS - basic | | $ | 0.05 | | | $ | 0.61 | | | $ | - | | | $ | 0.09 | | | $ | 0.71 | |
Weighted-average shares outstanding - Basic | | | 47,215,918 | | | | 47,183,804 | | | | 47,093,343 | | | | 46,946,678 | | | | 33,962,015 | |
EPS - diluted | | $ | 0.05 | | | $ | 0.61 | | | $ | - | | | $ | 0.09 | | | $ | 0.71 | |
Weighted-average shares outstanding - Diluted | | | 47,314,629 | | | | 47,229,736 | | | | 47,093,343 | | | | 46,966,605 | | | | 33,962,015 | |
Funds From Operations (FFO): | | | | | | | | | | | | | | | | | | | | |
Net Income (loss) | | $ | 2,407 | | | $ | 30,790 | | | $ | (46 | ) | | $ | 4,408 | | | $ | 25,636 | |
Add-Back (Deduct): | | | | | | | | | | | | | | | | | | | | |
Depreciation | | | 7,765 | | | | 7,635 | | | | 11,527 | | | | 11,632 | | | | 4,704 | |
Net (gains) losses on sale of assets | | | 1 | | | | (29,321 | ) | | | (2,453 | ) | | | (6,412 | ) | | | — | |
FFO | | $ | 10,173 | | | $ | 9,104 | | | $ | 9,028 | | | $ | 9,628 | | | $ | 30,340 | |
FFO per share--diluted | | $ | 0.20 | | | $ | 0.18 | | | $ | 0.18 | | | $ | 0.19 | | | $ | 0.86 | |
CORE Funds From Operations (CFFO): | | | | | | | | | | | | | | | | | | | | |
FFO | | $ | 10,173 | | | $ | 9,104 | | | $ | 9,028 | | | $ | 9,628 | | | $ | 30,340 | |
Add-Back (Deduct): | | | | | | | | | | | | | | | | | | | | |
Stock compensation expense | | | 247 | | | | 380 | | | | 205 | | | | 198 | | | | 217 | |
Amortization of deferred financing costs | | | 597 | | | | 749 | | | | 1,197 | | | | 1,034 | | | | 151 | |
Acquisition and integration expenses | | | 19 | | | | 8 | | | | 10 | | | | 524 | | | | 12,830 | |
TSRE financing extinguishment and employee separation expenses | | | — | | | | — | | | | — | | | | — | | | | 27,508 | |
(Gains) losses on extinguishment of debt | | | — | | | | 558 | | | | — | | | | — | | | | — | |
(Gains) losses on TSRE merger and property acquisitions | | | (641 | ) | | | - | | | | (91 | ) | | | (592 | ) | | | (64,012 | ) |
CFFO | | $ | 10,395 | | | $ | 10,799 | | | $ | 10,349 | | | $ | 10,792 | | | $ | 7,034 | |
CFFO per share--diluted | | $ | 0.21 | | | $ | 0.22 | | | $ | 0.21 | | | $ | 0.22 | | | $ | 0.20 | |
Weighted-average shares and units outstanding | | | 50,229,637 | | | | 50,134,620 | | | | 50,113,693 | | | | 50,101,609 | | | | 35,472,807 | |
11
STATEMENTS OF OPERATIONS, FFO & CORE FFO
THREE AND NINE MONTHS ENDED SEPTEMBER 30, 2016
Dollars in thousands, except per share data
| | Three Months Ended September 30, | | | Nine Months Ended September 30, | |
| | 2016 | | | 2015 | | | 2016 | | | 2015 | |
Revenue: | | | | | | | | | | | | | | | | |
Rental income | | $ | 34,333 | | | $ | 22,758 | | | $ | 103,271 | | | | 62,469 | |
Reimbursement and other income | | | 4,031 | | | | 2,734 | | | | 12,086 | | | | 7,398 | |
Total revenue | | | 38,364 | | | | 25,492 | | | | 115,357 | | | | 69,867 | |
Expenses: | | | | | | | | | | | | | | | | |
Real estate operating expenses | | | 17,326 | | | | 11,945 | | | | 51,298 | | | | 32,557 | |
General and administrative expenses | | | 485 | | | | 329 | | | | 1,750 | | | | 1,171 | |
Stock compensation expense | | | 247 | | | | 217 | | | | 832 | | | | 297 | |
Asset management fees - Base | | | 1,727 | | | | 1,259 | | | | 5,142 | | | | 3,306 | |
Asset management fees - Incentive | | | 206 | | | | — | | | | 350 | | | | 425 | |
Acquisition and integration expenses | | | 19 | | | | 12,830 | | | | 37 | | | | 13,031 | |
Depreciation and amortization expense | | | 7,765 | | | | 4,704 | | | | 26,927 | | | | 16,462 | |
Total expenses | | | 27,775 | | | | 31,284 | | | | 86,336 | | | | 67,249 | |
Operating Income (loss) | | | 10,589 | | | | (5,792 | ) | | | 29,021 | | | | 2,618 | |
Interest expense | | | (8,820 | ) | | | (5,094 | ) | | | (27,815 | ) | | | (13,393 | ) |
Other income (expense) | | | (2 | ) | | | 18 | | | | (2 | ) | | | 19 | |
Net gains (losses) on sale of assets | | | (1 | ) | | | — | | | | 31,773 | | | | — | |
Gains (losses) on extinguishment of debt | | | - | | | | — | | | | (558 | ) | | | — | |
TSRE financing extinguishment and employee separation expenses | | | | | | | (27,508 | ) | | | — | | | | (27,508 | ) |
Gains (losses) on TSRE merger and property acquisitions | | | 641 | | | | 64,012 | | | | 732 | | | | 64,012 | |
Net income (loss) | | | 2,407 | | | | 25,636 | | | | 33,151 | | | | 25,748 | |
(Income) loss allocated to noncontrolling interests | | | (140 | ) | | | (1,621 | ) | | | (1,972 | ) | | | (1,629 | ) |
Net income (loss) available to common shares | | $ | 2,267 | | | $ | 24,015 | | | $ | 31,179 | | | $ | 24,119 | |
EPS - basic | | $ | 0.05 | | | $ | 0.71 | | | $ | 0.66 | | | $ | 0.74 | |
Weighted-average shares outstanding - Basic | | | 47,215,918 | | | | 33,962,015 | | | | 47,164,543 | | | | 32,516,470 | |
EPS - diluted | | $ | 0.05 | | | $ | 0.71 | | | $ | 0.66 | | | $ | 0.74 | |
Weighted-average shares outstanding - Diluted | | | 47,314,629 | | | | 33,962,015 | | | | 47,190,139 | | | | 32,520,684 | |
| | | | | | | | | | | | | | | | |
Funds From Operations (FFO): | | | | | | | | | | | | | | | | |
Net Income (loss) | | $ | 2,407 | | | $ | 25,636 | | | $ | 33,151 | | | $ | 25,748 | |
Adjustments: | | | | | | | | | | | | | | | | |
Real estate depreciation and amortization | | | 7,765 | | | | 4,704 | | | | 26,927 | | | | 16,462 | |
Net (gains) losses on sale of assets | | | 1 | | | | — | | | | (31,773 | ) | | | — | |
Funds From Operations | | $ | 10,173 | | | $ | 30,340 | | | $ | 28,305 | | | $ | 42,210 | |
FFO per share--diluted | | $ | 0.20 | | | $ | 0.86 | | | $ | 0.56 | | | $ | 1.25 | |
Core Funds From Operations (CFFO): | | | | | | | | | | | | | | | | |
Funds From Operations | | $ | 10,173 | | | $ | 30,340 | | | $ | 28,305 | | | $ | 42,210 | |
Adjustments: | | | | | | | | | | | | | | | | |
Stock compensation expense | | | 247 | | | | 217 | | | | 832 | | | | 297 | |
Amortization of deferred financing costs | | | 597 | | | | 151 | | | | 2,543 | | | | 448 | |
Acquisition and integration expenses | | | 19 | | | | 12,830 | | | | 37 | | | | 13,031 | |
(Gains) losses on extinguishment of debt | | | - | | | | — | | | | 558 | | | | — | |
TSRE financing extinguishment and employee separation expenses | | | | | | | 27,508 | | | | | | | | 27,508 | |
(Gains) losses on TSRE merger and property acquisitions | | | (641 | ) | | | (64,012 | ) | | | (732 | ) | | | (64,012 | ) |
Core Funds From Operations | | $ | 10,395 | | | $ | 7,034 | | | $ | 31,543 | | | $ | 19,482 | |
CFFO per share--diluted | | $ | 0.21 | | | $ | 0.20 | | | $ | 0.63 | | | $ | 0.57 | |
Weighted-average shares and units outstanding | | | 50,229,637 | | | | 35,472,807 | | | | 50,105,147 | | | | 33,874,170 | |
12
ADJUSTED EBITDA RECONCILIATION AND COVERAGE RATIO
Dollars in thousands, except per share data
| | For the Three Months Ended | | | | Nine Months Ended September 30, | | |
ADJUSTED EBITDA: | | September 30, 2016 | | | June 30, 2016 | | | March 31, 2016 | | | December 31, 2015 | | | September 30, 2015 | | | | 2016 | | | 2015 | | |
Net income (loss) | | $ | 2,407 | | | $ | 30,790 | | | $ | (46 | ) | | $ | 4,408 | | | $ | 25,636 | | | | $ | 33,151 | | | $ | 25,748 | | |
Add-Back (Deduct): | | | | | | | | | | | | | | | | | | | | | | | | | | | | | | |
Depreciation and amortization | | | 7,765 | | | | 7,635 | | | | 11,527 | | | | 11,632 | | | | 4,704 | | | | | 26,927 | | | | 16,462 | | |
Interest expense | | | 8,820 | | | | 9,018 | | | | 9,977 | | | | 10,160 | | | | 5,094 | | | | | 27,815 | | | | 13,393 | | |
Other (income) expense | | | 2 | | | | — | | | | — | | | | — | | | | (18 | ) | | | | 2 | | | | (19 | ) | |
Acquisition and integration expenses | | | 19 | | | | 8 | | | | 10 | | | | 524 | | | | 12,830 | | | | | 37 | | | | 13,031 | | |
Net (gains) losses on sale of assets | | | 1 | | | | (29,321 | ) | | | (2,453 | ) | | | (6,412 | ) | | | — | | | | | (31,773 | ) | | | — | | |
TSRE financing extinguishment and employee separation expenses | | | — | | | | — | | | | — | | | | — | | | | 27,508 | | | | | — | | | | 27,508 | | |
(Gains) losses on extinguishment of debt | | | — | | | | 558 | | | | — | | | | — | | | | — | | | | | 558 | | | | — | | |
(Gains) losses on TSRE merger and property acquisitions | | | (641 | ) | | | — | | | | (91 | ) | | | (592 | ) | | | (64,012 | ) | | | | (732 | ) | | | (64,012 | ) | |
Adjusted EBITDA | | $ | 18,373 | | | $ | 18,688 | | | $ | 18,924 | | | $ | 19,720 | | | $ | 11,742 | | | | $ | 55,985 | | | $ | 32,111 | | |
| | | | | | | | | | | | | | | | | | | | | | | | | | | | | | |
INTEREST COST: | | | | | | | | | | | | | | | | | | | | | | | | | | | | | | |
Interest expense | | $ | 8,820 | | | $ | 9,018 | | | $ | 9,977 | | | $ | 10,160 | | | $ | 5,094 | | | | $ | 27,815 | | | $ | 13,393 | | |
| | | | | | | | | | | | | | | | | | | | | | | | | | | | | | |
INTEREST COVERAGE: | | | 2.1 | x | | | 2.1 | x | | | 1.9 | x | | | 1.9 | x | | | 2.1 | x | (a) | | | 2.0 | x | | | 2.1 | x | (a) |
| (a) | Annualized assuming the TSRE merger occurred at the beginning of the period. |
13
SAME STORE PORTFOLIO NET OPERATING INCOME
TRAILING 5 QUARTERS
Dollars in thousands, except per share data
| | For the Three Months Ended (a) | |
| | September 30, 2016 | | | June 30, 2016 | | | March 31, 2016 | | | December 31, 2015 | | | September 30, 2015 | |
Revenue: | | | | | | | | | | | | | | | | | | | | |
Rental income | | $ | 17,937 | | | $ | 17,811 | | | $ | 17,424 | | | $ | 17,329 | | | $ | 17,351 | |
Reimbursement and other income | | | 2,261 | | | | 2,136 | | | | 2,045 | | | | 2,012 | | | | 2,058 | |
Total revenue | | | 20,198 | | | | 19,947 | | | | 19,469 | | | | 19,341 | | | | 19,409 | |
Operating Expenses: | | | | | | | | | | | | | | | | | | | | |
Real estate taxes | | | 2,194 | | | | 2,155 | | | | 2,240 | | | | 2,368 | | | | 2,229 | |
Property insurance | | | 576 | | | | 590 | | | | 560 | | | | 563 | | | | 540 | |
Personnel expenses | | | 2,189 | | | | 2,053 | | | | 2,081 | | | | 2,144 | | | | 2,199 | |
Utilities | | | 1,543 | | | | 1,400 | | | | 1,552 | | | | 1,365 | | | | 1,527 | |
Repairs and maintenance | | | 994 | | | | 914 | | | | 720 | | | | 794 | | | | 946 | |
Management fees | | | 677 | | | | 667 | | | | 664 | | | | 657 | | | | 656 | |
Contract services | | | 655 | | | | 613 | | | | 600 | | | | 593 | | | | 589 | |
Advertising expenses | | | 249 | | | | 250 | | | | 256 | | | | 252 | | | | 269 | |
Other expenses | | | 671 | | | | 572 | | | | 590 | | | | 576 | | | | 596 | |
Total operating expenses | | | 9,748 | | | | 9,214 | | | | 9,263 | | | | 9,312 | | | | 9,551 | |
Net operating income | | $ | 10,450 | | | $ | 10,733 | | | $ | 10,206 | | | $ | 10,029 | | | $ | 9,858 | |
NOI Margin | | | 51.7 | % | | | 53.8 | % | | | 52.4 | % | | | 51.9 | % | | | 50.8 | % |
Average Occupancy | | | 93.2 | % | | | 93.9 | % | | | 92.9 | % | | | 92.4 | % | | | 93.4 | % |
Average effective monthly rent, per unit | | $ | 867 | | | $ | 856 | | | $ | 848 | | | $ | 844 | | | $ | 838 | |
Reconciliation of Same-Store Net Operating Income to Net Income (loss) | | | | | | | | | | | | | | | | | | | | |
Same-store net operating income (a) | | $ | 10,450 | | | $ | 10,733 | | | $ | 10,206 | | | $ | 10,029 | | | $ | 9,858 | |
Non same-store net operating income | | | 10,588 | | | | 10,742 | | | | 11,340 | | | | 12,282 | | | | 3,689 | |
Asset management fees | | | (1,933 | ) | | | (1,863 | ) | | | (1,696 | ) | | | (1,882 | ) | | | (1,259 | ) |
General and administrative expenses | | | (485 | ) | | | (544 | ) | | | (721 | ) | | | (511 | ) | | | (329 | ) |
Stock compensation expense | | | (247 | ) | | | (380 | ) | | | (205 | ) | | | (198 | ) | | | (217 | ) |
Acquisition and integration expenses | | | (19 | ) | | | (8 | ) | | | (10 | ) | | | (524 | ) | | | (12,830 | ) |
Depreciation and amortization | | | (7,765 | ) | | | (7,635 | ) | | | (11,527 | ) | | | (11,632 | ) | | | (4,704 | ) |
Interest expense | | | (8,820 | ) | | | (9,018 | ) | | | (9,977 | ) | | | (10,160 | ) | | | (5,094 | ) |
Other income (expense) | | | (2 | ) | | | — | | | | — | | | | — | | | | 18 | |
Net gains (losses) on sale of assets | | | (1 | ) | | | 29,321 | | | | 2,453 | | | | 6,412 | | | | — | |
TSRE financing extinguishment and employee separation expenses | | | — | | | | — | | | | — | | | | — | | | | (27,508 | ) |
Gains (losses) on extinguishment of debt | | | — | | | | (558 | ) | | | — | | | | — | | | | — | |
Gains (losses) on TSRE merger and property acquisitions | | | 641 | | | | — | | | | 91 | | | | 592 | | | | 64,012 | |
Net income (loss) | �� | $ | 2,407 | | | $ | 30,790 | | | $ | (46 | ) | | $ | 4,408 | | | $ | 25,636 | |
(a) | Same store portfolio includes 26 properties which represents 7,757 units. |
14
SAME STORE PORTFOLIO NET OPERATING INCOME
THREE AND NINE MONTHS ENDED SEPTEMBER 30, 2016
Dollars in thousands, except per share data
| | Three Months Ended September 30 (a) | | | Nine Months Ended September 30 (a) | |
| | 2016 | | | 2015 | | | % change | | | 2016 | | | 2015 | | | % change | |
Revenue: | | | | | | | | | | | | | | | | | | | | | | | |
Rental income | | $ | 17,937 | | | $ | 17,351 | | | | 3.4 | % | | $ | 53,172 | | | $ | 51,541 | | | | 3.2 | % |
Reimbursement and other income | | | 2,261 | | | | 2,058 | | | | 9.9 | % | | | 6,442 | | | | 6,075 | | | | 6.0 | % |
Total revenue | | | 20,198 | | | | 19,409 | | | | 4.1 | % | | | 59,614 | | | | 57,616 | | | | 3.5 | % |
Operating Expenses: | | | | | | | | | | | | | | | | | | | | | | | |
Real estate taxes | | | 2,194 | | | | 2,229 | | | | -1.6 | % | | | 6,589 | | | | 6,452 | | | | 2.1 | % |
Property insurance | | | 576 | | | | 540 | | | | 6.7 | % | | | 1,726 | | | | 1,644 | | | | 5.0 | % |
Personnel expenses | | | 2,189 | | | | 2,199 | | | | -0.5 | % | | | 6,323 | | | | 6,201 | | | | 2.0 | % |
Utilities | | | 1,543 | | | | 1,527 | | | | 1.0 | % | | | 4,495 | | | | 4,513 | | | | -0.4 | % |
Repairs and maintenance | | | 994 | | | | 946 | | | | 5.1 | % | | | 2,628 | | | | 2,480 | | | | 6.0 | % |
Management fees | | | 677 | | | | 656 | | | | 3.2 | % | | | 2,008 | | | | 1,939 | | | | 3.6 | % |
Contract services | | | 655 | | | | 589 | | | | 11.2 | % | | | 1,868 | | | | 1,765 | | | | 5.8 | % |
Advertising expenses | | | 249 | | | | 269 | | | | -7.4 | % | | | 755 | | | | 815 | | | | -7.4 | % |
Other expenses | | | 671 | | | | 596 | | | | 12.6 | % | | | 1,833 | | | | 1,808 | | | | 1.4 | % |
Total operating expenses | | | 9,748 | | | | 9,551 | | | | 2.1 | % | | | 28,225 | | | | 27,617 | | | | 2.2 | % |
Net operating income | | $ | 10,450 | | | $ | 9,858 | | | | 6.0 | % | | $ | 31,389 | | | $ | 29,999 | | | | 4.6 | % |
NOI Margin | | | 51.7 | % | | | 50.8 | % | | | 0.9 | % | | | 52.7 | % | | | 52.1 | % | | | 0.6 | % |
Average Occupancy | | | 93.2 | % | | | 93.4 | % | | | -0.2 | % | | | 93.4 | % | | | 93.4 | % | | | 0.0 | % |
Average effective monthly rent, per unit | | $ | 867 | | | $ | 838 | | | | 3.5 | % | | $ | 857 | | | $ | 831 | | | | 3.1 | % |
Reconciliation of Same-Store Net Operating Income to Net Income (loss) | | | | | | | | | | | | | | | | | | | | | | | | |
Same-store portfolio net operating income (a) | | $ | 10,450 | | | $ | 9,858 | | | | | | | $ | 31,389 | | | $ | 29,999 | | | | | |
Non same-store net operating income | | | 10,588 | | | | 3,689 | | | | | | | | 32,670 | | | | 7,311 | | | | | |
Asset management fees | | | (1,933 | ) | | | (1,259 | ) | | | | | | | (5,492 | ) | | | (3,731 | ) | | | | |
General and administrative expenses | | | (485 | ) | | | (329 | ) | | | | | | | (1,750 | ) | | | (1,171 | ) | | | | |
Stock compensation expense | | | (247 | ) | | | (217 | ) | | | | | | | (832 | ) | | | (297 | ) | | | | |
Acquisition and integration expenses | | | (19 | ) | | | (12,830 | ) | | | | | | | (37 | ) | | | (13,031 | ) | | | | |
Depreciation and amortization | | | (7,765 | ) | | | (4,704 | ) | | | | | | | (26,927 | ) | | | (16,462 | ) | | | | |
Interest expense | | | (8,820 | ) | | | (5,094 | ) | | | | | | | (27,815 | ) | | | (13,393 | ) | | | | |
Other income (expense) | | | (2 | ) | | | 18 | | | | | | | | (2 | ) | | | 19 | | | | | |
Net gains (losses) on sale of assets | | | (1 | ) | | | — | | | | | | | | 31,773 | | | | — | | | | | |
TSRE financing extinguishment and employee separation expenses | | | — | | | | (27,508 | ) | | | | | | | | | | | (27,508 | ) | | | | |
Gains (losses) on extinguishment of debt | | | — | | | | — | | | | | | | | (558 | ) | | | — | | | | | |
Gains (losses) on TSRE merger and property acquisitions | | | 641 | | | | 64,012 | | | | | | | | 732 | | | | 64,012 | | | | | |
Net income (loss) | | $ | 2,407 | | | $ | 25,636 | | | | | | | $ | 33,151 | | | $ | 25,748 | | | | | |
| (a) | Same store portfolio includes 26 properties which represents 7,757 units. |
15
NET OPERATING INCOME (NOI) BRIDGE
Dollars in thousands, except per share data
| | For the Three-Months Ended | |
| | September 30, 2016 | | | June 30, 2016 | | | March 31, 2016 | | | December 31, 2015 | | | September 30, 2015 | |
Property revenue | | | | | | | | | | | | | | | | | | | | |
Same store (a) | | $ | 20,198 | | | $ | 19,947 | | | $ | 19,469 | | | $ | 19,341 | | | $ | 19,409 | |
Non same store | | | 18,166 | | | | 18,380 | | | | 19,197 | | | | 20,368 | | | | 6,083 | |
Total property revenue | | | 38,364 | | | | 38,327 | | | | 38,666 | | | | 39,709 | | | | 25,492 | |
Property expenses | | | | | | | | | | | | | | | | | | | | |
Same store (a) | | | 9,748 | | | | 9,214 | | | | 9,263 | | | | 9,312 | | | | 9,551 | |
Non same store | | | 7,578 | | | | 7,638 | | | | 7,857 | | | | 8,086 | | | | 2,394 | |
Total property expenses | | | 17,326 | | | | 16,852 | | | | 17,120 | | | | 17,398 | | | | 11,945 | |
Net operating income | | | | | | | | | | | | | | | | | | | | |
Same store (a) | | | 10,450 | | | | 10,733 | | | | 10,206 | | | | 10,029 | | | | 9,858 | |
Non same store | | | 10,588 | | | | 10,742 | | | | 11,340 | | | | 12,282 | | | | 3,689 | |
Total property net operating income | | $ | 21,038 | | | $ | 21,475 | | | $ | 21,546 | | | $ | 22,311 | | | $ | 13,547 | |
Reconciliation of NOI to GAAP net income (loss) | | | | | | | | | | | | | | | | | | | | |
Total property net operating income | | $ | 21,038 | | | $ | 21,475 | | | $ | 21,546 | | | $ | 22,311 | | | $ | 13,547 | |
General and administrative expense | | | (485 | ) | | | (544 | ) | | | (721 | ) | | | (511 | ) | | | (329 | ) |
Stock compensation expense | | | (247 | ) | | | (380 | ) | | | (205 | ) | | | (198 | ) | | | (217 | ) |
Asset management fees - base | | | (1,727 | ) | | | (1,784 | ) | | | (1,631 | ) | | | (1,690 | ) | | | (1,259 | ) |
Asset management fees - incentive | | | (206 | ) | | | (79 | ) | | | (65 | ) | | | (192 | ) | | | — | |
Acquisition and integration expenses | | | (19 | ) | | | (8 | ) | | | (10 | ) | | | (524 | ) | | | (12,830 | ) |
Depreciation and amortization expense | | | (7,765 | ) | | | (7,635 | ) | | | (11,527 | ) | | | (11,632 | ) | | | (4,704 | ) |
Interest expense | | | (8,820 | ) | | | (9,018 | ) | | | (9,977 | ) | | | (10,160 | ) | | | (5,094 | ) |
Other income (expense) | | | (2 | ) | | | — | | | | — | | | | — | | | | 18 | |
Net gains (losses) on sale of assets | | | (1 | ) | | | 29,321 | | | | 2,453 | | | | 6,412 | | | | — | |
TSRE financing extinguishment and employee separation expenses | | | — | | | | — | | | | — | | | | — | | | | (27,508 | ) |
Gains (losses) on extinguishment of debt | | | — | | | | (558 | ) | | | — | | | | — | | | | — | |
Gains (losses) on TSRE merger and property acquisitions | | | 641 | | | | — | | | | 91 | | | | 592 | | | | 64,012 | |
Net income (loss) | | $ | 2,407 | | | $ | 30,790 | | | $ | (46 | ) | | $ | 4,408 | | | $ | 25,636 | |
(a) | Same store portfolio includes 26 properties which represents 7,757 units. |
16
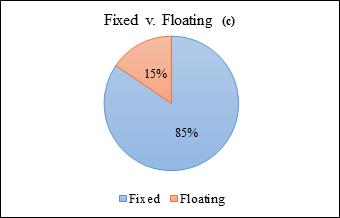
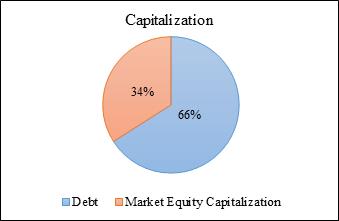
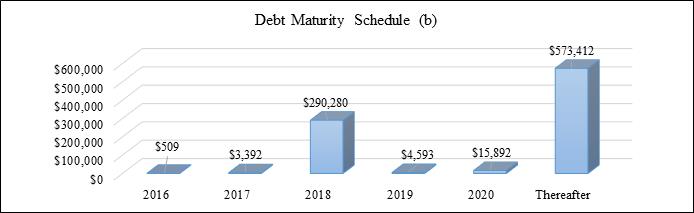
Debt Summary as of September 30, 2016
(Unaudited, in thousands except shares and per share data)
| | Amount | | | Rate | | | Type | | Weighted Average Maturity (in years) | | |
Debt: | | | | | | | | | | | | | | | |
Credit facility (a) (b) | | $ | 247,335 | | | | 2.8 | % | | Floating | | | 2.0 | | |
Term loan (b) | | | 40,000 | | | | 4.5 | % | | Floating | | | 2.0 | | |
Mortgages-Fixed rate | | | 600,743 | | | | 3.8 | % | | Fixed | | | 7.0 | | |
Unamortized deferred costs | | | (7,497 | ) | | | | | | | | | | | |
Total Debt | | | 880,581 | | | | 3.5 | % | | | | | 5.3 | | |
Market Equity Capitalization, at period end (b) | | | 453,823 | | | | | | | | | | | | |
Total Capitalization | | $ | 1,334,404 | | | | | | | | | | | | |
(a) | Credit facility total capacity is $325.0 million, of which $247.3 million was drawn as of September 30, 2016. |
(b) | On September 29, 2016, IRT priced a $25 million common share offering at $9.00 per share. The proceeds of this offering will be used to repay indebtedness, repurchase shares and fund the internalization payment later in 2016. As a result of this offering, IRT’s leverage and capitalization have improved. |
(c) | As of September 30, 2016, IRT maintained a float-to-fixed interest rate swap with a $150.0 million notional. This swap, which expires on June 17, 2021 and has a fixed rate of 1.145%, has converted $150.0 million of our floating rate debt to fixed rate debt. |
17
Property Summary
(Unaudited, in thousands except shares and per share data)
| | | | | | | | | | Investments in Real Estate | | | | | | | | | | | | | | | | | |
Property Name | | Location | | Acquisition Date | | Year Built / Renovated (a) | | | Gross Cost | | | Accumulated Depreciation | | | Net Book Value | | | Units (b) | | | Period End Occupancy (c) | | | Average Occupancy (d) | | | Average Effective Rent per Occupied Unit (e) | |
Copper Mill | | Austin, TX | | 4/29/2011 | | | 2010 | | | $ | 18,312 | | | $ | (3,547 | ) | | $ | 14,765 | | | | 320 | | | | 98.8% | | | | 95.2% | | | $ | 969 | |
Crestmont | | Marietta, GA | | 4/29/2011 | | 2010 (f) | | | | 17,067 | | | | (3,202 | ) | | | 13,865 | | | | 228 | | | | 87.7% | | | | 86.7% | | | | 825 | |
Heritage Trace | | Newport News, VA | | 4/29/2011 | | | 2010 | | | | 14,348 | | | | (2,823 | ) | | | 11,525 | | | | 200 | | | | 97.0% | | | | 95.6% | | | | 734 | |
Runaway Bay | | Indianapolis, IN | | 10/11/2012 | | | 2002 | | | | 16,061 | | | | (1,429 | ) | | | 14,632 | | | | 192 | | | | 95.8% | | | | 92.9% | | | | 967 | |
Berkshire Square | | Indianapolis, IN | | 9/19/2013 | | | 2012 | | | | 13,728 | | | | (928 | ) | | | 12,800 | | | | 354 | | | | 89.0% | | | | 88.9% | | | | 608 | |
The Crossings | | Jackson, MS | | 11/22/2013 | | | 2012 | | | | 23,276 | | | | (1,432 | ) | | | 21,844 | | | | 432 | | | | 91.4% | | | | 89.7% | | | | 790 | |
Reserve at Eagle Ridge | | Waukegan, IL | | 1/31/2014 | | | 2008 | | | | 28,986 | | | | (1,605 | ) | | | 27,381 | | | | 370 | | | | 92.7% | | | | 93.3% | | | | 998 | |
Windrush | | Edmond, OK | | 2/28/2014 | | | 2011 | | | | 9,360 | | | | (531 | ) | | | 8,829 | | | | 160 | | | | 88.1% | | | | 89.0% | | | | 785 | |
Heritage Park | | Oklahoma City, OK | | 2/28/2014 | | | 2011 | | | | 17,250 | | | | (943 | ) | | | 16,307 | | | | 453 | | | | 89.2% | | | | 90.6% | | | | 661 | |
Raindance | | Oklahoma City, OK | | 2/28/2014 | | | 2011 | | | | 14,166 | | | | (784 | ) | | | 13,382 | | | | 504 | | | | 94.0% | | | | 93.5% | | | | 564 | |
Augusta | | Oklahoma City, OK | | 2/28/2014 | | | 2011 | | | | 11,576 | | | | (720 | ) | | | 10,856 | | | | 197 | | | | 93.4% | | | | 93.4% | | | | 742 | |
Invitational | | Oklahoma City, OK | | 2/28/2014 | | | 2011 | | | | 19,309 | | | | (1,214 | ) | | | 18,095 | | | | 344 | | | | 91.6% | | | | 93.3% | | | | 672 | |
King's Landing | | Creve Coeur, MO | | 3/31/2014 | | | 2005 | | | | 32,594 | | | | (1,899 | ) | | | 30,695 | | | | 152 | | | | 95.4% | | | | 97.0% | | | | 1,521 | |
Carrington Park | | Little Rock, AR | | 5/7/2014 | | | 1999 | | | | 22,124 | | | | (1,271 | ) | | | 20,853 | | | | 202 | | | | 94.1% | | | | 92.2% | | | | 1,017 | |
Arbors at the Reservoir | | Ridgeland, MS | | 6/4/2014 | | | 2000 | | | | 20,713 | | | | (1,080 | ) | | | 19,633 | | | | 170 | | | | 94.1% | | | | 94.4% | | | | 1,145 | |
Walnut Hill | | Cordova, TN | | 8/28/2014 | | | 2001 | | | | 28,077 | | | | (1,435 | ) | | | 26,642 | | | | 362 | | | | 94.8% | | | | 95.6% | | | | 947 | |
Lenoxplace | | Raleigh, NC | | 9/5/2014 | | | 2012 | | | | 24,390 | | | | (1,112 | ) | | | 23,278 | | | | 268 | | | | 97.0% | | | | 95.9% | | | | 902 | |
Stonebridge Crossing | | Cordova, TN | | 9/15/2014 | | | 1994 | | | | 30,040 | | | | (1,424 | ) | | | 28,616 | | | | 500 | | | | 96.4% | | | | 93.5% | | | | 788 | |
Bennington Pond | | Groveport, OH | | 11/24/2014 | | | 2000 | | | | 17,750 | | | | (756 | ) | | | 16,994 | | | | 240 | | | | 97.1% | | | | 95.4% | | | | 869 | |
Prospect Park | | Louisville, KY | | 12/8/2014 | | | 1990 | | | | 14,190 | | | | (510 | ) | | | 13,680 | | | | 138 | | | | 97.8% | | | | 95.2% | | | | 915 | |
Brookside | | Louisville, KY | | 12/8/2014 | | | 1987 | | | | 20,891 | | | | (774 | ) | | | 20,117 | | | | 224 | | | | 94.6% | | | | 95.5% | | | | 828 | |
Jamestown | | Louisville, KY | | 12/8/2014 | | 1970 (f) | | | | 35,649 | | | | (1,313 | ) | | | 34,336 | | | | 355 | | | | 94.9% | | | | 93.9% | | | | 977 | |
Meadows | | Louisville, KY | | 12/8/2014 | | | 1988 | | | | 37,819 | | | | (1,404 | ) | | | 36,415 | | | | 400 | | | | 95.5% | | | | 95.1% | | | | 815 | |
Oxmoor | | Louisville, KY | | 12/8/2014 | | 1999-2000 | | | | 55,186 | | | | (2,144 | ) | | | 53,042 | | | | 432 | | | | 95.4% | | | | 94.9% | | | | 1,044 | |
Stonebridge at the Ranch | | Little Rock, AR | | 12/16/2014 | | | 2005 | | | | 31,482 | | | | (1,248 | ) | | | 30,234 | | | | 260 | | | | 93.5% | | | | 91.9% | | | | 926 | |
Iron Rock Ranch | | Austin, TX | | 12/30/2014 | | 2001-2002 | | | | 35,222 | | | | (1,335 | ) | | | 33,887 | | | | 300 | | | | 94.7% | | | | 94.2% | | | | 1,252 | |
Bayview Club | | Indianapolis, IN | | 5/1/2015 | | | 2004 | | | | 25,430 | | | | (809 | ) | | | 24,621 | | | | 236 | | | | 92.8% | | | | 93.8% | | | | 967 | |
Arbors River Oaks | | Memphis, TN | | 9/17/2015 | | 2010 (f) | | | | 21,490 | | | | (500 | ) | | | 20,990 | | | | 191 | | | | 96.3% | | | | 97.6% | | | | 1,182 | |
Aston | | Wake Forest, NC | | 9/17/2015 | | | 2013 | | | | 37,819 | | | | (861 | ) | | | 36,958 | | | | 288 | | | | 93.8% | | | | 94.5% | | | | 1,057 | |
Avenues at Craig Ranch | | McKinneuy, TX | | 9/17/2015 | | | 2013 | | | | 47,643 | | | | (1,058 | ) | | | 46,585 | | | | 334 | | | | 94.6% | | | | 95.3% | | | | 1,251 | |
Bridge Pointe | | Huntsville, AL | | 9/17/2015 | | | 2002 | | | | 15,906 | | | | (365 | ) | | | 15,541 | | | | 178 | | | | 96.6% | | | | 95.8% | | | | 818 | |
Creekstone at RTP | | Durham, NC | | 9/17/2015 | | | 2013 | | | | 38,209 | | | | (825 | ) | | | 37,384 | | | | 256 | | | | 93.8% | | | | 94.1% | | | | 1,165 | |
Fountains Southend | | Charlotte, NC | | 9/17/2015 | | | 2013 | | | | 41,677 | | | | (935 | ) | | | 40,742 | | | | 208 | | | | 90.9% | | | | 94.1% | | | | 1,412 | |
Fox Trails | | Plano, TX | | 9/17/2015 | | | 1981 | | | | 27,888 | | | | (565 | ) | | | 27,323 | | | | 286 | | | | 95.8% | | | | 96.2% | | | | 1,001 | |
Lakeshore on the Hill | | Chattanooga, TN | | 9/17/2015 | | | 2015 | | | | 11,278 | | | | (264 | ) | | | 11,014 | | | | 123 | | | | 99.2% | | | | 97.8% | | | | 950 | |
Millenia 700 | | Orlando, FL | | 9/17/2015 | | | 2012 | | | | 47,344 | | | | (1,051 | ) | | | 46,293 | | | | 297 | | | | 90.2% | | | | 90.4% | | | | 1,341 | |
Miller Creek at German Town | | Memphis, TN | | 9/17/2015 | | | 2013 | | | | 56,860 | | | | (1,342 | ) | | | 55,518 | | | | 330 | | | | 93.6% | | | | 94.8% | | | | 1,233 | |
Pointe at Canyon Ridge | | Atlanta, GA | | 9/17/2015 | | 2007 (f) | | | | 48,531 | | | | (956 | ) | | | 47,575 | | | | 494 | | | | 95.7% | | | | 96.2% | | | | 921 | |
St James at Goose Creek | | Goose Creek, SC | | 9/17/2015 | | | 2009 | | | | 31,707 | | | | (720 | ) | | | 30,987 | | | | 244 | | | | 96.3% | | | | 97.1% | | | | 1,077 | |
Talison Row at Daniel Island | | Daniel Island, SC | | 9/17/2015 | | | 2013 | | | | 47,013 | | | | (1,045 | ) | | | 45,968 | | | | 274 | | | | 98.5% | | | | 96.9% | | | | 1,518 | |
The Aventine Greenville | | Greenville, SC | | 9/17/2015 | | | 2013 | | | | 48,083 | | | | (1,100 | ) | | | 46,983 | | | | 346 | | | | 96.8% | | | | 95.6% | | | | 1,152 | |
Trails at Signal Mountain | | Chattanooga, TN | | 9/17/2015 | | | 2015 | | | | 14,354 | | | | (337 | ) | | | 14,017 | | | | 172 | | | | 98.3% | | | | 97.6% | | | | 928 | |
Vue at Knoll Trail | | Dallas, TX | | 9/17/2015 | | | 2015 | | | | 9,257 | | | | (159 | ) | | | 9,098 | | | | 114 | | | | 94.7% | | | | 94.9% | | | | 878 | |
Waterstone at Brier Creek | | Raleigh, NC | | 9/17/2015 | | | 2014 | | | | 38,917 | | | | (873 | ) | | | 38,044 | | | | 232 | | | | 90.9% | | | | 93.6% | | | | 1,240 | |
Waterstone Big Creek | | Alpharetta, GA | | 9/17/2015 | | | 2014 | | | | 69,626 | | | | (1,553 | ) | | | 68,073 | | | | 370 | | | | 92.7% | | | | 95.4% | | | | 1,352 | |
Westmont Commons | | Asheville, NC | | 9/17/2015 | | 2003, 2008 | | | | 28,127 | | | | (643 | ) | | | 27,484 | | | | 252 | | | | 97.6% | | | | 97.0% | | | | 1,021 | |
TOTAL | | | | | | | | | | $ | 1,316,725 | | | $ | (52,824 | ) | | $ | 1,263,901 | | | | 12,982 | | | | 94.3% | | | | 94.1% | | | $ | 977 | |
(a) | All dates are for the later of the year in which construction was completed or the year in which a significant renovation program was completed. |
(b) | Units represent the total number of apartment units available for rent at September 30, 2016. |
(c) | Physical occupancy for each of our properties is calculated as (i) total units rented as of September 30, 2016 divided by (ii) total units available as of September 30, 2016, expressed as a percentage. |
(d) | Average occupancy represents the daily average occupied units for the three-month period ended September 30, 2016. |
(e) | Average monthly effective monthly rent, per unit, represents the average monthly rent for all occupied units for the three-month period ended September 30, 2016. |
(f) | Properties are undergoing renovation. |
18
NOI Exposure by Market
Dollars in thousands, except per share data
| | | | | | | | | | | | | | For the Three Months Ended September 30, 2016 | |
Market | | Units | | | Gross Real Estate Assets | | | Period End Occupancy | | | Average Effective Monthly Rent per Unit | | | Net Operating Income (a) | | | % of NOI | |
Atlanta, GA | | | 1,092 | | | $ | 135,224 | | | | 93.0 | % | | $ | 1,047 | | | $ | 2,156 | | | | 10.3 | % |
Louisville. KY | | | 1,549 | | | | 163,736 | | | | 95.4 | % | | | 927 | | | | 2,571 | | | | 12.2 | % |
Raleigh, NC | | | 1,044 | | | | 139,335 | | | | 94.0 | % | | | 1,084 | | | | 2,011 | | | | 9.6 | % |
Memphis, TN | | | 1,383 | | | | 136,468 | | | | 95.3 | % | | | 990 | | | | 2,210 | | | | 10.5 | % |
Oklahoma City, OK | | | 1,658 | | | | 71,661 | | | | 91.6 | % | | | 655 | | | | 1,513 | | | | 7.2 | % |
Dallas, TX | | | 734 | | | | 84,787 | | | | 95.1 | % | | | 1,096 | | | | 1,326 | | | | 6.3 | % |
Charleston, SC | | | 518 | | | | 78,721 | | | | 97.5 | % | | | 1,310 | | | | 1,161 | | | | 5.5 | % |
Austin, TX | | | 620 | | | | 53,532 | | | | 96.8 | % | | | 1,106 | | | | 1,037 | | | | 4.9 | % |
Jackson, MS | | | 602 | | | | 43,990 | | | | 92.2 | % | | | 890 | | | | 866 | | | | 4.1 | % |
Indianapolis, IN | | | 782 | | | | 55,218 | | | | 91.8 | % | | | 821 | | | | 749 | | | | 3.6 | % |
Greenville, SC | | | 346 | | | | 48,082 | | | | 96.8 | % | | | 1,152 | | | | 749 | | | | 3.6 | % |
Little Rock, AR | | | 462 | | | | 53,606 | | | | 93.7 | % | | | 966 | | | | 735 | | | | 3.5 | % |
Orlando, FL | | | 297 | | | | 47,344 | | | | 90.2 | % | | | 1,341 | | | | 666 | | | | 3.2 | % |
Charlotte, NC | | | 208 | | | | 41,677 | | | | 90.9 | % | | | 1,412 | | | | 573 | | | | 2.7 | % |
Chicago, IL | | | 370 | | | | 28,986 | | | | 92.7 | % | | | 998 | | | | 587 | | | | 2.8 | % |
Asheville, NC | | | 252 | | | | 28,129 | | | | 97.6 | % | | | 1,021 | | | | 514 | | | | 2.4 | % |
St. Louis, MO | | | 152 | | | | 32,593 | | | | 95.4 | % | | | 1,521 | | | | 464 | | | | 2.2 | % |
Chattanooga, TN | | | 295 | | | | 25,631 | | | | 98.6 | % | | | 937 | | | | 430 | | | | 2.0 | % |
Columbus, OH | | | 240 | | | | 17,751 | | | | 97.1 | % | | | 869 | | | | 334 | | | | 1.6 | % |
Huntsville, AL | | | 178 | | | | 15,906 | | | | 96.6 | % | | | 818 | | | | 226 | | | | 1.1 | % |
Norfolk, VA | | | 200 | | | | 14,348 | | | | 97.0 | % | | | 734 | | | | 147 | | | | 0.7 | % |
Total/Weighted Average | | | 12,982 | | | $ | 1,316,725 | | | | 94.3 | % | | $ | 977 | | | $ | 21,025 | | | | 100.0 | % |
| | | | | | | | | | | | | | | | | | | | | | | | |
(a) | Net operating income for the three months ended September 30, 2016 excludes $13 primarily for properties sold during the nine months ended September 30, 2016. |
19
Definitions
Average Effective Monthly Rent per Unit
Average effective rent per unit represents the average of gross rent amounts, divided by the average occupancy (in units) for the period presented. We believe average effective rent is a helpful measurement in evaluating average pricing. This metric, when presented, reflects the average effective rent per month.
Average Occupancy
Average occupancy represents the average of the daily physical occupancy for the period presented.
Adjusted EBITDA
EBITDA is defined as net income before gains or losses on asset sales, gains or losses on debt extinguishments, depreciation and amortization expenses, interest expense, income taxes, and amortization of deferred financing costs. Adjusted EBITDA is EBITDA before acquisition expenses and gains. EBITDA and Adjusted EBITDA are each non-GAAP measures. We consider EBITDA and Adjusted EBITDA to be an appropriate supplemental measure of our performance because it eliminates depreciation, income taxes, interest and acquisition expenses and gains relating to IRT’s acquisition of TSRE, and internalization costs, which permits investors to view income from operations without non-cash items such as depreciation, amortization, the cost of debt or items specific to the TSRE acquisition, and internalization costs. The table is a reconciliation of net income applicable to common stockholders to Adjusted EBITDA. IRT’s calculation of Adjusted EBITDA differs from the methodology used for calculating Adjusted EBITDA by certain other REITs and, accordingly, IRT’s Adjusted EBITDA may not be comparable to Adjusted EBITDA reported by other REITs.
Funds From Operations (“FFO”) and Core Funds From Operations (“CFFO”)
IRT believes that FFO and CFFO, each of which is a non-GAAP measure, are additional appropriate measures of the operating performance of a REIT and IRT in particular. IRT computes FFO in accordance with the standards established by the National Association of Real Estate Investment Trusts, or NAREIT, as net income or loss (computed in accordance with GAAP), excluding real estate-related depreciation and amortization expense, gains or losses on sales of real estate and the cumulative effect of changes in accounting principles.
CFFO is a computation made by analysts and investors to measure a real estate company’s operating performance by removing the effect of items that do not reflect ongoing property operations, including acquisition and integration expenses, expensed costs related to the issuance of shares of our common stock, gains or losses on real estate transactions and equity-based compensation expenses, from the determination of FFO. IRT incurs acquisition expenses in connection with acquisitions of real estate properties and expenses those costs when incurred in accordance with U.S. GAAP. As these expenses are one-time and reflective of investing activities rather than operating performance, IRT adds back these costs to FFO in determining CFFO. In connection with the IRT’s acquisition of Trade Street Residential Inc., or TSRE, in September 2015, IRT modified the calculation of CFFO to adjust for amortization of deferred financing costs and TSRE financing extinguishment and employee separation expenses because these are non-cash items or reflective of investing activities rather than operating performance similar to the other CFFO adjustments. The effect of these modifications on prior periods is reflected in the reconciliation of IRT’s reported net income (loss) allocable to common shares to its FFO and CFFO included herein.
IRT’s calculation of CFFO differs from the methodology used for calculating CFFO by certain other REITs and, accordingly, IRT’s CFFO may not be comparable to CFFO reported by other REITs. IRT’s management utilizes FFO and CFFO as measures of IRT’s operating performance, and believes they are also useful to investors, because they facilitate an understanding of IRT’s operating performance after adjustment for certain non-cash items, such as depreciation and amortization expenses, equity based compensation, amortization of deferred financing fees, TSRE financing extinguishment and employee separation costs, gains (losses) on TSRE transaction and property acquisitions, and with respect to CFFO, acquisition and integration expenses, pursuit costs and internalization costs that are required by GAAP to be expensed but may not necessarily be indicative of current operating performance and that may not accurately compare IRT’s operating performance between periods. Furthermore, although FFO, CFFO and other supplemental performance measures are defined in various ways throughout the REIT industry, IRT also believes that FFO and CFFO may provide IRT and our investors with an additional useful measure to compare IRT’s financial performance to certain other REITs. IRT also uses CFFO for purposes of determining the quarterly incentive fee, if any, payable to our advisor. Neither FFO nor CFFO is equivalent to net income or cash generated from operating activities determined in accordance with GAAP. Furthermore, FFO and CFFO do not represent amounts available for management’s discretionary use because of needed capital replacement or expansion, debt service obligations or other commitments or uncertainties. Neither FFO nor CFFO should be considered as an alternative to net income as an indicator of IRT’s operating performance or as an alternative to cash flow from operating activities as a measure of IRT’s liquidity.
20
Net Debt
Net debt, a non-GAAP measure, equals total debt less cash and cash equivalents as these captions are reported on the consolidated balance sheet. The following table provides a reconciliation of total debt to net debt.
| As of | |
| September 30, 2016 | | | March 31, 2016 | | | March 31, 2016 | | | December 31, 2015 | | | September 30, 2015 | |
Total debt | $ | 880,581 | | | $ | 880,288 | | | $ | 940,336 | | | $ | 966,611 | | | $ | 983,207 | |
Less: cash and cash equivalents | | (29,247 | ) | | | (28,051 | ) | | | (21,924 | ) | | | (38,301 | ) | | | (16,939 | ) |
Total net debt | $ | 851,334 | | | $ | 852,237 | | | $ | 918,412 | | | $ | 928,310 | | | $ | 966,268 | |
| | | | | | | | | | | | | | | | | | | |
IRT presents net debt because management believes it is a useful measure of IRT’s credit position and progress toward reducing leverage. The calculation is limited in that IRT may not always be able to use cash to repay debt on a dollar for dollar basis.
Net Operating Income
IRT believes that Net Operating Income (“NOI”), a non-GAAP measure, is a useful measure of its operating performance. IRT defines NOI as total property revenues less total property operating expenses, excluding depreciation and amortization, asset management fees, acquisition expenses and general administrative expenses. Other REITs may use different methodologies for calculating NOI, and accordingly, our NOI may not be comparable to other REITs. We believe that this measure provides an operating perspective not immediately apparent from GAAP operating income or net income. We use NOI to evaluate our performance on a same store and non-same store basis because NOI measures the core operations of property performance by excluding corporate level expenses and other items not related to property operating performance and captures trends in rental housing and property operating expenses. However, NOI should only be used as an alternative measure of our financial performance.
Same Store Properties and Same Store Portfolio
IRT reviews its same store properties or portfolio at the beginning of each calendar year. Properties are added into the same store portfolio if they were owned at the beginning of the previous year. Properties that have been sold are excluded from the same store portfolio.
Total Gross Assets
Total Gross Assets equals total assets plus accumulated depreciation and accumulated amortization, including fully depreciated or amortized real estate and real estate related assets. The following table provides a reconciliation of total assets to total gross assets.
| As of | |
| September 30, 2016 | | | June 30, 2016 | | | March 31, 2016 | | | December 31, 2015 | | | September 30, 2015 | |
Total assets | $ | 1,306,242 | | | $ | 1,307,871 | | | $ | 1,344,650 | | | $ | 1,383,188 | | | $ | 1,402,554 | |
Plus: Accumulated Depreciation | | 52,824 | | | | 45,059 | | | | 44,422 | | | | 39,638 | | | | 35,304 | |
Plus: Accumulated Amortization | | 15,287 | | | | 15,287 | | | | 15,287 | | | | 11,551 | | | | 7,743 | |
Total gross assets | $ | 1,374,353 | | | $ | 1,368,217 | | | $ | 1,404,359 | | | $ | 1,434,377 | | | $ | 1,445,601 | |
| | | | | | | | | | | | | | | | | | | |
21