Exhibit 99.2
1

TABLE OF CONTENTS
Company Information | | 3 |
| | |
Forward-Looking Statements | | 4 |
| | |
Earnings Release Text | | 5 |
| | |
Financial & Operating Highlights | | 10 |
| | |
Balance Sheets | | 11 |
| | |
Statements of Operations, FFO & CORE FFO | | |
Trailing Five Quarters | | 12 |
Three and Nine Months Ended September 30, 2019 and 2018 | | 13 |
| | |
Adjusted EBITDA Reconciliations and Coverage Ratio | | |
Trailing Five Quarters | | 14 |
Three and Nine Months Ended September 30, 2019 and 2018 | | 14 |
| | |
Same-Store Portfolio Net Operating Income | | |
Trailing Five Quarters | | 15 |
Three and Nine Months Ended September 30, 2019 and 2018 | | 16 |
| | |
Net Operating Income Bridge | | 17 |
| | |
Same-Store Portfolio Net Operating Income by Market | | |
Three Months ended September 30, 2019 and 2018 | | 18 |
Nine Months ended September 30, 2019 and 2018 | | 19 |
| | |
Total Portfolio NOI Exposure by Market | | 20 |
| | |
Value Add Summary | | 21 |
| | |
Capital Recycling Activity | | 22 |
| | |
Debt Summary | | 23 |
| | |
Definitions | | 24 |
2
Independence Realty Trust
September 30, 2019
Company Information:
Independence Realty Trust, Inc. (NYSE: IRT) is a real estate investment trust that owns and operates multifamily apartment properties across non-gateway U.S. markets, including Atlanta, Louisville, Memphis, and Raleigh. IRT’s investment strategy is focused on gaining scale within key amenity rich submarkets that offer good school districts, high-quality retail and major employment centers. IRT aims to provide stockholders attractive risk-adjusted returns through diligent portfolio management, strong operational performance, and a consistent return of capital through distributions and capital appreciation. More information may be found on the Company’s website at www.irtliving.com.
Corporate Headquarters | | 1835 Market Street, Suite 2601 |
| | Philadelphia, PA 19103 |
| | 267.270.4800 |
| |
Trading Symbol | | NYSE: “IRT” |
| |
Investor Relations Contact | | Edelman Financial Communications & Capital Markets |
| | Ted McHugh and Lauren Tarola |
| | 212-277-4322 |
| | IRT@edelman.com |
| | |
3
Forward-Looking Statements
This supplemental information contains certain forward-looking statements within the meaning of Section 27A of the Securities Act of 1933, as amended, and Section 21E of the Securities Exchange Act of 1934, as amended. Such forward-looking statements can generally be identified by our use of forward-looking terminology such as “may,” “will,” “expect,” “intend,” “anticipate,” “estimate,” “believe,” “seek,” “outlook,” “assumption,” “projected,” “strategy”, “guidance” or other, similar words. Because such forward-looking statements involve significant risks, uncertainties and contingencies, many of which are not within IRT’s control, actual results may differ materially from the expectations, intentions, beliefs, plans or predictions of the future expressed or implied by such statements. These forward-looking statements are based upon the current judgements and expectations of IRT’s management. Risks and uncertainties that might cause IRT’s actual results to differ materially from those expressed or implied by forward-looking statements include, but are not limited to: adverse changes in national, regional and local economic climates; changes in market demand for rental apartment homes and pricing pressures from competitors that could limit our ability to lease units or increase rents; competition that could adversely affect our ability to acquire additional properties; volatility in capital and credit markets, including changes that reduce availability, and increase costs, of capital; unexpected changes in the assumptions underlying our 2019 EPS, CFFO and same store NOI growth guidance; delays in completing, and cost overruns incurred in connection with, our value add initiatives and failure to achieve projected rent increases and occupancy levels on account of the initiatives; risks associated with pursuit of strategic acquisitions, including risks associated with the need to raise additional capital to fund the acquisitions and failure of acquisitions to produce expected returns; unexpected costs of REIT qualification compliance; costs and disruptions as the result of a cybersecurity incident or other technology disruption; and share price fluctuations. Additional risks and uncertainties that could cause our actual results to differ materially from those expressed or implied by the forward-looking statements in this supplemental information are discussed in IRT’s filings with the Securities and Exchange Commission (“SEC”), including those under the heading “Risk Factors” in IRT’s most recently filed Annual Report on Form 10-K. Dividends are subject to the discretion of IRT’s Board of Directors, and will depend on IRT’s financial condition, results of operations, capital requirements, compliance with applicable laws and agreements and any other factors deemed relevant by IRT’s Board. IRT undertakes no obligation to update these forward-looking statements to reflect events or circumstances after the date hereof or to reflect the occurrence of unanticipated events, except as may be required by law.
4
Independence Realty Trust Announces Third Quarter 2019 Financial Results
PHILADELPHIA – (BUSINESS WIRE) – October 30, 2019 — Independence Realty Trust, Inc. (“IRT”) (NYSE: IRT), a multifamily apartment REIT, today announced its third quarter 2019 financial results.
Third Quarter Highlights
| • | Net income allocable to common shares of $4.9 million for the quarter ended September 30, 2019 as compared to $4.8 million for the quarter ended September 30, 2018. Earnings per diluted share of $0.05 for the quarter ended September 30, 2019, flat as compared to quarter ended September 30, 2018. |
| • | Same store net operating income (“NOI”) growth of 8.1% for the quarter ended September 30, 2019 compared to the quarter ended September 30, 2018. |
| • | Core Funds from Operations (“CFFO”) of $17.0 million for the quarter ended September 30, 2019 as compared to $16.5 million for the quarter ended September 30, 2018. CFFO per share was $0.19 for the third quarter of 2019, in line with the third quarter of 2018. |
| • | Adjusted EBITDA of $25.7 million for the quarter ended September 30, 2019 as compared to $24.7 million for the quarter ended September 30, 2018. |
| • | Since the inception of the value add program, IRT has completed renovations in 2,364 units, achieving a total weighted average return on investment of 15.8%. |
Included later in this press release are definitions of CFFO, NOI, Adjusted EBITDA and other Non-GAAP financial measures and reconciliations of such measures to their most comparable financial measures as calculated and presented under GAAP.
Management Commentary:
“We continued to see the benefit of our value add initiative in Q3, as evidenced by our strong same store revenue growth of 6.6% and resulting same store NOI growth of 8.1% during the quarter,” said Scott Schaeffer, IRT’s Chairman and CEO. “We are confident that the investment in portfolio upgrades and our commitment to opportunistically recycling capital will allow us to achieve our broader corporate goals and maximize value for our shareholders.”
Same Store Property Operating Results
| | |
| Third Quarter 2019 Compared to Third Quarter 2018 (1) | Nine Months Ended 9/30/19 Compared to Nine Months Ended 9/30/18 (1) |
Rental and other property revenue | 6.6% increase | 5.5% increase |
Property operating expenses | 4.4% increase | 3.2% increase |
Net operating income (“NOI”) | 8.1% increase | 7.0% increase |
Portfolio average occupancy | No change - 93.4% | 40 bps decrease to 93.3% |
Portfolio average rental rate | 5.7% increase to $1,078 | 5.2% increase to $1,058 |
NOI Margin | 90 bps increase to 60.5% | 90 bps increase to 60.6% |
| (1) | Same store portfolio for the three and nine months ended September 30, 2019 includes 49 properties, which represent 13,397 units. |
5
Same Store Property Operating Results, Excluding Value Add
The same store portfolio results below exclude 12 communities that are both part of the same store portfolio and are actively undergoing Value Add renovations during the three months ended September 30, 2019.
| | |
| Third Quarter 2019 Compared to Third Quarter 2018, Excluding Value Add (1) | Nine Months Ended 9/30/19 Compared to Nine Months Ended 9/30/18 (1) |
Rental and other property revenue | 4.0% increase | 4.0% increase |
Property operating expenses | 3.3% increase | 3.3% increase |
Net operating income (“NOI”) | 4.5% increase | 4.4% increase |
Portfolio average occupancy | 40 bps decrease to 94.6% | 10 bps decrease 94.5% |
Portfolio average rental rate | 3.7% increase to $1,072 | 3.6% increase to $1,055 |
NOI Margin | 30 bps increase to 60.0% | 20 bps increase to 60.1% |
| (1) | Same store portfolio, excluding value add, includes 37 properties, which represent 9,448 units for the three and nine months ended September 30, 2019. |
Capital Recycling
Acquisitions:
| • | On July 11, 2019, IRT acquired a 264-unit community in Tampa, FL for $48.0 million. At the time of acquisition, the community was 95.5% occupied with average rent per unit of $1,313. |
| • | Subsequent to quarter end, on October 1, 2019, IRT acquired a 318-unit community in Raleigh, NC for $52.9 million. At the time of acquisition, the community was 96.2% occupied with average rent per unit of $1,113. |
Dispositions:
| • | On July 18, 2019, IRT completed the disposition of two communities in Little Rock, AR for a combined sale price of $56.5 million. Associated with this disposition, IRT repaid property mortgages totaling $34.8 million and recognized a gain of $2.2 million. |
At-the-Market Offering
During the third quarter of 2019, IRT issued 972,887 shares of common stock under its at-the-market sales program at a weighted average per share price of $13.45, yielding net proceeds of approximately $12.8 million. During the first nine months of 2019, IRT issued 1,548,591 shares of common stock under its at-the-market sales program at a weighted average per share price of $12.59, yielding net proceeds of approximately $18.8 million.
Capital Expenditures
For the three months ended September 30, 2019, recurring capital expenditures for the total portfolio were $2.5 million, or $161 per unit. For the nine months ended September 30, 2019 recurring capital expenditures for the total portfolio were $6.2 million or $399 per unit.
Distributions
On September 12, 2019, IRT’s Board of Directors declared a quarterly cash dividend for the third quarter of 2019 of $0.18 per share of IRT common stock, payable on October 25, 2019 to stockholders of record at the close of business on September 27, 2019.
2019 EPS and CFFO Guidance
IRT is updating its 2019 full year guidance. EPS per diluted share is projected to be in a range of $0.47 to $0.54. CFFO per diluted share, a non-GAAP financial measure, is projected to be in the range of $0.75 to $0.78. A reconciliation of IRT's projected net income allocable to common shares to its projected CFFO per share is included below. Also included below are the primary assumptions underlying these estimates. See the schedules and definitions at the end of this release for further information regarding how IRT calculates CFFO and for management’s rationale for the usefulness of CFFO.
6
| | | | |
| Previous Guidance | Current Guidance |
2019 Full Year EPS and CFFO Guidance (1)(2) | Low | High | Low | High |
Earnings per share (3) | $0.65 | $0.70 | $0.47 | $0.54 |
Adjustments: | | | | |
Depreciation and amortization | 0.55 | 0.57 | 0.55 | 0.57 |
Gains on sale of assets (3) | (0.51) | (0.55) | (0.33) | (0.39) |
Share base compensation | 0.04 | 0.04 | 0.04 | 0.04 |
Amortization of deferred financing fees | 0.02 | 0.02 | 0.02 | 0.02 |
CORE FFO per share allocated to common shareholders | $0.75 | $0.78 | $0.75 | $0.78 |
| (1) | This guidance, including the underlying assumptions presented in the table below, constitutes forward-looking information. Actual full year 2019 EPS and CFFO could vary significantly from the projections presented. See “Forward-Looking Statements” below. |
| (2) | Per share guidance is based on weighted average shares and units outstanding of 90.9 million. |
| (3) | The change in earnings per share and gains on sale of assets is driven by a lower number of properties sold than was assumed in our previous guidance. |
| | |
Same Store Communities | Previous 2019 Outlook | Current 2019 Outlook |
Number of properties/units | 50 properties / 13,697 units | 49 properties / 13,397 units |
Property revenue growth | 5.0% to 6.0% | 5.5% to 6.0% |
Controllable property operating expense growth | 0.5% to 1.50% | 1.0% to 1.50% |
Real estate tax and insurance expense increase | 8.0% to 10.0% | 6.5% to 7.5% |
Total property operating expense growth | 4.0% to 5.0% | 3.0% to 3.5% |
Same store property NOI growth | 6.0% to 7.0% | 7.0% to 7.5% |
| | |
Corporate Expenses | | |
General and administrative expenses (excluding stock based compensation) | $9.5 to $10.0 million | $9.5 to $10.0 million |
| | |
Transaction/Investment Volume | | |
Acquisition volume (1) | $76.0 to $110.0 million | $128.9 million |
Disposition volume (2) | $98.5 to $180.0 million | $150.0 to $155.0 million |
| | |
Capital Expenditures | | |
Recurring | $7.50 to $8.25 million | $7.50 to $8.25 million |
Value add & non-recurring | $30.0 to $35.0 million | $30.0 to $35.0 million |
| (1) | Acquisition volume includes the April, July, and October 2019 acquisitions totaling $128.9 million. |
| (2) | Disposition volume includes dispositions year-to-date totaling $98.5 million, plus the expected sale of our Austin, Texas community in December 2019. |
Selected Financial Information
See the schedules at the end of this earnings release for selected financial information for IRT.
Non-GAAP Financial Measures and Definitions
IRT discloses the following non-GAAP financial measures in this earnings release: FFO, CFFO, NOI and Adjusted EBITDA. Included at the end of this release are definitions of these non-GAAP financial measures and a reconciliation of IRT’s reported net income to its FFO and CFFO, a reconciliation of IRT’s same store NOI to its reported net income, a reconciliation of IRT’s Adjusted EBITDA to net income, and management’s rationales for the usefulness of each of these and other non-GAAP financial measures used in this release.
7
Conference Call
All interested parties can listen to the live conference call webcast at 9:00 AM ET on Thursday, October 31, 2019 from the investor relations section of the IRT website at www.irtliving.com or by dialing 1.844.775.2542, access code 8497373. For those who are not available to listen to the live call, the replay will be available shortly following the live call from the investor relations section of IRT’s website and telephonically until Thursday, November 7, 2019 by dialing 1.855.859.2056, access code 8497373.
Supplemental Information
IRT produces supplemental information that includes details regarding the performance of the portfolio, financial information, non-GAAP financial measures, same store information and other useful information for investors. The supplemental information is available via the Company's website, www.irtliving.com, through the "Investor Relations" section.
About Independence Realty Trust, Inc.
Independence Realty Trust, Inc. (NYSE: IRT) is a real estate investment trust that owns and operates multifamily apartment properties across non-gateway U.S. markets, including Atlanta, Louisville, Memphis, and Raleigh. IRT’s investment strategy is focused on gaining scale within key amenity rich submarkets that offer good school districts, high-quality retail and major employment centers. IRT aims to provide stockholders attractive risk-adjusted returns through diligent portfolio management, strong operational performance, and a consistent return of capital through distributions and capital appreciation. More information may be found on the Company’s website at www.irtliving.com.
8
Forward-Looking Statements
This press release contains certain forward-looking statements within the meaning of Section 27A of the Securities Act of 1933, as amended, and Section 21E of the Securities Exchange Act of 1934, as amended. Such forward-looking statements can generally be identified by our use of forward-looking terminology such as “may,” “will,” “expect,” “intend,” “anticipate,” “estimate,” “believe,” “seek,” “outlook,” “assumption,” “projected,” “strategy”, “guidance” or other, similar words. Because such forward-looking statements involve significant risks, uncertainties and contingencies, many of which are not within IRT’s control, actual results may differ materially from the expectations, intentions, beliefs, plans or predictions of the future expressed or implied by such statements. These forward-looking statements are based upon the current judgements and expectations of IRT’s management. Risks and uncertainties that might cause IRT’s actual results to differ materially from those expressed or implied by forward-looking statements include, but are not limited to: adverse changes in national, regional and local economic climates; changes in market demand for rental apartment homes and pricing pressures from competitors that could limit our ability to lease units or increase rents; competition that could adversely affect our ability to acquire additional properties; volatility in capital and credit markets, including changes that reduce availability, and increase costs, of capital; unexpected changes in the assumptions underlying our 2019 EPS, CFFO and same store NOI growth guidance; delays in completing, and cost overruns incurred in connection with, our value add initiatives and failure to achieve projected rent increases and occupancy levels on account of the initiatives; risks associated with pursuit of strategic acquisitions, including risks associated with the need to raise additional capital to fund the acquisitions and failure of acquisitions to produce expected returns; unexpected costs of REIT qualification compliance; costs and disruptions as the result of a cybersecurity incident or other technology disruption; and share price fluctuations. Additional risks and uncertainties that could cause our actual results to differ materially from those expressed or implied by the forward-looking statements in this press release are discussed in IRT’s filings with the Securities and Exchange Commission (“SEC”), including those under the heading “Risk Factors” in IRT’s most recently filed Annual Report on Form 10-K. Dividends are subject to the discretion of IRT’s Board of Directors, and will depend on IRT’s financial condition, results of operations, capital requirements, compliance with applicable laws and agreements and any other factors deemed relevant by IRT’s Board. IRT undertakes no obligation to update these forward-looking statements to reflect events or circumstances after the date hereof or to reflect the occurrence of unanticipated events, except as may be required by law.
Independence Realty Trust, Inc. Contact
Edelman Financial Communications & Capital Markets
Ted McHugh and Lauren Tarola
212.277.4322
IRT@edelman.com
9
FINANCIAL & OPERATING HIGHLIGHTS
Dollars in thousands, except share and per share data
| | For the Three Months Ended |
| | September 30, 2019 | | June 30, 2019 | | March 31, 2019 | | December 31, 2018 | | September 30, 2018 |
Selected Financial Information: | | | | | | | | | | |
Operating Statistics: | | | | | | | | | | |
Net income available to common shares | | $4,863 | | $14,709 | | $2,540 | | $14,580 | | $4,787 |
Earnings (loss) per share -- diluted | | $0.05 | | $0.16 | | $0.03 | | $0.16 | | $0.05 |
Rental and other property revenue | | $51,057 | | $50,848 | | $49,465 | | $49,718 | | $48,644 |
Property operating expenses | | $20,546 | | $20,072 | | $19,886 | | $19,450 | | $19,792 |
Net operating income | | $30,511 | | $30,776 | | $29,579 | | $30,268 | | $28,852 |
NOI margin | | 59.8% | | 60.5% | | 59.8% | | 60.9% | | 59.3% |
Adjusted EBITDA | | $25,739 | | $25,284 | | $24,734 | | $25,653 | | $24,748 |
CORE FFO per share | | $0.19 | | $0.19 | | $0.18 | | $0.19 | | $0.19 |
Dividends per share | | $0.18 | | $0.18 | | $0.18 | | $0.18 | | $0.18 |
CORE FFO payout ratio | | 94.7% | | 94.7% | | 100.0% | | 94.7% | | 94.7% |
Portfolio Data: | | | | | | | | | | |
Total gross assets | | $1,821,173 | | $1,817,207 | | $1,807,955 | | $1,798,736 | | $1,782,186 |
Total number of properties | | 57 | | 58 | | 58 | | 58 | | 58 |
Total units | | 15,536 | | 15,734 | | 15,880 | | 15,880 | | 15,860 |
Period end occupancy | | 92.8% | | 94.0% | | 93.9% | | 92.5% | | 92.3% |
Total portfolio average occupancy | | 93.5% | | 94.4% | | 92.9% | | 92.3% | | 93.5% |
Total portfolio average effective monthly rent, per unit | | $1,084 | | $1,058 | | $1,042 | | $1,035 | | $1,024 |
Same store period end occupancy (a) | | 93.0% | | 93.8% | | 93.6% | | 92.0% | | 92.2% |
Same store portfolio average occupancy (a) | | 93.4% | | 94.1% | | 92.5% | | 92.0% | | 93.4% |
Same store portfolio average effective monthly rent, per unit (a) | | $1,078 | | $1,057 | | $1,039 | | $1,034 | | $1,020 |
Capitalization: | | | | | | | | | | |
Total debt | | $979,330 | | $989,499 | | $990,920 | | $985,488 | | $963,238 |
Common share price, period end | | $14.31 | | $11.57 | | $10.79 | | $9.18 | | $10.53 |
Market equity capitalization | | $1,313,311 | | $1,050,712 | | $978,825 | | $826,802 | | $945,615 |
Total market capitalization | | $2,292,641 | | $2,040,211 | | $1,969,745 | | $1,812,290 | | $1,908,853 |
Total debt/total gross assets | | 53.8% | | 54.5% | | 54.8% | | 54.8% | | 54.0% |
Net debt to Adjusted EBITDA (pro forma) (b) | | 9.0x | | 9.2x | | 9.2x | | 9.2x | | 9.3x |
Interest coverage | | 2.6x | | 2.6x | | 2.5x | | 2.6x | | 2.7x |
Common shares and OP Units: | | | | | | | | | | |
Shares outstanding | | 90,894,656 | | 89,932,418 | | 89,834,793 | | 89,184,443 | | 88,920,879 |
OP units outstanding | | 881,107 | | 881,107 | | 881,107 | | 881,107 | | 881,107 |
Common shares and OP units outstanding | | 91,775,763 | | 90,813,525 | | 90,715,900 | | 90,065,550 | | 89,801,986 |
Weighted average common shares and units | | 90,908,646 | | 90,394,212 | | 89,870,556 | | 89,532,373 | | 88,585,940 |
| (a) | Same store portfolio consists of 49 properties, which represent 13,397 units. |
| (b) | Reflects pro forma net debt to adjusted EBITDA for each period presented, which includes adjustments for the timing of acquisitions, the full quarter effect of current value add initiatives, and the completion of capital recycling activities including paydown of associated indebtedness. Actual net debt to Adjusted EBITDA for the five quarters ended September 30, 2019 was 9.4x, 9.7x, 9.9x, 9.5x, and 9.7x, respectively. |
10
BALANCE SHEETS
Dollars in thousands, except per share data
| | As of |
| | September 30, 2019 | | June 30, 2019 | | March 31, 2019 | | December 31, 2018 | | September 30, 2018 |
Assets: | | | | | | | | | | |
Investments in real estate at cost | | $1,732,392 | | $1,704,769 | | $1,669,875 | | $1,660,423 | | $1,572,015 |
Less: accumulated depreciation | | (145,075) | | (136,488) | | (124,107) | | (112,270) | | (101,589) |
Investments in real estate, net | | 1,587,317 | | 1,568,281 | | 1,545,768 | | 1,548,153 | | 1,470,426 |
Real estate held for sale | | 32,381 | | 50,494 | | 77,430 | | 77,285 | | 141,853 |
Cash and cash equivalents | | 6,587 | | 11,060 | | 9,030 | | 9,316 | | 7,645 |
Restricted cash | | 8,960 | | 7,780 | | 7,122 | | 6,729 | | 8,265 |
Other assets | | 16,439 | | 16,364 | | 10,984 | | 8,802 | | 6,924 |
Derivative assets | | 982 | | 1,558 | | 5,327 | | 8,307 | | 12,440 |
Intangible assets, net | | 351 | | 210 | | 188 | | 744 | | 555 |
Total assets | | $1,653,017 | | $1,655,747 | | $1,655,849 | | $1,659,336 | | $1,648,108 |
Liabilities and Equity: | | | | | | | | | | |
Indebtedness, net | | $979,330 | | $989,499 | | $990,920 | | $985,488 | | $963,238 |
Accounts payable and accrued expenses | | 32,249 | | 26,374 | | 22,092 | | 22,815 | | 28,477 |
Accrued interest payable | | 794 | | 691 | | 681 | | 719 | | 540 |
Dividends payable | | 16,460 | | 16,285 | | 16,267 | | 16,162 | | 16,113 |
Derivative liabilities | | 12,415 | | 7,394 | | 1,460 | | — | | — |
Other liabilities | | 7,399 | | 7,595 | | 7,355 | | 4,107 | | 3,697 |
Total liabilities | | 1,048,647 | | 1,047,838 | | 1,038,775 | | 1,029,291 | | 1,012,065 |
Equity: | | | | | | | | | | |
Shareholders' Equity: | | | | | | | | | | |
Preferred shares, $0.01 par value per share | | — | | — | | — | | — | | — |
Common shares, $0.01 par value per share | | 909 | | 899 | | 898 | | 892 | | 889 |
Additional paid in capital | | 762,933 | | 749,552 | | 747,731 | | 742,429 | | 739,152 |
Accumulated other comprehensive income (loss) | | (17,097) | | (11,769) | | (2,308) | | 2,016 | | 9,788 |
Retained earnings (deficit) | | (148,977) | | (137,539) | | (136,120) | | (122,342) | | (120,924) |
Total shareholders' equity | | 597,768 | | 601,143 | | 610,201 | | 622,995 | | 628,905 |
Noncontrolling Interests | | 6,602 | | 6,766 | | 6,873 | | 7,050 | | 7,138 |
Total equity | | 604,370 | | 607,909 | | 617,074 | | 630,045 | | 636,043 |
Total liabilities and equity | | $1,653,017 | | $1,655,747 | | $1,655,849 | | $1,659,336 | | $1,648,108 |
11
STATEMENTS OF OPERATIONS, FFO & CORE FFO
TRAILING FIVE QUARTERS
Dollars in thousands, except per share data
| | For the Three Months Ended |
| | September 30, 2019 | | June 30, 2019 | | March 31, 2019 | | December 31, 2018 | | September 30, 2018 |
Revenue: | | | | | | | | | | |
Rental and other property revenue | | $51,057 | | $50,848 | | $49,465 | | $49,718 | | $48,644 |
Other revenue | | 242 | | 108 | | 75 | | 91 | | 135 |
Total revenue | | 51,299 | | 50,956 | | 49,540 | | 49,809 | | 48,779 |
Expenses: | | | | | | | | | | |
Property operating expenses | | 20,546 | | 20,072 | | 19,886 | | 19,450 | | 19,792 |
Property management expenses | | 1,901 | | 2,062 | | 1,813 | | 2,027 | | 1,661 |
General and administrative expenses | | 3,113 | | 3,538 | | 3,107 | | 2,633 | | 2,578 |
Depreciation and amortization expense | | 13,434 | | 12,721 | | 12,447 | | 11,631 | | 10,783 |
Casualty related costs | | — | | — | | — | | 46 | | — |
Total expenses | | 38,994 | | 38,393 | | 37,253 | | 35,787 | | 34,814 |
Interest expense | | (9,783) | | (9,849) | | (9,721) | | (9,943) | | (9,129) |
Net gains (losses) on sale of assets | | 2,390 | | 12,142 | | — | | 10,650 | | — |
Net income (loss) | | 4,912 | | 14,856 | | 2,566 | | 14,729 | | 4,836 |
(Income) loss allocated to noncontrolling interests | | (49) | | (147) | | (26) | | (149) | | (49) |
Net income (loss) available to common shares | | $4,863 | | $14,709 | | $2,540 | | $14,580 | | $4,787 |
EPS - basic | | $0.05 | | $0.16 | | $0.03 | | $0.16 | | $0.05 |
Weighted-average shares outstanding - Basic | | 90,027,540 | | 89,513,105 | | 88,989,450 | | 88,651,266 | | 87,702,078 |
EPS - diluted | | $0.05 | | $0.16 | | $0.03 | | $0.16 | | $0.05 |
Weighted-average shares outstanding - Diluted | | 90,691,368 | | 90,019,909 | | 89,516,224 | | 89,032,952 | | 88,046,311 |
Funds From Operations (FFO): | | | | | | | | | | |
Net Income (loss) | | $4,912 | | $14,856 | | $2,566 | | $14,729 | | $4,836 |
Add-Back (Deduct): | | | | | | | | | | |
Real estate depreciation and amortization | | 13,313 | | 12,675 | | 12,318 | | 11,577 | | 10,738 |
Net (gains) losses on sale of assets excluding debt extinguishment costs | | (5,594) | | (14,171) | | — | | (11,561) | | — |
FFO | | $12,631 | | $13,360 | | $14,884 | | $14,745 | | $15,574 |
FFO per share | | $0.14 | | $0.15 | | $0.17 | | $0.16 | | $0.18 |
CORE Funds From Operations (CFFO): | | | | | | | | | | |
FFO | | $12,631 | | $13,360 | | $14,884 | | $14,745 | | $15,574 |
Add-Back (Deduct): | | | | | | | | | | |
Stock compensation expense | | 692 | | 1,086 | | 622 | | 558 | | 563 |
Amortization of deferred financing costs | | 351 | | 362 | | 339 | | 352 | | 309 |
Other depreciation and amortization | | 121 | | 46 | | 129 | | 54 | | 45 |
Debt extinguishment costs included in net gains (losses) on sale of assets | | 3,204 | | 2,029 | | — | | 911 | | — |
CFFO | | $16,999 | | $16,883 | | $15,974 | | $16,620 | | $16,491 |
CFFO per share | | $0.19 | | $0.19 | | $0.18 | | $0.19 | | $0.19 |
Weighted-average shares and units outstanding | | 90,908,646 | | 90,394,212 | | 89,870,556 | | 89,532,373 | | 88,585,940 |
12
STATEMENTS OF OPERATIONS, FFO & CORE FFO
THREE and NINE MONTHS ENDED SEPTEMBER 30, 2019 and 2018
Dollars in thousands, except per share data
| | For the Three Months Ended September 30, | | For the Nine Months Ended September 30, |
| | 2019 | | 2018 | | 2019 | | 2018 |
Revenue: | | | | | | | | |
Rental and other property revenue | | $51,057 | | $48,644 | | $151,370 | | $140,994 |
Other revenue | | 242 | | 135 | | 425 | | 429 |
Total revenue | | 51,299 | | 48,779 | | 151,795 | | 141,423 |
Expenses: | | | | | | | | |
Property operating expenses | | 20,546 | | 19,792 | | 60,504 | | 56,913 |
Property management expenses | | 1,901 | | 1,661 | | 5,776 | | 4,936 |
General and administrative expenses | | 3,113 | | 2,578 | | 9,758 | | 8,184 |
Depreciation and amortization expense | | 13,434 | | 10,783 | | 38,602 | | 33,590 |
Total expenses | | 38,994 | | 34,814 | | 114,640 | | 103,623 |
Interest expense | | (9,783) | | (9,129) | | (29,353) | | (26,063) |
Other income (expense) | | — | | — | | — | | 144 |
Net gains (losses) on sale of assets | | 2,390 | | — | | 14,532 | | — |
Net income (loss) | | 4,912 | | 4,836 | | 22,334 | | 11,881 |
(Income) loss allocated to noncontrolling interests | | (49) | | (49) | | (222) | | (173) |
Net income (loss) available to common shares | | $4,863 | | $4,787 | | $22,112 | | $11,708 |
EPS - basic | | $0.05 | | $0.05 | | $0.25 | | $0.14 |
Weighted-average shares outstanding - Basic | | 90,027,540 | | 87,702,078 | | 89,513,834 | | 86,559,294 |
EPS - diluted | | $0.05 | | $0.05 | | $0.25 | | $0.13 |
Weighted-average shares outstanding - Diluted | | 90,691,368 | | 88,046,311 | | 90,234,840 | | 86,818,337 |
| | | | | | | | |
Funds From Operations (FFO): | | | | | | | | |
Net Income (loss) | | $4,912 | | $4,836 | | $22,334 | | $11,881 |
Adjustments: | | | | | | | | |
Real estate depreciation and amortization | | 13,313 | | 10,738 | | 38,306 | | 33,489 |
Net (gains) losses on sale of assets excluding debt extinguishment costs | | (5,594) | | — | | (19,765) | | — |
Funds From Operations | | $12,631 | | $15,574 | | $40,875 | | $45,370 |
FFO per share | | $0.14 | | $0.18 | | $0.45 | | $0.52 |
Core Funds From Operations (CFFO): | | | | | | | | |
Funds From Operations | | $12,631 | | $15,574 | | $40,875 | | $45,370 |
Adjustments: | | | | | | | | |
Stock compensation expense | | 692 | | 563 | | 2,400 | | 1,966 |
Amortization of deferred financing costs | | 351 | | 309 | | 1,052 | | 1,078 |
Other depreciation and amortization | | 121 | | 45 | | 296 | | 101 |
Other expense (income) | | — | | — | | — | | (52) |
Debt extinguishment costs included in net gains (losses) on sale of assets | | 3,204 | | — | | 5,233 | | — |
Core Funds From Operations | | $16,999 | | $16,491 | | $49,856 | | $48,463 |
CFFO per share | | $0.19 | | $0.19 | | $0.55 | | $0.55 |
Weighted-average shares and units outstanding | | 90,908,646 | | 88,585,940 | | 90,394,941 | | 87,870,135 |
13
ADJUSTED EBITDA RECONCILIATION AND COVERAGE RATIO
Dollars in thousands
| | Three Months Ended | |
ADJUSTED EBITDA: | | September 30, 2019 | | June 30, 2019 | | March 31, 2019 | | December 31, 2018 | | September 30, 2018 | |
Net income (loss) | | $4,912 | | $14,856 | | $2,566 | | $14,729 | | $4,836 | |
Add-Back (Deduct): | | | | | | | | | | | |
Depreciation and amortization | | 13,434 | | 12,721 | | 12,447 | | 11,631 | | 10,783 | |
Interest expense | | 9,783 | | 9,849 | | 9,721 | | 9,943 | | 9,129 | |
Net (gains) losses on sale of assets | | (2,390) | | (12,142) | | — | | (10,650) | | — | |
Adjusted EBITDA | | $25,739 | | $25,284 | | $24,734 | | $25,653 | | $24,748 | |
| | | | | | | | | | | |
INTEREST COST: | | | | | | | | | | | |
Interest expense | | $9,783 | | $9,849 | | $9,721 | | $9,943 | | $9,129 | |
| | | | | | | | | | | |
INTEREST COVERAGE: | | 2.6x | | 2.6x | | 2.5x | | 2.6x | | 2.7x | |
| | | | | | | | | | | |
| | | | | | | | |
| | For the Three Months Ended September 30, | | For the Nine Months Ended September 30, |
ADJUSTED EBITDA: | | 2019 | | 2018 | | 2019 | | 2018 |
Net income (loss) | | $4,912 | | $4,836 | | $22,334 | | $11,881 |
Add-Back (Deduct): | | | | | | | | |
Depreciation and amortization | | 13,434 | | 10,783 | | 38,602 | | 33,590 |
Interest expense | | 9,783 | | 9,129 | | 29,353 | | 26,063 |
Other (income) expense | | — | | — | | — | | (52) |
Net (gains) losses on sale of assets | | (2,390) | | — | | (14,532) | | — |
Adjusted EBITDA | | $25,739 | | $24,748 | | $75,757 | | $71,482 |
| | | | | | | | |
INTEREST COST: | | | | | | | | |
Interest expense | | $9,783 | | $9,129 | | $29,353 | | $26,063 |
| | | | | | | | |
INTEREST COVERAGE: | | 2.6x | | 2.7x | | 2.6x | | 2.7x |
| | | | | | | | |
| | | | | | | | |
14
SAME STORE PORTFOLIO NET OPERATING INCOME
TRAILING FIVE QUARTERS
Dollars in thousands, except per unit data
| | For the Three-Months Ended (a) |
| | September 30, 2019 | | June 30, 2019 | | March 31, 2019 | | December 31, 2018 | | September 30, 2018 |
Revenue: | | | | | | | | | | |
Rental and other property revenue | | $43,686 | | $43,064 | | $41,530 | | $40,693 | | $40,975 |
Property Operating Expenses: | | | | | | | | | | |
Real estate taxes | | 5,299 | | 5,380 | | 5,355 | | 5,218 | | 4,749 |
Property insurance | | 865 | | 841 | | 831 | | 817 | | 820 |
Personnel expenses | | 4,282 | | 4,096 | | 3,937 | | 3,931 | | 4,188 |
Utilities | | 2,860 | | 2,612 | | 2,676 | | 2,600 | | 2,621 |
Repairs and maintenance | | 1,812 | | 1,778 | | 1,279 | | 1,078 | | 1,714 |
Contract services | | 1,099 | | 1,190 | | 1,163 | | 1,160 | | 1,223 |
Advertising expenses | | 466 | | 474 | | 422 | | 373 | | 460 |
Other expenses | | 585 | | 591 | | 617 | | 430 | | 772 |
Total property operating expenses | | 17,268 | | 16,962 | | 16,280 | | 15,607 | | 16,547 |
Same-store net operating income (a) | | $26,418 | | $26,102 | | $25,250 | | $25,086 | | $24,428 |
Same-store NOI margin | | 60.5% | | 60.6% | | 60.8% | | 61.6% | | 59.6% |
Average occupancy | | 93.4% | | 94.1% | | 92.5% | | 92.0% | | 93.4% |
Average effective monthly rent, per unit | | $1,078 | | $1,057 | | $1,039 | | $1,034 | | $1,020 |
Reconciliation of same-store net operating income to net income (loss) | | | | | | | | | | |
Same-store net operating income | | $26,418 | | $26,102 | | $25,250 | | $25,086 | | $24,428 |
Non same-store net operating income | | 4,093 | | 4,674 | | 4,329 | | 5,182 | | 4,424 |
Other revenue | | 242 | | 108 | | 75 | | 91 | | 135 |
Property management expenses | | (1,901) | | (2,062) | | (1,813) | | (2,027) | | (1,661) |
General and administrative expenses | | (3,113) | | (3,538) | | (3,107) | | (2,633) | | (2,578) |
Depreciation and amortization expense | | (13,434) | | (12,721) | | (12,447) | | (11,631) | | (10,783) |
Casualty related costs | | — | | — | | — | | (46) | | — |
Interest expense | | (9,783) | | (9,849) | | (9,721) | | (9,943) | | (9,129) |
Net gains (losses) on sale of assets | | 2,390 | | 12,142 | | — | | 10,650 | | — |
Net income (loss) | | $4,912 | | $14,856 | | $2,566 | | $14,729 | | $4,836 |
(a) | Same store portfolio consists of 49 properties, which represent 13,397 units. |
15
SAME STORE PORTFOLIO NET OPERATING INCOME
THREE and NINE MONTHS ENDED SEPTEMBER 30, 2019 and 2018
Dollars in thousands, except per unit data
| | For the Three Months Ended September 30, | | For the Nine Months Ended September 30, |
| | 2019 | | 2018 | | % change | | 2019 | | 2018 | | % change |
Revenue: | | | | | | | | | | | |
Rental and other property revenue | | $43,686 | | $40,975 | | 6.6% | | $128,280 | | $121,626 | | 5.5% |
Property Operating Expenses: | | | | | | | | | | | |
Real estate taxes | | 5,299 | | 4,749 | | 11.6% | | 16,034 | | 14,592 | | 9.9% |
Property insurance | | 865 | | 820 | | 5.5% | | 2,537 | | 2,626 | | -3.4% |
Personnel expenses | | 4,282 | | 4,188 | | 2.2% | | 12,315 | | 12,176 | | 1.1% |
Utilities | | 2,860 | | 2,621 | | 9.1% | | 8,148 | | 7,803 | | 4.4% |
Repairs and maintenance | | 1,812 | | 1,714 | | 5.7% | | 4,869 | | 4,357 | | 11.8% |
Contract services | | 1,099 | | 1,223 | | -10.1% | | 3,452 | | 3,709 | | -6.9% |
Advertising expenses | | 466 | | 460 | | 1.3% | | 1,362 | | 1,363 | | -0.1% |
Other expenses | | 585 | | 772 | | -24.2% | | 1,793 | | 2,330 | | -23.0% |
Total property operating expenses | | 17,268 | | 16,547 | | 4.4% | | 50,510 | | 48,956 | | 3.2% |
Same-store net operating income (a) | | $26,418 | | $24,428 | | 8.1% | | $77,770 | | $72,670 | | 7.0% |
Same-store NOI margin | | 60.5% | | 59.6% | | 0.9% | | 60.6% | | 59.7% | | 0.9% |
Average occupancy | | 93.4% | | 93.4% | | 0.0% | | 93.3% | | 93.7% | | -0.4% |
Average effective monthly rent, per unit | | $1,078 | | $1,020 | | 5.7% | | $1,058 | | $1,005 | | 5.2% |
Reconciliation of same-store net operating income to net income (loss) | | | | | | | | | | | | |
Same-store portfolio net operating income | | $26,418 | | $24,428 | | | | $77,770 | | $72,670 | | |
Non same-store net operating income | | 4,093 | | 4,424 | | | | 13,096 | | 11,411 | | |
Other revenue | | 242 | | 135 | | | | 425 | | 429 | | |
Property management expenses | | (1,901) | | (1,661) | | | | (5,776) | | (4,936) | | |
General and administrative expenses | | (3,113) | | (2,578) | | | | (9,758) | | (8,184) | | |
Depreciation and amortization expense | | (13,434) | | (10,783) | | | | (38,602) | | (33,590) | | |
Interest expense | | (9,783) | | (9,129) | | | | (29,353) | | (26,063) | | |
Other income (expense) | | — | | — | | | | — | | 144 | | |
Net gains (losses) on sale of assets | | 2,390 | | — | | | | 14,532 | | — | | |
Net income (loss) | | $4,912 | | $4,836 | | | | $22,334 | | $11,881 | | |
(a) | Same store portfolio consists of 49 properties, which represent 13,397 units. |
16
NET OPERATING INCOME (NOI) BRIDGE
TRAILING FIVE QUARTERS
Dollars in thousands
| | For the Three-Months Ended |
| | September 30, 2019 | | June 30, 2019 | | March 31, 2019 | | December 31, 2018 | | September 30, 2018 |
Rental and other property revenue | | | | | | | | | | |
Same store (a) | | $43,686 | | $43,064 | | $41,530 | | $40,693 | | $40,975 |
Non same-store | | 7,371 | | 7,784 | | 7,935 | | 8,666 | | 7,433 |
Total rental and other property revenue (b) | | 51,057 | | 50,848 | | 49,465 | | 49,359 | | 48,408 |
Property operating expenses | | | | | | | | | | |
Same store (a) | | 17,268 | | 16,962 | | 16,280 | | 15,607 | | 16,547 |
Non same-store | | 3,278 | | 3,110 | | 3,606 | | 3,484 | | 3,009 |
Total property operating expenses (b) | | 20,546 | | 20,072 | | 19,886 | | 19,091 | | 19,556 |
Net operating income | | | | | | | | | | |
Same-store (a) | | 26,418 | | 26,102 | | 25,250 | | 25,086 | | 24,428 |
Non same-store | | 4,093 | | 4,674 | | 4,329 | | 5,182 | | 4,424 |
Total property net operating income | | $30,511 | | $30,776 | | $29,579 | | $30,268 | | $28,852 |
Reconciliation of NOI to net income (loss) | | | | | | | | | | |
Total property net operating income | | $30,511 | | $30,776 | | $29,579 | | $30,268 | | $28,852 |
Other revenue | | 242 | | 108 | | 75 | | 91 | | 135 |
Property management expenses | | (1,901) | | (2,062) | | (1,813) | | (2,027) | | (1,661) |
General and administrative expenses | | (3,113) | | (3,538) | | (3,107) | | (2,633) | | (2,578) |
Depreciation and amortization expense | | (13,434) | | (12,721) | | (12,447) | | (11,631) | | (10,783) |
Interest expense | | (9,783) | | (9,849) | | (9,721) | | (9,943) | | (9,129) |
Casualty related costs | | — | | — | | — | | (46) | | — |
Net gains (losses) on sale of assets | | 2,390 | | 12,142 | | — | | 10,650 | | — |
Net income (loss) | | $4,912 | | $14,856 | | $2,566 | | $14,729 | | $4,836 |
(a) | Same store portfolio consists of 49 properties, which represent 13,397 units. |
(b) | Effective January 1, 2019, in connection with the adoption of ASC 842 “Leases”, IRT began recording uncollectible rent revenue as an adjustment to rental and other property revenue whereas it was previously recorded within property operating expenses. The presentation in accordance with ASC 842 is prospective for periods ending after January 1, 2019, not retrospective for all periods presented. For purposes of same store comparability only, IRT has adjusted prior periods within the table above and all same store NOI tables to be consistent with this current presentation. The amounts reclassified from property operating expenses to rental and other property revenue for the quarters ended December 31, 2018 and September 30, 2018, were $359, and $236, respectively. |
17
SAME-STORE PORTFOLIO NET OPERATING INCOME BY MARKET
THREE MONTHS ENDED SEPTEMBER 30, 2019 and 2018
Dollars in thousands, except rent per unit
| | | | | | Rental and Other Property Revenue | | Property Operating Expenses | | Net Operating Income | | Average Occupancy | | Average Effective Monthly Rent per Unit |
Market | | Number of Properties | | Units | | 2019 | | 2018 | | % Change | | 2019 | | 2018 | | % Change | | 2019 | | 2018 | | % Change | | 2019 | | 2018 | | % Change | | 2019 | | 2018 | | % Change |
Atlanta, GA | | 4 | | 1,536 | | $5,503 | | $4,980 | | 10.5% | | $1,945 | | $1,691 | | 15.0% | | $3,558 | | $3,289 | | 8.2% | | 93.4% | | 91.9% | | 1.5% | | $1,208 | | $1,119 | | 8.0% |
Raleigh - Durham, NC | | 5 | | 1,372 | | 5,013 | | 4,556 | | 10.0% | | 1,838 | | 1,749 | | 5.1% | | 3,175 | | 2,807 | | 13.1% | | 94.1% | | 91.4% | | 2.7% | | 1,199 | | 1,113 | | 7.7% |
Louisville, KY | | 6 | | 1,710 | | 5,159 | | 4,793 | | 7.6% | | 2,132 | | 2,113 | | 0.9% | | 3,027 | | 2,680 | | 12.9% | | 90.2% | | 89.7% | | 0.5% | | 1,004 | | 957 | | 4.9% |
Memphis, TN | | 4 | | 1,383 | | 4,701 | | 4,501 | | 4.4% | | 1,760 | | 1,779 | | -1.1% | | 2,941 | | 2,722 | | 8.0% | | 92.3% | | 96.0% | | -3.7% | | 1,143 | | 1,059 | | 8.0% |
Oklahoma City, OK | | 5 | | 1,658 | | 3,424 | | 3,233 | | 5.9% | | 1,474 | | 1,466 | | 0.5% | | 1,950 | | 1,767 | | 10.4% | | 95.1% | | 95.1% | | 0.0% | | 671 | | 650 | | 3.3% |
Columbus, OH | | 4 | | 1,080 | | 3,350 | | 3,051 | | 9.8% | | 1,480 | | 1,350 | | 9.6% | | 1,870 | | 1,701 | | 9.9% | | 92.8% | | 92.6% | | 0.2% | | 1,031 | | 967 | | 6.6% |
Indianapolis, IN | | 4 | | 916 | | 2,849 | | 2,682 | | 6.2% | | 1,278 | | 1,174 | | 8.9% | | 1,571 | | 1,508 | | 4.2% | | 94.1% | | 95.2% | | -1.1% | | 1,014 | | 964 | | 5.2% |
Dallas, TX | | 3 | | 734 | | 2,687 | | 2,585 | | 3.9% | | 1,184 | | 1,163 | | 1.8% | | 1,503 | | 1,422 | | 5.7% | | 95.2% | | 95.8% | | -0.6% | | 1,206 | | 1,164 | | 3.6% |
Myrtle Beach, SC - Wilmington, NC | | 3 | | 628 | | 2,001 | | 1,806 | | 10.8% | | 638 | | 613 | | 4.1% | | 1,363 | | 1,193 | | 14.2% | | 95.4% | | 95.6% | | -0.2% | | 1,053 | | 939 | | 12.1% |
Charleston, SC | | 2 | | 518 | | 2,100 | | 2,108 | | -0.4% | | 972 | | 945 | | 2.9% | | 1,128 | | 1,163 | | -3.0% | | 92.9% | | 95.0% | | -2.1% | | 1,314 | | 1,302 | | 1.0% |
Orlando, FL | | 1 | | 297 | | 1,329 | | 1,307 | | 1.7% | | 476 | | 468 | | 1.7% | | 853 | | 839 | | 1.7% | | 94.7% | | 96.1% | | -1.5% | | 1,488 | | 1,449 | | 2.7% |
Charlotte, NC | | 1 | | 208 | | 1,046 | | 964 | | 8.5% | | 359 | | 349 | | 2.9% | | 687 | | 615 | | 11.7% | | 96.2% | | 94.0% | | 2.2% | | 1,573 | | 1,495 | | 5.2% |
Asheville, NC | | 1 | | 252 | | 880 | | 850 | | 3.5% | | 264 | | 246 | | 7.3% | | 616 | | 604 | | 2.0% | | 96.4% | | 97.3% | | -0.8% | | 1,152 | | 1,113 | | 3.5% |
Tampa-St. Petersburg, FL | | 1 | | 216 | | 859 | | 786 | | 9.3% | | 298 | | 282 | | 5.7% | | 561 | | 504 | | 11.3% | | 96.9% | | 93.9% | | 3.0% | | 1,265 | | 1,226 | | 3.1% |
Chattanooga, TN | | 2 | | 295 | | 893 | | 892 | | 0.1% | | 425 | | 437 | | -2.7% | | 468 | | 455 | | 2.9% | | 95.7% | | 96.4% | | -0.7% | | 980 | | 964 | | 1.7% |
St. Louis, MO | | 1 | | 152 | | 716 | | 735 | | -2.6% | | 254 | | 265 | | -4.2% | | 462 | | 470 | | -1.7% | | 95.0% | | 95.9% | | -0.8% | | 1,472 | | 1,424 | | 3.4% |
Huntsville, AL | | 1 | | 178 | | 556 | | 523 | | 6.3% | | 197 | | 193 | | 2.1% | | 359 | | 330 | | 8.8% | | 97.9% | | 97.8% | | 0.1% | | 974 | | 905 | | 7.7% |
Baton Rouge, LA | | 1 | | 264 | | 620 | | 623 | | -0.5% | | 294 | | 264 | | 11.4% | | 326 | | 359 | | -9.2% | | 80.9% | | 79.7% | | 1.3% | | 901 | | 931 | | -3.2% |
Total/Weighted Average | | 49 | | 13,397 | | $43,686 | | $40,975 | | 6.6% | | $17,268 | | $16,547 | | 4.4% | | $26,418 | | $24,428 | | 8.1% | | 93.4% | | 93.4% | | 0.0% | | $1,078 | | $1,020 | | 5.7% |
18
SAME-STORE PORTFOLIO NET OPERATING INCOME BY MARKET
NINE MONTHS ENDED SEPTEMBER 30, 2019 and 2018
Dollars in thousands, except rent per unit
| | | | | | Rental and Other Property Revenue | | Property Operating Expenses | | Net Operating Income | | Average Occupancy | | Average Effective Monthly Rent per Unit |
Market | | Number of Properties | | Units | | 2019 | | 2018 | | % Change | | 2019 | | 2018 | | % Change | | 2019 | | 2018 | | % Change | | 2019 | | 2018 | | % Change | | 2019 | | 2018 | | % Change |
Atlanta, GA | | 4 | | 1,536 | | $16,164 | | $14,795 | | 9.3% | | $5,802 | | $5,074 | | 14.3% | | $10,362 | | $9,721 | | 6.6% | | 93.9% | | 93.3% | | 0.6% | | $1,182 | | $1,094 | | 8.1% |
Raleigh - Durham, NC | | 5 | | 1,372 | | 14,603 | | 13,576 | | 7.6% | | 5,466 | | 5,244 | | 4.2% | | 9,137 | | 8,332 | | 9.7% | | 93.6% | | 91.9% | | 1.7% | | 1,168 | | 1,105 | | 5.7% |
Louisville, KY | | 6 | | 1,710 | | 15,203 | | 14,608 | | 4.1% | | 6,117 | | 6,181 | | -1.0% | | 9,086 | | 8,427 | | 7.8% | | 90.3% | | 91.3% | | -1.0% | | 989 | | 953 | | 3.8% |
Memphis, TN | | 4 | | 1,383 | | 13,792 | | 13,270 | | 3.9% | | 5,174 | | 5,459 | | -5.2% | | 8,618 | | 7,811 | | 10.3% | | 92.5% | | 96.1% | | -3.6% | | 1,114 | | 1,036 | | 7.5% |
Oklahoma City, OK | | 5 | | 1,658 | | 10,172 | | 9,640 | | 5.5% | | 4,222 | | 4,307 | | -2.0% | | 5,950 | | 5,333 | | 11.6% | | 95.2% | | 94.5% | | 0.7% | | 666 | | 644 | | 3.4% |
Columbus, OH | | 4 | | 1,080 | | 9,613 | | 9,066 | | 6.0% | | 4,142 | | 3,936 | | 5.2% | | 5,471 | | 5,130 | | 6.6% | | 91.4% | | 94.2% | | -2.8% | | 1,012 | | 949 | | 6.6% |
Indianapolis, IN | | 4 | | 916 | | 8,362 | | 7,939 | | 5.3% | | 3,617 | | 3,346 | | 8.1% | | 4,745 | | 4,593 | | 3.3% | | 94.5% | | 95.0% | | -0.4% | | 995 | | 949 | | 4.9% |
Dallas, TX | | 3 | | 734 | | 8,038 | | 7,789 | | 3.2% | | 3,464 | | 3,302 | | 4.9% | | 4,574 | | 4,487 | | 1.9% | | 96.0% | | 96.1% | | -0.1% | | 1,190 | | 1,157 | | 2.9% |
Myrtle Beach, SC - Wilmington, NC | | 3 | | 628 | | 5,793 | | 5,200 | | 11.4% | | 1,902 | | 1,765 | | 7.8% | | 3,891 | | 3,435 | | 13.3% | | 94.6% | | 95.4% | | -0.9% | | 1,012 | | 903 | | 12.0% |
Charleston, SC | | 2 | | 518 | | 6,242 | | 6,254 | | -0.2% | | 2,883 | | 2,816 | | 2.4% | | 3,359 | | 3,438 | | -2.3% | | 94.0% | | 94.9% | | -0.9% | | 1,291 | | 1,299 | | -0.6% |
Orlando, FL | | 1 | | 297 | | 3,962 | | 3,853 | | 2.8% | | 1,428 | | 1,364 | | 4.7% | | 2,534 | | 2,489 | | 1.8% | | 96.2% | | 96.1% | | 0.1% | | 1,468 | | 1,425 | | 3.0% |
Charlotte, NC | | 1 | | 208 | | 3,057 | | 2,812 | | 8.7% | | 1,076 | | 1,004 | | 7.2% | | 1,981 | | 1,808 | | 9.6% | | 95.5% | | 93.4% | | 2.1% | | 1,544 | | 1,454 | | 6.2% |
Asheville, NC | | 1 | | 252 | | 2,603 | | 2,499 | | 4.2% | | 803 | | 798 | | 0.6% | | 1,800 | | 1,701 | | 5.8% | | 96.9% | | 96.8% | | 0.1% | | 1,131 | | 1,089 | | 3.9% |
Tampa-St. Petersburg, FL | | 1 | | 216 | | 2,490 | | 2,375 | | 4.8% | | 943 | | 919 | | 2.6% | | 1,547 | | 1,456 | | 6.3% | | 95.6% | | 93.6% | | 2.0% | | 1,248 | | 1,226 | | 1.8% |
Chattanooga, TN | | 2 | | 295 | | 2,617 | | 2,623 | | -0.2% | | 1,269 | | 1,288 | | -1.5% | | 1,348 | | 1,335 | | 1.0% | | 95.3% | | 96.3% | | -1.0% | | 974 | | 960 | | 1.4% |
St. Louis, MO | | 1 | | 152 | | 2,122 | | 2,133 | | -0.5% | | 753 | | 792 | | -4.9% | | 1,369 | | 1,341 | | 2.1% | | 94.5% | | 94.6% | | -0.1% | | 1,459 | | 1,399 | | 4.3% |
Huntsville, AL | | 1 | | 178 | | 1,633 | | 1,515 | | 7.8% | | 584 | | 576 | | 1.4% | | 1,049 | | 939 | | 11.7% | | 97.7% | | 97.7% | | 0.0% | | 954 | | 878 | | 8.6% |
Baton Rouge, LA | | 1 | | 264 | | 1,814 | | 1,679 | | 8.0% | | 865 | | 785 | | 10.2% | | 949 | | 894 | | 6.2% | | 77.2% | | 70.4% | | 6.8% | | 913 | | 911 | | 0.2% |
Total/Weighted Average | | 49 | | 13,397 | | $128,280 | | $121,626 | | 5.5% | | $50,510 | | $48,956 | | 3.2% | | $77,770 | | $72,670 | | 7.0% | | 93.3% | | 93.7% | | -0.4% | | $1,058 | | $1,005 | | 5.2% |
19
TOTAL PORTFOLIO NOI EXPOSURE BY MARKET
Dollars in thousands, except rent per unit
| | | | | | | | | | For the Three Months Ended September 30, 2019 |
Market | | Number of Properties | | Units | | Gross Real Estate Assets | | Period End Occupancy | | Average Effective Monthly Rent per Unit | | Net Operating Income (b) | | % of NOI |
Atlanta, GA | | 6 | | 2,020 | | $253,062 | | 93.4% | | $1,163 | | $4,495 | | 14.8% |
Raleigh - Durham, NC | | 5 | | 1,372 | | 190,618 | | 92.8% | | 1,199 | | 3,175 | | 10.4% |
Louisville, KY | | 6 | | 1,710 | | 196,882 | | 88.9% | | 1,004 | | 3,027 | | 10.0% |
Memphis, TN | | 4 | | 1,383 | | 144,311 | | 90.5% | | 1,143 | | 2,941 | | 9.7% |
Columbus, OH | | 6 | | 1,547 | | 152,162 | | 92.5% | | 1,011 | | 2,603 | | 8.6% |
Tampa-St. Petersburg, FL | | 4 | | 1,104 | | 171,537 | | 90.2% | | 1,212 | | 2,331 | | 7.7% |
Oklahoma City, OK | | 5 | | 1,658 | | 77,369 | | 96.2% | | 671 | | 1,950 | | 6.4% |
Indianapolis, IN | | 4 | | 916 | | 91,010 | | 94.4% | | 1,014 | | 1,571 | | 5.2% |
Dallas, TX | | 3 | | 734 | | 86,952 | | 94.8% | | 1,206 | | 1,503 | | 4.9% |
Myrtle Beach, SC - Wilmington, NC | | 3 | | 628 | | 63,301 | | 93.3% | | 1,053 | | 1,363 | | 4.5% |
Charleston, SC | | 2 | | 518 | | 79,852 | | 94.0% | | 1,314 | | 1,128 | | 3.7% |
Orlando, FL | | 1 | | 297 | | 48,613 | | 93.9% | | 1,488 | | 853 | | 2.8% |
Charlotte, NC | | 1 | | 208 | | 42,139 | | 95.7% | | 1,573 | | 687 | | 2.3% |
Asheville, NC | | 1 | | 252 | | 28,615 | | 97.6% | | 1,152 | | 615 | | 2.0% |
Austin, TX (a) | | 1 | | 300 | | 36,230 | | 93.0% | | 1,329 | | 556 | | 1.8% |
Chattanooga, TN | | 2 | | 295 | | 27,195 | | 97.6% | | 980 | | 467 | | 1.5% |
St. Louis, MO | | 1 | | 152 | | 33,548 | | 92.8% | | 1,472 | | 463 | | 1.5% |
Huntsville, AL | | 1 | | 178 | | 16,422 | | 98.3% | | 974 | | 359 | | 1.2% |
Baton Rouge, LA | | 1 | | 264 | | 28,804 | | 84.9% | | 901 | | 326 | | 1.1% |
Total/Weighted Average | | 57 | | 15,536 | | $1,768,622 | | 92.8% | | $1,084 | | $30,413 | | 100.0% |
| | | | | | | | | | | | | | |
(a) | Market includes one property which was classified as held for sale as of September 30, 2019. |
(b) | Excludes net operating income related to sold properties. |
20
VALUE ADD SUMMARY
PROJECT LIFE TO DATE AS OF SEPTEMBER 30, 2019
| | | | | | | Renovation Costs per Unit (b) | | |
Property | Market | Total Units To Be Renovated | Units Complete | Units Leased | Rent Premium (a) | % Rent Increase | Interior | Exterior | Total | ROI - Interior Costs(c) | ROI - Total Costs (d) |
| | | | | | | | | | | |
Phase 1 | | | | | | | | | | | |
Jamestown | Louisville, KY | 356 | 186 | 201 | $275 | 33.0% | $16,881 | $5,161 | $22,042 | 19.5% | 15.0% |
The Village at Auburn | Raleigh-Durham, NC | 328 | 266 | 239 | 175 | 17.0% | 14,217 | 2,248 | 16,465 | 14.8% | 12.8% |
Pointe at Canyon Ridge | Atlanta, GA | 494 | 317 | 281 | 181 | 18.8% | 8,712 | 1,802 | 10,514 | 24.9% | 20.6% |
Haverford | Lexington, KY | 160 | 111 | 111 | 81 | 9.6% | 5,181 | 849 | 6,029 | 18.9% | 16.2% |
Crestmont | Atlanta, GA | 208 | 179 | 177 | 145 | 15.6% | 12,341 | 8,963 | 21,304 | 14.1% | 8.2% |
Total/Weighted Average | | 1,546 | 1,059 | 1,009 | $181 | 19.6% | $11,891 | $3,728 | $15,620 | 18.3% | 13.9% |
| | | | | | | | | | | |
Phase 2 | | | | | | | | | | | |
Oxmoor | Louisville, KY | 432 | 219 | 199 | $204 | 22.9% | $15,969 | $202 | $16,171 | 15.3% | 15.2% |
Brunswick Point | Wilmington, NC | 288 | 164 | 136 | 91 | 9.4% | 6,561 | 170 | 6,731 | 16.7% | 16.3% |
Schirm Farms | Columbus, OH | 264 | 171 | 160 | 82 | 9.6% | 7,684 | 588 | 8,271 | 12.8% | 11.9% |
The Commons at Canal Winchester (e) | Columbus, OH | 264 | 97 | 81 | 192 | 22.2% | 9,723 | 520 | 10,244 | 23.6% | 22.4% |
Creekside Corners | Atlanta, GA | 444 | 222 | 212 | 177 | 18.9% | 8,813 | 1,325 | 10,139 | 24.0% | 20.9% |
Stonebridge Crossing | Memphis, TN | 500 | 278 | 241 | 133 | 15.8% | 9,436 | 1,069 | 10,504 | 17.0% | 15.2% |
Arbors River Oaks | Memphis, TN | 191 | 90 | 80 | 227 | 19.6% | 8,780 | 632 | 9,412 | 31.0% | 28.9% |
Total/Weighted Average | | 2,383 | 1,241 | 1,109 | $153 | 16.7% | $9,858 | $711 | $10,569 | 18.6% | 17.3% |
| | | | | | | | | | | |
Phase 3 | | | | | | | | | | | |
Vantage at Hillsborough | Tampa, FL | 348 | 33 | 45 | $202 | 19.7% | $12,958 | $1,916 | $14,874 | 18.7% | 16.3% |
Lucerne | Tampa, FL | 276 | 31 | 26 | 230 | 20.3% | 13,141 | 1,424 | 14,565 | 21.0% | 18.9% |
Rocky Creek (f) | Tampa, FL | 264 | - | - | - | - | - | - | - | - | - |
North Park (f) | Atlanta, GA | 224 | - | - | - | - | - | - | - | - | - |
Waterford Landing (f) | Atlanta, GA | 260 | - | - | - | - | - | - | - | - | - |
Meadows (f) | Louisville, KY | 400 | - | - | - | - | - | - | - | - | - |
Walnut Hill (f) | Memphis, TN | 362 | - | - | - | - | - | - | - | - | - |
Lenoxplace (f) | Raleigh, NC | 268 | - | - | - | - | - | - | - | - | - |
Total/Weighted Average | | 2,402 | 64 | 71 | $212 | 19.9% | $13,025 | $1,735 | $14,761 | 19.5% | 17.2% |
| | | | | | | | | | | |
Grand Total/Weighted Average | | 6,331 | 2,364 | 2,189 | $168 | 18.2% | $10,898 | $1,800 | $12,698 | 18.5% | 15.8% |
| (a) | The rent premium reflects the per unit per month difference between the rental rate on the renovated unit and the market rent for an unrenovated unit as of the date presented, as determined by management consistent with its customary rent-setting and evaluation procedures. |
| (b) | Includes all costs to renovate the interior units and make certain exterior renovations, including clubhouses and amenities. Interior costs per unit are based on units leased. Exterior costs per unit are based on total units at the community. Excludes internal costs to support and manage the value add program as those costs relate to the entire program and cannot be allocated to individual projects. |
| (c) | Calculated using the rent premium per unit per month, multiplied by 12, divided by the interior renovation costs per unit. |
| (d) | Calculated using the rent premium per unit per month, multiplied by 12, divided by the total renovation costs per unit. |
| (e) | Property was previously known as Kensington Commons. |
| (f) | Renovations at the remaining Phase 3 properties are expected to commence during the remainder of 2019 and the first half of 2020. |
21
CAPITAL RECYCLING
Dollars in thousands with respect to Contract Price and Price per Unit
| | | | | | | | | | | | |
| | | | | | | | | | | | |
Acquisitions to Date 2019 | | Location | | Units | | Acquisition Date | | Contract Price | | Price per Unit | | Average Rent Per Unit |
North Park | | Atlanta, GA | | 224 | | April 30, 2019 | | $28,000 | | $125 | | $990 |
Rocky Creek Apartments | | Tampa, FL | | 264 | | July 11, 2019 | | $48,000 | | $182 | | $1,313 |
Thornhill Apartments (a) | | Raleigh, NC | | 318 | | October 1, 2019 | | $52,925 | | $166 | | $1,113 |
| | | | | | | | | | | | |
Total | | | | 806 | | | | $128,925 | | $160 | | $1,144 |
| | | | | | | | | | | | |
| | | | | | | | | | | | |
| | | | | | | | | | | | |
| | | | | | | | | | | | |
Dispositions to Date 2019 | | Location | | Units | | Disposition Date | | Contract Price | | Price per Unit | | Average Rent Per Unit |
Reserve at Eagle Ridge | | Chicago, IL | | 370 | | April 30, 2019 | | $42,000 | | $114 | | $1,059 |
Carrington Park | | Little Rock, AR | | 202 | | July 18, 2019 | | $26,250 | | $130 | | $1,067 |
Stonebridge at the Ranch | | Little Rock, AR | | 260 | | July 18, 2019 | | $30,250 | | $116 | | $927 |
| | | | | | | | | | | | |
Total | | | | 832 | | | | $98,500 | | $118 | | $1,020 |
| (a) | Transaction closed subsequent to September 30, 2019. |
22
DEBT SUMMARY AS OF SEPTEMBER 30, 2019
Dollars in thousands
| | Amount | | Weighted Average Rate | | Type | | Weighted Average Maturity (in years) | |
Debt: | | | | | | | | | |
Unsecured credit facility (a) | | $156,303 | | 3.5% | | Floating | | 3.6 | |
Unsecured term loans (b) | | 300,000 | | 3.5% | | Floating | | 4.6 | |
Mortgages | | 528,713 | | 3.8% | | Fixed | | 4.3 | |
Unamortized deferred financing costs | | (5,686) | | | | | | | |
Total Debt | | 979,330 | | 3.7% | | | | 4.3 | |
Market Equity Capitalization, at period end | | 1,313,311 | | | | | | | |
Total Capitalization | | $2,292,641 | | | | | | | |
| (a) | Credit facility total capacity is $350,000, comprised entirely of an unsecured revolving line of credit, of which $156,303 was drawn as of September 30, 2019. The maturity date of borrowings under the revolving line of credit is May 9, 2023. |
| (b) | Comprised of a $200,000 unsecured term loan with a maturity date of January 17, 2024 and a $100,000 unsecured term loan with a maturity date of November 20, 2024. |
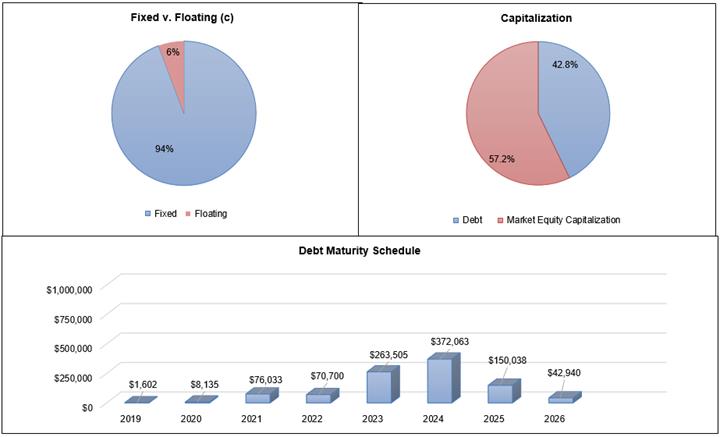
| (c) | As of September 30, 2019, IRT maintained a float-to-fixed interest swap with a $150,000 notional amount. This swap, which expires on June 17, 2021 and has a fixed rate of 1.1325%, has converted $150,000 of floating rate debt to fixed rate debt. IRT also maintains: (1) an interest rate collar with a $100,000 notional amount, which expires on November 20, 2024 has a floor of 1.25% and a cap of 2.00%, and (2) an interest rate collar with a $150,000 notional amount, which expires on January 17, 2024, has a floor of 2.25% and a cap of 2.50%. These collars have converted $250,000 of floating rate debt to fixed rate debt when LIBOR is above the cap rate or below the floor rate. |
Encumbered & Unencumbered Statistics | | | Total Units | | % of Total | | Gross Assets | | % of Total | | Q3 2019 NOI | | % of Total |
Unencumbered assets | | | 8,221 | | 52.9% | | $889,682 | | 48.9% | | $14,633 | | 48.0% |
Encumbered assets | | | 7,315 | | 47.1% | | 931,491 | | 51.1% | | 15,878 | | 52.0% |
| | | 15,536 | | 100.0% | | $1,821,173 | | 100.0% | | $30,511 | | 100.0% |
23
Definitions
Average Effective Monthly Rent per Unit
Average effective rent per unit represents the average of gross rent amounts, divided by the average occupancy (in units) for the period presented. IRT believes average effective rent is a helpful measurement in evaluating average pricing. This metric, when presented, reflects the average effective rent per month.
Average Occupancy
Average occupancy represents the average occupied units for the reporting period divided by the average of total units available for rent for the reporting period.
EBITDA and Adjusted EBITDA
EBITDA is defined as net income before interest expense including amortization of deferred financing costs, income tax expense, and depreciation and amortization expenses. Adjusted EBITDA is EBITDA before certain other non-cash or non-operating gains or losses related to items such as acquisition and integration expenses, asset sales, debt extinguishments and acquisition related debt extinguishment expenses. EBITDA and Adjusted EBITDA are each non-GAAP measures. IRT considers each of EBITDA and Adjusted EBITDA to be an appropriate supplemental measure of performance because it eliminates interest, income taxes, depreciation and amortization, and other non-cash or non-operating gains and losses, which permits investors to view income from operations without these non-cash or non-operating items. IRT’s calculation of Adjusted EBITDA differs from the methodology used for calculating Adjusted EBITDA by certain other REITs and, accordingly, IRT’s Adjusted EBITDA may not be comparable to Adjusted EBITDA reported by other REITs.
Funds From Operations (“FFO”) and Core Funds From Operations (“CFFO”)
IRT believes that FFO and CFFO, each of which is a non-GAAP financial measure, are additional appropriate measures of the operating performance of a REIT and IRT in particular. IRT computes FFO in accordance with the standards established by the National Association of Real Estate Investment Trusts, or NAREIT, as net income or loss (computed in accordance with GAAP), excluding real estate-related depreciation and amortization expense, gains or losses on sales of real estate and the cumulative effect of changes in accounting principles.
CFFO is a computation made by analysts and investors to measure a real estate company’s operating performance by removing the effect of items that do not reflect ongoing property operations, including stock compensation expense, depreciation and amortization of other items not included in FFO, amortization of deferred financing costs, acquisition and integration expenses, and other non-cash or non-operating gains or losses related to items such as defeasance costs IRT incurs when it sells a property subject to secured debt, asset sales, debt extinguishments, and acquisition related debt extinguishment expenses from the determination of FFO.
IRT’s calculation of CFFO differs from the methodology used for calculating CFFO by certain other REITs and, accordingly, IRT’s CFFO may not be comparable to CFFO reported by other REITs. IRT’s management utilizes FFO and CFFO as measures of IRT’s operating performance, and believes they are also useful to investors, because they facilitate an understanding of IRT’s operating performance after adjustment for certain non-cash or non-operating items that are required by GAAP to be expensed but may not necessarily be indicative of current operating performance and that may not accurately compare IRT’s operating performance between periods. Furthermore, although FFO, CFFO and other supplemental performance measures are defined in various ways throughout the REIT industry, IRT believes that FFO and CFFO provide investors with additional useful measures to compare IRT’s financial performance to certain other REITs. Neither FFO nor CFFO is equivalent to net income or cash generated from operating activities determined in accordance with GAAP. Furthermore, FFO and CFFO do not represent amounts available for management’s discretionary use because of needed capital replacement or expansion, debt service obligations or other commitments or uncertainties. Neither FFO nor CFFO should be considered as an alternative to net income as an indicator of IRT’s operating performance or as an alternative to cash flow from operating activities as a measure of IRT’s liquidity.
Interest Coverage
Interest coverage is a ratio computed by dividing Adjusted EBITDA by interest expense.
24
Net Debt
Net debt, a non-GAAP financial measure, equals total debt less cash and cash equivalents. The following table provides a reconciliation of total debt to net debt (Dollars in thousands).
| As of |
| September 30, 2019 | | June 30, 2019 | | March 31, 2019 | | December 31, 2018 | | September 30, 2018 |
Total debt | $979,330 | | $989,499 | | $990,920 | | $985,488 | | $963,238 |
Less: cash and cash equivalents | (6,587) | | (11,060) | | (9,030) | | (9,316) | | (7,645) |
Total net debt | $972,743 | | $978,439 | | $981,890 | | $976,172 | | $955,593 |
| | | | | | | | | |
IRT presents net debt because management believes it is a useful measure of IRT’s credit position and progress toward reducing leverage. The calculation is limited because IRT may not always be able to use cash to repay debt on a dollar for dollar basis.
Net Operating Income
IRT believes that Net Operating Income (“NOI”), a non-GAAP financial measure, is a useful supplemental measure of its operating performance. IRT defines NOI as total property revenues less total property operating expenses, excluding interest expenses, depreciation and amortization, acquisition expenses, property management expenses, and general and administrative expenses. Other REITs may use different methodologies for calculating NOI, and accordingly, IRT’s NOI may not be comparable to other REITs. IRT believes that this measure provides an operating perspective not immediately apparent from GAAP operating income or net income insofar as the measure reflects only operating income and expense at the property level. IRT uses NOI to evaluate performance on a same store and non-same store basis because NOI measures the core operations of property performance by excluding corporate level expenses, financing expenses, and other items not related to property operating performance and captures trends in rental housing and property operating expenses. However, NOI should only be used as an alternative measure of IRT’s financial performance.
Same Store Properties and Same Store Portfolio
IRT reviews its same store portfolio at the beginning of each calendar year. Properties are added into the same store portfolio if they were owned at the beginning of the previous year. Properties that are held-for-sale or have been sold are excluded from the same store portfolio.
Total Gross Assets
Total Gross Assets equals total assets plus accumulated depreciation and accumulated amortization, including fully depreciated or amortized real estate and real estate related assets. The following table provides a reconciliation of total assets to total gross assets (Dollars in thousands).
| As of |
| September 30, 2019 | | June 30, 2019 | | March 31, 2019 | | December 31, 2018 | | September 30, 2018 |
Total assets | $1,653,017 | | $1,655,747 | | $1,655,849 | | $1,659,336 | | $1,648,108 |
Plus: accumulated depreciation (a) | 148,924 | | 141,965 | | 132,448 | | 120,202 | | 114,660 |
Plus: accumulated amortization | 19,232 | | 19,495 | | 19,658 | | 19,198 | | 19,418 |
Total gross assets | $1,821,173 | | $1,817,207 | | $1,807,955 | | $1,798,736 | | $1,782,186 |
| (a) | Includes previously recognized depreciation on properties that were classified as held-for-sale as of September 30, 2019. |