Exhibit 99.2

Talison Row at Daniel Island, South Carolina
EARNINGS RELEASE & SUPPLEMENTAL INFORMATION
Q3 2020
NYSE: IRT
WWW.IRTLIVING.COM

TABLE OF CONTENTS
Company Information | | 3 |
| | |
Forward-Looking Statements | | 4 |
| | |
Earnings Release Text | | 5 |
| | |
Financial & Operating Highlights | | 11 |
| | |
Balance Sheets | | 12 |
| | |
Statements of Operations, FFO & CORE FFO | | |
Trailing Five Quarters | | 13 |
Three and Nine Months Ended September 30, 2020 and 2019 | | 14 |
| | |
Adjusted EBITDA Reconciliations and Coverage Ratio | | |
Trailing Five Quarters | | 15 |
Three and Nine Months Ended September 30, 2020 and 2019 | | 15 |
| | |
Same-Store Portfolio Net Operating Income | | |
Trailing Five Quarters | | 16 |
Three and Nine Months Ended September 30, 2020 and 2019 | | 17 |
| | |
Net Operating Income Bridge | | 18 |
| | |
Same-Store Portfolio Net Operating Income by Market | | |
Three Months Ended September 30, 2020 and 2019 | | 19 |
Nine Months Ended September 30, 2020 and 2019 | | 20 |
| | |
Total Portfolio NOI Exposure by Market | | 21 |
| | |
Value Add Summary | | 22 |
| | |
Capital Recycling Activity | | 23 |
| | |
Debt Summary | | 24 |
| | |
Debt Covenant & Unencumbered Asset Statistics | | 25 |
| | |
Definitions | | 26 |
2
Independence Realty Trust
September 30, 2020
Company Information:
Independence Realty Trust, Inc. (NYSE: IRT) is a real estate investment trust that owns and operates multifamily apartment properties across non-gateway U.S. markets, including Atlanta, Louisville, Memphis, and Raleigh. IRT’s investment strategy is focused on gaining scale within key amenity rich submarkets that offer good school districts, high-quality retail and major employment centers. IRT aims to provide stockholders attractive risk-adjusted returns through diligent portfolio management, strong operational performance, and a consistent return on capital through distributions and capital appreciation. More information may be found on the Company’s website at www.irtliving.com.
Corporate Headquarters | | 1835 Market Street, Suite 2601 |
| | Philadelphia, PA 19103 |
| | 267.270.4800 |
| |
Trading Symbol | | NYSE: “IRT” |
| |
Investor Relations Contact | | Edelman Financial Communications & Capital Markets |
| | Ted McHugh and Lauren Torres |
| | 917-365-7979 |
| | IRT@edelman.com |
| | |
3
Forward-Looking Statements
This supplemental information contains certain forward-looking statements within the meaning of Section 27A of the Securities Act of 1933, as amended, and Section 21E of the Securities Exchange Act of 1934, as amended. Such forward-looking statements can generally be identified by our use of forward-looking terminology such as “will,” “strategy,” “expects,” “seeks,” “believes,” “potential,” or other similar words. These forward-looking statements include, without limitation, our expectations with respect to capital allocations, including as to the timing and amount of future dividends. Because such statements include risks, uncertainties and contingencies, actual results may differ materially from the expectations, intentions, beliefs, plans or predictions of the future expressed or implied by such forward-looking statements. These forward-looking statements are based upon the current beliefs and expectations of our management and are inherently subject to significant business, economic and competitive uncertainties and contingencies, many of which are difficult to predict and generally not within our control. In addition, these forward-looking statements are subject to assumptions with respect to future business strategies and decisions that are subject to change. Risks and uncertainties that might cause our actual results and/or future dividends to differ materially from those expressed or implied by forward-looking statements include, but are not limited to: risks related to the impact of COVID-19 and other potential future outbreaks of infectious diseases on our financial condition, results of operations, cash flows and performance and those of our residents as well as on the economy and real estate and financial markets; changes in market demand for rental apartment homes and pricing pressures, including from competitors, that could limit our ability to lease units or increase rents or that could lead to declines in occupancy and rent levels; uncertainty and volatility in capital and credit markets, including changes that reduce availability, and increase costs, of capital; inability of tenants to meet their rent and other lease obligations and charge-offs in excess of our allowance for bad debt; legislative restrictions that may delay or limit collections of past due rents; risks endemic to real estate and the real estate industry generally; the effects of natural and other disasters; delays in completing, and cost overruns incurred in connection with, our value add initiatives and failure to achieve projected rent increases and occupancy levels on account of the initiatives; unexpected costs of REIT qualification compliance; costs and disruptions as the result of a cybersecurity incident or other technology disruption; and share price fluctuations. Please refer to the documents filed by us with the SEC, including specifically the “Risk Factors” sections of our Form 10-K for the year ended December 31, 2019 and our Quarterly Report on Form 10-Q for the quarter ended March 31, 2020, and our other filings with the SEC, which identify additional factors that could cause actual results to differ from those contained in forward-looking statements. We undertake no obligation to update these forward-looking statements to reflect events or circumstances after the date hereof or to reflect the occurrence of unanticipated events, except as may be required by law. In addition, the declaration of dividends on our common stock is subject to the discretion of our Board of Directors and depends upon a broad range of factors, including our results of operations, financial condition, capital requirements, the annual distribution requirements under the REIT provisions of the Internal Revenue Code of 1986, as amended, applicable legal requirements and such other factors as our Board of Directors may from time to time deem relevant. For these reasons, as well as others, there can be no assurance that dividends in the future will be equal or similar to the expected amount of the quarterly dividend described in this supplemental information.
4
Independence Realty Trust Announces Third Quarter 2020 Financial Results
PHILADELPHIA – (BUSINESS WIRE) – October 28, 2020 — Independence Realty Trust, Inc. (“IRT”) (NYSE: IRT), a multifamily apartment REIT, today announced its third quarter 2020 financial results.
Third Quarter Highlights
| • | Net income available to common shares of $1.1 million for the quarter ended September 30, 2020 compared to $4.9 million for the quarter ended September 30, 2019. |
| • | Earnings per diluted share of $0.01 for the quarter ended September 30, 2020 compared to $0.05 for the quarter ended September 30, 2019. |
| • | Same store net operating income (“NOI”) growth of 0.5% for the quarter ended September 30, 2020 compared to the quarter ended September 30, 2019, supported by average occupancy of 94.0%. |
| • | Core Funds from Operations (“CFFO”) of $19.4 million for the quarter ended September 30, 2020 compared to $17.0 million for the quarter ended September 30, 2019. CFFO per share was $0.20 for the third quarter of 2020, as compared to $0.19 for the quarter ended September 30, 2019. |
| • | Adjusted EBITDA of $27.1 million for the quarter ended September 30, 2020 compared to $25.7 million for the quarter ended September 30, 2019. |
Included later in this press release are definitions of NOI, CFFO, Adjusted EBITDA and other Non-GAAP financial measures and reconciliations of such measures to their most comparable financial measures as calculated and presented in accordance with GAAP.
Management Commentary
“Our quarter and year-to-date 2020 results reflect the continued resiliency of our portfolio and dedication of our team.” said Scott Schaeffer, Chairman and CEO of IRT. “We increased same store portfolio average occupancy on a quarter-over-quarter and year-over-year basis and delivered NOI growth of 0.5% in the third quarter, collecting 98.9% of rents billed and maintaining a conservative reserve for uncollected rents. We remain confident in our strategy, as we look to close out 2020 with positive momentum heading into 2021.”
“IRT is committed to managing our business for long-term success, as evidenced by recent advancements in our value add and capital recycling programs. In the third quarter, we progressed with renovations at 17 of our properties and have taken a proactive approach to acquiring and divesting properties which will better position our portfolio. Our actions support continued efforts to increase our return on investment at existing properties, as well as rotate capital out of non-core markets that offer limited growth potential and into core markets that fit our long-term investment criteria. We are also focused on the strength of our balance sheet, having approximately $217 million in total liquidity at quarter-end.”
Same Store Property Operating Results
| | |
| Third Quarter 2020 Compared to Third Quarter 2019(1) | Nine Months Ended 9/30/20 Compared to Nine Months Ended 9/30/19 (1) |
Rental and other property revenue | 3.0% increase | 3.0% increase |
Property operating expenses | 6.8% increase | 3.6% increase |
Net operating income (“NOI”) | 0.5% increase | 2.6% increase |
Portfolio average occupancy | 40 bps increase to 94.0% | 40 bps decrease to 93.3% |
Portfolio average rental rate | 2.2% increase to $1,106 | 3.7% increase to $1,101 |
NOI Margin | 150 bps decrease to 58.8% | 30 bps decrease to 60.2% |
| (1) | Same store portfolio for the three months ended September 30, 2020 includes 51 properties, which represent 14,189 units. |
5
Same Store Property Operating Results, Excluding Value Add
The same store portfolio results below exclude 16 communities that are both part of the same store portfolio and were actively undergoing Value Add renovations during the three months ended September 30, 2020.
| | |
| Third Quarter 2020 Compared to Third Quarter 2019(1) | Nine Months Ended 9/30/20 Compared to Nine Months Ended 9/30/19 (1) |
Rental and other property revenue | 1.2% increase | 1.9% increase |
Property operating expenses | 6.2% increase | 1.9% increase |
Net operating income (“NOI”) | 2.1% decrease | 1.9% increase |
Portfolio average occupancy | 40 bps decrease to 94.6% | 50 bps decrease to 94.5% |
Portfolio average rental rate | 0.8% increase to $1,084 | 1.9% increase to $1,084 |
NOI Margin | 200 bps decrease to 58.3% | No change – 60.5% |
| (1) | Same store portfolio, excluding value add, for the three months ended September 30, 2020 includes 35 properties, which represent 9,193 units. |
COVID-19 Metrics (1)(2)
(Dollars in thousands, except per unit data)
| | | |
Rent collections | 3Q 2020 | 3Q 2019 | 2Q 2020 |
Rent collected for the period presented, as a percentage of rent billed | 98.8% | 99.1% | 98.2% |
| | | |
Deferred payment plans: (3) | | | |
Number of deferred payment plans originated | 3 | - | 260 |
Amount of monthly rent deferred for period presented | $55 | - | $424 |
Amount of monthly rent deferred for the period presented, as a percentage of rent billed | 0.1% | 0.0% | 0.9% |
| | | |
Combined rent collected and rent subject to deferred payment plans, as a percentage of rent billed | 98.9% | 99.1% | 99.1% |
| (1) | All metrics presented are for our total portfolio in the period presented. |
| (2) | All metrics are based on our internal data, which management uses to monitor property performance on a daily or weekly basis. |
| (3) | Deferred payment plans allow residents to defer between 25% and 75% of their monthly rent for between one and three months. Residents must provide evidence of hardship and commit to a full 12-month lease term, which allows deferred payments to be repaid over a longer remaining lease term. |
During the third quarter of 2020 and as a result of the COVID-19 pandemic, we recorded a $80,000 provision for bad debts. The table below presents additional details on the components of bad debt:
| | | | | | |
Components of Bad Debt (1) | 3Q 2020 | 3Q 2019 | 2Q 2020 |
Amount | Percentage | Amount | Percentage | Amount | Percentage |
Charge-offs, net | $260 | 0.5% | $245 | 0.5% | $28 | 0.0% |
Provision for bad debt | $80 | 0.1% | - | - | $723 | 1.4% |
Net bad debt | $340 | 0.6% | $245 | 0.5% | $751 | 1.4% |
| (1) | Dollar amounts are in thousands and percentages are as a percentage of total rental and other property income. Bad debt is recorded as a reduction to rental and other property revenue in our consolidated statements of operations. |
6
| | | |
| | | |
Operating statistics | October 2020 (1) | October 2019 | 3Q 2020 |
Rent collected for the period presented, as a percentage of rent billed | 96.7% | 99.5% | 98.8% |
Amount of monthly rent deferred for the period presented, as a percentage of rent billed | 0.0% | 0.0% | 0.1% |
Combined rent collected and rent subject to deferred payment plans, as a percentage of rent billed | 96.7% | 99.5% | 98.9% |
Average occupancy, total portfolio | 94.9% | 92.5% | 94.1% |
Average effective monthly rent per unit | $1,120 | $1,091 | $1,113 |
Resident retention rate | 47.5% | 45.8% | 56.7% |
Traffic (2) | 9,147 | 10,119 | 45,142 (2) |
| (1) | October 2020 data is month-to-date through October 27, 2020. |
| (2) | Traffic represents instances of first contact with potential residents through email, phone call, office visit, etc. Traffic during 3Q 2020 was 22.3% higher than 3Q 2019. |
Lease-Over-Lease Effective Rent Growth (1)
The table below depicts lease-over-lease effective rent growth for all new and renewal leases entered into during the respective periods for the 51-property same store portfolio.
| | |
Lease Type | Q3 2020 | Q4 2020 (2) |
New Leases | 1.8% | 7.4% |
Renewal Leases | 0.5% | 1.3% |
Total | 1.1% | 3.9% |
| (1) | Lease-over-lease effective rent growth represents the change in effective monthly rent, as adjusted for concessions, for each unit that had a prior lease and current lease that are for a term of 9-13 months. |
| (2) | For new leases and renewals commencing during Q4 2020 that were signed as of October 27, 2020. |
Value Add Program
Since the inception of our value add program, we have completed renovations in 3,489 units, achieving a weighted average return on investment of 18.4% on interior renovation costs and an average 18.3% rent premium on unrenovated units.
During June and July of 2020, with traffic returning in most of our markets, we resumed renovation efforts at all five communities that had been paused in first quarter 2020. As demonstrated by these actions, we will continue to assess the potential of identified projects, including those at the six properties where the start of renovations have been delayed, as market conditions improve.
Capital Recycling
In third quarter 2020, we reengaged in capital recycling activity in support of our ongoing initiative to establish and grow our presence in markets where we see long-term growth opportunities and reevaluate those that are not attractive long-term investments.
Completed or Planned Acquisitions:
| • | Tampa, FL: On July 11, 2020, we acquired a 1.1-acre parcel of land adjacent to our Vantage on Hillsborough property for $860,000. The acquisition improves the street frontage of our existing property and will allow us to add up to 51 units to the existing 348 units, pending final approvals. |
| • | Huntsville, AL: We are under contract to acquire a 421-unit property in Huntsville, AL. The property was built in two phases in 2014 and 2019 and the gross purchase price is $95 million. This acquisition will expand our footprint in Huntsville from 178 units to 599 units, at an average rent per unit above that of our existing total portfolio effective monthly rent per unit. This acquisition includes a contiguous land parcel approved for up to 337 additional units. We expect to close this acquisition in late November using proceeds from the dispositions mentioned below, the availability under our unsecured line of credit, and a portion of the remaining availability from our February 2020 forward equity offering. |
7
Completed or Planned Dispositions:
| • | Trails at Signal Mountain in Chattanooga, TN: On October 27, 2020, we sold this 172-unit property for $20.0 million and expect to recognize a $6.3 million gain on sale in fourth quarter 2020. |
| • | Live Oak Trace in Baton Rouge, LA: In early November 2020, we expect to sell this 264-unit property for $25.4 million and as a result, exit the Baton Rouge market. We expect to sell the property at a loss and therefore, we have recognized a $1.8 million impairment charge in third quarter 2020. |
| • | Lakeshore on the Hill in Chattanooga, TN: In late November 2020, we expect to sell this 123-unit property for $14.3 million and recognize a $3.6 million gain in fourth quarter 2020. Following this sale, we will have exited the Chattanooga market. |
The three properties that we sold or expect to sell during the fourth quarter 2020 were classified as held for sale as of September 30, 2020 and were removed from our same store portfolio thereby reducing our same store portfolio from 54 properties to 51 properties.
Financial Flexibility
As of September 30, 2020, we had a total liquidity position of approximately $217 million, which includes unrestricted cash, additional capacity under our unsecured line of credit, and proceeds upon the future settlement of the unsettled portion of our forward equity offering.
Capital Expenditures
For the three months ended September 30, 2020, recurring capital expenditures for the total portfolio were $1.8 million, or $116 per unit. For the nine months ended September 30, 2020, recurring capital expenditures for the total portfolio were $4.5 million, or $283 per unit.
Distributions
On September 15, 2020, our Board of Directors declared a quarterly cash dividend of $0.12 per share of our common stock, which was paid on October 23, 2020 to stockholders of record at the close of business on October 2, 2020.
2020 EPS and CFFO Guidance
On March 26, 2020, we suspended our fiscal 2020 guidance, given the uncertainty around the length and depth of the coronavirus crisis and its impact on our business and the economy. At this time, we believe it is prudent to keep our guidance suspended and we anticipate resuming our practice of providing full year guidance when there is more clarity on economic conditions.
Selected Financial Information
See the schedules at the end of this earnings release for selected financial information for IRT.
Non-GAAP Financial Measures and Definitions
We disclose the following non-GAAP financial measures in this earnings release: FFO, CFFO, NOI and Adjusted EBITDA. Included at the end of this release are definitions of these non-GAAP financial measures and a reconciliation of our reported net income to our FFO and CFFO, a reconciliation of our same store NOI to our reported net income, a reconciliation of our Adjusted EBITDA to net income, and management’s rationales for the usefulness of each of these and other non-GAAP financial measures used in this release.
Conference Call
All interested parties can listen to the live conference call webcast at 9:00 AM ET on Thursday, October 29, 2020 from the investor relations section of the IRT website at www.irtliving.com or by dialing 1.844.775.2542, access code 4646712. For those who are not available to listen to the live call, the replay will be available shortly following the live call from the investor relations section of IRT’s website and telephonically until Thursday, November 5, 2020 by dialing 1.855.859.2056, access code 4646712.
Supplemental Information
We produce supplemental information that includes details regarding the performance of the portfolio, financial information, non-GAAP financial measures, same store information and other useful information for investors. The supplemental information is available via our website, www.irtliving.com, through the "Investor Relations" section.
8
About Independence Realty Trust, Inc.
Independence Realty Trust, Inc. (NYSE: IRT) is a real estate investment trust that owns and operates multifamily apartment properties across non-gateway U.S. markets, including Atlanta, Louisville, Memphis, and Raleigh. IRT’s investment strategy is focused on gaining scale within key amenity rich submarkets that offer good school districts, high-quality retail and major employment centers. IRT aims to provide stockholders attractive risk-adjusted returns through diligent portfolio management, strong operational performance, and a consistent return on capital through distributions and capital appreciation. More information may be found on IRT’s website at www.irtliving.com.
9
Forward-Looking Statements
This press release contains certain forward-looking statements within the meaning of Section 27A of the Securities Act of 1933, as amended, and Section 21E of the Securities Exchange Act of 1934, as amended. Such forward-looking statements can generally be identified by our use of forward-looking terminology such as “will,” “strategy,” “expects,” “seeks,” “believes,” “potential,” or other similar words. These forward-looking statements include, without limitation, our expectations with respect to capital allocations, including as to the timing and amount of future dividends. Because such statements include risks, uncertainties and contingencies, actual results may differ materially from the expectations, intentions, beliefs, plans or predictions of the future expressed or implied by such forward-looking statements. These forward-looking statements are based upon the current beliefs and expectations of our management and are inherently subject to significant business, economic and competitive uncertainties and contingencies, many of which are difficult to predict and generally not within our control. In addition, these forward-looking statements are subject to assumptions with respect to future business strategies and decisions that are subject to change. Risks and uncertainties that might cause our actual results and/or future dividends to differ materially from those expressed or implied by forward-looking statements include, but are not limited to: risks related to the impact of COVID-19 and other potential future outbreaks of infectious diseases on our financial condition, results of operations, cash flows and performance and those of our residents as well as on the economy and real estate and financial markets; changes in market demand for rental apartment homes and pricing pressures, including from competitors, that could limit our ability to lease units or increase rents or that could lead to declines in occupancy and rent levels; uncertainty and volatility in capital and credit markets, including changes that reduce availability, and increase costs, of capital; inability of tenants to meet their rent and other lease obligations and charge-offs in excess of our allowance for bad debt; legislative restrictions that may delay or limit collections of past due rents; risks endemic to real estate and the real estate industry generally; the effects of natural and other disasters; delays in completing, and cost overruns incurred in connection with, our value add initiatives and failure to achieve projected rent increases and occupancy levels on account of the initiatives; unexpected costs of REIT qualification compliance; costs and disruptions as the result of a cybersecurity incident or other technology disruption; and share price fluctuations. Please refer to the documents filed by us with the SEC, including specifically the “Risk Factors” sections of our Form 10-K for the year ended December 31, 2019 and our Quarterly Report on Form 10-Q for the quarter ended March 31, 2020, and our other filings with the SEC, which identify additional factors that could cause actual results to differ from those contained in forward-looking statements. We undertake no obligation to update these forward-looking statements to reflect events or circumstances after the date hereof or to reflect the occurrence of unanticipated events, except as may be required by law. In addition, the declaration of dividends on our common stock is subject to the discretion of our Board of Directors and depends upon a broad range of factors, including our results of operations, financial condition, capital requirements, the annual distribution requirements under the REIT provisions of the Internal Revenue Code of 1986, as amended, applicable legal requirements and such other factors as our Board of Directors may from time to time deem relevant. For these reasons, as well as others, there can be no assurance that dividends in the future will be equal or similar to the expected amount of the quarterly dividend described in this press release.
Independence Realty Trust, Inc. Contact
Edelman Financial Communications & Capital Markets
Ted McHugh and Lauren Torres
917-365-7979
IRT@edelman.com
10
FINANCIAL & OPERATING HIGHLIGHTS
Dollars in thousands, except per share data
| | For the Three Months Ended | |
| | September 30, 2020 | | June 30, 2020 | | March 31, 2020 | | December 31, 2019 | | September 30, 2019 | |
Selected Financial Information: | | | | | | | | | | | |
Operating Statistics: | | | | | | | | | | | |
Net income available to common shares | | $1,090 | | $789 | | $(372) | | $23,784 | | $4,863 | |
Earnings (loss) per share -- diluted | | $0.01 | | 0.01 | | $0.00 | | $0.26 | | $0.05 | |
Rental and other property revenue | | $54,001 | | $52,087 | | $51,156 | | $51,250 | | $51,057 | |
Property operating expenses | | $22,129 | | $20,974 | | $19,737 | | $19,064 | | $20,546 | |
Net operating income | | $31,872 | | $31,113 | | $31,419 | | $32,186 | | $30,511 | |
NOI margin | | 59.0% | | 59.7% | | 61.4% | | 62.8% | | 59.8% | |
Adjusted EBITDA | | $27,081 | | $25,643 | | $24,081 | | $27,427 | | $25,739 | |
CORE FFO per share | | $0.20 | | $0.19 | | $0.19 | | $0.20 | | $0.19 | |
Dividends per share | | $0.12 | | $0.12 | | $0.18 | | $0.18 | | $0.18 | |
CORE FFO payout ratio | | 60.0% | | 63.2% | | 94.7% | | 90.0% | | 94.7% | |
Portfolio Data: | | | | | | | | | | | |
Total gross assets | | $1,914,900 | | $1,916,424 | | $1,949,494 | | $1,841,738 | | $1,821,173 | |
Total number of properties | | 58 | | 58 | | 58 | | 57 | | 57 | |
Total units | | 15,805 | | 15,805 | | 15,805 | | 15,554 | | 15,536 | |
Period end occupancy | | 94.4% | | 93.5% | | 92.7% | | 92.5% | | 92.8% | |
Total portfolio average occupancy | | 94.1% | | 92.9% | | 92.5% | | 92.5% | | 93.5% | |
Total portfolio average effective monthly rent, per unit | | $1,113 | | $1,108 | | $1,100 | | $1,088 | | $1,084 | |
Same store period end occupancy (a) | | 94.3% | | 93.4% | | 93.1% | | 92.6% | | 92.9% | |
Same store portfolio average occupancy (a) | | 94.0% | | 93.1% | | 92.8% | | 92.4% | | 93.6% | |
Same store portfolio average effective monthly rent, per unit (a) | | $1,106 | | $1,103 | | $1,094 | | $1,089 | | $1,082 | |
Capitalization: | | | | | | | | | | | |
Total debt | | $1,004,237 | | $1,008,911 | | $1,049,541 | | $985,572 | | $979,330 | |
Common share price, period end | | $11.59 | | $11.45 | | $8.94 | | $14.08 | | $14.31 | |
Market equity capitalization | | $1,107,144 | | $1,093,822 | | $853,600 | | $1,294,545 | | $1,313,311 | |
Total market capitalization | | $2,111,381 | | $2,102,733 | | $1,903,141 | | $2,280,117 | | $2,292,641 | |
Total debt/total gross assets | | 52.4% | | 52.6% | | 53.8% | | 53.5% | | 53.8% | |
Net debt to Adjusted EBITDA (pro forma) (b) | | 9.1x | | 9.2x | | 9.0x | | 8.9x | | 9.0x | |
Interest coverage | | 3.0x | | 2.8x | | 2.5x | | 2.8x | | 2.6x | |
Common shares and OP Units: | | | | | | | | | | | |
Shares outstanding | | 94,823,806 | | 94,741,146 | | 94,691,806 | | 91,070,637 | | 90,894,656 | |
OP units outstanding | | 701,986 | | 789,134 | | 789,134 | | 871,491 | | 881,107 | |
Common shares and OP units outstanding | | 95,525,792 | | 95,530,279 | | 95,480,939 | | 91,942,128 | | 91,775,763 | |
Weighted average common shares and units | | 95,227,176 | | 95,224,855 | | 91,737,113 | | 91,526,726 | | 90,908,646 | |
| (a) | Same store portfolio consists of 51 properties, which represent 14,189 units. |
| (b) | Reflects pro forma net debt to Adjusted EBITDA for each period presented, which includes adjustments for the timing of acquisitions, the full quarter effect of current value add initiatives, the completion of capital recycling activities including paydown of associated indebtedness, and the normalization of items impacting quarterly EBITDA. Actual net debt to Adjusted EBITDA for the five quarters ended September 30, 2020 was 9.3x, 9.7x, 10.3x, 8.9x, and 9.4x, respectively. |
11
BALANCE SHEETS
Dollars in thousands, except per share data
| | As of |
| | September 30, 2020 | | June 30, 2020 | | March 31, 2020 | | December 31, 2019 | | September 30, 2019 |
Assets: | | | | | | | | | | |
Investments in real estate at cost | | $1,815,754 | | $1,864,182 | | $1,856,760 | | $1,796,365 | | $1,732,392 |
Less: accumulated depreciation | | (194,644) | | (187,758) | | (172,789) | | (158,435) | | (145,075) |
Investments in real estate, net | | 1,621,110 | | 1,676,424 | | 1,683,971 | | 1,637,930 | | 1,587,317 |
Real estate held for sale | | 49,264 | | — | | — | | — | | 32,381 |
Cash and cash equivalents | | 9,891 | | 11,652 | | 57,436 | | 9,888 | | 6,587 |
Restricted cash | | 7,218 | | 6,509 | | 4,740 | | 4,545 | | 8,960 |
Other assets | | 12,945 | | 14,253 | | 10,731 | | 10,380 | | 16,439 |
Derivative assets | | — | | — | | — | | 953 | | 982 |
Intangible assets, net | | — | | 74 | | 260 | | 410 | | 351 |
Total assets | | $1,700,428 | | $1,708,912 | | $1,757,138 | | $1,664,106 | | $1,653,017 |
Liabilities and Equity: | | | | | | | | | | |
Indebtedness, net | | $1,004,237 | | $1,008,911 | | $1,049,541 | | $985,572 | | $979,330 |
Accounts payable and accrued expenses | | 34,319 | | 28,748 | | 21,250 | | 25,399 | | 32,249 |
Accrued interest payable | | 1,888 | | 1,970 | | 2,099 | | 2,196 | | 794 |
Dividends payable | | 11,449 | | 11,423 | | 17,128 | | 16,491 | | 16,460 |
Derivative liabilities | | 33,453 | | 34,614 | | 30,937 | | 7,769 | | 12,415 |
Other liabilities | | 6,736 | | 6,860 | | 7,012 | | 6,922 | | 7,399 |
Total liabilities | | 1,092,082 | | 1,092,526 | | 1,127,967 | | 1,044,349 | | 1,048,647 |
Equity: | | | | | | | | | | |
Shareholders' Equity: | | | | | | | | | | |
Preferred shares, $0.01 par value per share | | — | | — | | — | | — | | — |
Common shares, $0.01 par value per share | | 948 | | 947 | | 947 | | 911 | | 909 |
Additional paid in capital | | 820,105 | | 818,719 | | 817,501 | | 765,992 | | 762,933 |
Accumulated other comprehensive income (loss) | | (37,688) | | (39,099) | | (35,750) | | (12,099) | | (17,097) |
Retained earnings (deficit) | | (179,834) | | (169,585) | | (159,045) | | (141,525) | | (148,977) |
Total shareholders' equity | | 603,531 | | 610,982 | | 623,653 | | 613,279 | | 597,768 |
Noncontrolling Interests | | 4,815 | | 5,404 | | 5,518 | | 6,478 | | 6,602 |
Total equity | | 608,346 | | 616,386 | | 629,171 | | 619,757 | | 604,370 |
Total liabilities and equity | | $1,700,428 | | $1,708,912 | | $1,757,138 | | $1,664,106 | | $1,653,017 |
12
STATEMENTS OF OPERATIONS, FFO & CORE FFO
TRAILING FIVE QUARTERS
Dollars in thousands, except per share data
| | For the Three-Months Ended |
| | September 30, 2020 | | June 30, 2020 | | March 31, 2020 | | December 31, 2019 | | September 30, 2019 |
Revenue: | | | | | | | | | | |
Rental and other property revenue | | $54,001 | | $52,087 | | $51,156 | | $51,250 | | $51,057 |
Other revenue | | 199 | | 181 | | 194 | | 178 | | 242 |
Total revenue | | 54,200 | | 52,268 | | 51,350 | | 51,428 | | 51,299 |
Expenses: | | | | | | | | | | |
Property operating expenses | | 22,129 | | 20,974 | | 19,737 | | 19,064 | | 20,546 |
Property management expenses | | 2,078 | | 2,077 | | 2,156 | | 1,950 | | 1,901 |
General and administrative expenses (a) | | 2,912 | | 3,574 | | 5,376 | | 2,987 | | 3,113 |
Depreciation and amortization expense | | 15,232 | | 15,231 | | 14,828 | | 14,213 | | 13,434 |
Abandoned deal costs | | — | | — | | 130 | | — | | — |
Casualty losses | | — | | 411 | | — | | — | | — |
Total expenses | | 42,351 | | 42,267 | | 42,227 | | 38,214 | | 38,994 |
Interest expense | | (8,917) | | (9,202) | | (9,497) | | (9,873) | | (9,783) |
Gain on sale (loss on impairment) of real estate assets, net | | (1,840) | | — | | — | | 20,679 | | 2,390 |
Net income (loss) | | 1,092 | | 799 | | (374) | | 24,020 | | 4,912 |
(Income) loss allocated to noncontrolling interests | | (2) | | (10) | | 2 | | (236) | | (49) |
Net income (loss) available to common shares | | $1,090 | | $789 | | $(372) | | $23,784 | | $4,863 |
EPS - basic | | $0.01 | | $0.01 | | $0.00 | | $0.26 | | $0.05 |
Weighted-average shares outstanding - Basic | | 94,456,987 | | 94,435,722 | | 90,895,488 | | 90,646,142 | | 90,027,540 |
EPS - diluted | | $0.01 | | $0.01 | | $0.00 | | $0.26 | | $0.05 |
Weighted-average shares outstanding - Diluted | | 95,222,623 | | 95,070,734 | | 90,895,488 | | 91,409,854 | | 90,691,368 |
Funds From Operations (FFO): | | | | | | | | | | |
Net Income (loss) | | $1,092 | | $799 | | $(374) | | $24,020 | | $4,912 |
Add-Back (Deduct): | | | | | | | | | | |
Real estate depreciation and amortization | | 15,155 | | 15,156 | | 14,725 | | 14,175 | | 13,313 |
Net loss on impairment (gain on sale) of real estate assets excluding debt extinguishment costs | | 1,840 | | — | | — | | (22,862) | | (5,594) |
FFO | | $18,087 | | $15,955 | | $14,351 | | $15,333 | | $12,631 |
FFO per share | | $0.19 | | $0.17 | | $0.16 | | $0.17 | | $0.14 |
CORE Funds From Operations (CFFO): | | | | | | | | | | |
FFO | | $18,087 | | $15,955 | | $14,351 | | $15,333 | | $12,631 |
Add-Back (Deduct): | | | | | | | | | | |
Stock compensation expense (a) | | 901 | | 1,233 | | 2,627 | | 717 | | 692 |
Amortization of deferred financing costs | | 362 | | 362 | | 361 | | 370 | | 351 |
Other depreciation and amortization | | 77 | | 75 | | 103 | | 38 | | 121 |
Abandoned deal costs | | — | | — | | 130 | | — | | — |
Casualty losses | | — | | 411 | | — | | — | | — |
Debt extinguishment costs included in net gains (losses) on sale of assets | | — | | — | | — | | 2,184 | | 3,204 |
CFFO | | $19,427 | | $18,036 | | $17,572 | | $18,642 | | $16,999 |
CFFO per share | | $0.20 | | $0.19 | | $0.19 | | $0.20 | | $0.19 |
Weighted-average shares and units outstanding | | 95,227,176 | | 95,224,855 | | 91,737,113 | | 91,526,726 | | 90,908,646 |
| (a) | The three-months ended March 31, 2020 included $1.7 million of stock compensation expense recorded with respect to stock awards granted during the period to retirement eligible employees. |
13
STATEMENTS OF OPERATIONS, FFO & CORE FFO
THREE AND NINE MONTHS ENDED SEPTEMBER 30, 2020 and 2019
Dollars in thousands, except per share data
| | For the Three Months Ended September 30, | | For the Nine Months Ended September 30, |
| | 2020 | | 2019 | | 2020 | | 2019 |
Revenue: | | | | | | | | |
Rental and other property revenue | | $54,001 | | $51,057 | | $157,244 | | $151,370 |
Other revenue | | 199 | | 242 | | 574 | | 425 |
Total revenue | | 54,200 | | 51,299 | | 157,818 | | 151,795 |
Expenses: | | | | | | | | |
Property operating expenses | | 22,129 | | 20,546 | | 62,840 | | 60,504 |
Property management expenses | | 2,078 | | 1,901 | | 6,311 | | 5,776 |
General and administrative expenses (a) | | 2,912 | | 3,113 | | 11,862 | | 9,758 |
Depreciation and amortization expense | | 15,232 | | 13,434 | | 45,291 | | 38,602 |
Abandoned deal costs | | — | | — | | 130 | | — |
Casualty losses | | — | | — | | 411 | | — |
Total expenses | | 42,351 | | 38,994 | | 126,845 | | 114,640 |
Interest expense | | (8,917) | | (9,783) | | (27,616) | | (29,353) |
Gain on sale (loss on impairment) of real estate assets, net | | (1,840) | | 2,390 | | (1,840) | | 14,532 |
Net income (loss) | | 1,092 | | 4,912 | | 1,517 | | 22,334 |
(Income) loss allocated to noncontrolling interests | | (2) | | (49) | | (10) | | (222) |
Net income (loss) available to common shares | | $1,090 | | $4,863 | | $1,507 | | $22,112 |
EPS - basic | | $0.01 | | $0.05 | | $0.02 | | $0.25 |
Weighted-average shares outstanding - Basic | | 94,456,987 | | 90,027,540 | | 93,261,757 | | 89,513,834 |
EPS - diluted | | $0.01 | | $0.05 | | $0.02 | | $0.25 |
Weighted-average shares outstanding - Diluted | | 95,222,623 | | 90,691,368 | | 94,099,091 | | 90,234,840 |
| | | | | | | | |
Funds From Operations (FFO): | | | | | | | | |
Net Income (loss) | | $1,092 | | $4,912 | | $1,517 | | $22,334 |
Adjustments: | | | | | | | | |
Real estate depreciation and amortization | | 15,155 | | 13,313 | | 45,036 | | 38,306 |
Net loss on impairment (gain on sale) of real estate assets excluding debt extinguishment costs | | 1,840 | | (5,594) | | 1,840 | | (19,765) |
Funds From Operations | | $18,087 | | $12,631 | | $48,393 | | $40,875 |
FFO per share | | $0.19 | | $0.14 | | $0.51 | | $0.45 |
Core Funds From Operations (CFFO): | | | | | | | | |
Funds From Operations | | $18,087 | | $12,631 | | $48,393 | | $40,875 |
Adjustments: | | | | | | | | |
Stock compensation expense (a) | | 901 | | 692 | | 4,761 | | 2,400 |
Amortization of deferred financing costs | | 362 | | 351 | | 1,085 | | 1,052 |
Other depreciation and amortization | | 77 | | 121 | | 255 | | 296 |
Abandoned deal costs | | — | | — | | 130 | | — |
Casualty losses | | — | | — | | 411 | | — |
Debt extinguishment costs included in net gains (losses) on sale of assets | | — | | 3,204 | | — | | 5,233 |
Core Funds From Operations | | $19,427 | | $16,999 | | $55,035 | | $49,856 |
CFFO per share | | $0.20 | | $0.19 | | $0.59 | | $0.55 |
Weighted-average shares and units outstanding | | 95,227,176 | | 90,908,646 | | 94,061,963 | | 90,394,941 |
| (a) | Included in the Nine-months ended September 30, 2020 is $1.7 million of stock compensation expense recorded with respect to stock awards granted during the period to retirement eligible employees. |
14
ADJUSTED EBITDA RECONCILIATION AND COVERAGE RATIO
Dollars in thousands
| | Three Months Ended | |
ADJUSTED EBITDA: | | September 30, 2020 | | June 30, 2020 | | March 31, 2020 | | December 31, 2019 | | September 30, 2019 | |
Net income (loss) | | $1,092 | | $799 | | $(374) | | $24,020 | | $4,912 | |
Add-Back (Deduct): | | | | | | | | | | | |
Depreciation and amortization | | 15,232 | | 15,231 | | 14,828 | | 14,213 | | 13,434 | |
Interest expense | | 8,917 | | 9,202 | | 9,497 | | 9,873 | | 9,783 | |
Net loss on impairment (gain on sale) of real estate assets | | 1,840 | | — | | — | | (20,679) | | (2,390) | |
Abandoned deal costs | | — | | — | | 130 | | — | | — | |
Casualty losses | | — | | 411 | | — | | — | | — | |
Adjusted EBITDA | | $27,081 | | $25,643 | | $24,081 | | $27,427 | | $25,739 | |
| | | | | | | | | | | |
INTEREST COST: | | | | | | | | | | | |
Interest expense | | $8,917 | | $9,202 | | $9,497 | | $9,873 | | $9,783 | |
| | | | | | | | | | | |
INTEREST COVERAGE: | | 3.0x | | 2.8x | | 2.5x | | 2.8x | | 2.6x | |
| | | | | | | | | | | |
| | | | | | | | |
| | For the Three Months Ended September 30, | | For the Nine Months Ended September 30, |
ADJUSTED EBITDA: | | 2020 | | 2019 | | 2020 | | 2019 |
Net income (loss) | | $1,092 | | $4,912 | | $1,517 | | $22,334 |
Add-Back (Deduct): | | | | | | | | |
Depreciation and amortization | | 15,232 | | 13,434 | | 45,291 | | 38,602 |
Interest expense | | 8,917 | | 9,783 | | 27,616 | | 29,353 |
Net loss on impairment (gain on sale) of real estate assets | | 1,840 | | (2,390) | | 1,840 | | (14,532) |
Abandoned deal costs | | — | | — | | 130 | | — |
Casualty losses | | — | | — | | 411 | | — |
Adjusted EBITDA | | $27,081 | | $25,739 | | $76,805 | | $75,757 |
| | | | | | | | |
INTEREST COST: | | | | | | | | |
Interest expense | | $8,917 | | $9,783 | | $27,616 | | $29,353 |
| | | | | | | | |
INTEREST COVERAGE: | | 3.0x | | 2.6x | | 2.8x | | 2.6x |
| | | | | | | | |
| | | | | | | | |
15
SAME STORE PORTFOLIO NET OPERATING INCOME
TRAILING FIVE QUARTERS
Dollars in thousands, except per unit data
| | For the Three-Months Ended (a) |
| | September 30, 2020 | | June 30, 2020 | | March 31, 2020 | | December 31, 2019 | | September 30, 2019 |
Revenue: | | | | | | | | | | |
Rental and other property revenue | | $47,881 | | $46,598 | | $46,344 | | $45,890 | | $46,493 |
Property Operating Expenses: | | | | | | | | | | |
Real estate taxes | | 6,053 | | 6,076 | | 5,737 | | 5,286 | | 5,768 |
Property insurance | | 1,097 | | 1,040 | | 864 | | 945 | | 933 |
Personnel expenses | | 4,753 | | 4,458 | | 4,199 | | 4,230 | | 4,509 |
Utilities | | 2,789 | | 2,448 | | 2,660 | | 2,521 | | 2,537 |
Repairs and maintenance | | 2,031 | | 1,621 | | 1,438 | | 1,200 | | 1,889 |
Contract services | | 1,911 | | 1,931 | | 1,711 | | 1,698 | | 1,695 |
Advertising expenses | | 554 | | 462 | | 507 | | 497 | | 499 |
Other expenses | | 522 | | 471 | | 647 | | 604 | | 629 |
Total property operating expenses | | 19,710 | | 18,507 | | 17,763 | | 16,981 | | 18,459 |
Same-store net operating income (a) | | $28,171 | | $28,091 | | $28,581 | | $28,909 | | $28,034 |
Same-store NOI margin | | 58.8% | | 60.3% | | 61.7% | | 63.0% | | 60.3% |
Average occupancy | | 94.0% | | 93.1% | | 92.8% | | 92.4% | | 93.6% |
Average effective monthly rent, per unit | | $1,106 | | $1,103 | | $1,094 | | $1,089 | | $1,082 |
Reconciliation of same-store net operating income to net income (loss) | | | | | | | | | | |
Same-store net operating income | | $28,171 | | $28,091 | | $28,581 | | $28,909 | | $28,034 |
Non same-store net operating income | | 3,701 | | 3,022 | | 2,838 | | 3,277 | | 2,477 |
Other revenue | | 199 | | 181 | | 194 | | 178 | | 242 |
Property management expenses | | (2,078) | | (2,077) | | (2,156) | | (1,950) | | (1,901) |
General and administrative expenses | | (2,912) | | (3,574) | | (5,376) | | (2,987) | | (3,113) |
Depreciation and amortization expense | | (15,232) | | (15,231) | | (14,828) | | (14,213) | | (13,434) |
Abandoned deal costs | | — | | — | | (130) | | — | | — |
Casualty losses | | — | | (411) | | — | | — | | — |
Interest expense | | (8,917) | | (9,202) | | (9,497) | | (9,873) | | (9,783) |
Gain on sale (loss on impairment) of real estate assets, net | | (1,840) | | — | | — | | 20,679 | | 2,390 |
Net income (loss) | | $1,092 | | $799 | | $(374) | | $24,020 | | $4,912 |
(a) | Same store portfolio consists of 51 properties, which represent 14,189 units. |
16
SAME STORE PORTFOLIO NET OPERATING INCOME
THREE AND NINE MONTHS ENDED SEPTEMBER 30, 2020 and 2019
Dollars in thousands, except per unit data
| | For the Three Months Ended September 30, | | For the Nine Months Ended September 30, |
| | 2020 | | 2019 | | % change | | 2020 | | 2019 | | % change |
Revenue: | | | | | | | | | | | |
Rental and other property revenue | | $47,881 | | $46,493 | | 3.0% | | $140,823 | | $136,710 | | 3.0% |
Property Operating Expenses: | | | | | | | | | | | |
Real estate taxes | | 6,053 | | 5,768 | | 4.9% | | 17,866 | | 17,440 | | 2.4% |
Property insurance | | 1,097 | | 933 | | 17.6% | | 3,001 | | 2,743 | | 9.4% |
Personnel expenses | | 4,753 | | 4,509 | | 5.4% | | 13,410 | | 12,949 | | 3.6% |
Utilities | | 2,789 | | 2,537 | | 9.9% | | 7,897 | | 7,361 | | 7.3% |
Repairs and maintenance | | 2,031 | | 1,889 | | 7.5% | | 5,090 | | 5,154 | | -1.2% |
Contract services | | 1,911 | | 1,695 | | 12.7% | | 5,553 | | 5,051 | | 9.9% |
Advertising expenses | | 554 | | 499 | | 11.0% | | 1,523 | | 1,433 | | 6.3% |
Other expenses | | 522 | | 629 | | -17.0% | | 1,640 | | 1,894 | | -13.4% |
Total property operating expenses | | 19,710 | | 18,459 | | 6.8% | | 55,980 | | 54,025 | | 3.6% |
Same-store net operating income (a) | | $28,171 | | $28,034 | | 0.5% | | $84,843 | | $82,685 | | 2.6% |
Same-store NOI margin | | 58.8% | | 60.3% | | -1.5% | | 60.2% | | 60.5% | | -0.3% |
Average occupancy | | 94.0% | | 93.6% | | 0.4% | | 93.3% | | 93.7% | | -0.4% |
Average effective monthly rent, per unit | | $1,106 | | $1,082 | | 2.2% | | $1,101 | | $1,061 | | 3.7% |
Reconciliation of same-store net operating income to net income (loss) | | | | | | | | | | | | |
Same-store portfolio net operating income | | $28,171 | | $28,034 | | | | $84,843 | | $82,685 | | |
Non same-store net operating income | | 3,701 | | 2,477 | | | | 9,561 | | 8,181 | | |
Other revenue | | 199 | | 242 | | | | 574 | | 425 | | |
Property management expenses | | (2,078) | | (1,901) | | | | (6,311) | | (5,776) | | |
General and administrative expenses | | (2,912) | | (3,113) | | | | (11,862) | | (9,758) | | |
Depreciation and amortization expense | | (15,232) | | (13,434) | | | | (45,291) | | (38,602) | | |
Abandoned deal costs | | — | | — | | | | (130) | | — | | |
Casualty losses | | — | | — | | | | (411) | | — | | |
Interest expense | | (8,917) | | (9,783) | | | | (27,616) | | (29,353) | | |
Gain on sale (loss on impairment) of real estate assets, net | | (1,840) | | 2,390 | | | | (1,840) | | 14,532 | | |
Net income (loss) | | $1,092 | | $4,912 | | | | $1,517 | | $22,334 | | |
(a) | Same store portfolio consists of 51 properties, which represent 14,189 units. |
17
NET OPERATING INCOME (NOI) BRIDGE
TRAILING FIVE QUARTERS
Dollars in thousands
| | For the Three-Months Ended |
| | September 30, 2020 | | June 30, 2020 | | March 31, 2020 | | December 31, 2019 | | September 30, 2019 |
Rental and other property revenue | | | | | | | | | | |
Same store (a) | | $47,881 | | $46,598 | | $46,344 | | $45,890 | | $46,493 |
Non same-store | | 6,120 | | 5,489 | | 4,812 | | 5,360 | | 4,564 |
Total rental and other property revenue | | 54,001 | | 52,087 | | 51,156 | | 51,250 | | 51,057 |
Property operating expenses | | | | | | | | | | |
Same store (a) | | 19,710 | | 18,507 | | 17,763 | | 16,981 | | 18,459 |
Non same-store | | 2,419 | | 2,467 | | 1,974 | | 2,083 | | 2,087 |
Total property operating expenses | | 22,129 | | 20,974 | | 19,737 | | 19,064 | | 20,546 |
Net operating income | | | | | | | | | | |
Same-store (a) | | 28,171 | | 28,091 | | 28,581 | | 28,909 | | 28,034 |
Non same-store | | 3,701 | | 3,022 | | 2,838 | | 3,277 | | 2,477 |
Total property net operating income | | $31,872 | | $31,113 | | $31,419 | | $32,186 | | $30,511 |
Reconciliation of NOI to net income (loss) | | | | | | | | | | |
Total property net operating income | | $31,872 | | $31,113 | | $31,419 | | $32,186 | | $30,511 |
Other revenue | | 199 | | 181 | | 194 | | 178 | | 242 |
Property management expenses | | (2,078) | | (2,077) | | (2,156) | | (1,950) | | (1,901) |
General and administrative expenses | | (2,912) | | (3,574) | | (5,376) | | (2,987) | | (3,113) |
Depreciation and amortization expense | | (15,232) | | (15,231) | | (14,828) | | (14,213) | | (13,434) |
Abandoned deal costs | | — | | — | | (130) | | — | | — |
Casualty losses | | — | | (411) | | — | | — | | — |
Interest expense | | (8,917) | | (9,202) | | (9,497) | | (9,873) | | (9,783) |
Gain on sale (loss on impairment) of real estate assets, net | | (1,840) | | — | | — | | 20,679 | | 2,390 |
Net income (loss) | | $1,092 | | $799 | | $(374) | | $24,020 | | $4,912 |
(a) | Same store portfolio consists of 51 properties, which represent 14,189 units. |
18
SAME-STORE PORTFOLIO NET OPERATING INCOME BY MARKET
THREE MONTHS ENDED SEPTEMBER 30, 2020
Dollars in thousands, except rent per unit
| | | | | | Rental and Other Property Revenue | | Property Operating Expenses | | Net Operating Income | | Average Occupancy | | Average Effective Monthly Rent per Unit |
Market | | Number of Properties | | Units | | 2020 | | 2019 | | % Change | | 2020 | | 2019 | | % Change | | 2020 | | 2019 | | % Change | | 2020 | | 2019 | | % Change | | 2020 | | 2019 | | % Change |
Atlanta, GA | | 5 | | 1,796 | | $6,644 | | $6,328 | | 5.0% | | $2,356 | | $2,262 | | 4.2% | | $4,288 | | $4,066 | | 5.5% | | 95.4% | | 93.8% | | 1.7% | | $1,227 | | $1,181 | | 3.9% |
Raleigh - Durham, NC | | 5 | | 1,372 | | 5,128 | | 5,013 | | 2.3% | | 1,898 | | 1,838 | | 3.3% | | 3,230 | | 3,175 | | 1.7% | | 94.0% | | 94.1% | | -0.2% | | 1,206 | | 1,199 | | 0.6% |
Memphis, TN | | 4 | | 1,383 | | 4,869 | | 4,701 | | 3.6% | | 1,871 | | 1,760 | | 6.3% | | 2,998 | | 2,941 | | 1.9% | | 93.8% | | 92.3% | | 1.5% | | 1,165 | | 1,143 | | 1.9% |
Louisville, KY | | 6 | | 1,710 | | 5,173 | | 5,160 | | 0.3% | | 2,407 | | 2,132 | | 12.9% | | 2,766 | | 3,028 | | -8.7% | | 88.9% | | 90.2% | | -1.3% | | 1,017 | | 1,004 | | 1.3% |
Columbus, OH | | 6 | | 1,547 | | 4,924 | | 4,748 | | 3.7% | | 2,326 | | 2,145 | | 8.4% | | 2,598 | | 2,603 | | -0.2% | | 93.6% | | 93.9% | | -0.3% | | 1,057 | | 1,011 | | 4.5% |
Oklahoma City, OK | | 5 | | 1,658 | | 3,609 | | 3,424 | | 5.4% | | 1,615 | | 1,474 | | 9.6% | | 1,994 | | 1,950 | | 2.3% | | 95.6% | | 95.1% | | 0.5% | | 696 | | 671 | | 3.6% |
Tampa-St. Petersburg, FL | | 3 | | 840 | | 3,168 | | 2,955 | �� | 7.2% | | 1,259 | | 1,225 | | 2.8% | | 1,909 | | 1,730 | | 10.3% | | 93.2% | | 92.4% | | 0.8% | | 1,284 | | 1,187 | | 8.1% |
Indianapolis, IN | | 4 | | 916 | | 2,983 | | 2,849 | | 4.7% | | 1,365 | | 1,278 | | 6.8% | | 1,618 | | 1,571 | | 3.0% | | 95.3% | | 94.1% | | 1.2% | | 1,054 | | 1,014 | | 3.9% |
Dallas, TX | | 3 | | 734 | | 2,749 | | 2,687 | | 2.3% | | 1,286 | | 1,184 | | 8.6% | | 1,463 | | 1,503 | | -2.7% | | 95.1% | | 95.2% | | -0.1% | | 1,216 | | 1,206 | | 0.8% |
Myrtle Beach, SC - Wilmington, NC | | 3 | | 628 | | 2,011 | | 2,001 | | 0.5% | | 672 | | 638 | | 5.3% | | 1,339 | | 1,363 | | -1.8% | | 95.2% | | 95.4% | | -0.2% | | 1,046 | | 1,053 | | -0.7% |
Charleston, SC | | 2 | | 518 | | 2,140 | | 2,100 | | 1.9% | | 981 | | 972 | | 0.9% | | 1,159 | | 1,128 | | 2.7% | | 94.9% | | 92.9% | | 2.0% | | 1,299 | | 1,314 | | -1.2% |
Orlando, FL | | 1 | | 297 | | 1,281 | | 1,329 | | -3.6% | | 561 | | 476 | | 17.9% | | 720 | | 853 | | -15.6% | | 94.7% | | 94.7% | | 0.0% | | 1,457 | | 1,488 | | -2.1% |
Charlotte, NC | | 1 | | 208 | | 968 | | 1,046 | | -7.5% | | 353 | | 359 | | -1.7% | | 615 | | 687 | | -10.5% | | 91.7% | | 96.2% | | -4.5% | | 1,458 | | 1,573 | | -7.3% |
Asheville, NC | | 1 | | 252 | | 881 | | 880 | | 0.1% | | 279 | | 264 | | 5.7% | | 602 | | 616 | | -2.3% | | 96.6% | | 96.4% | | 0.2% | | 1,140 | | 1,152 | | -1.0% |
St. Louis, MO | | 1 | | 152 | | 728 | | 716 | | 1.7% | | 277 | | 254 | | 9.1% | | 451 | | 462 | | -2.4% | | 94.3% | | 95.0% | | -0.7% | | 1,480 | | 1,472 | | 0.6% |
Huntsville, AL | | 1 | | 178 | | 625 | | 556 | | 12.4% | | 204 | | 198 | | 3.0% | | 421 | | 358 | | 17.6% | | 98.0% | | 97.9% | | 0.1% | | 1,062 | | 974 | | 9.0% |
Total/Weighted Average | | 51 | | 14,189 | | $47,881 | | $46,493 | | 3.0% | | $19,710 | | $18,459 | | 6.8% | | $28,171 | | $28,034 | | 0.5% | | 94.0% | | 93.6% | | 0.4% | | $1,106 | | $1,082 | | 2.3% |
SAME-STORE PORTFOLIO NET OPERATING INCOME BY MARKET
NINE MONTHS ENDED SEPTEMBER 30, 2020
Dollars in thousands, except rent per unit
| | | | | | Rental and Other Property Revenue | | Property Operating Expenses | | Net Operating Income | | Average Occupancy | | Average Effective Monthly Rent per Unit |
Market | | Number of Properties | | Units | | 2020 | | 2019 | | % Change | | 2020 | | 2019 | | % Change | | 2020 | | 2019 | | % Change | | 2020 | | 2019 | | % Change | | 2020 | | 2019 | | % Change |
Atlanta, GA | | 5 | | 1,796 | | $19,504 | | $18,589 | | 4.9% | | $6,866 | | $6,692 | | 2.6% | | $12,638 | | $11,897 | | 6.2% | | 94.6% | | 94.3% | | 0.2% | | $1,219 | | $1,158 | | 5.3% |
Raleigh - Durham, NC | | 5 | | 1,372 | | 15,162 | | 14,603 | | 3.8% | | 5,350 | | 5,466 | | -2.1% | | 9,812 | | 9,137 | | 7.4% | | 93.8% | | 93.6% | | 0.2% | | 1,205 | | 1,168 | | 3.1% |
Louisville, KY | | 6 | | 1,710 | | 15,417 | | 15,203 | | 1.4% | | 6,648 | | 6,116 | | 8.7% | | 8,769 | | 9,087 | | -3.5% | | 88.9% | | 90.3% | | -1.3% | | 1,016 | | 989 | | 2.7% |
Memphis, TN | | 4 | | 1,383 | | 14,025 | | 13,792 | | 1.7% | | 5,373 | | 5,174 | | 3.8% | | 8,652 | | 8,618 | | 0.4% | | 90.6% | | 92.5% | | -1.9% | | 1,160 | | 1,114 | | 4.1% |
Columbus, OH | | 6 | | 1,547 | | 14,381 | | 13,675 | | 5.2% | | 6,697 | | 6,005 | | 11.5% | | 7,684 | | 7,670 | | 0.2% | | 93.3% | | 92.8% | | 0.5% | | 1,044 | | 992 | | 5.2% |
Oklahoma City, OK | | 5 | | 1,658 | | 10,632 | | 10,173 | | 4.5% | | 4,426 | | 4,222 | | 4.8% | | 6,206 | | 5,951 | | 4.3% | | 96.0% | | 95.2% | | 0.8% | | 689 | | 666 | | 3.4% |
Tampa-St. Petersburg, FL | | 3 | | 840 | | 9,028 | | 8,863 | | 1.9% | | 3,802 | | 3,840 | | -1.0% | | 5,226 | | 5,023 | | 4.0% | | 90.3% | | 93.9% | | -3.7% | | 1,257 | | 1,172 | | 7.2% |
Indianapolis, IN | | 4 | | 916 | | 8,833 | | 8,362 | | 5.6% | | 3,704 | | 3,617 | | 2.4% | | 5,129 | | 4,745 | | 8.1% | | 95.2% | | 94.5% | | 0.7% | | 1,041 | | 995 | | 4.6% |
Dallas, TX | | 3 | | 734 | | 8,129 | | 8,038 | | 1.1% | | 3,531 | | 3,464 | | 1.9% | | 4,598 | | 4,574 | | 0.5% | | 95.3% | | 96.0% | | -0.7% | | 1,211 | | 1,190 | | 1.8% |
Myrtle Beach, SC - Wilmington, NC | | 3 | | 628 | | 5,767 | | 5,793 | | -0.4% | | 1,962 | | 1,902 | | 3.2% | | 3,805 | | 3,891 | | -2.2% | | 92.1% | | 94.6% | | -2.5% | | 1,039 | | 1,012 | | 2.7% |
Charleston, SC | | 2 | | 518 | | 6,410 | | 6,242 | | 2.7% | | 2,873 | | 2,883 | | -0.3% | | 3,537 | | 3,359 | | 5.3% | | 94.5% | | 94.0% | | 0.5% | | 1,313 | | 1,291 | | 1.7% |
Orlando, FL | | 1 | | 297 | | 3,893 | | 3,962 | | -1.7% | | 1,525 | | 1,428 | | 6.8% | | 2,368 | | 2,534 | | -6.6% | | 94.8% | | 96.2% | | -1.4% | | 1,479 | | 1,468 | | 0.8% |
Charlotte, NC | | 1 | | 208 | | 3,043 | | 3,057 | | -0.5% | | 1,028 | | 1,076 | | -4.5% | | 2,015 | | 1,981 | | 1.7% | | 94.2% | | 95.5% | | -1.3% | | 1,520 | | 1,544 | | -1.6% |
Asheville, NC | | 1 | | 252 | | 2,632 | | 2,603 | | 1.1% | | 821 | | 803 | | 2.2% | | 1,811 | | 1,800 | | 0.6% | | 96.2% | | 96.9% | | -0.7% | | 1,147 | | 1,131 | | 1.4% |
St. Louis, MO | | 1 | | 152 | | 2,162 | | 2,122 | | 1.9% | | 772 | | 753 | | 2.5% | | 1,390 | | 1,369 | | 1.5% | | 96.0% | | 94.5% | | 1.5% | | 1,468 | | 1,459 | | 0.6% |
Huntsville, AL | | 1 | | 178 | | 1,805 | | 1,633 | | 10.5% | | 602 | | 584 | | 3.1% | | 1,203 | | 1,049 | | 14.7% | | 97.8% | | 97.7% | | 0.0% | | 1,041 | | 954 | | 9.1% |
Total/Weighted Average | | 51 | | 14,189 | | $140,823 | | $136,710 | | 3.0% | | $55,980 | | $54,025 | | 3.6% | | $84,843 | | $82,685 | | 2.6% | | 93.3% | | 93.7% | | -0.4% | | $1,101 | | $1,061 | | 3.7% |
20
TOTAL PORTFOLIO NOI EXPOSURE BY MARKET
Dollars in thousands, except rent per unit
| | | | | | | | | | For the Three Months Ended September 30, 2020 |
Market | | Number of Properties | | Units | | Gross Real Estate Assets | | Period End Occupancy | | Average Effective Monthly Rent per Unit | | Net Operating Income | | % of NOI |
Atlanta, GA | | 6 | | 2,020 | | $259,584 | | 95.9% | | 1,216 | | 4,784 | | 15.2% |
Raleigh - Durham, NC | | 6 | | 1,690 | | 245,106 | | 94.5% | | 1,191 | | 3,924 | | 12.4% |
Louisville, KY | | 6 | | 1,710 | | 200,646 | | 88.6% | | 1,017 | | 2,766 | | 8.8% |
Memphis, TN | | 4 | | 1,383 | | 148,507 | | 95.4% | | 1,165 | | 2,999 | | 9.5% |
Columbus, OH | | 6 | | 1,547 | | 155,847 | | 93.7% | | 1,057 | | 2,598 | | 8.2% |
Tampa-St. Petersburg, FL | | 4 | | 1,104 | | 180,224 | | 93.9% | | 1,294 | | 2,543 | | 8.1% |
Oklahoma City, OK | | 5 | | 1,658 | | 79,087 | | 95.9% | | 696 | | 1,994 | | 6.3% |
Dallas, TX | | 4 | | 985 | | 140,113 | | 95.6% | | 1,300 | | 2,106 | | 6.7% |
Indianapolis, IN | | 4 | | 916 | | 91,655 | | 94.9% | | 1,054 | | 1,621 | | 5.1% |
Myrtle Beach, SC - Wilmington, NC | | 3 | | 628 | | 64,441 | | 95.3% | | 1,046 | | 1,339 | | 4.2% |
Charleston, SC | | 2 | | 518 | | 80,157 | | 95.0% | | 1,299 | | 1,159 | | 3.7% |
Orlando, FL | | 1 | | 297 | | 49,038 | | 95.1% | | 1,457 | | 720 | | 2.3% |
Charlotte, NC | | 1 | | 208 | | 42,254 | | 94.3% | | 1,458 | | 615 | | 1.9% |
Asheville, NC | | 1 | | 252 | | 28,876 | | 96.0% | | 1,140 | | 602 | | 1.9% |
Chattanooga, TN (a) | | 2 | | 295 | | 27,654 | | 98.7% | | 1,003 | | 487 | | 1.5% |
St. Louis, MO | | 1 | | 152 | | 33,652 | | 95.8% | | 1,480 | | 452 | | 1.4% |
Huntsville, AL | | 1 | | 178 | | 16,560 | | 98.4% | | 1,062 | | 421 | | 1.3% |
Baton Rouge, LA (b) | | 1 | | 264 | | 27,231 | | 93.2% | | 913 | | 424 | | 1.3% |
Total/Weighted Average | | 58 | | 15,805 | | $1,870,632 | | 94.4% | | $1,113 | | $31,554 | | 100.0% |
| | | | | | | | | | | | | | |
| (a) | Market includes two properties classified as held for sale as of September 30, 2020 and one sold in October 2020. |
| (b) | Market includes one property classified as held for sale as of September 30, 2020. |
21
VALUE ADD SUMMARY
PROJECT LIFE TO DATE AS OF SEPTEMBER 30, 2020
| | | | | | | | | Renovation Costs per Unit (b) | | |
Property | Market | Percentage Complete | | Total Units To Be Renovated | Units Complete | Units Leased | Rent Premium (a) | % Rent Increase | Interior | Exterior | Total | ROI - Interior Costs(c) | ROI - Total Costs (d) |
| | | | | | | | | | | | | |
Ongoing | | | | | | | | | | | | | |
Crestmont | Atlanta, GA | 95.7% | | 208 | 199 | 194 | 151 | 16.3% | 12,276 | 7,742 | 20,018 | 14.8% | 9.1% |
The Village at Auburn | Raleigh-Durham, NC | 89.9% | | 328 | 295 | 273 | 178 | 17.0% | 14,500 | 2,108 | 16,609 | 14.7% | 12.8% |
Jamestown (f) | Louisville, KY | 85.5% | | 296 | 253 | 256 | 285 | 34.4% | 15,242 | 5,161 | 21,203 | 22.5% | 15.9% |
Haverford | Lexington, KY | 84.4% | | 160 | 135 | 134 | 90 | 10.6% | 5,501 | 798 | 6,299 | 19.7% | 17.2% |
Pointe at Canyon Ridge | Atlanta, GA | 79.8% | | 494 | 394 | 386 | 171 | 17.8% | 9,016 | 1,773 | 10,789 | 22.7% | 19.0% |
Schirm Farms (f) | Columbus, OH | 77.7% | | 264 | 205 | 203 | 87 | 10.2% | 7,754 | 613 | 8,367 | 13.5% | 12.5% |
Stonebridge Crossing | Memphis, TN | 73.4% | | 500 | 367 | 343 | 141 | 16.7% | 10,129 | 1,131 | 11,261 | 16.7% | 15.1% |
Oxmoor (f) | Louisville, KY | 73.1% | | 432 | 316 | 308 | 190 | 21.1% | 16,124 | 127 | 16,471 | 14.1% | 13.8% |
Arbors River Oaks | Memphis, TN | 71.7% | | 191 | 137 | 133 | 255 | 22.2% | 10,620 | 561 | 11,180 | 28.8% | 27.4% |
Creekside Corners | Atlanta, GA | 71.6% | | 444 | 318 | 304 | 176 | 18.6% | 8,950 | 1,314 | 10,264 | 23.6% | 20.6% |
Brunswick Point (f) | Wilmington, NC | 69.4% | | 288 | 200 | 195 | 61 | 6.2% | 6,928 | 56 | 6,984 | 10.6% | 10.5% |
The Commons at Canal Winchester | Columbus, OH | 61.7% | | 264 | 163 | 151 | 216 | 24.8% | 10,736 | 402 | 11,137 | 24.2% | 23.3% |
Vantage at Hillsborough | Tampa, FL | 53.4% | | 348 | 186 | 187 | 172 | 16.4% | 14,251 | 2,155 | 16,406 | 14.5% | 12.6% |
Lucerne (f) | Tampa, FL | 45.3% | | 276 | 125 | 121 | 230 | 20.5% | 14,760 | 634 | 15,240 | 18.7% | 19.1% |
Waterford Landing | Atlanta, GA | 35.4% | | 260 | 92 | 98 | 142 | 13.6% | 8,728 | 685 | 9,413 | 19.6% | 18.1% |
North Park | Atlanta, GA | 27.7% | | 224 | 62 | 67 | 129 | 12.4% | 8,344 | 268 | 8,612 | 18.6% | 18.0% |
Avalon Oaks | Columbus, OH | 17.9% | | 235 | 42 | 66 | 274 | 31.6% | 11,751 | 1,021 | 12,772 | 28.0% | 25.7% |
Total/Weighted Average | | | | 5,212 | 3,489 | 3,419 | $171 | 18.3% | $11,179 | $1,731 | $12,910 | 18.4% | 15.9% |
| | | | | | | | | | | | | |
On hold (e) | | | | | | | | | | | | | |
Rocky Creek | Tampa, FL | 0.0% | | 264 | 0 | 0 | - | 0.0% | - | - | - | 0.0% | 0.0% |
Meadows | Louisville, KY | 0.0% | | 400 | 0 | 0 | - | 0.0% | - | - | - | 0.0% | 0.0% |
Westmont Commons | Asheville, NC | 0.0% | | 252 | 0 | 0 | - | 0.0% | - | - | - | 0.0% | 0.0% |
Walnut Hill | Memphis, TN | 0.0% | | 362 | 0 | 0 | - | 0.0% | - | - | - | 0.0% | 0.0% |
Lenoxplace | Raleigh-Durham, NC | 0.0% | | 268 | 0 | 0 | - | 0.0% | - | - | - | 0.0% | 0.0% |
Thornhill | Raleigh-Durham, NC | 0.0% | | 318 | 0 | 0 | - | 0.0% | - | - | - | 0.0% | 0.0% |
Total/Weighted Average | | | | 1,864 | 0 | 0 | $- | 0.0% | $- | $- | $- | 0.0% | 0.0% |
| | | | | | | | | | | | | |
Grand Total/Weighted Average | | | | 7,076 | 3,489 | 3,419 | $171 | 18.3% | $11,179 | $1,731 | $12,910 | 18.4% | 15.9% |
| (a) | The rent premium reflects the per unit per month difference between the rental rate on the renovated unit and the market rent for an unrenovated unit as of the date presented, as determined by management consistent with its customary rent-setting and evaluation procedures. |
| (b) | Includes all costs to renovate the interior units and make certain exterior renovations, including clubhouses and amenities. Interior costs per unit are based on units leased. Exterior costs per unit are based on total units at the community. Excludes overhead costs to support and manage the value add program as those costs relate to the entire program and cannot be allocated to individual projects. |
| (c) | Calculated using the rent premium per unit per month, multiplied by 12, divided by the interior renovation costs per unit. |
| (d) | Calculated using the rent premium per unit per month, multiplied by 12, divided by the total renovation costs per unit. |
| (e) | Renovations at these properties have been delayed as we evaluate market conditions amid the COVID-19 pandemic. |
| (f) | Renovations at these properties were paused in March 2020, but were restarted in June and July 2020. |
22
CAPITAL RECYCLING
Dollars in thousands with respect to Contract Price and Price per Unit
| | | | | | | | | | | | |
| | | | | | | | | | | | |
Acquisitions to Date 2020 | | Market | | Units | | Acquisition Date | | Contract Price | | Price per Unit | | Average Rent Per Unit |
The Adley at Craig Ranch | | Dallas, TX | | 251 | | February 11, 2020 | | $51,204 | | $204 | | $1,552 |
| | | | | | | | | | | | |
Total | | | | 251 | | | | 51,204 | | $204 | | $1,552 |
| | | | | | | | | | | | |
| | | | | | | | | | | | |
| | | | | | | | | | | | |
Dispositions to Date 2020 | | Location | | Units | | Disposition Date | | Contract Price | | Price per Unit | | Average Rent Per Unit |
Trails at Signal Mountain (a) | | Chattanooga, TN | | 172 | | October 27, 2020 | | $20,000 | | $116 | | $989 |
| | | | | | | | | | | | |
Total | | | | 172 | | | | 20,000 | | $116 | | $989 |
| | | | | | | | | | | | |
(a) Transaction closed subsequent to September 30, 2020.
23
DEBT SUMMARY AS OF SEPTEMBER 30, 2020
Dollars in thousands
| | Amount | | Weighted Average Rate (c) | | Type | | Weighted Average Maturity (in years) | |
Debt: | | | | | | | | | |
Unsecured credit facility (a) | | $241,803 | | 1.6% | | Floating | | 2.6 | |
Unsecured term loans (b) | | 300,000 | | 1.5% | | Floating | | 3.6 | |
Mortgages | | 467,005 | | 3.9% | | Fixed | | 3.4 | |
Unamortized deferred financing costs | | (4,571) | | | | | | | |
Total Debt | | 1,004,237 | | 2.6% | | | | 3.3 | |
Market Equity Capitalization, at period end | | 1,107,144 | | | | | | | |
Total Capitalization | | $2,111,381 | | | | | | | |
| (a) | Credit facility total capacity is $350,000, comprised entirely of an unsecured revolving line of credit, of which $241,803 was drawn as of September 30, 2020. The maturity date of borrowings under the revolving line of credit is May 9, 2023. |
| (b) | Comprised of a $200,000 unsecured term loan with a maturity date of January 17, 2024 and a $100,000 unsecured term loan with a maturity date of November 20, 2024. |
| (c) | Represents the weighted average of the contractual interest rates in effect as of quarter-end without regard to any interest rate swaps or collars. The effective interest rate during 3Q 2020 on our floating rate debt, after giving effect to the impact of interest rate swaps and collars, was 3.0%. |
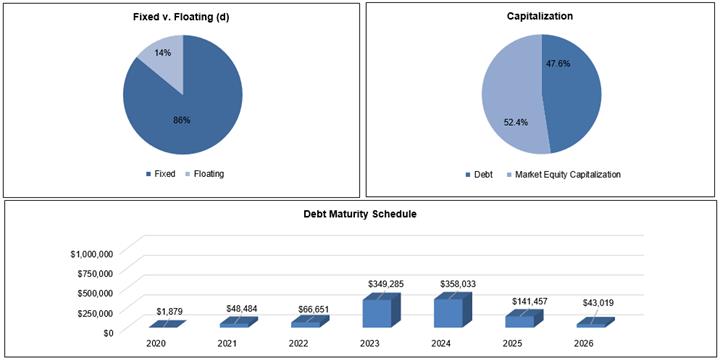
| (d) | As of September 30, 2020, we maintained a float-to-fixed interest swap with a $150,000 notional amount. This swap, which expires on September 17, 2021 and has a fixed rate of 1.1325%, has converted $150,000 of floating rate debt to fixed rate debt. We also maintain: (1) an interest rate collar with a $100,000 notional amount, which expires on November 20, 2024, has a floor of 1.25% and a cap of 2.00%, and (2) an interest rate collar with a $150,000 notional amount, which expires on January 17, 2024, has a floor of 2.25% and a cap of 2.50%. These collars have converted $250,000 of floating rate debt to fixed rate debt when LIBOR is above the cap rate or below the floor rate. |
24
DEBT COVENANT AND UNENCUMBERED ASSET STATS AS OF SEPTEMBER 30, 2020
Dollars in thousands
Debt Covenant Summary (a) | Requirement | Actual | Compliance |
Consolidated leverage ratio | ≤ 60% | 47.4% | Yes |
Consolidated fixed charge coverage ratio | ≥ 1.5x | 2.4 | Yes |
Unsecured leverage ratio | ≤ 60% | 47.8% | Yes |
Unencumbered asset debt service ratio | ≥ 1.3x | 1.8 | Yes |
| (a) | For a complete listing of all debt covenants along with definitions of each covenant calculation see the Unsecured Credit Facility and Unsecured Term Loan Agreements, which are included as exhibits 10.20, 10.6, and 10.15 of our 2019 Form 10-K. |
Encumbered & Unencumbered Statistics | | | Total Units | | % of Total | | Gross Assets | | % of Total | | Q3 2020 NOI | | % of Total |
Unencumbered assets | | | 9,087 | | 57.5% | | $1,059,195 | | 55.3% | | $17,785 | | 55.8% |
Encumbered assets | | | 6,718 | | 42.5% | | 855,705 | | 44.7% | | 14,087 | | 44.2% |
| | | 15,805 | | 100.0% | | $1,914,900 | | 100.0% | | $31,872 | | 100.0% |
25
Definitions
Average Effective Monthly Rent per Unit
Average effective rent per unit represents the average of gross rent amounts, divided by the average occupancy (in units) for the period presented. We believe average effective rent is a helpful measurement in evaluating average pricing. This metric, when presented, reflects the average effective rent per month.
Average Occupancy
Average occupancy represents the average occupied units for the reporting period divided by the average of total units available for rent for the reporting period.
EBITDA and Adjusted EBITDA
Each of EBITDA and Adjusted EBITDA is a non-GAAP financial measure. EBITDA is defined as net income before interest expense including amortization of deferred financing costs, income tax expense, and depreciation and amortization expenses. Adjusted EBITDA is EBITDA before certain other non-cash or non-operating gains or losses related to items such as asset sales, debt extinguishments and acquisition related debt extinguishment expenses, casualty losses, and abandoned deal costs. We consider each of EBITDA and Adjusted EBITDA to be an appropriate supplemental measure of performance because it eliminates interest, income taxes, depreciation and amortization, and other non-cash or non-operating gains and losses, which permits investors to view income from operations without these non-cash or non-operating items. Our calculation of Adjusted EBITDA differs from the methodology used for calculating Adjusted EBITDA by certain other REITs and, accordingly, our Adjusted EBITDA may not be comparable to Adjusted EBITDA reported by other REITs.
Funds From Operations (“FFO”) and Core Funds From Operations (“CFFO”)
We believe that FFO and CFFO, each of which is a non-GAAP financial measure, are additional appropriate measures of the operating performance of a REIT and IRT in particular. We compute FFO in accordance with the standards established by the National Association of Real Estate Investment Trusts, or NAREIT, as net income or loss (computed in accordance with GAAP), excluding real estate-related depreciation and amortization expense, gains or losses on sales or impairment of real estate and the cumulative effect of changes in accounting principles.
CFFO is a computation made by analysts and investors to measure a real estate company’s operating performance by removing the effect of items that do not reflect ongoing property operations, including stock compensation expense, depreciation and amortization of other items not included in FFO, amortization of deferred financing costs, and other non-cash or non-operating gains or losses related to items such as casualty losses and abandoned deal costs.
Our calculation of CFFO differs from the methodology used for calculating CFFO by certain other REITs and, accordingly, our CFFO may not be comparable to CFFO reported by other REITs. Our management utilizes FFO and CFFO as measures of our operating performance, and believes they are also useful to investors, because they facilitate an understanding of our operating performance after adjustment for certain non-cash or non-operating items that are required by GAAP to be expensed but may not necessarily be indicative of current operating performance and that may not accurately compare our operating performance between periods. Furthermore, although FFO, CFFO and other supplemental performance measures are defined in various ways throughout the REIT industry, we believe that FFO and CFFO provide investors with additional useful measures to compare our financial performance to certain other REITs. Neither FFO nor CFFO is equivalent to net income or cash generated from operating activities determined in accordance with GAAP. Furthermore, FFO and CFFO do not represent amounts available for management’s discretionary use because of needed capital replacement or expansion, debt service obligations or other commitments or uncertainties. Neither FFO nor CFFO should be considered as an alternative to net income as an indicator of our operating performance or as an alternative to cash flow from operating activities as a measure of our liquidity.
Interest Coverage
Interest coverage is a ratio computed by dividing Adjusted EBITDA by interest expense.
26
Net Debt
Net debt, a non-GAAP financial measure, equals total debt less cash and cash equivalents. The following table provides a reconciliation of total debt to net debt (Dollars in thousands).
We present net debt because management believes it is a useful measure of our credit position and progress toward reducing leverage. The calculation is limited because we may not always be able to use cash to repay debt on a dollar for dollar basis.
| As of |
| September 30, 2020 | | June 30, 2020 | | March 31, 2020 | | December 31, 2019 | | September 30, 2019 |
Total debt | $1,004,237 | | $1,008,911 | | $1,049,541 | | $985,572 | | $979,330 |
Less: cash and cash equivalents | (9,891) | | (11,652) | | (57,436) | | (9,888) | | (6,587) |
Total net debt | $994,346 | | $997,259 | | $992,105 | | $975,684 | | $972,743 |
| | | | | | | | | |
Net Operating Income
We believe that Net Operating Income (“NOI”), a non-GAAP financial measure, is a useful supplemental measure of its operating performance. We define NOI as total property revenues less total property operating expenses, excluding interest expenses, depreciation and amortization, property management expenses, and general and administrative expenses. Other REITs may use different methodologies for calculating NOI, and accordingly, our NOI may not be comparable to other REITs. We believe that this measure provides an operating perspective not immediately apparent from GAAP operating income or net income insofar as the measure reflects only operating income and expense at the property level. We use NOI to evaluate performance on a same store and non-same store basis because NOI measures the core operations of property performance by excluding corporate level expenses, financing expenses, and other items not related to property operating performance and captures trends in rental housing and property operating expenses. However, NOI should only be used as an alternative measure of our financial performance.
Same Store Properties and Same Store Portfolio
We review our same store portfolio at the beginning of each calendar year. Properties are added into the same store portfolio if they were owned at the beginning of the previous year. Properties that are held-for-sale or have been sold are excluded from the same store portfolio.
Total Gross Assets
Total Gross Assets equals total assets plus accumulated depreciation and accumulated amortization, including fully depreciated or amortized real estate and real estate related assets. The following table provides a reconciliation of total assets to total gross assets (Dollars in thousands).
| As of |
| September 30, 2020 | | June 30, 2020 | | March 31, 2020 | | December 31, 2019 | | September 30, 2019 |
Total assets | $1,700,428 | | $1,708,912 | | $1,757,138 | | $1,664,106 | | $1,653,017 |
Plus: accumulated depreciation | 194,645 | | 187,758 | | 172,789 | | 158,435 | | 148,924 |
Plus: accumulated amortization | 19,827 | | 19,754 | | 19,567 | | 19,197 | | 19,232 |
Total gross assets | $1,914,900 | | $1,916,424 | | $1,949,494 | | $1,841,738 | | $1,821,173 |
27