
Analyst and Investor Meeting November 12, 2013 1 1 Agenda: 2013 Analyst and Investor Meeting Overview Mike Lamach Innovation Paul Camuti Operations Todd Wyman Climate Didier Teirlinck BREAK: 15 minutes Res. HVAC Gary Michel Industrial Robert Zafari Financial Sue Carter Q&A 2 Safe Harbor This presentation includes “forward-looking statements,” which are statements that are not historical facts, including statements that relate to the mix of and demand for our products, performance of the markets in which we operate, the proposed spin-off of our commercial and residential security businesses, our new reporting structure, our expectation regarding charges related to our restructuring, our capital allocation strategy, and our projected and proforma financial performance for the 2013 full-year and beyond. These forward-looking statements are based on our current expectations and are subject to risks and uncertainties, which may cause actual results to differ materially from our current expectations. Such factors include, but are not limited to, our ability to successfully, if ever, complete the proposed spinoff; our ability to fully realize the expected benefits of the proposed spinoff; global economic conditions, demand for our products and services and tax law changes. Additional factors that could cause such differences can be found in our Form 10-K for the year ended December 31, 2012, Form 10-Q for the quarters ended March 31, 2013, June 30, 2013 and September 30, 2013 and in our other SEC filings. We assume no obligation to update these forward-looking statements. This presentation also includes adjusted non-GAAP financial information which should be considered supplemental to, not a substitute for, or as superior to, the financial measure calculated in accordance with GAAP. Further information about the adjusted non-GAAP financial information, including why management believes the information is useful, the purposes for which management uses the information and reconciliation to the nearest GAAP measure, is included in financial tables attached to the earnings news release that can be found at www.ingersollrand.com. All data for beyond the third quarter of 2013 are estimates.
Analyst and Investor Meeting November 12, 2013 2 3 4 Positioning Ingersoll Rand to Deliver Shareholder Value Operational Excellence Balanced Capital Allocation Accelerating Revenue Growth Strong, recognized brands Well positioned in both geographic and end markets Sustainable, Profitable Growth and Shareholder Value Leading market shares
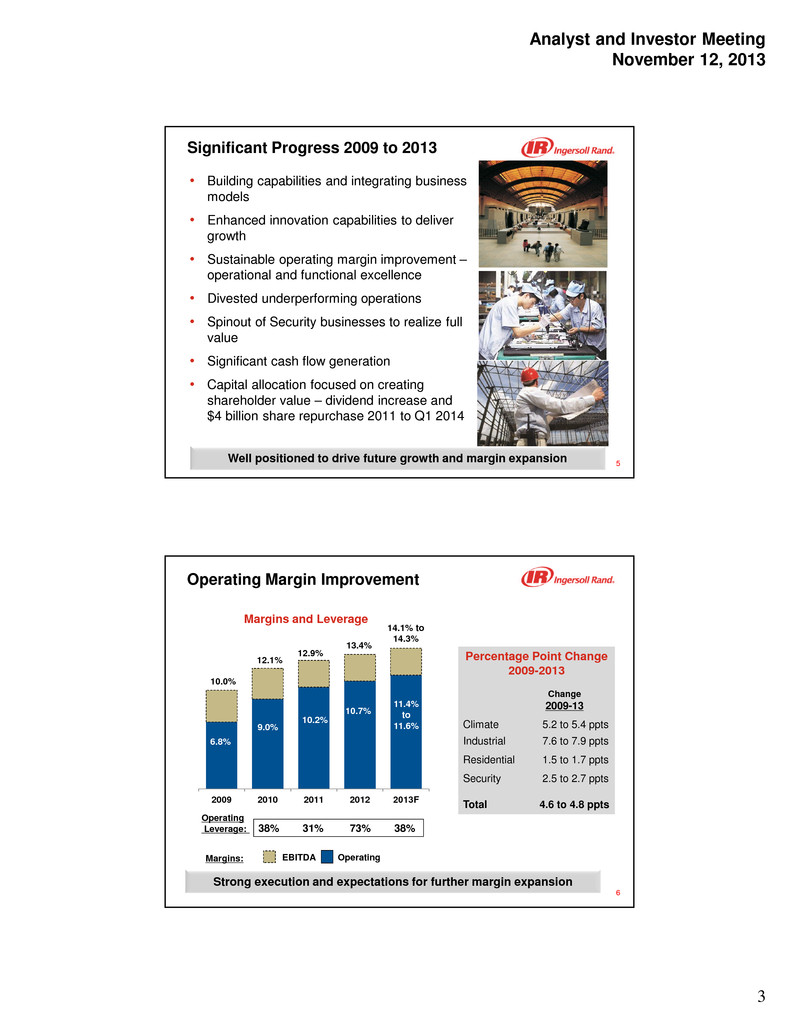
Analyst and Investor Meeting November 12, 2013 3 5 • Building capabilities and integrating business models • Enhanced innovation capabilities to deliver growth • Sustainable operating margin improvement – operational and functional excellence • Divested underperforming operations • Spinout of Security businesses to realize full value • Significant cash flow generation • Capital allocation focused on creating shareholder value – dividend increase and $4 billion share repurchase 2011 to Q1 2014 Well positioned to drive future growth and margin expansion Significant Progress 2009 to 2013 6 Operating Margin Improvement 2009 2010 2011 2012 2013F 6.8% 9.0% 10.2% 10.0% 12.9% 12.1% 13.4% 10.7% Margins and Leverage 38% 31% 73% 38% 14.1% to 14.3% 11.4% to 11.6% Percentage Point Change 2009-2013 Change 2009-13 Climate 5.2 to 5.4 ppts Industrial 7.6 to 7.9 ppts Residential 1.5 to 1.7 ppts Security 2.5 to 2.7 ppts Total 4.6 to 4.8 ppts Strong execution and expectations for further margin expansion Margins: EBITDA Operating Operating Leverage:

Analyst and Investor Meeting November 12, 2013 4 7 Capital Allocation Annual Dividend Per Share Share Repurchase, $B 2011 2012 2013 to Q1 2014 $0.84 $1.16 $2.0 Over $4.5 billion returned to shareholders in 3 years • Future dividends to reach peer payout ratios • 2013 dividend exceeded 2008 peak of $0.72 by 17% # Shares Repurchased 36.3M 18.4M • $2B authorization ‒ Started in Q2 2013 ‒ 14 million shares for $800M repurchased Q3 YTD ‒ Targeted for Q1 2014 completion $0.50 $0.28 $0.43 $0.64 $0.84 2009 2010 2011 2012 2013 8 New Organization Structure • New structure to focus on core Climate and Industrial businesses • Increase focus on growth with intentional enterprise-wide rigor • Continued commitment to Operational Excellence • Reduce complexity and cost • Optimize common assets, technology and manufacturing commonalities • Effective with Q4 2013 results New structure to accelerate growth and to reduce complexity and overhead costs Climate Industrial Commercial HVAC Residential HVAC Transport Refrigeration Compressed Air Systems and Services Power Tools Fluid Management Material Handling Club Car

Analyst and Investor Meeting November 12, 2013 5 9 • Leading global brands and market positions • Strong long-term growth drivers – Macro drivers are energy efficiency and sustainability – Large installed base drives replacement business and parts and service growth – Global footprint and exposure to attractive growing markets – Organic growth enhanced by innovation – Market recoveries • Product/service offering underpinned by shared technologies, materials, manufacturing, processes and supply chain • Continued margin and cash flow improvement opportunity from operational/functional excellence “New” Ingersoll Rand: Foundational Strengths A world leader in creating comfortable, sustainable and efficient environments 10 30% 17% 13% 21% 15% 4% Golf Non-Res Building, N. America Non-Res Building, OverseasResidential Building, Americas Industrial/ Process Transport Refrigeration End Markets Climate 75% Industrial 25% By Segment 2012 Revenue Profile for New Ingersoll Rand By Geography North America 63% Eur/ME 15% Asia 16% Latin America 2012 Revenue: ~$12.0B 69% New equipment 31% Aftermarket Emerging markets accounted for 27% of total revenue 6%

Analyst and Investor Meeting November 12, 2013 6 11 Ability to Capitalize on Industry Macro Drivers Trends Opportunities Energy Efficiency/ Sustainability • Reduce energy costs • High-performance equipment: compression & thermal management, advanced controls Rising Food Costs, Spoilage and Safety Issues • Fill increased demand for food transport and preservation to reduce spoilage Global Industrialization • Reduce customer costs and improve efficiency for air and process cooling Large Installed Base that Continues to Age • Replacement equipment and ongoing parts and service streams. • Service expansion: new services and geographic expansion Recovery of Commercial and Residential Building Markets • New products in place to capture growth as markets recover in developed economies 12 Core Technical Capabilities Shared Across Businesses Compression Materials and Chemistry Thermal Management Smart, Wireless Devices Remote Services and Analytics Vibration/Acoustics Engineering Precision Machining Modeling and Simulation
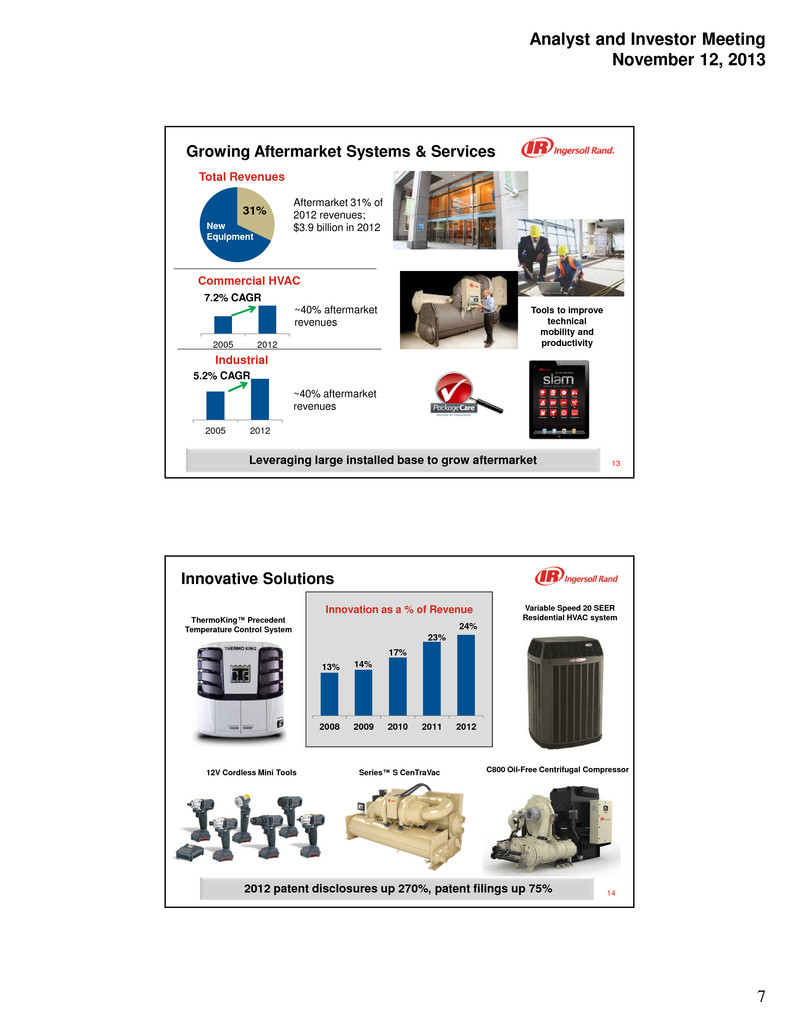
Analyst and Investor Meeting November 12, 2013 7 13 Growing Aftermarket Systems & Services Leveraging large installed base to grow aftermarket Total Revenues Commercial HVAC Industrial New Equipment 31% 2005 2012 7.2% CAGR 2005 2012 5.2% CAGR Aftermarket 31% of 2012 revenues; $3.9 billion in 2012 ~40% aftermarket revenues ~40% aftermarket revenues Tools to improve technical mobility and productivity 14 2008 2009 2010 2011 2012 24% Innovative Solutions 13% 14% 17% 23% Innovation as a % of Revenue C800 Oil-Free Centrifugal Compressor 2012 patent disclosures up 270%, patent filings up 75% Variable Speed 20 SEER Residential HVAC systemThermoKing™ Precedent Temperature Control System 12V Cordless Mini Tools Series™ S CenTraVac

Analyst and Investor Meeting November 12, 2013 8 15 Manufacturing Facilities 94 67 49 2009 2013 2013 Post Spin Operational Excellence • Restructuring of manufacturing footprint largely completed in 2013 • Improved pricing processes: price exceeded material inflation for 10 consecutive quarters • Material productivity – Global procurement – Centralize spend • Lean transformation – Operations – Strong improvement in key metrics – Covers 40% of conversion costs in 2013, 60% by 2014 • Lean transformation – Functional – Program to reduce back office costs Past Due Days Cycle Time Employee Engagement Cost Leverage Building capabilities: increasing margins and working capital efficiency Value Streams 16 Operational Excellence Value Steams: Past 3 years Quote Cash • Speed to market as a competitive advantage • Reduce cycle time and waste • Improve working capital turns • Increase market share and margins Sales & Order Management SourcingApplied Engineering Build & Ship Collection Significant progress and results delivered Customer Value Customer
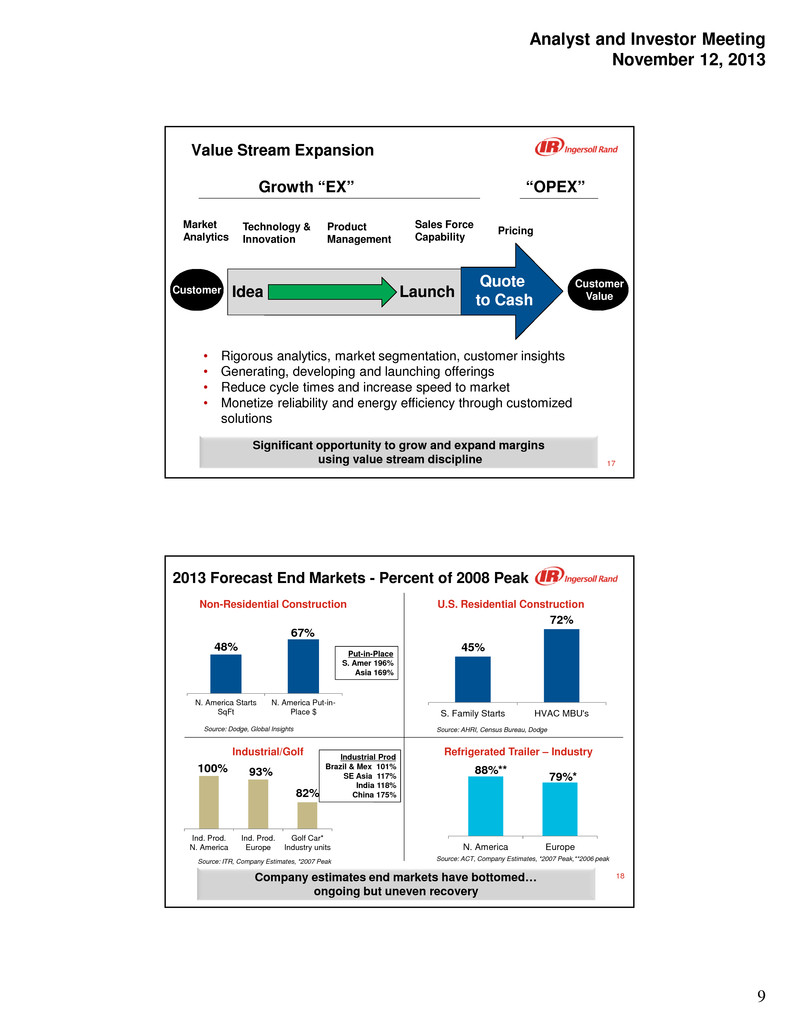
Analyst and Investor Meeting November 12, 2013 9 17 Value Stream Expansion “OPEX”Growth “EX” Market Analytics Product Management Technology & Innovation Sales Force Capability Pricing • Rigorous analytics, market segmentation, customer insights • Generating, developing and launching offerings • Reduce cycle times and increase speed to market • Monetize reliability and energy efficiency through customized solutions LaunchIdea Significant opportunity to grow and expand margins using value stream discipline Customer Customer Value Quote to Cash 18 93% 82% Ind. Prod. N. America Ind. Prod. Europe Golf Car* Industry units 100% 2013 Forecast End Markets - Percent of 2008 Peak Company estimates end markets have bottomed… ongoing but uneven recovery Non-Residential Construction U.S. Residential Construction Industrial/Golf Refrigerated Trailer – Industry 48% 67% N. America Starts SqFt N. America Put-in- Place $ Source: Dodge, Global Insights Put-in-Place S. Amer 196% Asia 169% 45% 72% S. Family Starts HVAC MBU's Source: AHRI, Census Bureau, Dodge Source: ITR, Company Estimates, *2007 Peak Source: ACT, Company Estimates, *2007 Peak,**2006 peak N. America Europe 79%* 88%** Industrial Prod Brazil & Mex 101% SE Asia 117% India 118% China 175%
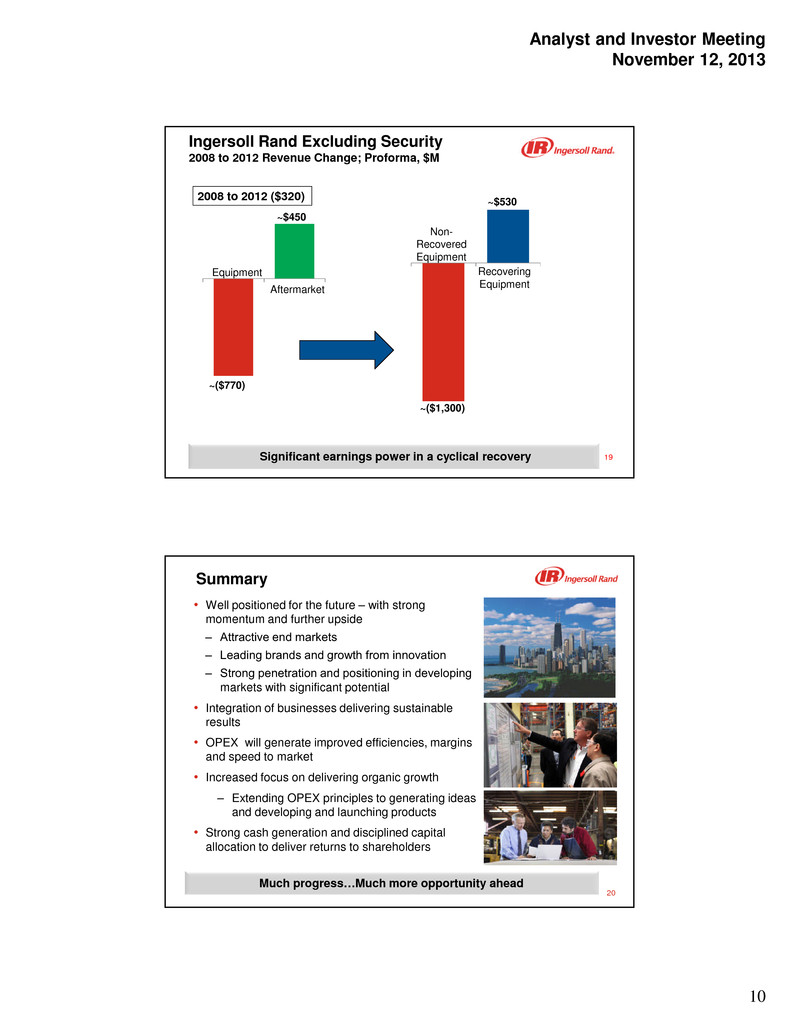
Analyst and Investor Meeting November 12, 2013 10 19 Ingersoll Rand Excluding Security 2008 to 2012 Revenue Change; Proforma, $M 2008 to 2012 ($320) ~($1,300) Recovering Equipment Non- Recovered Equipment ~$530 Significant earnings power in a cyclical recovery Equipment Aftermarket ~($770) ~$450 20 Summary • Well positioned for the future – with strong momentum and further upside ‒ Attractive end markets ‒ Leading brands and growth from innovation ‒ Strong penetration and positioning in developing markets with significant potential • Integration of businesses delivering sustainable results • OPEX will generate improved efficiencies, margins and speed to market • Increased focus on delivering organic growth – Extending OPEX principles to generating ideas and developing and launching products • Strong cash generation and disciplined capital allocation to deliver returns to shareholders Much progress…Much more opportunity ahead

Analyst and Investor Meeting November 12, 2013 11 Innovation/Technology Paul Camuti Senior Vice President, Innovation and Chief Technology Officer November 12, 2013 22 External Drivers that Impact Ingersoll Rand Energy Productivity Global Industrialization Sustainability and Climate Change Ubiquitous Connective Technologies Continue to expand our market leadership in reliability and energy efficiency / sustainability

Analyst and Investor Meeting November 12, 2013 12 23 2014 Technology Trends Impacting our Innovation Agenda • Information and Communications – The internet of things – Wireless – Large scale data analytics • Materials – Light weight, high strength – Energy storage – Refrigerants • Additive Manufacturing / 3D Printing Focus on external drivers and trends Opportunity for Ingersoll Rand • Remote Service & Energy Service • New Solution offers for systems • Improve Energy Efficiency • Improve Reliability • Product Development cycle time 24 Where We Are Today ~2,800 Technologists Worldwide Europe 300 Engineers India 550 Engineers Davidson, NC Minneapolis, MN Tyler, TX LaCrosse, WI St. Paul, MN Prague, Czech Republic* Epinal, France Oberhausen, Germany Vignate, Italy Bangalore* Chennai* Shanghai* Taicang* Investing in growth markets and services North America 1,410 Engineers China 545 Engineers Networks of Excellence Modeling & Simulation Materials & Chemistry *Engineering & Technology Center Locations
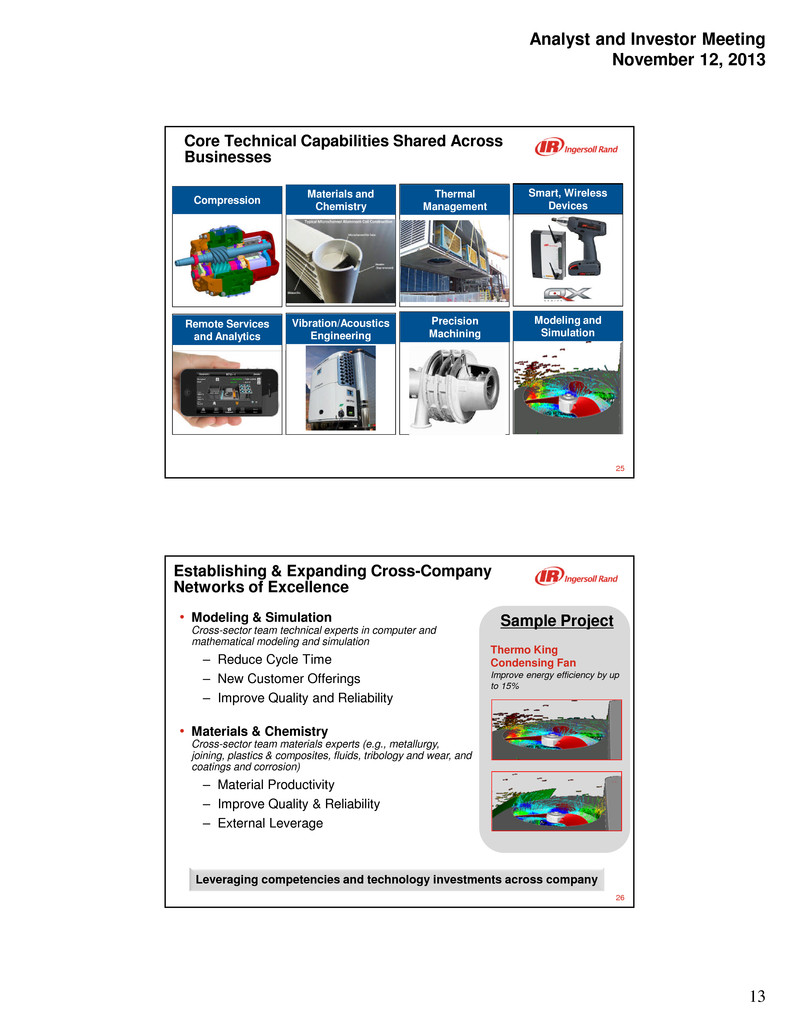
Analyst and Investor Meeting November 12, 2013 13 25 Core Technical Capabilities Shared Across Businesses Compression Materials and Chemistry Thermal Management Smart, Wireless Devices Remote Services and Analytics Vibration/Acoustics Engineering Precision Machining Modeling and Simulation 26 Establishing & Expanding Cross-Company Networks of Excellence • Modeling & Simulation Cross-sector team technical experts in computer and mathematical modeling and simulation – Reduce Cycle Time – New Customer Offerings – Improve Quality and Reliability • Materials & Chemistry Cross-sector team materials experts (e.g., metallurgy, joining, plastics & composites, fluids, tribology and wear, and coatings and corrosion) – Material Productivity – Improve Quality & Reliability – External Leverage Sample Project Thermo King Condensing Fan Improve energy efficiency by up to 15% Leveraging competencies and technology investments across company
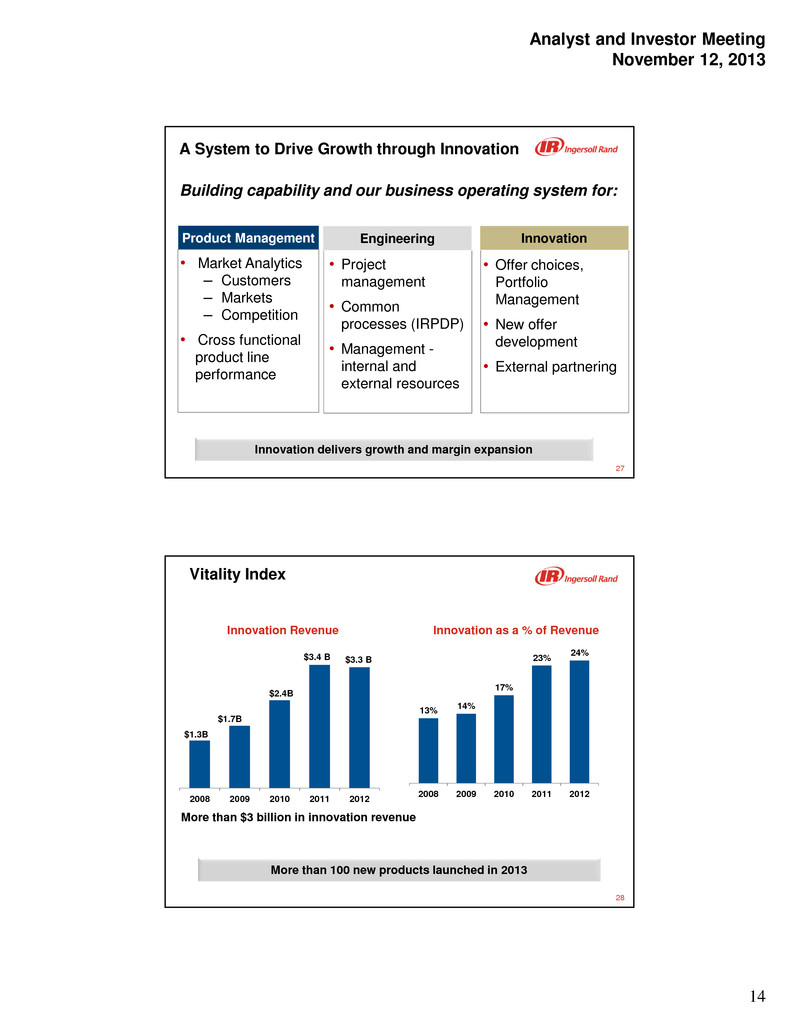
Analyst and Investor Meeting November 12, 2013 14 27 A System to Drive Growth through Innovation Building capability and our business operating system for: Innovation delivers growth and margin expansion • Offer choices, Portfolio Management • New offer development • External partnering • Market Analytics ‒ Customers ‒ Markets ‒ Competition • Cross functional product line performance • Project management • Common processes (IRPDP) • Management - internal and external resources Product Management Engineering Innovation 28 Vitality Index More than 100 new products launched in 2013 2008 2009 2010 2011 2012 $1.3B $2.4B $1.7B $3.3 B 13% 14% 17% 23% 24% 2008 2009 2010 2011 2012 Innovation as a % of RevenueInnovation Revenue More than $3 billion in innovation revenue $3.4 B
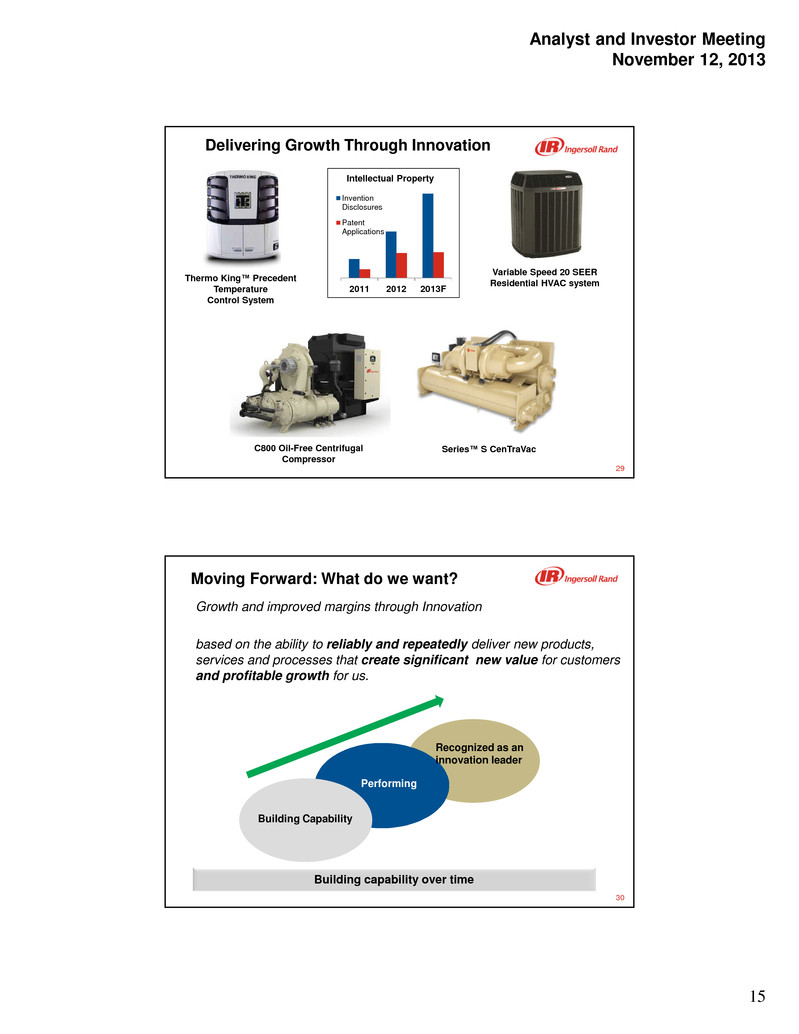
Analyst and Investor Meeting November 12, 2013 15 29 Delivering Growth Through Innovation Thermo King™ Precedent Temperature Control System C800 Oil-Free Centrifugal Compressor Series™ S CenTraVac Variable Speed 20 SEER Residential HVAC system Intellectual Property 2011 2012 2013F Invention Disclosures Patent Applications 30 Growth and improved margins through Innovation based on the ability to reliably and repeatedly deliver new products, services and processes that create significant new value for customers and profitable growth for us. Moving Forward: What do we want? Building capability over time Recognized as an innovation leader Performing Building Capability
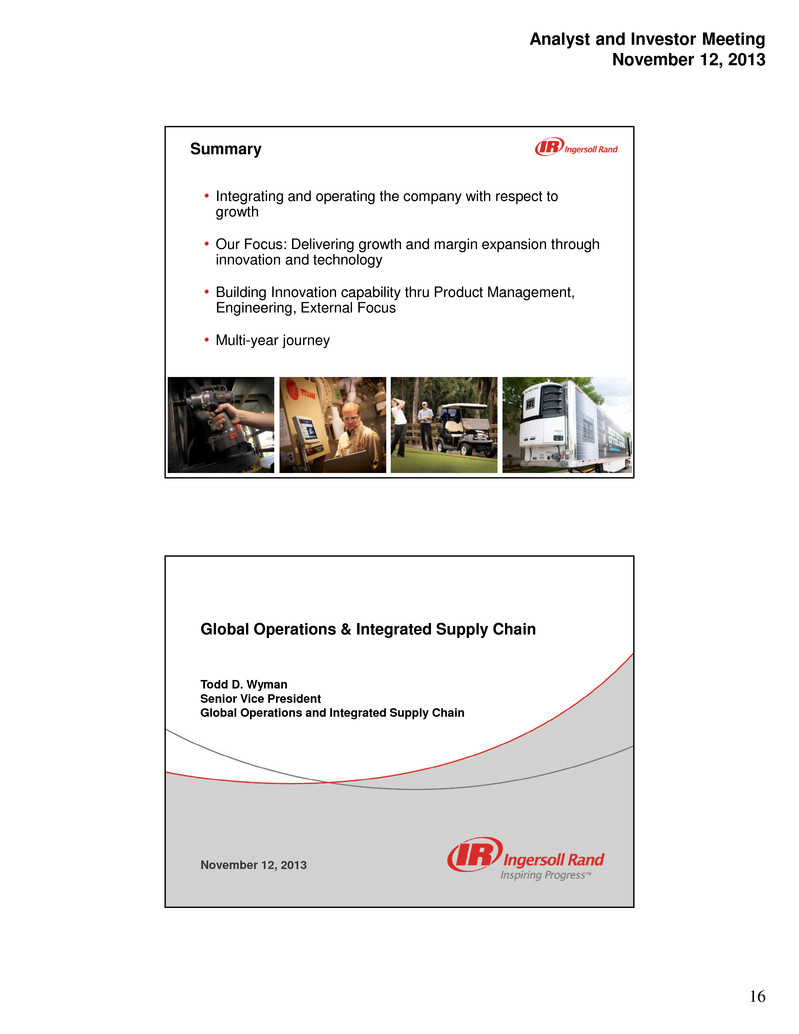
Analyst and Investor Meeting November 12, 2013 16 31 Summary • Integrating and operating the company with respect to growth • Our Focus: Delivering growth and margin expansion through innovation and technology • Building Innovation capability thru Product Management, Engineering, External Focus • Multi-year journey Global Operations & Integrated Supply Chain Todd D. Wyman Senior Vice President Global Operations and Integrated Supply Chain November 12, 2013

Analyst and Investor Meeting November 12, 2013 17 33 Agenda Operational Excellence • Strategy • Landscape • Capability Building • Lean Transformation • Global Procurement • Materials & Sales, Inventory and Operations Planning • Quality • Advanced Manufacturing Engineering 34 Operational Excellence Strategy • Balancing of “Inch wide & mile deep” strategy and continued expansion • Growth and people engagement focus • Expansion to Parts & Service to align with growth strategy Lean • Global Direct Material Commodities – Leveraging global spend through a local, regional and global supply base model • Business Facing Program Management – Collaborating with engineering and product management to support specific, prioritized growth and productivity programs • Support Functions – Leveraging global spend across indirect material, logistics and supplier development and quality Procurement • Quality & Advanced Manufacturing Engineering (AME) – Build best in class capabilities, processes and technology within an optimized footprint • Materials Management and Sales, Inventory & Operations Planning (SIOP) – Developing global standardized processes to improve delivery and cash performance Standard Processes
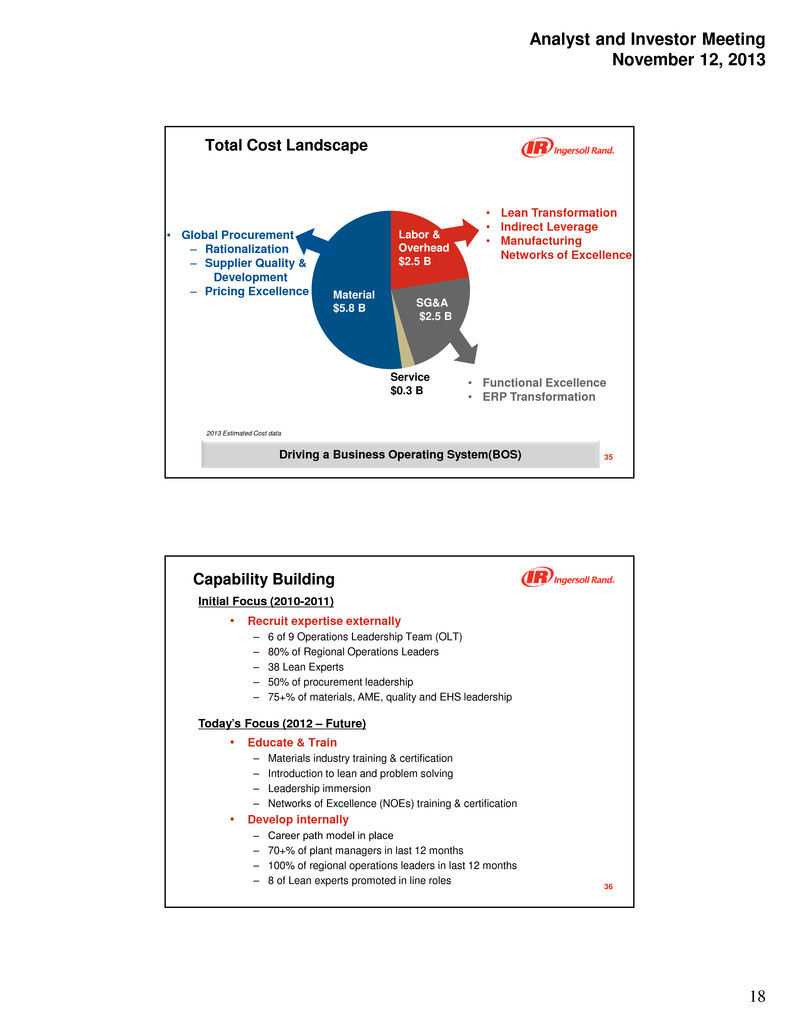
Analyst and Investor Meeting November 12, 2013 18 35 Labor & Overhead $2.5 B SG&A $2.5 B Total Cost Landscape 2013 Estimated Cost data • Lean Transformation • Indirect Leverage • Manufacturing Networks of Excellence • Functional Excellence • ERP Transformation • Global Procurement ‒ Rationalization ‒ Supplier Quality & Development ‒ Pricing Excellence Material $5.8 B Service $0.3 B Driving a Business Operating System(BOS) 36 Capability Building • Recruit expertise externally – 6 of 9 Operations Leadership Team (OLT) – 80% of Regional Operations Leaders – 38 Lean Experts – 50% of procurement leadership – 75+% of materials, AME, quality and EHS leadership Initial Focus (2010-2011) • Educate & Train – Materials industry training & certification – Introduction to lean and problem solving – Leadership immersion – Networks of Excellence (NOEs) training & certification • Develop internally ‒ Career path model in place – 70+% of plant managers in last 12 months – 100% of regional operations leaders in last 12 months – 8 of Lean experts promoted in line roles Today’s Focus (2012 – Future)

Analyst and Investor Meeting November 12, 2013 19 37 Lean Transformation • Less reliance on external coaching • Build out of internal resources – Regional and functional capability • Implement model value stream • Mature leadership immersion • Imbed continuous improvement through daily management and problem solving Capability Building Expansion • Value Streams – Progression on track … 85% coverage by 2016 – Connecting end to end, aligned to Product Growth Teams – Expansion into Parts, Services & Functions • Business Operating System – Organization design – Expand coverage, continuous improvement, and disciplined adherence to standard work Balancing between capability building and expansion 0 100 200 300 400 500 2013F 2014F 2015F 2016F Full-Time Dedicated Value Stream Change Agents 0 20 40 60 80 100 2013F 2014F 2015F 2016F Value Stream % Coverage 38 Lean Transformation Results 2013 - YTD Q3 Absolute Margin Expansion* 3.6% +3.5 ppts Cycle Time 27% N/A Inventory Turns 8.5X +2.4 Turns **Measured by Cost Leverage Past Due Days 28% +18.9 ppts Cost of Poor Quality 13% + 7.0 ppts Continued separation in performance improvement Difference Between Value Streams & Non Value Streams

Analyst and Investor Meeting November 12, 2013 20 39 Lean Transformation Results 2013 YTD results from value streams started in 2011 Past Due Days Cycle Time Inventory Turns Margin Expansion* Cost of Poor Quality 7%21% 6.7% 12%17% **Measured by Cost Leverage Expectation of continuous improvement cycle 40 Global Procurement: Organizational Focus Commodity Management • Mature commercial & technical expertise • Leverage commonality with total cost focus • Rationalize supply through 7 step process Business Partnering • Mature product and project management skills • Connectivity to business prioritization • Partner on delivering New Product Development & productivity Functional Teams • Functional expertise • Supplier quality & development • Global logistics & indirect material
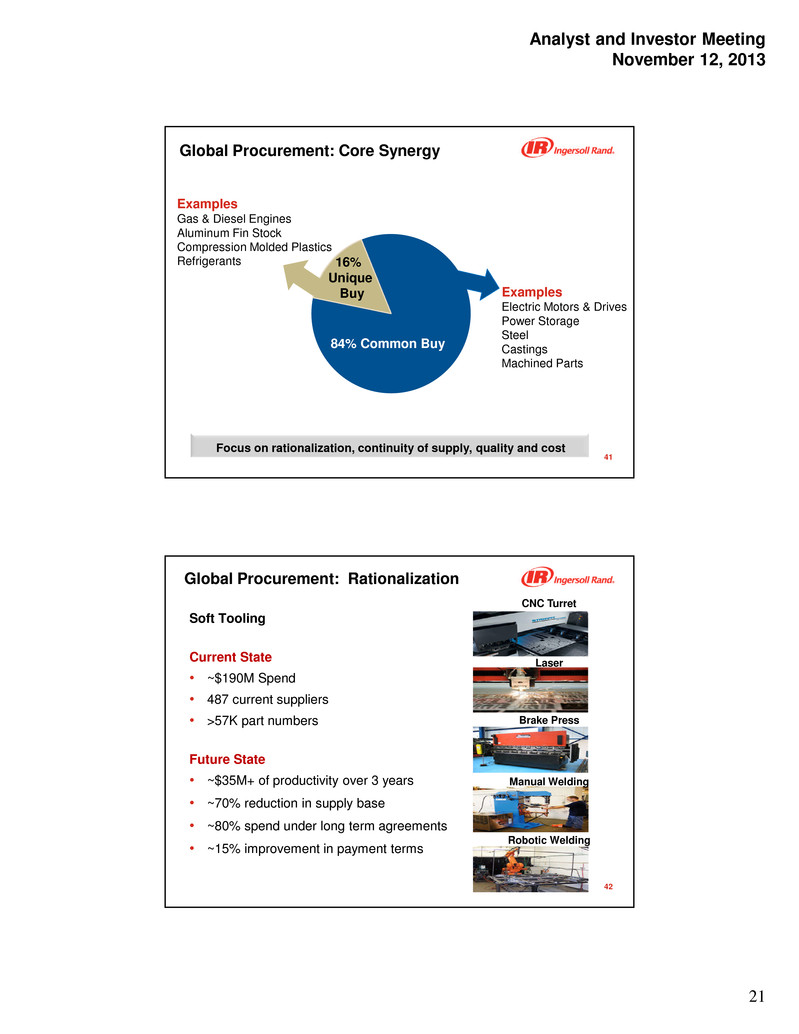
Analyst and Investor Meeting November 12, 2013 21 41 16% Unique Buy Examples Gas & Diesel Engines Aluminum Fin Stock Compression Molded Plastics Refrigerants Global Procurement: Core Synergy 84% Common Buy Examples Electric Motors & Drives Power Storage Steel Castings Machined Parts Focus on rationalization, continuity of supply, quality and cost 42 Soft Tooling Current State • ~$190M Spend • 487 current suppliers • >57K part numbers Future State • ~$35M+ of productivity over 3 years • ~70% reduction in supply base • ~80% spend under long term agreements • ~15% improvement in payment terms Global Procurement: Rationalization CNC Turret Laser Brake Press Manual Welding Robotic Welding
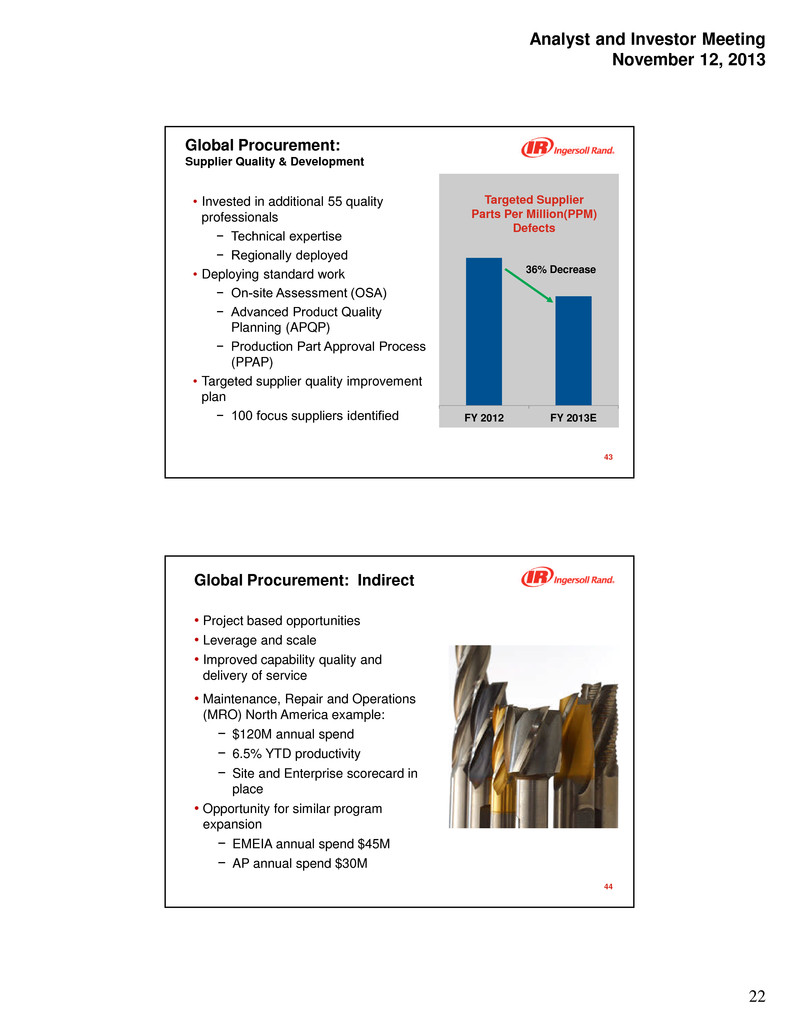
Analyst and Investor Meeting November 12, 2013 22 43 FY 2012 FY 2013E Global Procurement: Supplier Quality & Development • Invested in additional 55 quality professionals − Technical expertise − Regionally deployed • Deploying standard work − On-site Assessment (OSA) − Advanced Product Quality Planning (APQP) − Production Part Approval Process (PPAP) • Targeted supplier quality improvement plan − 100 focus suppliers identified 36% Decrease Targeted Supplier Parts Per Million(PPM) Defects 44 • Project based opportunities • Leverage and scale • Improved capability quality and delivery of service • Maintenance, Repair and Operations (MRO) North America example: − $120M annual spend − 6.5% YTD productivity − Site and Enterprise scorecard in place • Opportunity for similar program expansion − EMEIA annual spend $45M − AP annual spend $30M Global Procurement: Indirect
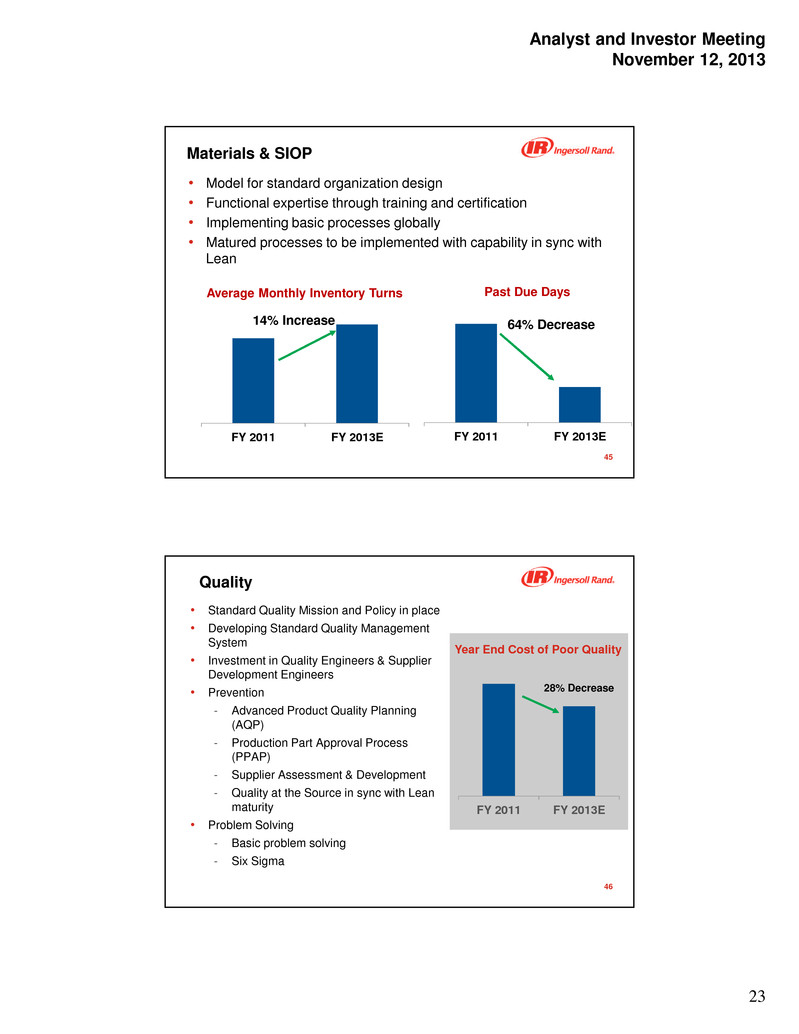
Analyst and Investor Meeting November 12, 2013 23 45 FY 2011 FY 2013EFY 2011 FY 2013E Materials & SIOP • Model for standard organization design • Functional expertise through training and certification • Implementing basic processes globally • Matured processes to be implemented with capability in sync with Lean Average Monthly Inventory Turns Past Due Days 14% Increase 64% Decrease 46 FY 2011 FY 2013E Quality • Standard Quality Mission and Policy in place • Developing Standard Quality Management System • Investment in Quality Engineers & Supplier Development Engineers • Prevention - Advanced Product Quality Planning (AQP) - Production Part Approval Process (PPAP) - Supplier Assessment & Development - Quality at the Source in sync with Lean maturity • Problem Solving - Basic problem solving - Six Sigma 28% Decrease Year End Cost of Poor Quality

Analyst and Investor Meeting November 12, 2013 24 47 Advanced Manufacturing Engineering (AME): Core Synergy • Drive capability in manufacturing Networks of Excellence (NOEs) • Initiated pilot with strong results • Expand to other manufacturing NOEs • Standard equipment, tools, materials & process • Standard training & certification Joining Pilot • 240 million connections annually • 30 locations with 1200 associates • 18.2% reduction in COPQ • 3 trial lines in Columbia, Tyler and Vidalia − 3 point improvement in first pass yield − 58% improvement in parts per million defects (PPM) 48 Summary • Executing on consistent strategy • Capability is stronger every day • Building out and maturing of the Business Operating System (BOS) Leveraging the business operating system to expand margins
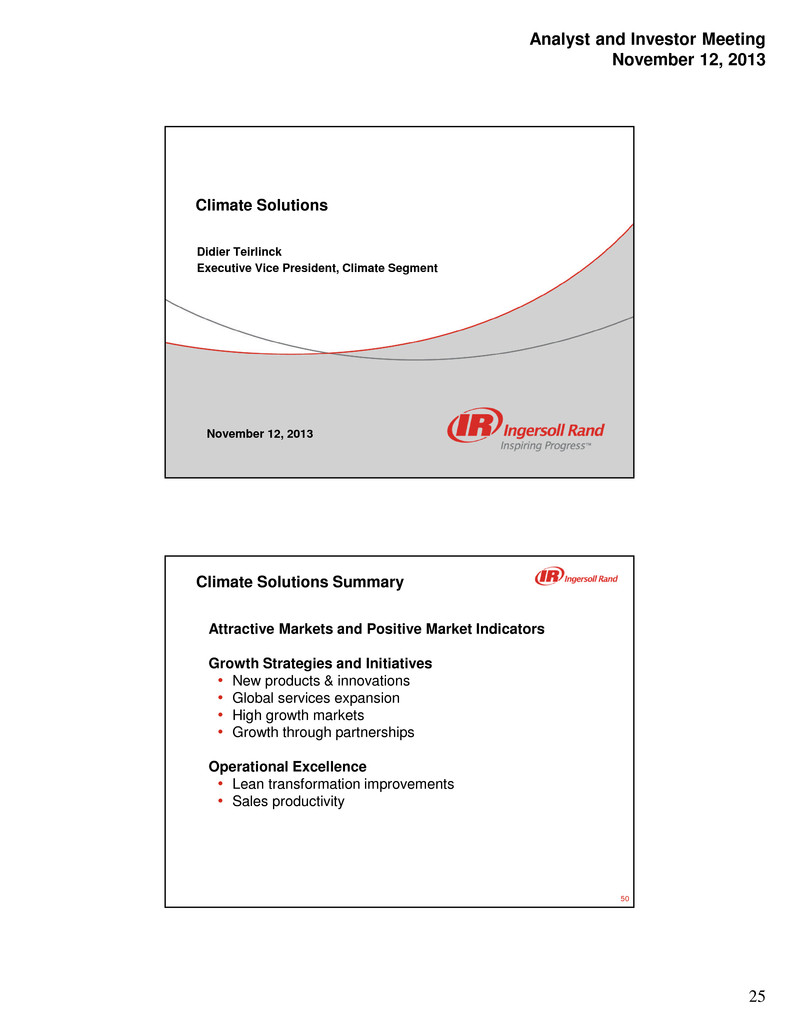
Analyst and Investor Meeting November 12, 2013 25 Climate Solutions Didier Teirlinck Executive Vice President, Climate Segment November 12, 2013 50 Climate Solutions Summary Attractive Markets and Positive Market Indicators Growth Strategies and Initiatives • New products & innovations • Global services expansion • High growth markets • Growth through partnerships Operational Excellence • Lean transformation improvements • Sales productivity

Analyst and Investor Meeting November 12, 2013 26 51 Climate Solutions Trusted expert Innovator Performance Specialist Trusted brands with extensive installed base and global market coverage Performance Innovation Commitment Knowledge 52 Enhance Building Results O p e ra te , M a in ta in a n d S u s ta in R e s to re a n d M o d e rn iz e Design and Construction Trane Integrated Systems Trane Building Services • Service • Contracting and Energy • Monitoring and Analytics • Parts Delivering high performance buildings through unique expertise in HVAC systems and service • Chillers • Unitary • Airside • Controls Making Buildings Better For Life Customer Mission

Analyst and Investor Meeting November 12, 2013 27 53 Thermo King Trailer Large Truck Bus and Rail Comfort Marine Railcar & Intermodal Small Truck Delivering reliable, efficient refrigerated transport solutions, supported by extensive worldwide dealer network Transport Refrigeration Solutions 850+ worldwide • TK trained and certified technicians • Comprehensive service contract programs • 24 hour and mobile service • TK and competitive replacement parts Global Dealer Network 54 TypeProduct/Solution Region Growth Through Innovation • Leading positions in transport refrigeration and commercial HVAC markets • Strong brands and channels Growth in Services • Serving customers with total lifecycle solutions • Realizing benefits of product and services innovation Growth In Global Markets • Continued expansion in Asia Pacific, Latin America and Middle East • Benefits of regionalization and localization Markets and Regions Aligning investments and resources to growth priorities HVAC 76% Transport 24% North America 59% Asia 14% EMEIA 19% Latin America 8% Equipment 64% 11% Controls/ Contracting Service/Parts 25%

Analyst and Investor Meeting November 12, 2013 28 55 Market Drivers and Trends Urbanization Efficiency and Sustainability Food and water scarcity Existing Building Solutions Food Safety Integrated Building Solutions Regulation Refrigerant Market drivers for continued long term growth 56 Market Indicators Indicators of future improvement of market conditions and long term global growth US Vertical Market Growth 5% 6% 7% 7% 8% 9% 11% North America West Europe Latin America ME&A East Europe Rest of Asia China Regional Non-Res Construction Growth (2012 – 2022 CAGR) Source: IHS Global Insight, Global Construction Outlook - Sept 2013 2014 Stores & Restaurants Office Manufacturing Education Health Care Public Lodging Other Total 4.7% Source: McGraw Hill US Transport Market Growth -20 -15 -10 -5 0 5 10 15 20 1 2 3 4 1 2 3 4 1 2 3 4 1 2 3 4 1 2 3 4 1 2 3 4 1 2 3 4 1 2 3 4 1 2 3 4 ACT U.S. Freight Composite Q/Q at SAAR, Y/Y Q1’06 – Q4’14 (Actual through Q2’13) ANN. AVG. +5.4% + 3.6% +4.8% 06 07 08 09 10 11 12 13 14
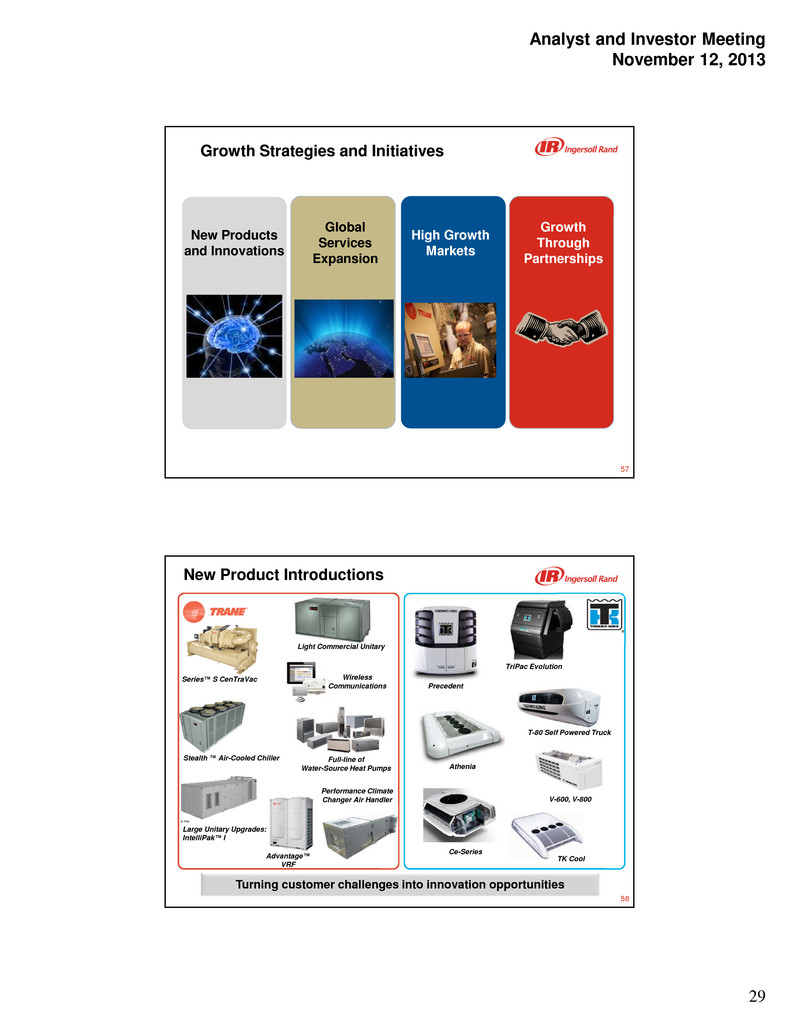
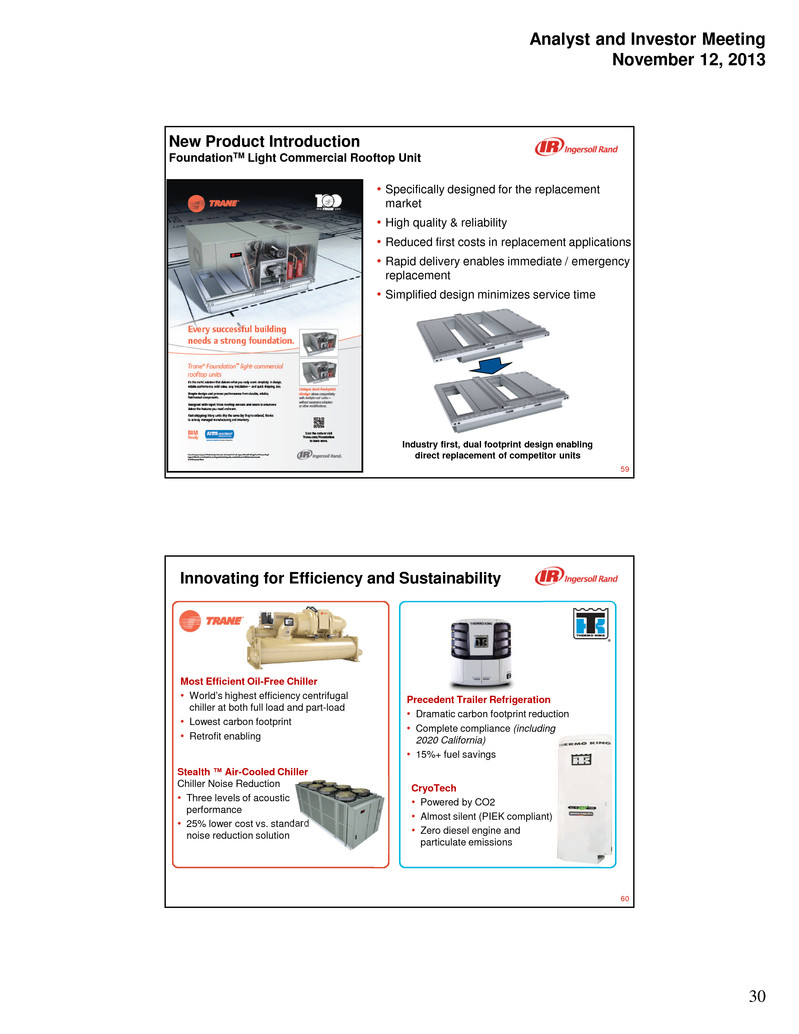
Analyst and Investor Meeting November 12, 2013 29 57 Growth Strategies and Initiatives Global Services Expansion High Growth Markets Growth Through Partnerships New Products and Innovations 58 New Product Introductions Series™ S CenTraVac Stealth™ Air-Cooled Chiller Wireless Communications Advantage™ VRF Full-line of Water-Source Heat Pumps Light Commercial Unitary Large Unitary Upgrades: IntelliPak™ I Turning customer challenges into innovation opportunities Precedent TriPac Evolution Ce-Series TK Cool T-80 Self Powered Truck Athenia V-600, V-800 Performance Climate Changer Air Handler
Analyst and Investor Meeting November 12, 2013 30 59 New Product Introduction FoundationTM Light Commercial Rooftop Unit • Specifically designed for the replacement market • High quality & reliability • Reduced first costs in replacement applications • Rapid delivery enables immediate / emergency replacement • Simplified design minimizes service time Industry first, dual footprint design enabling direct replacement of competitor units 60 Innovating for Efficiency and Sustainability Stealth™ Air-Cooled Chiller Chiller Noise Reduction • Three levels of acoustic performance • 25% lower cost vs. standard noise reduction solution CryoTech • Powered by CO2 • Almost silent (PIEK compliant) • Zero diesel engine and particulate emissions Precedent Trailer Refrigeration • Dramatic carbon footprint reduction • Complete compliance (including 2020 California) • 15%+ fuel savings Most Efficient Oil-Free Chiller • World’s highest efficiency centrifugal chiller at both full load and part-load • Lowest carbon footprint • Retrofit enabling
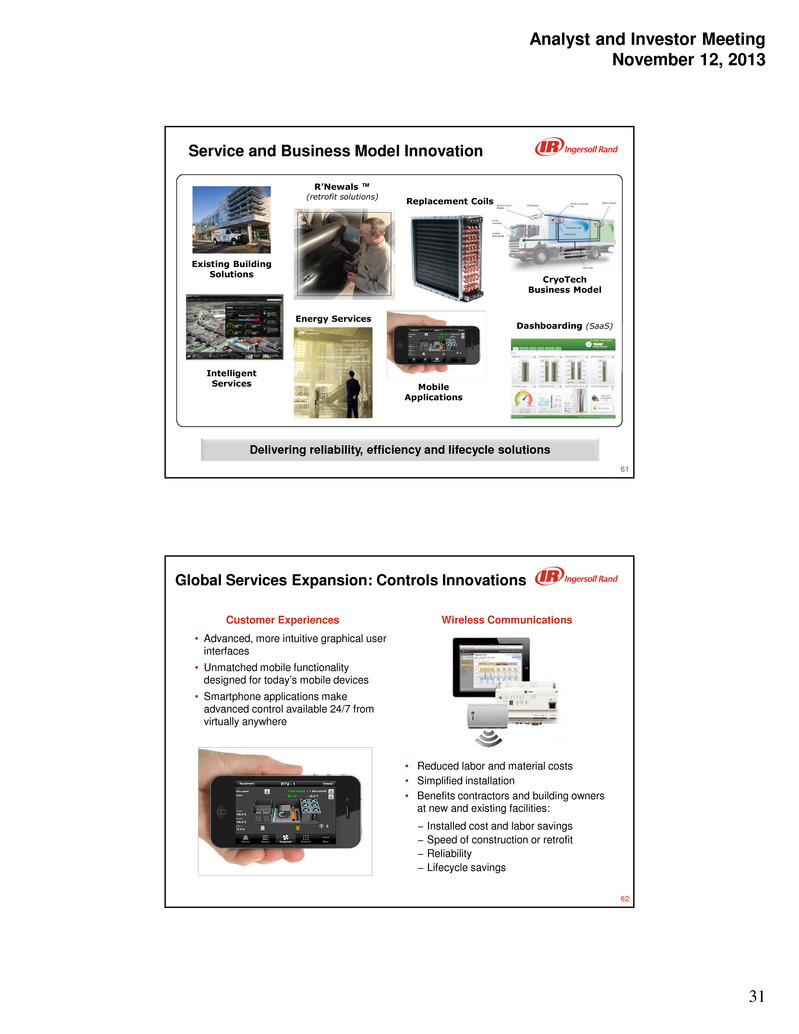
Analyst and Investor Meeting November 12, 2013 31 61 Service and Business Model Innovation Replacement Coils Mobile Applications Delivering reliability, efficiency and lifecycle solutions Dashboarding (SaaS) CryoTech Business Model Intelligent Services Existing Building Solutions R’Newals™ (retrofit solutions) Energy Services 62 Global Services Expansion: Controls Innovations Wireless CommunicationsCustomer Experiences • Advanced, more intuitive graphical user interfaces • Unmatched mobile functionality designed for today’s mobile devices • Smartphone applications make advanced control available 24/7 from virtually anywhere • Reduced labor and material costs • Simplified installation • Benefits contractors and building owners at new and existing facilities: – Installed cost and labor savings – Speed of construction or retrofit – Reliability – Lifecycle savings

Analyst and Investor Meeting November 12, 2013 32 63 Global Services Expansion: Trane Boost Cooling System Optimization Programs Results Poland, Pharmaceutical: • Saved 60% of pumping energy costs Germany, Manufacturing: • Comprehensive retrofit including free cooling reduced chiller hours by 20% and utility cost by 10% Solutions • Trane Boost optimizes cooling system ROI – Different levels to suit customer need – Addresses full system Equipment retrofit solutions Water system upgrades Controls Cooling system operating cost Energy & Consumption Energy Waste Admin Situation • Significant and rising energy costs • Coupled with budget constraints Parts & Maintenance 64 Global Services Expansion Rental Expansion Results • Rapid profitable growth • >60% utilization and increasingSolutions • Areas of use: – Seasonal demand – Planned equipment upgrade – Unplanned emergencies • Applications – Specific markets (e.g., ice rinks, wineries) – Resiliency and contingency planning 0 40 2013F 2014F 2017F 3X 5X Situation • Many businesses require temporary cooling: – Disaster recovery – Seasonal contingency cooling – Capacity increase with no replacement budget – Pro-active maintenance shut-down Revenue

Analyst and Investor Meeting November 12, 2013 33 65 High Growth Markets China test lab Localization: products & supply chains China manufacturing Local talent development Regionalization of organization Executing our global growth strategy 2009 2010 2011 2012 2013 2014 Czech Manufacturing facility upgrade 2009 2013 LAR MEIA EE China AP Em Mkts 8% Commercial HVAC Developing Market Growth 6% 8% GDP Commercial HVAC Commercial HVAC Developing Market Growth vs. GDP 66 High Growth Markets: Customer Wins 0% 25% Mexico China Brazil China • Samsung Group – Largest semiconductor fabrication plant of its kind – High efficiency chillers, air handling, installation & commissioning, cooling tower optimization and controls Mexico • One of Latin America’s largest conglomerates – Chillers, air handling, building controls, service and contracting Brazil • Viação Redentor - Large bus fleet serving Rio de Janeiro – New TK bus HVAC unit will serve newly expanded bus line as part of 2014 World Cup and 2016 Olympics 2013 Growth Recent customer wins
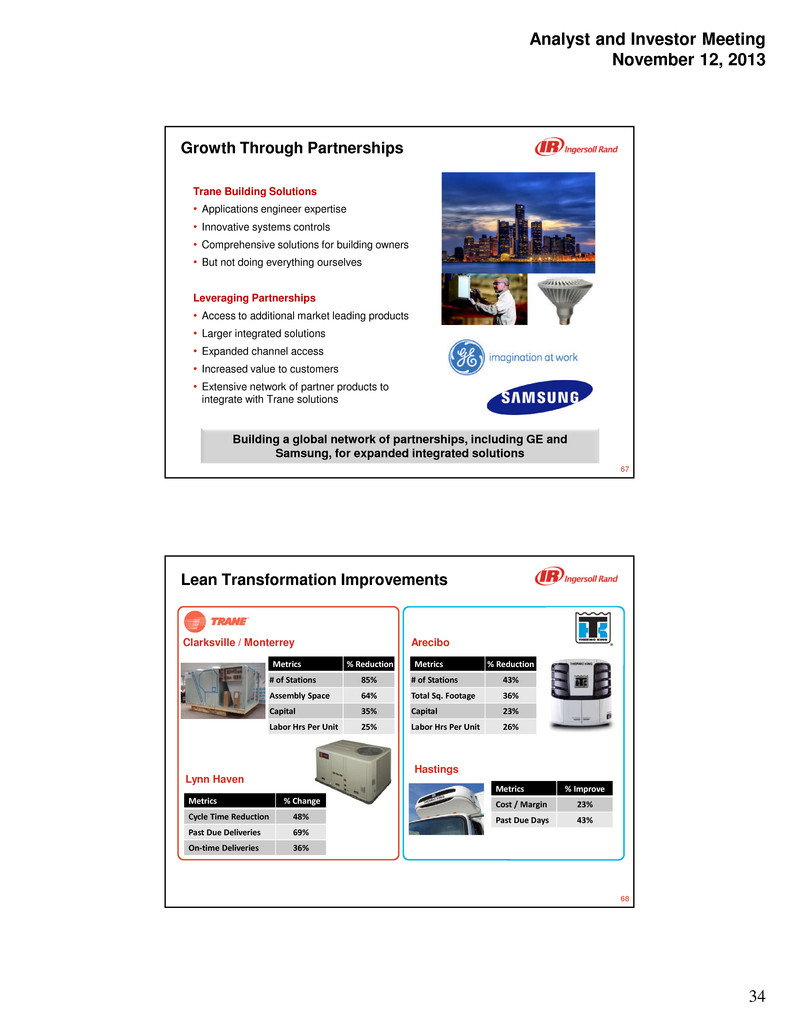
Analyst and Investor Meeting November 12, 2013 34 67 Building a global network of partnerships, including GE and Samsung, for expanded integrated solutions Growth Through Partnerships Trane Building Solutions • Applications engineer expertise • Innovative systems controls • Comprehensive solutions for building owners • But not doing everything ourselves Leveraging Partnerships • Access to additional market leading products • Larger integrated solutions • Expanded channel access • Increased value to customers • Extensive network of partner products to integrate with Trane solutions 68 Lean Transformation Improvements Lynn Haven Hastings Metrics % Reduction # of Stations 85% Assembly Space 64% Capital 35% Labor Hrs Per Unit 25% Metrics % Reduction # of Stations 43% Total Sq. Footage 36% Capital 23% Labor Hrs Per Unit 26% Metrics % Improve Cost / Margin 23% Past Due Days 43% Metrics % Change Cycle Time Reduction 48% Past Due Deliveries 69% On-time Deliveries 36% AreciboClarksville / Monterrey

Analyst and Investor Meeting November 12, 2013 35 69 Sales Productivity Structured sales management to: • Increase ability to “win” at each stage of customer’s buying process • Earn the business on the right terms and in the right time Selling efficiency and effectiveness through sales management processes Asia Pacific HVAC Market Coverage 2012 2013F 2012 2013 Opportunities Identified Opportunities Won 39% 29% 70 Climate Solutions Attractive Markets and Positive Market Indicators Growth Strategies and Initiatives • New products & innovations • Global services expansion • High growth markets • Growth through partnerships Operational Excellence • Lean transformation improvements • Sales productivity 6.0% 2009 2013F 11.2% to 11.4% Percentage Point Change 5.2 to 5.4 Operating Margin
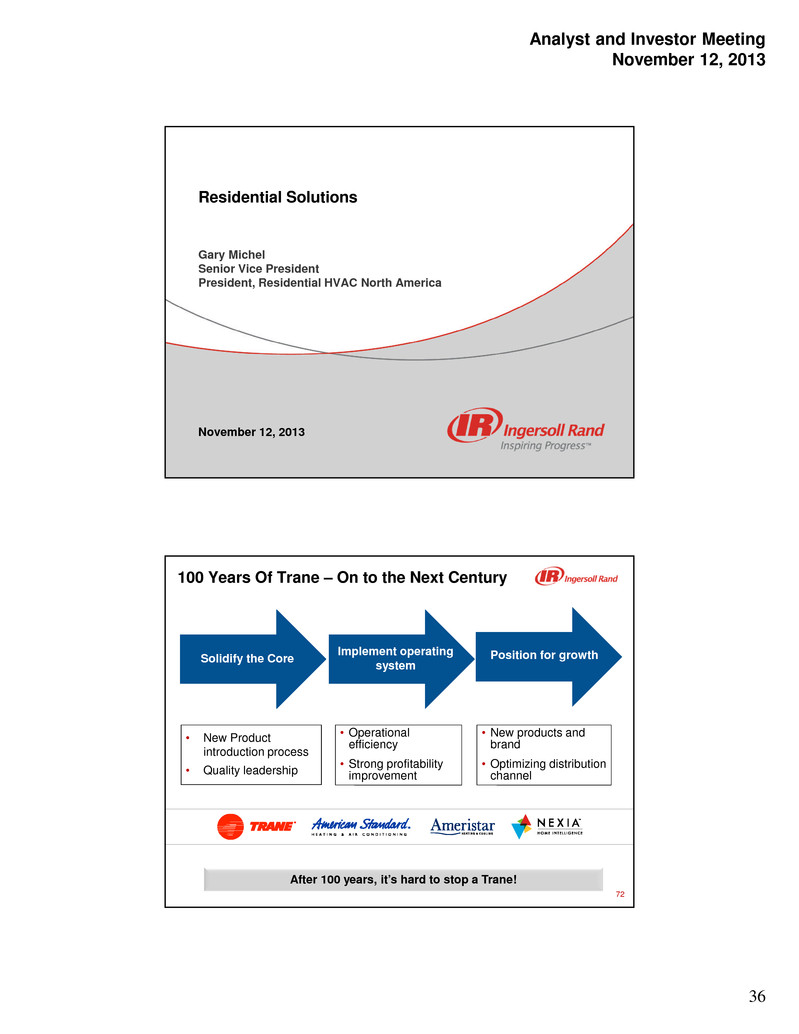
Analyst and Investor Meeting November 12, 2013 36 Residential Solutions Gary Michel Senior Vice President President, Residential HVAC North America November 12, 2013 72 100 Years Of Trane – On to the Next Century After 100 years, it’s hard to stop a Trane! Solidify the Core Position for growth • Operational efficiency • Strong profitability improvement • New Product introduction process • Quality leadership • New products and brand • Optimizing distribution channel Implement operating system

Analyst and Investor Meeting November 12, 2013 37 73 100 Years Of Trane: Looking Forward • Powerful strategic brands with highest brand preference • Leading reliability and quality • Proven channel leadership with highest dealer satisfaction • Leading energy efficiency and sustainability Positioned for a successful second century! 74 Residential Solutions Revenue Profile Business improvements created strong margin performance 86% Residential 40% Company Owned 60% Independent 2013F Revenue ~$1.7B 14% Light Commercial Distribution Channel End User Growth 2012 2013F Revenue Growth 6% 2012 2013F 80% OI Growth
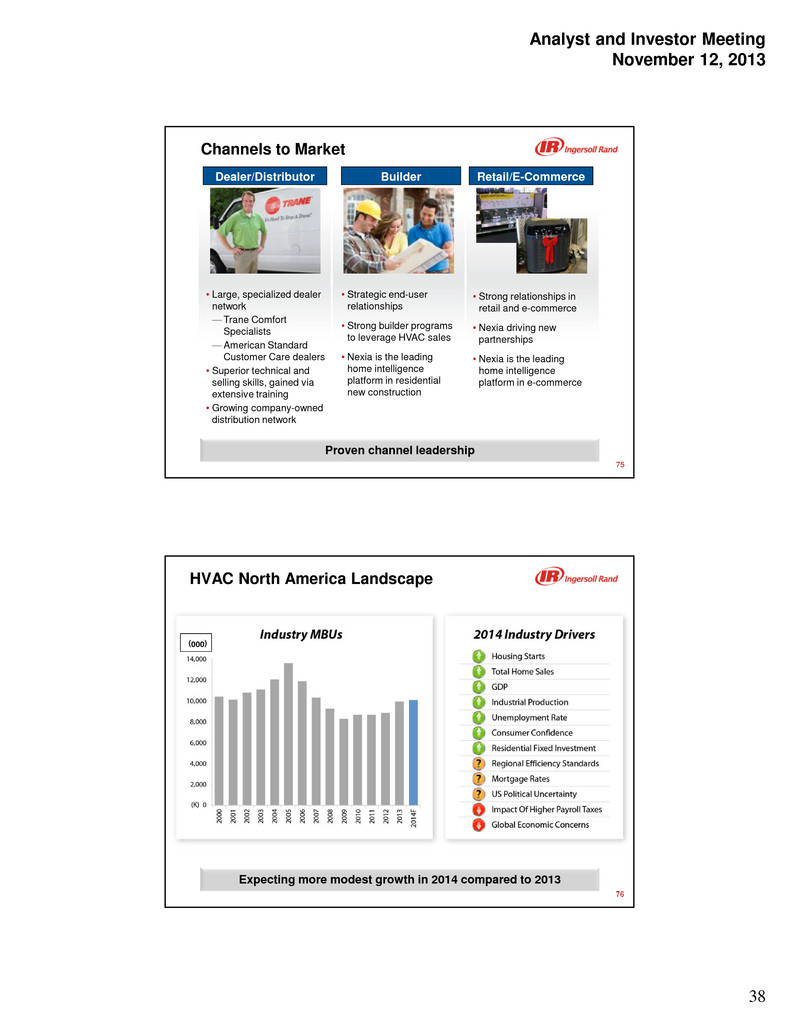
Analyst and Investor Meeting November 12, 2013 38 75 Channels to Market • Strategic end-user relationships • Strong builder programs to leverage HVAC sales • Nexia is the leading home intelligence platform in residential new construction • Strong relationships in retail and e-commerce • Nexia driving new partnerships • Nexia is the leading home intelligence platform in e-commerce • Large, specialized dealer network — Trane Comfort Specialists — American Standard Customer Care dealers • Superior technical and selling skills, gained via extensive training • Growing company-owned distribution network Proven channel leadership Dealer/Distributor Builder Retail/E-Commerce 76 HVAC North America Landscape Expecting more modest growth in 2014 compared to 2013 (000)
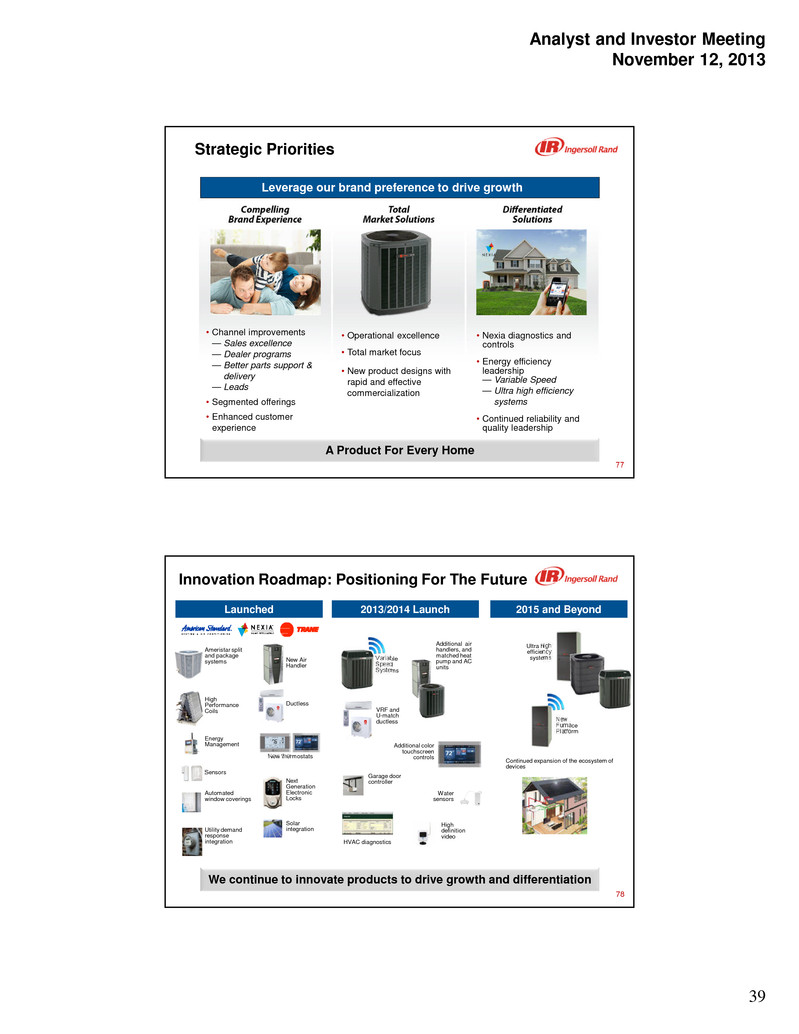
Analyst and Investor Meeting November 12, 2013 39 77 Strategic Priorities • Operational excellence • Total market focus • New product designs with rapid and effective commercialization • Nexia diagnostics and controls • Energy efficiency leadership — Variable Speed — Ultra high efficiency systems • Continued reliability and quality leadership • Channel improvements — Sales excellence — Dealer programs — Better parts support & delivery — Leads • Segmented offerings • Enhanced customer experience • Employee engagement Leverage our brand preference to drive growth A Product For Every Home 78 Innovation Roadmap: Positioning For The Future Variable Speed Systems New Furnace Platform Additional air handlers, and matched heat pump and AC units New Air Handler High definition video Continued expansion of the ecosystem of devices Ultra high efficiency systems VRF and U-match ductless Additional color touchscreen controls Garage door controller Water sensors HVAC diagnostics Energy Management Ameristar split and package systems Ductless Sensors Next Generation Electronic Locks New thermostats Automated window coverings High Performance Coils Utility demand response integration Solar integration We continue to innovate products to drive growth and differentiation Launched 2013/2014 Launch 2015 and Beyond
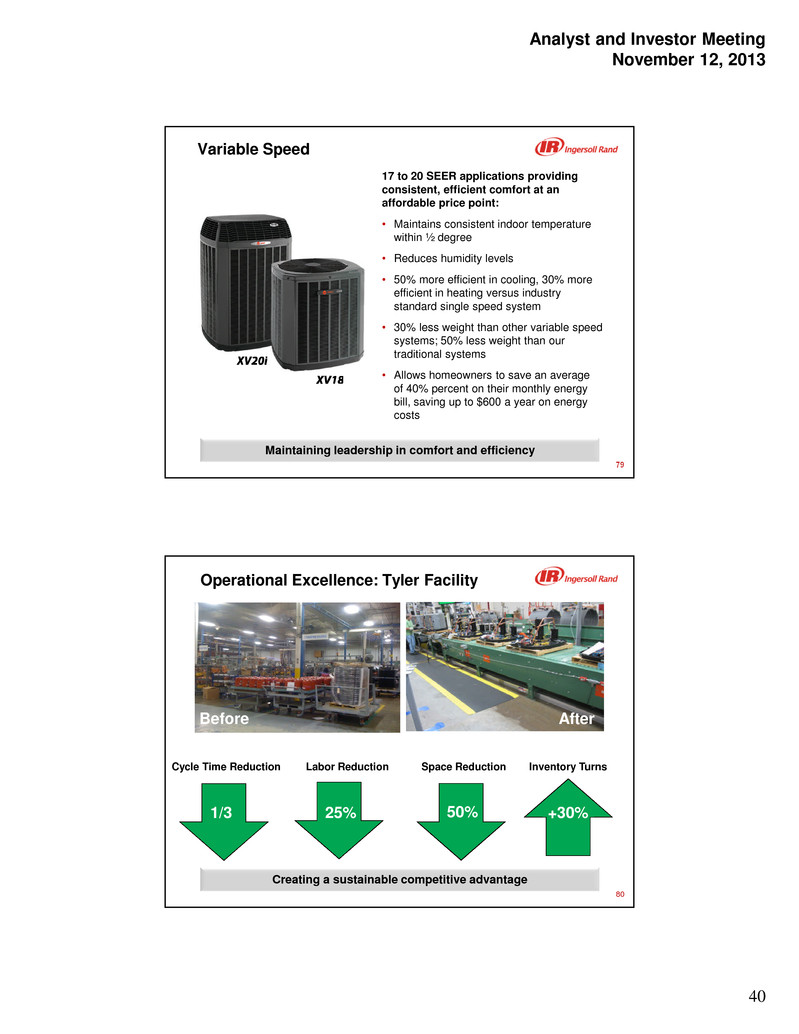
Analyst and Investor Meeting November 12, 2013 40 79 Variable Speed 17 to 20 SEER applications providing consistent, efficient comfort at an affordable price point: • Maintains consistent indoor temperature within ½ degree • Reduces humidity levels • 50% more efficient in cooling, 30% more efficient in heating versus industry standard single speed system • 30% less weight than other variable speed systems; 50% less weight than our traditional systems • Allows homeowners to save an average of 40% percent on their monthly energy bill, saving up to $600 a year on energy costs Maintaining leadership in comfort and efficiency 80 Operational Excellence: Tyler Facility Creating a sustainable competitive advantage Before After Cycle Time Reduction Labor Reduction Space Reduction 1/3 25% 50% Inventory Turns +30%
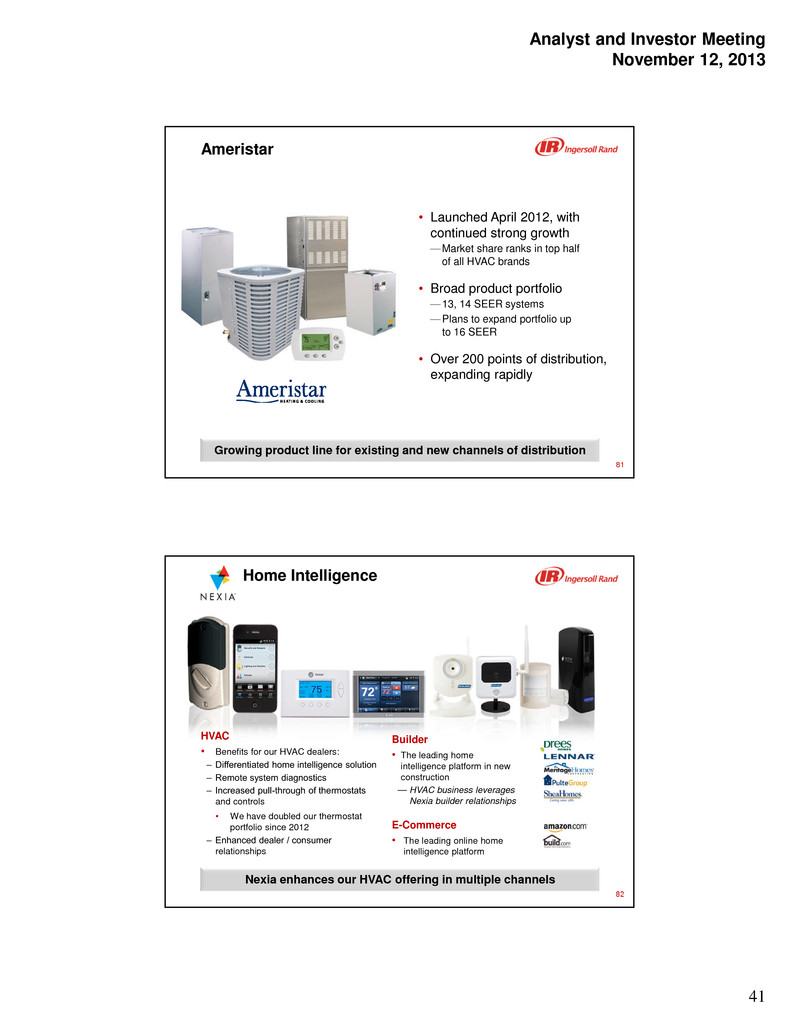
Analyst and Investor Meeting November 12, 2013 41 81 Ameristar • Launched April 2012, with continued strong growth —Market share ranks in top half of all HVAC brands • Broad product portfolio —13, 14 SEER systems —Plans to expand portfolio up to 16 SEER • Over 200 points of distribution, expanding rapidly Growing product line for existing and new channels of distribution 82 Home Intelligence Builder • The leading home intelligence platform in new construction — HVAC business leverages Nexia builder relationships E-Commerce • The leading online home intelligence platform HVAC • Benefits for our HVAC dealers: ‒ Differentiated home intelligence solution ‒ Remote system diagnostics ‒ Increased pull-through of thermostats and controls • We have doubled our thermostat portfolio since 2012 ‒ Enhanced dealer / consumer relationships Nexia enhances our HVAC offering in multiple channels

Analyst and Investor Meeting November 12, 2013 42 83 Residential • Powerful strategic brands with highest brand preference • Leading reliability and quality • Proven channel leadership with highest dealer satisfaction • Leading energy efficiency and sustainability Positioned for a successful second century! 6.1% 2009 2013F 7.6% to 7.8% Percentage point change 1.5 to 1.7 Operating Margin: Residential Solutions* *Includes the Residential HVAC and Security businesses Robert Zafari Executive Vice President, Industrial Segment November 12, 2013 Industrial Segment
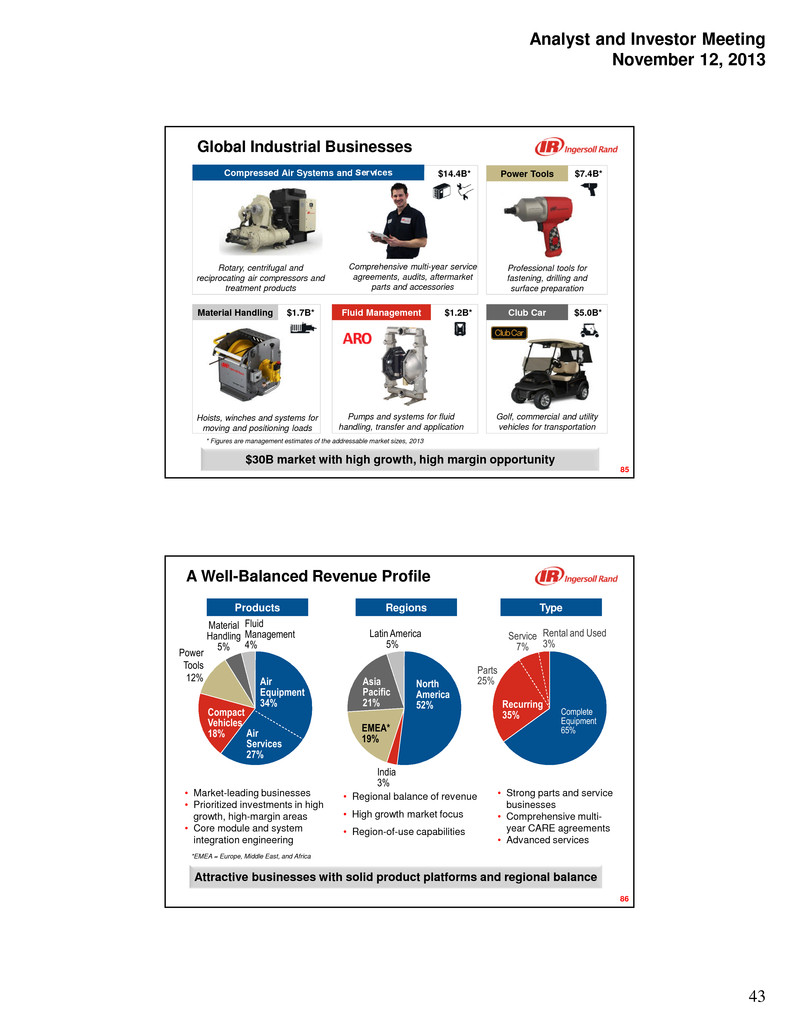
Analyst and Investor Meeting November 12, 2013 43 Global Industrial Businesses Compressed Air Systems and Services Club Car Power Tools Fluid ManagementMaterial Handling * Figures are management estimates of the addressable market sizes, 2013 $30B market with high growth, high margin opportunity 85 $7.4B* $5.0B* Professional tools for fastening, drilling and surface preparation Rotary, centrifugal and reciprocating air compressors and treatment products Comprehensive multi-year service agreements, audits, aftermarket parts and accessories Pumps and systems for fluid handling, transfer and application Hoists, winches and systems for moving and positioning loads Golf, commercial and utility vehicles for transportation $1.7B* $1.2B* $14.4B* A Well-Balanced Revenue Profile Attractive businesses with solid product platforms and regional balance Air Equipment 34% Fluid Management 4% Compact Vehicles 18% Material Handling 5% Power Tools 12% Air Services 27% • Market-leading businesses • Prioritized investments in high growth, high-margin areas • Core module and system integration engineering Products Latin America 5% North America 52% EMEA* 19% Asia Pacific 21% India 3% • Regional balance of revenue • High growth market focus • Region-of-use capabilities Regions • Strong parts and service businesses • Comprehensive multi- year CARE agreements • Advanced services Complete Equipment 65% Recurring 35% Parts 25% Service 7% Rental and Used 3% Type *EMEA = Europe, Middle East, and Africa 86
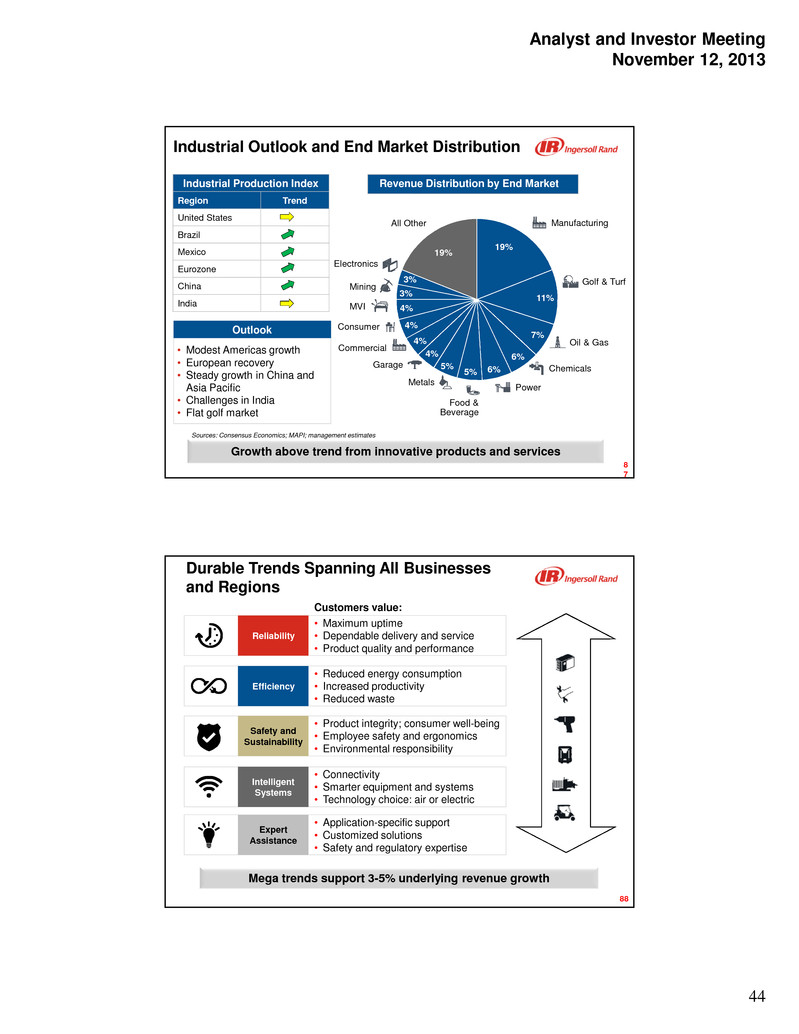
Analyst and Investor Meeting November 12, 2013 44 Industrial Outlook and End Market Distribution Growth above trend from innovative products and services Industrial Production Index Region Trend United States Brazil Mexico Eurozone China India Sources: Consensus Economics; MAPI; management estimates 8 7 • Modest Americas growth • European recovery • Steady growth in China and Asia Pacific • Challenges in India • Flat golf market Outlook 19% 11% 7% 6% 6%5% 5% 4% 4% 4% 4% 3% 3% 19% Manufacturing Oil & Gas Chemicals Food & Beverage Garage Commercial Electronics Power Golf & Turf Metals Consumer MVI Mining All Other Revenue Distribution by End Market Efficiency Reliability Safety and Sustainability Intelligent Systems Expert Assistance Mega trends support 3-5% underlying revenue growth • Reduced energy consumption • Increased productivity • Reduced waste • Maximum uptime • Dependable delivery and service • Product quality and performance • Product integrity; consumer well-being • Employee safety and ergonomics • Environmental responsibility • Connectivity • Smarter equipment and systems • Technology choice: air or electric • Application-specific support • Customized solutions • Safety and regulatory expertise 88 Durable Trends Spanning All Businesses and Regions Customers value:

Analyst and Investor Meeting November 12, 2013 45 Grow Global Services Grow Technology Leadership • Customer-driven innovation • Market-leading reliability, efficiency and controls technology • Core module and system integration engineering centers • Region-of-use capabilities • Enhanced customer value through multi-year CARE agreements • World-class parts logistics and pricing • Mobility tools to enable technician responsiveness and productivity • Advanced services for reliability and efficiency Optimize and Expand Channel • Network of fewer but stronger channel partners • Dedicated regional channel teams • Standard global distributor management processes • High Growth Market (HGM) expansion Enhance Customer Experience • World-class delivery and quality through standard processes • Seamless online experiences • Superior customer communication • New enterprise IT system infrastructure Four Strategic Growth Paths Growth is our overarching mission; customer experience is our first priority 89 Value Stream Improvement: Customer cycle time 93% Past due backlog reduction 100% On-time delivery 78% Revenue increase 8% Enhancing Customer Experience: Lean Transformation Lean standard work delivering transformational results Transformational Results from Global Industrial Businesses (2010 – September 2013) 33% On Time Delivery Improvement 280 bps Gross Margin Expansion 6% CAGR Revenue Increase 82% Past Due Backlog Reduction 90 Campbellsville, Kentucky Manufacturing Operation
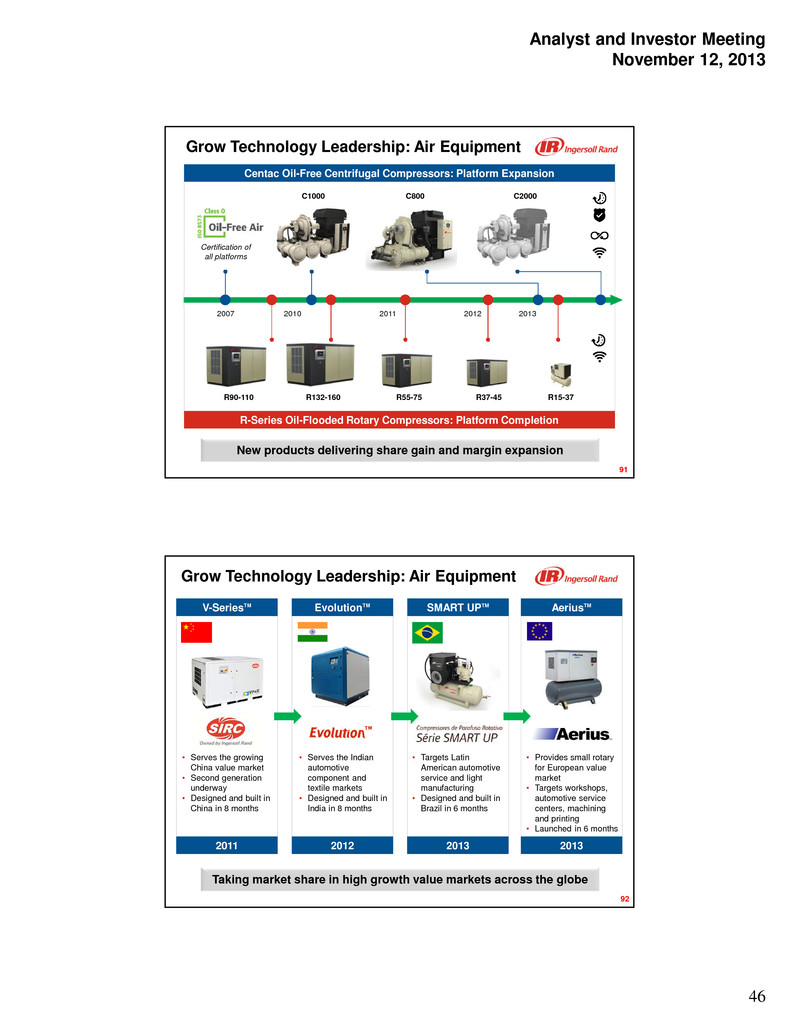
Analyst and Investor Meeting November 12, 2013 46 Grow Technology Leadership: Air Equipment New products delivering share gain and margin expansion R-Series Oil-Flooded Rotary Compressors: Platform Completion R90-110 R132-160 R55-75 R37-45 R15-37 Centac Oil-Free Centrifugal Compressors: Platform Expansion 91 C800 2007 2010 C1000 C2000 Certification of all platforms 2011 2012 2013 V-SeriesTM Grow Technology Leadership: Air Equipment EvolutionTM • Serves the growing China value market • Second generation underway • Designed and built in China in 8 months • Serves the Indian automotive component and textile markets • Designed and built in India in 8 months SMART UPTM • Targets Latin American automotive service and light manufacturing • Designed and built in Brazil in 6 months Air AeriusTM • Provides small rotary for European value market • Targets workshops, automotive service centers, machining and printing • Launched in 6 months Taking market share in high growth value markets across the globe 2011 2012 2013 2013 92

Analyst and Investor Meeting November 12, 2013 47 IQV12 Cordless Mini Tools Grow Technology Leadership: Power Tools Increasing investment in our high margin power tools business QX Series Precision Cordless Tools • Cordless flexibility • Traceability • Connectivity “The operators like the QX tool. They take care of it, keep it clean and locked up. They never do that with the other tools they use.” – European truck manufacturer • Compact size for vehicle service and MRO • Lightweight for comfort and ergonomics • Durability by design Situation and Focus Areas • Market leader in premium, professional pneumatic ImpactoolsTM • Increasing demand for cordless and DC electric tools in the Garage and Industrial segments • 13 new cordless and pneumatic tool launches in 2013 • Cordless revenue growth of 119% CAGR from 2011 93 Grow Technology Leadership: Material Handling Extending our market leadership through safety and innovation Committed to Safety Campaign MR 150 Personnel WinchSituation and Focus Areas • #1 position in air-operated winch products for the oil and gas market • Growing demand for systems that make lifting, positioning and moving products and personnel safer and more efficient • Major opportunities in electric-driven systems and value-added services • Enhanced safety features • Lifts personnel during onshore or offshore drilling inspection and maintenance • December 2013 launch 94
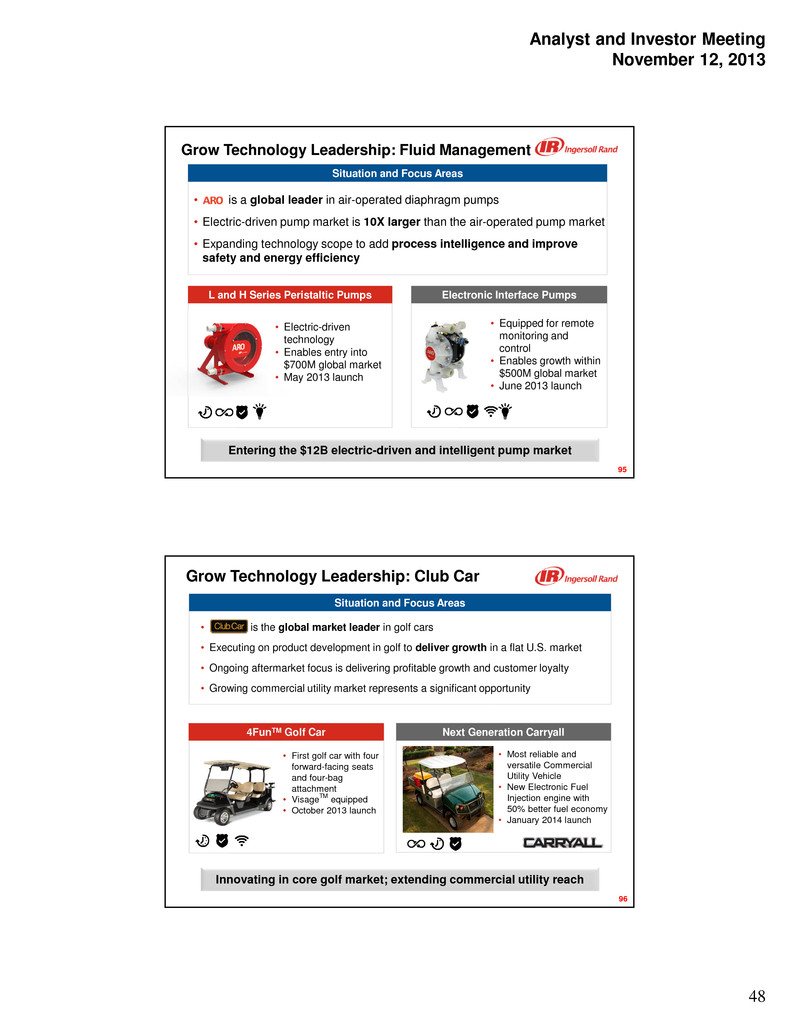
Analyst and Investor Meeting November 12, 2013 48 Electronic Interface PumpsL and H Series Peristaltic Pumps Grow Technology Leadership: Fluid Management Situation and Focus Areas Entering the $12B electric-driven and intelligent pump market • Equipped for remote monitoring and control • Enables growth within $500M global market • June 2013 launch • Electric-driven technology • Enables entry into $700M global market • May 2013 launch 95 • is a global leader in air-operated diaphragm pumps • Electric-driven pump market is 10X larger than the air-operated pump market • Expanding technology scope to add process intelligence and improve safety and energy efficiency Grow Technology Leadership: Club Car Innovating in core golf market; extending commercial utility reach Situation and Focus Areas • is the global market leader in golf cars • Executing on product development in golf to deliver growth in a flat U.S. market • Ongoing aftermarket focus is delivering profitable growth and customer loyalty • Growing commercial utility market represents a significant opportunity Next Generation Carryall • Most reliable and versatile Commercial Utility Vehicle • New Electronic Fuel Injection engine with 50% better fuel economy • January 2014 launch 96 4FunTM Golf Car • First golf car with four forward-facing seats and four-bag attachment • VisageTM equipped • October 2013 launch

Analyst and Investor Meeting November 12, 2013 49 Air System Optimization Grow Global Services: Air System Optimization Winning customers through efficiency and lifecycle value improvement Goal: Deliver air at the right quality, pressure and flow - at the lowest Total Cost of Ownership and highest level of reliability 97 • Fortune 500 firm, global leader in food production • 26 installed centrifugal air compressors • 86,000 total horsepower • 420,000 specific cubic feet per minute of air Win for Customer • $1.7M annual energy efficiency savings • $500K rebate from local utility Win for Ingersoll Rand • $2.5M in aftermarket parts • $600K compressor pull- through = possible leak/fault Case Study Grow Global Services Comprehensive Multi-Year CARE Bookings 2009 2010 2011 2012 2013E Americas EMEIA* AP 29% CAGR Acquiring new and satisfying existing customers with the CARE suite 98 Situation and Focus Areas • Comprehensive Multi-Year CARE agreement growth in all three regions • Aftermarket products growth driven by proprietary parts that deliver optimal equipment reliability and energy efficiency • Advanced services opportunity for growth through connectivity and remote monitoring • Technician productivity and mobility enabled by standard processes and tools *EMEIA = Europe, Middle East, India and Africa
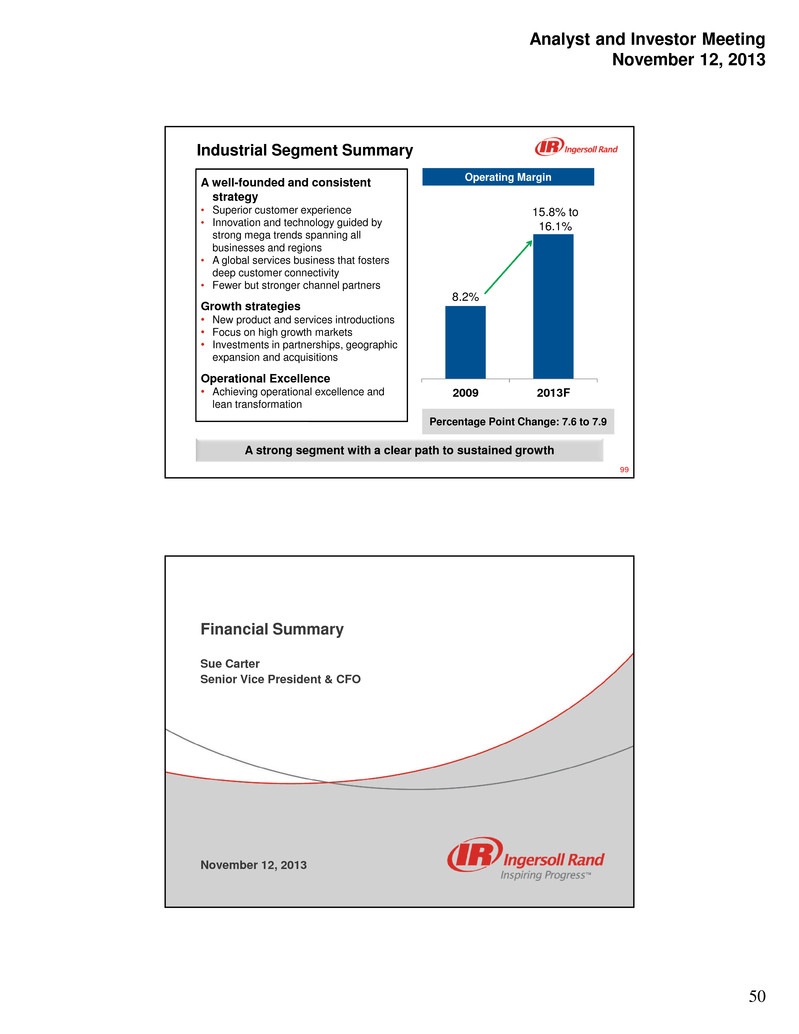
Analyst and Investor Meeting November 12, 2013 50 Industrial Segment Summary A well-founded and consistent strategy • Superior customer experience • Innovation and technology guided by strong mega trends spanning all businesses and regions • A global services business that fosters deep customer connectivity • Fewer but stronger channel partners Growth strategies • New product and services introductions • Focus on high growth markets • Investments in partnerships, geographic expansion and acquisitions Operational Excellence • Achieving operational excellence and lean transformation A strong segment with a clear path to sustained growth 99 Percentage Point Change: 7.6 to 7.9 Operating Margin 8.2% 2009 2013F 15.8% to 16.1% Financial Summary Sue Carter Senior Vice President & CFO November 12, 2013

Analyst and Investor Meeting November 12, 2013 51 101 Agenda • Spinoff of Allegion Security business • Reorganization and new segment reporting • Reset of financials for 2013 • Balance sheet and cash flow • Capital allocation • Outlook for 2014 to 2016 102 Update Security Company Spinoff BOCOM Systems A leading global provider of mechanical and electronic security products and services • Spinoff of Security businesses named Allegion • Allegion to become a publicly traded company - Listed on the NYSE with the symbol ALLE - Record date for shares: November 22 • Completed Irish incorporation for Allegion • Tax free status of spinoff confirmed by IRS • Debt offering completed • Form 10 update filed in October • Expect to complete separation on December 1
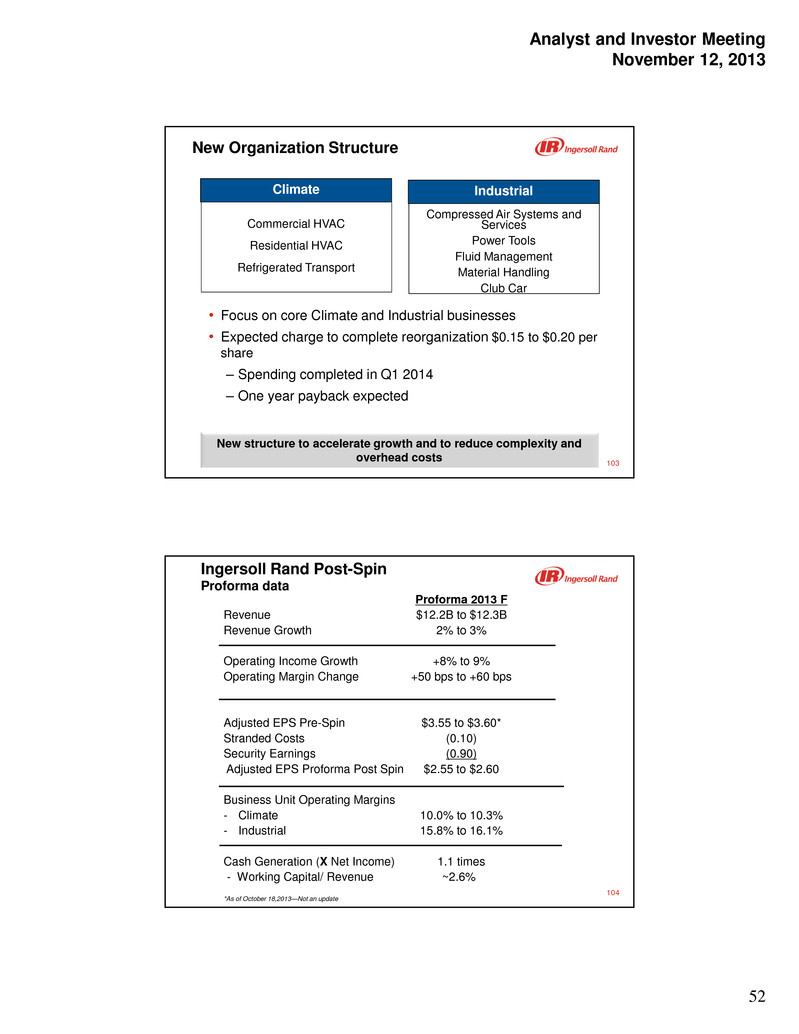
Analyst and Investor Meeting November 12, 2013 52 103 New Organization Structure • Focus on core Climate and Industrial businesses • Expected charge to complete reorganization $0.15 to $0.20 per share – Spending completed in Q1 2014 – One year payback expected New structure to accelerate growth and to reduce complexity and overhead costs Climate Industrial Commercial HVAC Residential HVAC Refrigerated Transport Compressed Air Systems and Services Power Tools Fluid Management Material Handling Club Car 104 Ingersoll Rand Post-Spin Proforma data Proforma 2013 F Revenue $12.2B to $12.3B Revenue Growth 2% to 3% Operating Income Growth +8% to 9% Operating Margin Change +50 bps to +60 bps Adjusted EPS Pre-Spin $3.55 to $3.60* Stranded Costs (0.10) Security Earnings (0.90) Adjusted EPS Proforma Post Spin $2.55 to $2.60 Business Unit Operating Margins - Climate 10.0% to 10.3% - Industrial 15.8% to 16.1% Cash Generation (X Net Income) 1.1 times - Working Capital/ Revenue ~2.6% *As of October 18,2013—Not an update

Analyst and Investor Meeting November 12, 2013 53 105 Balance Sheet and Cash Flow $ Millions YE 12 Q1’13 Q2’13 Q3’13 Cash 882 833 2,201 1,084 Debt 3,233 3,236 4,782 3,527 Net Debt 2,351 2,403 2,581 2,443 Solid balance sheet and cash flows Available Cash Flow 918 1,100 ~800 900 to 1,100 2012 2013F 2013F w/o Security 2014 to 2016F Annual $ Millions 106 $148 $196 $223 $250 2010 2011 2012 2013F 2014- 2016F Annually $40 $40 $30 Capital Expenditures Excluding Security • Modest future CAPEX needs • Minimal “Bricks and Mortar” (except Emerging Markets) • Significant ongoing investment in ERP system • Expect to spend ~$250 to $275 million annually Capital Expenditures ($M) Capital expenditures at 1.5% to 2% of revenues going forward ERP Spend $250 to $275

Analyst and Investor Meeting November 12, 2013 54 107 Working Capital Performance Excluding Security Annual Working Capital % of Revenues 2010 2011 2012 2013F 2016F 0.8% 2.4% 2.6% ~2.5%2.3% 108 4.9% 6.4% 6.6% 7.3% ~10% 2010 2011 2012 2013F 2016F Return on Invested Capital Excluding Security Improved margins and working capital management are key drivers of ROIC growth
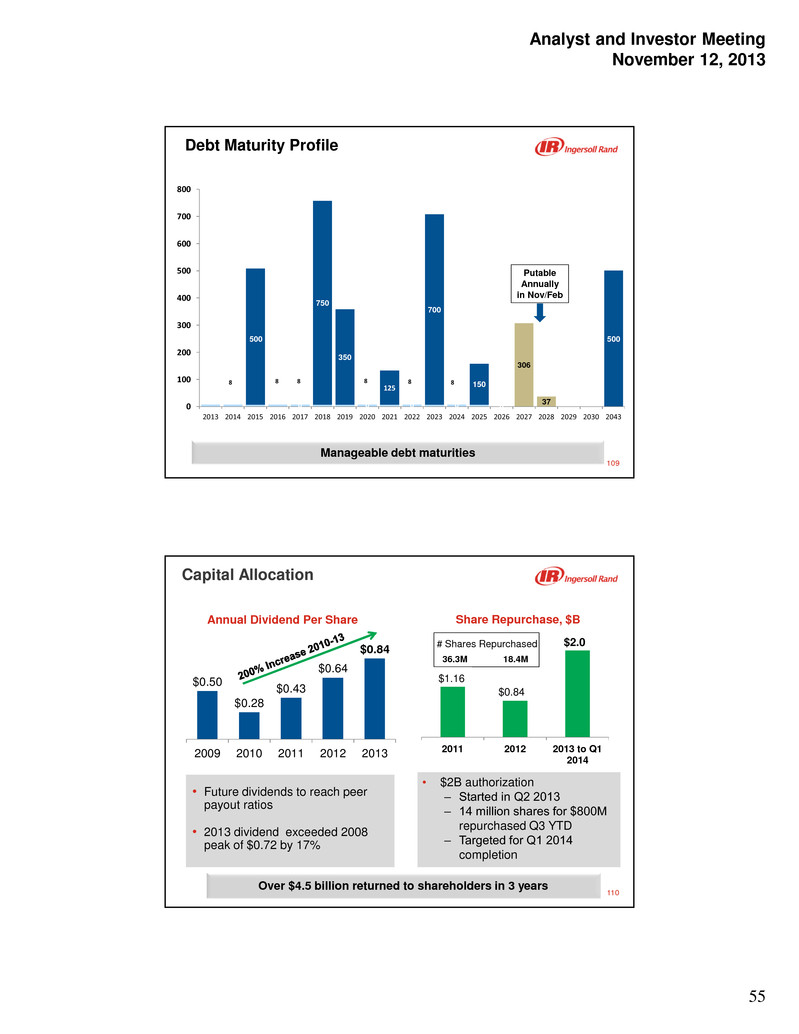
Analyst and Investor Meeting November 12, 2013 55 109 8 0 750 350 0 125 0 700 0 150 0 306 37 500 0 100 200 300 400 500 600 700 800 2013 2014 2015 2016 2017 2018 2019 2020 2021 2022 2023 2024 2025 2026 2027 2028 2029 2030 2043 Debt Maturity Profile Putable Annually in Nov/Feb 8 8 8 8 8 8 500 Manageable debt maturities 110 Capital Allocation Annual Dividend Per Share Share Repurchase, $B 2011 2012 2013 to Q1 2014 $0.84 $1.16 $2.0 Over $4.5 billion returned to shareholders in 3 years • Future dividends to reach peer payout ratios • 2013 dividend exceeded 2008 peak of $0.72 by 17% # Shares Repurchased 36.3M 18.4M • $2B authorization ‒ Started in Q2 2013 ‒ 14 million shares for $800M repurchased Q3 YTD ‒ Targeted for Q1 2014 completion $0.50 $0.28 $0.43 $0.64 $0.84 2009 2010 2011 2012 2013

Analyst and Investor Meeting November 12, 2013 56 111 Capital Allocation Shareholder Value Balance Sheet • BBB Rating • No maturities until 2015 M & A • Focused on core businesses • Value accretive on a risk adjusted basis Share Repurchase • Complete current $2B authorization • Anticipate new authorization in early 2014 Organic Investment • Innovation and Growth • Opex Dividend • Move to peer group metrics Balancing capital allocation alternatives to create shareholder value 112 Total Shareholder Return % Change Total Returns 2009 to Present* 120 133 172 262 322 S&P 500 S&P Ind Peer Group Midpoint Peer Group Avg.Top Quartile Ingersoll Rand Top total shareholder return since 2009 * As of 10/31/2013

Analyst and Investor Meeting November 12, 2013 57 113 Ingersoll Rand Post-Spin Pro-Forma 2013F Targets 2014 to 2016 Revenue $12.2B to $12.3B Revenue Change 2% to 3% 4% to 5% CAGR Operating Income Growth +8% to 9% 13% to 15% CAGR Operating Margin Change +50 bps to 60 bps 85 to 100 bps annual Adjusted EPS Proforma, Post spin $2.55 to $2.60 15% to 20% CAGR Based 24-26% tax rate Business Unit Operating Margins - Climate 10.0% to 10.3% 12% to 13% in 2016 - Industrial 15.8% to 16.1% 17% to 19% in 2016 Cash Generation(X Net Income) 1.1 times 1.0 times - Working capital/revenues 2% to 3% 2% to 3% 114 Ingersoll Rand $12.0B 2012 2013F 2016F Operating Margin 9.6% to 9.8% Operating Margin 12% to 13% $12.2B to $12.3B $13.9B to $14.3B Revenue and Operating Income EBITDA Margins 12.0% 12.4 to 12.6% 15.0 to 16.0% Operating Margin 9.2% • Strong and Liquid balance sheet • Cash flow to fund future growth • Delivering improved financial performance - Margins - Working capital management - ROIC • Balanced capital allocation Financial strategy to deliver growth and shareholder value

Analyst and Investor Meeting November 12, 2013 58 115


