UNITED STATES SECURITIES AND EXCHANGE COMMISSION
Washington, D.C. 20549
FORM 10-K/A
Amendment No. 1
(Mark One)
(X) | Annual Report pursuant to Section 13 or 15(d) of the Securities Exchange Act of 1934 | |
| For the fiscal year ended December 31, 2017 |
( ) | Transition Report pursuant to Section 13 or 15(d) of the Securities Exchange Act of 1934 | |
| For the transition period from _______to_______ |
Commission File Number 0-53713
OTTER TAIL CORPORATION
(Exact name of registrant as specified in its charter)
| MINNESOTA | 27-0383995 |
| (State or other jurisdiction of incorporation or organization) | (I.R.S. Employer Identification No.) |
| 215 SOUTH CASCADE STREET, BOX 496, FERGUS FALLS, MINNESOTA | 56538-0496 |
| (Address of principal executive offices) | (Zip Code) |
Registrant's telephone number, including area code: 866-410-8780
Securities registered pursuant to Section 12(b) of the Act:
| Title of each class | Name of each exchange on which registered |
| COMMON SHARES, par value $5.00 per share | The NASDAQ Stock Market LLC |
Securities registered pursuant to Section 12(g) of the Act: None
Indicate by check mark if the registrant is a well-known seasoned issuer, as defined in Rule 405 of the Securities Act. Yes ☑ No ☐
Indicate by check mark if the registrant is not required to file reports pursuant to Section 13 or Section 15(d) of the Act. Yes ☐ No ☑
Indicate by check mark whether the registrant (1) has filed all reports required to be filed by Section 13 or 15(d) of the Securities Exchange Act of 1934 during the preceding 12 months (or for such shorter period that the registrant was required to file such reports), and (2) has been subject to such filing requirements for the past 90 days. Yes ☑ No ☐
Indicate by check mark whether the registrant has submitted electronically and posted on its corporate Web site, if any, every Interactive Data File required to be submitted and posted pursuant to Rule 405 of Regulation S-T during the preceding 12 months (or for such shorter period that the registrant was required to submit and post such files). Yes ☑ No ☐
Indicate by check mark if disclosure of delinquent filers pursuant to Item 405 of Regulation S-K is not contained herein and will not be contained, to the best of the registrant's knowledge, in definitive proxy or information statements incorporated by reference in Part III of this Form 10-K or any amendment to this Form 10-K. ☑
Indicate by check mark whether the registrant is a large accelerated filer, an accelerated filer, a non-accelerated filer or a smaller reporting company. See the definitions of “large accelerated filer,” “accelerated filer,” “smaller reporting company,” and “emerging growth company” in Rule 12b-2 of the Exchange Act. (Check one):
| Large Accelerated Filer ☑ | Accelerated Filer ☐ |
| Non-Accelerated Filer ☐ | Smaller Reporting Company ☐ |
| (Do not check if a smaller reporting company) | Emerging Growth Company ☐ |
If an emerging growth company, indicate by checkmark if the registrant has elected not to use the extended transition period for complying with any new or revised financial accounting standards provided pursuant to Section 13(a) of the Exchange Act ☐
Indicate by check mark whether the registrant is a shell company (as defined in Rule 12b-2 of the Exchange Act). Yes ☐ No ☑
The aggregate market value of common stock held by non-affiliates, computed by reference to the last sales price on June 30, 2017 was $1,500,154,049.
Indicate the number of shares outstanding of each of the registrant's classes of common stock, as of the latest practicable date: 39,626,594 Common Shares ($5 par value) as of February 8, 2018.
Documents Incorporated by Reference:
No documents are incorporated by reference into this Amendment No. 1 on Form 10-K/A. Certain information required by Part III of the Form 10-K for the year ended December 31, 2017, filed with the Securities and Exchange Commission on February 20, 2018, has been incorporated by reference from the Proxy Statement for the 2018 Annual Meeting.
EXPLANATORY NOTE
This Amendment No. 1 on Form 10-K/A (this “Amendment”) amends Otter Tail Corporation’s Annual Report on Form 10-K for the year ended December 31, 2017, which was originally filed with the Securities and Exchange Commission (the “Commission”) on February 20, 2018 (the “Original Filing”). Otter Tail Corporation is filing this Amendment for the sole purpose of inserting the conformed signature of our independent registered public accounting firm on their Report of Independent Registered Public Accounting Firm with respect to the audited financial statements included in the Original Filing which was inadvertently omitted. Accordingly, Item 8 of Part II of the Original Filing is being amended hereby solely to reflect this conformed signature. In addition, as required by Rule 12b-15 of the Securities Exchange Act of 1934, as amended, new certifications by our principal executive officer and principal financial officer are included herein as exhibits to this Amendment. Accordingly, Item 15 of Part IV of the Original Filing is being amended hereby solely to reflect the filing of these new exhibits.
This Amendment does not make any other changes to the Original Filing and does not reflect events occurring after the Original Filing or modify or update any of the information contained therein in any way other than as expressly described in this Amendment.
Item 8. FINANCIAL STATEMENTS AND SUPPLEMENTARY DATA
REPORT OF INDEPENDENT REGISTERED PUBLIC ACCOUNTING FIRM
To the Shareholders and Board of Directors of
Otter Tail Corporation
Opinions on the Financial Statements and Internal Control over Financial Reporting
We have audited the accompanying consolidated balance sheets and statements of capitalization of Otter Tail Corporation and subsidiaries (the "Company") as of December 31, 2017 and 2016, and the related consolidated statements of income, comprehensive income, common shareholders’ equity, and cash flows for each of the three years in the period ended December 31, 2017, and the related notes and the schedule listed in the Index at Item 15 (collectively referred to as the "financial statements"). We also have audited the Company's internal control over financial reporting as of December 31, 2017, based on criteria established in Internal Control — Integrated Framework (2013) issued by the Committee of Sponsoring Organizations of the Treadway Commission (COSO).
In our opinion, the financial statements referred to above present fairly, in all material respects, the financial position of Otter Tail Corporation and subsidiaries as of December 31, 2017 and 2016, and the results of their operations and their cash flows for each of the three years in the period ended December 31, 2017, in conformity with accounting principles generally accepted in the United States of America. Also, in our opinion, the Company maintained, in all material respects, effective internal control over financial reporting as of December 31, 2017, based on the criteria established in Internal Control — Integrated Framework (2013) issued by COSO.
Basis for Opinions
The Company's management is responsible for these financial statements, for maintaining effective internal control over financial reporting, and for its assessment of the effectiveness of internal control over financial reporting, included in the accompanying Management’s Report Regarding Internal Controls Over Financial Reporting. Our responsibility is to express an opinion on these financial statements and an opinion on the Company's internal control over financial reporting based on our audits. We are a public accounting firm registered with the Public Company Accounting Oversight Board (United States) (PCAOB) and are required to be independent with respect to the Company in accordance with the U.S. federal securities laws and the applicable rules and regulations of the Securities and Exchange Commission and the PCAOB.
We conducted our audits in accordance with the standards of the PCAOB. Those standards require that we plan and perform the audit to obtain reasonable assurance about whether the financial statements are free of material misstatement, whether due to error or fraud, and whether effective internal control over financial reporting was maintained in all material respects.
Our audits of the financial statements included performing procedures to assess the risks of material misstatement of the financial statements, whether due to error or fraud, and performing procedures to respond to those risks. Such procedures included examining, on a test basis, evidence regarding the amounts and disclosures in the financial statements. Our audits also included evaluating the accounting principles used and significant estimates made by management, as well as evaluating the overall presentation of the financial statements. Our audit of internal control over financial reporting included obtaining an understanding of internal control over financial reporting, assessing the risk that a material weakness exists, and testing and evaluating the design and operating effectiveness of internal control based on the assessed risk. Our audits also included performing such other procedures as we considered necessary in the circumstances. We believe that our audits provide a reasonable basis for our opinions.
Definition and Limitations of Internal Control over Financial Reporting
A company's internal control over financial reporting is a process designed to provide reasonable assurance regarding the reliability of financial reporting and the preparation of financial statements for external purposes in accordance with generally accepted accounting principles. A company’s internal control over financial reporting includes those policies and procedures that (1) pertain to the maintenance of records that, in reasonable detail, accurately and fairly reflect the transactions and dispositions of the assets of the company; (2) provide reasonable assurance that transactions are recorded as necessary to permit preparation of financial statements in accordance with generally accepted accounting principles, and that receipts and expenditures of the company are being made only in accordance with authorizations of management and directors of the company; and (3) provide reasonable assurance regarding prevention or timely detection of unauthorized acquisition, use, or disposition of the company’s assets that could have a material effect on the financial statements.
Because of its inherent limitations, internal control over financial reporting may not prevent or detect misstatements. Also, projections of any evaluation of effectiveness to future periods are subject to the risk that controls may become inadequate because of changes in conditions, or that the degree of compliance with the policies or procedures may deteriorate.
/s/ Deloitte & Touche LLP
Minneapolis, Minnesota
February 20, 2018
We have served as the Company’s auditor since 1944.
60
Otter Tail Corporation | ||||||||
Consolidated Balance Sheets, December 31 | ||||||||
(in thousands) | 2017 | 2016 | ||||||
Assets | ||||||||
Current Assets | ||||||||
Cash and Cash Equivalents | $ | 16,216 | $ | -- | ||||
Accounts Receivable: | ||||||||
Trade (less allowance for doubtful accounts of $1,094 for 2017 and $1,246 for 2016) | 68,466 | 68,242 | ||||||
Other | 7,761 | 5,850 | ||||||
Inventories | 88,034 | 83,740 | ||||||
Unbilled Revenues | 22,427 | 20,080 | ||||||
Income Taxes Receivable | 1,181 | 662 | ||||||
Regulatory Assets | 22,551 | 21,297 | ||||||
Other | 12,491 | 8,144 | ||||||
Total Current Assets | 239,127 | 208,015 | ||||||
Investments | 8,629 | 8,417 | ||||||
Other Assets | 36,006 | 34,104 | ||||||
Goodwill | 37,572 | 37,572 | ||||||
Other Intangibles–Net | 13,765 | 14,958 | ||||||
Regulatory Assets | 129,576 | 132,094 | ||||||
Plant | ||||||||
Electric Plant in Service | 1,981,018 | 1,860,357 | ||||||
Nonelectric Operations | 216,937 | 211,826 | ||||||
Construction Work in Progress | 141,067 | 153,261 | ||||||
Total Gross Plant | 2,339,022 | 2,225,444 | ||||||
Less Accumulated Depreciation and Amortization | 799,419 | 748,219 | ||||||
Net Plant | 1,539,603 | 1,477,225 | ||||||
Total Assets | $ | 2,004,278 | $ | 1,912,385 | ||||
See accompanying notes to consolidated financial statements. |
61
Otter Tail Corporation | ||||||||
Consolidated Balance Sheets, December 31 | ||||||||
(in thousands, except share data) | 2017 | 2016 | ||||||
Liabilities and Equity | ||||||||
Current Liabilities | ||||||||
Short-Term Debt | $ | 112,371 | $ | 42,883 | ||||
Current Maturities of Long-Term Debt | 186 | 33,201 | ||||||
Accounts Payable | 84,185 | 89,350 | ||||||
Accrued Salaries and Wages | 21,534 | 17,497 | ||||||
Accrued Taxes | 16,808 | 16,000 | ||||||
Regulatory Liabilities | 9,688 | 3,294 | ||||||
Other Accrued Liabilities | 11,389 | 12,083 | ||||||
Liabilities of Discontinued Operations | 492 | 1,363 | ||||||
Total Current Liabilities | 256,653 | 215,671 | ||||||
Pensions Benefit Liability | 109,708 | 97,627 | ||||||
Other Postretirement Benefits Liability | 69,774 | 62,571 | ||||||
Other Noncurrent Liabilities | 22,769 | 21,706 | ||||||
Commitments and Contingencies (note 8) | ||||||||
Deferred Credits | ||||||||
Deferred Income Taxes | 100,501 | 226,591 | ||||||
Deferred Tax Credits | 21,379 | 22,849 | ||||||
Regulatory Liabilities | 232,893 | 82,433 | ||||||
Other | 3,329 | 7,492 | ||||||
Total Deferred Credits | 358,102 | 339,365 | ||||||
Capitalization (page 67) | ||||||||
Long-Term Debt—Net | 490,380 | 505,341 | ||||||
Cumulative Preferred Shares – Authorized 1,500,000 Shares Without Par Value; Outstanding – None | -- | -- | ||||||
Cumulative Preference Shares – Authorized 1,000,000 Shares Without Par Value; Outstanding – None | -- | -- | ||||||
Common Shares, Par Value $5 Per Share–Authorized, 50,000,000 Shares; Outstanding, 2017—39,557,491 Shares; 2016—39,348,136 Shares | 197,787 | 196,741 | ||||||
Premium on Common Shares | 343,450 | 337,684 | ||||||
Retained Earnings | 161,286 | 139,479 | ||||||
Accumulated Other Comprehensive Loss | (5,631 | ) | (3,800 | ) | ||||
Total Common Equity | 696,892 | 670,104 | ||||||
Total Capitalization | 1,187,272 | 1,175,445 | ||||||
Total Liabilities and Equity | $ | 2,004,278 | $ | 1,912,385 | ||||
See accompanying notes to consolidated financial statements. |
62
Otter Tail Corporation | ||||||||||||
Consolidated Statements of Income–For the Years Ended December 31 | ||||||||||||
(in thousands, except per-share amounts) | 2017 | 2016 | 2015 | |||||||||
Operating Revenues | ||||||||||||
Electric | $ | 434,506 | $ | 427,349 | $ | 407,039 | ||||||
Product Sales | 414,844 | 376,190 | 372,765 | |||||||||
Total Operating Revenues | 849,350 | 803,539 | 779,804 | |||||||||
Operating Expenses | ||||||||||||
Production Fuel – Electric | 59,690 | 54,792 | 42,744 | |||||||||
Purchased Power – Electric System Use | 64,807 | 63,226 | 78,150 | |||||||||
Electric Operation and Maintenance Expenses | 151,319 | 151,225 | 140,768 | |||||||||
Cost of Products Sold (depreciation included below) | 316,562 | 295,222 | 295,032 | |||||||||
Other Nonelectric Expenses | 43,240 | 40,264 | 40,021 | |||||||||
Depreciation and Amortization | 72,545 | 73,445 | 60,363 | |||||||||
Property Taxes – Electric | 15,053 | 14,266 | 13,512 | |||||||||
Total Operating Expenses | 723,216 | 692,440 | 670,590 | |||||||||
Operating Income | 126,134 | 111,099 | 109,214 | |||||||||
Interest Charges | 29,604 | 31,886 | 31,160 | |||||||||
Other Income | 2,632 | 2,905 | 2,177 | |||||||||
Income Before Income Taxes – Continuing Operations | 99,162 | 82,118 | 80,231 | |||||||||
Income Tax Expense – Continuing Operations | 27,043 | 20,081 | 21,642 | |||||||||
Net Income from Continuing Operations | 72,119 | 62,037 | 58,589 | |||||||||
Discontinued Operations | ||||||||||||
Income (Loss) – net of Income Tax Expense (Benefit) of $213 in 2017, $138 in 2016, and ($1,539) in 2015 | 320 | 284 | (5,404 | ) | ||||||||
Impairment Loss – net of Income Tax (Benefit) of $0 in 2015 | -- | -- | (1,000 | ) | ||||||||
Gain on Disposition – net of Income Tax Expense of $4,530 in 2015 | -- | -- | 7,160 | |||||||||
Net Income from Discontinued Operations | 320 | 284 | 756 | |||||||||
Total Net Income | $ | 72,439 | $ | 62,321 | $ | 59,345 | ||||||
Average Number of Common Shares Outstanding–Basic | 39,457 | 38,546 | 37,495 | |||||||||
Average Number of Common Shares Outstanding–Diluted | 39,748 | 38,731 | 37,668 | |||||||||
Basic Earnings Per Common Share: | ||||||||||||
Continuing Operations | $ | 1.83 | $ | 1.61 | $ | 1.56 | ||||||
Discontinued Operations | $ | 0.01 | $ | 0.01 | $ | 0.02 | ||||||
| $ | 1.84 | $ | 1.62 | $ | 1.58 | |||||||
Diluted Earnings Per Common Share: | ||||||||||||
Continuing Operations | $ | 1.81 | $ | 1.60 | $ | 1.56 | ||||||
Discontinued Operations | $ | 0.01 | $ | 0.01 | $ | 0.02 | ||||||
| $ | 1.82 | $ | 1.61 | $ | 1.58 | |||||||
Dividends Declared Per Common Share | $ | 1.28 | $ | 1.25 | $ | 1.23 | ||||||
See accompanying notes to consolidated financial statements. |
63
Otter Tail Corporation | ||||||||||||
Consolidated Statements of Comprehensive Income–For the Years Ended December 31 | ||||||||||||
(in thousands) | 2017 | 2016 | 2015 | |||||||||
Net Income | $ | 72,439 | $ | 62,321 | $ | 59,345 | ||||||
Other Comprehensive Income (Loss): | ||||||||||||
Unrealized Loss on Available-for-Sale Securities: | ||||||||||||
Reversal of Previously Recognized Gains Realized on Sale of Investments and Included in Other Income During Period | (15 | ) | (3 | ) | (3 | ) | ||||||
Gains (Losses) Arising During Period | 115 | (14 | ) | (49 | ) | |||||||
Income Tax (Expense) Benefit | (35 | ) | 6 | 18 | ||||||||
Change in Unrealized Losses on Available-for-Sale Securities – net-of-tax | 65 | (11 | ) | (34 | ) | |||||||
Pension and Postretirement Benefit Plans: | ||||||||||||
Actuarial (Losses) Gains Net of Regulatory Allocation Adjustment | (3,791 | ) | (445 | ) | 510 | |||||||
Amortization of Unrecognized Postretirement Benefit Costs (note 10) | 629 | 628 | 821 | |||||||||
Income Tax Benefit (Expense) | 1,266 | (74 | ) | (532 | ) | |||||||
Pension and Postretirement Benefit Plans – net-of-tax | (1,896 | ) | 109 | 799 | ||||||||
Total Other Comprehensive Income (Loss) | (1,831 | ) | 98 | 765 | ||||||||
Total Comprehensive Income | $ | 70,608 | $ | 62,419 | $ | 60,110 | ||||||
See accompanying notes to consolidated financial statements. |
64
Otter Tail Corporation | |||||||||||||||||||||||||
Consolidated Statements of Common Shareholders’ Equity | |||||||||||||||||||||||||
(in thousands, except common shares outstanding) | Common Shares Outstanding | Par Value, Common Shares | Premium on Common Shares | Retained Earnings | Accumulated Other Comprehensive Income/(Loss) | Total Common Equity | |||||||||||||||||||
Balance, December 31, 2014 | 37,218,053 | $ | 186,090 | $ | 278,436 | $ | 112,903 | $ | (4,663 | ) | (a) | $ | 572,766 | ||||||||||||
Common Stock Issuances, Net of Expenses | 690,485 | 3,453 | 14,715 | 18,168 | |||||||||||||||||||||
Common Stock Retirements | (51,352 | ) | (257 | ) | (1,339 | ) | (1,596 | ) | |||||||||||||||||
Net Income | 59,345 | 59,345 | |||||||||||||||||||||||
Other Comprehensive Income | 765 | 765 | |||||||||||||||||||||||
Tax Benefit – Stock Compensation | 82 | 82 | |||||||||||||||||||||||
Employee Stock Incentive Plan Expense | 1,716 | 1,716 | |||||||||||||||||||||||
Common Dividends ($1.23 per share) | (46,223 | ) | (46,223 | ) | |||||||||||||||||||||
Balance, December 31, 2015 | 37,857,186 | $ | 189,286 | $ | 293,610 | $ | 126,025 | $ | (3,898 | ) | (a) | $ | 605,023 | ||||||||||||
Common Stock Issuances, Net of Expenses | 1,494,618 | 7,473 | 38,490 | 45,963 | |||||||||||||||||||||
Common Stock Retirements | (3,668 | ) | (18 | ) | (86 | ) | (104 | ) | |||||||||||||||||
Net Income | 62,321 | 62,321 | |||||||||||||||||||||||
Other Comprehensive Income | 98 | 98 | |||||||||||||||||||||||
Employee Stock Incentive Plan Expense | 3,178 | 3,178 | |||||||||||||||||||||||
ASU 2016-09 Adoption | 2,492 | (623 | ) | 1,869 | |||||||||||||||||||||
Common Dividends ($1.25 per share) | (48,244 | ) | (48,244 | ) | |||||||||||||||||||||
Balance, December 31, 2016 | 39,348,136 | $ | 196,741 | $ | 337,684 | $ | 139,479 | $ | (3,800 | ) | (a) | $ | 670,104 | ||||||||||||
Common Stock Issuances, Net of Expenses | 257,059 | 1,285 | 3,684 | 4,969 | |||||||||||||||||||||
Common Stock Retirements | (47,704 | ) | (239 | ) | (1,560 | ) | (1,799 | ) | |||||||||||||||||
Net Income | 72,439 | 72,439 | |||||||||||||||||||||||
Other Comprehensive Income | (1,831 | ) | (1,831 | ) | |||||||||||||||||||||
Employee Stock Incentive Plan Expense | 3,642 | 3,642 | |||||||||||||||||||||||
Common Dividends ($1.28 per share) | (50,632 | ) | (50,632 | ) | |||||||||||||||||||||
Balance, December 31, 2017 | 39,557,491 | $ | 197,787 | $ | 343,450 | $ | 161,286 | $ | (5,631 | ) | (a) | $ | 696,892 | ||||||||||||
(a) Accumulated Other Comprehensive Loss on December 31 is comprised of the following: | ||||||||||||
(in thousands) | 2017 | 2016 | 2015 | |||||||||
Unrealized Gain (Loss) on Marketable Equity Securities: | ||||||||||||
Before Tax | $ | 71 | $ | (29 | ) | $ | (12 | ) | ||||
Tax Effect | (25 | ) | 10 | 4 | ||||||||
Unrealized Gain (Loss) on Marketable Equity Securities – net-of-tax | 46 | (19 | ) | (8 | ) | |||||||
Unamortized Actuarial Losses and Prior Service Costs Related to Pension and Postretirement Benefits: | ||||||||||||
Before Tax | (9,462 | ) | (6,300 | ) | (6,484 | ) | ||||||
Tax Effect | 3,785 | 2,519 | 2,594 | |||||||||
Unamortized Actuarial Losses and Prior Service Costs Related to Pension and Postretirement Benefits – net-of-tax | (5,677 | ) | (3,781 | ) | (3,890 | ) | ||||||
Accumulated Other Comprehensive Loss: | ||||||||||||
Before Tax | (9,391 | ) | (6,329 | ) | (6,496 | ) | ||||||
Tax Effect | 3,760 | 2,529 | 2,598 | |||||||||
Net Accumulated Other Comprehensive Loss | $ | (5,631 | ) | $ | (3,800 | ) | $ | (3,898 | ) | |||
See accompanying notes to consolidated financial statements. |
65
Otter Tail Corporation | ||||||||||||
Consolidated Statements of Cash Flows—For the Years Ended December 31 | ||||||||||||
(in thousands) | 2017 | 2016 | 2015 | |||||||||
Cash Flows from Operating Activities | ||||||||||||
Net Income | $ | 72,439 | $ | 62,321 | $ | 59,345 | ||||||
Adjustments to Reconcile Net Income to Net Cash Provided by Operating Activities: | ||||||||||||
Net Gain from Sale of Discontinued Operations | -- | -- | (7,160 | ) | ||||||||
Net (Income) Loss from Discontinued Operations | (320 | ) | (284 | ) | 6,404 | |||||||
Depreciation and Amortization | 72,545 | 73,445 | 60,363 | |||||||||
Deferred Tax Credits | (1,470 | ) | (1,657 | ) | (1,878 | ) | ||||||
Deferred Income Taxes | 24,001 | 19,124 | 26,027 | |||||||||
Change in Deferred Debits and Other Assets | (2,173 | ) | (10,090 | ) | 11,407 | |||||||
Discretionary Contribution to Pension Fund | -- | (10,000 | ) | (10,000 | ) | |||||||
Change in Noncurrent Liabilities and Deferred Credits | 19,257 | 14,685 | 20,524 | |||||||||
Allowance for Equity/Other Funds Used During Construction | (986 | ) | (857 | ) | (1,303 | ) | ||||||
Change in Derivatives Net of Regulatory Deferral | -- | -- | (14,736 | ) | ||||||||
Stock Compensation Expense – Equity Awards | 3,642 | 3,178 | 1,716 | |||||||||
Other—Net | 10 | 7 | (80 | ) | ||||||||
Cash (Used for) Provided by Current Assets and Current Liabilities: | ||||||||||||
Change in Receivables | (2,135 | ) | (944 | ) | (1,746 | ) | ||||||
Change in Inventories | (4,294 | ) | 1,874 | 1,960 | ||||||||
Change in Other Current Assets | (3,060 | ) | (2,541 | ) | (210 | ) | ||||||
Change in Payables and Other Current Liabilities | (2,667 | ) | 11,941 | (15,150 | ) | |||||||
Change in Interest Payable and Income Taxes Receivable/Payable | (1,186 | ) | 3,339 | (3,943 | ) | |||||||
Net Cash Provided by Continuing Operations | 173,603 | 163,541 | 131,540 | |||||||||
Net Cash Used in Discontinued Operations | (26 | ) | (155 | ) | (14,000 | ) | ||||||
Net Cash Provided by Operating Activities | 173,577 | 163,386 | 117,540 | |||||||||
Cash Flows from Investing Activities | ||||||||||||
Capital Expenditures | (132,913 | ) | (161,259 | ) | (160,084 | ) | ||||||
Proceeds from Disposal of Noncurrent Assets | 4,491 | 4,837 | 3,590 | |||||||||
Acquisition Purchase Price Cash Received (Paid) | -- | 1,500 | (30,806 | ) | ||||||||
Cash Used for Investments and Other Assets | (4,168 | ) | (4,402 | ) | (6,302 | ) | ||||||
Net Cash Used in Investing Activities – Continuing Operations | (132,590 | ) | (159,324 | ) | (193,602 | ) | ||||||
Net Proceeds from Sale of Discontinued Operations | -- | -- | 39,401 | |||||||||
Net Cash Used in Investing Activities – Discontinued Operations | -- | -- | (1,769 | ) | ||||||||
Net Cash Used in Investing Activities | (132,590 | ) | (159,324 | ) | (155,970 | ) | ||||||
Cash Flows from Financing Activities | ||||||||||||
Change in Checks Written in Excess of Cash | 2,434 | (3,363 | ) | 2,857 | ||||||||
Net Short-Term Borrowings (Repayments) | 69,488 | (37,789 | ) | 69,818 | ||||||||
Proceeds from Issuance of Common Stock – net of Issuance Expenses | 4,349 | 43,873 | 13,782 | |||||||||
Payments for Retirement of Capital Stock | (1,799 | ) | (104 | ) | (1,596 | ) | ||||||
Proceeds from Issuance of Long-Term Debt | -- | 130,000 | -- | |||||||||
Short-Term and Long-Term Debt Issuance Expenses | (380 | ) | (888 | ) | (312 | ) | ||||||
Payments for Retirement of Long-Term Debt | (48,231 | ) | (87,547 | ) | (212 | ) | ||||||
Dividends Paid and Other Distributions | (50,632 | ) | (48,244 | ) | (46,223 | ) | ||||||
Net Cash (Used in) Provided by Financing Activities – Continuing Operations | (24,771 | ) | (4,062 | ) | 38,114 | |||||||
Net Cash Provided by Financing Activities – Discontinued Operations | -- | -- | 316 | |||||||||
Net Cash (Used in) Provided by Financing Activities | (24,771 | ) | (4,062 | ) | 38,430 | |||||||
Net Change in Cash and Cash Equivalents | 16,216 | -- | -- | |||||||||
Cash and Cash Equivalents at Beginning of Period | -- | -- | -- | |||||||||
Cash and Cash Equivalents at End of Period | $ | 16,216 | $ | -- | $ | -- | ||||||
See accompanying notes to consolidated financial statements. |
66
Otter Tail Corporation | ||||||||
Consolidated Statements of Capitalization, December 31 | ||||||||
(in thousands, except share data) | 2017 | 2016 | ||||||
Short-Term Debt | ||||||||
Otter Tail Corporation Credit Agreement | $ | -- | $ | -- | ||||
Otter Tail Power Company Credit Agreement | 112,371 | 42,883 | ||||||
Total Short-Term Debt | $ | 112,371 | $ | 42,883 | ||||
Long-Term Debt | ||||||||
Obligations of Otter Tail Corporation | ||||||||
Term Loan, LIBOR plus 0.90%, due February 5, 2018 | $ | -- | $ | 15,000 | ||||
3.55% Guaranteed Senior Notes, due December 15, 2026 | 80,000 | 80,000 | ||||||
North Dakota Development Note, 3.95%, due April 1, 2018 | 27 | 106 | ||||||
Partnership in Assisting Community Expansion (PACE) Note, 2.54%, due March 18, 2021 | 684 | 836 | ||||||
Total – Otter Tail Corporation | 80,711 | 95,942 | ||||||
Less: Current Maturities--net of Unamortized Debt Issuance Costs | 186 | 231 | ||||||
Unamortized Long-Term Debt Issuance Costs | 461 | 539 | ||||||
Total Otter Tail Corporation Long-Term Debt net of Unamortized Debt Issuance Costs | 80,064 | 95,172 | ||||||
Obligations of Otter Tail Power Company | ||||||||
Senior Unsecured Notes 5.95%, Series A, due August 20, 2017 | -- | 33,000 | ||||||
Senior Unsecured Notes 4.63%, due December 1, 2021 | 140,000 | 140,000 | ||||||
Senior Unsecured Notes 6.15%, Series B, due August 20, 2022 | 30,000 | 30,000 | ||||||
Senior Unsecured Notes 6.37%, Series C, due August 20, 2027 | 42,000 | 42,000 | ||||||
Senior Unsecured Notes 4.68%, Series A, due February 27, 2029 | 60,000 | 60,000 | ||||||
Senior Unsecured Notes 6.47%, Series D, due August 20, 2037 | 50,000 | 50,000 | ||||||
Senior Unsecured Notes 5.47%, Series B, due February 27, 2044 | 90,000 | 90,000 | ||||||
Total – Otter Tail Power Company | 412,000 | 445,000 | ||||||
Less: Current Maturities--net of Unamortized Debt Issuance Costs | -- | 32,970 | ||||||
Unamortized Long-Term Debt Issuance Costs | 1,684 | 1,861 | ||||||
Total Otter Tail Power Company Long-Term Debt net of Unamortized Debt Issuance Costs | 410,316 | 410,169 | ||||||
Total Consolidated Long-Term Debt | 492,711 | 540,942 | ||||||
Less: Current Maturities--net of Unamortized Debt Issuance Costs | 186 | 33,201 | ||||||
Unamortized Long-Term Debt Issuance Costs | 2,145 | 2,400 | ||||||
Total Consolidated Long-Term Debt net of Unamortized Debt Issuance Costs | 490,380 | 505,341 | ||||||
Cumulative Preferred Shares—Without Par Value, Authorized 1,500,000 Shares; Outstanding: None | ||||||||
Cumulative Preference Shares–Without Par Value, Authorized 1,000,000 Shares; Outstanding: None | ||||||||
Total Common Shareholders’ Equity | 696,892 | 670,104 | ||||||
Total Capitalization | $ | 1,187,272 | $ | 1,175,445 | ||||
See accompanying notes to consolidated financial statements. |
67
Otter Tail Corporation
Notes to Consolidated Financial Statements
For the years ended December 31, 2017, 2016 and 2015
1. Summary of Significant Accounting Policies
Principles of Consolidation
The consolidated financial statements of Otter Tail Corporation and its wholly owned subsidiaries (the Company) include the accounts of the following segments: Electric, Manufacturing and Plastics. See note 2 to consolidated financial statements for further descriptions of the Company’s business segments. All intercompany balances and transactions have been eliminated in consolidation except profits on sales to the regulated electric utility company from nonregulated affiliates, which is in accordance with the requirements of Financial Accounting Standards Board (FASB) Accounting Standards Codification (ASC) Topic 980, Regulated Operations (ASC 980).
Regulation and ASC 980
The Company’s regulated electric utility company, Otter Tail Power Company (OTP), accounts for the financial effects of regulation in accordance with ASC 980. This standard allows for the recording of a regulatory asset or liability for costs and revenues that will be collected or refunded through the ratemaking process in the future. In accordance with regulatory treatment, OTP defers utility debt redemption premiums and amortizes such costs over the original life of the reacquired bonds. See note 4 to consolidated financial statements for further discussion.
OTP is subject to various state and federal agency regulations. The accounting policies followed by this business are subject to the Uniform System of Accounts of the Federal Energy Regulatory Commission (FERC). These accounting policies differ in some respects from those used by the Company’s nonelectric businesses.
Plant, Retirements and Depreciation
Utility plant is stated at original cost. The cost of additions includes contracted work, direct labor and materials, allocable overheads and allowance for funds used during construction. The amount of interest capitalized on electric utility plant was $741,000 in 2017, $495,000 in 2016 and $723,000 in 2015. The cost of depreciable units of property retired less salvage is charged to accumulated depreciation. Removal costs, when incurred, are charged against the accumulated reserve for estimated removal costs, a regulatory liability. Maintenance, repairs and replacement of minor items of property are charged to operating expenses. The provisions for utility depreciation for financial reporting purposes are made on the straight-line method based on the estimated remaining service lives of the properties (5 to 82 years). Such provisions as a percent of the average balance of depreciable electric utility property were 2.74% in 2017, 2.88% in 2016 and 2.61% in 2015. Gains or losses on group asset dispositions are taken to the accumulated provision for depreciation reserve and impact current and future depreciation rates.
Property and equipment of nonelectric operations are carried at historical cost or at fair value if acquired in a business combination, and are depreciated on a straight-line basis over the assets’ estimated useful lives (3 to 40 years). The cost of additions includes contracted work, direct labor and materials, allocable overheads and capitalized interest. No interest was capitalized on nonelectric plant in 2017, 2016 or 2015. Maintenance and repairs are expensed as incurred. Gains or losses on asset dispositions are included in the determination of operating income.
Recoverability of Long-Lived Assets
The Company reviews its long-lived assets whenever events or changes in circumstances indicate the carrying amount of the assets may not be recoverable. The Company determines potential impairment by comparing the carrying amount of the assets with net cash flows expected to be provided by operating activities of the business or related assets. If the sum of the expected future net cash flows is less than the carrying amount of the assets, the Company would recognize an impairment loss. Such an impairment loss would be measured as the amount by which the carrying amount exceeds the fair value of the asset, where fair value is based on the discounted cash flows expected to be generated by the asset.
68
Jointly Owned Facilities
OTP is a joint owner in two coal-fired steam-powered electric generation plants: Big Stone Plant near Big Stone City, South Dakota and Coyote Station near Beulah, North Dakota. OTP is also a joint owner, with other regional utilities, in four major in-service transmission lines and one additional major transmission line under construction. The following table provides OTP’s ownership percentages and amounts included in the Company’s December 31, 2017 and 2016 consolidated balance sheets for OTP’s share of jointly owned assets in each of these jointly owned facilities:
Jointly Owned Facilities (dollars in thousands) | OTP Ownership Percentage | Electric Plant in Service | Construction Work in Progress | Accumulated Depreciation | Net Plant | |||||||||||||||
December 31, 2017 | ||||||||||||||||||||
Big Stone Plant | 53.9 | % | $ | 329,942 | $ | 1,074 | $ | (74,165 | ) | $ | 256,851 | |||||||||
Coyote Station | 35.0 | % | 177,721 | 158 | (103,944 | ) | 73,935 | |||||||||||||
Fargo-Monticello 345 kV line | 14.2 | % | 78,192 | -- | (4,667 | ) | 73,525 | |||||||||||||
Brookings-Southeast Twin Cities 345 kV line1 | 4.8 | % | 26,269 | -- | (1,293 | ) | 24,976 | |||||||||||||
Bemidji-Grand Rapids 230 kV line | 14.8 | % | 16,331 | -- | (1,753 | ) | 14,578 | |||||||||||||
Big Stone South–Brookings 345 kV line1 | 50.0 | % | 53,225 | -- | (434 | ) | 52,791 | |||||||||||||
Big Stone South–Ellendale 345 kV line1 | 50.0 | % | -- | 89,980 | -- | 89,980 | ||||||||||||||
December 31, 2016 | ||||||||||||||||||||
Big Stone Plant | 53.9 | % | $ | 328,809 | $ | 23 | $ | (65,665 | ) | $ | 263,167 | |||||||||
Coyote Station | 35.0 | % | 176,315 | 113 | (101,499 | ) | 74,929 | |||||||||||||
Fargo-Monticello 345 kV line | 14.2 | % | 78,298 | -- | (3,511 | ) | 74,787 | |||||||||||||
Brookings-Southeast Twin Cities 345 kV line1 | 4.8 | % | 26,406 | -- | (924 | ) | 25,482 | |||||||||||||
Bemidji-Grand Rapids 230 kV line | 14.8 | % | 16,331 | -- | (1,573 | ) | 14,758 | |||||||||||||
Big Stone South–Brookings 345 kV line1 | 50.0 | % | -- | 45,050 | -- | 45,050 | ||||||||||||||
Big Stone South–Ellendale 345 kV line1 | 50.0 | % | -- | 49,160 | -- | 49,160 | ||||||||||||||
1Midcontinent Independent System Operator, Inc. (MISO) Multi-Value Project (MVP) designation provides for a return on invested funds while under construction under the MISO Open Access Transmission, Energy and Operating Reserve Markets Tariff (MISO Tariff).
The Company’s share of direct revenue and expenses of the jointly owned facilities is included in operating revenue and expenses in the consolidated statements of income.
Coyote Station Lignite Supply Agreement – Variable Interest Entity—In October 2012 the Coyote Station owners, including OTP, entered into a lignite sales agreement (LSA) with Coyote Creek Mining Company, L.L.C. (CCMC), a subsidiary of The North American Coal Corporation, for the purchase of lignite coal to meet the coal supply requirements of Coyote Station for the period beginning in May 2016 and ending in December 2040. The price per ton paid by the Coyote Station owners under the LSA reflects the cost of production, along with an agreed profit and capital charge. CCMC was formed for the purpose of mining coal to meet the coal fuel supply requirements of Coyote Station from May 2016 through December 2040 and, based on the terms of the LSA, is considered a variable interest entity (VIE) due to the transfer of all operating and economic risk to the Coyote Station owners, as the agreement is structured so that the price of the coal would cover all costs of operations as well as future reclamation costs. The Coyote Station owners are also providing a guarantee of the value of the assets of CCMC as they would be required to buy certain assets at book value should they terminate the contract prior to the end of the contract term and are providing a guarantee of the value of the equity of CCMC in that they are required to buy the entity at the end of the contract term at equity value. Under current accounting standards, the primary beneficiary of a VIE is required to include the assets, liabilities, results of operations and cash flows of the VIE in its consolidated financial statements. No single owner of Coyote Station owns a majority interest in Coyote Station and none, individually, has the power to direct the activities that most significantly impact CCMC. Therefore, none of the owners individually, including OTP, is considered a primary beneficiary of the VIE and the Company is not required to include CCMC in its consolidated financial statements.
If the LSA terminates prior to the expiration of its term or the production period terminates prior to December 31, 2040 and the Coyote Station owners purchase all of the outstanding membership interests of CCMC as required by the LSA, the owners will satisfy, or (if permitted by CCMC’s applicable lender) assume, all of CCMC’s obligations owed to CCMC’s lenders under its loans and leases. The Coyote Station owners have limited rights to assign their rights and obligations under the LSA without the consent of CCMC’s lenders during any period in which CCMC’s obligations to its lenders remain outstanding. In the event the contract is terminated because regulations or legislation render the burning of coal cost prohibitive and the assets worthless, OTP’s maximum exposure to loss as a result of its involvement with CCMC as of December 31, 2017 could be as high as $57.1 million, OTP’s 35% share of unrecovered costs.
69
Income Taxes
Comprehensive interperiod income tax allocation is used for substantially all book and tax temporary differences. Deferred income taxes arise for all temporary differences between the book and tax basis of assets and liabilities. Deferred taxes are recorded using the tax rates scheduled by tax law to be in effect in the periods when the temporary differences reverse. The Company amortizes investment tax credits over the estimated lives of related property. The Company records income taxes in accordance with ASC Topic 740, Income Taxes, and has recognized in its consolidated financial statements the tax effects of all tax positions that are “more-likely-than-not” to be sustained on audit based solely on the technical merits of those positions as of the balance sheet date. The term “more-likely-than-not” means a likelihood of more than 50%. The Company classifies interest and penalties on tax uncertainties as components of the provision for income taxes. See note 13 to consolidated financial statements regarding the Company’s accounting for uncertain tax positions.
The Company also is required to assess the realizability of its deferred tax assets, taking into consideration the Company’s forecast of future taxable income, the reversal of other existing temporary differences, available net operating loss carryforwards and available tax planning strategies that could be implemented to realize the deferred tax assets. Based on this assessment, management must evaluate the need for, and amount of, valuation allowances against the Company’s deferred tax assets. To the extent facts and circumstances change in the future, adjustments to the valuation allowance may be required.
On December 22, 2017, the Tax Cuts and Jobs Act of 2017 (TCJA) was signed into law. The major impacts of the changes included in the TCJA are discussed in note 13 to consolidated financial statements.
Revenue Recognition
Due to the diverse business operations of the Company, revenue recognition depends on the product produced and sold or service performed. The Company recognizes revenue when the earnings process is complete, evidenced by an agreement with the customer, there has been delivery and acceptance, the price is fixed or determinable and collectability is reasonably assured. In cases where significant obligations remain after delivery, revenue recognition is deferred until such obligations are fulfilled. Provisions for sales returns are recorded at the time of the sale based on historical information and current trends.
For the Company’s operating companies recognizing revenue on certain products when shipped, those operating companies have no further obligation to provide services related to such product. The shipping terms used in these instances are FOB shipping point. The majority of the revenues recorded by the companies in the Manufacturing and Plastics segments are recorded when products are shipped.
Customer electricity use is metered and bills are rendered monthly. Revenue is accrued for electricity consumed but not yet billed. Rate schedules applicable to substantially all customers include a fuel clause adjustment, under which the rates are adjusted to reflect changes in average cost of fuels and purchased power, and a surcharge for recovery of conservation-related expenses. Revenue is recognized for fuel and purchased power costs incurred in excess of amounts recovered in base rates but not yet billed through the fuel clause adjustment, for conservation program incentives and bonuses earned but not yet billed and for renewable resource, transmission-related and environmental incurred costs and investment returns approved for recovery through riders.
Revenues on wholesale electricity sales from Company-owned generating units are recognized when energy is delivered. For shared use of transmission facilities with certain regional transmission cooperatives, revenues are estimated. Bills are rendered based on anticipated usage and settlements are made later based on actual usage. Estimated revenues may be adjusted prior to settlement, or at the time of settlement, to reflect actual usage.
Under ASC Topic 815, Derivatives and Hedging, OTP accounts for forward energy contracts as derivatives subject to mark-to-market accounting unless those contracts meet the definition of a capacity contract or are not subject to unplanned netting, then OTP accounts for the contracts under the normal purchases and sales exception to mark-to-market accounting.
Warranty Reserves
Certain products sold by the Company’s manufacturing and plastics companies carry product warranties for one year after the shipment date. These companies’ standard product warranty terms generally include post-sales support and repairs or replacement of a product at no additional charge for a specified period of time. While these companies engage in extensive product quality programs and processes, including actively monitoring and evaluating the quality of their component suppliers, they base their estimated warranty obligations on warranty terms, ongoing product failure rates, repair costs, product call rates, average cost per call, and current period product shipments. The Company’s manufacturing and plastics companies have not incurred any significant warranty costs over the last three fiscal years.
70
Shipping and Handling Costs
The Company includes revenues received for shipping and handling in operating revenues. Expenses paid for shipping and handling are recorded as part of cost of goods sold.
Use of Estimates
The Company uses estimates based on the best information available in recording transactions and balances resulting from business operations. As better information becomes available (or actual amounts are known), the recorded estimates are revised. Consequently, operating results can be affected by revisions to prior accounting estimates.
Cash Equivalents
The Company considers all highly liquid debt instruments purchased with maturity of 90 days or less to be cash equivalents.
Investments
The following table provides a breakdown of the Company’s investments at December 31:
(in thousands) | 2017 | 2016 | ||||||
Cost Method: | ||||||||
Economic Development Loan Pools | $ | 45 | $ | 54 | ||||
Other | 115 | 115 | ||||||
Equity Method Partnerships | 24 | 23 | ||||||
Marketable Debt Securities Classified as Available-for-Sale | 7,160 | 8,225 | ||||||
Marketable Equity Securities Classified as Available-for-Sale | 1,285 | -- | ||||||
Total Investments | $ | 8,629 | $ | 8,417 | ||||
The Company’s marketable securities classified as available-for-sale are held for insurance purposes and are reflected at their fair values on December 31, 2017. See further discussion below.
Agreements Subject to Legally Enforceable Netting Arrangements
OTP has certain derivative contracts that are designated as normal purchases and carried at historical cost in the accompanying balance sheet. Individual counterparty exposures for these contracts can be offset according to legally enforceable netting arrangements. The Company does not offset assets and liabilities under legally enforceable netting arrangements on the face of its consolidated balance sheet.
Fair Value Measurements
The Company follows ASC Topic 820, Fair Value Measurements and Disclosures (ASC 820), for recurring fair value measurements. ASC 820 provides a single definition of fair value, requires enhanced disclosures about assets and liabilities measured at fair value and establishes a hierarchal framework for disclosing the observability of the inputs utilized in measuring assets and liabilities at fair value. The three levels defined by the hierarchy and examples of each level are as follows:
Level 1 – Quoted prices are available in active markets for identical assets or liabilities as of the reported date. The types of assets and liabilities included in Level 1 are highly liquid and actively traded instruments with quoted prices, such as equities listed by the New York Stock Exchange and commodity derivative contracts listed on the New York Mercantile Exchange .
Level 2 – Pricing inputs are other than quoted prices in active markets, but are either directly or indirectly observable as of the reported date. The types of assets and liabilities included in Level 2 are typically either comparable to actively traded securities or contracts, such as treasury securities with pricing interpolated from recent trades of similar securities, or priced with models using highly observable inputs, such as commodity options priced using observable forward prices and volatilities.
Level 3 – Significant inputs to pricing have little or no observability as of the reporting date. The types of assets and liabilities included in Level 3 are those with inputs requiring significant management judgment or estimation and may include complex and subjective models and forecasts.
71
The following tables present, for each of the hierarchy levels, the Company’s assets and liabilities that are measured at fair value on a recurring basis as of December 31, 2017 and December 31, 2016:
December 31, 2017 (in thousands) | Level 1 | Level 2 | Level 3 | |||||||||
Assets: | ||||||||||||
Investments: | ||||||||||||
Equity Funds – Held by Captive Insurance Company | $ | 1,285 | ||||||||||
Corporate Debt Securities – Held by Captive Insurance Company | $ | 5,373 | ||||||||||
Government-Backed and Government-Sponsored Enterprises’ Debt Securities – Held by Captive Insurance Company | 1,787 | |||||||||||
Other Assets: | ||||||||||||
Money Market and Mutual Funds – Nonqualified Retirement Savings Plan | 823 | |||||||||||
Total Assets | $ | 2,108 | $ | 7,160 | ||||||||
December 31, 2016 (in thousands) | Level 1 | Level 2 | Level 3 | |||||||||
Assets: | ||||||||||||
Investments: | ||||||||||||
Corporate Debt Securities – Held by Captive Insurance Company | $ | 5,280 | ||||||||||
Government-Backed and Government-Sponsored Enterprises’ Debt Securities – Held by Captive Insurance Company | 2,945 | |||||||||||
Other Assets: | ||||||||||||
Money Market and Mutual Funds – Nonqualified Retirement Savings Plan | $ | 849 | ||||||||||
Total Assets | $ | 849 | $ | 8,225 | ||||||||
The valuation techniques and inputs used for the Level 2 fair value measurements in the table above are as follows:
Government-Backed and Government-Sponsored Enterprises’ and Corporate Debt Securities Held by the Company’s Captive Insurance Company – Fair values are determined on the basis of valuations provided by a third-party pricing service which utilizes industry accepted valuation models and observable market inputs to determine valuation. Some valuations or model inputs used by the pricing service may be based on broker quotes.
Inventories
Electric segment inventories are reported at average cost. The Manufacturing and Plastics segments’ inventories are stated at the lower of average cost or market. Inventories consist of the following at December 31:
(in thousands) | 2017 | 2016 | ||||||
Finished Goods | $ | 26,605 | $ | 27,755 | ||||
Work in Process | 14,222 | 11,754 | ||||||
Raw Material, Fuel and Supplies | 47,207 | 44,231 | ||||||
Total Inventories | $ | 88,034 | $ | 83,740 | ||||
Goodwill and Other Intangible Assets
The Company accounts for goodwill and other intangible assets in accordance with the requirements of ASC Topic 350, Intangibles—Goodwill and Other, measuring its goodwill for impairment annually in the fourth quarter, and more often when events indicate the assets may be impaired. The Company does qualitative assessments of its reporting units with recorded goodwill to determine if it is more likely than not that the fair value of the reporting unit exceeds its book value. The Company also does quantitative assessments of its reporting units with recorded goodwill to determine the fair value of the reporting unit.
In the first quarter of 2015, Foley recorded a $1.0 million goodwill impairment charge based on adjustments to the carrying value of Foley. The first quarter 2015 goodwill impairment loss is reflected in the results of discontinued operations. See note 15 to consolidated financial statements.
On September 1, 2015 BTD Manufacturing, Inc. (BTD), acquired the assets of Impulse Manufacturing, Inc. (Impulse) of Dawsonville, Georgia. The acquired business operates under the name BTD-Georgia. Based on the preliminary purchase price allocation, the difference in the fair value of assets acquired and the price paid for Impulse resulted in an initial estimate of acquired goodwill of $8.2 million. A final determination of the purchase price was agreed to in June 2016 resulting in a $2.2 million reduction in acquired goodwill in June 2016.
72
The following tables summarize changes to goodwill by business segment during 2017 and 2016:
(in thousands) | Gross Balance December 31, 2016 | Accumulated Impairments | Balance (net of impairments) December 31, 2016 | Adjustments to Goodwill in 2017 | Balance (net of impairments) December 31, 2017 | |||||||||||||||
Manufacturing | $ | 18,270 | $ | -- | $ | 18,270 | $ | -- | $ | 18,270 | ||||||||||
Plastics | 19,302 | -- | 19,302 | -- | 19,302 | |||||||||||||||
Total | $ | 37,572 | $ | -- | $ | 37,572 | $ | -- | $ | 37,572 | ||||||||||
(in thousands) | Gross Balance December 31, 2015 | Accumulated Impairments | Balance (net of impairments) December 31, 2015 | Adjustments to Goodwill in 2016 | Balance (net of impairments) December 31, 2016 | |||||||||||||||
Manufacturing | $ | 20,430 | $ | -- | $ | 20,430 | $ | (2,160 | ) | $ | 18,270 | |||||||||
Plastics | 19,302 | -- | 19,302 | -- | 19,302 | |||||||||||||||
Total | $ | 39,732 | $ | -- | $ | 39,732 | $ | (2,160 | ) | $ | 37,572 | |||||||||
Intangible assets with finite lives are amortized over their estimated useful lives and reviewed for impairment in accordance with requirements under ASC Topic 360-10-35, Property, Plant, and Equipment—Overall—Subsequent Measurement. In 2017 the Company capitalized $154,000 in implementation costs for new financial reporting consolidation software included in other amortizable intangible assets. In September 2017 the Company initiated use of the software and began amortizing the implementation costs.
The following table summarizes the components of the Company’s intangible assets at December 31, 2017 and December 31, 2016:
December 31, 2017 (in thousands) | Gross Carrying Amount | Accumulated Amortization | Net Carrying Amount | Remaining Amortization Periods (months) | |||||||||||||
Amortizable Intangible Assets: | |||||||||||||||||
Customer Relationships | $ | 22,491 | $ | 8,994 | $ | 13,497 | 24 | - | 212 | ||||||||
Covenant not to Compete | 590 | 459 | 131 | 8 | |||||||||||||
Other | 154 | 17 | 137 | 32 | |||||||||||||
Total | $ | 23,235 | $ | 9,470 | $ | 13,765 | |||||||||||
December 31, 2016 (in thousands) | |||||||||||||||||
Amortizable Intangible Assets: | |||||||||||||||||
Customer Relationships | $ | 22,491 | $ | 7,861 | $ | 14,630 | 36 | - | 224 | ||||||||
Covenant not to Compete | 590 | 262 | 328 | 20 | |||||||||||||
Total | $ | 23,081 | $ | 8,123 | $ | 14,958 | |||||||||||
The amortization expense for these intangible assets was:
(in thousands) | 2017 | 2016 | 2015 | |||||||||
Amortization Expense – Intangible Assets | $ | 1,347 | $ | 1,436 | $ | 1,127 | ||||||
The estimated annual amortization expense for these intangible assets for the next five years is:
(in thousands) | 2018 | 2019 | 2020 | 2021 | 2022 | |||||||||||||||
Estimated Amortization Expense – Intangible Assets | $ | 1,315 | $ | 1,184 | $ | 1,133 | $ | 1,099 | $ | 1,099 | ||||||||||
Supplemental Disclosures of Cash Flow Information
As of December 31, | ||||||||
(in thousands) | 2017 | 2016 | ||||||
Noncash Investing Activities: | ||||||||
Transactions Related to Capital Additions not Settled in Cash | $ | 13,887 | $ | 13,533 | ||||
(in thousands) | 2017 | 2016 | 2015 | |||||||||
Cash Paid (Received) During the Year for: | ||||||||||||
Interest (net of amount capitalized) | $ | 29,791 | $ | 31,269 | $ | 30,512 | ||||||
Income Taxes | $ | 5,064 | $ | (1,291 | ) | $ | 7,322 | |||||
73
New Accounting Standards Adopted
Accounting Standards Update (ASU) 2015-11—In July 2015 the Financial Accounting Standards Board (FASB) issued ASU No. 2015-11, Inventory (Topic 330): Simplifying the Measurement of Inventory, which requires that inventories be measured at the lower of cost or net realizable value instead of the lower of cost or market value. Net realizable value is defined as the estimated selling price in the ordinary course of business, less reasonably predictable costs of completion, disposal, and transportation. The standards update was effective prospectively for fiscal years and interim periods beginning after December 15, 2016. The Company adopted the updates in ASU 2015-11 in the first quarter of 2017. The adoption of the updated standard did not have a material impact on the Company’s consolidated financial statements as market and net realizable value were substantially the same for the inventories of its manufacturing companies.
New Accounting Standards Pending Adoption
ASU 2014-09—In May 2014 the FASB issued ASU No. 2014-09, Revenue from Contracts with Customers (Topic 606) (ASC 606). ASC 606 is a comprehensive, principles-based accounting standard which amends current revenue recognition guidance with the objective of improving revenue recognition requirements by providing a single comprehensive model to determine the measurement of revenue and the timing of revenue recognition. ASC 606 also requires expanded disclosures to enable users of financial statements to understand the nature, amount, timing and uncertainty of revenue and cash flows arising from contracts with customers.
Amendments to the ASC in ASU 2014-09, as amended, are effective for fiscal years beginning after December 15, 2017. Early adoption is permitted. Application methods permitted are: (1) full retrospective, (2) retrospective using one or more practical expedients and (3) retrospective with the cumulative effect of initial application recognized at the date of initial application. As of December 31, 2017 the Company had reviewed its revenue streams and contracts and determined areas where the amendments in ASU 2014-09 are applicable and has developed controls for new processes that will be required to track and report revenues where the timing of revenue recognition may change under ASU 2014-09. Based on review of the Company’s revenue streams, the Company has not identified any contracts where the timing of revenue recognition will change as a result of the adoption of the updates in ASU 2016-09. The Company will adopt the updates in ASU 2014-09 on a modified retrospective basis on January 1, 2018, the date of initial application, but will not be recording a cumulative effect adjustment to retained earnings on application of the updates because the adoption of the updates in ASU 606 have no material impact on the timing of revenue recognition for the Company or its subsidiaries. Adoption of ASU 2014-09 will result in additional disclosures related to the nature, timing and certainty of revenues and any contract assets or liabilities that may be required to be reported under the updated standard.
The Company will report adjustments to Alternative Revenue Program (ARP) revenues at OTP as a separate line item within revenue on the face of the Company’s consolidated statements of income. The ARP revenue adjustments are recorded on the basis of recoverable costs incurred and returns earned under rate riders and are not considered revenue from contracts with customers.
ASU 2016-02—In February 2016 the FASB issued ASU No. 2016-02, Leases (Topic 842) (ASU 2016-02). ASU 2016-02 is a comprehensive amendment of the ASC, creating Topic 842, which will supersede the current requirements under ASC Topic 840 on leases and require the recognition of lease assets and lease liabilities on the balance sheet and the disclosure of key information about leasing arrangements. Topic 842 affects any entity that enters into a lease, with some specified scope exemptions. The main difference between previous Generally Accepted Accounting Principles in the United States (GAAP) and Topic 842 is the recognition of lease assets and lease liabilities by lessees for those leases classified as operating leases under previous GAAP. Topic 842 retains a distinction between finance leases and operating leases. The classification criteria for distinguishing between finance leases and operating leases are substantially similar to the classification criteria for distinguishing between capital leases and operating leases in the previous guidance. Topic 842 also requires qualitative and specific quantitative disclosures by lessees and lessors to meet the objective of enabling users of financial statements to assess the amount, timing, and uncertainty of cash flows arising from leases. The amendments in ASU 2016-02 are effective for fiscal years beginning after December 15, 2018, including interim periods within those fiscal years. Early application of the amendments in ASU 2016-02 is permitted. The Company has developed a list of all current leases outstanding and continues to review ASU 2016-02, identifying key impacts to its businesses to determine areas where the amendments in ASU 2016-02 will be applicable and is evaluating transition options. The Company does not currently plan to apply the amendments in ASU 2016-02 to its consolidated financial statements prior to 2019.
74
ASU 2017-04—In January 2017 the FASB issued ASU No. 2017-04, Intangibles—Goodwill and Other (Topic 350): Simplifying the Test for Goodwill Impairment (ASU 2017-04), which simplifies how an entity is required to test goodwill for impairment by eliminating Step 2 from the goodwill impairment test. Step 2 measures a goodwill impairment loss by comparing the implied fair value of a reporting unit’s goodwill with the carrying amount of that goodwill. In computing the implied fair value of goodwill under Step 2, an entity has to perform procedures to determine the fair value at the impairment testing date of its assets and liabilities (including unrecognized assets and liabilities) following the procedure that would be required in determining the fair value of assets acquired and liabilities assumed in a business combination. Under the amendments in ASU 2017-04, an entity will perform its annual, or interim, goodwill impairment test by comparing the fair value of a reporting unit with its carrying amount. An entity will recognize an impairment charge for the amount by which the carrying amount exceeds the reporting unit’s fair value; however, the loss recognized will not exceed the total amount of goodwill allocated to that reporting unit. Additionally, an entity will consider income tax effects from any tax deductible goodwill on the carrying amount of the reporting unit when measuring the goodwill impairment loss, if applicable.
The amendments in ASU 2017-04 modify the concept of impairment from the condition that exists when the carrying amount of goodwill exceeds its implied fair value to the condition that exists when the carrying amount of a reporting unit exceeds its fair value. An entity no longer will determine goodwill impairment by calculating the implied fair value of goodwill by assigning the fair value of a reporting unit to all of its assets and liabilities as if that reporting unit had been acquired in a business combination. Because these amendments eliminate Step 2 from the goodwill impairment test, they should reduce the cost and complexity of evaluating goodwill for impairment. The amendments in ASU 2017-04 are effective for annual or any interim goodwill impairment tests in fiscal years beginning after December 15, 2019. Early adoption is permitted for interim or annual goodwill impairment tests performed on testing dates after January 1, 2017.
ASU 2017-07—In March 2017 the FASB issued ASU No. 2017-07, Compensation—Retirement Benefits (Topic 715): Improving the Presentation of Net Periodic Pension Cost and Net Periodic Postretirement Benefit Cost (ASU 2017-07), which is intended to improve the presentation of net periodic pension cost and net periodic postretirement benefit cost. ASC Topic 715, Compensation—Retirement Benefits (ASC 715), does not prescribe where the amount of net benefit cost should be presented in an employer’s income statement and does not require entities to disclose by line item the amount of net benefit cost that is included in the income statement or capitalized in assets. The amendments in ASU 2017-07 require that an employer report the service cost component of periodic benefit costs in the same line item or items as other compensation costs arising from services rendered by the pertinent employees during the period. The other components of net benefit cost as defined in ASC 715 are required to be presented in the income statement separately from the service cost component and outside a subtotal of income from operations. The amendments in ASU 2017-07 also allow only the service cost component to be eligible for capitalization when applicable (for example, as a cost of internally manufactured inventory or a self-constructed asset). The amendments in ASU 2017-07 are effective for annual periods beginning after December 15, 2017, including interim periods within those annual periods. The amendments will be applied retrospectively for the presentation of the service cost component and the other components of net periodic pension cost and net periodic postretirement benefit cost in the income statement and prospectively, on and after the effective date, for the capitalization of the service cost component of net periodic pension cost and net periodic postretirement benefit cost in assets.
The majority of the Company’s benefit costs to which the amendments in ASU 2017-07 apply are related to benefit plans in place at OTP, the Company’s regulated provider of electric utility services. The amendments in ASU 2017-07 deviate significantly from current prescribed ratemaking and regulatory accounting treatment of postretirement benefit costs, which require the capitalization of a portion of all the components of net periodic benefit costs be included in rate base additions and provide for rate recovery of the non-capitalized portion of all of the components of net periodic pension costs as recoverable operating expenses. The Company has assessed the impact adoption of the amendments in ASU 2017-07 will have on its consolidated financial statements, financial position and results of operations and OTP has determined the regulatory assets to be established in order to reflect the effect of the required regulatory accounting treatment of the non-service cost components that cannot be capitalized to plant in service under the ASU 2017-07 amendments to GAAP. The non-service cost components of the affected net periodic benefit costs will be reported below the operating income line on the Company’s consolidated income statements upon adoption of the amendments in ASU 2017-07.
The Company does not plan to adopt the updates in ASU 2017-07 prior to the first quarter of 2018, the required effective period for application of the updates by the Company. The Company’s non-service cost components of net periodic post-retirement benefit costs that were capitalized to plant in service in 2017 that would have been recorded as regulatory assets if the amendments in ASU 2017-07 were applicable in 2017 were $0.8 million. The Company’s non-service costs components of net periodic postretirement benefit costs included in operating expense that will be included in other income and deductions on adoption of ASU 2017-07 were $5.6 million in 2017 and $5.1 million in 2016.
75
2. Business Combinations, Dispositions and Segment Information
Business Combinations
The Company acquired no new businesses in 2017 or 2016.
On September 1, 2015 BTD acquired the assets of Impulse of Dawsonville, Georgia for $30.8 million in cash. A post-closing reduction in the purchase price of $1.5 million was agreed to in June 2016 resulting in an adjusted purchase price of $29.3 million. The acquired business, operating under the name BTD-Georgia, is a full-service metal fabricator located 30 miles north of Atlanta, Georgia, which offers a wide range of metal fabrication services ranging from simple laser cutting services and high volume stamping to complex weldments and assemblies for metal fabrication buyers and original equipment manufacturers. In addition to serving some of BTD’s existing customers from a location closer to the customers’ manufacturing facilities, this acquisition provides opportunities for growth in new and existing markets for BTD with complementing production capabilities that expand the capacity of services offered by BTD. Pro forma results of operations have not been presented for this acquisition because the effect of the acquisition was not material to the Company.
Below is condensed balance sheet information disclosing the final allocation of the purchase price assigned to each major asset and liability category of BTD-Georgia:
(in thousands) | ||||
Assets: | ||||
Current Assets | $ | 4,906 | ||
Goodwill | 6,083 | |||
Other Intangible Assets | 6,270 | |||
Other Amortizable Assets | 1,380 | |||
Fixed Assets | 13,649 | |||
Total Assets | $ | 32,288 | ||
Liabilities: | ||||
Current Liabilities | $ | 2,971 | ||
Lease Obligation | 11 | |||
Total Liabilities | $ | 2,982 | ||
Cash Paid | $ | 29,306 |
In execution of the Company’s announced strategy of realigning its business portfolio to reduce its risk profile and dedicate a greater portion of its resources toward electric utility operations, the Company sold several of its holdings in recent years. On December 31, 2014 the Company was in the process of negotiating the sales of Foley, its mechanical and prime contractor on industrial projects, and AEV, Inc., its electrical design and construction services company, which resulted in the removal of its Construction segment from continuing operations. The sale of Foley closed on April 30, 2015 and the sale of the assets of AEV, Inc. closed on February 28, 2015.
The results of operations of the Company’s recently disposed businesses are reported as discontinued operations in the Company’s consolidated financial statements as of and for the years ended December 31, 2017, 2016 and 2015, and are summarized in note 15 to consolidated financial statements.
76
Segment Information
The accounting policies of the segments are described under note 1 – Summary of Significant Accounting Policies. The Company's businesses have been classified into three segments to be consistent with its business strategy and the reporting and review process used by the Company’s chief operating decision makers. These businesses sell products and provide services to customers primarily in the United States. The Company’s business structure currently includes the following three segments: Electric, Manufacturing and Plastics. The chart below indicates the companies included in each segment.
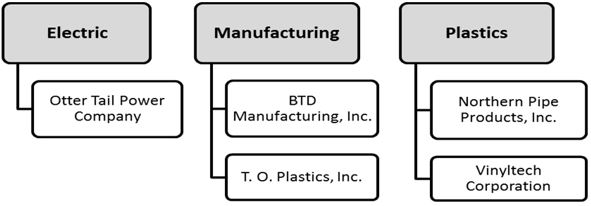
Electric includes the production, transmission, distribution and sale of electric energy in Minnesota, North Dakota and South Dakota by OTP. In addition, OTP is a participant in the MISO markets. OTP’s operations have been the Company’s primary business since 1907.
Manufacturing consists of businesses in the following manufacturing activities: contract machining, metal parts stamping, fabrication and painting, and production of plastic thermoformed horticultural containers, life science and industrial packaging, and material handling components. These businesses have manufacturing facilities in Georgia, Illinois and Minnesota and sell products primarily in the United States.
Plastics consists of businesses producing polyvinyl chloride (PVC) pipe at plants in North Dakota and Arizona. The PVC pipe is sold primarily in the upper Midwest and Southwest regions of the United States.
OTP is a wholly owned subsidiary of the Company. All of the Company’s other businesses are owned by its wholly owned subsidiary, Varistar Corporation (Varistar). The Company’s Corporate operating costs include items such as corporate staff and overhead costs, the results of the Company’s captive insurance company and other items excluded from the measurement of operating segment performance. Corporate assets consist primarily of cash, prepaid expenses, investments and fixed assets. Corporate is not an operating segment. Rather, it is added to operating segment totals to reconcile to totals on the Company’s consolidated financial statements.
No single customer accounted for over 10% of the Company’s consolidated revenues in 2017, 2016 and 2015. While no single customer accounted for over 10% of consolidated revenue in 2017, certain customers provided a significant portion of each business segment’s 2017 revenue. The Electric segment has one customer that provided 11.7% of 2017 Electric segment revenues. The Manufacturing segment has one customer that manufactures and sells recreational vehicles that provided 24.3% of 2017 Manufacturing segment revenues and one customer that manufactures and sells lawn and garden equipment that provided 12.0% of 2017 Manufacturing segment revenues. The Plastics segment has two customers that individually provided 20.6% and 17.8% of 2017 Plastics segment revenues. The loss of any one of these customers would have a significant negative impact on the financial position and results of operations of the respective business segment and the Company.
All of the Company’s long-lived assets are within the United States and sales within the United States accounted for 98.2% of sales in 2017, 98.6% of sales in 2016 and 97.1% of sales in 2015.
77
The Company evaluates the performance of its business segments and allocates resources to them based on earnings contribution and return on total invested capital. Information on continuing operations for the business segments for 2017, 2016 and 2015 is presented in the following table:
(in thousands) | 2017 | 2016 | 2015 | |||||||||
Operating Revenue | ||||||||||||
Electric | $ | 434,537 | $ | 427,383 | $ | 407,131 | ||||||
Manufacturing | 229,738 | 221,289 | 215,011 | |||||||||
Plastics | 185,132 | 154,901 | 157,758 | |||||||||
Intersegment Eliminations | (57 | ) | (34 | ) | (96 | ) | ||||||
Total | $ | 849,350 | $ | 803,539 | $ | 779,804 | ||||||
Cost of Products Sold | ||||||||||||
Manufacturing | $ | 176,473 | $ | 171,732 | $ | 171,956 | ||||||
Plastics | 140,107 | 123,496 | 123,085 | |||||||||
Intersegment Eliminations | (18 | ) | (6 | ) | (9 | ) | ||||||
Total | $ | 316,562 | $ | 295,222 | $ | 295,032 | ||||||
Other Nonelectric Expenses | ||||||||||||
Manufacturing | $ | 23,785 | $ | 21,994 | $ | 21,116 | ||||||
Plastics | 11,564 | 9,402 | 9,849 | |||||||||
Corporate | 7,930 | 8,896 | 9,143 | |||||||||
Intersegment Eliminations | (39 | ) | (28 | ) | (87 | ) | ||||||
Total | $ | 43,240 | $ | 40,264 | $ | 40,021 | ||||||
Depreciation and Amortization | ||||||||||||
Electric | $ | 53,276 | $ | 53,743 | $ | 44,786 | ||||||
Manufacturing | 15,379 | 15,794 | 11,853 | |||||||||
Plastics | 3,817 | 3,861 | 3,552 | |||||||||
Corporate | 73 | 47 | 172 | |||||||||
Total | $ | 72,545 | $ | 73,445 | $ | 60,363 | ||||||
Operating Income (Loss) | ||||||||||||
Electric | $ | 90,392 | $ | 90,131 | $ | 87,171 | ||||||
Manufacturing | 14,101 | 11,769 | 10,086 | |||||||||
Plastics | 29,644 | 18,142 | 21,272 | |||||||||
Corporate | (8,003 | ) | (8,943 | ) | (9,315 | ) | ||||||
Total | $ | 126,134 | $ | 111,099 | $ | 109,214 | ||||||
Interest Charges | ||||||||||||
Electric | $ | 25,334 | $ | 25,069 | $ | 24,371 | ||||||
Manufacturing | 2,215 | 3,859 | 3,560 | |||||||||
Plastics | 633 | 1,034 | 1,026 | |||||||||
Corporate and Intersegment Eliminations | 1,422 | 1,924 | 2,203 | |||||||||
Total | $ | 29,604 | $ | 31,886 | $ | 31,160 | ||||||
Income Tax Expense (Benefit) – Continuing Operations | ||||||||||||
Electric | $ | 17,013 | $ | 16,366 | $ | 16,067 | ||||||
Manufacturing | 989 | 2,276 | 2,299 | |||||||||
Plastics | 7,448 | 6,538 | 8,187 | |||||||||
Corporate | 1,593 | (5,099 | ) | (4,911 | ) | |||||||
Total | $ | 27,043 | $ | 20,081 | $ | 21,642 | ||||||
Net Income (Loss) | ||||||||||||
Electric | $ | 49,446 | $ | 49,829 | $ | 48,370 | ||||||
Manufacturing | 11,050 | 5,694 | 4,247 | |||||||||
Plastics | 21,696 | 10,628 | 12,108 | |||||||||
Corporate | (10,073 | ) | (4,114 | ) | (6,136 | ) | ||||||
Discontinued Operations | 320 | 284 | 756 | |||||||||
Total | $ | 72,439 | $ | 62,321 | $ | 59,345 | ||||||
78
(in thousands) | 2017 | 2016 | 2015 | |||||||||
Capital Expenditures | ||||||||||||
Electric | $ | 118,444 | $ | 149,648 | $ | 135,572 | ||||||
Manufacturing | 9,916 | 8,429 | 20,295 | |||||||||
Plastics | 4,432 | 3,085 | 4,206 | |||||||||
Corporate | 121 | 97 | 11 | |||||||||
Total | $ | 132,913 | $ | 161,259 | $ | 160,084 | ||||||
Identifiable Assets | ||||||||||||
Electric | $ | 1,690,224 | $ | 1,622,231 | $ | 1,520,887 | ||||||
Manufacturing | 167,023 | 166,525 | 173,860 | |||||||||
Plastics | 87,230 | 84,592 | 81,624 | |||||||||
Corporate | 59,801 | 39,037 | 42,312 | |||||||||
Total | $ | 2,004,278 | $ | 1,912,385 | $ | 1,818,683 | ||||||
3. Rate and Regulatory Matters
Below are descriptions of OTP’s major capital expenditure projects that have had, or will have, a significant impact on OTP’s revenue requirements, rates and alternative revenue recovery mechanisms, followed by summaries of specific electric rate or rider proceedings with the Minnesota Public Utilities Commission (MPUC), the North Dakota Public Service Commission (NDPSC), the South Dakota Public Utilities Commission (SDPUC) and the FERC, impacting OTP’s revenues in 2017, 2016 and 2015.
Major Capital Expenditure Projects
Big Stone South–Ellendale Multi-Value Transmission Project (MVP)—This is a 345-kiloVolt (kV) transmission line that will extend 163 miles between a substation near Big Stone City, South Dakota and a substation near Ellendale, North Dakota. OTP jointly developed this project with Montana-Dakota Utilities Co., a division of MDU Resources Group, Inc., and the parties will have equal ownership interest in the transmission line portion of the project. MISO approved this project as an MVP under the MISO Open Access Transmission, Energy and Operating Reserve Markets Tariff (MISO Tariff) in December 2011. MVPs are designed to enable the region to comply with energy policy mandates and to address reliability and economic issues affecting multiple areas within the MISO region. The cost allocation is designed to ensure the costs of transmission projects with regional benefits are properly assigned to those who benefit. Construction began on this line in the second quarter of 2016 and is expected to be completed in 2019. OTP’s capitalized costs on this project as of December 31, 2017 were approximately $90.0 million, which includes assets that are 100% owned by OTP.
Big Stone South–Brookings MVP—This 345-kV transmission line extends approximately 70 miles between a substation near Big Stone City, South Dakota and the Brookings County Substation near Brookings, South Dakota. OTP and Northern States Power–Minnesota, a subsidiary of Xcel Energy Inc., jointly developed this project and the parties have equal ownership interest in the transmission line portion of the project. MISO approved this project as an MVP under the MISO Tariff in December 2011. Construction began on this line in the third quarter of 2015 and the line was energized on September 8, 2017. OTP’s capitalized costs on this project as of December 31, 2017 were approximately $72.7 million, which includes assets that are 100% owned by OTP.
Recovery of OTP’s major transmission investments is through the MISO Tariff (several as MVPs) and, currently, Minnesota, North Dakota and South Dakota Transmission Cost Recovery (TCR) Riders.
Reagent Costs
OTP’s systemwide costs for reagents are expected to increase to approximately $2.2 million annually through May 2021 when Hoot Lake Plant is expected to be retired. The Minnesota, North Dakota and South Dakota share of costs are approximately 50%, 40% and 10%, respectively. Reagent costs for the Big Stone Plant AQCS and Coyote Station and Hoot Lake Plant Mercury and Air Toxics Standards (MATS) were initially incurred in 2015 when projects went into service.
79
Minnesota
2016 General Rate Case—The MPUC rendered its final decision in OTP’s 2016 general rate case in March 2017 and issued its written order on May 1, 2017. Pursuant to the order, OTP’s allowed rate of return on rate base decreased from 8.61% to 7.5056% and its allowed rate of return on equity decreased from 10.74% to 9.41%. On July 6, 2017 the MPUC denied OTP’s request for reconsideration of certain of the MPUC’s rulings in the rate case and confirmed its May 1, 2017 order.
The MPUC’s order also included: (1) the determination that all costs (including FERC allocated costs and revenues) of the Big Stone South–Brookings and Big Stone South–Ellendale MVP projects will be included in the Minnesota TCR rider and jurisdictionally allocated to OTP’s Minnesota customers, and (2) approval of OTP’s proposal to transition rate base, expenses and revenues from Environmental Cost Recovery (ECR) and TCR riders to base rate recovery, with the transition occurring when final rates are implemented. The rate base balances, expense levels and revenue levels existing in the riders at the time of implementation of final rates will be used to establish the amounts transitioned to base rates. Certain MISO expenses and revenues will remain in the TCR rider to allow for the ongoing refund or recovery of these variable revenues and costs.
Information on interim and final rate increases and interim revenue refunds accrued is detailed in the tables below:
($ in thousands) | Interim Rates Authorized April 14, 2016 | Final Rates | ||||||
Revenue Increase – Annualized based on Test Year Data | $ | 16,816 | $ | 10,471 | ||||
Revenue Percent Increase | 9.56 | % | 5.34 | % | ||||
Return on Rate Base | 8.07 | % | 7.5056 | % | ||||
Jurisdictional Rate Base based on Test Year Data | $ | 483,000 | $ | 471,000 | ||||
Return on Equity | 10.40 | % | 9.41 | % | ||||
Based on Equity to Total Capital of | 52.50 | % | 52.50 | % | ||||
Debt to Total Capital | 47.50 | % | 47.50 | % | ||||
Interim Revenue (in thousands) | April 16, 2016 through October 31, 2017 | |||
Billed | $ | 23,289 | ||
Accrued Refund | $ | 8,779 | ||
Net Interim Revenue | $ | 14,510 | ||
Interest on Refundable Amount | $ | 265 | ||
Final Refund | $ | 9,044 | ||
In addition to the interim rate refund, OTP will be required to refund the difference between (1) amounts collected under its Minnesota ECR and TCR riders based on the return on equity (ROE) approved in its most recent rider update and (2) amounts that would have been collected based on the lower 9.41% ROE approved in its 2016 general rate case going back to April 16, 2016, the date interim rates were implemented. As of October 31, 2017 the revenues collected under the Minnesota ECR and TCR riders subject to refund due to the lower ROE rate and other adjustments were $0.9 million and $1.4 million, respectively. These amounts will be refunded to Minnesota customers over a 12-month period through reductions in the Minnesota ECR and TCR rider rates in effect November 1, 2017, as approved by the MPUC. The TCR rate is provisional and subject to revision under a separate docket.
OTP accrued interim and rider rate refunds until final rates became effective, for bills rendered on and after November 1, 2017. The final interim rate refund, including interest, of $9.0 million was applied as a credit to Minnesota customers’ electric bills beginning November 17, 2017.
Minnesota Conservation Improvement Programs (MNCIP)—Under Minnesota law, every regulated public utility that furnishes electric service must make annual investments and expenditures in energy conservation improvements, or make a contribution to the state's energy and conservation account, in an amount equal to at least 1.5% of its gross operating revenues from service provided in Minnesota.
The Minnesota Department of Commerce (MNDOC) may require a utility to make investments and expenditures in energy conservation improvements whenever it finds that the improvement will result in energy savings at a total cost to the utility less than the cost to the utility to produce or purchase an equivalent amount of a new supply of energy. Such MNDOC orders can be appealed to the MPUC. Investments made pursuant to such orders generally are recoverable costs in rate cases, even though ownership of the improvement may belong to the property owner rather than the utility. OTP recovers conservation related costs not included in base rates under the MNCIP through the use of an annual recovery mechanism approved by the MPUC.
80
On May 25, 2016 the MPUC adopted the MNDOC’s proposed changes to the MNCIP financial incentive. The new model provides utilities an incentive of 13.5% of 2017 net benefits, 12% of 2018 net benefits and 10% of 2019 net benefits, assuming the utility achieves 1.7% savings compared to retail sales. OTP estimates the impact of the new model will reduce the MNCIP financial incentive by approximately 50% compared to the previous incentive mechanism. MNCIP incentives included $5.0 million approved for 2016 and $4.3 million approved for 2015.
Based on results from the 2017 MNCIP program year, OTP recognized a financial incentive of $2.6 million in 2017. The 2017 program resulted in an approximate 10% decrease in energy savings compared to 2016 program results. OTP will request approval for recovery of its 2017 MNCIP program costs not included in base rates, a $2.6 million financial incentive and an update to the MNCIP surcharge from the MPUC by April 1, 2018.
Transmission Cost Recovery Rider—The Minnesota Public Utilities Act (the MPU Act) provides a mechanism for automatic adjustment outside of a general rate proceeding to recover the costs of new transmission facilities that have been previously approved by the MPUC in a Certificate of Need (CON) proceeding, certified by the MPUC as a Minnesota priority transmission project, made to transmit the electricity generated from renewable generation sources ultimately used to provide service to the utility's retail customers, or exempt from the requirement to obtain a Minnesota CON. The MPUC may also authorize cost recovery via such TCR riders for charges incurred by a utility under a federally approved tariff that accrue from other transmission owners’ regionally planned transmission projects that have been determined by the MISO to benefit the utility or integrated transmission system. The MPU Act also authorizes TCR riders to recover the costs of new transmission facilities approved by the regulatory commission of the state in which the new transmission facilities are to be constructed, to the extent approval is required by the laws of that state, and determined by the MISO to benefit the utility or integrated transmission system. Finally, under certain circumstances, the MPU Act also authorizes TCR riders to recover the costs associated with distribution planning and investments in distribution facilities to modernize the utility grid. Such TCR riders allow a return on investment at the level approved in a utility’s last general rate case. Additionally, following approval of the rate schedule, the MPUC may approve annual rate adjustments filed pursuant to the rate schedule. MISO regional cost allocation allows OTP to recover some of the costs of its transmission investment from other MISO customers.
In OTP’s 2016 general rate case order issued on May 1, 2017, the MPUC ordered OTP to include, in the TCR rider retail rate base, Minnesota’s jurisdictional share of OTP’s investment in the Big Stone South–Brookings and Big Stone South–Ellendale MVP Projects and all revenues received from other utilities under MISO’s tariffed rates as a credit in its TCR revenue requirement calculations. In doing so, the MPUC’s order diverts interstate wholesale revenues that have been approved by the FERC to offset FERC-approved expenses, effectively reducing OTP’s recovery of those FERC-approved expense levels. The MPUC-ordered treatment will result in the projects being treated as retail investments for Minnesota retail ratemaking purposes. Because the FERC’s revenue requirements and authorized returns will vary from the MPUC revenue requirements and authorized returns for the project investments over the lives of the projects, the impact of this decision will vary over time and be dependent on the differences between the revenue requirements and returns in the two jurisdictions at any given time. On August 18, 2017 OTP filed an appeal of the MPUC order with the Minnesota Court of Appeals to contest the portion of the order requiring OTP to allocate costs between jurisdictions of the FERC MVP transmission projects in the TCR rider. OTP believes the MPUC-ordered treatment conflicts with federal authority over transmission of electricity in interstate commerce and rates for the transmission of electricity subject to the jurisdiction of the FERC as set forth in the Federal Power Act of 1935, as amended (Federal Power Act). A decision is expected in late 2018.
Environmental Cost Recovery Rider— OTP had an ECR rider for recovery of OTP’s Minnesota jurisdictional share of the revenue requirements of its investment in the Big Stone Plant Air Quality Control System (AQCS). The ECR rider provided for a return on the project’s construction work in progress (CWIP) balance at the level approved in OTP’s 2010 general rate case. In its 2016 general rate case order, the MPUC approved OTP’s proposal to transition eligible rate base and expense recovery from the ECR rider to base rate recovery, effective with implementation of final rates in November 2017.
Reagent Costs and Emission Allowances—On July 31, 2014 OTP filed a request with the MPUC to revise its Fuel Clause Adjustment (FCA) rider in Minnesota to include recovery of reagent and emission allowance costs. On March 12, 2015 the MPUC denied OTP’s request to revise its FCA rider to include recovery of these costs. These costs were included in OTP’s 2016 general rate case in Minnesota and were considered for recovery either through the FCA rider or general rates. In its 2016 general rate case order issued May 1, 2017 the MPUC again denied OTP’s request for recovery of test-year reagent costs and emission allowances in base fuel costs or through the FCA rider. Instead, the test-year costs will be recovered in general rates and variability of those costs in excess of amounts included in general rates will only be recovered to the extent actual kilowatt-hour (kwh) sales exceed forecasted kwh sales used to establish general rates.
81
North Dakota
General Rates—On November 2, 2017 OTP filed a request with the NDPSC for a rate review and an effective increase in annual revenues from non-fuel base rates of $13.1 million or 8.72%. In the request, OTP proposed an allowed return on rate base of 7.97% and an allowed rate of return on equity of 10.30%. On December 20, 2017 the NDPSC approved OTP’s request for interim rates to increase annual revenue collections by $12.8 million, effective January 1, 2018. OTP used a lower rate of return on equity in the calculation of interim rates based on the rate of return on equity used in its 2018 test-year rate request.
OTP’s most recent general rate increase in North Dakota of $3.6 million, or approximately 3.0%, was granted by the NDPSC in an order issued on November 25, 2009 and effective December 2009. Pursuant to the order, OTP’s allowed rate of return on rate base was set at 8.62%, and its allowed rate of return on equity was set at 10.75%.
Renewable Resource Adjustment—OTP has a North Dakota Renewable Resource Adjustment which enables OTP to recover its North Dakota jurisdictional share of investments in renewable energy facilities. This rider allows OTP to recover costs associated with new renewable energy projects as they are completed, along with a return on investment.
Transmission Cost Recovery Rider—North Dakota law provides a mechanism for automatic adjustment outside of a general rate proceeding to recover jurisdictional capital and operating costs incurred by a public utility for new or modified electric transmission facilities. For qualifying projects, the law authorizes a current return on CWIP and a return on investment at the level approved in the utility's most recent general rate case.
Environmental Cost Recovery Rider—OTP has an ECR rider in North Dakota to recover its North Dakota jurisdictional share of the revenue requirements associated with its investment in the Big Stone Plant AQCS and Hoot Lake Plant MATS projects. The ECR rider provides for a return on investment at the level approved in OTP’s most recent general rate case and for recovery of OTP’s North Dakota share of reagent and emission allowance costs.
South Dakota
2010 General Rate Case—OTP’s most recent general rate increase in South Dakota of approximately $643,000 or approximately 2.32% was granted by the SDPUC in an order issued on April 21, 2011 and effective with bills rendered on and after June 1, 2011. Pursuant to the order, OTP’s allowed rate of return on rate base was set at 8.50%.
Transmission Cost Recovery Rider—South Dakota law provides a mechanism for automatic adjustment outside of a general rate proceeding to recover jurisdictional capital and operating costs incurred by a public utility for new or modified electric transmission facilities.
Environmental Cost Recovery Rider—OTP has an ECR rider in South Dakota to recover its South Dakota jurisdictional share of revenue requirements associated with its investment in the Big Stone Plant AQCS and Hoot Lake Plant MATS projects.
Reagent Costs and Emission Allowances—On August 1, 2014 OTP filed a request with the SDPUC to revise its FCA rider in South Dakota to include recovery of reagent and emission allowance costs. On September 16, 2014 the SDPUC approved OTP’s request to include recovery of these costs in its South Dakota FCA rider.
TCJA
The TCJA reduced the federal corporate income tax rate from 35% to 21%. Currently, all OTP rates have been developed using a 35% tax rate. The MPUC, the NDPSC, the SDPUC and the FERC have all initiated dockets or proceedings to begin working with utilities to assess the impact of the lower income tax rates under the TCJA on electric rates, and develop regulatory strategies to incorporate the tax change into future rates, if warranted. The MPUC required its regulated utilities to make filings by January 30, 2018 and February 15, 2018, but has not made a determination on rate treatment. OTP currently has an active rate case in North Dakota and anticipates incorporating the impact of the tax changes to North Dakota rates within that proceeding. The SDPUC required initial comments by February 1, 2018 and indicated that revenues collected subsequent to December 31, 2017 would be subject to refund, pending determination of the impacts of the TCJA. OTP is still assessing these impacts and will continue to work with the respective commissions to determine if any rate adjustments are necessary, and if so, to determine the appropriate timing and approach for making those adjustments.
82
Rate Rider Updates
The following table provides summary information on the status of updates since January 1, 2014 for the rate riders described above:
Rate Rider | R - Request Date A - Approval Date | Effective Date Requested or Approved | Annual Revenue ($000s) | Rate | |||
Minnesota | |||||||
Conservation Improvement Program | |||||||
2016 Incentive and Cost Recovery | A – September 15, 2017 | October 1, 2017 | $ | 9,868 | $0.00536/kwh | ||
2015 Incentive and Cost Recovery | A – July 19, 2016 | October 1, 2016 | $ | 8,590 | $0.00275/kwh | ||
2014 Incentive and Cost Recovery | A – July 10, 2015 | October 1, 2015 | $ | 8,689 | $0.00287/kwh | ||
2013 Incentive and Cost Recovery | A – September 26, 2014 | October 1, 2014 | $ | 8,862 | $0.00263/kwh | ||
Transmission Cost Recovery | |||||||
2017 Rate Reset1 | A – October 30, 2017 | November 1, 2017 | $ | (3,311 | ) | Various | |
2016 Annual Update | A – July 5, 2016 | September 1, 2016 | $ | 4,736 | Various | ||
2015 Annual Update | A – March 9, 2016 | April 1, 2016 | $ | 7,203 | Various | ||
2014 Annual Update | A – February 18, 2015 | March 1, 2015 | $ | 8,388 | Various | ||
2013 Annual Update | A – June 24, 2014 | March 1, 2014 | $ | 2,066 | Various | ||
Environmental Cost Recovery | |||||||
2017 Rate Reset | A – October 30, 2017 | November 1, 2017 | $ | (1,943 | ) | -0.935% of base | |
2016 Annual Update | A – July 5, 2016 | September 1, 2016 | $ | 11,884 | 6.927% of base | ||
2015 Annual Update | A – March 9, 2016 | October 1, 2015 | $ | 12,104 | 7.006% of base | ||
2014 Annual Update | A – November 26, 2014 | December 1, 2014 | $ | 9,229 | 2 | 7.006% of base | |
North Dakota | |||||||
Renewable Resource Adjustment | |||||||
2017 Rate Reset | A – December 20, 2017 | January 1, 2018 | $ | 9,989 | 7.756% of base | ||
2016 Annual Update | A – March 15, 2017 | April 1, 2017 | $ | 9,156 | 7.005% of base | ||
2015 Annual Update | A – June 22, 2016 | July 1, 2016 | $ | 9,262 | 7.573% of base | ||
2014 Annual Update | A – March 25, 2015 | April 1, 2015 | $ | 5,441 | 4.069% of base | ||
2013 Annual Update | A – March 12, 2014 | April 1, 2014 | $ | 8,068 | $0.00437/kwh | ||
Transmission Cost Recovery | |||||||
2017 Annual Update | A – November 29, 2017 | January 1, 2018 | $ | 7,959 | Various | ||
2016 Annual Update | A – December 14, 2016 | January 1, 2017 | $ | 6,916 | Various | ||
2015 Annual Update | A – December 16, 2015 | January 1, 2016 | $ | 9,985 | Various | ||
2014 Annual Update | A – December 17, 2014 | January 1, 2015 | $ | 8,463 | Various | ||
Environmental Cost Recovery | |||||||
2017 Rate Reset | A – December 20, 2017 | January 1, 2018 | $ | 8,537 | 6.629% of base | ||
2017 Annual Update | A – July 12, 2017 | August 1, 2017 | $ | 9,917 | 7.633% of base | ||
2016 Annual Update | A – June 22, 2016 | July 1, 2016 | $ | 10,359 | 7.904% of base | ||
2015 Annual Update | A – June 17, 2015 | July 1, 2015 | $ | 12,249 | 9.193% of base | ||
2014 Annual Update | A – July 10, 2014 | August 1, 2014 | $ | 9,880 | 7.531% of base | ||
South Dakota | |||||||
Transmission Cost Recovery | |||||||
2017 Annual Update | R – November 1, 2017 | March 1, 2018 | $ | 1,779 | Various | ||
2016 Annual Update | A – February 17, 2017 | March 1, 2017 | $ | 2,053 | Various | ||
2015 Annual Update | A – February 12, 2016 | March 1, 2016 | $ | 1,895 | Various | ||
2014 Annual Update | A – February 13, 2015 | March 1, 2015 | $ | 1,538 | Various | ||
2013 Annual Update | A – February 18, 2014 | March 1, 2014 | $ | 1,349 | Various | ||
Environmental Cost Recovery | |||||||
2017 Annual Update | A – October 13, 2017 | November 1, 2017 | $ | 2,082 | $0.00483/kwh | ||
2016 Annual Update | A – October 26, 2016 | November 1, 2016 | $ | 2,238 | $0.00536/kwh | ||
2015 Annual Update | A – October 15, 2015 | November 1, 2015 | $ | 2,728 | $0.00643/kwh | ||
2014 Initial Request | A – November 25, 2014 | December 1, 2014 | $ | 1,995 | $0.00487/kwh | ||
1Approved on a provisional basis in the Minnesota general rate case docket and subject to revision in a separate docket.
2Amount approved for recovery over ten months through September 30, 2015. Initial 2014 annual update requirement was $10.2 million to be effective October 1, 2014. Due to delayed approval, the amount was reduced for revenues billed under the rider rate in effect from October 1, 2014 through November 30, 2014.
83
Revenues Recorded under Rate Riders
The following table presents revenue recorded by OTP under rate riders in place in Minnesota, North Dakota and South Dakota for the years ended December 31:
Rate Rider (in thousands) | 2017 | 2016 | 2015 | |||||||||
Minnesota | ||||||||||||
Conservation Improvement Program Costs and Incentives1 | $ | 9,225 | $ | 12,920 | $ | 10,724 | ||||||
Transmission Cost Recovery | 2,973 | 5,795 | 5,202 | |||||||||
Environmental Cost Recovery | 8,148 | 12,443 | 10,238 | |||||||||
North Dakota | ||||||||||||
Renewable Resource Adjustment | 7,620 | 7,800 | 8,409 | |||||||||
Transmission Cost Recovery | 8,729 | 7,694 | 6,609 | |||||||||
Environmental Cost Recovery | 9,782 | 11,089 | 9,502 | |||||||||
South Dakota | ||||||||||||
Transmission Cost Recovery | 1,843 | 1,820 | 1,290 | |||||||||
Environmental Cost Recovery | 2,345 | 2,538 | 1,967 | |||||||||
Conservation Improvement Program Costs and Incentives | 598 | 468 | 583 | |||||||||
1Includes MNCIP costs recovered in base rates.
FERC
Wholesale power sales and transmission rates are subject to the jurisdiction of the FERC under the Federal Power Act. The FERC is an independent agency with jurisdiction over rates for wholesale electricity sales, transmission and sale of electric energy in interstate commerce, interconnection of facilities, and accounting policies and practices. Filed rates are effective after a one day suspension period, subject to ultimate approval by the FERC.
Multi-Value Transmission Projects—On December 16, 2010 the FERC approved the cost allocation for a new classification of projects in the MISO region called MVPs. MVPs are designed to enable the region to comply with energy policy mandates and to address reliability and economic issues affecting multiple transmission zones within the MISO region. The cost allocation is designed to ensure that the costs of transmission projects with regional benefits are properly assigned to those who benefit.
On November 12, 2013 a group of industrial customers and other stakeholders filed a complaint with the FERC seeking to reduce the ROE component of the transmission rates that MISO transmission owners, including OTP, may collect under the MISO Tariff. The complainants sought to reduce the 12.38% ROE used in MISO’s transmission rates to a proposed 9.15%. The complaint established a 15-month refund period from November 12, 2013 to February 11, 2015. A non-binding decision by the presiding Administrative Law Judge (ALJ) was issued on December 22, 2015 finding that the MISO transmission owners’ ROE should be 10.32%, and the FERC issued an order on September 28, 2016 setting the base ROE at 10.32%. A number of parties requested rehearing of the September 2016 order and the requests are pending FERC action.
On November 6, 2014 a group of MISO transmission owners, including OTP, filed for a FERC incentive of an additional 50-basis points for Regional Transmission Organization participation (RTO Adder). On January 5, 2015 the FERC granted the request, deferring collection of the RTO Adder until the FERC issued its order in the ROE complaint proceeding. Based on the FERC adjustment to the MISO Tariff ROE resulting from the November 12, 2013 complaint and OTP’s incentive rate filing, OTP’s ROE will be 10.82% (a 10.32% base ROE plus the 0.5% RTO Adder) effective September 28, 2016.
On February 12, 2015 another group of stakeholders filed a complaint with the FERC seeking to reduce the ROE component of the transmission rates that MISO transmission owners, including OTP, may collect under the MISO Tariff from 12.38% to a proposed 8.67%. This second complaint established a second 15-month refund period from February 12, 2015 to May 11, 2016. The FERC issued an order on June 18, 2015 setting the complaint for hearings before an ALJ, which were held the week of February 16, 2016. A non-binding decision by the presiding ALJ was issued on June 30, 2016 finding that the MISO transmission owners’ ROE should be 9.7%. OTP is currently waiting for the issuance of a FERC order on the second complaint.
Based on the probable reduction by the FERC in the ROE component of the MISO Tariff, OTP had a $2.7 million liability on its balance sheet as of December 31, 2016, representing OTP’s best estimate of the refund obligations that would arise, net of amounts that would be subject to recovery under state jurisdictional TCR riders, based on a reduced ROE. MISO processed the refund for the FERC-ordered reduction in the MISO Tariff allowed ROE for the first 15-month refund period in its February and June 2017 billings. The refund, in combination with a decision in the 2016 Minnesota general rate case that affected the Minnesota TCR rider, has resulted in a reduction in OTP’s accrued MISO Tariff ROE refund liability from $2.7 million on December 31, 2016 to $1.6 million as of December 31, 2017.
84
In June 2014, the FERC adopted a two-step ROE methodology for electric utilities in an order issued in a complaint proceeding involving New England Transmission Owners (NETOs). The issue of how to apply the FERC ROE methodology has been contested in various complaint proceedings, including the two ROE complaints involving MISO transmission owners discussed above. In April 2017 the Court of Appeals for the District of Columbia (D.C. Circuit) vacated and remanded the FERC’s June 2014 ROE order in the NETOs’ complaint. The D.C. Circuit found that the FERC had not properly determined that the ROE authorized for NETOs prior to June 2014 was unjust and unreasonable. The D.C. Circuit also found that the FERC failed to justify the new ROE methodology. OTP will await the FERC response to the April 2017 action of the D.C. Circuit before determining if an adjustment to its accrued refund liability is required. On September 29, 2017 the MISO transmission owners filed a motion to dismiss the second complaint based on the D.C. Circuit decision in the NETO complaint. If FERC were to act on a motion to dismiss, it would eliminate the refund obligation from the second complaint and the ROE from the first complaint would remain in effect.
4. Regulatory Assets and Liabilities
As a regulated entity, OTP accounts for the financial effects of regulation in accordance with ASC 980. This accounting standard allows for the recording of a regulatory asset or liability for costs that will be collected or refunded in the future as required under regulation. Additionally, ASC 980-605-25 provides for the recognition of revenues authorized for recovery outside of a general rate case under alternative revenue programs which provide for recovery of costs and incentives or returns on investment in such items as transmission infrastructure, renewable energy resources or conservation initiatives. The following tables indicate the amount of regulatory assets and liabilities recorded on the Company’s consolidated balance sheets:
December 31, 2017 | Remaining Recovery/ | |||||||||||||||
(in thousands) | Current | Long-Term | Total | Refund Period (months) | ||||||||||||
Regulatory Assets: | ||||||||||||||||
Prior Service Costs and Actuarial Losses on Pensions and Other Postretirement Benefits1 | $ | 9,090 | $ | 112,487 | $ | 121,577 | see below | |||||||||
Conservation Improvement Program Costs and Incentives2 | 7,385 | 2,774 | 10,159 | 21 | ||||||||||||
Accumulated ARO Accretion/Depreciation Adjustment1 | -- | 6,651 | 6,651 | asset lives | ||||||||||||
Deferred Marked-to-Market Losses1 | 4,063 | 2,405 | 6,468 | 36 | ||||||||||||
Big Stone II Unrecovered Project Costs – Minnesota1 | 650 | 1,636 | 2,286 | 40 | ||||||||||||
MISO Schedule 26/26A Transmission Cost Recovery Rider True-up2 | -- | 1,985 | 1,985 | 24 | ||||||||||||
Debt Reacquisition Premiums1 | 254 | 960 | 1,214 | 177 | ||||||||||||
Big Stone II Unrecovered Project Costs – South Dakota2 | 100 | 442 | 542 | 65 | ||||||||||||
North Dakota Renewable Resource Rider Accrued Revenues2 | 206 | 236 | 442 | 15 | ||||||||||||
North Dakota Deferred Rate Case Expenses Subject to Recovery1 | 309 | -- | 309 | 12 | ||||||||||||
Minnesota Deferred Rate Case Expenses Subject to Recovery1 | 267 | -- | 267 | 4 | ||||||||||||
North Dakota Environmental Cost Recovery Rider Accrued Revenues2 | 152 | -- | 152 | 12 | ||||||||||||
Minnesota Energy Intensive Trade Exposed Rider Accrued Revenues2 | 75 | -- | 75 | 12 | ||||||||||||
Total Regulatory Assets | $ | 22,551 | $ | 129,576 | $ | 152,127 | ||||||||||
Regulatory Liabilities: | ||||||||||||||||
Deferred Income Taxes | $ | -- | $ | 149,052 | $ | 149,052 | asset lives | |||||||||
Accumulated Reserve for Estimated Removal Costs – Net of Salvage | -- | 83,100 | 83,100 | asset lives | ||||||||||||
Refundable Fuel Clause Adjustment Revenues | 5,778 | -- | 5,778 | 12 | ||||||||||||
Minnesota Environmental Cost Recovery Rider Accrued Refund | 1,667 | -- | 1,667 | 11 | ||||||||||||
Minnesota Transmission Cost Recovery Rider Accrued Refund | 802 | 609 | 1,411 | 22 | ||||||||||||
Minnesota Renewable Resource Recovery Rider Accrued Refund | 409 | -- | 409 | 12 | ||||||||||||
North Dakota Transmission Cost Recovery Rider Accrued Refund | 349 | -- | 349 | 12 | ||||||||||||
Revenue for Rate Case Expenses Subject to Refund – Minnesota | 208 | -- | 208 | 4 | ||||||||||||
South Dakota Environmental Cost Recovery Rider Accrued Refund | 187 | -- | 187 | 12 | ||||||||||||
MISO Schedule 26/26A Transmission Cost Recovery Rider True-up | 132 | 48 | 180 | 24 | ||||||||||||
South Dakota Transmission Cost Recovery Rider Accrued Refund | 151 | -- | 151 | 12 | ||||||||||||
Other | 5 | 84 | 89 | 192 | ||||||||||||
Total Regulatory Liabilities | $ | 9,688 | $ | 232,893 | $ | 242,581 | ||||||||||
Net Regulatory Asset/(Liability) Position | $ | 12,863 | $ | (103,317 | ) | $ | (90,454 | ) | ||||||||
1Costs subject to recovery without a rate of return.
2Amount eligible for recovery under an alternative revenue program which includes an incentive or rate of return.
85
December 31, 2016 | Remaining Recovery/ | |||||||||||||||
(in thousands) | Current | Long-Term | Total | Refund Period (months) | ||||||||||||
Regulatory Assets: | ||||||||||||||||
Prior Service Costs and Actuarial Losses on Pensions and Other Postretirement Benefits1 | $ | 6,443 | $ | 108,267 | $ | 114,710 | see below | |||||||||
Conservation Improvement Program Costs and Incentives2 | 4,836 | 5,158 | 9,994 | 21 | ||||||||||||
Accumulated ARO Accretion/Depreciation Adjustment1 | -- | 6,153 | 6,153 | asset lives | ||||||||||||
Deferred Marked-to-Market Losses1 | 4,063 | 6,467 | 10,530 | 48 | ||||||||||||
Big Stone II Unrecovered Project Costs – Minnesota1 | 778 | 2,087 | 2,865 | 52 | ||||||||||||
MISO Schedule 26/26A Transmission Cost Recovery Rider True-up2 | 333 | -- | 333 | 12 | ||||||||||||
Debt Reacquisition Premiums1 | 325 | 1,214 | 1,539 | 189 | ||||||||||||
Big Stone II Unrecovered Project Costs – South Dakota2 | 100 | 543 | 643 | 77 | ||||||||||||
North Dakota Renewable Resource Rider Accrued Revenues2 | 1,319 | 482 | 1,801 | 15 | ||||||||||||
Minnesota Deferred Rate Case Expenses Subject to Recovery1 | 1,082 | -- | 1,082 | 12 | ||||||||||||
North Dakota Environmental Cost Recovery Rider Accrued Revenues2 | 113 | -- | 113 | 12 | ||||||||||||
Deferred Income Taxes1 | -- | 1,014 | 1,014 | asset lives | ||||||||||||
Recoverable Fuel and Purchased Power Costs1 | 1,798 | -- | 1,798 | 12 | ||||||||||||
Minnesota Renewable Resource Rider Accrued Revenues2 | 34 | -- | 34 | 9 | ||||||||||||
North Dakota Transmission Cost Recovery Rider Accrued Revenues2 | -- | 568 | 568 | 24 | ||||||||||||
South Dakota Transmission Cost Recovery Rider Accrued Revenues2 | 73 | 141 | 214 | 14 | ||||||||||||
Total Regulatory Assets | $ | 21,297 | $ | 132,094 | $ | 153,391 | ||||||||||
Regulatory Liabilities: | ||||||||||||||||
Deferred Income Taxes | $ | -- | $ | 818 | $ | 818 | asset lives | |||||||||
Accumulated Reserve for Estimated Removal Costs – Net of Salvage | -- | 80,404 | 80,404 | asset lives | ||||||||||||
Minnesota Environmental Cost Recovery Rider Accrued Refund | 139 | -- | 139 | 12 | ||||||||||||
Minnesota Transmission Cost Recovery Rider Accrued Refund | 757 | -- | 757 | 12 | ||||||||||||
North Dakota Transmission Cost Recovery Rider Accrued Refund | 1,381 | 782 | 2,163 | 24 | ||||||||||||
Revenue for Rate Case Expenses Subject to Refund – Minnesota | 711 | 208 | 919 | 16 | ||||||||||||
South Dakota Environmental Cost Recovery Rider Accrued Refund | 285 | -- | 285 | 12 | ||||||||||||
MISO Schedule 26/26A Transmission Cost Recovery Rider True-up | -- | 132 | 132 | 24 | ||||||||||||
Other | 21 | 89 | 110 | 204 | ||||||||||||
Total Regulatory Liabilities | $ | 3,294 | $ | 82,433 | $ | 85,727 | ||||||||||
Net Regulatory Asset Position | $ | 18,003 | $ | 49,661 | $ | 67,664 | ||||||||||
1Costs subject to recovery without a rate of return.
2Amount eligible for recovery under an alternative revenue program which includes an incentive or rate of return.
The regulatory liability and asset related to Deferred Income Taxes results from changes in statutory tax rates accounted for in accordance with ASC Topic 740, Income Taxes.
The regulatory asset related to prior service costs and actuarial losses on pensions and other postretirement benefits represents benefit costs and actuarial losses subject to recovery through rates as they are expensed over the remaining service lives of active employees included in the plans. These unrecognized benefit costs and actuarial losses are required to be recognized as components of Accumulated Other Comprehensive Income in equity under ASC Topic 715, Compensation—Retirement Benefits, but are eligible for treatment as regulatory assets based on their probable recovery in future retail electric rates.
Conservation Improvement Program Costs and Incentives represent mandated conservation expenditures and incentives recoverable through retail electric rates.
The Accumulated Asset Retirement Obligation (ARO) Accretion/Depreciation Adjustment will accrete and be amortized over the lives of property with asset retirement obligations.
All Deferred Marked-to-Market Losses recorded as of December 31, 2017 relate to forward purchases of energy scheduled for delivery through December 2020.
Big Stone II Unrecovered Project Costs – Minnesota are the Minnesota share of generation and transmission plant-related costs incurred by OTP related to its participation in the abandoned Big Stone II project.
86
MISO Schedule 26/26A Transmission Cost Recovery Rider True-ups relate to the over/under collection of revenue based on comparison of the expected versus actual construction on eligible projects in the period. The true-ups also include the state jurisdictional portion of MISO Schedule 26/26A for regional transmission cost recovery that was included in the calculation of the state transmission riders and subsequently adjusted to reflect actual billing amounts in the schedule.
Debt Reacquisition Premiums are being recovered from OTP customers over the remaining original lives of the reacquired debt issues, the longest of which is 177 months.
Big Stone II Unrecovered Project Costs – South Dakota are the South Dakota share of generation and transmission plant-related costs incurred by OTP related to its participation in the abandoned Big Stone II project.
North Dakota Renewable Resource Rider Accrued Revenues relate to qualifying renewable resource costs incurred to serve North Dakota customers that have not been billed to North Dakota customers as of December 31, 2017.
North Dakota Deferred Rate Case Expenses Subject to Recovery relate to costs incurred in conjunction with OTP’s current rate case in North Dakota currently being recovered over a 12-month period beginning with the establishment of interim rates in January 2018.
Minnesota Deferred Rate Case Expenses Subject to Recovery relate to costs incurred in conjunction with OTP’s 2016 rate case in Minnesota currently being recovered over a 24-month period beginning with the establishment of interim rates in April 2016.
North Dakota Environmental Cost Recovery Rider Accrued Revenues relate to revenues earned on the North Dakota share of OTP’s investments in the Big Stone Plant AQCS and Hoot Lake Plant MATS projects and for reagent and emission allowances costs that are recoverable from North Dakota customers as of December 31, 2017.
Minnesota Energy Intensive Trade Exposed Rider Accrued Revenues relate to revenues recorded for fuel and purchased power costs reductions provided to customers in energy intensive trade exposed industries that are subject to recovery from other Minnesota customers.
The Accumulated Reserve for Estimated Removal Costs – Net of Salvage is reduced as actual removal costs, net of salvage revenues, are incurred.
The Minnesota Environmental Cost Recovery Rider Accrued Refund relates to amounts collected on the Minnesota share of OTP’s investment in the Big Stone Plant AQCS project that are refundable to Minnesota customers as of December 31, 2017.
The Minnesota Transmission Cost Recovery Rider Accrued Refund relates to amounts collected for qualifying transmission system facilities and operating costs incurred to serve Minnesota customers that are refundable to Minnesota customers as of December 31, 2017.
The Minnesota Renewable Resource Rider Accrued Refund relates to amounts collected for qualifying renewable resource costs incurred to serve Minnesota customers that are refundable to Minnesota customers as of December 31, 2017.
The North Dakota Transmission Cost Recovery Rider Accrued Refund relates to amounts collected for qualifying transmission system facilities and operating costs incurred to serve North Dakota customers that are refundable to North Dakota customers as of December 31, 2017.
Revenue for Rate Case Expenses Subject to Refund – Minnesota relates to revenues collected under general rates to recover costs related to prior rate case proceedings in excess of the actual costs incurred, which are subject to refund over a 24-month period beginning with the establishment of interim rates in April 2016.
The South Dakota Environmental Cost Recovery Rider Accrued Refund relates to amounts collected on the South Dakota share of OTP’s investments in the Big Stone Plant AQCS and Hoot Lake Plant MATS projects that are refundable to South Dakota customers as of December 31, 2017.
The South Dakota Transmission Cost Recovery Rider Accrued Revenues relate to revenues earned on qualifying transmission system facilities that had not been billed to South Dakota customers as of December 31, 2016.
The South Dakota Transmission Cost Recovery Rider Accrued Refund relates to amounts collected for qualifying transmission system facilities and operating costs incurred to serve South Dakota customers that are refundable to South Dakota customers as of December 31, 2017.
87
If for any reason OTP ceases to meet the criteria for application of guidance under ASC 980 for all or part of its operations, the regulatory assets and liabilities that no longer meet such criteria would be removed from the consolidated balance sheet and included in the consolidated statement of income as an expense or income item in the period in which the application of guidance under ASC 980 ceases.
5. Common Shares and Earnings per Share
Shelf Registration
The Company’s shelf registration statement filed with the Securities and Exchange Commission (SEC) on May 11, 2015, under which the Company may offer for sale, from time to time, either separately or together in any combination, equity, debt or other securities described in the shelf registration statement, including common shares of the Company, expires on May 11, 2018.
Common Share Distribution Agreement
On May 11, 2015, the Company entered into a Distribution Agreement with J.P. Morgan Securities (JPMS) under which it may offer and sell its common shares from time to time in an At-the-Market offering program through JPMS, as its distribution agent, up to an aggregate sales price of $75 million.
Under the Distribution Agreement, the Company will designate the minimum price and maximum number of shares to be sold through JPMS on any given trading day or over a specified period of trading days, and JPMS will use commercially reasonable efforts to sell such shares on such days, subject to certain conditions. Sales of the shares, if any, will be made by means of ordinary brokers’ transactions on the NASDAQ Global Select Market at market prices or as otherwise agreed with JPMS. The Company may also agree to sell shares to JPMS, as principal for its own account, on terms agreed by the Company and JPMS in a separate agreement at the time of sale. The Company is not obligated to sell and JPMS is not obligated to buy or sell any of the shares under the Distribution Agreement. The shares, if issued, will be issued pursuant to the Company’s existing shelf registration statement.
2017 Common Stock Activity
Following is a reconciliation of the Company’s common shares outstanding from December 31, 2016 through December 31, 2017:
Common Shares Outstanding December 31, 2016 | 39,348,136 | |||
Issuances: | ||||
Executive Stock Performance Awards (2014 shares earned) | 89,291 | |||
Automatic Dividend Reinvestment and Share Purchase Plan: | ||||
Dividends Reinvested | 68,235 | |||
Cash Invested | 29,463 | |||
Vesting of Restricted Stock Units | 22,225 | |||
Restricted Stock Issued to Directors | 17,600 | |||
Employee Stock Ownership Plan | 14,835 | |||
Employee Stock Purchase Plan: | ||||
Dividends Reinvested | 9,566 | |||
Cash Invested | 5,284 | |||
Directors Deferred Compensation | 560 | |||
Retirements: | ||||
Shares Withheld for Individual Income Tax Requirements | (47,704 | ) | ||
Common Shares Outstanding December 31, 2017 | 39,557,491 |
2014 Stock Incentive Plan
The 2014 Stock Incentive Plan (2014 Incentive Plan), which was approved by the Company’s shareholders in April 2014, provides for the grant of stock options, stock appreciation rights, restricted stock, restricted stock units, performance awards, and other stock and stock-based awards. A total of 1,900,000 common shares were authorized for granting stock awards under the 2014 Incentive Plan, of which 1,244,353 were available for issuance as of December 31, 2017. The 2014 Incentive Plan terminates on December 13, 2023.
88
Employee Stock Purchase Plan
The 1999 Employee Stock Purchase Plan (Purchase Plan) allowed eligible employees to purchase the Company’s common shares at 85% of the market price at the end of each six-month purchase period through December 31, 2016. For purchase periods beginning after January 1, 2017, the purchase price is 100% of the market price at the end of each six-month purchase period. On April 16, 2012, the Company’s shareholders approved an amendment to the Purchase Plan, increasing the number of shares available under the Purchase Plan from 900,000 common shares to 1,400,000 common shares and making certain other changes to the terms of the Purchase Plan. Of the 1,400,000 common shares authorized to be issued under the Purchase Plan, 374,624 were available for purchase as of December 31, 2017. At the discretion of the Company, shares purchased under the Purchase Plan can be either new issue shares or shares purchased in the open market. To provide shares for purchases for the Purchase Plan, 9,486 common shares were issued in 2017, 53,875 common shares were issued in 2016 and 42,253 common shares were issued in 2015. Shares available for purchase were also reduced by 49 shares in 2017 to reserve for fractional shares.
Dividend Reinvestment and Share Purchase Plan
The Company’s shelf registration statement filed with the SEC on May 11, 2015, as amended on October 13, 2015, provides for the issuance of up to 1,500,000 common shares under the Company's Automatic Dividend Reinvestment and Share Purchase Plan (the Plan), which permits shares purchased by participants in the Plan to be either new issue common shares or common shares purchased in the open market. New common shares issued under the Plan totaled 97,698 in 2017, 278,811 in 2016 and 302,519 in 2015, leaving 820,972 common shares available for issuance under the Plan as of December 31, 2017.
Earnings Per Share
The numerator used in the calculation of both basic and diluted earnings per common share is net income with no adjustments in 2017, 2016 and 2015. The denominator used in the calculation of basic earnings per common share is the weighted average number of common shares outstanding during the period excluding nonvested restricted shares granted to the Company’s directors and employees, which are considered contingently returnable and not outstanding for the purpose of calculating basic earnings per share. The denominator used in the calculation of diluted earnings per common share is derived by adjusting basic shares outstanding for the items listed in the following reconciliation:
2017 | 2016 | 2015 | ||||||||||
Weighted Average Common Shares Outstanding – Basic | 39,457,261 | 38,546,459 | 37,494,986 | |||||||||
Plus Outstanding Share Awards net of Share Reductions for Unrecognized Stock-Based Compensation Expense and Excess Tax Benefits: | ||||||||||||
Shares Expected to be Awarded for Stock Performance Awards Granted to Executive Officers based on Measurement Period-to-Date Performance | 210,784 | 118,644 | 100,194 | |||||||||
Underlying Shares Related to Nonvested Restricted Stock Units Granted to Employees | 56,952 | 45,712 | 36,180 | |||||||||
Nonvested Restricted Shares | 20,380 | 16,778 | 22,848 | |||||||||
Shares Expected to be Issued Under the Deferred Compensation Program for Directors | 2,970 | 3,417 | 13,488 | |||||||||
Potentially Dilutive Stock Options | -- | -- | 330 | |||||||||
Total Dilutive Shares | 291,086 | 184,551 | 173,040 | |||||||||
Weighted Average Common Shares Outstanding – Diluted | 39,748,347 | 38,731,010 | 37,668,026 | |||||||||
The effect of dilutive shares on earnings per share for the years ended December 31, 2017, 2016 and 2015, resulted in no differences greater than $0.014 between basic and diluted earnings per share in total or from continuing or discontinued operations in any period.
89
6. Share-Based Payments
Purchase Plan
Through December 31, 2016, the Purchase Plan allowed employees through payroll withholding to purchase shares of the Company’s common stock at a 15% discount from the average market price on the last day of a six-month investment period. Under ASC Topic 718, Compensation—Stock Compensation (ASC 718), the Company was required to record compensation expense related to the 15% discount. The 15% discount resulted in compensation expense of $173,000 in 2016 and $184,000 in 2015. For purchase periods beginning after January 1, 2017, the purchase price is 100% of the market price at the end of each six-month purchase period.
Stock Options Granted Under the 1999 Incentive Plan
The Company granted 2,041,500 options for the purchase of the Company’s common stock under the 1999 Stock Incentive Plan (1999 Incentive Plan). The exercise price of the options granted was the average market price of the Company’s common stock on the grant date. Under ASC 718 accounting requirements, compensation expense is recorded based on the estimated fair value of the options on their grant date using a fair-value option pricing model. Under ASC 718 accounting requirements, the fair value of the options granted has been recorded as compensation expense over the requisite service period (the vesting period of the options). The estimated fair value of all options granted under the 1999 Incentive Plan was based on the Black-Scholes option pricing model. There were no options outstanding as of December 31 of each of the years, 2017, 2016 or 2015.
Presented below is a summary of the stock options activity:
Stock Options Activity | 2017 | 2016 | 2015 | |||||||||||||||||||||
Options | Average Exercise Price | Options | Average Exercise Price | Options | Average Exercise Price | |||||||||||||||||||
Outstanding, Beginning of Year | -- | -- | 12,750 | $ | 24.93 | |||||||||||||||||||
Exercised | -- | -- | 10,250 | 24.93 | ||||||||||||||||||||
Forfeited or Expired | -- | -- | 2,500 | 24.93 | ||||||||||||||||||||
Outstanding, End of Year | -- | -- | -- | |||||||||||||||||||||
Exercisable, End of Year | -- | -- | -- | |||||||||||||||||||||
Cash Received for Options Exercised | $ | 256,000 | ||||||||||||||||||||||
Intrinsic Value of Options Exercised | $ | 75,000 | ||||||||||||||||||||||
Restricted Stock Granted to Directors
Under the 1999 Incentive Plan and the 2014 Incentive Plan, restricted shares of the Company’s common stock were granted to members of the Company’s board of directors as a form of compensation. All remaining restricted shares issued under the 1999 Incentive Plan vested on April 8, 2017. Under ASC 718 accounting requirements, compensation expense related to restricted shares is based on the fair value of the restricted shares on their grant dates. On April 10, 2017, 17,600 shares of restricted stock were granted to the Company’s nonemployee directors. The grant-date fair value of each share of restricted stock granted on April 10, 2017 was $37.75 per share, the average of the high and low market price on the date of grant. The restricted shares granted in 2017 vest 25% per year on April 8 of each year in the period 2018 through 2021 and are eligible for full dividend and voting rights. Restricted shares not vested and dividends on those restricted shares are subject to forfeiture under the terms of the restricted stock award agreement.
Presented below is a summary of the status of directors’ restricted stock awards for the years ended December 31:
Directors’ Restricted Stock Awards | 2017 | 2016 | 2015 | |||||||||||||||||||||
Shares | Weighted Average Grant-Date Fair Value | Shares | Weighted Average Grant-Date Fair Value | Shares | Weighted Average Grant-Date Fair Value | |||||||||||||||||||
Nonvested, Beginning of Year | 46,334 | $ | 29.71 | 38,217 | $ | 29.78 | 38,050 | $ | 27.47 | |||||||||||||||
Granted | 17,600 | 37.75 | 23,200 | 28.66 | 15,200 | 31.775 | ||||||||||||||||||
Vested | 17,134 | 29.93 | 15,083 | 28.28 | 15,033 | 25.96 | ||||||||||||||||||
Forfeited | -- | -- | -- | |||||||||||||||||||||
Nonvested, End of Year | 46,800 | 32.65 | 46,334 | 29.71 | 38,217 | 29.78 | ||||||||||||||||||
Compensation Expense Recognized | $ | 658,000 | $ | 491,000 | $ | 417,000 | ||||||||||||||||||
Fair Value of Shares Vested in Year | $ | 513,000 | $ | 427,000 | $ | 390,000 | ||||||||||||||||||
90
Restricted Stock Granted to Employees
Under the 1999 Incentive Plan and 2014 Incentive Plan, restricted shares of the Company’s common stock have been granted to employees as a form of compensation. All remaining restricted shares issued under the 1999 Incentive Plan vested on April 8, 2017. Under ASC 718 accounting requirements, compensation expense related to restricted shares is based on the fair value of the restricted shares on their grant dates. No shares of restricted stock have been granted to employees since 2014.
Presented below is a summary of the status of employees’ restricted stock awards for the years ended December 31:
Employees’ Restricted Stock Awards | 2017 | 2016 | 2015 | |||||||||||||||||||||
Shares | Weighted Average Grant-Date Fair Value | Shares | Weighted Average Grant-Date Fair Value | Shares | Weighted Average Grant-Date Fair Value | |||||||||||||||||||
Nonvested, Beginning of Year | 7,180 | $ | 29.72 | 13,581 | $ | 28.56 | 45,280 | $ | 27.46 | |||||||||||||||
Granted | -- | -- | -- | |||||||||||||||||||||
Vested | 4,285 | 29.94 | 6,401 | 27.25 | 31,699 | 27.09 | ||||||||||||||||||
Forfeited | -- | -- | -- | |||||||||||||||||||||
Nonvested, End of Year | 2,895 | 29.41 | 7,180 | 29.72 | 13,581 | 28.56 | ||||||||||||||||||
Compensation Expense Recognized | $ | 70,000 | $ | 96,000 | $ | 359,000 | ||||||||||||||||||
Fair Value of Awards Vested | $ | 128,000 | $ | 174,000 | $ | 859,000 | ||||||||||||||||||
Restricted Stock Units Granted to Executive Officers
On February 2, 2017, 15,900 restricted stock units under the 2014 Incentive Plan were granted to the Company’s executive officers. The grant-date fair value of each restricted stock unit was $37.65 per share, the average of the high and low market price on the date of grant. The restricted stock units granted to executive officers in 2017 vest 25% per year on February 6 of each year in the period 2018 through 2021 and are eligible to receive dividend equivalent payments on all unvested awards over the awards’ respective vesting periods, subject to forfeiture under the terms of the restricted stock unit award agreements. The vesting of restricted stock units is accelerated in the event of a change in control, disability, death or retirement, subject to proration on retirement in certain cases.
Presented below is a summary of the status of restricted stock unit awards granted to executive officers for the years ended December 31:
Executives’ Restricted Stock Unit Awards | 2017 | 2016 | 2015 | |||||||||||||||||||||
Shares | Weighted Average Grant-Date Fair Value | Shares | Weighted Average Grant-Date Fair Value | Shares | Weighted Average Grant-Date Fair Value | |||||||||||||||||||
Nonvested, Beginning of Year | 41,825 | $ | 30.23 | 24,300 | $ | 31.682 | -- | |||||||||||||||||
Granted | 15,900 | 37.65 | 22,000 | 28.915 | 29,100 | $ | 31.681 | |||||||||||||||||
Vested | 9,975 | 30.16 | 4,475 | 31.69 | 4,800 | 31.675 | ||||||||||||||||||
Forfeited | -- | -- | -- | |||||||||||||||||||||
Nonvested, End of Year | 47,750 | 32.71 | 41,825 | 30.23 | 24,300 | 31.682 | ||||||||||||||||||
Compensation Expense Recognized | $ | 576,000 | $ | 446,000 | $ | 452,000 | ||||||||||||||||||
Fair Value of Awards Vested | $ | 301,000 | $ | 142,000 | $ | 152,000 | ||||||||||||||||||
Restricted Stock Units Granted to Employees
In 2017 the following restricted stock unit awards under the 2014 Incentive Plan were granted to key employees of the Company who are not executive officers:
Grant Date | Units Granted | Grant-Date Fair Value per Award | |||||||
Restricted Stock Units Vesting 100% on April 8, 2021 | April 10, 2017 | 9,995 | $ | 32.78 | |||||
Restricted Stock Units Vesting 100% on April 8, 2021 | September 25, 2017 | 1,000 | $ | 38.29 | |||||
The grant-date fair value of each restricted stock unit was based on the average of the high and low market price of the Company’s common stock on the date of grant, discounted for the value of the dividend exclusion over the four-year vesting period. Under the terms of the restricted stock unit award agreements, all outstanding (unvested) restricted stock units held by a retiring grantee vest immediately on normal retirement.
91
Presented below is a summary of the status of employees’ restricted stock unit awards for the years ended December 31:
Employees’ Restricted Stock Unit Awards | 2017 | 2016 | 2015 | |||||||||||||||||||||
Restricted Stock Units | Weighted Average Grant-Date Fair Value | Restricted Stock Units | Weighted Average Grant-Date Fair Value | Restricted Stock Units | Weighted Average Grant-Date Fair Value | |||||||||||||||||||
Nonvested, Beginning of Year | 47,370 | $ | 25.19 | 46,600 | $ | 23.75 | 45,900 | $ | 21.82 | |||||||||||||||
Granted | 10,995 | 33.28 | 17,220 | 24.54 | 15,650 | 25.89 | ||||||||||||||||||
Vested | 11,550 | 25.30 | 12,250 | 19.03 | 12,250 | 19.46 | ||||||||||||||||||
Forfeited | 375 | 26.92 | 4,200 | 24.51 | 2,700 | 22.84 | ||||||||||||||||||
Nonvested, End of Year | 46,440 | 27.07 | 47,370 | 25.19 | 46,600 | 23.75 | ||||||||||||||||||
Compensation Expense Recognized | $ | 331,000 | $ | 307,000 | $ | 304,000 | ||||||||||||||||||
Fair Value of Awards Vested | $ | 292,000 | $ | 233,000 | $ | 238,000 | ||||||||||||||||||
Stock Performance Awards granted to Executive Officers
Agreements for stock performance awards have been granted under the 2014 Incentive Plan for the Company’s executive officers. Under these agreements, the officers could be awarded shares of the Company’s common stock based on the Company’s total shareholder return relative to that of its peer group of companies in the Edison Electric Institute (EEI) Index over a three-year period beginning on January 1 of the year the awards are granted. The awards also include a performance incentive based on the Company’s average 3-year adjusted return on equity (ROE) relative to a targeted average 3-year adjusted ROE. The number of shares earned, if any, will be awarded and issued at the end of each three-year performance measurement period. The participants have no voting or dividend rights under these award agreements until common shares, if any, are issued at the end of the performance measurement period.
On February 2, 2017 performance share awards were granted to the Company’s executive officers under the 2014 Incentive Plan for the 2017-2019 performance measurement period. Under the 2017 performance share award agreements the aggregate award for performance at target is 59,500 shares. For target performance the participants would earn an aggregate of 39,667 common shares based on the Company’s total shareholder return relative to the total shareholder return of the companies that comprise the EEI Index over the performance measurement period of January 1, 2017 through December 31, 2019, with the beginning and ending share values based on the average closing price of a share of the Company’s common stock for the 20 trading days immediately following January 1, 2017 and the average closing price for the 20 trading days immediately preceding January 1, 2020. The participants would also earn an aggregate of 19,833 common shares for achieving the target set for the Company’s 3-year average adjusted ROE. Actual payment may range from zero to 150% of the target amount, or up to 89,250 common shares. The grant-date fair value of each performance share award was determined using a Monte Carlo fair valuation simulation model resulting in a weighted average fair value of $30.25 per share, except for one grantee whose performance shares were fair valued at $36.27 per share due to retirement provisions in his award agreement.
Under the 2017 performance award agreements payment in the event of retirement, resignation for good reason or involuntary termination without cause is to be made at the end of the performance period based on actual performance, subject to proration in certain cases, except that the payment of performance awards granted to certain officers who are parties to executive employment agreements with the Company is to be made at target at the date of any such event. The vesting of these performance awards is accelerated and paid at target in the event of a change in control, disability or death and on retirement at or after age 62 for certain officers who are parties to executive employment agreements with the Company. The terms of these awards are such that the entire award will be classified and accounted for as equity, as required under ASC 718, and recognized over the grantee’s requisite service period based on the grant-date fair value of the award.
The table below provides a summary of stock performance awards granted and amounts expensed related to the stock performance awards:
Performance Period | Maximum Shares Subject To Award | Target Shares | Expense Recognized in the Year Ended December 31, | Earned Shares | |||||||||||||||||||||
2017 | 2016 | 2015 | |||||||||||||||||||||||
| 2017-2019 | 89,250 | 59,500 | $ | 854,000 | 7,500 | ||||||||||||||||||||
| 2016-2018 | 122,250 | 81,500 | 580,000 | $ | 798,000 | 11,100 | |||||||||||||||||||
| 2015-2017 | 126,450 | 84,300 | 573,000 | 535,000 | $ | 943,000 | 114,648 | ||||||||||||||||||
| 2014-2016 | 159,450 | 106,300 | -- | 332,000 | (64,000 | ) | 121,491 | ||||||||||||||||||
| 2013-2015 | 90,600 | 45,300 | -- | -- | (445,000 | ) | 22,500 | ||||||||||||||||||
Total | $ | 2,007,000 | $ | 1,665,000 | $ | 434,000 | 277,239 | ||||||||||||||||||
92
Stock-based payment expense recognized in 2017, 2016 and 2015 for the 2017-2019, 2016-2018 and 2015-2017 performance awards reflects the accelerated recognition of expense for outstanding and unvested awards of executives who are eligible for retirement and whose awards vest on normal retirement, as defined in the performance award agreements, prior to the vesting dates of the awards.
The earned shares shown in the table above for the 2016-2018 and 2017-2019 performance periods include vested shares to be issued in 2018 to a participant who retired on December 31, 2017 and had reached age 62 prior to retirement.
The earned shares shown in the table above for the 2015-2017 performance period include shares received in 2018 by participants in the plan based on the Company achieving a total shareholder return ranking of 2 out of 42 companies in the EEI Index and an average 3-year adjusted return on equity of 10.16% relative to a targeted average 3-year adjusted return on equity of 10.00% resulting payout at 136.00% of target.
The earned shares shown in the table above for the 2014-2016 performance period include shares received in 2017 by participants in the plan based on the Company achieving a total shareholder return ranking of 19 out of 43 companies in the EEI Index and a resulting payout at 114.29% of target. The earned shares also include shares for a portion of the award that vested on normal retirement of the Company’s former CEO on July 1, 2015 that were issued in 2016 following the 180 day deferral period required under the Internal Revenue Code at a value of $26.35 per share or $848,000.
The earned shares shown in the table above for the 2013-2015 performance period reflect shares that vested on normal retirement of the Company’s former CEO on July 1, 2015 that were issued in 2016 following the 180 day deferral period required under the Internal Revenue Code at a value of $26.35 per share or $593,000.
In connection with the resignation of an executive officer in May 2014, the following unvested stock performance awards were forfeited: 8,900 granted in 2014 and 4,900 granted in 2013.
As of December 31, 2017 the total remaining unrecognized amount of compensation expense related to stock-based compensation for all of the Company’s stock-based payment programs was approximately $4.0 million (before income taxes), which will be amortized over a weighted average period of 2.0 years.
7. Retained Earnings and Dividend Restriction
The Company is a holding company with no significant operations of its own. The primary source of funds for payments of dividends to the Company’s shareholders is from dividends paid or distributions made by the Company’s subsidiaries. As a result of certain statutory limitations or regulatory or financing agreements, restrictions could occur on the amount of distributions allowed to be made by the Company’s subsidiaries.
Both the Company and OTP credit agreements contain restrictions on the payment of cash dividends upon a default or event of default. An event of default would be considered to have occurred if the Company did not meet certain financial covenants. As of December 31, 2017 the Company was in compliance with these financial covenants. See note 9 to consolidated financial statements for further information on the covenants.
Under the Federal Power Act, a public utility may not pay dividends from any funds properly included in a capital account. What constitutes “funds properly included in a capital account” is undefined in the Federal Power Act or the related regulations; however, the FERC has consistently interpreted the provision to allow dividends to be paid as long as (1) the source of the dividends is clearly disclosed, (2) the dividend is not excessive and (3) there is no self-dealing on the part of corporate officials.
The MPUC indirectly limits the amount of dividends OTP can pay to the Company by requiring an equity-to-total-capitalization ratio between 47.4% and 58.0% based on OTP’s 2017 capital structure petition approved by order of the MPUC on September 1, 2017. As of December 31, 2017 OTP’s equity-to-total-capitalization ratio including short-term debt was 51.4% and its net assets restricted from distribution totaled approximately $471,000,000. Total capitalization for OTP cannot currently exceed $1,178,024,000.
93
8. Commitments and Contingencies of Continuing Operations
Construction and Other Purchase Commitments
At December 31, 2017 OTP had commitments under contracts, including its share of construction program commitments, extending into 2019, of approximately $41.0 million. At December 31, 2017 T.O. Plastics had commitments for the purchase of resin through December 31, 2021 of approximately $6.7 million.
Electric Utility Capacity and Energy Requirements and Coal Purchase and Delivery Contracts
OTP has commitments for the purchase of capacity and energy requirements under agreements extending into 2041. OTP has contracts providing for the purchase and delivery of a significant portion of its current coal requirements. OTP’s current coal purchase agreements for Big Stone Plant and Coyote Station expire at the end of 2019 and 2040, respectively. OTP has an agreement with Cloud Peak Energy Resources LLC for the purchase of subbituminous coal for Hoot Lake Plant through December 31, 2023. OTP has no fixed minimum purchase requirements under the agreement, but all of Hoot Lake Plant’s coal requirements for the period covered must be purchased under this agreement. The dollar amounts of OTP’s estimated purchase requirements under this agreement are excluded from the table below because OTP has not committed to any minimum level of purchases under the agreement. Fuel clause adjustment mechanisms lessen the risk of loss from market price changes because they currently provide for recovery of most fuel costs. See table below for schedule of commitments.
Operating Leases
OTP has obligations to make future operating lease payments primarily related to land leases and coal rail-car leases. The Company’s nonelectric companies have obligations to make future operating lease payments primarily related to leases of buildings and manufacturing equipment. Rent expense from continuing operations was $7,110,000, $7,565,000 and $6,447,000 for 2017, 2016 and 2015, respectively.
The amounts of the Company’s construction program and other commitments and commitments under capacity and energy agreements, coal and coal delivery contracts and operating leases for continuing operations as of December 31, 2017, are as follows:
| Construction Program | Capacity and Energy | Coal Purchase | Operating Leases | ||||||||||||||||||||
(in thousands) | and Other Commitments | Requirements | Commitments | OTP | Nonelectric | Total | ||||||||||||||||||
2018 | $ | 29,218 | $ | 24,424 | $ | 26,021 | $ | 1,838 | $ | 4,175 | $ | 6,013 | ||||||||||||
2019 | 15,159 | 24,925 | 23,016 | 1,435 | 4,183 | 5,618 | ||||||||||||||||||
2020 | 1,680 | 24,844 | 22,102 | 1,436 | 3,362 | 4,798 | ||||||||||||||||||
2021 | 1,680 | 12,988 | 22,537 | 1,241 | 1,434 | 2,675 | ||||||||||||||||||
2022 | -- | 11,827 | 22,300 | 761 | 1,439 | 2,200 | ||||||||||||||||||
Beyond 2022 | -- | 154,310 | 527,520 | 8,644 | 4,326 | 12,970 | ||||||||||||||||||
Total | $ | 47,737 | $ | 253,318 | $ | 643,496 | $ | 15,355 | $ | 18,919 | $ | 34,274 | ||||||||||||
Contingencies
OTP had a $2.7 million refund liability on its balance sheet as of December 31, 2016 representing its best estimate of the refund obligations that would arise, net of amounts that would be subject to recovery under state jurisdictional TCR riders, based on the likelihood of the FERC reducing the ROE component of the MISO Tariff and ordering MISO to refund amounts charged in excess of the lower rate. In the February and June 2017 MISO billings, MISO processed the refund of the FERC-ordered reduction in the MISO Tariff allowed ROE for the first 15-month refund period. The refund, in combination with a decision in the 2016 Minnesota general rate case that affected the Minnesota TCR rider, resulted in a reduction in OTP’s accrued MISO Tariff ROE refund liability from $2.7 million as of December 31, 2016 to $1.6 million as of December 31, 2017.
Together with as many as 200 utilities, generators and power marketers, OTP participated in proceedings before the FERC regarding the calculation, assessment and implementation of MISO Revenue Sufficiency Guarantee (RSG) charges for entities participating in the MISO wholesale energy market since that market’s start on April 1, 2005 until the conclusion of the proceedings on May 2, 2015. The proceedings fundamentally concerned MISO’s application of its MISO RSG rate on file with the FERC to market participants, revisions to the RSG rate based on several FERC orders, and the FERC’s decision to not resettle the markets based on MISO application of the RSG rate to market participants. Several of the FERC’s orders are on review in a set of consolidated cases before the D.C. Circuit. The consolidated petitions at the D.C. Circuit involve multiple petitioners and intervenors. OTP is an intervenor in these cases. Final briefs were filed on January 26, 2018. Oral arguments will occur in the spring of 2018. A final decision is not expected until late in 2018. MISO has not made available past billing or resettlement data necessary for determining amounts that might be payable if the FERC’s decisions are reversed. Therefore, the Company cannot estimate OTP’s exposure at this time from a final order reversing the relevant FERC orders, which could have an adverse effect on the Company’s results of operations.
94
Contingencies, by their nature, relate to uncertainties that require the Company’s management to exercise judgment both in assessing the likelihood a liability has been incurred as well as in estimating the amount of potential loss. The most significant contingencies impacting the Company’s consolidated financial statements are those related to environmental remediation, risks associated with indemnification obligations under divestitures of discontinued operations and litigation matters. Should all of these known items result in liabilities being incurred, the loss could be as high as $1.0 million, excluding any liability for RSG charges for which an estimate cannot be made at this time.
In 2014 the Environmental Protection Agency (EPA) published both proposed standards of performance for carbon dioxide (CO2) emissions from new, reconstructed and modified fossil fuel-fired power plants (New Source Performance Standards), and proposed CO2 emission guidelines for existing fossil fuel-fired power plants (the Clean Power Plan) under section 111 of the Clean Air Act. The EPA published final rules for each of these proposals on October 23, 2015. Both rules were challenged on legal grounds. On February 9, 2016 the U.S. Supreme Court granted a stay of the Clean Power Plan, pending disposition of petitions for review in the D.C. Circuit. The D.C. Circuit heard oral argument on challenges to the Clean Power Plan on September 27, 2016 before the full court, and a decision was expected in the first half of 2017. However, pursuant to Executive Order 13783, Promoting Energy Independence and Economic Growth, the EPA was directed to consider suspending, revising or rescinding the CO2 rules discussed above. Thereafter, the EPA issued notices in the Federal Register of its intent to review these rules pursuant to the Executive Order, and it filed motions to stay the pending litigation. The D.C. Circuit subsequently issued orders holding in abeyance the appeals of both the New Source Performance Standards and the Clean Power Plan, pending EPA review. On October 16, 2017 the EPA published a proposed rule to rescind the Clean Power Plan. Therefore, there is uncertainty regarding the future of both rules.
Other
The Company is a party to litigation and regulatory enforcement matters arising in the normal course of business. The Company regularly analyzes current information and, as necessary, provides accruals for liabilities that are probable of occurring and that can be reasonably estimated. The Company believes the effect on its consolidated results of operations, financial position and cash flows, if any, for the disposition of all matters pending as of December 31, 2017 will not be material.
9. Short-Term and Long-Term Borrowings
Short-Term Debt
The following table presents the status of the Company’s lines of credit as of December 31, 2017 and December 31, 2016:
(in thousands) | Line Limit | In Use on December 31, 2017 | Restricted due to Outstanding Letters of Credit | Available on December 31, 2017 | Available on December 31, 2016 | |||||||||||||||
Otter Tail Corporation Credit Agreement | $ | 130,000 | $ | -- | $ | -- | $ | 130,000 | $ | 130,000 | ||||||||||
OTP Credit Agreement | 170,000 | 112,371 | 300 | 57,329 | 127,067 | |||||||||||||||
Total | $ | 300,000 | $ | 112,371 | $ | 300 | $ | 187,329 | $ | 257,067 | ||||||||||
Under the Otter Tail Corporation Credit Agreement (as defined below), the maximum amount of debt outstanding in 2017 was $15,169,000 on April 3, 2017 and the average daily balance of debt outstanding during 2017 was $2,305,000. The weighted average interest rate paid on debt outstanding under the Otter Tail Corporation Credit Agreement during 2017 was 2.8% compared with 2.3% in 2016. Under the OTP Credit Agreement (as defined below), the maximum amount of debt outstanding in 2017 was $112,371,000 on December 29, 2017 and the average daily balance of debt outstanding during 2017 was $69,391,000. The weighted average interest rate paid on debt outstanding under the OTP Credit Agreement during 2017 was 2.4% compared with 1.8% in 2016. The maximum amount of consolidated short-term debt outstanding in 2017 was $112,371,000 on December 29, 2017 and the average daily balance of consolidated short-term debt outstanding during 2017 was $71,696,000. The weighted average interest rate on consolidated short-term debt outstanding on December 31, 2017 was 2.7%.
On October 29, 2012 the Company entered into a Third Amended and Restated Credit Agreement (the Otter Tail Corporation Credit Agreement), which is an unsecured $130 million revolving credit facility that may be increased to $250 million on the terms and subject to the conditions described in the Otter Tail Corporation Credit Agreement. On October 31, 2017 the Otter Tail Corporation Credit Agreement was amended to extend its expiration date by one year from October 29, 2021 to October 31, 2022. The Company can draw on this credit facility to refinance certain indebtedness and support its operations and the operations of its subsidiaries. Borrowings under the Otter Tail Corporation Credit Agreement bear interest at LIBOR plus 1.50%, subject to adjustment based on the Company’s senior unsecured credit ratings or the issuer rating if a rating is not provided for the senior unsecured credit. The Company is required to pay commitment fees based on the average daily unused amount available to be drawn under the revolving credit facility. The Otter Tail Corporation Credit Agreement
95
contains a number of restrictions on the Company and the businesses of its wholly owned subsidiary, Varistar and its subsidiaries, including restrictions on the Company’s and Varistar��s ability to merge, sell assets, make investments, create or incur liens on assets, guarantee the obligations of certain other parties and engage in transactions with related parties. The Otter Tail Corporation Credit Agreement also contains affirmative covenants and events of default, and financial covenants as described below under the heading “Financial Covenants.” The Otter Tail Corporation Credit Agreement does not include provisions for the termination of the agreement or the acceleration of repayment of amounts outstanding due to changes in the Company’s credit ratings. The Company’s obligations under the Otter Tail Corporation Credit Agreement are guaranteed by certain of the Company’s subsidiaries. Outstanding letters of credit issued by the Company under the Otter Tail Corporation Credit Agreement can reduce the amount available for borrowing under the line by up to $40 million.
On October 29, 2012 OTP entered into a Second Amended and Restated Credit Agreement (the OTP Credit Agreement), providing for an unsecured $170 million revolving credit facility that may be increased to $250 million on the terms and subject to the conditions described in the OTP Credit Agreement. On October 31, 2017 the OTP Credit Agreement was amended to extend its expiration date by one year from October 29, 2021 to October 31, 2022. OTP can draw on this credit facility to support the working capital needs and other capital requirements of its operations, including letters of credit in an aggregate amount not to exceed $50 million outstanding at any time. Borrowings under this line of credit bear interest at LIBOR plus 1.25%, subject to adjustment based on the ratings of OTP’s senior unsecured debt or the issuer rating if a rating is not provided for the senior unsecured debt. OTP is required to pay commitment fees based on the average daily unused amount available to be drawn under the revolving credit facility. The OTP Credit Agreement contains a number of restrictions on the business of OTP, including restrictions on its ability to merge, sell assets, make investments, create or incur liens on assets, guarantee the obligations of any other party, and engage in transactions with related parties. The OTP Credit Agreement also contains affirmative covenants and events of default, and financial covenants as described below under the heading “Financial Covenants.” The OTP Credit Agreement does not include provisions for the termination of the agreement or the acceleration of repayment of amounts outstanding due to changes in OTP’s credit ratings. OTP’s obligations under the OTP Credit Agreement are not guaranteed by any other party.
Long-Term Debt Issuances and Retirements
2018 Note Purchase Agreement
On November 14, 2017, OTP entered into a Note Purchase Agreement (the 2018 Note Purchase Agreement) with the purchasers named therein, pursuant to which OTP agreed to issue to the purchasers, in a private placement transaction, $100 million aggregate principal amount of OTP’s 4.07% Series 2018A Senior Unsecured Notes due February 7, 2048 (the 2018 Notes). The 2018 Notes were issued on February 7, 2018. Proceeds from the 2018 Notes were used to repay $100 million in outstanding borrowings under the OTP Credit Agreement.
OTP may prepay all or any part of the Notes (in an amount not less than 10% of the aggregate principal amount of the Notes then outstanding in the case of a partial prepayment) at 100% of the principal amount so prepaid, together with unpaid accrued interest and a make-whole amount; provided that if no default or event of default exists under the Note Purchase Agreement, any prepayment made by OTP of all of the Notes then outstanding on or after August 7, 2047 will be made without any make-whole amount. The 2018 Note Purchase Agreement also requires OTP to offer to prepay all outstanding Notes at 100% of the principal amount together with unpaid accrued interest in the event of a Change of Control (as defined in the 2018 Note Purchase Agreement) of OTP.
The 2018 Note Purchase Agreement contains a number of restrictions on the business of OTP. These include restrictions on OTP’s abilities to merge, sell assets, create or incur liens on assets, guarantee the obligations of any other party, and engage in transactions with related parties. The 2018 Note Purchase Agreement also contains other negative covenants and events of default, as well as certain financial covenants as described below under the heading “Financial Covenants.” The 2018 Note Purchase Agreement does not include provisions for the termination of the agreement or the acceleration of repayment of amounts outstanding due to changes in OTP’s credit ratings. The 2018 Note Purchase Agreement includes a “most favored lender” provision generally requiring that in the event the OTP Credit Agreement or any renewal, extension or replacement thereof, at any time contains any financial covenant or other provision providing for limitations on interest expense and such a covenant is not contained in the 2018 Note Purchase Agreement under substantially similar terms or would be more beneficial to the holders of the 2018 Notes than any analogous provision contained in the 2018 Note Purchase Agreement (Additional Covenant), then unless waived by the Required Holders (as defined in the 2018 Note Purchase Agreement), the Additional Covenant will be deemed to be incorporated into the 2018 Note Purchase Agreement. The 2018 Note Purchase Agreement also provides for the amendment, modification or deletion of an Additional Covenant if such Additional Covenant is amended or modified under or deleted from the OTP Credit Agreement, provided that no default or event of default has occurred and is continuing.
96
2016 Note Purchase Agreement
On September 23, 2016 the Company entered into a Note Purchase Agreement (the 2016 Note Purchase Agreement) with the purchasers named therein, pursuant to which the Company agreed to issue to the purchasers, in a private placement transaction, $80 million aggregate principal amount of its 3.55% Guaranteed Senior Notes due December 15, 2026 (the 2026 Notes). The 2026 Notes were issued on December 13, 2016. The Company’s obligations under the 2016 Note Purchase Agreement and the 2026 Notes are guaranteed by its Material Subsidiaries (as defined in the 2016 Note Purchase Agreement, but specifically excluding OTP). The proceeds from the issuance of the 2026 Notes were used to repay the remaining $52,330,000 of the Company’s 9.000% Senior Notes due December 15, 2016, and to pay down a portion of the $50 million in funds borrowed in February 2016 under the Company’s term loan agreement.
The Company may prepay all or any part of the 2026 Notes (in an amount not less than 10% of the aggregate principal amount of the 2026 Notes then outstanding in the case of a partial prepayment) at 100% of the principal amount prepaid, together with unpaid accrued interest and a make-whole amount; provided that if no default or event of default exists under the 2016 Note Purchase Agreement, any optional prepayment made by the Company of all of the 2026 Notes on or after September 15, 2026 will be made without any make-whole amount. The Company is required to offer to prepay all of the outstanding 2026 Notes at 100% of the principal amount together with unpaid accrued interest in the event of a Change of Control (as defined in the 2016 Note Purchase Agreement) of the Company. In addition, if the Company and its Material Subsidiaries sell a “substantial part” of its or their assets and use the proceeds to prepay or retire senior Interest-bearing Debt (as defined in the 2016 Note Purchase Agreement) of the Company and/or a Material Subsidiary in accordance with the terms of the 2016 Note Purchase Agreement, the Company is required to offer to prepay a Ratable Portion (as defined in the 2016 Note Purchase Agreement) of the 2026 Notes held by each holder of the 2026 Notes.
The 2016 Note Purchase Agreement contains a number of restrictions on the business of the Company and the Material Subsidiaries that became effective on execution of the 2016 Note Purchase Agreement. These include restrictions on the Company’s and the Material Subsidiaries’ abilities to merge, sell assets, create or incur liens on assets, guarantee the obligations of any other party, engage in transactions with related parties, redeem or pay dividends on the Company’s and the Material Subsidiaries’ shares of capital stock, and make investments. The 2016 Note Purchase Agreement also contains other negative covenants and events of default, as well as certain financial covenants as described below under the heading “Financial Covenants.” The 2016 Note Purchase Agreement does not include provisions for the termination of the agreement or the acceleration of repayment of amounts outstanding due to changes in the Company’s or the Material Subsidiaries’ credit ratings.
Term Loan Agreement
On February 5, 2016 the Company borrowed $50 million under an unsecured Term Loan Agreement (the Term Loan Agreement) at an interest rate based on the 30 day LIBOR plus 90 basis points. The proceeds from the Term Loan Agreement were used to pay down borrowings under the Otter Tail Corporation Credit Agreement that were used to fund the expansion of BTD’s Minnesota facilities in 2015 and to fund the September 1, 2015 acquisition of BTD-Georgia. The Company repaid $35 million of the $50 million in the fourth quarter of 2016 and repaid the remaining $15 million during 2017. The Term Loan Agreement terminated on February 5, 2018.
2013 Note Purchase Agreement
On August 14, 2013 OTP entered into a Note Purchase Agreement (the 2013 Note Purchase Agreement) with the purchasers named therein pursuant to which OTP agreed to issue to the purchasers, in a private placement transaction, $60 million aggregate principal amount of OTP’s 4.68% Series A Senior Unsecured Notes due February 27, 2029 (the Series A Notes) and $90 million aggregate principal amount of OTP’s 5.47% Series B Senior Unsecured Notes due February 27, 2044 (the Series B Notes and, together with the Series A Notes, the Notes). The Notes were issued on February 27, 2014.
The 2013 Note Purchase Agreement states that OTP may prepay all or any part of the Notes (in an amount not less than 10% of the aggregate principal amount of the Notes then outstanding in the case of a partial prepayment) at 100% of the principal amount prepaid, together with accrued interest and a make-whole amount, provided that if no default or event of default under the 2013 Note Purchase Agreement exists, any optional prepayment made by OTP of (i) all of the Series A Notes then outstanding on or after November 27, 2028 or (ii) all of the Series B Notes then outstanding on or after November 27, 2043, will be made at 100% of the principal prepaid but without any make-whole amount. In addition, the 2013 Note Purchase Agreement states OTP must offer to prepay all of the outstanding Notes at 100% of the principal amount together with unpaid accrued interest in the event of a Change of Control (as defined in the 2013 Note Purchase Agreement) of OTP.
97
The 2013 Note Purchase Agreement contains a number of restrictions on the business of OTP, including restrictions on OTP’s ability to merge, sell assets, create or incur liens on assets, guarantee the obligations of any other party, and engage in transactions with related parties. The 2013 Note Purchase Agreement also contains affirmative covenants and events of default, as well as certain financial covenants as described below under the heading “Financial Covenants.” The 2013 Note Purchase Agreement does not include provisions for the termination of the agreement or the acceleration of repayment of amounts outstanding due to changes in OTP’s credit ratings. The 2013 Note Purchase Agreement includes a “most favored lender” provision generally requiring that in the event the OTP Credit Agreement or any renewal, extension or replacement thereof, at any time contains any financial covenant or other provision providing for limitations on interest expense and such a covenant is not contained in the 2013 Note Purchase Agreement under substantially similar terms or would be more beneficial to the holders of the Notes than any analogous provision contained in the 2013 Note Purchase Agreement (Additional Covenant), then unless waived by the Required Holders (as defined in the 2013 Note Purchase Agreement), the Additional Covenant will be deemed to be incorporated into the 2013 Note Purchase Agreement. The 2013 Note Purchase Agreement also provides for the amendment, modification or deletion of an Additional Covenant if such Additional Covenant is amended or modified under or deleted from the OTP Credit Agreement, provided that no default or event of default has occurred and is continuing.
2007 and 2011 Note Purchase Agreements
On December 1, 2011, OTP issued $140 million aggregate principal amount of its 4.63% Senior Unsecured Notes due December 1, 2021 pursuant to a Note Purchase Agreement dated as of July 29, 2011 (the 2011 Note Purchase Agreement). OTP also has outstanding its $122 million senior unsecured notes issued in three series consisting of $30 million aggregate principal amount of 6.15% Senior Unsecured Notes, Series B, due 2022; $42 million aggregate principal amount of 6.37% Senior Unsecured Notes, Series C, due 2027; and $50 million aggregate principal amount of 6.47% Senior Unsecured Notes, Series D, due 2037 (collectively, the 2007 Notes). The 2007 Notes were issued pursuant to a Note Purchase Agreement dated as of August 20, 2007 (the 2007 Note Purchase Agreement). On August 21, 2017 OTP used borrowings under the OTP Credit Agreement to retire the $33 million 5.95%, Series A Senior Unsecured Notes, which had been issued under the 2007 Note Purchase Agreement and matured on August 20, 2017.
The 2011 Note Purchase Agreement and the 2007 Note Purchase Agreement each states that OTP may prepay all or any part of the notes issued thereunder (in an amount not less than 10% of the aggregate principal amount of the notes then outstanding in the case of a partial prepayment) at 100% of the principal amount prepaid, together with accrued interest and a make-whole amount. The 2011 Note Purchase Agreement states in the event of a transfer of utility assets put event, the noteholders thereunder have the right to require OTP to repurchase the notes held by them in full, together with accrued interest and a make-whole amount, on the terms and conditions specified in the 2011 Note Purchase Agreement. The 2011 Note Purchase Agreement and the 2007 Note Purchase Agreement each also states that OTP must offer to prepay all of the outstanding notes issued thereunder at 100% of the principal amount together with unpaid accrued interest in the event of a change of control of OTP. The note purchase agreements contain a number of restrictions on OTP, including restrictions on OTP’s ability to merge, sell assets, create or incur liens on assets, guarantee the obligations of any other party, and engage in transactions with related parties. The note purchase agreements also include affirmative covenants and events of default, and certain financial covenants as described below under the heading “Financial Covenants.”
Shelf Registration
On May 11, 2015 the Company filed a shelf registration statement with the SEC under which the Company may offer for sale, from time to time, either separately or together in any combination, equity, debt or other securities described in the shelf registration statement, which expires on May 11, 2018.
98
The following tables provide a breakdown of the assignment of the Company’s consolidated short-term and long-term debt outstanding as of December 31, 2017 and December 31, 2016:
December 31, 2017 (in thousands) | OTP | Otter Tail Corporation | Otter Tail Corporation Consolidated | |||||||||
Short-Term Debt | $ | 112,371 | $ | -- | $ | 112,371 | ||||||
Long-Term Debt: | ||||||||||||
Term Loan, LIBOR plus 0.90%, due February 5, 2018 | $ | -- | $ | -- | ||||||||
3.55% Guaranteed Senior Notes, due December 15, 2026 | 80,000 | 80,000 | ||||||||||
Senior Unsecured Notes 4.63%, due December 1, 2021 | $ | 140,000 | 140,000 | |||||||||
Senior Unsecured Notes 6.15%, Series B, due August 20, 2022 | 30,000 | 30,000 | ||||||||||
Senior Unsecured Notes 6.37%, Series C, due August 20, 2027 | 42,000 | 42,000 | ||||||||||
Senior Unsecured Notes 4.68%, Series A, due February 27, 2029 | 60,000 | 60,000 | ||||||||||
Senior Unsecured Notes 6.47%, Series D, due August 20, 2037 | 50,000 | 50,000 | ||||||||||
Senior Unsecured Notes 5.47%, Series B, due February 27, 2044 | 90,000 | 90,000 | ||||||||||
North Dakota Development Note, 3.95%, due April 1, 2018 | 27 | 27 | ||||||||||
PACE Note, 2.54%, due March 18, 2021 | 684 | 684 | ||||||||||
Total | $ | 412,000 | $ | 80,711 | $ | 492,711 | ||||||
Less: Current Maturities net of Unamortized Debt Issuance Costs | -- | 186 | 186 | |||||||||
Unamortized Long-Term Debt Issuance Costs | 1,684 | 461 | 2,145 | |||||||||
Total Long-Term Debt net of Unamortized Debt Issuance Costs | $ | 410,316 | $ | 80,064 | $ | 490,380 | ||||||
Total Short-Term and Long-Term Debt (with current maturities) | $ | 522,687 | $ | 80,250 | $ | 602,937 | ||||||
December 31, 2016 (in thousands) | OTP | Otter Tail Corporation | Otter Tail Corporation Consolidated | |||||||||
Short-Term Debt | $ | 42,883 | $ | -- | $ | 42,883 | ||||||
Long-Term Debt: | ||||||||||||
Term Loan, LIBOR plus 0.90%, due February 5, 2018 | $ | 15,000 | $ | 15,000 | ||||||||
3.55% Guaranteed Senior Notes, due December 15, 2026 | 80,000 | 80,000 | ||||||||||
Senior Unsecured Notes 5.95%, Series A, due August 20, 2017 | $ | 33,000 | 33,000 | |||||||||
Senior Unsecured Notes 4.63%, due December 1, 2021 | 140,000 | 140,000 | ||||||||||
Senior Unsecured Notes 6.15%, Series B, due August 20, 2022 | 30,000 | 30,000 | ||||||||||
Senior Unsecured Notes 6.37%, Series C, due August 20, 2027 | 42,000 | 42,000 | ||||||||||
Senior Unsecured Notes 4.68%, Series A, due February 27, 2029 | 60,000 | 60,000 | ||||||||||
Senior Unsecured Notes 6.47%, Series D, due August 20, 2037 | 50,000 | 50,000 | ||||||||||
Senior Unsecured Notes 5.47%, Series B, due February 27, 2044 | 90,000 | 90,000 | ||||||||||
North Dakota Development Note, 3.95%, due April 1, 2018 | 106 | 106 | ||||||||||
PACE Note, 2.54%, due March 18, 2021 | 836 | 836 | ||||||||||
Total | $ | 445,000 | $ | 95,942 | $ | 540,942 | ||||||
Less: Current Maturities net of Unamortized Debt Issuance Costs | 32,970 | 231 | 33,201 | |||||||||
Unamortized Long-Term Debt Issuance Costs | 1,861 | 539 | 2,400 | |||||||||
Total Long-Term Debt net of Unamortized Debt Issuance Costs | $ | 410,169 | $ | 95,172 | $ | 505,341 | ||||||
Total Short-Term and Long-Term Debt (with current maturities) | $ | 486,022 | $ | 95,403 | $ | 581,425 | ||||||
The aggregate amounts of maturities on bonds outstanding and other long-term obligations at December 31, 2017 for each of the next five years are:
(in thousands) | 2018 | 2019 | 2020 | 2021 | 2022 | |||||||||||||||
Aggregate Amounts of Debt Maturities | $ | 186 | $ | 172 | $ | 185 | $ | 140,167 | $ | 30,000 | ||||||||||
Financial Covenants
The Company and OTP were in compliance with the financial covenants in these debt agreements as of December 31, 2017.
No Credit or Note Purchase Agreement contains any provisions that would trigger an acceleration of the related debt as a result of changes in the credit rating levels assigned to the related obligor by rating agencies.
99
The Company’s and OTP’s borrowing agreements are subject to certain financial covenants. Specifically:
● | Under the Otter Tail Corporation Credit Agreement and the 2016 Note Purchase Agreement, the Company may not permit the ratio of its Interest-bearing Debt to Total Capitalization to be greater than 0.60 to 1.00 or permit its Interest and Dividend Coverage Ratio to be less than 1.50 to 1.00 (each measured on a consolidated basis) as provided in the agreements. |
● | Under the 2016 Note Purchase Agreement, the Company may not permit its Priority Indebtedness to exceed 10% of its Total Capitalization. The Company had no Priority Indebtedness outstanding as of December 31, 2017. |
● | Under the OTP Credit Agreement, OTP may not permit the ratio of its Interest-bearing Debt to Total Capitalization to be greater than 0.60 to 1.00. |
● | Under the 2007 Note Purchase Agreement and the 2011 Note Purchase Agreement, OTP may not permit the ratio of its Consolidated Debt to Total Capitalization to be greater than 0.60 to 1.00 or permit its Interest and Dividend Coverage Ratio to be less than 1.50 to 1.00, in each case as provided in the related borrowing agreement, and OTP may not permit its Priority Debt to exceed 20% of its Total Capitalization, as provided in the related agreement. |
● | Under the 2013 Note Purchase Agreement and the 2018 Note Purchase Agreement, OTP may not permit its Interest-bearing Debt to exceed 60% of Total Capitalization and may not permit its Priority Indebtedness to exceed 20% of its Total Capitalization, in each case as provided in the related agreement. OTP had no Priority Indebtedness outstanding as of December 31, 2017. |
10. Pension Plan and Other Postretirement Benefits
Pension Plan
The Company's noncontributory funded pension plan covers substantially all corporate employees and OTP nonunion employees hired prior to September 1, 2006, and all union employees of OTP hired prior to November 1, 2013, excluding Coyote Station employees. Coyote Station employees hired before January 1, 2009 are covered under the plan. The plan provides 100% vesting after five vesting years of service and for retirement compensation at age 65, with reduced compensation in cases of retirement prior to age 62. The Company reserves the right to discontinue the plan but no change or discontinuance may affect the pensions theretofore vested.
The pension plan has a trustee who is responsible for pension payments to retirees and a separate pension fund manager responsible for managing the plan's assets. An independent actuary assists the Company in performing the necessary actuarial valuations for the plan.
The plan assets consist of common stock and bonds of public companies, U.S. government securities, cash and cash equivalents and alternative investments. None of the plan assets are invested in common stock or debt securities of the Company.
The following table lists components of net periodic pension benefit cost for the year ended December 31:
(in thousands) | 2017 | 2016 | 2015 | |||||||||
Service Cost–Benefit Earned During the Period | $ | 5,629 | $ | 5,518 | $ | 6,059 | ||||||
Interest Cost on Projected Benefit Obligation | 14,139 | 14,195 | 13,344 | |||||||||
Expected Return on Assets | (19,229 | ) | (19,454 | ) | (18,383 | ) | ||||||
Amortization of Prior Service Cost: | ||||||||||||
From Regulatory Asset | 120 | 189 | 188 | |||||||||
From Other Comprehensive Income1 | 3 | 5 | 5 | |||||||||
Amortization of Net Actuarial Loss: | ||||||||||||
From Regulatory Asset | 5,090 | 5,153 | 6,676 | |||||||||
From Other Comprehensive Income1 | 125 | 127 | 171 | |||||||||
Net Periodic Pension Cost2 | $ | 5,877 | $ | 5,733 | $ | 8,060 | ||||||
1Corporate cost included in Other Nonelectric Expenses. | ||||||||||||
2Allocation of Costs: | 2017 | 2016 | 2015 | |||||||||
Costs included in OTP Capital Expenditures | $ | 1,142 | $ | 1,048 | $ | 1,453 | ||||||
Costs included in Electric Operation and Maintenance Expenses | 4,594 | 4,547 | 6,406 | |||||||||
Costs included in Other Nonelectric Expenses | 141 | 138 | 201 | |||||||||
100
Weighted average assumptions used to determine net periodic pension cost for the year ended December 31:
2017 | 2016 | 2015 | ||||||||||
Discount Rate | 4.60 | % | 4.76 | % | 4.35 | % | ||||||
Long-Term Rate of Return on Plan Assets | 7.50 | % | 7.75 | % | 7.75 | % | ||||||
Rate of Increase in Future Compensation Level | 3.00 | % | 3.13 | % | 3.13 | % | ||||||
The following table presents amounts recognized in the consolidated balance sheets as of December 31:
(in thousands) | 2017 | 2016 | ||||||
Regulatory Assets: | ||||||||
Unrecognized Prior Service Cost | $ | 21 | $ | 141 | ||||
Unrecognized Actuarial Loss | 99,360 | 98,039 | ||||||
Total Regulatory Assets | $ | 99,381 | $ | 98,180 | ||||
Accumulated Other Comprehensive Loss: | ||||||||
Unrecognized Prior Service Cost | $ | 9 | $ | 12 | ||||
Unrecognized Actuarial Loss | 439 | 406 | ||||||
Total Accumulated Other Comprehensive Loss | $ | 448 | $ | 418 | ||||
Noncurrent Liability | $ | 67,399 | $ | 60,292 | ||||
Funded status as of December 31:
(in thousands) | 2017 | 2016 | ||||||
Accumulated Benefit Obligation | $ | (316,095 | ) | $ | (281,414 | ) | ||
Projected Benefit Obligation | $ | (352,718 | ) | $ | (314,637 | ) | ||
Fair Value of Plan Assets | 285,319 | 254,345 | ||||||
Funded Status | $ | (67,399 | ) | $ | (60,292 | ) | ||
The following tables provide a reconciliation of the changes in the fair value of plan assets and the plan’s benefit obligations over the two-year period ended December 31, 2017:
(in thousands) | 2017 | 2016 | ||||||
Reconciliation of Fair Value of Plan Assets: | ||||||||
Fair Value of Plan Assets at January 1 | $ | 254,346 | $ | 233,639 | ||||
Actual Return on Plan Assets | 44,181 | 23,794 | ||||||
Discretionary Company Contributions | -- | 10,000 | ||||||
Benefit Payments | (13,208 | ) | (13,088 | ) | ||||
Fair Value of Plan Assets at December 31 | $ | 285,319 | $ | 254,345 | ||||
Estimated Asset Return | 17.8 | % | 10.1 | % | ||||
Reconciliation of Projected Benefit Obligation: | ||||||||
Projected Benefit Obligation at January 1 | $ | 314,637 | $ | 302,740 | ||||
Service Cost | 5,629 | 5,518 | ||||||
Interest Cost | 14,139 | 14,195 | ||||||
Benefit Payments | (13,208 | ) | (13,088 | ) | ||||
Actuarial Loss | 31,521 | 5,272 | ||||||
Projected Benefit Obligation at December 31 | $ | 352,718 | $ | 314,637 | ||||
Weighted average assumptions used to determine benefit obligations at December 31:
2017 | 2016 | |||||||
Discount Rate | 3.90 | % | 4.60 | % | ||||
Rate of Increase in Future Compensation Level: | ||||||||
All participants – prior to 2017 | 3.00 | % | ||||||
Participants to Age 39 | 4.50 | % | ||||||
Participants Age 40 to Age 49 | 3.50 | % | ||||||
Participants Age 50 and Older | 2.75 | % | ||||||
101
The assumed rate of return on pension fund assets used for the determination of 2018 net periodic pension cost is 7.50%. The assumed long-term rate of return on plan assets is based primarily on asset category studies using historical market return and volatility data with forward looking estimates based on existing financial market conditions and forecasts of capital markets. Modest excess return expectations versus some market indices are incorporated into the return projections based on the actively managed structure of the investment programs and their records of achieving such returns historically. The Company reviews its rate of return on plan asset assumptions annually. The assumptions are largely based on the asset category rate-of-return assumptions developed annually with the Company’s pension plan investment advisors, as well as input from actuaries who work with the pension plan and benchmarking to peer companies with similar asset allocation strategies.
Market-related value of plan assets—The Company’s expected return on plan assets is determined based on the expected long-term rate of return on plan assets and the market-related value of plan assets.
The Company bases actuarial determination of pension plan expense or income on a market-related valuation of assets, which reduces year-to-year volatility. This market-related valuation calculation recognizes investment gains or losses over a five-year period from the year in which they occur. Investment gains or losses for this purpose are the difference between the expected return calculated using the market-related value of assets and the actual return based on the fair value of assets. Since the market-related valuation calculation recognizes gains or losses over a five-year period, the future value of the market-related assets will be impacted as previously deferred gains or losses are recognized.
Measurement Dates: | 2017 | 2016 |
Net Periodic Pension Cost | January 1, 2017 | January 1, 2016 |
End of Year Benefit Obligations | January 1, 2017 projected to December 31, 2017 | January 1, 2016 projected to December 31, 2016 |
Market Value of Assets | December 31, 2017 | December 31, 2016 |
The estimated amounts of unrecognized net actuarial losses and prior service costs to be amortized from regulatory assets and accumulated other comprehensive loss into the net periodic pension cost in 2018 are:
(in thousands) | 2018 | |||
Decrease in Regulatory Assets: | ||||
Amortization of Unrecognized Prior Service Cost | $ | 16 | ||
Amortization of Unrecognized Actuarial Loss | 7,142 | |||
Decrease in Accumulated Other Comprehensive Loss: | ||||
Amortization of Unrecognized Prior Service Cost | -- | |||
Amortization of Unrecognized Actuarial Loss | 176 | |||
Total Estimated Amortization | $ | 7,334 | ||
Cash flows—The Company had no minimum funding requirement as of December 31, 2017 but made discretionary plan contributions of $20 million as of February 2018.
The following benefit payments, which reflect expected future service, as appropriate, are expected to be paid out from plan assets:
(in thousands) | 2018 | 2019 | 2020 | 2021 | 2022 | Years 2023-2027 | ||||||||||||||||||
| $ | 14,384 | $ | 15,022 | $ | 15,666 | $ | 16,336 | $ | 17,041 | $ | 93,882 | |||||||||||||
The following objectives guide the investment strategy of the Company’s pension plan (the Plan):
● | The assets of the Plan will be invested in accordance with all applicable laws in a manner consistent with fiduciary standards including Employee Retirement Income Security Act standards (if applicable). Specifically: |
o | The safeguards and diversity that a prudent investor would adhere to must be present in the investment program. |
o | All transactions undertaken on behalf of the Plan must be in the best interest of plan participants and their beneficiaries. |
● | The primary objective of the Plan is to provide a source of retirement income for its participants and beneficiaries. |
● | The near-term primary financial objective of the Plan is to improve the funded status of the Plan. |
● | A secondary financial objective is to minimize pension funding and expense volatility where possible. |
102
The asset allocation strategy developed by the Company’s Retirement Plans Administration Committee (the Committee) is based on the current needs of the Plan and the objectives listed above. An asset/liability review is conducted annually or as often as necessary to assess the impact of various asset allocations on funded status and other financial variables. The current needs of the Plan, the overall investment objectives above, the investment preferences and risk tolerance of the Committee and the desired degree of diversification suggest the need for an investment allocation including multiple asset classes.
The asset allocation in the table below contains guideline percentages, at market value, of the total Plan invested in various asset classes. The Permitted Range is a guide and will at times not reflect the actual asset allocation as this will be dictated by market conditions, the independent actions of the Committee and/or Investment Managers and required cash flows to and from the Plan. The Permitted Range anticipates this fluctuation and provides flexibility for the Investment Managers’ portfolios to vary around the target without the need for immediate rebalancing. The Investment Manager will proactively monitor the asset allocation and will direct the purchases and sales to remain within the stated ranges.
The policy of the Plan is to invest assets in accordance with the allocations shown below:
| Permitted Range | ||||||||||||||||||||
Asset Class / PBO Funded Status | <85% PBO | >=85% PBO | >=90% PBO | >=95% PBO | >=100% PBO | |||||||||||||||
Equity | 39% | - | 59% | 34% | - | 54% | 24% | - | 44% | 14% | - | 34% | 0% | - | 20% | |||||
Investment Grade Fixed Income | 22% | - | 42% | 30% | - | 50% | 40% | - | 60% | 53% | - | 73% | 70% | - | 100% | |||||
Below Investment Grade Fixed Income* | 0% | - | 15% | 0% | - | 15% | 0% | - | 15% | 0% | - | 10% | 0% | - | 10% | |||||
Other** | 5% | - | 20% | 5% | - | 20% | 5% | - | 20% | 0% | - | 15% | 0% | - | 15% | |||||
* Includes (but not limited to) High Yield Bond Fund and Emerging Markets Debt funds. ** Other category may include cash, alternatives, and/or other investment strategies that may be classified other than equity or fixed income, such as the Dynamic Asset Allocation fund. |
The Company’s pension plan asset allocations at December 31, 2017 and 2016, by asset category are as follows:
Asset Allocation | 2017 | 2016 | ||||||
Large Capitalization Equity Securities | 23.5 | % | 21.4 | % | ||||
International Equity Securities | 18.1 | % | 22.0 | % | ||||
Small and Mid-Capitalization Equity Securities | 8.7 | % | 9.0 | % | ||||
Emerging Markets Equity Fund | 5.5 | % | 0.0 | % | ||||
SEI Dynamic Asset Allocation Fund | 5.0 | % | 5.4 | % | ||||
Equity Securities | 60.8 | % | 57.8 | % | ||||
Fixed-Income Securities and Cash | 35.2 | % | 34.3 | % | ||||
Other – SEI Energy Debt Collective Fund | 4.0 | % | 4.1 | % | ||||
Other – SEI Special Situation Collective Investment Trust | 0.0 | % | 3.8 | % | ||||
| 100.0 | % | 100.0 | % | |||||
The following table presents the Company’s pension fund assets measured at fair value and included in Level 1 of the fair value hierarchy and assets measured using the NAV practical expedient to fair valuation as of December 31:
(in thousands) | 2017 | 2016 | ||||||
Assets in Level 1 of the Fair Value Hierarchy | $ | 273,999 | $ | 234,303 | ||||
SEI Energy Debt Collective Fund at NAV | 11,320 | 10,441 | ||||||
SEI Special Situation Collective Investment Trust Fund at NAV | -- | 9,601 | ||||||
Total Assets | $ | 285,319 | $ | 254,345 | ||||
Fair Value Measurements of Pension Fund Assets
ASC 715, Compensation – Retirement Benefits, requires disclosures about pension plan assets identified by the three levels of the fair value hierarchy established by ASC 820-10-35.
103
The following table presents, the Company’s pension fund assets measured at fair value and included in Level 1 of the fair value hierarchy as of December 31:
(in thousands) | 2017 | 2016 | ||||||
Large Capitalization Equity Securities Mutual Fund | $ | 66,946 | $ | 54,483 | ||||
International Equity Securities Mutual Funds | 51,636 | 55,916 | ||||||
Small and Mid-Capitalization Equity Securities Mutual Fund | 24,848 | 23,011 | ||||||
Emerging Markets Equity Fund | 15,824 | -- | ||||||
SEI Dynamic Asset Allocation Mutual Fund | 14,371 | 13,622 | ||||||
Fixed Income Securities Mutual Funds | 100,373 | 87,268 | ||||||
Cash Management – Money Market Fund | 1 | 3 | ||||||
Total Assets | $ | 273,999 | $ | 234,303 | ||||
The investments held by the SEI Energy Debt Collective Fund on December 31, 2017 and 2016 consist mainly of below investment grade high yielding bonds and loans of U.S. energy companies which trade at a discount to fair value. Redemptions are allowed semi-annually with a 95-day notice period, subject to fund director consent and certain gate, holdback and suspension restrictions. Subscriptions are allowed monthly with a three-year lock up on subscriptions. The Company invested $10.0 million in the SEI Energy Debt Fund in July 2015. The fund’s assets are valued in accordance with valuations reported by the fund’s sub-advisor or the fund’s underlying investments or other independent third party sources, although SEI in its discretion may use other valuation methods, subject to compliance with ERISA (as applicable). The fund’s assets are valued as of the close of business on the last business day of each calendar month and are available 30 days after the end of a calendar quarter. On an annual basis, as determined by the investment manager in its sole discretion, an independent valuation agent is retained to provide a valuation of the illiquid assets of the fund and of any other asset of the fund, as determined by the investment manager in its sole discretion. The Company reviews and verifies the reasonableness of the year-end valuations.
Executive Survivor and Supplemental Retirement Plan (ESSRP)
The ESSRP is an unfunded, nonqualified benefit plan for executive officers and certain key management employees. The ESSRP provides defined benefit payments to these employees on their retirements for life or to their beneficiaries on their deaths for a 15-year postretirement period. Life insurance carried on certain plan participants is payable to the Company on the employee's death. There are no plan assets in this nonqualified benefit plan due to the nature of the plan.
The following table lists components of net periodic pension benefit cost for the year ended December 31:
(in thousands) | 2017 | 2016 | 2015 | |||||||||
Service Cost–Benefit Earned During the Period | $ | 290 | $ | 252 | $ | 189 | ||||||
Interest Cost on Projected Benefit Obligation | 1,686 | 1,667 | 1,523 | |||||||||
Amortization of Prior Service Cost: | ||||||||||||
From Regulatory Asset | 16 | 16 | 16 | |||||||||
From Other Comprehensive Income1 | 38 | 38 | 38 | |||||||||
Amortization of Net Actuarial Loss: | ||||||||||||
From Regulatory Asset | 285 | 293 | 334 | |||||||||
From Other Comprehensive Income2 | 440 | 446 | 602 | |||||||||
Net Periodic Pension Cost3 | $ | 2,755 | $ | 2,712 | $ | 2,702 | ||||||
1Amortization of Prior Service Costs from Other Comprehensive Income Charged to: | ||||||||||||
Electric Operation and Maintenance Expenses | $ | 15 | $ | 15 | $ | 15 | ||||||
Other Nonelectric Expenses | 23 | 23 | 23 | |||||||||
2Amortization of Net Actuarial Loss from Other Comprehensive Income Charged to: | ||||||||||||
Electric Operation and Maintenance Expenses | $ | 265 | $ | 272 | $ | 310 | ||||||
Other Nonelectric Expenses | 175 | 174 | 292 | |||||||||
3ESSRP costs are not capitalized. | ||||||||||||
Weighted average assumptions used to determine net periodic pension cost for the year ended December 31:
2017 | 2016 | 2015 | ||||||||||
Discount Rate | 4.60 | % | 4.76 | % | 4.35 | % | ||||||
Rate of Increase in Future Compensation Level | 3.00 | % | 3.13 | % | 3.15 | % | ||||||
104
The following table presents amounts recognized in the consolidated balance sheets as of December 31:
(in thousands) | 2017 | 2016 | ||||||
Regulatory Assets: | ||||||||
Unrecognized Prior Service Cost | $ | 40 | $ | 58 | ||||
Unrecognized Actuarial Loss | 3,229 | 2,890 | ||||||
Total Regulatory Assets | $ | 3,269 | $ | 2,948 | ||||
Projected Benefit Obligation Liability – Net Amount Recognized | $ | (42,308 | ) | $ | (37,335 | ) | ||
Accumulated Other Comprehensive Loss: | ||||||||
Unrecognized Prior Service Cost | $ | 98 | $ | 134 | ||||
Unrecognized Actuarial Loss | 9,024 | 5,915 | ||||||
Total Accumulated Other Comprehensive Loss | $ | 9,122 | $ | 6,049 | ||||
The following tables provide a reconciliation of the changes in the fair value of plan assets and the plan’s projected benefit obligations over the two-year period ended December 31, 2017 and a statement of the funded status as of December 31 of both years:
(in thousands) | 2017 | 2016 | ||||||
Reconciliation of Fair Value of Plan Assets: | ||||||||
Fair Value of Plan Assets at January 1 | $ | -- | $ | -- | ||||
Actual Return on Plan Assets | -- | -- | ||||||
Employer Contributions | 1,175 | 1,188 | ||||||
Benefit Payments | (1,175 | ) | (1,188 | ) | ||||
Fair Value of Plan Assets at December 31 | $ | -- | $ | -- | ||||
Reconciliation of Projected Benefit Obligation: | ||||||||
Projected Benefit Obligation at January 1 | $ | 37,335 | $ | 35,811 | ||||
Service Cost | 290 | 252 | ||||||
Interest Cost | 1,686 | 1,667 | ||||||
Benefit Payments | (1,175 | ) | (1,188 | ) | ||||
Plan Amendments | -- | -- | ||||||
Actuarial Loss | 4,172 | 793 | ||||||
Projected Benefit Obligation at December 31 | $ | 42,308 | $ | 37,335 | ||||
Weighted average assumptions used to determine benefit obligations at December 31:
2017 | 2016 | |||||||
Discount Rate | 3.85 | % | 4.60 | % | ||||
Rate of Increase in Future Compensation Level: | 2.92 | % | 3.00 | % | ||||
The estimated amounts of unrecognized net actuarial losses and prior service costs to be amortized from regulatory assets and accumulated other comprehensive loss into the net periodic pension cost for the ESSRP in 2018 are:
(in thousands) | 2018 | |||
Decrease in Regulatory Assets: | ||||
Amortization of Unrecognized Prior Service Cost | $ | 16 | ||
Amortization of Unrecognized Actuarial Loss | 267 | |||
Decrease in Accumulated Other Comprehensive Loss: | ||||
Amortization of Unrecognized Prior Service Cost | 38 | |||
Amortization of Unrecognized Actuarial Loss | 661 | |||
Total Estimated Amortization | $ | 982 | ||
Cash flows—The ESSRP is unfunded and has no assets; contributions are equal to the benefits paid to plan participants. The following benefit payments, which reflect future service, as appropriate, are expected to be paid:
Years | ||||||||||||||||||||||||
(in thousands) | 2018 | 2019 | 2020 | 2021 | 2022 | 2023-2027 | ||||||||||||||||||
| $ | 1,568 | $ | 1,612 | $ | 1,576 | $ | 1,670 | $ | 2,255 | $ | 13,775 | |||||||||||||
105
Other Postretirement Benefits
The Company provides a portion of health insurance and life insurance benefits for retired OTP and corporate employees. Substantially all of the Company's electric utility and corporate employees may become eligible for health insurance benefits if they reach age 55 and have 10 years of service. There are no plan assets. The following table lists components of net periodic postretirement benefit cost for the year ended December 31:
(in thousands) | 2017 | 2016 | 2015 | |||||||||
Service Cost–Benefit Earned During the Period | $ | 1,425 | $ | 1,301 | $ | 1,297 | ||||||
Interest Cost on Projected Benefit Obligation | 2,712 | 2,503 | 2,097 | |||||||||
Amortization of Prior Service Cost | ||||||||||||
From Regulatory Asset | (4 | ) | 134 | 205 | ||||||||
From Other Comprehensive Income1 | 4 | 3 | 5 | |||||||||
Amortization of Net Actuarial Loss | ||||||||||||
From Regulatory Asset | 936 | 379 | -- | |||||||||
From Other Comprehensive Income1 | 19 | 9 | -- | |||||||||
Net Periodic Postretirement Benefit Cost2 | $ | 5,092 | $ | 4,329 | $ | 3,604 | ||||||
Effect of Medicare Part D Subsidy | $ | (561 | ) | $ | (923 | ) | $ | (1,487 | ) | |||
| 1Corporate cost included in Other Nonelectric Expenses | ||||||||||||
| 2Allocation of Cost: | 2017 | 2016 | 2015 | |||||||||
| Cost included in OTP Capital Expenditures | $ | 989 | $ | 792 | $ | 650 | ||||||
| Cost included in Electric Operation and Maintenance Expenses | 3,981 | 3,433 | 2,864 | |||||||||
| Cost included in Other Nonelectric Expenses | 122 | 104 | 90 | |||||||||
Weighted average assumptions used to determine net periodic postretirement benefit cost for the year ended December 31:
2017 | 2016 | 2015 | ||||||||||
Discount Rate | 4.46 | % | 4.57 | % | 4.20 | % | ||||||
The following table presents amounts recognized in the consolidated balance sheets as of December 31:
(in thousands) | 2017 | 2016 | ||||||
Regulatory Asset: | ||||||||
Unrecognized Prior Service Cost | $ | -- | $ | (4 | ) | |||
Unrecognized Net Actuarial Loss | 18,927 | 13,586 | ||||||
Net Regulatory Asset | $ | 18,927 | $ | 13,582 | ||||
Projected Benefit Obligation Liability – Net Amount Recognized | $ | (69,774 | ) | $ | (62,571 | ) | ||
Accumulated Other Comprehensive (Income) Loss: | ||||||||
Unrecognized Prior Service Cost | $ | -- | $ | 4 | ||||
Unrecognized Net Actuarial Gain | (111 | ) | (171 | ) | ||||
Accumulated Other Comprehensive Income | $ | (111 | ) | $ | (167 | ) | ||
106
The following tables provide a reconciliation of the changes in the fair value of plan assets and the plan’s projected benefit obligations and accrued postretirement benefit cost over the two-year period ended December 31, 2017:
(in thousands) | 2017 | 2016 | ||||||
Reconciliation of Fair Value of Plan Assets: | ||||||||
Fair Value of Plan Assets at January 1 | $ | -- | $ | -- | ||||
Actual Return on Plan Assets | -- | -- | ||||||
Company Contributions | 3,290 | 2,825 | ||||||
Benefit Payments (Net of Medicare Part D Subsidy) | (6,534 | ) | (5,908 | ) | ||||
Participant Premium Payments | 3,244 | 3,083 | ||||||
Fair Value of Plan Assets at December 31 | $ | -- | $ | -- | ||||
Reconciliation of Projected Benefit Obligation: | ||||||||
Projected Benefit Obligation at January 1 | $ | 62,571 | $ | 48,730 | ||||
Service Cost (Net of Medicare Part D Subsidy) | 1,425 | 1,301 | ||||||
Interest Cost (Net of Medicare Part D Subsidy) | 2,712 | 2,503 | ||||||
Benefit Payments (Net of Medicare Part D Subsidy) | (6,534 | ) | (5,908 | ) | ||||
Participant Premium Payments | 3,244 | 3,083 | ||||||
Actuarial Loss | 6,356 | 12,862 | ||||||
Projected Benefit Obligation at December 31 | $ | 69,774 | $ | 62,571 | ||||
Reconciliation of Accrued Postretirement Cost: | ||||||||
Accrued Postretirement Cost at January 1 | $ | (49,156 | ) | $ | (47,652 | ) | ||
Expense | (5,092 | ) | (4,329 | ) | ||||
Net Company Contribution | 3,290 | 2,825 | ||||||
Accrued Postretirement Cost at December 31 | $ | (50,958 | ) | $ | (49,156 | ) | ||
Weighted average assumptions used to determine benefit obligations at December 31:
2017 | 2016 | |||||||
Discount Rate | 3.81 | % | 4.46 | % | ||||
Assumed healthcare cost-trend rates as of December 31:
2017 | 2016 | |||||||
Healthcare Cost-Trend Rate Assumed for Next Year Pre-65 | 5.85 | % | 6.01 | % | ||||
Healthcare Cost-Trend Rate Assumed for Next Year Post-65 | 6.03 | % | 6.23 | % | ||||
Rate to Which the Cost-Trend Rate is Assumed to Decline | 4.50 | % | 4.50 | % | ||||
Year the Rate Reaches the Ultimate Trend Rate | 2038 | 2038 | ||||||
Assumed healthcare cost-trend rates have a significant effect on the amounts reported for healthcare plans. A one-percentage-point change in assumed healthcare cost-trend rates for 2017 would have the following effects:
(in thousands) | 1 Point Increase | 1 Point Decrease | ||||||
Effect on the Postretirement Benefit Obligation | $ | 9,301 | $ | (7,692 | ) | |||
Effect on Total of Service and Interest Cost | $ | 731 | $ | (601 | ) | |||
Effect on Expense | $ | 1,589 | $ | (1,500 | ) | |||
Measurement Dates: | 2017 | 2016 |
Net Periodic Postretirement Benefit Cost | January 1, 2017 | January 1, 2016 |
End of Year Benefit Obligations | January 1, 2017 projected to December 31, 2017 | January 1, 2016 projected to December 31, 2016 |
107
The estimated net amounts of unrecognized prior service cost to be amortized from regulatory assets and accumulated other comprehensive loss into the net periodic postretirement benefit cost in 2018 are:
(in thousands) | 2018 | |||
Decrease in Regulatory Assets: | ||||
Amortization of Unrecognized Actuarial Loss | $ | 1,649 | ||
Decrease in Accumulated Other Comprehensive Loss: | ||||
Amortization of Unrecognized Actuarial Loss | 41 | |||
Total Estimated Amortization | $ | 1,690 | ||
Cash flows—The Company expects to contribute $4.0 million net of expected employee contributions for the payment of retiree medical benefits and Medicare Part D subsidy receipts in 2018. The Company expects to receive a Medicare Part D subsidy from the Federal government of approximately $0.4 million in 2018. The following benefit payments, which reflect expected future service, as appropriate, net of expected Medicare Part D subsidy receipts and participant premium payments, are expected to be paid:
Years | ||||||||||||||||||||||||
(in thousands) | 2018 | 2019 | 2020 | 2021 | 2022 | 2023-2027 | ||||||||||||||||||
| $ | 3,986 | $ | 4,107 | $ | 4,133 | $ | 4,218 | $ | 4,327 | $ | 21,089 | |||||||||||||
401K Plan
The Company sponsors a 401K plan for the benefit of all corporate and subsidiary company employees. Contributions made to these plans by the Company and its subsidiary companies included in continuing operations totaled $4,211,000 for 2017, $3,877,000 for 2016 and $3,602,000 for 2015.
Employee Stock Ownership Plan
The Company has a stock ownership plan for the benefit of all its electric utility employees. Contributions made by the Company were $612,000 for 2017, $647,000 for 2016 and $674,000 for 2015.
11. Fair Value of Financial Instruments
The following methods and assumptions were used to estimate the fair value of each class of financial instruments for which it is practicable to estimate that value:
Cash Equivalents—The carrying amount approximates fair value because of the short-term maturity of those instruments.
Short-Term Debt—The carrying amount approximates fair value because the debt obligations are short-term and the balances outstanding as of December 31, 2017 and December 31, 2016 related to the OTP Credit Agreement were subject to a variable interest rate of LIBOR plus 1.25%, which approximates market rates.
Long-Term Debt including Current Maturities—The fair value of the Company's and OTP’s long-term debt is estimated based on the current market indications of rates available to the Company for the issuance of debt. The Company’s long-term debt subject to variable interest rates on December 31, 2016 approximated fair value. The fair value measurements of the Company’s long-term debt issues fall into level 2 of the fair value hierarchy set forth in ASC 820.
December 31, 2017 | December 31, 2016 | |||||||||||||||
(in thousands) | Carrying Amount | Fair Value | Carrying Amount | Fair Value | ||||||||||||
Cash and Cash Equivalents | $ | 16,216 | $ | 16,216 | $ | -- | $ | -- | ||||||||
Short-Term Debt | (112,371 | ) | (112,371 | ) | (42,883 | ) | (42,883 | ) | ||||||||
Long-Term Debt including Current Maturities | (490,566 | ) | (543,691 | ) | (538,542 | ) | (583,835 | ) | ||||||||
108
12. Property, Plant and Equipment
(in thousands) | December 31, 2017 | December 31, 2016 | ||||||
Electric Plant in Service | ||||||||
Production | $ | 897,732 | $ | 891,330 | ||||
Transmission | 500,352 | 410,679 | ||||||
Distribution | 482,867 | 466,285 | ||||||
General | 100,067 | 92,063 | ||||||
Electric Plant in Service | 1,981,018 | 1,860,357 | ||||||
Construction Work in Progress | 132,556 | 149,997 | ||||||
Total Gross Electric Plant | 2,113,574 | 2,010,354 | ||||||
Less Accumulated Depreciation and Amortization | 662,431 | 622,657 | ||||||
Net Electric Plant | $ | 1,451,143 | $ | 1,387,697 | ||||
Nonelectric Operations Plant | ||||||||
Equipment | $ | 160,263 | $ | 155,809 | ||||
Buildings and Leasehold Improvements | 52,280 | 51,323 | ||||||
Land | 4,394 | 4,694 | ||||||
Nonelectric Operations Plant | 216,937 | 211,826 | ||||||
Construction Work in Progress | 8,511 | 3,264 | ||||||
Total Gross Nonelectric Plant | 225,448 | 215,090 | ||||||
Less Accumulated Depreciation and Amortization | 136,988 | 125,562 | ||||||
Net Nonelectric Operations Plant | $ | 88,460 | $ | 89,528 | ||||
Net Plant | $ | 1,539,603 | $ | 1,477,225 | ||||
The estimated service lives for rate-regulated properties is 5 to 82 years. For nonelectric property the estimated useful lives are from 3 to 40 years.
Service Life Range | ||||||||
(years) | Low | High | ||||||
Electric Fixed Assets: | ||||||||
Production Plant | 9 | 82 | ||||||
Transmission Plant | 42 | 70 | ||||||
Distribution Plant | 5 | 68 | ||||||
General Plant | 5 | 50 | ||||||
Nonelectric Fixed Assets: | ||||||||
Equipment | 3 | 12 | ||||||
Buildings and Leasehold Improvements | 7 | 40 | ||||||
109
13. Income Taxes
The total income tax expense differs from the amount computed by applying the federal income tax rate (35% in 2017, 2016 and 2015) to net income before total income tax expense for the following reasons:
(in thousands) | 2017 | 2016 | 2015 | |||||||||
Tax Computed at Federal Statutory Rate – Continuing Operations | $ | 34,707 | $ | 28,741 | $ | 28,081 | ||||||
Increases (Decreases) in Tax from: | ||||||||||||
Federal Production Tax Credits (PTCs) | (7,527 | ) | (7,175 | ) | (6,962 | ) | ||||||
State Income Taxes Net of Federal Income Tax Expense | 4,341 | 2,848 | 4,945 | |||||||||
Section 199 Domestic Production Activities Deduction | (1,471 | ) | (482 | ) | -- | |||||||
North Dakota Wind Tax Credit Amortization – Net of Federal Taxes | (850 | ) | (850 | ) | (850 | ) | ||||||
Corporate-owned Life Insurance | (845 | ) | (680 | ) | (167 | ) | ||||||
Excess Tax deduction - Equity Method Stock Awards | (751 | ) | -- | -- | ||||||||
Employee Stock Ownership Plan Dividend Deduction | (509 | ) | (537 | ) | (560 | ) | ||||||
Allowance for Funds Used During Construction – Equity | (322 | ) | (280 | ) | (426 | ) | ||||||
Investment Tax Credit Amortization | (164 | ) | (350 | ) | (571 | ) | ||||||
Differences Reversing in Excess of Federal Rates | 551 | 77 | (1,143 | ) | ||||||||
Permanent and Other Differences | (1,873 | ) | (1,231 | ) | (705 | ) | ||||||
Effect of TCJA Tax Rate Reduction on Value of Net Deferred Tax Assets | 1,756 | -- | -- | |||||||||
Total Income Tax Expense – Continuing Operations | $ | 27,043 | $ | 20,081 | $ | 21,642 | ||||||
Income Tax Expense – Discontinued Operations – U.S. | 213 | 138 | 2,991 | |||||||||
Income Tax Expense – Continuing and Discontinued Operations | $ | 27,256 | $ | 20,219 | $ | 24,633 | ||||||
Overall Effective Federal, State and Foreign Income Tax Rate | 27.3 | % | 24.5 | % | 29.3 | % | ||||||
Income Tax Expense From Continuing Operations Includes the Following: | ||||||||||||
Current Federal Income Taxes | $ | 4,581 | $ | 1,070 | $ | 211 | ||||||
Current State Income Taxes | 1,154 | 1,211 | 1 | |||||||||
Deferred Federal Income Taxes | 25,320 | 23,586 | 23,050 | |||||||||
Deferred State Income Taxes | 4,529 | 2,589 | 6,763 | |||||||||
Federal PTCs | (7,527 | ) | (7,175 | ) | (6,962 | ) | ||||||
North Dakota Wind Tax Credit Amortization – Net of Federal Taxes | (850 | ) | (850 | ) | (850 | ) | ||||||
Investment Tax Credit Amortization | (164 | ) | (350 | ) | (571 | ) | ||||||
Total | $ | 27,043 | $ | 20,081 | $ | 21,642 | ||||||
Total Income Before Income Taxes – Continuing and Discontinued Operations | $ | 99,695 | $ | 82,540 | $ | 83,978 | ||||||
The Company's deferred tax assets and liabilities were composed of the following on December 31:
(in thousands) | 2017 | 2016 | ||||||
Deferred Tax Assets | ||||||||
Federal PTCs | $ | 40,614 | $ | 43,433 | ||||
Regulatory Tax Liability | 39,465 | 2,422 | ||||||
North Dakota Wind Tax Credits | 32,962 | 32,962 | ||||||
Benefit Liabilities | 32,328 | 44,381 | ||||||
Retirement Benefits Liabilities | 31,894 | 38,390 | ||||||
Cost of Removal | 21,800 | 31,636 | ||||||
Differences Related to Property | 6,499 | 9,876 | ||||||
Net Operating Loss Carryforward | 3,203 | 3,865 | ||||||
Vacation Accrual | 1,844 | 2,725 | ||||||
Investment Tax Credits | 515 | 818 | ||||||
Other | 668 | 5,371 | ||||||
Total Deferred Tax Assets | $ | 211,792 | $ | 215,879 | ||||
Deferred Tax Liabilities | ||||||||
Differences Related to Property | $ | (257,906 | ) | $ | (371,761 | ) | ||
Retirement Benefits Regulatory Asset | (31,894 | ) | (38,390 | ) | ||||
Excess Tax over Book Pension | (14,077 | ) | (15,509 | ) | ||||
North Dakota Wind Tax Credits | (4,112 | ) | (3,654 | ) | ||||
Impact of State Net Operating Losses on Federal Taxes | (673 | ) | (1,352 | ) | ||||
Other | (3,631 | ) | (11,804 | ) | ||||
Total Deferred Tax Liabilities | $ | (312,293 | ) | $ | (442,470 | ) | ||
Deferred Income Taxes | $ | (100,501 | ) | $ | (226,591 | ) | ||
110
Federal PTCs are earned as wind energy is generated based on a per kwh rate prescribed in applicable federal statutes. OTP’s kwh generation from its wind turbines eligible for PTCs increased 4.4% in 2017 compared with 2016. North Dakota wind energy credits are based on dollars invested in qualifying facilities and are being recognized on a straight-line basis over 25 years.
Schedule of expiration of tax credits and tax net operating losses available as of December 31, 2017:
(in thousands) | Amount | 2022-2031 | 2032-2037 | 2038-2043 | |||||||||||
United States | |||||||||||||||
Federal Tax Credits | $ | 43,238 | $ | -- | $ | 43,238 | $ | -- | |||||||
State Net Operating Losses | 3,203 | 2,339 | 864 | -- | |||||||||||
State Tax Credits | 33,568 | 376 | 231 | 32,961 | |||||||||||
The following table summarizes the activity related to the Company’s unrecognized tax benefits:
(in thousands) | 2017 | 2016 | 2015 | |||||||||
Balance on January 1 | $ | 891 | $ | 468 | $ | 222 | ||||||
Increases Related to Tax Positions for Prior Years | 28 | 406 | 236 | |||||||||
Decreases Related to Tax Positions for Prior Years | (378 | ) | -- | -- | ||||||||
Increases Related to Tax Positions for Current Year | 143 | 114 | 10 | |||||||||
Uncertain Positions Resolved During Year | -- | (97 | ) | -- | ||||||||
Balance on December 31 | $ | 684 | $ | 891 | $ | 468 | ||||||
The balance of unrecognized tax benefits as of December 31, 2017 would reduce the Company’s effective tax rate if recognized. The total amount of unrecognized tax benefits as of December 31, 2017 is not expected to change significantly within the next 12 months. The Company classifies interest and penalties on tax uncertainties as components of the provision for income taxes in the Company’s consolidated statement of income. There was no amount accrued for interest on tax uncertainties as of December 31, 2017.
The Company and its subsidiaries file a consolidated U.S. federal income tax return and various state income tax returns. As of December 31, 2017, with limited exceptions, the Company is no longer subject to examinations by taxing authorities for tax years prior to 2014 for federal and North Dakota state income taxes and for years prior to 2013 for Minnesota state income taxes.
TCJA
In December 2017 the TCJA was enacted. The TCJA includes a number of changes to existing U.S. tax laws that impact the Company, most notably a reduction of the federal corporate income tax rate from 35% to 21% for tax years beginning after December 31, 2017.
The Company measures deferred tax assets and liabilities using enacted tax rates that will apply in the years in which the temporary differences are expected to be recovered or paid. Accordingly, the Company’s deferred tax assets and liabilities were remeasured to reflect the reduction in the U.S. corporate income tax rate from 35% to 21%. The revaluation for OTP required the creation of a regulatory liability and an offsetting reduction in deferred tax liability. This regulatory liability will generally be amortized over the remaining life of the related assets. On a consolidated financial statement basis, the revaluation resulted in a one-time, non-cash, income tax expense of approximately $1.8 million in 2017. The impacts of the TCJA adjustments to deferred taxes and regulatory liabilities are provided in the reconciliation below:
(in thousands) | Deferred Tax Liability | Deferred Tax Regulatory Liability | ||||||
Balance on January 1, 2017 | $ | 226,591 | $ | 818 | ||||
Change due to 2017 Accruals and Amortizations | 20,012 | 376 | ||||||
TCJA Deferred Tax Valuation Adjustment | (109,072 | ) | 109,072 | |||||
Tax Effect on TCJA Deferred Tax Valuation Adjustment | (38,786 | ) | 38,786 | |||||
TCJA Adjustment to Income Tax Expense | 1,756 | -- | ||||||
Balance on December 31, 2017 | $ | 100,501 | $ | 149,052 | ||||
111
The Company recognized the income tax effects of the TCJA in its 2017 consolidated financial statements in accordance with Staff Accounting Bulletin No. 118, which provides SEC staff guidance for the application of ASC Topic 740, Income Taxes, in the reporting period in which the TCJA was signed into law. Current estimates may be revised and are subject to change due, in part, to complexities and uncertainties associated with the TCJA. While the Company is able to make reasonable estimates of the impact of the TCJA for the reduction in the federal corporate tax rate, changes to bonus depreciation and consequences on the Company’s regulatory liabilities, the final impact of the TCJA may differ from these estimates due to, among other things, changes in the Company’s interpretations and assumptions and additional guidance that may be issued by the U.S. Internal Revenue Service, rate regulators or the FASB.
14. Asset Retirement Obligations (AROs)
The Company’s AROs are related to OTP’s coal-fired generation plants and its 92 wind turbines located in North Dakota. The AROs include items such as site restoration, closure of ash pits, and removal of certain structures, generators, asbestos and storage tanks. The Company has legal obligations associated with the retirement of a variety of other long-lived tangible assets used in electric operations where the estimated settlement costs are individually and collectively immaterial. The Company has no assets legally restricted for the settlement of any of its AROs.
OTP recorded no new AROs in 2017.
Reconciliations of carrying amounts of the present value of the Company’s legal AROs, capitalized asset retirement costs and related accumulated depreciation and a summary of settlement activity for the years ended December 31, 2017 and 2016 are presented in the following table:
(in thousands) | 2017 | 2016 | ||||||
Asset Retirement Obligations | ||||||||
Beginning Balance | $ | 8,341 | $ | 8,084 | ||||
New Obligations Recognized | -- | -- | ||||||
Adjustments Due to Revisions in Cash Flow Estimates | -- | (103 | ) | |||||
Accrued Accretion | 378 | 360 | ||||||
Settlements | -- | -- | ||||||
Ending Balance | $ | 8,719 | $ | 8,341 | ||||
Asset Retirement Costs Capitalized | ||||||||
Beginning Balance | $ | 2,983 | $ | 3,086 | ||||
New Obligations Recognized | -- | -- | ||||||
Adjustments Due to Revisions in Cash Flow Estimates | -- | (103 | ) | |||||
Settlements | -- | -- | ||||||
Ending Balance | $ | 2,983 | $ | 2,983 | ||||
Accumulated Depreciation – Asset Retirement Costs Capitalized | ||||||||
Beginning Balance | $ | 795 | $ | 673 | ||||
New Obligations Recognized | -- | -- | ||||||
Adjustments Due to Revisions in Cash Flow Estimates | -- | -- | ||||||
Depreciation Expense | 120 | 122 | ||||||
Settlements | -- | -- | ||||||
Ending Balance | $ | 915 | $ | 795 | ||||
Settlements | None | None | ||||||
Original Capitalized Asset Retirement Cost – Retired | $ | -- | $ | -- | ||||
Accumulated Depreciation | -- | -- | ||||||
Asset Retirement Obligation | $ | -- | $ | -- | ||||
Settlement Cost | -- | -- | ||||||
Gain on Settlement – Deferred Under Regulatory Accounting | $ | -- | $ | -- | ||||
112
15. Discontinued Operations
On April 30, 2015 the Company sold Foley for $12.0 million in cash, plus $6.3 million in adjustments for working capital and other related items received in October 2015, less $1.0 million in selling expenses. On February 28, 2015 the Company sold the assets of AEV, Inc. for $22.3 million in cash, plus $0.6 million in adjustments for working capital and fixed assets received in October 2015, less $0.8 million in selling expenses. Foley and AEV, Inc. were formerly included in the Company’s Construction segment.
On February 8, 2013 the Company completed the sale of substantially all the assets of its dock and boatlift company, formerly included in the Company’s Manufacturing segment. On November 30, 2012 the Company completed the sale of the assets of the Company’s wind tower manufacturing business. This business was the only remaining entity in the Company’s former Wind Energy segment.
The Company’s Wind Energy and Construction segments were eliminated as a result of the sales of its wind tower manufacturing business, Foley and AEV, Inc. The financial position, results of operations and cash flows of Foley, AEV, Inc., the Company’s wind tower manufacturing business and its dock and boatlift company are reported as discontinued operations in the Company’s consolidated financial statements.
Following are summary presentations of the results of discontinued operations for the years ended December 31, 2017, 2016 and 2015:
For the Year Ended December 31, 2017 | ||||||||||||||||||||||||
(in thousands) | Foley | AEV, Inc. | Wind Tower Business | Dock and Boatlift Business | Intercompany Transactions Adjustment | Total | ||||||||||||||||||
Operating Expenses | $ | 233 | $ | -- | $ | (460 | ) | $ | (306 | ) | $ | -- | $ | (533 | ) | |||||||||
Income Tax (Benefit) Expense | (93 | ) | -- | 184 | 122 | -- | 213 | |||||||||||||||||
Net (Loss) Income | $ | (140 | ) | $ | -- | $ | 276 | $ | 184 | $ | -- | $ | 320 | |||||||||||
For the Year Ended December 31, 2016 | ||||||||||||||||||||||||
(in thousands) | Foley | AEV, Inc. | Wind Tower Business | Dock and Boatlift Business | Intercompany Transactions Adjustment | Total | ||||||||||||||||||
Operating Expenses | $ | 250 | $ | -- | $ | (757 | ) | $ | 85 | $ | -- | $ | (422 | ) | ||||||||||
Income Tax (Benefit) Expense | (136 | ) | 5 | 303 | (34 | ) | -- | 138 | ||||||||||||||||
Net (Loss) Income | $ | (114 | ) | $ | (5 | ) | $ | 454 | $ | (51 | ) | $ | -- | $ | 284 | |||||||||
For the Year Ended December 31, 2015 | ||||||||||||||||||||||||
(in thousands) | Foley | AEV, Inc. | Wind Tower Business | Dock and Boatlift Business | Intercompany Transactions Adjustment | Total | ||||||||||||||||||
Operating Revenues | $ | 21,625 | $ | 2,998 | $ | -- | $ | -- | $ | -- | $ | 24,623 | ||||||||||||
Operating Expenses | 26,839 | 4,532 | (462 | ) | 966 | (240 | ) | 31,635 | ||||||||||||||||
Asset Impairment Charge | 1,000 | -- | -- | -- | -- | 1,000 | ||||||||||||||||||
Interest Expense | 177 | 27 | -- | -- | (204 | ) | -- | |||||||||||||||||
Other Income (Deductions) | (42 | ) | 2 | 111 | -- | (2 | ) | 69 | ||||||||||||||||
Income Tax (Benefit) Expense | (921 | ) | (638 | ) | 229 | (386 | ) | 177 | (1,539 | ) | ||||||||||||||
Net (Loss) Income from Operations | (5,512 | ) | (921 | ) | 344 | (580 | ) | 265 | (6,404 | ) | ||||||||||||||
(Loss) Gain on Disposition Before Taxes | (204 | ) | 11,894 | -- | -- | -- | 11,690 | |||||||||||||||||
Income Tax (Benefit) Expense on Disposition | (227 | ) | 4,757 | -- | -- | -- | 4,530 | |||||||||||||||||
Net Gain on Disposition | 23 | 7,137 | -- | -- | -- | 7,160 | ||||||||||||||||||
Net (Loss) Income | $ | (5,489 | ) | $ | 6,216 | $ | 344 | $ | (580 | ) | $ | 265 | $ | 756 | ||||||||||
Foley and AEV, Inc. entered into fixed-price construction contracts. Revenues under these contracts were recognized on a percentage-of-completion basis. The method used to determine the progress of completion was based on the ratio of costs incurred to total estimated costs on construction projects. An increase in estimated costs on one large job in progress at Foley in excess of previous period cost estimates resulted in pretax charges of $4.4 million in 2015. In the first quarter of 2015, Foley recorded a $1.0 million goodwill impairment charge based on adjustments to the carrying value of Foley.
113
Following are summary presentations of the major components of assets and liabilities of discontinued operations as of December 31, 2017 and December 31, 2016:
December 31, 2017 | ||||||||||||
(in thousands) | Wind Tower Business | Dock and Boatlift Business | Total | |||||||||
Current Liabilities | $ | 130 | $ | 362 | $ | 492 | ||||||
Liabilities of Discontinued Operations | $ | 130 | $ | 362 | $ | 492 | ||||||
December 31, 2016 | ||||||||||||
(in thousands) | Wind Tower Business | Dock and Boatlift Business | Total | |||||||||
Current Liabilities | $ | 589 | $ | 774 | $ | 1,363 | ||||||
Liabilities of Discontinued Operations | $ | 589 | $ | 774 | $ | 1,363 | ||||||
Included in current liabilities of discontinued operations are warranty reserves. Details regarding the warranty reserves follow:
(in thousands) | 2017 | 2016 | ||||||
Warranty Reserve Balance, January 1 | $ | 1,369 | $ | 2,103 | ||||
Additional Provision for Warranties Made During the Year | -- | -- | ||||||
Settlements Made During the Year | (112 | ) | (24 | ) | ||||
Decrease in Warranty Estimates for Prior Years | (760 | ) | (710 | ) | ||||
Warranty Reserve Balance, December 31 | $ | 497 | $ | 1,369 | ||||
The warranty reserve balances as of December 31, 2017 relate entirely to products produced by the Company’s former wind tower and dock and boatlift manufacturing companies. Certain products sold by the companies carried one to fifteen year warranties. Although the assets of these companies have been sold and their operating results are reported under discontinued operations in the Company’s consolidated statements of income, the Company retains responsibility for warranty claims related to the products they produced prior to the sales of these companies.
Expenses associated with remediation activities of these companies could be substantial. For wind towers, the potential exists for multiple claims based on one defect repeated throughout the production process or for claims where the cost to repair or replace the defective part is highly disproportionate to the original cost of the part. For example, if the Company is required to cover remediation expenses in addition to regular warranty coverage, the Company could be required to accrue additional expenses and experience additional unplanned cash expenditures which could adversely affect the Company’s consolidated net income and financial condition.
16. Subsequent Events
Stock Incentive Awards
On February 5, 2018 the following stock incentive awards were granted to officers under the 2014 Incentive Plan:
Award | Shares/Units Granted | Weighted Average Grant- Date Fair Value per Award | Vesting | ||||||
Restricted Stock Units Granted | 15,200 | $ | 41.325 | 25% per year through February 6, 2022 | |||||
Stock Performance Awards Granted | 54,000 | $ | 35.73 | December 31, 2020 | |||||
The vesting of restricted stock units is accelerated in the event of a change in control, disability, death or retirement, subject to proration in certain cases. All restricted stock units granted to executive officers are eligible to receive dividend equivalent payments on all unvested awards over the awards respective vesting periods, subject to forfeiture under the terms of the restricted stock unit award agreements. The grant-date fair value of each restricted stock unit was the average of the high and low market price per share on the date of grant.
114
Under the performance share awards the aggregate award for performance at target is 54,000 shares. For target performance the participants would earn an aggregate of 27,000 common shares for achieving the target set for the Company’s 3-year average adjusted return on equity. The participants would also earn an aggregate of 27,000 common shares based on the Company’s total shareholder return relative to the total shareholder return of the companies that comprise the EEI Index over the performance measurement period of January 1, 2018 through December 31, 2020, with the beginning and ending share values based on the average closing price of a share of the Company’s common stock for the 20 trading days immediately following January 1, 2018 and the average closing price for the 20 trading days immediately preceding January 1, 2021. Actual payment may range from zero to 150% of the target amount, or up to 81,000 common shares. There are no voting or dividend rights related to these shares until the shares, if any, are issued at the end of the performance measurement period. The terms of these awards are such that the entire award will be classified and accounted for as equity, as required under ASC 718, and will be measured over the performance period based on the grant-date fair value of the award. The grant-date fair value of each performance share award was determined using a Monte Carlo fair valuation simulation model.
Under the 2018 Performance Award Agreements, payment and the amount of payment in the event of retirement, resignation for good reason or involuntary termination without cause is to be made at the end of the performance period based on actual performance, subject to proration in certain cases, except that the payment of performance awards granted to an officer who is party to an Executive Employment Agreement with the Company is to be made at target at the date of any such event.
The end of the period over which compensation expense is recognized for the above share-based awards for the individual grantees is the shorter of the indicated vesting period for the respective awards or the date the grantee becomes eligible for retirement as defined in their award agreement.
Supplementary Financial Information
Quarterly Information (not audited)
Because of changes in the number of common shares outstanding and the impact of diluted shares, the sum of the quarterly earnings per common share may not equal total earnings per common share.
Three Months Ended | March 31 | June 30 | September 30 | December 31 | ||||||||||||||||||||||||||||
(in thousands, except per share data) | 2017 | 2016 | 2017 | 2016 | 2017 | 2016 | 2017 | 2016 | ||||||||||||||||||||||||
Operating Revenues–Continuing Operations | $ | 214,117 | $ | 206,242 | $ | 212,086 | $ | 203,482 | $ | 216,457 | $ | 197,175 | $ | 206,690 | $ | 196,640 | ||||||||||||||||
Operating Income–Continuing Operations | $ | 32,801 | $ | 27,576 | $ | 29,589 | $ | 27,083 | $ | 31,609 | $ | 27,284 | $ | 32,135 | $ | 29,156 | ||||||||||||||||
Net Income (Loss): | ||||||||||||||||||||||||||||||||
Continuing Operations | $ | 19,529 | $ | 14,490 | $ | 16,717 | $ | 15,556 | $ | 17,773 | $ | 14,594 | $ | 18,100 | $ | 17,397 | ||||||||||||||||
Discontinued Operations | $ | 56 | $ | 30 | $ | 61 | $ | 119 | $ | (39 | ) | $ | 22 | $ | 242 | $ | 113 | |||||||||||||||
Total Net Income | $ | 19,585 | $ | 14,520 | $ | 16,778 | $ | 15,675 | $ | 17,734 | $ | 14,616 | $ | 18,342 | $ | 17,510 | ||||||||||||||||
Basic Earnings Per Share: | ||||||||||||||||||||||||||||||||
Continuing Operations | $ | .50 | $ | .38 | $ | .43 | $ | .41 | $ | .45 | $ | .38 | $ | .45 | $ | .45 | ||||||||||||||||
Discontinued Operations | $ | -- | $ | -- | $ | -- | $ | -- | $ | -- | $ | -- | $ | .01 | $ | -- | ||||||||||||||||
Total Basic Earnings Per Share | $ | .50 | $ | .38 | $ | .43 | $ | .41 | $ | .45 | $ | .38 | $ | .46 | $ | .45 | ||||||||||||||||
Diluted Earnings Per Share: | ||||||||||||||||||||||||||||||||
Continuing Operations | $ | .49 | $ | .38 | $ | .42 | $ | .41 | $ | .45 | $ | .37 | $ | .45 | $ | .44 | ||||||||||||||||
Discontinued Operations | $ | -- | $ | -- | $ | -- | $ | -- | $ | -- | $ | -- | $ | .01 | $ | -- | ||||||||||||||||
Total Diluted Earnings Per Share | $ | .49 | $ | .38 | $ | .42 | $ | .41 | $ | .45 | $ | .37 | $ | .46 | $ | .44 | ||||||||||||||||
Dividends Declared Per Common Share | $ | .3200 | $ | .3125 | $ | .3200 | $ | .3125 | $ | .3200 | $ | .3125 | $ | .3200 | $ | .3125 | ||||||||||||||||
Price Range: | ||||||||||||||||||||||||||||||||
High | 40.80 | 29.73 | 41.95 | 33.50 | 44.50 | 36.42 | 48.65 | 42.55 | ||||||||||||||||||||||||
Low | 35.65 | 25.80 | 36.45 | 27.77 | 38.75 | 32.89 | 43.30 | 33.08 | ||||||||||||||||||||||||
Average Number of Common Shares Outstanding--Basic | 39,351 | 37,937 | 39,463 | 38,179 | 39,508 | 38,833 | 39,508 | 39,236 | ||||||||||||||||||||||||
Average Number of Common Shares Outstanding--Diluted | 39,641 | 38,045 | 39,702 | 38,321 | 39,795 | 39,006 | 39,855 | 39,552 | ||||||||||||||||||||||||
115
PART IV
Item 15. | EXHIBITS AND FINANCIAL STATEMENT SCHEDULES |
(a) | List of documents filed as part of this report: |
1. | Financial Statements |
| Page | ||
Report of Independent Registered Public Accounting Firm | 60 | |
Consolidated Balance Sheets, December 31, 2017 and 2016 | 61 | |
Consolidated Statements of Income for the Three Years Ended December 31, 2017 | 63 | |
Consolidated Statements of Comprehensive Income for the Three Years Ended December 31, 2017 | 64 | |
Consolidated Statements of Common Shareholders’ Equity for the Three Years Ended December 31, 2017 | 65 | |
Consolidated Statements of Cash Flows for the Three Years Ended December 31, 2017 | 66 | |
Consolidated Statements of Capitalization, December 31, 2017 and 2016 | 67 | |
Notes to Consolidated Financial Statements | 68 |
2. | Financial Statement Schedules |
SCHEDULE 1 - Condensed financial information of registrant | ||||||||
Otter Tail Corporation (PARENT COMPANY) | ||||||||
Condensed Balance Sheets, December 31 | ||||||||
(in thousands) | 2017 | 2016 | ||||||
Assets | ||||||||
Current Assets | ||||||||
Cash and Cash Equivalents | $ | 16,371 | $ | 6,218 | ||||
Accounts Receivable | -- | 12 | ||||||
Accounts Receivable from Subsidiaries | 2,098 | 1,706 | ||||||
Interest Receivable from Subsidiaries | 117 | 141 | ||||||
Income Taxes Receivable | -- | 662 | ||||||
Notes Receivable from Subsidiaries | 1,752 | 1,671 | ||||||
Other | 1,130 | 936 | ||||||
Total Current Assets | 21,468 | 11,346 | ||||||
Investments in Subsidiaries | 724,613 | 692,723 | ||||||
Notes Receivable from Subsidiaries | 79,611 | 79,843 | ||||||
Deferred Income Taxes | 27,923 | 35,387 | ||||||
Other Assets | 31,559 | 29,079 | ||||||
Total Assets | $ | 885,174 | $ | 848,378 | ||||
Liabilities and Equity | ||||||||
Current Liabilities | ||||||||
Short-Term Debt | $ | -- | $ | -- | ||||
Current Maturities of Long-Term Debt | 186 | 231 | ||||||
Accounts Payable to Subsidiaries | 6 | 5,958 | ||||||
Notes Payable to Subsidiaries | 61,908 | 38,519 | ||||||
Other | 7,799 | 5,838 | ||||||
Total Current Liabilities | 69,899 | 50,546 | ||||||
Other Noncurrent Liabilities | 38,319 | 32,556 | ||||||
Commitments and Contingencies | ||||||||
Capitalization | ||||||||
Long-Term Debt, Net of Current Maturities | 80,064 | 95,172 | ||||||
Common Shareholder Equity | 696,892 | 670,104 | ||||||
Total Capitalization | 776,956 | 765,276 | ||||||
Total Liabilities and Equity | $ | 885,174 | $ | 848,378 | ||||
See accompanying notes to condensed financial statements. | ||||||||
119
Otter Tail Corporation (PARENT COMPANY) | ||||||||||||
Condensed Statements of Income--For the Years Ended December 31 | ||||||||||||
(in thousands) | 2017 | 2016 | 2015 | |||||||||
Operating Loss | ||||||||||||
Revenue | $ | -- | $ | -- | $ | -- | ||||||
Operating Expenses | 8,353 | 9,689 | 10,188 | |||||||||
Operating Loss | (8,353 | ) | (9,689 | ) | (10,188 | ) | ||||||
Other Income (Expense) | ||||||||||||
Equity Income in Earnings of Subsidiaries | 82,715 | 67,047 | 66,067 | |||||||||
Interest Charges | (4,270 | ) | (6,817 | ) | (6,786 | ) | ||||||
Interest Charges to Subsidiaries | (244 | ) | (173 | ) | (193 | ) | ||||||
Interest Income from Subsidiaries | 2,848 | 4,897 | 4,786 | |||||||||
Other Income | 1,054 | 1,621 | 421 | |||||||||
Total Other Income | 82,103 | 66,575 | 64,295 | |||||||||
Income Before Income Taxes | 73,750 | 56,886 | 54,107 | |||||||||
Income Tax Expense (Benefit) | 1,311 | (5,435 | ) | (5,238 | ) | |||||||
Net Income | $ | 72,439 | $ | 62,321 | $ | 59,345 | ||||||
See accompanying notes to condensed financial statements. | ||||||||||||
Otter Tail Corporation (PARENT COMPANY) | ||||||||||||
Condensed Statements of Cash Flows--For the Years Ended December 31 | ||||||||||||
(in thousands) | 2017 | 2016 | 2015 | |||||||||
Cash Flows from Operating Activities | ||||||||||||
Net Cash Provided by Operating Activities | $ | 50,205 | $ | 83,296 | $ | 53,958 | ||||||
Cash Flows from Investing Activities | ||||||||||||
Return of Capital (Investment in Subsidiaries) | -- | 9,912 | (88,079 | ) | ||||||||
Debt Repaid by (Issued to) Subsidiaries | 151 | (3,309 | ) | (12,592 | ) | |||||||
Cash (Used in) Provided by Investing Activities | (121 | ) | 106 | (11 | ) | |||||||
Net Cash Provided by (Used in) Investing Activities | 30 | 6,709 | (100,682 | ) | ||||||||
Cash Flows from Financing Activities | ||||||||||||
Change in Checks Written in Excess of Cash | -- | (428 | ) | 213 | ||||||||
Net Short-Term (Repayments) Borrowings | -- | (59,666 | ) | 48,812 | ||||||||
Borrowings from (Repayments to) Subsidiaries | 23,389 | (60,948 | ) | 32,249 | ||||||||
Proceeds from Issuance of Common Stock | 4,349 | 44,435 | 14,233 | |||||||||
Common Stock Issuance Expenses | -- | (562 | ) | (451 | ) | |||||||
Payments for Retirement of Capital Stock | (1,799 | ) | (104 | ) | (1,596 | ) | ||||||
Proceeds from the Issuance of Long-Term Debt | -- | 130,000 | -- | |||||||||
Short-Term and Long-Term Debt Issuance Expenses | (158 | ) | (723 | ) | (312 | ) | ||||||
Payments for Retirement of Long-Term Debt | (15,231 | ) | (87,547 | ) | (201 | ) | ||||||
Dividends Paid and Other Distributions | (50,632 | ) | (48,244 | ) | (46,223 | ) | ||||||
Net Cash (Used in) Provided by Financing Activities | (40,082 | ) | (83,787 | ) | 46,724 | |||||||
Net Change in Cash and Cash Equivalents | 10,153 | 6,218 | -- | |||||||||
Cash and Cash Equivalents at Beginning of Period | 6,218 | -- | -- | |||||||||
Cash and Cash Equivalents at End of Period | $ | 16,371 | $ | 6,218 | $ | -- | ||||||
See accompanying notes to condensed financial statements. | ||||||||||||
120
Otter Tail Corporation (Parent Company)
Notes to Condensed Financial Statements
For the years ended December 31, 2017, 2016 and 2015
Incorporated by reference are Otter Tail Corporation’s consolidated statements of comprehensive income and common shareholders’ equity in Part II, Item 8.
Basis of Presentation
The condensed financial information of Otter Tail Corporation is presented to comply with Rule 12-04 of Regulation S-X. The unconsolidated condensed financial statements do not reflect all of the information and notes normally included with financial statements prepared in accordance with GAAP. Therefore, these condensed financial statements should be read with the consolidated financial statements and related notes included in this Annual Report on Form 10-K.
Otter Tail Corporation’s investments in subsidiaries are presented under the equity method of accounting. Under this method, the assets and liabilities of subsidiaries are not consolidated. The investments in net assets of the subsidiaries are recorded in the balance sheets. The income from operations of the subsidiaries is reported on a net basis as equity income in earnings of subsidiaries.
Related Party Transactions
As of December 31, 2017: (in thousands) | Accounts Receivable | Interest Receivable | Current Notes Receivable | Long-Term Notes Receivable | Accounts Payable | Current Notes Payable | ||||||||||||||||||
Otter Tail Power Company | $ | 2,067 | $ | -- | $ | -- | $ | -- | $ | 6 | $ | -- | ||||||||||||
Vinyltech Corporation | 2 | 17 | -- | 11,500 | -- | 20,603 | ||||||||||||||||||
Northern Pipe Products, Inc. | 4 | 8 | -- | 5,711 | -- | 8,186 | ||||||||||||||||||
BTD Manufacturing, Inc. | -- | 77 | -- | 52,000 | -- | 7,260 | ||||||||||||||||||
Wind Tower Business | -- | -- | 1,461 | -- | -- | -- | ||||||||||||||||||
Dock and Boatlift Business | -- | -- | 291 | -- | -- | -- | ||||||||||||||||||
T.O. Plastics, Inc. | -- | 15 | -- | 10,400 | -- | 13,446 | ||||||||||||||||||
Varistar Corporation | -- | -- | -- | -- | -- | 12,413 | ||||||||||||||||||
Otter Tail Assurance Limited | 25 | -- | -- | -- | -- | -- | ||||||||||||||||||
| $ | 2,098 | $ | 117 | $ | 1,752 | $ | 79,611 | $ | 6 | $ | 61,908 | |||||||||||||
As of December 31, 2016: (in thousands) | Accounts Receivable | Interest Receivable | Current Notes Receivable | Long-Term Notes Receivable | Accounts Payable | Current Notes Payable | ||||||||||||||||||
Otter Tail Power Company | $ | 1,572 | $ | -- | $ | -- | $ | -- | $ | 10 | $ | -- | ||||||||||||
Vinyltech Corporation | 3 | 20 | -- | 11,500 | -- | 15,951 | ||||||||||||||||||
Northern Pipe Products, Inc. | -- | 10 | -- | 5,943 | -- | 6,560 | ||||||||||||||||||
BTD Manufacturing, Inc. | -- | 92 | -- | 52,000 | -- | 2,342 | ||||||||||||||||||
Wind Tower Business | -- | -- | 1,441 | -- | -- | -- | ||||||||||||||||||
Dock and Boatlift Business | -- | -- | 230 | -- | -- | -- | ||||||||||||||||||
T.O. Plastics, Inc. | -- | 19 | -- | 10,400 | -- | 12,378 | ||||||||||||||||||
Varistar Corporation | 60 | -- | -- | -- | 5,948 | 1,288 | ||||||||||||||||||
Otter Tail Assurance Limited | 71 | -- | -- | -- | -- | -- | ||||||||||||||||||
| $ | 1,706 | $ | 141 | $ | 1,671 | $ | 79,843 | $ | 5,958 | $ | 38,519 | |||||||||||||
Dividends
Dividends paid to Otter Tail Corporation (the Parent) from its subsidiaries were as follows:
(in thousands) | 2017 | 2016 | 2015 | |||||||||
Cash Dividends Paid to Parent by Subsidiaries | $ | 50,571 | $ | 77,779 | $ | 46,188 | ||||||
See Otter Tail Corporation’s notes to consolidated financial statements in Part II, Item 8 for other disclosures.
Other schedules are omitted because of the absence of the conditions under which they are required, because the amounts are insignificant or because the information required is included in the financial statements or the notes thereto.
121
3. | Exhibits | |
| The following Exhibits are filed as part of, or incorporated by reference into, this report. |
Previously Filed | |||
File No. | As Exhibit No. | ||
2-A | 8-K filed 7/1/09 | 2.1 | |
2-B | 10-K/A for year ended 12/31/16 | 2-B | |
2-C | 10-K/A for year ended 12/31/16 | 2-C | |
3-A | 8-K filed 7/1/09 | 3.1 | |
3-B | 8-K filed 7/1/09 | 3.2 | |
4-A | 8-K filed 8/23/07 | 4.1 | |
4-A-1 | 8-K filed 12/20/07 | 4.3 | |
4-A-2 | 8-K filed 9/15/08 | 4.1 | |
4-A-3 | 8-K filed 7/1/09 | 4.2 | —Third Amendment, dated as of June 26, 2009, to Note Purchase Agreement dated as of August 20, 2007. |
4-B | 8-K filed 11/2/12 | 4.1 | |
4-B-1 | 8-K filed 11/1/13 | 4.1 | |
4-B-2 | 8-K filed 11/4/14 | 4.1 | |
4-B-3 | 8-K filed 11/3/15 | 4.1 | |
122
| Previously Filed | |||
| File No. | As Exhibit No. | ||
4-B-4 | 8-K filed 11/3/16 | 4.1 | |
4-B-5 | 8-K filed 11/2/17 | 4.1 | |
4-C | 8-K filed 11/2/12 | 4.2 | |
4-C-1 | 8-K filed 11/1/13 | 4.2 | |
4-C-2 | 8-K filed 11/4/14 | 4.2 | |
4-C-3 | 8-K filed 11/3/15 | 4.2 | |
4-C-4 | 8-K filed 11/3/16 | 4.2 | |
123
| Previously Filed | |||
| File No. | As Exhibit No. | ||
4-C-5 | 8-K filed 11/2/17 | 4.2 | |
4-D | 8-K filed 8/3/11 | 4.1 | |
4-E | 8-K filed 8/16/13 | 4.1 | |
4-F | 8-K filed 2/9/16 | 4.1 | |
4-G | 8-K filed 9/27/16 | 4.1 | |
4-H | 8-K filed 11/16/17 | 4.1 | |
10-A | 10-K for year ended 12/31/89 | 10-F | —Agreement for Sharing Ownership of Generating Plant by and between the Company, Montana-Dakota Utilities Co., and Northwestern Public Service Company (dated as of January 7, 1970). |
10-A-1 | 10-K for year ended 12/31/89 | 10-F-1 | —Letter of Intent for purchase of share of Big Stone Plant from Northwestern Public Service Company (dated as of May 8, 1984). |
10-A-2 | 10-K for year ended 12/31/91 | 10-F-2 | —Supplemental Agreement No. 1 to Agreement for Sharing Ownership of Big Stone Plant (dated as of July 1, 1983). |
10-A-3 | 10-K for year ended 12/31/91 | 10-F-3 | —Supplemental Agreement No. 2 to Agreement for Sharing Ownership of Big Stone Plant (dated as of March 1, 1985). |
10-A-4 | 10-K for year ended 12/31/91 | 10-F-4 | —Supplemental Agreement No. 3 to Agreement for Sharing Ownership of Big Stone Plant (dated as of March 31, 1986). |
10-A-5 | 10-Q for quarter ended 9/30/03 | 10.1 | |
10-A-6 | 10-K for year ended 12/31/92 | 10-F-5 | —Amendment I to Letter of Intent dated May 8, 1984, for purchase of share of Big Stone Plant. |
10-B | 10-Q for quarter ended 6/30/15 | 10.3 | |
10-C | 2-61043 | 5-H | —Agreement for Sharing Ownership of Coyote Station Generating Unit No. 1 by and between the Company, Minnkota Power Cooperative, Inc., Montana-Dakota Utilities Co., Northwestern Public Service Company and Minnesota Power & Light Company (dated as of July 1, 1977). |
10-C-1 | 10-K for year ended 12/31/89 | 10-H-1 | —Supplemental Agreement No. One, dated as of November 30, 1978, to Agreement for Sharing Ownership of Coyote Generating Unit No. 1. |
10-C-2 | 10-K for year ended 12/31/89 | 10-H-2 | —Supplemental Agreement No. Two, dated as of March 1, 1981, to Agreement for Sharing Ownership of Coyote Generating Unit No. 1 and Amendment No. 2 dated March 1, 1981, to Coyote Plant Coal Agreement. |
124
| Previously Filed | |||
| File No. | As Exhibit No. | ||
10-C-3 | 10-K for year ended 12/31/89 | 10-H-3 | —Amendment, dated as of July 29, 1983, to Agreement for Sharing Ownership of Coyote Generating Unit No. 1. |
10-C-4 | 10-K for year ended 12/31/92 | 10-H-4 | —Agreement, dated as of September 5, 1985, containing Amendment No. 3 to Agreement for Sharing Ownership of Coyote Generating Unit No. 1, dated as of July 1, 1977, and Amendment No. 5 to Coyote Plant Coal Agreement, dated as of January 1, 1978. |
10-C-5 | 10-Q for quarter ended 9/30/01 | 10-A | |
10-C-6 | 10-Q for quarter ended 9/30/03 | 10.2 | |
10-D | 10-K for year ended 12/31/12 | 10-J | |
10-D-1 | 8-K filed 1/31/14 | 10.1 | |
10-D-2 | 8-K filed 3/18/15 | 10.1 | |
10-E | 10-Q/A for quarter ended 6/30/13 | 10.1 | |
10-F-1 | 10-K for year ended 12/31/02 | 10-N-1 | |
10-F-1a | 10-K for year ended 12/31/10 | 10-N-1A | —First Amendment of Deferred Compensation Plan for Directors (2003 Restatement), as amended.* |
10-F-1b | 8-K filed 4/17/14 | 10.5 | —Second Amendment of Deferred Compensation Plan for Directors (2003 Restatement), as amended.* |
10-F-2 | 8-K filed 2/04/05 | 10.1 | —Executive Survivor and Supplemental Retirement Plan (2005 Restatement).* |
10-F-2a | 10-K for year ended 12/31/06 | 10-N-2a | —First Amendment of Executive Survivor and Supplemental Retirement Plan (2005 Restatement).* |
10-F-2b | 10-K for year ended 12/31/10 | 10-N-2B | —Second Amendment of Executive Survivor and Supplemental Retirement Plan (2005 Restatement).* |
10-F-3 | 10-Q for quarter ended 9/30/11 | 10.1 | |
10-F-4 | 10-Q for quarter ended 9/30/16 | 10.1 | |
10-F-5 | 8-K filed 4/13/06 | 10.4 | |
10-F-6 | 8-K filed 4/13/06 | 10.1 | |
10-F-7 | 10-K for year ended 12/31/13 | 10-O-12 | |
10-F-8 | 333-195337 | 4.1 | |
10-F-9 | 8-K filed 4/17/14 | 10.1 | |
125
| Previously Filed | |||
| File No. | As Exhibit No. | ||
10-F-10 | 8-K filed 4/17/14 | 10.2 | —Form of 2014 Restricted Stock Award Agreement for Executive Officers.* |
10-F-11 | 8-K filed 4/17/14 | 10.3 | —Form of 2014 Restricted Stock Award Agreement for Directors.* |
10-F-12 | 10-K for year ended 12/31/16 | 10-J-14 | |
10-F-13 | 8-K filed 2/11/15 | 10.1 | |
10-F-14 | 8-K filed 2/11/15 | 10.2 | |
10-F-15 | 8-K filed 2/11/15 | 10.3 | —Form of 2015 Restricted Stock Unit Award Agreement (Executives).* |
10-F-16 | 8-K filed 2/11/15 | 10.4 | —Form of 2015 Restricted Stock Unit Award Agreement (Legacy).* |
10-F-17 | 8-K filed 4/15/15 | 10.2 | —Form of 2015 Restricted Stock Award Agreement for Directors.* |
10-F-18 | 8-K filed 2/11/15 | 10.5 | —Otter Tail Corporation Executive Restoration Plus Plan, as Amended and Restated.* |
10-F-18a | 10-K for year ended 12/31/17 | 10-F-18a | —First Amendment of Otter Tail Corporation Executive Restoration Plus Plan* |
10-F-19 | 10-K for year ended 12/31/17 | 10-F-19 | |
10-G | 8-K filed 5/11/15 | 1.1 | |
10-H-1 | 10-K for year ended 12/31/12 | 10-O-1 | |
10-H-2 | 10-K for year ended 12/31/12 | 10-O-2 | |
10-I-1 | 10-K for year ended 12/31/10 | 10-Q-3 | |
10-I-2 | 10-K for year ended 12/31/10 | 10-Q-4 | |
10-I-3 | 10-K for year ended 12/31/11 | 10-Q-5 | |
10-I-4 | 10-Q for quarter ended 9/30/14 | 10.3 | |
10-I-5 | 10-Q for quarter ended 9/30/14 | 10.6 | |
10-I-6 | 10-K for year ended 12/31/15 | 10-R-6 | |
10-I-7 | 10-K for year ended 12/31/17 | 10-I-7 | |
10-J | 10-K for year ended 12/31/17 | 10-J | |
12.1 | 10-K for year ended 12/31/17 | 12.1 | —Calculation of Ratios of Earnings to Fixed Charges and Preferred Dividends. |
21-A | 10-K for year ended 12/31/17 | 21-A | |
23-A | 10-K for year ended 12/31/17 | 23-A | |
24-A | 10-K for year ended 12/31/17 | 24-A | |
126
| Previously Filed | |||
| File No. | As Exhibit No. | ||
| 31.1 | —Certification of Chief Executive Officer Pursuant to Section 302 of the Sarbanes-Oxley Act of 2002. | ||
| 31.2 | —Certification of Chief Financial Officer Pursuant to Section 302 of the Sarbanes-Oxley Act of 2002. | ||
| 32.1 | —Certification of Chief Executive Officer Pursuant to Section 906 of the Sarbanes-Oxley Act of 2002. | ||
| 32.2 | —Certification of Chief Financial Officer Pursuant to Section 906 of the Sarbanes-Oxley Act of 2002. | ||
101 | 10-K for year ended 12/31/17 | 101 | —Financial statements from the Annual Report on Form 10-K of Otter Tail Corporation for the year ended December 31, 2017, formatted in Extensible Business Reporting Language: (i) the Consolidated Balance Sheets, (ii) the Consolidated Statements of Income, (iii) the Consolidated Statements of Comprehensive Income, (iv) the Consolidated Statements of Common Shareholders’ Equity, (v) the Consolidated Statements of Cash Flows, (vi) the Consolidated Statements of Capitalization, (vii) the Notes to Consolidated Financial Statements and (viii) Schedule I. |
*Management contract, compensatory plan or arrangement required to be filed pursuant to Item 601(b)(10)(iii)(A) of Regulation S-K.
**Confidential information has been omitted from this Exhibit and filed separately with the Securities and Exchange Commission pursuant to a confidential treatment request under Rule 24b-2.
***Schedules and exhibits have been omitted pursuant to Item 601(b)(2) of Regulation S-K. The Company hereby undertakes to furnish copies of any of the omitted schedules and exhibits to the Securities and Exchange Commission upon request.
Pursuant to Item 601(b)(4)(iii) of Regulation S-K, copies of certain instruments defining the rights of holders of certain long-term debt of the Company are not filed, and in lieu thereof, the Company agrees to furnish copies thereof to the Securities and Exchange Commission upon request.
127
SIGNATURES
Pursuant to the requirements of Section 13 or 15(d) of the Securities Exchange Act of 1934, the registrant has duly caused this report to be signed on its behalf by the undersigned, thereunto duly authorized.
OTTER TAIL CORPORATION
By /s/ Kevin G. Moug
Kevin G. Moug
Chief Financial Officer and Senior Vice President
(authorized officer and principal financial officer)
Dated: February 22, 2018