UNITED STATES
SECURITIES AND EXCHANGE COMMISSION
Washington, D.C. 20549
|
| |
| ý | QUARTERLY REPORT PURSUANT TO SECTION 13 OR 15(d) OF THE SECURITIES EXCHANGE ACT OF 1934 |
For the quarterly period ended March 31, 2016
OR
|
| |
¨
| TRANSITION REPORT PURSUANT TO SECTION 13 OR 15(d) OF THE SECURITIES EXCHANGE ACT OF 1934 |
Commission file number 001-34456
|
| | | | |
| | COLONY CAPITAL, INC. (Exact Name of Registrant as Specified in Its Charter) | |
| | | | | |
| | Maryland | | 27-0419483 | |
| | (State or Other Jurisdiction of Incorporation or Organization) | | (I.R.S. Employer Identification No.) | |
| | | | |
515 South Flower Street, 44th Floor
Los Angeles, California 90071
(Address of Principal Executive Offices, Including Zip Code)
(310) 282-8820
(Registrant’s Telephone Number, Including Area Code)
Indicate by check mark whether the registrant: (1) has filed all reports required to be filed by Section 13 or 15(d) of the Securities Exchange Act of 1934 during the preceding 12 months (or for such shorter period that the registrant was required to file such reports), and (2) has been subject to such filing requirements for the past 90 days. Yes ý No ¨
Indicate by check mark whether the registrant has submitted electronically and posted on its corporate Web site, if any, every Interactive Data File required to be submitted and posted pursuant to Rule 405 of Regulation S-T (§232.405 of this chapter) during the preceding 12 months (or for such shorter period that the registrant was required to submit and post such files). Yes ý No ¨
Indicate by check mark whether the registrant is a large accelerated filer, an accelerated filer, a non-accelerated filer, or a smaller reporting company. See the definitions of “large accelerated filer,” “accelerated filer” and “smaller reporting company” in Rule 12b-2 of the Exchange Act. (Check one):
|
| | | | | | |
| Large Accelerated Filer | ý | | | Accelerated Filer | | ¨
|
| | | | | | | |
| Non-Accelerated Filer | ¨
| (Do not check if a smaller reporting company) | | Smaller Reporting Company | | ¨
|
Indicate by check mark whether the registrant is a shell company (as defined in Rule 12b-2 of the Exchange Act). Yes ¨ No ý
As of May 6, 2016, 113,206,171 shares of the Registrant's Class A common stock and 527,131 shares of Class B common stock were outstanding.
COLONY CAPITAL, INC.
TABLE OF CONTENTS
|
| | |
| | | Page |
| Item 1. | | |
| | | |
| | | |
| | | |
| | | |
| | | |
| | | |
| | | |
| | | |
| | | |
| | | |
| | | |
| | | |
| | | |
| | | |
| | | |
| | | |
| | | |
| | | |
| | | |
| | | |
| | | |
| | | |
| | | |
| | | |
| | | |
| | | |
| | | |
| | | |
| Item 2. | | |
| Item 3. | | |
| Item 4. | | |
| | | |
| | | |
| Item 1. | | |
| Item 1A. | | |
| Item 2. | | |
| Item 3. | | |
| Item 4. | | |
| Item 5. | | |
| Item 6. | | |
| |
PART I—FINANCIAL INFORMATION
ITEM 1. Financial Statements.
COLONY CAPITAL, INC.
CONDENSED CONSOLIDATED BALANCE SHEETS
(In thousands, except per share data)
|
| | | | | | | | |
| | | March 31, 2016 | | December 31, 2015 |
| | | (Unaudited) | |
| ASSETS | | | | |
| Cash | | $ | 171,300 |
| | $ | 185,854 |
|
| Loans receivable, net | | | | |
| Held for investment | | 4,067,544 |
| | 4,048,477 |
|
| Held for sale | | — |
| | 75,002 |
|
| Real estate assets, net | | | | |
| Held for investment | | 3,256,474 |
| | 3,132,218 |
|
| Held for sale | | 153,416 |
| | 297,887 |
|
| Investments in unconsolidated joint ventures | | 914,715 |
| | 924,465 |
|
| Goodwill | | 680,127 |
| | 678,267 |
|
| Deferred leasing costs and intangible assets, net (including $5,036 and $9,872 held for sale intangible assets, net) | | 328,120 |
| | 325,513 |
|
| Due from affiliates | | 7,020 |
| | 11,713 |
|
| Other assets (including $3,709 and $3,704 held for sale) | | 350,440 |
| | 359,914 |
|
| Total assets | | $ | 9,929,156 |
| | $ | 10,039,310 |
|
| LIABILITIES AND EQUITY | | | | |
| Liabilities: | | | | |
| Accrued and other liabilities (including $7,953 and $9,101 related to real estate held for sale) | | $ | 316,288 |
| | $ | 325,589 |
|
Due to affiliates—contingent consideration | | 43,211 |
| | 52,990 |
|
Due to affiliates—other | | 2,979 |
| | — |
|
| Dividends and distributions payable | | 66,037 |
| | 65,688 |
|
| Debt, net (including $32,098 and $8,769 related to real estate held for sale) | | 3,595,723 |
| | 3,587,724 |
|
| Convertible senior notes, net | | 591,508 |
| | 591,079 |
|
| Total liabilities | | 4,615,746 |
| | 4,623,070 |
|
| Commitments and contingencies (Note 20) | |
| |
|
| Equity: | | | | |
| Stockholders’ equity: | | | | |
| Preferred stock, $0.01 par value per share; $625,750 liquidation preference; 50,000 shares authorized; 25,030 shares issued and outstanding | | 250 |
| | 250 |
|
| Common stock, $0.01 par value per share | | | |
|
|
| Class A, 449,000 shares authorized; 112,550 and 111,694 shares issued and outstanding | | 1,126 |
| | 1,118 |
|
| Class B, 1,000 shares authorized; 546 and 546 shares issued and outstanding | | 5 |
| | 5 |
|
| Additional paid-in capital | | 2,998,378 |
| | 2,995,243 |
|
| Distributions in excess of earnings | | (158,387 | ) | | (131,278 | ) |
| Accumulated other comprehensive loss | | (16,579 | ) | | (18,422 | ) |
| Total stockholders’ equity | | 2,824,793 |
| | 2,846,916 |
|
| Noncontrolling interests in investment entities | | 2,065,728 |
| | 2,138,925 |
|
| Noncontrolling interests in Operating Company | | 422,889 |
| | 430,399 |
|
| Total equity | | 5,313,410 |
| | 5,416,240 |
|
| Total liabilities and equity | | $ | 9,929,156 |
| | $ | 10,039,310 |
|
The accompanying notes are an integral part of these condensed consolidated financial statements.
COLONY CAPITAL, INC.
CONDENSED CONSOLIDATED BALANCE SHEETS
(In thousands, except per share data)
The following table presents the assets and liabilities recorded in the consolidated balance sheets attributable to securitization vehicles consolidated as variable interest entities (excluding the Operating Company, as discussed in Note 4).
|
| | | | | | | | |
| | | March 31, 2016 | | December 31, 2015 |
| | | (Unaudited) | |
| Assets | | | | |
| Cash | | $ | 881 |
| | $ | 2,453 |
|
| Loans receivable, net | | 1,171,833 |
| | 1,193,859 |
|
| Real estate assets, net | | 8,953 |
| | 9,016 |
|
| Other assets | | 72,653 |
| | 94,796 |
|
| Total assets | | $ | 1,254,320 |
| | $ | 1,300,124 |
|
| Liabilities | | | | |
| Debt, net | | $ | 775,644 |
| | $ | 806,728 |
|
| Accrued and other liabilities | | 68,927 |
| | 80,619 |
|
| Total liabilities | | $ | 844,571 |
| | $ | 887,347 |
|
The accompanying notes are an integral part of these condensed consolidated financial statements.
COLONY CAPITAL, INC.
CONDENSED CONSOLIDATED STATEMENTS OF OPERATIONS
(In thousands, except per share data)
(Unaudited)
|
| | | | | | | | |
| | | Three Months Ended March 31, |
| | | 2016 | | 2015 |
| Income | | | | |
| Interest income | | $ | 89,361 |
| | $ | 46,137 |
|
| Property operating income | | 91,617 |
| | 43,793 |
|
| Equity in income of unconsolidated joint ventures | | 2,429 |
| | 26,349 |
|
| Fee income from affiliates | | 16,609 |
| | — |
|
| Other income (including $1,255 and $63 from affiliates, respectively) | | 3,202 |
| | 333 |
|
| Total income | | 203,218 |
| | 116,612 |
|
| Expenses | | | | |
| Management fees (including $0 and $5,897 of share-based payments, respectively) | | — |
| | 14,961 |
|
| Investment and servicing expenses (including $0 and $366 reimbursed to affiliates, respectively) | | 6,931 |
| | 2,253 |
|
| Transaction costs | | 4,490 |
| | 14,190 |
|
| Interest expense | | 41,871 |
| | 26,593 |
|
| Property operating expenses | | 30,786 |
| | 14,011 |
|
| Depreciation and amortization | | 46,142 |
| | 22,308 |
|
| Provision for loan losses | | 4,630 |
| | 364 |
|
| Impairment loss | | 2,079 |
| | 450 |
|
| Compensation expense (including $0 and $450 reimbursed to affiliates, respectively) | | 26,867 |
| | 615 |
|
| Administrative expenses (including $0 and $1,922 reimbursed to affiliates, respectively) | | 12,771 |
| | 4,166 |
|
| Total expenses | | 176,567 |
| | 99,911 |
|
| Gain on sale of real estate assets, net | | 51,119 |
| | — |
|
| Other gain, net | | 14,045 |
| | 164 |
|
| Income before income taxes | | 91,815 |
| | 16,865 |
|
| Income tax expense | | (784 | ) | | (650 | ) |
| Net income | | 91,031 |
| | 16,215 |
|
| Net income attributable to noncontrolling interests: | | | | |
| Investment entities | | 57,595 |
| | 5,686 |
|
| Operating Company | | 3,421 |
| | — |
|
| Net income attributable to Colony Capital, Inc. | | 30,015 |
| | 10,529 |
|
| Preferred dividends | | 11,880 |
| | 6,972 |
|
| Net income attributable to common stockholders | | $ | 18,135 |
| | $ | 3,557 |
|
| Net income per common share: | | | | |
| Basic | | $ | 0.16 |
| | $ | 0.03 |
|
| Diluted | | $ | 0.16 |
| | $ | 0.03 |
|
| Weighted average number of common shares outstanding: | | | | |
| Basic | | 111,660 |
| | 109,415 |
|
| Diluted | | 111,660 |
| | 109,415 |
|
| Dividends declared per common share | | $ | 0.40 |
| | $ | 0.37 |
|
The accompanying notes are an integral part of these condensed consolidated financial statements.
COLONY CAPITAL, INC.
CONDENSED CONSOLIDATED STATEMENTS OF COMPREHENSIVE INCOME
(In thousands)
(Unaudited)
|
| | | | | | | | |
| | | Three Months Ended March 31, |
| | | 2016 | | 2015 |
| Net income | | $ | 91,031 |
| | $ | 16,215 |
|
| Other comprehensive income (loss), net of tax: | | | | |
| Equity in other comprehensive income (loss) of unconsolidated joint ventures, net | | 11 |
| | (451 | ) |
| Net change in fair value of cash flow hedges | | (44 | ) | | (270 | ) |
| Foreign currency translation adjustments: | | | | |
| Foreign currency translation adjustment gain (loss) | | 29,568 |
| | (51,331 | ) |
| Change in fair value of net investment hedges | | (17,716 | ) | | 30,583 |
|
| Net foreign currency translation adjustments | | 11,852 |
| | (20,748 | ) |
| Other comprehensive income (loss) | | 11,819 |
| | (21,469 | ) |
| Comprehensive income (loss) | | 102,850 |
| | (5,254 | ) |
| Comprehensive income attributable to noncontrolling interests: | | | | |
| Investment entities | | 67,217 |
| | 2,096 |
|
| Operating Company | | 3,775 |
| | — |
|
| Comprehensive income (loss) attributable to stockholders | | $ | 31,858 |
| | $ | (7,350 | ) |
The accompanying notes are an integral part of these condensed consolidated financial statements.
COLONY CAPITAL, INC.
CONDENSED CONSOLIDATED STATEMENTS OF EQUITY
(In thousands)
(Unaudited)
|
| | | | | | | | | | | | | | | | | | | | | | | | | | | | | | | | | | | | |
| | | Preferred Stock | | Common Stock | | Additional Paid-in Capital | | Distributions in Excess of Earnings | | Accumulated Other Comprehensive Income (Loss) | | Total Stockholders’ Equity | | Noncontrolling Interests in Investment Entities | | Noncontrolling Interests in Operating Company | | Total Equity |
| | | | |
| Balance at December 31, 2014 | | $ | 135 |
| | $ | 1,096 |
| | $ | 2,512,743 |
| | $ | (68,003 | ) | | $ | (28,491 | ) | | $ | 2,417,480 |
| | $ | 518,313 |
| | $ | — |
| | $ | 2,935,793 |
|
| Net income | | — |
| | — |
| | — |
| | 10,529 |
| | — |
| | 10,529 |
| | 5,686 |
| | — |
| | 16,215 |
|
| Other comprehensive loss | | — |
| | — |
| | — |
| | — |
| | (17,879 | ) | | (17,879 | ) | | (3,590 | ) | | — |
| | (21,469 | ) |
| Share-based compensation | | — |
| | 7 |
| | 5,979 |
| | — |
| | — |
| | 5,986 |
| | — |
| | — |
| | 5,986 |
|
| Contributions from noncontrolling interests | | — |
| | — |
| | — |
| | — |
| | — |
| | — |
| | 7,574 |
| | — |
| | 7,574 |
|
| Distributions to noncontrolling interests | | — |
| | — |
| | — |
| | — |
| | — |
| | — |
| | (8,160 | ) | | — |
| | (8,160 | ) |
| Preferred stock dividends | | — |
| | — |
| | — |
| | (6,972 | ) | | — |
| | (6,972 | ) | | — |
| | — |
| | (6,972 | ) |
| Common stock dividends declared ($0.37 per share) | | — |
| | — |
| | — |
| | (40,798 | ) | | — |
| | (40,798 | ) | | — |
| | — |
| | (40,798 | ) |
| Balance at March 31, 2015 | | $ | 135 |
| | $ | 1,103 |
| | $ | 2,518,722 |
| | $ | (105,244 | ) | | $ | (46,370 | ) | | $ | 2,368,346 |
| | $ | 519,823 |
| | $ | — |
| | $ | 2,888,169 |
|
| | | | | | | | | | | | | | | | | | | |
| Balance at December 31, 2015 | | $ | 250 |
| | $ | 1,123 |
| | $ | 2,995,243 |
| | $ | (131,278 | ) | | $ | (18,422 | ) | | $ | 2,846,916 |
| | $ | 2,138,925 |
| | $ | 430,399 |
| | $ | 5,416,240 |
|
| Net income | | — |
| | — |
| | — |
| | 30,015 |
| | — |
| | 30,015 |
| | 57,595 |
| | 3,421 |
| | 91,031 |
|
| Other comprehensive income | | — |
| | — |
| | — |
| | — |
| | 1,843 |
| | 1,843 |
| | 9,622 |
| | 354 |
| | 11,819 |
|
| Repurchase of preferred stock | | (10 | ) | | — |
| | (19,988 | ) | | — |
| | — |
| | (19,998 | ) | | — |
| | — |
| | (19,998 | ) |
| Reissuance of preferred stock to an equity method investee | | 10 |
| | — |
| | 19,988 |
| | — |
| | — |
| | 19,998 |
| | — |
| | — |
| | 19,998 |
|
| Share-based compensation | | — |
| | 10 |
| | 3,409 |
| | — |
| | — |
| | 3,419 |
| | — |
| | — |
| | 3,419 |
|
| Shares canceled for tax withholding on vested stock awards | | — |
| | (2 | ) | | (2,860 | ) | | — |
| | — |
| | (2,862 | ) | | — |
| | — |
| | (2,862 | ) |
| Contributions from noncontrolling interests | | — |
| | — |
| | — |
| | — |
| | — |
| | — |
| | 44,363 |
| | — |
| | 44,363 |
|
| Distributions to noncontrolling interests | | — |
| | — |
| | — |
| | — |
| | — |
| | — |
| | (184,777 | ) | | (8,699 | ) | | (193,476 | ) |
| Preferred stock dividends | | — |
| | — |
| | — |
| | (11,880 | ) | | — |
| | (11,880 | ) | | — |
| | — |
| | (11,880 | ) |
| Common stock dividends declared ($0.40 per share) | | — |
| | — |
| | — |
| | (45,244 | ) | | — |
| | (45,244 | ) | | — |
| | — |
| | (45,244 | ) |
| Reallocation of equity of Operating Company (Note 15) | | — |
| | — |
| | 2,586 |
| | — |
| | — |
| | 2,586 |
| | — |
| | (2,586 | ) | | — |
|
| Balance at March 31, 2016 | | $ | 250 |
| | $ | 1,131 |
| | $ | 2,998,378 |
| | $ | (158,387 | ) | | $ | (16,579 | ) | | $ | 2,824,793 |
| | $ | 2,065,728 |
| | $ | 422,889 |
| | $ | 5,313,410 |
|
The accompanying notes are an integral part of these condensed consolidated financial statements.
COLONY CAPITAL, INC.
CONDENSED CONSOLIDATED STATEMENTS OF CASH FLOWS
(In thousands)
(Unaudited)
|
| | | | | | | | |
| | | Three Months Ended March 31, |
| | | 2016 | | 2015 |
| Cash Flows from Operating Activities | | | | |
| Net income | | $ | 91,031 |
| | $ | 16,215 |
|
| Adjustments to reconcile net income to net cash provided by operating activities: | | | | |
| Amortization of discount and net origination fees on purchased and originated loans | | (2,155 | ) | | (5,073 | ) |
| Paid-in-kind interest added to loan principal | | (9,435 | ) | | (1,547 | ) |
| Straight-line rents | | (3,645 | ) | | (2,978 | ) |
| Amortization of above and below market lease values, net | | 967 |
| | 1,023 |
|
| Amortization of deferred financing costs | | 5,959 |
| | 4,416 |
|
| Equity in income of unconsolidated joint ventures | | (2,429 | ) | | (26,349 | ) |
| Distributions of income from unconsolidated joint ventures | | 6,736 |
| | 24,393 |
|
| Provision for loan losses | | 4,630 |
| | 364 |
|
| Impairment of real estate and intangible assets | | 2,079 |
| | 450 |
|
| Depreciation and amortization | | 46,142 |
| | 22,308 |
|
| Share-based compensation | | 3,419 |
| | 5,986 |
|
| Change in fair value of contingent consideration | | (9,779 | ) | | — |
|
| Gain on sales of real estate assets, net | | (51,119 | ) | | — |
|
| Changes in operating assets and liabilities: | | | | |
| Decrease in due from affiliates | | 2,430 |
| | — |
|
| Decrease (increase) in other assets | | 1,409 |
| | (4,409 | ) |
| (Decrease) increase in accrued and other liabilities | | (6,988 | ) | | 25,935 |
|
| Increase (decrease) in due to affiliates | | 2,979 |
| | (1,808 | ) |
| Other adjustments, net | | (4,554 | ) | | (1,005 | ) |
| Net cash provided by operating activities | | 77,677 |
| | 57,921 |
|
| Cash Flows from Investing Activities | | | | |
| Contributions to unconsolidated joint ventures | | (14,278 | ) | | (207,297 | ) |
| Distributions from unconsolidated joint ventures | | 20,242 |
| | 71,632 |
|
| Net disbursements on originated loans | | (73,056 | ) | | (121,463 | ) |
| Repayments of loans receivable | | 57,383 |
| | 26,842 |
|
| Proceeds from sales of loans receivable | | 75,000 |
| | — |
|
| Cash receipts in excess of accretion on purchased credit impaired loans | | 20,738 |
| | 62,823 |
|
| Disbursements on acquisition of real estate assets, related intangibles and leasing commissions | | (119,934 | ) | | (225,655 | ) |
| Proceeds from sales of real estate assets | | 168,715 |
| | — |
|
| Other investing activities, net | | (1,421 | ) | | 1,793 |
|
| Net cash provided by (used in) investing activities | | $ | 133,389 |
| | $ | (391,325 | ) |
COLONY CAPITAL, INC.
CONDENSED CONSOLIDATED STATEMENTS OF CASH FLOWS (Continued)
(In thousands)
(Unaudited)
|
| | | | | | | | |
| | | Three Months Ended March 31, |
| | | 2016 | | 2015 |
| Cash Flows from Financing Activities | | | | |
| Dividends paid to preferred stockholders | | $ | (12,093 | ) | | $ | (6,972 | ) |
| Dividends paid to common stockholders | | (44,896 | ) | | (40,565 | ) |
| Line of credit borrowings | | 152,000 |
| | 297,400 |
|
| Line of credit repayments | | (163,400 | ) | | (63,000 | ) |
| Proceeds from secured financing | | 227,372 |
| | 165,521 |
|
| Secured financing repayments | | (226,945 | ) | | (91,778 | ) |
| Payment of deferred financing costs | | (10,298 | ) | | (2,848 | ) |
| Contributions from noncontrolling interests | | 44,363 |
| | 7,574 |
|
| Distributions to noncontrolling interests | | (193,476 | ) | | (8,160 | ) |
| Repurchase of preferred stock | | (19,998 | ) | | — |
|
| Reissuance of preferred stock to an equity method investee | | 19,998 |
| | — |
|
| Other financing activities, net | | — |
| | (1,539 | ) |
| Net cash (used in) provided by financing activities | | (227,373 | ) | | 255,633 |
|
| Effect of exchange rates on cash | | 1,753 |
| | 131 |
|
| Net decrease in cash | | (14,554 | ) | | (77,640 | ) |
| Cash, beginning of period | | 185,854 |
| | 141,936 |
|
| Cash, end of period | | $ | 171,300 |
| | $ | 64,296 |
|
| | | | | |
| SUPPLEMENTAL DISCLOSURE OF CASH FLOW INFORMATION: | | | | |
| Cash paid for interest | | $ | 31,914 |
| | $ | 20,506 |
|
| Cash paid for income taxes | | $ | 944 |
| | $ | 428 |
|
| SUPPLEMENTAL DISCLOSURE OF NONCASH INVESTING AND FINANCING ACTIVITIES: | | | | |
| Dividends payable | | $ | 66,037 |
| | $ | 47,770 |
|
| Accrued and other liabilities assumed in connection with acquisitions, net of cash assumed | | $ | — |
| | $ | 407 |
|
The accompanying notes are an integral part of these condensed consolidated financial statements.
COLONY CAPITAL, INC.
NOTES TO CONDENSED CONSOLIDATED FINANCIAL STATEMENTS
March 31, 2016
(Unaudited)
1. Organization
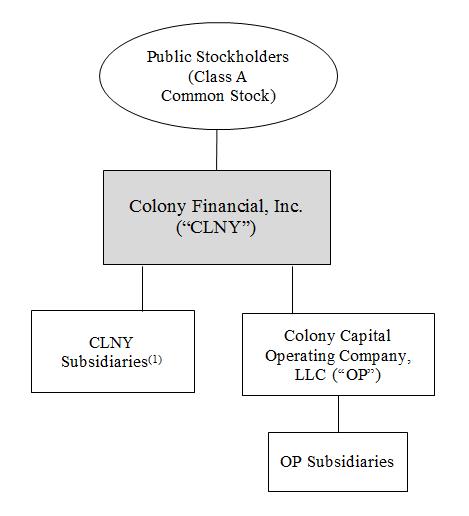
Colony Capital, Inc. (formerly, Colony Financial, Inc.) (the “Company”) is a leading global real estate and investment management firm that targets attractive risk-adjusted returns for its investors by investing primarily in real estate and real estate-related assets. The Company manages capital on behalf of both its shareholders and limited partners in private investment funds under its management where the Company may earn management fees and carried interests. The Company's portfolio is composed primarily of: (i) real estate equity; (ii) real estate and real estate-related debt; and (iii) investment management of Company-sponsored private equity funds and vehicles. The Company was organized on June 23, 2009 as a Maryland corporation and has elected to be taxed as a real estate investment trust ("REIT") under the Internal Revenue Code, for U.S. federal income tax purposes.
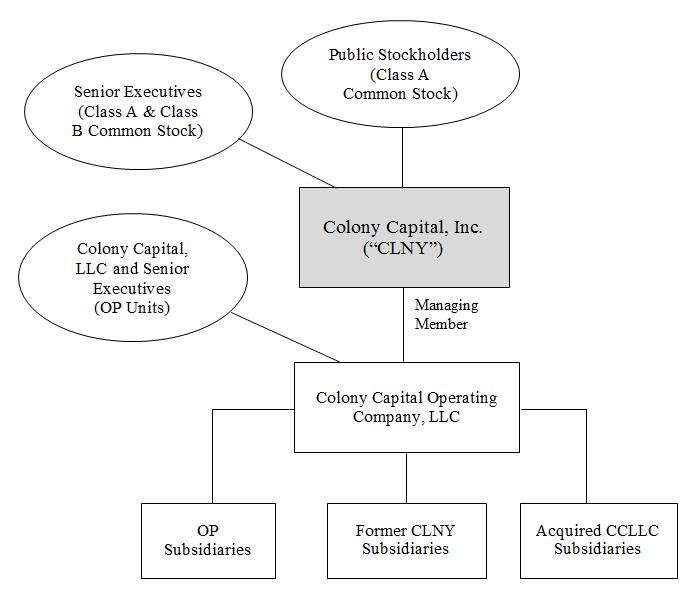
Prior to April 2, 2015, the Company was externally managed and advised by Colony Financial Manager, LLC (the "Manager"), which was a wholly-owned subsidiary of Colony Capital, LLC ("CCLLC"), a privately held global real estate investment firm. On April 2, 2015, Colony Capital Operating Company, LLC ("Operating Company" or “OP”), an operating subsidiary of the Company, acquired substantially all of the real estate investment management business and operations of CCLLC (the "Combination") and the Company became a self-managed REIT. As a result of the Combination, the Company is able to sponsor new investment vehicles as general partner under the Colony name. Details of the Combination are described more fully in Note 3.
In connection with the Combination, the Company reorganized into an umbrella partnership real estate investment trust ("UPREIT"). As part of the restructuring, the Company contributed to OP and its subsidiaries substantially all of the Company's other subsidiaries, assets and liabilities, other than certain indebtedness, in exchange for membership interests in OP ("OP Units"). Following the Combination, OP conducts all of the activities and owns substantially all of the assets and liabilities of the combined business.
2. Significant Accounting Policies
The significant accounting policies of the Company are described below. The accounting policies of the Company's unconsolidated joint ventures are substantially similar to those of the Company.
Basis of Presentation
The accompanying unaudited interim financial statements have been prepared in accordance with the instructions to Form 10-Q and Article 10 of Regulation S-X. Accordingly, they do not include all information and footnotes required by accounting principles generally accepted in the United States of America (“GAAP”) for complete financial statements. These statements reflect all normal and recurring adjustments which, in the opinion of management, are necessary to present fairly the financial position, results of operations and cash flows of the Company for the interim periods presented. However, the results of operations for the interim period presented are not necessarily indicative of the results that may be expected for the year ending December 31, 2016 or any other future period. These interim financial statements should be read in conjunction with the audited consolidated financial statements and notes thereto included in the Company’s Annual Report on Form 10-K for the year ended December 31, 2015, as amended.
Principles of Consolidation
The accompanying condensed consolidated financial statements include the accounts of the Company and its controlled subsidiaries, including consolidated variable interest entities. All significant intercompany accounts and transactions have been eliminated. The portions of the equity, net income and other comprehensive income of consolidated subsidiaries that are not attributable to the parent are presented separately as amounts attributable to noncontrolling interests in the consolidated financial statements. A substantial portion of noncontrolling interests represent interests held by private investment funds or other investment vehicles managed by the Company and which invest alongside the Company ("Co-Investment Funds") and membership interests in OP held by affiliates and senior executives.
The Company consolidates entities in which it has a controlling financial interest, by first considering if an entity meets the definition of a variable interest entity ("VIE") for which the Company is deemed to be the primary beneficiary, or otherwise, if the Company controls an entity through a majority of voting interest.
Variable Interest—A variable interest in an entity is an economic arrangement that absorbs economic risks and rewards of the entity. For entities in which the Company has a variable interest, the Company determines if the entity is a VIE by considering whether the entity’s equity investment at risk is sufficient to finance its activities without additional subordinated financial support and whether the entity’s at-risk equity holders have the characteristics of a controlling financial interest. In performing the analysis of whether the Company is the primary beneficiary of a VIE, the Company considers whether it individually has the power to direct the activities of the VIE that most significantly affect the entity’s performance and also has the obligation to absorb losses or the right to receive benefits of the VIE that could potentially be significant to the VIE. The Company also considers interests held by its related parties, including de facto agents. The Company assesses whether it is a member of a related party group that collectively meets the power and benefits criteria and, if so, whether the Company is most closely associated with the VIE. In performing its analysis, the Company considers both qualitative and quantitative factors, including, but not limited to: the amount and characteristics of its investment relative to other investors; the Company’s and the other investors’ ability to control or significantly influence key decisions of the VIE including consideration of involvement by de facto agents; the obligation or likelihood for the Company or other investors to fund operating losses of the VIE; and the similarity and significance of the VIE’s business activities to those of the Company and the other investors. The determination of whether an entity is a VIE, and whether the Company is the primary beneficiary, involves significant judgment, including the determination of which activities most significantly affect the entities’ performance, and estimates about the current and future fair values and performance of assets held by the VIE.
Voting Interest—Unlike VIEs, voting interest entities have sufficient equity and equity investors exhibit the characteristics of a controlling financial interest through their voting rights. The Company consolidates such entities when it has a controlling financial interest through ownership of a majority of the entities' voting equity interests.
At each reporting period, the Company reassesses the status of an entity as a VIE and the determination of the Company as the primary beneficiary, or if there is a change in the Company's ability to control through a majority voting interest. Changes in consolidation status are applied prospectively. An entity may be consolidated as a result of this reassessment, in which case, the assets, liabilities and noncontrolling interest in the entity are recorded at fair value upon initial consolidation. Any existing equity interest held by the Company in the entity prior to the Company obtaining control will be remeasured at fair value, which may result in a gain or loss recognized upon initial consolidation. The Company may also deconsolidate a subsidiary as a result of this reassessment, which may result in a gain or loss recognized upon deconsolidation depending on the carrying values of deconsolidated assets and liabilities compared to the fair value of any retained interests.
Use of Estimates
The preparation of financial statements in conformity with GAAP requires management to make estimates and assumptions that affect the reported amounts of assets, liabilities, and disclosure of contingent assets and liabilities at the date of the financial statements and the reported amounts of income and expenses during the reporting period. Actual results could differ from those estimates.
Foreign Currency
Assets and liabilities of non-U.S. dollar functional currency investments and subsidiaries are translated into U.S. dollars using exchange rates in effect at the balance sheet date. Income and expenses from these investments and subsidiaries are translated at the average rate of exchange prevailing during the period such income was earned or expenses were incurred. Gains and losses related to translation of these non-U.S dollar functional currency items are included in other comprehensive income or loss within stockholders’ equity. Upon sale, complete or substantially complete liquidation of an investment in a foreign subsidiary, or upon partial sale of an equity method investment, the translation adjustment associated with the investment, or the proportionate share related to the portion of equity method investment sold, is reclassified from accumulated other comprehensive income or loss into earnings.
Gains and losses resulting from nonfunctional currency transactions are recognized in the income statement in other gain (loss), net.
Disclosures of non-US dollar amounts to be recorded in the future are translated using exchange rates in effect at balance sheet date.
Business Combinations
The Company evaluates each purchase transaction to determine whether the acquired assets meet the definition of a business. Net cash paid to acquire a business or assets is classified as investing activities on the accompanying statements of cash flows.
The Company accounts for business combinations by applying the acquisition method. Transaction costs related to acquisition of a business are expensed as incurred and excluded from the fair value of consideration transferred. The
identifiable assets acquired, liabilities assumed and noncontrolling interests in acquired entity are recognized and measured at their estimated fair values. The excess of the fair value of consideration transferred over the fair values of identifiable assets acquired, liabilities assumed and noncontrolling interests in an acquired entity, net of fair value of any previously held interest in the acquired entity, is recorded as goodwill. Such valuations require management to make significant estimates and assumptions, especially with respect to intangible assets and liabilities.
For acquisitions that are not deemed to be businesses, the assets acquired are recognized based on their cost to the Company as the acquirer and no gain or loss is recognized unless the fair value of non-cash assets given as consideration differs from the carrying amount of the assets acquired. The cost of assets acquired in a group is allocated to individual assets within the group based on their relative fair values and does not give rise to goodwill. Transaction costs related to acquisition of assets are included in the cost basis of the assets acquired.
Contingent consideration is classified as a liability or equity, as applicable. Contingent consideration in connection with the acquisition of a business is measured at fair value on acquisition date, and unless classified as equity, is remeasured at fair value each reporting period thereafter until the consideration is settled, with changes in fair value included in net income. For contingent consideration in connection with the acquisition of assets, subsequent changes to the recorded amount are adjusted against the cost of the acquisition.
Real estate acquisitions, which are considered as either business combinations or asset acquisitions, are recorded at the fair values of the acquired components at the time of acquisition, allocated among land, building, improvements, equipment, lease-related tangible and identifiable intangible assets and liabilities, such as tenant improvements, deferred leasing costs, in-place lease values, above- and below-market lease values. The estimated fair value of acquired land is derived from recent comparable sales of land and listings within the same local region based on available market data. The estimated fair value of acquired buildings and building improvements is derived from comparable sales, discounted cash flow analysis using market-based assumptions, or replacement cost, as appropriate. The fair value of site and tenant improvements is estimated based upon current market replacement costs and other relevant market rate information.
Reclassification
Certain immaterial prior period amounts on the condensed consolidated statement of operations have been reclassified to conform to current period presentation.
Recent Accounting Updates
Revenue Recognition—In May 2014, the Financial Accounting Standards Board (“FASB”) issued Accounting Standards Update ("ASU") No. 2014-09, Revenue from Contracts with Customers, which amends existing revenue recognition standards, by establishing principles for recognizing revenue upon the transfer of promised goods or services to customers at an amount reflecting the consideration a company expects to receive in exchange for those goods or services. The new revenue standard may be applied retrospectively to each prior period presented or retrospectively with the cumulative effect as of the date of initial application recognized in retained earnings. ASU No. 2014-09 was originally effective for fiscal years beginning after December 15, 2016 and interim periods therein. In July 2015, the FASB deferred the effective date of the new standard by one year to fiscal years and interim periods beginning after December 15, 2017. Early adoption is permitted but not before the original effective date. In March 2016, the FASB issued amendments to clarify the principal versus agent assessment in the new revenue guidance, which affects whether revenue is recorded on a gross or net basis. The amendments have the same effective date and transition requirements as the new standard. The Company is currently evaluating the potential impact of adopting this new guidance on its consolidated financial statements.
Financial Instruments—In January 2016, the FASB issued ASU No. 2016-01, Recognition and Measurement of Financial Assets and Financial Liabilities, which affects accounting for investments in equity securities and financial liabilities under fair value option as well as presentation and disclosures, but does not affect accounting for investments in debt securities and loans. Key provisions include elimination of available for sale classification and cost method accounting, requiring investments in equity securities to be measured at fair value through earnings, unless an election is made to measure equity securities without readily determinable fair values at cost less impairment. ASU No. 2016-01 is effective for fiscal years and interim periods beginning after December 15, 2017. Early adoption is limited to specific provisions. ASU 2016-01 is to be applied retrospectively with cumulative effect as of the beginning of the first reporting period adopted recognized in retained earnings, except for amendments related to equity investments without readily determinable fair values and disclosure requirements, which are to be applied prospectively. The Company is currently evaluating the potential impact of adopting this new guidance on its consolidated financial statements.
Leases—In February 2016, the FASB issued ASU No. 2016-02, Leases, which amends existing lease accounting standards, primarily requiring lessees to recognize most leases on balance sheet through a right-of-use asset and a lease liability, as well as making targeted changes to lessor accounting, including a new model for sale-leaseback transactions that is applicable to both lessors and lessees. ASU No. 2016-02 is effective for fiscal years and interim periods beginning after
December 31, 2018. Early adoption is permitted. The new leases standard requires adoption using a modified retrospective approach for all leases existing at, or entered into after, the date of initial application, and provides for certain practical expedients. Full retrospective application is prohibited. Transition will require application of the new guidance at the beginning of the earliest comparative period presented. The Company is currently evaluating the impact of adopting this new guidance on its consolidated financial statements.
Derivative Novation—In March 2016, the FASB issued ASU No. 2016-05, Effect of Derivative Contract Novations on Existing Hedge Accounting Relationships, which clarifies that a change in the derivative counterparty does not, in and of itself, represent a termination of the original derivative or a change in critical terms of the hedging relationship. As a result, a hedging relationship would not be dedesignated as long as all of the other hedge accounting criteria are met when considering the credit worthiness of the new counterparty. ASU No. 2016-05 is effective for fiscal years and interim periods beginning after December 15, 2016. Early adoption is permitted, including interim periods. The new guidance may be adopted prospectively or on a modified retrospective basis to derivatives outstanding in the periods presented that were previously dedesignated due to a novation. The Company adopted the new guidance effective March 31, 2016 on a prospective basis. The adoption did not have an impact on the consolidated financial statements.
Equity Method—In March 2016, the FASB issued ASU No. 2016-07, Simplifying the Transition to the Equity Method of Accounting, which eliminates retrospective application of the equity method to prior periods that the investment was held before the investor obtained significant influence over the investee. ASU No. 2016-07 is effective for fiscal years beginning after December 15, 2016 and interim periods therein, to be applied prospectively. Early adoption is permitted, including interim periods. The Company adopted the new guidance effective March 31, 2016. The adoption did not have an impact on the consolidated financial statements.
Share-Based Compensation—In March 2016, the FASB issued ASU No. 2016-09, Improvements to Share-Based Payment Accounting, which amends certain aspects of accounting for share-based payments to employees. This includes accounting for income tax effects in the income statement, increasing the fair value of shares applied for income tax withholding without triggering liability accounting, allowing forfeitures related to service condition to be recognized upon occurrence, as well as changes in cash flow classifications. This guidance may be adopted prospectively or on a modified retrospective transition basis depending on the requirements of each provision. ASU No. 2016-09 is effective for fiscal years and interim periods beginning after December 15, 2016. Early adoption is permitted, with all provisions within the guidance to be adopted in the same period. If early adopted in an interim period, adjustments are to be reflected as of the beginning of the fiscal year of adoption. The Company is currently evaluating the impact of adopting this new guidance on its consolidated financial statements.
3. Combination with Colony Capital
On April 2, 2015, pursuant to agreements dated December 23, 2014, OP completed its acquisition of the CCLLC trademark name and substantially all of its real estate investment management business and operations, excluding those conducted exclusively in connection with then Colony American Homes, Inc. (now Colony Starwood Homes—see Note 21). The Combination was subject to approval of two-thirds of the Company’s non-affiliated shareholders, which was received at a special meeting of shareholders held on March 31, 2015.
Upon consummation of the Combination, CCLLC's personnel became employees of the Company and the Company became an internally managed REIT. The Company plans to sponsor new investment vehicles as general partner under the Colony name. In addition, the Company changed its name from Colony Financial, Inc. to Colony Capital, Inc. The Company’s common stock, which was reclassified as Class A Common Stock, continues to be listed on the NYSE under the ticker symbol “CLNY.”
Mr. Thomas J. Barrack, Jr., Executive Chairman, and Mr. Richard B. Saltzman, Chief Executive Officer and President, have entered into 5-year employment agreements and related lock-up arrangements with the Company, which, subject to certain exceptions, will generally restrict them from transferring their respective interests in OP Units and/or shares received in connection with the Combination over the same period as their respective employment agreement terms, which restriction would be ratably reduced over such period. Messrs. Barrack and Saltzman also have entered into non-competition arrangements with the Company, each of which will provide for clawback as to a material portion of consideration in the event such individuals violate the non-compete restrictions during the same period as their respective lock-ups. The employment agreements, and related lock-ups and non-competition arrangements became effective at the closing of the Combination.
The consideration for the Combination consisted of an upfront and a contingent portion, as follows:
| |
| • | Upfront consideration paid in a combination of 1.43 million shares of Class A Common Stock, 563,987 shares of newly created Class B Common Stock and 21.34 million of OP Units, measured based upon the closing price of the |
Company’s common stock of $26.19 on April 1, 2015, as well as $61.4 million of cash payments made for working capital, transaction costs incurred on behalf of CCLLC and tax withholding on behalf of Mr. Saltzman. The aggregate upfront consideration was valued at $672.3 million.
| |
| • | Contingent consideration to be paid in a combination of up to approximately 1.02 million shares of Class A Common Stock, 90,991 shares of Class B Common Stock and approximately 3.47 million OP Units, subject to multi-year performance targets for achievement of a contractually-defined funds from operations per share target and capital-raising thresholds from the funds management business. If the minimum performance target for either of these metrics is not met or exceeded, a portion of the contingent consideration paid in respect of the other metric would not be paid out in full. |
Each share of Class B Common Stock and each OP Unit is, at the holder’s option, convertible into one share of Class A Common Stock, subject, in the case of OP Units, to the terms and conditions set forth in the operating agreement of OP.
The following table summarizes the total consideration and allocation to assets acquired and liabilities assumed. In the first quarter of 2016, measurement period adjustments were identified that impacted provisional accounting, specifically adjustments to payroll accrual, valuation of investment management contract intangible asset and related impact to deferred tax liability, which increased goodwill by approximately $1.9 million, as presented in the table below.
|
| | | | | | | | | | | |
| (In thousands) | As Reported At December 31, 2015 | | Measurement Period Adjustments (1) | | Final Adjusted Amounts At March 31, 2016 |
| Consideration | | | | | |
| Cash | $ | 61,350 |
| | $ | — |
| | $ | 61,350 |
|
| Class A and Class B common stock issued | 52,160 |
| | — |
| | 52,160 |
|
| OP Units issued | 558,794 |
| | — |
| | 558,794 |
|
Estimated fair value of contingent consideration (2) | 69,500 |
| | — |
| | 69,500 |
|
| | $ | 741,804 |
| | $ | — |
| | $ | 741,804 |
|
| Identifiable assets acquired and liabilities assumed | | | | | |
| Cash | $ | 5,015 |
| | $ | — |
| | $ | 5,015 |
|
| Fixed assets | 46,396 |
| | — |
| | 46,396 |
|
| Other assets | 23,300 |
| | — |
| | 23,300 |
|
| Intangible asset: | | | | | |
| Investment management contracts | 46,000 |
| | (1,900 | ) | | 44,100 |
|
| Customer relationships | 46,800 |
| | — |
| | 46,800 |
|
| Trade name | 15,500 |
| | — |
| | 15,500 |
|
| Notes payable | (44,337 | ) | | — |
| | (44,337 | ) |
| Deferred tax liability | (35,920 | ) | | 729 |
| | (35,191 | ) |
| Other liabilities | (19,217 | ) | | (689 | ) | | (19,906 | ) |
| | 83,537 |
| | (1,860 | ) | | 81,677 |
|
| Goodwill | 658,267 |
| | 1,860 |
| | 660,127 |
|
| | $ | 741,804 |
| | $ | — |
| | $ | 741,804 |
|
__________
| |
(1) | The estimated fair values and purchase price allocation on April 2, 2015 were subject to retrospective adjustments during the measurement period, which ended on April 1, 2016, based upon new information obtained about facts and circumstances that existed as of the date of acquisition. |
| |
(2) | Estimated fair value of contingent consideration is subject to remeasurement each reporting period, as discussed in Note 13. |
See Note 8 for discussions related to identifiable intangible assets and goodwill, and Note 13 for fair value measurement of contingent consideration.
Pro Forma Results (Unaudited)
The following table presents pro forma results of the Company as if the Combination had been consummated on January 1, 2014. The amounts have been calculated pursuant to the application of the Company’s accounting policies and adjusting the results of CCLLC's operations to reflect additional compensation expense, depreciation and amortization, income tax, and after eliminating intercompany transactions of the combined entities and allocation of net income to OP Units. The pro forma results for the three months ended March 31, 2015 were adjusted to exclude acquisition-related expenses of approximately $14.1 million. The pro forma results are not indicative of future operating results.
|
| | | | |
| (In thousands, except per share data) | | Three Months Ended March 31, 2015 |
| Pro forma: | | |
| Total income | | $ | 147,711 |
|
| Net income attributable to Colony Capital, Inc. | | 23,238 |
|
| Net income attributable to common stockholders | | 16,266 |
|
| Net income per common share: | | |
| Basic | | $ | 0.14 |
|
| Diluted | | $ | 0.14 |
|
4. Variable Interest Entities
Securitizations
The Company securitizes loans receivable using VIEs as a source of financing. Securitization usually occurs in conjunction with or shortly after the Company's origination or purchase of the commercial mortgage loans. The securitization vehicles are structured as pass through entities that receive principal and interest on the underlying mortgage loan collateral and distribute those payments to the holders of the notes or certificates issued by the securitization vehicles. The loans are transferred into securitization vehicles such that these assets are restricted and legally isolated from the creditors of the Company, and therefore are not available to satisfy the Company's obligations but only obligations of the securitization vehicles. The obligations of the securitization vehicles do not have any recourse to the general credit of any other consolidated entities, nor to the Company.
The Company retains beneficial interests in the securitization vehicles, usually equity tranches or subordinate securities, or in the interim period, senior securities. Affiliates of the Company or appointed third parties act as special servicer of the underlying collateral mortgage loans. The special servicer has the power to direct activities during the loan workout process on defaulted and delinquent loans as permitted by the underlying contractual agreements, which is subject to the consent of the Company, as the controlling class representative or directing holder who, under certain circumstances, has the right to unilaterally remove the special servicer. As the Company’s rights as the directing holder and controlling class representative provide the Company the ability to direct activities that most significantly impact the economic performance of the securitization vehicles, for example, responsibility over decisions related to loan modifications and workouts, the Company maintains effective control over the loans transferred into the securitization trusts. Considering the positions retained by the Company in the securitization vehicles together with its role as controlling class representative or directing holder, the Company is deemed to be the primary beneficiary and consolidates these securitization vehicles. Accordingly, these securitizations did not qualify as sale transactions and are accounted for as secured financing with the underlying mortgage loans pledged as collateral.
All of the underlying assets, liabilities, equity, revenues and expenses of the securitization vehicles are consolidated within the Company's consolidated financial statements. The Company’s exposure to the obligations of the securitization vehicles is generally limited to its investment in these entities, which was $409.7 million and $412.8 million at March 31, 2016 and December 31, 2015, respectively. The Company is not obligated to provide any financial support to these securitization vehicles and did not do so in the periods reported.
Operating Subsidiary
The Company's operating subsidiary under the UPREIT structure, OP, is a limited liability company that has governing provisions that are the functional equivalent of a limited partnership. The Company holds the majority of membership interest in OP, acts as the managing member of OP and exercises full responsibility, discretion and control over the day-to-day management of OP. The noncontrolling interests in OP do not have either substantive liquidation rights, or substantive kick-out rights without cause, or substantive participating rights that could be exercised by a simple majority of noncontrolling interest members (including by such a member unilaterally). The absence of such rights, which represent voting rights in a limited partnership equivalent structure, would render OP to be a VIE. The Company, as managing member, has the power to direct the core activities of OP that most significantly affect OP's performance, and through its majority interest in OP, has both the right to receive benefits from and the obligation to absorb losses of OP. Accordingly, the Company is the primary beneficiary of OP and consolidates OP. As the Company conducts its business and holds its assets and liabilities through OP, the total assets and liabilities of OP comprise substantially all of the total consolidated assets and liabilities of the Company.
Sponsored Funds
The Company sponsors funds and other similar investment vehicles as general partner ("Sponsored Funds"), for the purpose of providing investment management services in exchange for management fees and performance-based fees.
Sponsored Funds are established as limited partnerships or equivalent structures. The limited partners of Sponsored Funds do not have either substantive liquidation rights, or substantive kick-out rights without cause, or substantive participating rights, that could be exercised by a simple majority of limited partners or by a single limited partner. The absence of such rights, which represent voting rights in a limited partnership, results in the Sponsored Fund being considered a VIE. The Company invests alongside its Sponsored Funds through joint ventures between the Company and the Sponsored Funds. These co-investment joint ventures are consolidated by the Company. As general partner, the Company has capital commitments directly to the Sponsored Funds and as an affiliate of the general partner, capital commitments satisfied directly through the co-investment joint ventures. The nature of the Company's involvement with the Sponsored Funds comprise fee arrangements and equity interests. The fee arrangements are commensurate with the level of management services provided by the Company, and contain terms and conditions that are customary to similar at-market fee arrangements. The Company's equity interests in the Sponsored Funds absorb insignificant variability. As the Company acts in the capacity of an agent of the Sponsored Funds, the Company is not the primary beneficiary and does not consolidate the Sponsored Funds. The Company accounts for its equity interest in the Sponsored Funds under the equity method. At March 31, 2016 and December 31, 2015, the Company had one Sponsored Fund and its equity method investment balance in the Sponsored Fund was approximately $0.3 million.
5. Loans Receivable
Loans Held For Investment
The following table provides a summary of the Company’s loans held for investment.
|
| | | | | | | | | | | | | | | | | | | | | | | | | | |
| | | March 31, 2016 | | December 31, 2015 |
| (Amounts in thousands) | | Unpaid Principal Balance | | Carrying Value | | Weighted Average Coupon | | Weighted Average Maturity in Years | | Unpaid Principal Balance | | Carrying Value | | Weighted Average Coupon | | Weighted Average Maturity in Years |
| Non-PCI Loans | | | | | | | | | | | | | | | | |
| Fixed rate | | | | | | | | | | | | | | | | |
| Mortgage loans | | $ | 917,545 |
| | $ | 907,278 |
| | 9.2 | % | | 3.7 | | $ | 882,935 |
| | $ | 880,519 |
| | 9.3 | % | | 3.9 |
| Securitized mortgage loans | | 131,782 |
| | 134,579 |
| | 6.4 | % | | 16.6 | | 135,519 |
| | 138,366 |
| | 6.4 | % | | 16.9 |
| Mezzanine loans | | 332,670 |
| | 333,596 |
| | 12.3 | % | | 3.3 | | 338,856 |
| | 340,260 |
| | 12.3 | % | | 3.5 |
| | | 1,381,997 |
| | 1,375,453 |
| | | | | | 1,357,310 |
| | 1,359,145 |
| | | | |
| Variable rate | | | | | | | | | | | | | | | | |
| Mortgage loans | | 689,765 |
| | 674,704 |
| | 7.3 | % | | 1.5 | | 643,013 |
| | 627,374 |
| | 7.2 | % | | 1.7 |
| Securitized mortgage loans | | 1,034,262 |
| | 1,031,768 |
| | 5.7 | % | | 3.1 | | 1,051,822 |
| | 1,048,522 |
| | 5.5 | % | | 3.4 |
| Mezzanine loans | | 348,035 |
| | 347,538 |
| | 11.0 | % | | 0.5 | | 348,091 |
| | 347,267 |
| | 10.8 | % | | 0.7 |
| | | 2,072,062 |
| | 2,054,010 |
| | | | | | 2,042,926 |
| | 2,023,163 |
| | | | |
| | | 3,454,059 |
| | 3,429,463 |
| | | | | | 3,400,236 |
| | 3,382,308 |
| | | | |
| PCI Loans | | | | | | | | | | | | | | | | |
| Mortgage loans | | 966,388 |
| | 670,321 |
| |
| | | | 1,008,839 |
| | 693,934 |
| | | | |
| Securitized mortgage loans | | 8,816 |
| | 7,436 |
| |
| | | | 8,871 |
| | 7,422 |
| | | | |
| | | 975,204 |
| | 677,757 |
| | | | | | 1,017,710 |
| | 701,356 |
| | | | |
| Allowance for loan losses | | — |
| | (39,676 | ) | | | | | | — |
| | (35,187 | ) | | | | |
| Loans held for investment, net | | $ | 4,429,263 |
| | $ | 4,067,544 |
| | | | | | $ | 4,417,946 |
| | $ | 4,048,477 |
| | | | |
Activity in loans held for investment is summarized below:
|
| | | | | | | | |
| | | Three Months Ended March 31, |
| (In thousands) | | 2016 | | 2015 |
| Carrying value at January 1 | | $ | 4,048,477 |
| | $ | 2,131,134 |
|
| Loan acquisitions and originations | | 63,356 |
| | 121,463 |
|
| Paid-in-kind interest added to loan principal | | 9,435 |
| | 1,547 |
|
| Discount and net loan fee amortization | | 2,155 |
| | 3,179 |
|
| Loan repayments | | (46,083 | ) | | (26,842 | ) |
| Payments received from PCI loans | | (34,825 | ) | | (66,907 | ) |
| Accretion on PCI loans | | 14,087 |
| | 5,978 |
|
| Transfer to real estate assets upon foreclosure | | (1,374 | ) | | — |
|
| Provision for loan losses, excluding interest receivable | | (4,489 | ) | | (112 | ) |
| Effect of changes in foreign exchange rates | | 16,805 |
| | (22,543 | ) |
| Carrying value at March 31 | | $ | 4,067,544 |
| | $ | 2,146,897 |
|
Loan Maturity and Aging
Carrying values of loans held for investment before allowance for loan losses, excluding PCI loans, based on remaining maturities under contractual terms at March 31, 2016, was as follows: |
| | | | |
| (In thousands) | | |
| Due in one year or less | | $ | 933,040 |
|
| Due after one year through five years | | 2,063,844 |
|
| Due after five years | | 432,579 |
|
| | | $ | 3,429,463 |
|
The following table provides an aging summary of loans held for investment at carrying values before allowance for loan losses, excluding PCI loans.
|
| | | | | | | | | | | | | | | | | | | |
| (In thousands) | Current or Less Than 30 Days Past Due | | 30-59 Days Past Due | | 60-89 Days Past Due | | 90 Days or More Past Due | | Total |
| At March 31, 2016 | $ | 3,399,889 |
| | $ | 4,869 |
| | $ | 13,713 |
| | $ | 10,992 |
| | $ | 3,429,463 |
|
| At December 31, 2015 | 3,357,454 |
| | 14,628 |
| | 1,509 |
| | 8,717 |
| | 3,382,308 |
|
Troubled Debt Restructuring ("TDR")
The following table provides a summary of loan modifications, excluding purchased credit-impaired loans, classified as TDRs, in which the Company provided the borrowers, who are experiencing financial difficulties, with various concessions in interest rates, payment terms or default waivers.
|
| | | | | | | | |
| | | Three Months Ended March 31, |
| (Dollars in thousands) | | 2016 | | 2015 |
| Loans modified in TDRs during the period: | | | | |
| Number of loans | | 1 |
| | — |
|
| Carrying value of loans before allowance for loan losses | | $ | 37,611 |
| | $ | — |
|
| Loss incurred | | 1,687 |
| | — |
|
At March 31, 2016 and December 31, 2015, carrying values of TDR loans before allowance for loan losses were $66.0 million and $26.7 million, respectively, and the TDR loans were not in default post-modification. There were no additional commitments to lend to borrowers whose loans have been modified in TDRs.
Purchased Credit-Impaired Loans ("PCI")
PCI loans are acquired loans with evidence of credit quality deterioration for which it is probable at acquisition that the Company will collect less than the contractually required payments. PCI loans are recorded at the initial investment in the loans and accreted to the estimated cash flows expected to be collected as measured at acquisition date. The excess of cash flows expected to be collected, measured as of acquisition date, over the estimated fair value represents the accretable yield and is recognized in interest income over the remaining life of the loan using the effective interest method. The difference between contractually required payments as of the acquisition date and the cash flows expected to be collected ("nonaccretable difference") is not recognized as an adjustment of yield, loss accrual or valuation allowance.
Factors that most significantly affect estimates of cash flows expected to be collected, and accordingly the accretable yield, include: (i) estimate of the remaining life of acquired loans which may change the amount of future interest income; (ii) changes to prepayment assumptions; (iii) changes to collateral value assumptions for loans expected to foreclose; and (iv) changes in interest rates on variable rate loans.
There were no acquisitions of new PCI loans during the three months ended March 31, 2016 and 2015. Changes in accretable yield of PCI loans were as follows:
|
| | | | | | | | |
| | | Three Months Ended March 31, |
| (In thousands) | | 2016 | | 2015 |
| Beginning accretable yield | | $ | 66,639 |
| | $ | 98,523 |
|
| Changes in accretable yield | | 6,510 |
| | 2,024 |
|
| Accretion | | (14,087 | ) | | (5,978 | ) |
| Effect of changes in foreign exchange rates | | 156 |
| | (10,492 | ) |
| Ending accretable yield | | $ | 59,218 |
| | $ | 84,077 |
|
Nonaccrual Loans
Non-PCI loans that are past due 90 days or more as to principal or interest, or where reasonable doubt exists as to timely collection, are generally considered nonperforming and placed on nonaccrual status. For PCI loans, if the cash flows expected to be collected cannot be reasonably estimated, the Company may consider placing such PCI loans on nonaccrual. Interest collection on nonaccruing loans for which ultimate collectability of principal is uncertain is recognized using a cost recovery method by applying interest collected as a reduction to loan principal; otherwise, interest collected is recognized on a cash basis by crediting to income when received.
Carrying values of loans, before allowance for loan losses, that have been placed on nonaccrual were as follows:
|
| | | | | | | |
| (In thousands) | March 31, 2016 | | December 31, 2015 |
| Non-PCI loans | $ | 24,705 |
| | $ | 10,226 |
|
| PCI loans | 117,443 |
| | 116,647 |
|
| | $ | 142,148 |
| | $ | 126,873 |
|
At March 31, 2016 and December 31, 2015, there were no non-PCI loans past due 90 days or more that continued to accrue interest.
For the three months ended March 31, 2016, interest income of $0.3 million was recognized on a cash basis related to PCI loans with carrying values before allowance for loan losses of $37.9 million at March 31, 2016. There was no cash basis interest income recognized for the three months ended March 31, 2015.
Allowance for Loan Losses
On a periodic basis, the Company analyzes the extent and effect of any credit migration from underwriting and the initial investment review associated with the performance of a loan and/or value of its underlying collateral, as well as financial and operating capability of the borrower or sponsor. Specifically, operating results of collateral properties and any cash reserves are analyzed and used to assess whether cash from operations are sufficient to cover debt service requirements currently and into the future, ability of the borrower to refinance the loan, and/or liquidation value of collateral properties. Where applicable, the Company also evaluates the financial wherewithal of any loan guarantors as well as the borrower’s competency in managing and operating the collateral properties. Such analysis is performed at least quarterly, or more often as needed when impairment indicators are present.
For PCI loans, the Company records a provision for loan losses if decreases in expected cash flows result in a decrease in the estimated fair value of the loan below its amortized cost. Subsequent increases in cash flows expected to be collected are first applied to reverse any previously recorded allowance for loan losses, with any remaining increases recognized prospectively through an adjustment to yield over its remaining life.
The allowance for loan losses and related carrying values of loans held for investment were as follows: |
| | | | | | | | | | | | | | | | |
| | | March 31, 2016 | | December 31, 2015 |
| (In thousands) | | Allowance for Loan Losses | | Carrying Value | | Allowance for Loan Losses | | Carrying Value |
| Non-PCI loans | | $ | 3,656 |
| | $ | 57,531 |
| | $ | 472 |
| | $ | 7,827 |
|
| PCI loans | | 36,020 |
| | 203,766 |
| | 34,715 |
| | 203,527 |
|
| | | $ | 39,676 |
| | $ | 261,297 |
| | $ | 35,187 |
| | $ | 211,354 |
|
Changes in allowance for loan losses are presented below: |
| | | | | | | |
| | Three Months Ended March 31, |
| (In thousands) | 2016 | | 2015 |
| Allowance for loan losses at January 1 | $ | 35,187 |
| | $ | 197 |
|
| Provision for loan losses | 4,489 |
| | 364 |
|
| Allowance for loan losses at March 31 | $ | 39,676 |
| | $ | 561 |
|
Loans Held For Sale
In December 2015, the Company acquired and classified a loan with carrying value of $75.0 million as held for sale. In February 2016, the loan was sold at approximately its carrying value.
6. Real Estate Assets
The Company's real estate assets comprise the following: |
| | | | | | | | |
| (In thousands) | | March 31, 2016 | | December 31, 2015 |
| Real Estate Held for Investment | | | | |
| Land | | $ | 631,325 |
| | $ | 578,577 |
|
| Buildings and improvements | | 2,726,749 |
| | 2,619,872 |
|
| Foreclosed properties | | 20,192 |
| | 19,989 |
|
| | | 3,378,266 |
| | 3,218,438 |
|
| Less: Accumulated depreciation | | (121,792 | ) | | (86,220 | ) |
| | | 3,256,474 |
| | 3,132,218 |
|
| Real Estate Held for Sale | | | | |
| Land, buildings and improvements | | 73,772 |
| | 203,970 |
|
| Foreclosed properties | | 79,644 |
| | 93,917 |
|
| | | 153,416 |
| | 297,887 |
|
| Real Estate Assets, Net | | $ | 3,409,890 |
| | $ | 3,430,105 |
|
As discussed in Note 7, effective April 2, 2015, the Company was deemed to have a controlling financial interest in a number of its real estate investment entities previously accounted for under the equity method. As a result, the Company consolidated the real estate assets, both real estate held for investment and held for sale, including foreclosed properties, held by these investment entities.
Real Estate Held for Sale and Dispositions
For the three months ended March 31, 2016, an additional $27.9 million of real estate assets, including $1.4 million of properties foreclosed during the quarter, were classified as held for sale. Additionally, real estate assets with carrying values of $65.7 million that were previously classified as held for sale were transferred into held for investment during the three months ended March 31, 2016 as it is no longer probable that these properties would be sold within a year. For the three months ended March 31, 2015, a real estate asset at $16.2 million was classified as held for sale.
For the three months ended March 31, 2016, real estate assets with total carrying values of $118.4 million were sold for aggregate net gains of $51.1 million. There were no real estate dispositions for the three months ended March 31, 2015. Real estate classified as held for sale or sold during the three months ended March 31, 2016 and 2015 did not constitute discontinued operations.
Real estate held for sale as of March 31, 2016 and December 31, 2015 include $10.9 million and $20.3 million, respectively, that have been written down to fair value, estimated based on either broker price opinions or comparable market information, less estimated selling costs of 5% to 8% of fair value.
Depreciation and Impairment
Depreciation expense on real estate held for investment was $27.5 million and $14.6 million for the three months ended March 31, 2016 and 2015, respectively.
For the three months ended March 31, 2016 and 2015, the Company recognized impairment losses on real estate held for sale of $1.8 million and $0.5 million, respectively.
Real Estate Acquisitions
The following table summarizes the Company's real estate acquisitions:
|
| | | | | | | | | | | | | | | | | | | | | | | | | | | | | | |
| ($ in thousands) | | | | | | Purchase Price Allocation |
| | Acquisition Date | | Property Type and Location | | Number of Properties | | Purchase Price (1) | | Land | | Buildings and Improvements | | Lease Intangible Assets | | Lease Intangible Liabilities | | Other Liabilities |
Three Months Ended March 31, 2016 (2) | | | | | | | | | | | | |
Business Combinations (3) (4) | | | | | | | | | | | | | | |
| | January | | Industrial—Spain | | 23 |
| | $ | 94,403 |
| | $ | 30,451 |
| | $ | 59,399 |
| | $ | 5,318 |
| | $ | (765 | ) | | $ | — |
|
| | February | | Light industrial—Maryland, U.S. | | 1 |
| | 17,625 |
| | 3,294 |
| | 13,324 |
| | 1,178 |
| | (171 | ) | | — |
|
| | | | | | 24 |
| | $ | 112,028 |
| | $ | 33,745 |
| | $ | 72,723 |
| | $ | 6,496 |
| | $ | (936 | ) | | $ | — |
|
| Year Ended December 31, 2015 | | | | | | | | | | | | |
Asset Acquisitions (5) | | | | | | | | | | | | | | |
| | January | | Education—Switzerland | | 2 | | $ | 167,911 |
| | $ | 16,450 |
| | $ | 130,446 |
| | $ | 21,015 |
| | $ | — |
| | $ | — |
|
| | June | | Office—Norway (6) | | 1 |
| | 322,231 |
| | 69,350 |
| | 257,541 |
| | 28,235 |
| | — |
| | (32,895 | ) |
| | November | | Office—France | | 1 |
| | 31,000 |
| | 3,936 |
| | 24,096 |
| | 3,661 |
| | (693 | ) | | — |
|
Business Combinations (3) (4) | | | |
| | | | | | | | | | — |
|
| | Various | | Light industrial—Various in U.S. | | 34 |
| | 345,463 |
| | 53,257 |
| | 280,380 |
| | 17,724 |
| | (5,898 | ) | | — |
|
| | December | | Mixed use—United Kingdom (7) | | 24 |
| | 440,999 |
| | 54,005 |
| | 316,405 |
| | 79,282 |
| | (8,693 | ) | | — |
|
| | | | | | 62 |
| | $ | 1,307,604 |
| | $ | 196,998 |
| | $ | 1,008,868 |
| | $ | 149,917 |
| | $ | (15,284 | ) | | $ | (32,895 | ) |
__________
| |
(1) | Dollar amounts of purchase price and allocation to assets acquired and liabilities assumed are translated based on foreign exchange rates as of respective dates of acquisition, where applicable. Purchase price excludes transaction costs. |
| |
(2) | Useful life of real estate assets acquired in 2016 ranges from 26 to 35 years for buildings, 4 to 6 years for improvements, 33 years for below-market ground lease obligations and 4 to 7 years for other lease intangibles. |
| |
(3) | Acquisitions of real estate assets with existing leases where the sellers are not the lessees are classified as business combinations. Transaction costs associated with business combinations are expensed, totaling $4.0 million for the three months ended March 31, 2016. |
| |
(4) | The estimated fair values and purchase price allocation are provisional and subject to retrospective adjustments during the measurement period, not to exceed one year, based upon new information obtained about facts and circumstances that existed as of the date of acquisition. |
| |
(5) | These asset acquisitions are net lease properties in which the Company entered into sale-leaseback transactions with the sellers. Transaction costs associated with asset acquisitions are capitalized, totaling approximately $4.1 million for the three months ended March 31, 2015. |
| |
(6) | The Company acquired equity in a subsidiary of the seller, partially financed by a non-callable bond, and assumed the liabilities of the entity acquired of $2.1 million, as well as the entity's tax basis, resulting in a tax basis difference recorded as a deferred tax liability of $30.8 million upon acquisition. |
| |
(7) | In the first quarter of 2016, certain measurement period adjustments were identified which impacted provisional accounting, primarily below-market operating ground leases assumed by the Company in connection with the properties acquired. These adjustments resulted in an increase to lease intangible assets with a corresponding decrease to land of $18.6 million, an increase to buildings and improvements of $1.1 million and a decrease to lease intangible liabilities of $1.1 million. Included in the condensed consolidated statement of operations for the three months ended March 31, 2016 was a $0.3 million increase in depreciation and amortization expense as well as immaterial adjustments to increase rent expense and decrease rental income to reflect the effects of the measurement period adjustment as of the acquisition date in December 2015. |
Pro Forma Results (Unaudited)
The following table presents pro forma results of the Company as if all 2015 real estate business combinations above had been completed on January 1, 2014. The pro forma results for the three months ended March 31, 2015 have been adjusted to exclude non-recurring acquisition-related expenses of approximately $93,000. These pro forma results are not necessarily indicative of future operating results. Real estate business combinations for the three months ended March 31, 2016 were not material to the Company's consolidated results of operations.
|
| | | | |
| (In thousands, except per share data) | | Three Months Ended March 31, 2015 |
| Pro forma: | | |
| Total income | | $ | 138,296 |
|
| Net income | | 10,993 |
|
| Net income attributable to common stockholders | | 2,550 |
|
| Net income per common share: | | |
| Basic | | $ | 0.02 |
|
| Diluted | | $ | 0.02 |
|
Property Operating Income
The components of property operating income are as follows: |
| | | | | | | | |
| | | Three Months Ended March 31, |
| (In thousands) | | 2016 | | 2015 |
| Rental income | | $ | 67,221 |
| | $ | 33,346 |
|
| Tenant reimbursements | | 14,745 |
| | 10,447 |
|
| Hotel operating income | | 9,651 |
| | — |
|
| | | $ | 91,617 |
| | $ | 43,793 |
|
Future Minimum Rents
The Company has operating leases with tenants that expire at various dates through 2042. Future contractual minimum rental payments to be received under noncancelable operating leases for real estate held for investment as of March 31, 2016 are as follows:
|
| | | | |
| Year Ending December 31, | | (In thousands) |
| Remaining 2016 | | $ | 179,273 |
|
| 2017 | | 217,538 |
|
| 2018 | | 188,666 |
|
| 2019 | | 157,581 |
|
| 2020 | | 133,829 |
|
| 2021 and after | | 737,068 |
|
| Total | | $ | 1,613,955 |
|
7. Investments in Unconsolidated Joint Ventures
The Company's investments in unconsolidated joint ventures comprise the following:
|
| | | | | | | | |
| (In thousands) | | March 31, 2016 | | December 31, 2015 |
| Equity method investments | | $ | 814,979 |
| | $ | 824,597 |
|
| Cost method investment | | 99,736 |
| | 99,868 |
|
| | | $ | 914,715 |
| | $ | 924,465 |
|
Certain of the Company’s investments in real estate debt and equity are structured as joint ventures with one or more private investment funds or other investment vehicles managed by CCLLC or its affiliates, or to a lesser extent, with unaffiliated third parties. These investment entities are generally capitalized through equity contributions from the members, although certain investments are leveraged through various financing arrangements. Subsequent to the Combination, the Company sponsors funds and other similar investment vehicles under the Colony name as general partner and the Company continues to invest alongside its Sponsored Funds through joint ventures between the Company and the Sponsored Funds.
The assets of the investment entities may only be used to settle the liabilities of these entities and there is no recourse to the general credit of the Company nor the other investors for the obligations of these investment entities. Neither the Company nor the other investors are required to provide financial or other support in excess of their capital commitments. The Company’s exposure to the investment entities is limited to its equity method investment balance as of March 31, 2016 and December 31, 2015, respectively.
Equity Method Investments
Activity in the Company’s equity method investment is summarized below:
|
| | | | | | | | |
| | | Three Months Ended March 31, |
| (In thousands) | | 2016 | | 2015 |
| Balance at January 1 | | $ | 824,597 |
| | $ | 1,646,977 |
|
| Contributions | | 14,278 |
| | 107,429 |
|
| Distributions | | (26,846 | ) | | (96,025 | ) |
| Equity in net income | | 2,429 |
| | 26,349 |
|
| Equity in other comprehensive income (loss) | | 11 |
| | (612 | ) |
| Equity in realized loss reclassified from accumulated other comprehensive income | | — |
| | 161 |
|
| Foreign currency translation gain (loss) and other | | 510 |
| | (28,803 | ) |
| Balance at March 31 | | $ | 814,979 |
| | $ | 1,655,476 |
|
No single investment in an unconsolidated joint venture represented greater than 10% of total assets as of March 31, 2016 and December 31, 2015 or generated greater than 10% of net income before tax for the three months ended March 31, 2016 and 2015.
Consolidation of Previous Equity-Method Investments
Prior to the Combination, a majority of the Company’s investments in real estate debt and equity that were held in joint ventures with Co-Investment Funds were accounted for under the equity method as the Company did not have a controlling financial interest but exercised significant influence over these investment entities. Upon closing of the Combination on April 2, 2015, the Company became the investment manager of the Co-Investment Funds and employees of CCLLC, including those who are directors or officers of the investment entities, became employees of the Company. For real estate investment entities structured as joint ventures with Co-Investment Funds, combining the Company's interests with those held by the Co-Investment Funds, to which the Company now acts as investment manager, the Company is considered to have a controlling financial interest in these investment entities post-Combination. Therefore, the Combination represents a reconsideration event that resulted in a shift in controlling financial interest over these investment entities in favor of the Company. Accordingly, the Company consolidated 52 investment entities effective April 2, 2015. The Company did not acquire any economic interests in the Co-Investment Funds nor any additional economic interests in these investment entities as a result of the Combination. Upon initial consolidation of the investment entities, the Company recorded the assets, liabilities, and noncontrolling interests of these entities at estimated fair values as of April 2, 2015.
The following table presents the combined assets, liabilities and noncontrolling interests of the consolidated investment entities as of April 2, 2015:
|
| | | | |
| (In thousands) | | |
| Assets: | | |
| Cash | | $ | 75,412 |
|
| Loans receivable, net | | 1,629,496 |
|
| Real estate assets, net | | 812,672 |
|
| Other assets | | 543,404 |
|
| Total assets | | $ | 3,060,984 |
|
| Liabilities: | | |
| Debt | | $ | 282,555 |
|
| Accrued and other liabilities | | 65,739 |
|
| Total liabilities | | 348,294 |
|
| Noncontrolling interests | | 1,700,114 |
|
| Equity attributable to Colony Capital, Inc. | | $ | 1,012,576 |
|
At April 2, 2015, the fair value of the Company's proportionate share of equity interest in the investment entities was $1.0 billion. The excess of fair value over carrying value of the Company's equity interest in these investment entities, net of cumulative translation adjustments reclassified to earnings, resulted in a remeasurement gain of $41.5 million upon consolidation of these investment entities in April 2015.
Cost Method Investment
In January 2015, OP funded its equity commitment of $50 million to an investor consortium, alongside $50 million from a passive co-investment partner, for the acquisition of common stock in an investee. The Company uses the cost method to account for this non-marketable equity investment as it has neither a controlling interest nor significant influence over the underlying investee. Dividends received from cost-method investments are recorded as dividend income to the extent they are not considered a return of capital, otherwise such amounts are recorded as a reduction to the cost of investment. For the three months ended March 31, 2016, dividends of $0.1 million were received as return of capital and applied to reduce the cost of investment. No dividends were received during the three months ended March 31, 2015.
Related Party Transactions of Unconsolidated Joint Ventures
Prior to the Combination, CCLLC and its affiliates incurred compensation, overhead and direct costs, as well as costs of property management on behalf of the joint ventures and AMCs, for which they were reimbursed by the joint ventures for amounts allocated. Subsequent to the Combination, the Company has assumed the activities of the Manager and has consolidated all of the AMCs and a majority of the joint ventures. Therefore, such costs and corresponding reimbursements have been eliminated upon consolidation. Total costs from such affiliates allocated to the joint ventures were $2.3 million for the three months ended March 31, 2015. The Company’s proportionate share, based upon its percentage interests in the joint ventures, were $0.8 million for the three months ended March 31, 2015.
8. Goodwill, Deferred Leasing Costs and Other Intangibles
The following table summarizes goodwill, deferred leasing costs, other intangible assets and intangible liabilities arising from acquisitions of operating real estate and the investment management business:
|
| | | | | | | | | | | | | | | | | | | | | | | | |
| | | March 31, 2016 | | December 31, 2015 |
| (In thousands) | | Carrying Amount (Net of Impairment) (1) | | Accumulated Amortization | | Net Carrying Amount | | Carrying Amount | | Accumulated Amortization | | Net Carrying Amount |
| Goodwill | | $ | 680,127 |
| | NA |
| | $ | 680,127 |
| | $ | 678,267 |
| | NA |
| | $ | 678,267 |
|
| Deferred Leasing Costs and Intangible Assets | | | | | | | | | | | | |
| Trade name | | $ | 15,500 |
| | NA |
| | $ | 15,500 |
| | $ | 15,500 |
| | NA |
| | $ | 15,500 |
|
| In-place lease values | | 150,065 |
| | (37,542 | ) | | 112,523 |
| | 144,863 |
| | (27,780 | ) | | 117,083 |
|
| Above-market lease values | | 33,502 |
| | (10,501 | ) | | 23,001 |
| | 32,774 |
| | (7,708 | ) | | 25,066 |
|
| Below-market ground lease obligations | | 50,965 |
| | (184 | ) | | 50,781 |
| | 36,635 |
| | (39 | ) | | 36,596 |
|
| Deferred leasing costs | | 76,173 |
| | (16,098 | ) | | 60,075 |
| | 71,710 |
| | (12,647 | ) | | 59,063 |
|
| Investment management contracts | | 39,646 |
| | (16,864 | ) | | 22,782 |
| | 41,897 |
| | (13,985 | ) | | 27,912 |
|
| Customer relationships | | 46,800 |
| | (3,342 | ) | | 43,458 |
| | 46,800 |
| | (2,507 | ) | | 44,293 |
|
| Total deferred leasing costs and intangible assets | | $ | 412,651 |
| | $ | (84,531 | ) | | $ | 328,120 |
| | $ | 390,179 |
| | $ | (64,666 | ) | | $ | 325,513 |
|
| Intangible Liabilities | | | | | | | | | | | | |
| Below-market lease values | | $ | 30,677 |
| | $ | (6,445 | ) | | $ | 24,232 |
| | $ | 28,879 |
| | $ | (4,523 | ) | | $ | 24,356 |
|
| Above-market ground lease obligations | | 172 |
| | (7 | ) | | 165 |
| | 171 |
| | (5 | ) | | 166 |
|
| Total intangible liabilities | | $ | 30,849 |
| | $ | (6,452 | ) | | $ | 24,397 |
| | $ | 29,050 |
| | $ | (4,528 | ) | | $ | 24,522 |
|
__________
| |
(1) | For intangible assets and intangible liabilities recognized in connection with business combinations, purchase price allocations may be subject to adjustments during the measurement period, not to exceed one year from date of acquisition, based upon new information obtained about facts and circumstances that existed at time of acquisition. Carrying amounts at March 31, 2016 were presented net of measurement period adjustments, where applicable (see Note 3 and Note 6). |
Held for Sale
Lease intangible assets and intangible liabilities related to real estate assets held for sale were approximately $5.0 million and $15,000 at March 31, 2016, and approximately $9.9 million and $35,000 at December 31, 2015, respectively.
Acquisitions of Operating Real Estate
Goodwill—Goodwill of $20.0 million arising from the acquisition of a light industrial operating platform on December 18, 2014 represents the value of the acquired operating platform, which primarily consists of its work force and business processes. The goodwill amount recognized is not expected to be deductible for income tax purposes. This goodwill is assigned and reported under the light industrial platform segment. As of March 31, 2016, no indications of potential impairment to goodwill were identified.
Lease Intangibles—Lease intangibles are amortized on a straight-line basis over the remaining term of the respective lease contracts assumed upon acquisition.
Acquisition of Investment Management Business
Goodwill
Goodwill of $660.1 million was recognized in connection with the acquisition of the investment management business through the Combination. This goodwill reflects, in part, the expected cost savings resulting from the internalization through direct incurrence of operating costs relative to a management fee charge, the ability to raise additional equity without a proportionate increase in the cost of managing the Company and control over key functions critical to the growth of the business. The goodwill amount recognized is not expected to be deductible for income tax purposes. This goodwill is assigned and reported under the investment management segment. As of March 31, 2016, no indications of impairment to goodwill were identified.
Identifiable Intangible Assets
As a result of the acquisition of the investment management business, the Company recognized identifiable intangible assets which include the Colony trade name as well as contractual rights to earn future fee income from in-place investment management contracts and customer relationships with institutional clients of private funds. Investment management contracts are amortized in accordance with their expected future cash flows over the remaining contractual period of the agreements ranging between 3 to 5 years. Customer relationships are amortized on a straight-line basis over the estimated life of future funds to be sponsored by the Company ranging between 11 to 14 years. The trade name is determined to have an indefinite useful life and is not subject to amortization.
In the first quarter of 2016, an impairment of $0.3 million on investment management contracts was recognized in impairment loss resulting from a change in fee basis of a liquidating fund.
Amortization
The following table summarizes the amortization of deferred leasing costs and finite-lived intangible assets and intangible liabilities:
|
| | | | | | | | |
| | | Three Months Ended March 31, |
| (Amounts in thousands) | | 2016 | | 2015 |
| Above-market lease values | | $ | (2,766 | ) | | $ | (1,670 | ) |
| Below-market lease values | | 1,939 |
| | 647 |
|
| Net decrease to rental income | | $ | (827 | ) | | $ | (1,023 | ) |
| | | | | |
| Net below-market ground lease obligations | |
| |
|
| Increase to rent expense | | $ | 140 |
| | $ | 5 |
|
| | | | | |
| In-place lease values | | $ | 10,416 |
| | $ | 5,128 |
|
| Deferred leasing costs | | 3,348 |
| | 2,572 |
|
| Investment management contracts | | 2,909 |
| | — |
|
| Customer relationships | | 836 |
| | — |
|
| Amortization expense | | $ | 17,509 |
| | $ | 7,700 |
|
The following table presents the estimated annual amortization of deferred leasing costs and finite-lived intangible assets and intangible liabilities for each of the next five years and thereafter:
|
| | | | | | | | | | | | | | | | | | | | | | | | | | | |
| (In thousands) | | | | | | | | | | | | | |
| Year Ending December 31, | Remaining2016 | | 2017 | | 2018 | | 2019 | | 2020 | | 2021 and after | | Total |
| Above-market lease values | $ | (7,199 | ) | | $ | (6,088 | ) | | $ | (3,770 | ) | | $ | (1,819 | ) | | $ | (1,258 | ) | | $ | (2,867 | ) | | $ | (23,001 | ) |
| Below-market lease values | 4,823 |
| | 5,186 |
| | 3,756 |
| | 2,108 |
| | 1,379 |
| | 6,980 |
| | 24,232 |
|
| (Decrease) increase to rental income | $ | (2,376 | ) | | $ | (902 | ) | | $ | (14 | ) | | $ | 289 |
| | $ | 121 |
| | $ | 4,113 |
| | $ | 1,231 |
|
| | | |
|
| |
|
| |
|
| |
|
| |
|
| |
|
|
| Net below-market ground lease obligations | | |
|
| |
|
| |
|
| |
|
| |
|
| |
|
|
| Increase to rent expense | $ | 380 |
| | $ | 506 |
| | $ | 506 |
| | $ | 506 |
| | $ | 506 |
| | $ | 48,212 |
| | $ | 50,616 |
|
| | | |
|
| |
|
| |
|
| |
|
| |
|
| |
|
|
| In-place lease values | $ | 23,374 |
| | $ | 20,120 |
| | $ | 13,941 |
| | $ | 10,097 |
| | $ | 8,030 |
| | $ | 36,961 |
| | $ | 112,523 |
|
| Deferred leasing costs | 9,550 |
| | 10,611 |
| | 8,616 |
| | 6,468 |
| | 4,802 |
| | 20,028 |
| | 60,075 |
|
| Investment management contracts | 7,360 |
| | 6,320 |
| | 3,636 |
| | 2,906 |
| | 1,818 |
| | 742 |
| | 22,782 |
|
| Customer relationships | 2,507 |
| | 3,343 |
| | 3,343 |
| | 3,343 |
| | 3,343 |
| | 27,579 |
| | 43,458 |
|
| Amortization expense | $ | 42,791 |
| | $ | 40,394 |
| | $ | 29,536 |
| | $ | 22,814 |
| | $ | 17,993 |
| | $ | 85,310 |
| | $ | 238,838 |
|
9. Other Assets and Other Liabilities
Other Assets
The following table summarizes the Company's other assets:
|
| | | | | | | | |
| (In thousands) | | March 31, 2016 | | December 31, 2015 |
Restricted cash (1) | | $ | 171,168 |
| | $ | 187,208 |
|
Deferred financing costs, net (2) | | 9,711 |
| | 4,083 |
|
| Interest receivable | | 39,272 |
| | 34,074 |
|
| Other receivables, including straight-line rents | | 36,958 |
|
| 43,130 |
|
| Derivative assets | | 22,425 |
| | 21,636 |
|
| Prepaid expenses and other | | 23,267 |
| | 21,320 |
|
Fixed assets, net (3) | | 47,639 |
| | 48,463 |
|
Total (4) | | $ | 350,440 |
| | $ | 359,914 |
|
__________
| |
(1) | Restricted cash includes borrower escrow accounts, tenant security deposits and escrow accounts for interest, property taxes and capital expenditure reserves required under secured financing agreements. |
| |
(2) | Deferred financing costs relate to revolving credit arrangements and are shown net of accumulated amortization of $8.1 million and $6.8 million as of March 31, 2016 and December 31, 2015, respectively. |
| |
(3) | Fixed assets are shown net of accumulated depreciation of $4.4 million and $3.3 million as of March 31, 2016 and December 31, 2015, respectively. Depreciation for the three months ended March 31, 2016 was $1.1 million. The Company did not hold any fixed assets prior to and as of March 31, 2015. |
| |
(4) | At March 31, 2016 and December 31, 2015, other assets related to real estate held for sale was $3.7 million. |
Accrued and Other Liabilities
The following table summarizes the Company's accrued and other liabilities:
|
| | | | | | | | |
| (In thousands) | | March 31, 2016 | | December 31, 2015 |
| Borrower and tenant reserves | | $ | 103,026 |
| | $ | 116,800 |
|
| Deferred income | | 29,310 |
| | 41,671 |
|
| Interest payable | | 21,727 |
| | 18,071 |
|
| Intangible liabilities, net | | 24,397 |
| | 24,522 |
|
| Derivative liabilities | | 13,117 |
| | 507 |
|
| Current and deferred tax liabilities | | 43,804 |
| | 44,951 |
|
| Accrued compensation | | 12,727 |
| | 11,495 |
|
| Accounts payable and other liabilities | | 68,180 |
| | 67,572 |
|
Total (1) | | $ | 316,288 |
| | $ | 325,589 |
|
__________
| |
(1) | Intangible liabilities and accrued and other liabilities related to real estate assets held for sale were $15,000 and $7.9 million at March 31, 2016, and $35,000 and $9.1 million at December 31, 2015, respectively. |
10. Debt
Components of debt are summarized as follows:
|
| | | | | | | | |
| (In Thousands) | | March 31, 2016 | | December 31, 2015 |
| Line of credit | | $ | 303,600 |
| | $ | 315,000 |
|
| Secured debt | | 3,332,272 |
| | 3,313,550 |
|
| Less: Debt issuance costs, net | | (40,149 | ) | | (40,826 | ) |
| | | $ | 3,595,723 |
| | $ | 3,587,724 |
|
Line of Credit
On March 31, 2016, the Company entered into an amended and restated credit agreement (the “JPM Credit Agreement”) with several lenders and JPMorgan Chase Bank, N.A. as administrative agent, and Bank of America, N.A. as syndication agent. The JPM Credit Agreement provides a secured revolving credit facility in the maximum principal amount of $850 million, an increase of $50 million from the previous credit facility. The maximum principal amount may be increased up to $1.275 billion, subject to customary conditions, including agreement of existing or substitute lenders to provide additional commitments for the increased amount.
The maximum amount available at any time is limited by a borrowing base of certain investment assets, with the valuation of such investment assets generally determined according to a percentage of adjusted net book value or a multiple of base management fee EBITDA (as defined in the JPM Credit Agreement). As of March 31, 2016, the borrowing base valuation was sufficient to permit borrowings up to the full $850 million commitment.
The JPM Credit Agreement matures on March 31, 2020, with two 6-month extension options, each subject to a fee of 0.10% of the commitment amount upon exercise.
Advances under the JPM Credit Agreement accrue interest at a per annum rate equal to the sum of one-month LIBOR plus 2.25% or a base rate determined according to a prime rate or federal funds rate plus a margin of 1.25%. At March 31, 2016, the Company had outstanding borrowings bearing weighted average interest at 2.74% per annum. The Company also pays a commitment fee of 0.25% or 0.35% per annum of the unused amount (0.35% at March 31, 2016), depending upon the amount of facility utilization.
Some of the Company’s subsidiaries guaranty the obligations of the Company under the JPM Credit Agreement. As security for the advances under the JPM Credit Agreement, the Company and some of its affiliates pledged their equity interests in certain subsidiaries through which the Company directly or indirectly owns substantially all of its assets.
The JPM Credit Agreement contains various affirmative and negative covenants, including financial covenants that require the Company to maintain minimum tangible net worth and liquidity levels and financial ratios, as defined in the JPM Credit Agreement. At March 31, 2016, the Company was in compliance with all of the financial covenants.
The JPM Credit Agreement also includes customary events of default, in certain cases subject to reasonable and customary periods to cure, including but not limited to: failure to make payments when due; breach of covenants; breach of representations and warranties; insolvency proceedings; cross default to material indebtedness or material judgment defaults; certain judgments and attachments; and certain change of control events. The occurrence of an event of default may result in the termination of the credit facility, accelerate the Company’s repayment obligations, in certain cases limit the Company’s ability to make distributions, and allow the lenders to exercise all rights and remedies available to them with respect to the collateral. There have been no events of default since the inception of the credit facility.
Secured Debt
A number of financing arrangements at previously unconsolidated investment entities are now consolidated as a result of the Combination (Note 7). The following table summarizes certain information about the Company's secured debt:
|
| | | | | | | | | | | | | | | | | |
| (Amounts in thousands) | | | | | | | | | | Outstanding Principal at |
| Type (1) | | Collateral | | Interest Rate
(per annum) | | Maturity Date | | Payment Terms (2) | | March 31, 2016 | | December 31, 2015 |
| Investment level financing: | | | | | | | | | | |
| | Secured financing (3) | | Portfolio of first mortgage loans and subordinated loan | | 1-month LIBOR+3.75% | | Apr-2016 | | P&I | | $ | 22,549 |
| | $ | 23,123 |
|
| | Secured financing (3) | | Portfolio of first mortgage loans and subordinated loan | | 1-month LIBOR+3.75% | | Apr-2016 | | P&I | | 10,002 |
| | 10,965 |
|
|
| | | | | | | | | | | | | | | | | |
| (Amounts in thousands) | | | | | | | | | | Outstanding Principal at |
| Type (1) | | Collateral | | Interest Rate
(per annum) | | Maturity Date | | Payment Terms (2) | | March 31, 2016 | | December 31, 2015 |
| Investment level financing: | | | | | | | | | | |
| | Secured financing (3) | | Portfolio of first mortgage loans and subordinated loan | | 1-month LIBOR+4.0% | | Jun-2016 | | P&I | | 3,448 |
| | 5,869 |
|
| | Secured financing (3) | | Portfolio of first mortgage loans and subordinated loan | | 1-month LIBOR+3.75% | | Aug-2016 | | P&I | | 7,446 |
| | 8,579 |
|
| | Secured financing (3) | | Portfolio of first mortgage loans and subordinated loan | | 1-month LIBOR+3.25% | | Sept-2016 | | P&I | | 3,856 |
| | 4,351 |
|
| | Secured financing (3) | | Portfolio of first mortgage loans and subordinated loan | | 1-month LIBOR+2.85% | | Dec-2017 | | P&I | | 62,401 |
| | 73,543 |
|
| | Secured financing | | First mortgage loan secured by residential properties | | 1-month LIBOR+3.75% | | Jun-2016 | | P&I | | 10,268 |
| | 10,314 |
|
| | Warehouse facility (4) | | Eligible first mortgage loans originated within Transitional CRE Lending Platform | | 1 month LIBOR+2.50% | | Feb-2017 | | I/O | | 48,198 |
| | 48,198 |
|
| | Warehouse facility (4) | | Eligible first mortgage loans, including any corresponding mezzanine loans, originated within Transitional CRE Lending Platform | | 1 month LIBOR+2.50% to 2.75% | | Apr-2018 | | I/O | | 131,328 |
| | 114,433 |
|
| | First mortgage loan (5) | | Hotel properties | | 1-month LIBOR+4.65% | | Jan-2019 | | (5) | | 94,000 |
| | 94,000 |
|
| | First mortgage loan (6) | | Office property in Phoenix | | 1-month LIBOR+2.65% | | Jul-2018 | | I/O | | 13,500 |
| | 13,500 |
|
| | First mortgage loan | | Office property in Minnesota | | 4.84% fixed | | Jan-2024 | | P&I | | 87,782 |
| | 88,000 |
|
| | First mortgage loan (7) | | Commercial properties in United Kingdom | | 3-month GBP LIBOR+2.50% | | Aug-2018 | | I/O | | 85,873 |
| | 88,121 |
|
| | First mortgage loan (8) | | Office properties throughout Italy | | 4.02% fixed | | Nov-2018 | | (8) | | 83,739 |
| | 79,133 |
|
| | First mortgage loan (9) | | Warehouse properties in Spain | | 3-month Euribor+2.80% | | Jun-2022 | | I/O | | 26,623 |
| | 25,540 |
|
| | First mortgage loan (10) | | Portfolio of light industrial properties across the U.S. | | 1-month LIBOR+2.25% | | Dec-2019 | | I/O | | 894,740 |
| | 917,469 |
|
| | First mortgage loan | | Portfolio of light industrial properties across the U.S | | 3.80% fixed | | Aug-2025 | | I/O | | 165,750 |
| | 165,750 |
|
| | First mortgage loan | | Portfolio of light industrial properties across the U.S. | | 4.04% fixed | | Apr-2028 | | (11) | | 93,450 |
| | — |
|
| | First mortgage loans | | Two higher education campuses in Switzerland | | 2.72% fixed | | Dec-2029 | | P&I | | 125,085 |
| | 120,947 |
|
| | First mortgage loan (12) | | Office property in United Kingdom | | 3-month GBP LIBOR+2.35% | | Feb-2020 | | I/O | | 13,642 |
| | — |
|
| | First mortgage loan | | Office property in France | | 1.89% fixed | | Nov-2022 | | I/O | | 17,867 |
| | 17,050 |
|
| | First mortgage loan (13) | | Portfolio of office, retail and other commercial properties in United Kingdom | | 3-month GBP LIBOR+3.28% | | Nov-2018 | | I/O | | 230,866 |
| | 236,911 |
|
| | First mortgage loan (14) | | Portfolio of industrial properties in Spain | | 3-month Euribor+3.00% | | Jan-2021 | | I/O | | 51,360 |
| | — |
|
| | Bond payable | | Office property in Norway and shares of borrowing entity | | 3.91% fixed | | Jun-2025 | | I/O | | 193,440 |
| | 180,960 |
|
| | Revolving credit facility | | Portfolio of light industrial properties across the U.S | | 1-month LIBOR+2.25% | | Jul-2016 | | I/O | | — |
| | 23,730 |
|
| | Revolving credit facility | | Partner capital commitments | | 1-month LIBOR+1.60% | | Sept-2016 | | I/O | | 29,400 |
| | 104,400 |
|
| | | | | | | | | | | | 2,506,613 |
| | 2,454,886 |
|
|
| | | | | | | | | | | | | | | | | |
| (Amounts in thousands) | | | | | | | | | | Outstanding Principal at |
| Type (1) | | Collateral | | Interest Rate
(per annum) | | Maturity Date | | Payment Terms (2) | | March 31, 2016 | | December 31, 2015 |
| Investment level financing: | | | | | | | | | | |
| Commercial Mortgage-Backed Securitization ("CMBS") Debt: | | | | | | | | | | |
| | CMBS 2014-FL1 (15) | | Portfolio of first mortgage loans originated within Transitional CRE Lending Platform | | 1-month LIBOR+1.78% | | Apr-2031 | | I/O | | 105,548 |
| | 126,248 |
|
| | CMBS 2014-FL2 (15) | | Portfolio of first mortgage loans originated within Transitional CRE Lending Platform | | 1-month LIBOR+2.01% | | Nov-2031 | | I/O | | 203,734 |
| | 203,734 |
|
| | CMBS 2015-FL3 (15) | | Portfolio of first mortgage loans originated within Transitional CRE Lending Platform | | 1-month LIBOR+2.36% | | Sept-2032 | | I/O | | 340,350 |
| | 340,350 |
|
| | CMBS MF 2014-1 (16) | | Portfolio of first mortgage loans secured by multifamily properties | | 2.54% fixed | | (15) | | I/O | | 133,497 |
| | 145,349 |
|
| | | | | | | | | | | | 783,129 |
| | 815,681 |
|
| Notes Payable: | | | | | | | | | | | | |
| | Promissory notes (17) | | Corporate aircraft | | 5.02% fixed | | Dec-2025 | | P&I | | 42,530 |
| | 42,983 |
|
| | Total | | | | | | | | $ | 3,332,272 |
| | $ | 3,313,550 |
|
__________
| |
| (1) | All secured debt presented in the table are non-recourse unless otherwise stated as recourse debt. |
| |
| (2) | Payment terms: P&I = Periodic payment of principal and interest; I/O = Periodic payment of interest only with principal at maturity (except for principal repayments to release collateral properties disposed) |
| |
| (3) | These financings in connection with loan portfolio acquisitions require monthly interest payments and principal curtailment based upon the ratio of principal outstanding to collateral cost basis. The current principal curtailment requirement ranges from 65% to 80% of all excess cash flow from the underlying loan portfolios, after payment of certain loan servicing fees and monthly interest, but may increase or decrease in the future. The financing arrangements provide for either a single or multiple 1-year extension options to the initial term. |
| |
| (4) | The Company entered into two warehouse facilities with different commercial banks to partially finance loans within its Transitional Commercial Real Estate ("CRE") Lending Platform. The initial term of each facility is subject to a 1-year extension option. The facility maturing in February 2017 is full recourse to OP and provides up to $150 million in financing. The facility maturing in April 2018 is partial recourse and provides up to $250 million in financing. |
| |
| (5) | Initial term on the loan is subject to two 1-year extensions. Payment terms is interest only through January 2017, followed by periodic principal and interest for the remaining term of the loan. An interest rate cap is required to be maintained at a maximum strike rate of 3.00% on 1-month LIBOR. Interest rate spread is presented as a weighted average across different tranches of the loan. At March 31, 2016, $23.6 million of outstanding principal balance was related to real estate held for sale. |
| |
| (6) | Initial term on the loan is subject to two 1-year extensions, during which payment terms require periodic principal and interest. |
| |
| (7) | The loan has two 1-year extensions on its initial term and requires an interest rate cap to be maintained at a maximum strike rate of 2.25% on 3-month GBP LIBOR. At March 31, 2016, $0.6 million of outstanding principal balance was related to a real estate held for sale |
| |
| (8) | Seller provided zero-interest financing on acquired portfolio of properties with imputed interest of 4.02%, requiring principal payments of €15,750,000, €35,437,500 and €27,562,000 in November 2016, November 2017 and November 2018, respectively. A discount was established at inception and is being accreted to debt principal as interest expense. |
| |
| (9) | The loan requires an interest rate cap to be maintained at a maximum strike rate of 1.50% on 3-month Euribor. |
| |
| (10) | This loan was obtained in connection with the acquisition of the light industrial properties portfolio and operating platform in December 2014, has three 1-year extension options, with interest rate margin increasing to 2.50% effective December 2018, and requires an interest rate cap to be maintained at a strike rate of 3.00% on 1-month LIBOR. At March 31, 2016 and December 31, 2015, $3.7 million and $4.9 million, respectively, of outstanding principal balance were related to real estate held for sale. |
| |
| (11) | Payment terms is interest only through April 2021, followed by periodic principal and interest for remaining term of the loan. |
| |
| (12) | The loan requires an interest rate cap to be maintained at a maximum strike rate of 2.25% on 3-month GBP LIBOR. |
| |
| (13) | Interest rate spread was 2.75% at inception and amended to a weighted average of 3.28% in January 2016. Initial term on the loan is subject to two 1-year extensions. Payment terms changes from interest only to periodic principal and interest if specific loan-to-value threshold is exceeded at any time effective August 2016. An interest rate cap is required to be maintained at a maximum strike rate of 2.25% on 3-month GBP LIBOR. Interest rate spread is presented as a weighted average of the facility amount across two tranches of the loan. At March 31, 2016 and December 31, 2015, $4.2 million and $4.1 million, respectively, of outstanding principal balance was related to a real estate held for sale. |
| |
| (14) | The loan requires an interest rate cap to be maintained at a maximum strike rate of 1.50% on 3-month Euribor. |
| |
| (15) | The Company, through its indirect Cayman subsidiaries—Colony Mortgage Capital Series 2014-FL1 Ltd, Colony Mortgage Capital Series 2014-FL2 Ltd and Colony Mortgage Capital Series 2015-FL3 Ltd.—securitized commercial mortgage loans originated within the Company’s Transitional CRE Lending Platform. Senior notes issued by the securitization trusts were generally sold to third parties and subordinated notes retained by the Company. These three securitizations are accounted for as secured financing with underlying mortgage loans pledged as collateral. Principal repayments from underlying collateral loans must be applied to repay the notes until fully paid off, |
irrespective of the contractual maturities of the notes. Underlying collateral loans have initial terms of 2 to 3 years. Interest rate spreads on these CMBS debt are presented on a weighted average basis as of the date of the respective securitizations.
| |
| (16) | The Company transferred acquired loans, secured by multifamily properties, into a securitization trust, Colony Multifamily Mortgage Trust 2014-1, with the most senior certificates issued by the trust sold to third parties and the Company retaining remaining certificates. The securitization was accounted for as a secured financing with underlying mortgage loans pledged as collateral. Although the certificates do not have a contractual maturity date, principal repayments from underlying collateral loans must be applied to repay the debt until fully paid off. Underlying collateral loans have initial remaining terms of 1 to 24 years. Interest rate is presented on a weighted average basis as of the date of the securitization. |
| |
| (17) | In connection with the Combination, the Company assumed two promissory notes, with full recourse, bearing interest at a fixed weighted-average rate of 5.02%. |
The financing agreements require minimum scheduled principal payments or payments that depend upon the net cash flows from the collateral assets and the ratio of principal outstanding to collateral.
The following table summarizes such future scheduled minimum principal payments, excluding CMBS debt, as of March 31, 2016.
|
| | | | | |
| Year Ending December 31, | | (In thousands) | |
| Remaining 2016 | | $ | 163,069 |
| (1) |
| 2017 | | 108,231 |
| (1) |
| 2018 | | 502,726 |
| (1) |
| 2019 | | 994,343 |
| |
| 2020 | | 22,287 |
| |
| 2021 and after | | 764,365 |
| |
| Total | | $ | 2,555,021 |
| |
__________
| |
(1) | Amounts include a combined $5.9 million of discount on seller-provided zero-interest financing being accreted to debt principal. |
CMBS debt obligations are estimated to be repaid earlier than the contractual maturity only if proceeds from the underlying loans are repaid by the borrowers. Future principal payments based on contractual maturity or otherwise based on reasonable expectations of cash flows from the underlying loans as of March 31, 2016 are as follows: |
| | | | | | | | |
(In thousands)
Year Ending December 31, | | Contractual Maturity | | Expectations of Cash Flows |
| Remaining 2016 | | $ | — |
| | $ | 101,312 |
|
| 2017 | | — |
| | 438,129 |
|
| 2018 | | — |
| | 206,556 |
|
| 2019 | | — |
| | 21,975 |
|
| 2020 | | — |
| | 15,157 |
|
| 2021 and after | | 783,129 |
| | — |
|
| Total | | $ | 783,129 |
| | $ | 783,129 |
|
Convertible Senior Notes
Convertible Senior Notes issued by the Company and outstanding are as follows:
|
| | | | | | | | | | | | | | | | | | | | | | | | | | | | |
| | | | | | | | | Conversion Price (per share of common stock) | | | | March 31, 2016 | | December 31, 2015 |
| Description | | Issuance Date | | Due Date | | Interest Rate | | | Redemption Date | | Outstanding Principal (in thousands) | | Carrying Amount (in thousands) (1) | | Outstanding Principal (in thousands) | | Carrying Amount (in thousands) (1) |
| 5% Convertible Senior Notes | | April 2013 | | April 15, 2023 | | 5.00% fixed | | $ | 23.35 |
| | On or after April 22, 2020 | | $ | 200,000 |
| | $ | 195,208 |
| | $ | 200,000 |
| | $ | 195,069 |
|
| 3.875% Convertible Senior Notes | | January and June 2014 | | January 15, 2021 | | 3.875% fixed | | 24.56 |
| | On or after January 22, 2019 | | 402,500 |
| | 396,300 |
| | 402,500 |
| | 396,010 |
|
| | | | | | | | | | | | | $ | 602,500 |
| | $ | 591,508 |
| | $ | 602,500 |
| | $ | 591,079 |
|
__________
| |
(1) | Carrying amounts include $1.6 million and $1.7 million of premium and are shown net of debt issuance costs of $12.6 million and $13.1 million at March 31, 2016 and December 31, 2015, respectively. |
The Company may redeem the Convertible Senior Notes at its option at any time on or after the respective redemption dates of the Convertible Notes if the last reported sale price of the Company's common stock has been at least 130% of the conversion price of the convertible notes then in effect for at least 20 trading days (whether or not consecutive) during any 30 consecutive trading day period ending on, and including, the trading day immediately preceding the date on which the Company provides notice of redemption, at a redemption price equal to 100% of the principal amount of the convertible notes to be redeemed, plus accrued and unpaid interest to, but excluding, the redemption date.
On February 25, 2016, the Company declared a dividend of $0.40 per share of its Class A and Class B common stock for the first quarter of 2016 to be paid on April 15, 2016 to stockholders on record on March 31, 2016. The payment of this cash dividend resulted in adjustments to the conversion rate of the Company's outstanding 5.00% Convertible Senior Notes due 2023 from 42.3819 to 42.8183 and the 3.875% Convertible Senior Notes due 2021 from 40.2941 to 40.7089, in each case effective March 29, 2016 and subject to further adjustment as provided in the applicable governing indenture. The adjustments were made pursuant to the terms of the Convertible Notes and recognition of carried-forward adjustments relating to cash dividends paid on July 15, 2014 to January 15, 2016, which adjustments were deferred and carried forward as permitted under the indenture.
11. Derivatives and Hedging
The Company uses derivative instruments to manage the risk of changes in interest rates and foreign exchange rates, arising from both its business operations and economic conditions. Specifically, the Company enters into derivative instruments to manage differences in the amount, timing, and duration of the Company’s known or expected cash receipts and cash payments, the values of which are driven by interest rates, principally relating to the Company’s investments and borrowings. Additionally, the Company’s foreign operations expose the Company to fluctuations in foreign interest rates and exchange rates. The Company enters into derivative instruments to protect the value or fix certain of these foreign denominated amounts in terms of its functional currency, the U.S. dollar. Derivative instruments used in the Company’s risk management activities may be designated as qualifying hedge accounting relationships (“designated hedges”) or otherwise used for economic hedging purposes (“non-designated hedges”).
Gross fair value of derivative assets and derivative liabilities are as follows: |
| | | | | | | | | | | | | | | | | | | | | | | | |
| | | March 31, 2016 | | December 31, 2015 |
| (In thousands) | | Designated Hedges | | Non-Designated Hedges | | Total | | Designated Hedges | | Non-Designated Hedges | | Total |
| Derivative Assets | | | | | | | | | | | | |
| Foreign exchange contracts | | $ | 21,417 |
| | $ | 374 |
| | $ | 21,791 |
| | $ | 19,773 |
| | $ | 426 |
| | $ | 20,199 |
|
| Interest rate contracts | | 1 |
| | 633 |
| | 634 |
| | 5 |
| | 1,432 |
| | 1,437 |
|
| Included in other assets | | $ | 21,418 |
| | $ | 1,007 |
| | $ | 22,425 |
| | $ | 19,778 |
| | $ | 1,858 |
| | $ | 21,636 |
|
| Derivative Liabilities | | | | | | | | | | | | |
| Foreign exchange contracts | | $ | 12,815 |
| | $ | 302 |
| | $ | 13,117 |
| | $ | 505 |
| | $ | — |
| | $ | 505 |
|
| Interest rate contracts | | — |
| | — |
| | — |
| | 2 |
| | — |
| | 2 |
|
| Included in accrued and other liabilities | | $ | 12,815 |
| | $ | 302 |
| | $ | 13,117 |
| | $ | 507 |
| | $ | — |
| | $ | 507 |
|
Certain counterparties to the derivative instruments require the Company to deposit cash or other eligible collateral for derivative financial liabilities exceeding $100,000. As of March 31, 2016 and December 31, 2015, the Company had no amounts on deposit related to these agreements.
Foreign Exchange Contracts
The following table summarizes the aggregate notional amounts of designated and non-designated foreign exchange contracts in place as of March 31, 2016 along with certain key terms:
|
| | | | | | | | | | | | | | | |
| Hedged Currency | | Instrument Type | | Notional Amount (in thousands) | | FX Rates ($ per unit of foreign currency) | | Range of Expiration Dates |
| | | Designated | | Non-Designated | | |
| EUR | | FX Collar | | € | 140,970 |
| | € | 1,455 |
| | Min $1.09 / Max $1.53 | | July 2017 to January 2021 |
| GBP | | FX Collar | | £ | 130,900 |
| | £ | 3,100 |
| | Min $1.40 / Max $1.82 | | September 2017 to December 2020 |
| EUR | | FX Forward | | € | 119,146 |
| | € | 2,004 |
| | Range between $1.07 to $1.27 | | May 2016 to January 2019 |
| GBP | | FX Forward | | £ | 75,150 |
| | £ | — |
| | Range between $1.49 to $1.51 | | June 2016 to December 2018 |
| CHF | | FX Forward | | CHF | 54,383 |
| | CHF | 1,162 |
| | Range between $1.47 to $1.50 | | January 2030 |
| NOK | | FX Forward | | NOK | 895,454 |
| | NOK | 27,546 |
| | $0.12 | | May 2016 |
Designated Net Investment Hedges
The Company’s foreign denominated net investments in subsidiaries or joint ventures totaled approximately €306.6 million, £120.8 million, CHF55.1 million and NOK898.8 million, or a total of $688.4 million, as of March 31, 2016, and €311.2 million, £126.4 million, CHF54.4 million and NOK895.5 million, or a total of $679.9 million, as of December 31, 2015.
The Company entered into foreign exchange contracts to hedge the foreign currency exposure of its investments in foreign subsidiaries or equity method joint ventures, designated as net investment hedges, as follows:
| |
| • | forward contracts whereby the Company agrees to sell an amount of foreign currency for an agreed upon amount of U.S. dollars; and |
| |
| • | foreign exchange collars (caps and floors) without upfront premium costs, which consist of a combination of currency options with single date expirations, whereby the Company gains protection against foreign currency weakening below a specified level and pays for that protection by giving up gains from foreign currency appreciation above a specified level. |
These foreign exchange contracts are used to protect certain of the Company’s foreign denominated investments and receivables from adverse foreign currency fluctuations, with notional amounts and termination dates based upon the anticipated return of capital from the investments.
Release of accumulated other comprehensive income related to net investment hedges occurs upon losing a controlling financial interest in an investment or obtaining control over an equity method investment. Upon sale, complete or substantially complete liquidation of an investment in a foreign subsidiary, or partial sale of an equity method investment, the gain or loss on the related net investment hedge is reclassified from accumulated other comprehensive income to earnings. There were no such transfers from accumulated other comprehensive income into other gain (loss), net for the three months ended March 31, 2016 and 2015.
Non-Designated Hedges
At the end of each quarter, the Company reassesses the effectiveness of its net investment hedges and as appropriate, dedesignates the portion of the derivative notional that is in excess of the beginning balance of its net investments as non-designated hedges.
For the three months ended March 31, 2016 and 2015, $0.3 million of net unrealized loss and $0.2 million of net unrealized gain on the dedesignated portion of net investment hedges were transferred out of accumulated other comprehensive income into other gain (loss), net, respectively.
Interest Rate Contracts
The Company uses various interest rate derivatives, designated as cash flows hedges or otherwise non-designated, to limit the exposure of increases in interest rates on various floating rate debt obligations.
As of March 31, 2016, the Company held the following designated and non-designated interest rate contracts:
|
| | | | | | | | | | | | | | |
| | | Notional Amount
(in thousands) | | | | | | |
| Instrument Type | | Designated | | Non-Designated | | Index | | Strike | | Expiration |
| Interest rate caps | | $ | 750,000 |
| | $ | 476,750 |
| | 1-Month LIBOR | | 3.00% | | December 2016 to January 2019 |
| Interest rate caps | | $ | — |
| | $ | 95,387 |
| | 1-Month LIBOR | | 2.50% | | April 2016 to December 2016 |
| Interest rate caps | | € | — |
| | € | 53,751 |
| | 3-Month EURIBOR | | 1.50% | | February 2021 to June 2022 |
| Interest rate caps | | £ | — |
| | £ | 60,945 |
| | 3-Month GBP LIBOR | | 2.25% | | November 2018 to February 2020 |
| Interest rate caps | | £ | — |
| | £ | 152,732 |
| | 3-Month GBP LIBOR | | 2.00% | | December 2018 |
Designated Cash Flow Hedges
Unrealized gain of $33,000 on cash flow hedge ineffectiveness was recorded in other gain (loss), net for the three months ended March 31, 2016. There was no cash flow hedge ineffectiveness for the three months ended March 31, 2015.
Non-Designated Hedges
For the three months ended March 31, 2016 and 2015, net unrealized loss associated with non-designated interest rate contracts of $1.0 million and $52,000, respectively, were recorded in other gain (loss), net.
12. Balance Sheet Offsetting
The Company enters into agreements subject to enforceable master netting arrangements with its derivative counterparties that allow the Company to offset the settlement of derivative assets and liabilities in the same currency by derivative instrument type or, in the event of default by the counterparty, to offset all derivative assets and liabilities with the same counterparty. The Company has elected not to net derivative asset and liability positions, notwithstanding the conditions for right of offset may have been met. The Company presents derivative assets and liabilities with the same counterparty on a gross basis on the consolidated balance sheets. The table below sets forth derivative positions where the Company has a right of set off under netting arrangements with the same counterparty.
|
| | | | | | | | | | | | | | | |
| | | | Gross Amounts Not Offset on Consolidated Balance Sheets | | |
| (In thousands) | Gross Amounts of Assets (Liabilities) Included on Consolidated Balance Sheets | | (Assets) Liabilities | | Cash Collateral Received (Pledged) | | Net Amounts of Assets (Liabilities) |
| March 31, 2016 | | | | | | | |
| Derivative Assets | | | | | | | |
| Foreign exchange forwards | $ | 4,641 |
| | $ | (893 | ) | | $ | — |
| | $ | 3,748 |
|
| Foreign exchange collars | 17,150 |
| | (2,262 | ) | | — |
| | 14,888 |
|
| Interest rate caps | 634 |
| | — |
| | — |
| | 634 |
|
| | $ | 22,425 |
| | $ | (3,155 | ) | | $ | — |
| | $ | 19,270 |
|
| Derivative Liabilities | | | | | | | |
| Foreign exchange forwards | $ | (10,855 | ) | | $ | 893 |
| | $ | — |
| | $ | (9,962 | ) |
| Foreign exchange collars | (2,262 | ) | | 2,262 |
| | — |
| | — |
|
| | $ | (13,117 | ) | | $ | 3,155 |
| | $ | — |
| | $ | (9,962 | ) |
| | | | | | | | |
| December 31, 2015 | | | | | | | |
| Derivative Assets | | | | | | | |
| Foreign exchange forwards | $ | 5,907 |
| | $ | (58 | ) | | $ | — |
| | $ | 5,849 |
|
| Foreign exchange collars | 14,292 |
| | (66 | ) | | — |
| | 14,226 |
|
| Interest rate caps | 1,437 |
| | — |
| | — |
| | 1,437 |
|
| | $ | 21,636 |
| | $ | (124 | ) | | $ | — |
| | $ | 21,512 |
|
| Derivative Liabilities | | | | | | | |
| Foreign exchange forwards | $ | (439 | ) | | $ | 58 |
| | $ | — |
| | $ | (381 | ) |
| Foreign exchange collars | (66 | ) | | 66 |
| | — |
| | — |
|
| Interest rate swap | (2 | ) | | — |
| | — |
| | (2 | ) |
| | $ | (507 | ) | | $ | 124 |
| | $ | — |
| | $ | (383 | ) |
13. Fair Value Measurements
Recurring Fair Values
Derivatives—Derivative assets and derivative liabilities are carried at fair value on a recurring basis and classified under Level 2 fair value hierarchy, as presented in Note 11, Derivatives and Hedging. These interest rate contracts and foreign exchange contracts are traded over-the-counter and valued based on observable inputs such as contractual cash flows, yield curve, foreign currency rates and credit spreads, taking into consideration any credit valuation adjustments, as applicable. Although credit valuation adjustments, such as the risk of default, rely on Level 3 inputs, the Company has determined that these inputs are not significant to the overall valuation of its derivatives. As a result, derivative valuations in their entirety are classified in Level 2 of the fair value hierarchy.
Contingent Consideration—Contingent consideration payable in connection with the Combination, included in due to affiliates, is remeasured at fair value each reporting period using a third party valuation service provider and classified under Level 3 of the fair value hierarchy. The contingent consideration is subject to achievement of multi-year performance targets, specifically a contractually-defined funds from operations ("Benchmark FFO") per share metric and capital raising targets in the funds management business. If the minimum target for either of these metrics is not met or exceeded, a portion of the contingent consideration paid in respect of the other metric would not be paid out in full. Fair value of the contingent consideration was measured using a Monte Carlo probability simulation model for the Benchmark FFO component and a discounted payout analysis
based on probabilities of achieving prescribed targets for the capital raising component. The valuation methodology considered the Company's Class A common stock price and related equity volatilities to convert the contingent consideration payout into shares. At March 31, 2016 and December 31, 2015, the contingent consideration was estimated at a fair value of $43.2 million and $53.0 million, respectively. The $9.8 million decrease in fair value resulted in part from the decrease in the Class A common stock price and was recognized in other gain (loss), net.
The following table presents additional information on the significant unobservable inputs used to measure the fair value of contingent consideration:
|
| | | | | | |
| Significant Input | | Input Value at March 31, 2016 | | Input Value at December 31, 2015 | | Impact to Fair Value from Increase in Input (2) |
| Class A common stock price | | $16.77 | | $19.48 | | Increase |
| Benchmark FFO volatility | | 22.9% | | 20.6% | | Increase |
| Equity volatility | | 29.9% | | 28.1% | | Increase |
Correlation (1) | | 80.0% | | 80.0% | | Increase |
__________
| |
(1) | Represents the assumed correlation between Benchmark FFO and the Company's Class A common stock price |
| |
(2) | This is the directional change in fair value of the contingent consideration that would result from an increase to the corresponding unobservable input. A decrease to the unobservable input would have the reverse effect. Significant increases or decreases in these inputs in isolation could result in significantly higher or lower fair value measure of the contingent consideration. |
Nonrecurring Fair Values
The Company holds certain assets carried at fair value on a nonrecurring basis, which comprise loans held for sale, foreclosed properties and real estate held for sale carried at the lower of carrying value and fair value less estimated costs to sell. Nonrecurring fair values at March 31, 2016 and December 31, 2015 consisted of real estate held for sale that were written down to fair value less disposal costs, classified under Level 3 hierarchy, as discussed in Note 6.
Fair Value Disclosure of Financial Instruments Reported at Cost
Carrying amounts and estimated fair values of financial instruments reported at amortized cost are presented below: |
| | | | | | | | | | | | | | | | | | | | |
| | | Fair Value Measurements | | Carrying Value |
| (In thousands) | | Level 1 | | Level 2 | | Level 3 | | Total | |
| March 31, 2016 | | | | | | | | | | |
| Assets | | | | | | | | | | |
| Loans held for investment | | $ | — |
| | $ | — |
| | $ | 4,106,743 |
| | $ | 4,106,743 |
| | $ | 4,067,544 |
|
| Investments in unconsolidated joint ventures | | 374,200 |
| | 2,670 |
| | 741,787 |
| | 1,118,657 |
| | 914,715 |
|
| Liabilities | | | | | | | | | | |
| Line of credit | | — |
| | 303,600 |
| | — |
| | 303,600 |
| | 303,600 |
|
| Secured and unsecured debt | | — |
| | — |
| | 2,512,491 |
| | 2,512,491 |
| | 2,473,949 |
|
| CMBS debt | | — |
| | 763,300 |
| | — |
| | 763,300 |
| | 775,644 |
|
| Notes payable | | — |
| | — |
| | 42,530 |
| | 42,530 |
| | 42,530 |
|
| Convertible senior notes | | 539,375 |
| | — |
| | — |
| | 539,375 |
| | 591,508 |
|
| December 31, 2015 | | | | | | | | | | |
| Assets | | | | | | | | | | |
| Loans held for investment | | $ | — |
| | $ | — |
| | $ | 4,073,075 |
| | $ | 4,073,075 |
| | $ | 4,048,477 |
|
| Loans held for sale | | — |
| | — |
| | 75,002 |
| | 75,002 |
| | 75,002 |
|
| Investments in unconsolidated joint ventures | | | | | | 1,087,850 |
| | 1,087,850 |
| | 924,465 |
|
| Liabilities | | | | | | | | | | |
| Line of credit | | — |
| | 315,000 |
| | — |
| | 315,000 |
| | 315,000 |
|
| Secured and unsecured debt | | — |
| | — |
| | 2,423,013 |
| | 2,423,013 |
| | 2,423,013 |
|
| CMBS debt | | — |
| | 794,982 |
| | — |
| | 794,982 |
| | 806,728 |
|
| Notes payable | | — |
| | — |
| | 42,983 |
| | 42,983 |
| | 42,983 |
|
| Convertible senior notes | | 574,359 |
| | — |
| | — |
| | 574,359 |
| | 591,079 |
|
Loans Held for Investment—Loans held for investment, consisting of first mortgages and subordinated mortgages, were valued based on discounted cash flow projections of principal and interest expected to be collected, which includes consideration of the
financial standing of the borrower or sponsor as well as operating results of the underlying collateral. Carrying values of loans held for investment are presented net of allowances for loan losses, where applicable.
Investments in Unconsolidated Joint Ventures—Fair values of investments in unconsolidated joint ventures were derived by applying the Company’s ownership interest to the fair value of underlying assets and liabilities of each joint venture. The Company’s proportionate share of each joint venture’s fair value approximates the Company’s fair value of the investment, as the timing of cash flows of the joint venture does not deviate materially from the timing of cash flows received by the Company from the joint venture. Beginning in 2016, the Company's investment in Colony Starwood Homes is valued based upon the closing price of its publicly traded common stock (see Note 21).
Debt—Fair value of the line of credit approximated carrying value as its prevailing interest rate and applicable terms were recently renegotiated and agreed upon with the Company's lender at March 31, 2016. Fair values of the secured financing were estimated by discounting expected future cash outlays at current interest rates available for similar instruments, which approximated carrying value for floating rate debt with credit spreads that approximate market rates. Fair value of CMBS debt was determined using the last trade price of similar instruments in active markets, and for recent securitizations, fair value approximates carrying value. Fair value of notes payable approximated carrying values based on market rate for debt with similar underlying collateral. Fair value of convertible senior notes was determined using the last trade price in active markets.
Other—The carrying values of cash, interest receivable, due from affiliates and accrued and other liabilities approximate fair values due to their short term nature and credit risk, if any, are negligible.
14. Stockholders’ Equity
The table below summarizes the share activities of the Company's preferred and common stock:
|
| | | | | | | | | |
| | | Number of Shares |
| | | Preferred Stock | | Common Stock |
| (In thousands) | | Series A, B and C | | Class A | | Class B |
| Shares outstanding at December 31, 2014 | | 13,530 |
| | 109,634 |
| | — |
|
| Share-based compensation, net of forfeitures | | — |
| | 632 |
| | — |
|
| Shares outstanding at March 31, 2015 | | 13,530 |
| | 110,266 |
| | — |
|
| | | | | | | |
| Shares outstanding at December 31, 2015 | | 25,030 |
| | 111,694 |
| | 546 |
|
| Repurchase of preferred stock | | (964 | ) | | — |
| | — |
|
| Reissuance of preferred stock | | 964 |
| | — |
| | — |
|
| Share-based compensation, net of forfeitures | | — |
| | 1,003 |
| | — |
|
| Shares canceled for tax withholding on vested stock awards | | — |
| | (147 | ) | | — |
|
| Shares outstanding at March 31, 2016 | | 25,030 |
| | 112,550 |
| | 546 |
|
In January 2016, the Company repurchased 963,718 shares in aggregate of its Series A, B and C preferred stock from institutional shareholders for approximately $20.0 million. In March 2016, the Company reissued the preferred stock at its purchase price to an investment vehicle (the "REIT Securities Venture"), which is a joint venture with a private fund managed by the Company. The Company holds an approximate 4.4% interest in the REIT Securities Venture and accounts for its investment under the equity method, which had a carrying value of $2.5 million as of March 31, 2016. The REIT Securities Venture targets for investment purposes the common stock and preferred stock of publicly traded U.S. real estate investment trusts, including securities of the Company.
Preferred Stock
The table below summarizes the preferred stock outstanding as of March 31, 2016:
|
| | | | | | | | | | | | | | | | | |
| Description | | Dividend Rate Per Annum | | Initial Issuance Date | | Shares Outstanding (in thousands) | | Par Value (in thousands) | | Liquidation Preference (in thousands) | | Earliest Redemption Date |
| Series A 8.5% Cumulative Redeemable Perpetual | | 8.5% | | March 2012 | | 10,080 |
| | $ | 101 |
| | $ | 252,000 |
| | March 27, 2017 |
| Series B 7.5% Cumulative Redeemable Perpetual | | 7.5% | | June 2014 | | 3,450 |
| | 34 |
| | 86,250 |
| | June 19, 2019 |
| Series C 7.125% Cumulative Redeemable Perpetual | | 7.125% | | April 2015 | | 11,500 |
| | 115 |
| | 287,500 |
| | April 13, 2020 |
| | | | | | | 25,030 |
| | $ | 250 |
| | $ | 625,750 |
| | |
In April 2015, the Company issued 11.5 million shares of its 7.125% Series C Cumulative Redeemable Perpetual Preferred Stock through an underwritten public offering for proceeds of approximately $277.9 million, net of underwriting discounts, commissions and offering costs payable by the Company.
Each series of the Company's preferred stock is redeemable at $25.00 per share plus accrued and unpaid dividends (whether or not declared) exclusively at the Company’s option. The redemption period for each series of preferred stock is subject to the Company’s right under limited circumstances to redeem the preferred stock earlier in order to preserve its qualification as a REIT or upon the occurrence of a change of control (as defined in the articles supplementary relating to each series of preferred stock). All series of preferred stock are at parity with respect to dividends and distributions, including distributions upon liquidation, dissolution or winding up, and all preferred stock are senior to the Company’s common stock. Dividends of each series of preferred stock are payable quarterly in arrears in January, April, July and October.
Each series of preferred stock generally does not have any voting rights, except if the Company fails to pay the preferred dividends for six or more quarterly periods (whether or not consecutive). Under such circumstances, the preferred stock will be entitled to vote, together as a class with any other series of parity stock upon which like voting rights have been conferred and are exercisable, to elect two additional directors to the Company’s board of directors, until all unpaid dividends have been paid or declared and set aside for payment. In addition, certain changes to the terms of any series of preferred stock cannot be made without the affirmative vote of holders of at least two-thirds of the outstanding shares voting separately as a class for each series of preferred stock.
Common Stock
At the closing of the Combination on April 2, 2015, all outstanding common stock at that time was reclassified on a one-for-one basis to Class A common stock, with equivalent terms, and a new class of common stock, Class B, was created. As discussed in Note 3, 1.43 million shares of Class A Common Stock and 563,987 shares of Class B Common Stock were issued as part of the upfront consideration for the Combination.
Except with respect to voting rights, Class A and Class B common stock have the same rights and privileges and rank equally, share ratably in dividends and distributions, and are identical in all respects as to all matters. Class B common stock may only be issued in conjunction with the issuance of OP Units, which are membership interests in the Operating Company, in a ratio of no more than one share of Class B common stock for every thirty-five and one-half OP Units. Class A common stock has one vote per share and Class B common stock has thirty-six and one-half votes per share. This gives the holders of Class B common stock a right to vote that reflects the aggregate outstanding non-voting economic interest in the Company attributable to Class B common stock holders and therefore, does not provide any disproportionate voting rights. Each share of Class B common stock shall convert automatically into one share of Class A common stock if the Executive Chairman or his beneficiaries directly or indirectly transfer beneficial ownership of Class B common stock or OP Units held by them, other than to certain qualified transferees, which generally includes affiliates and employees. In addition, each holder of Class B common stock has the right, at the holder’s option, to convert all or a portion of such holder’s Class B common stock into an equal number of shares of Class A common stock.
In December 2015, 17,712 shares of Class B common stock were converted into an equivalent number of Class A common stock following a charitable contribution of the Executive Chairman's interests in 628,773 OP Units.
At-The-Market Stock Offering Program ("ATM Program")
In May 2015, the Company entered into separate “at-the-market” equity distribution agreements with certain sales agents to offer and sell, from time to time, shares of its common stock having an aggregate offering price of up to $300 million. Sales of the shares may be made in negotiated transactions and/or transactions that are deemed to be "at the market" offerings, including sales made by means of ordinary brokers' transactions, including directly on the New York Stock Exchange (“NYSE”), or sales made to or through a market maker other than on an exchange. The Company pays each sales agent a commission not to exceed 2% of the gross sales proceeds for any common stock sold through such agent.
Dividend Reinvestment and Direct Stock Purchase Plan
The Company’s Dividend Reinvestment and Direct Stock Purchase Plan (the “DRIP Plan”) provides existing common stockholders and other investors the opportunity to purchase shares (or additional shares, as applicable) of the Company’s Class A common stock by reinvesting some or all of the cash dividends received on their shares of the Company’s Class A common stock or making optional cash purchases within specified parameters. The DRIP Plan involves acquisition of Class A common stock either in the open market, directly from the Company as newly issued common stock, or in privately negotiated transactions with third parties. For the three months ended March 31, 2016, there were no shares of Class A common stock acquired under the DRIP Plan.
Accumulated Other Comprehensive Income (Loss) ("AOCI")
The following tables present the changes in each component of AOCI attributable to stockholders and noncontrolling interests, net of immaterial tax effect.
Changes in Components of AOCI Attributable to Stockholders and Noncontrolling Interests
|
| | | | | | | | | | | | | | | | | | | | |
| (In thousands) | | Equity in AOCI of Unconsolidated Joint Ventures | | Gain (Loss) on Cash Flow Hedges | | Foreign Currency Translation Gain (Loss) | | Gain (Loss) on Net Investment Hedges | | Total |
| AOCI at December 31, 2014 attributable to: | | | | | | | | | | |
| Stockholders | | $ | 451 |
| | $ | (101 | ) | | $ | (52,643 | ) | | $ | 23,802 |
| | $ | (28,491 | ) |
| Noncontrolling interests in investment entities | | — |
| | (52 | ) | | (3,616 | ) | | (1 | ) | | (3,669 | ) |
| | | 451 |
| | (153 | ) | | (56,259 | ) | | 23,801 |
| | (32,160 | ) |
| Other comprehensive income (loss) before reclassifications attributable to: | | | | | | | | | | |
| Stockholders | | (612 | ) | | (170 | ) | | (47,840 | ) | | 30,797 |
| | (17,825 | ) |
| Noncontrolling interests in investment entities | | — |
| | (100 | ) | | (3,490 | ) | | — |
| | (3,590 | ) |
| Amounts reclassified from AOCI attributable to: | | | | | | | | | | |
| Stockholders | | 161 |
| | — |
| | — |
| | (215 | ) | | (54 | ) |
| Net other comprehensive (loss) income | | (451 | ) | | (270 | ) | | (51,330 | ) | | 30,582 |
| | (21,469 | ) |
| AOCI at March 31, 2015 attributable to: | | | | | | | | | | |
| Stockholders | | — |
| | (271 | ) | | (100,483 | ) | | 54,384 |
| | (46,370 | ) |
| Noncontrolling interests in investment entities | | — |
| | (152 | ) | | (7,106 | ) | | (1 | ) | | (7,259 | ) |
| | | $ | — |
| | $ | (423 | ) | | $ | (107,589 | ) | | $ | 54,383 |
| | $ | (53,629 | ) |
| AOCI at December 31, 2015 attributable to: | | | | | | | | | | |
| Stockholders | | $ | — |
| | $ | (245 | ) | | $ | (42,125 | ) | | $ | 23,948 |
| | $ | (18,422 | ) |
| Noncontrolling interests in investment entities | | — |
| | (149 | ) | | 51 |
| | (1 | ) | | (99 | ) |
| Noncontrolling interests in Operating Company | | — |
| | 5 |
| | 11,102 |
| | (5,750 | ) | | 5,357 |
|
| | | — |
| | (389 | ) | | (30,972 | ) | | 18,197 |
| | (13,164 | ) |
| Other comprehensive income (loss) before reclassifications attributable to: | | | | | | | | | | |
| Stockholders | | 9 |
| | 7 |
| | 16,326 |
| | (14,395 | ) | | 1,947 |
|
| Noncontrolling interests in investment entities | | — |
| | — |
| | 11,282 |
| | (875 | ) | | 10,407 |
|
| Noncontrolling interests in Operating Company | | 2 |
| | 1 |
| | 3,140 |
| | (2,769 | ) | | 374 |
|
| Amounts reclassified from AOCI attributable to: | | | | | | | | | | |
| Stockholders | | — |
| | (44 | ) | | (331 | ) | | 271 |
| | (104 | ) |
| Noncontrolling interests in investment entities | | — |
| | — |
| | (785 | ) | | — |
| | (785 | ) |
| Noncontrolling interests in Operating Company | | — |
| | (8 | ) | | (64 | ) | | 52 |
| | (20 | ) |
| Net other comprehensive (loss) income | | 11 |
| | (44 | ) | | 29,568 |
| | (17,716 | ) | | 11,819 |
|
| AOCI at March 31, 2016 attributable to: | | | | | | | | | | |
| Stockholders | | 9 |
| | (282 | ) | | (26,130 | ) | | 9,824 |
| | (16,579 | ) |
| Noncontrolling interests in investment entities | | — |
| | (149 | ) | | 10,548 |
| | (876 | ) | | 9,523 |
|
| Noncontrolling interests in Operating Company | | 2 |
| | (2 | ) | | 14,178 |
| | (8,467 | ) | | 5,711 |
|
| | | $ | 11 |
| | $ | (433 | ) | | $ | (1,404 | ) | | $ | 481 |
| | $ | (1,345 | ) |
Reclassifications out of AOCI—Stockholders
Information about amounts reclassified out of AOCI attributable to stockholders by component is presented below:
|
| | | | | | | | | | |
| (In thousands) | | Three Months Ended March 31, | | Affected Line Item in the Consolidated Statements of Operations |
| Component of AOCI reclassified into earnings | 2016 | | 2015 |
| Equity in realized loss on sale of marketable securities of unconsolidated joint ventures | | $ | — |
| | $ | (161 | ) | | Equity in income of unconsolidated joint ventures |
| Unrealized gain on ineffective cash flow hedge | | 44 |
| | — |
| | Other gain (loss), net |
| Release of cumulative translation adjustments | | 331 |
| | — |
| | Other gain (loss), net |
| Unrealized (loss) gain on dedesignated net investment hedges | | (271 | ) | | 215 |
| | Other gain (loss), net |
15. Noncontrolling Interests
Noncontrolling Interests in Investment Entities
Noncontrolling interests in investment entities represent interests in consolidated real estate investment entities held primarily by Co-Investment Funds, which prior to the Combination, were managed by CCLLC or its affiliates, and to a lesser extent, held by unaffiliated third parties. Allocation of net income or loss is generally based upon relative ownership interests held by equity owners in each investment entity, or based upon contractual arrangements that may provide for disproportionate allocation of economic returns among equity interests, including hypothetical liquidation at book value, when applicable and substantive.
Noncontrolling Interests in Operating Company
Noncontrolling interests in Operating Company represent membership interests in OP held directly or indirectly by senior executives of the Company. A majority of the OP Units held by noncontrolling interests were issued as consideration for the Combination. Noncontrolling interests in OP are attributed a share of net income or loss in OP based on their weighted average ownership interest in OP during the period. At the end of each period, noncontrolling interests in OP is adjusted to reflect their ownership percentage in OP at the end of the period, through a reallocation between controlling and noncontrolling interests in OP, as applicable.
Noncontrolling interests in OP, subject to lock-up agreements, have the right to require OP to redeem part or all of such member’s OP Units for cash based on the market value of an equivalent number of shares of Class A common stock at the time of redemption, or at the Company's election, through issuance of shares of Class A common stock (registered or unregistered) on a one-for-one basis.
In June 2015, OP issued an additional 412,865 common OP Units to Cobalt Capital Management, L.P. ("CCM"), in exchange for redemption of a $10 million unsecured note that the Company previously issued to CCM in connection with its acquisition of the light industrial portfolio and operating platform in December 2014.
16. Earnings per Share
The following table provides the basic and diluted earnings per common share computations:
|
| | | | | | | | |
| | | Three Months Ended March 31, |
| (In thousands, except per share data) | | 2016 | | 2015 |
| Net income allocated to common stockholders | | | | |
| Net income | | $ | 91,031 |
| | $ | 16,215 |
|
| Net income attributable to noncontrolling interests: | | | | |
| Investment entities | | (57,595 | ) | | (5,686 | ) |
| Operating Company | | (3,421 | ) | | — |
|
| Net income attributable to Colony Capital, Inc. | | 30,015 |
| | 10,529 |
|
| Preferred dividends | | (11,880 | ) | | (6,972 | ) |
| Net income attributable to common stockholders | | 18,135 |
| | 3,557 |
|
| Net income allocated to participating securities (nonvested shares) | | (568 | ) | | (305 | ) |
| Net income allocated to common stockholders—basic | | 17,567 |
| | 3,252 |
|
Interest expense attributable to convertible notes (1) | | — |
| | — |
|
| Net income allocated to common stockholders—diluted | | $ | 17,567 |
| | $ | 3,252 |
|
| Weighted average common shares outstanding | | | | |
| Weighted average number of common shares outstanding—basic | | 111,660 |
| | 109,415 |
|
Weighted average effect of dilutive shares (2) | | — |
| | — |
|
| Weighted average number of common shares outstanding—diluted | | 111,660 |
| | 109,415 |
|
| Earnings per share | | | | |
| Basic | | $ | 0.16 |
| | $ | 0.03 |
|
| Diluted | | $ | 0.16 |
| | $ | 0.03 |
|
__________
| |
(1) | For the three months ended March 31, 2016 and 2015, excluded from the calculation of diluted net income per share is the effect of adding back $6.8 million and $6.8 million of interest expense and 24,949,000 and 24,694,800 weighted average dilutive common share equivalents, respectively, for the assumed conversion of the Convertible Notes, as their inclusion would be antidilutive. Also excluded from the calculation of diluted income per share for the three months ended March 31, 2015 is the effect of adding back $169,000 of interest expense and 412,900 weighted average dilutive common share equivalents for the assumed repayment of a $10 million unsecured note issued to CCM in shares of the Company's common stock (see Note 15), as its inclusion would be antidilutive. |
| |
(2) | OP Units, subject to lock-up agreements, may be redeemed for registered or unregistered Class A common shares on a one-for-one basis. At March 31, 2016, there were 21,749,000 redeemable OP Units. These OP Units would not be dilutive and were not included in the computation of diluted earnings per share for the three months ended March 31, 2016. |
17. Related Party Transactions
Affiliates include funds and other investment vehicles managed by the Company, directors, senior executives, and employees, and prior to the Combination, the Manager and its affiliates.
Amounts due from and due to affiliates consist of the following: |
| | | | | | | | |
| (In thousands) | | March 31, 2016 | | December 31, 2015 |
| Due from Affiliates | | | | |
| Due from funds and unconsolidated joint ventures: | | | | |
| Management fees | | $ | 5,578 |
| | $ | 5,734 |
|
| Other | | 928 |
| | 3,952 |
|
| Due from CCLLC | | — |
| | 1,559 |
|
| Due from employees and other affiliated entities | | 514 |
| | 468 |
|
| | | $ | 7,020 |
| | $ | 11,713 |
|
| Due to Affiliates | | | | |
| Contingent consideration (Note 3) | | $ | 43,211 |
| | $ | 52,990 |
|
| Due to funds | | 2,979 |
| | — |
|
| | | $ | 46,190 |
| | $ | 52,990 |
|
Prior to the Combination, the Company was externally managed by an affiliate. Amounts payable to the Manager under this arrangement included:
| |
| ▪ | Base management fee of 1.5% per annum of stockholders' equity; |
| |
| ▪ | Incentive fee each quarter, measured based on a core earning metric, as defined in the management agreement, payable in shares of the Company's common stock; |
| |
| ▪ | Reimbursement of certain expenditures incurred by the Manager, including allocation of overhead costs; and |
| |
| ▪ | Cost of employment for the Company's chief financial officer pursuant to a secondment agreement with an affiliate of the Manager. |
Amounts incurred and payable to the Manager or its affiliates for periods prior to the Combination were as follows:
|
| | | | |
| (In thousands) | | Three Months Ended March 31, 2015 |
| Base management fee expense | | $ | 9,064 |
|
| Compensation pursuant to secondment agreement | | 450 |
|
| Direct and allocated investment-related expenses | | 366 |
|
| Direct and allocated administrative expenses | | 1,922 |
|
| | | $ | 11,802 |
|
Subsequent to the Combination which closed on April 2, 2015, the Company is internally managed and incurs all costs directly. Additionally, the management and investment personnel of the Manager became employees of the Company. Transactions with affiliates post-Combination include the following:
Management Fees—Pursuant to management and advisory agreements, the Company earns base and asset management fee income from managing private funds and their underlying investments. For the three months ended March 31, 2016, base and asset management fees from affiliates, included in fee income, totaled $16.6 million. At March 31, 2016, $1.8 million of fees received from a fund during the quarter became payable to the fund following a retrospective change in fee basis effective January 1, 2016.
Cost Reimbursements—The Company received cost reimbursements for administrative services provided to affiliates, including property management services on behalf of the Company's investment entities. Cost reimbursements, included in other income, was $1.3 million for the three months ended March 31, 2016, of which $0.4 million was receivable at March 31, 2016.
Recoverable Expenses—In the normal course of business, the Company pays certain expenses on behalf of managed funds, for which the Company recovers from the funds. Such amounts due from funds were $0.4 million at March 31, 2016.
Arrangements with Sponsored Fund—In December 2015, the Company sponsored a fund as general partner and co-invests alongside the Sponsored Fund through joint ventures between the Company and the Sponsored Fund. These co-investment joint ventures are consolidated by the Company. As general partner, the Company has capital commitments directly to the Sponsored Fund and as an affiliate of the general partner, capital commitments satisfied through the co-investment joint ventures. In connection with the Company's commitments as an affiliate of the general partner, the Company is allocated a proportionate share of the general and administrative costs of the Sponsored Fund. At March 31, 2016, $1.2 million of advances made by the Sponsored Fund to the consolidated co-investment joint ventures was outstanding. As permitted by the limited partnership agreement of the Sponsored Fund, the Company may make interest bearing advances to the Sponsored Fund as general partner. There were no such advances outstanding at March 31, 2016 and December 31, 2015.
Advances—Certain employees are permitted to participate in co-investment vehicles which generally invest in Colony-sponsored funds alongside third party investors. Additionally, the Company grants loans to certain employees in the form of promissory notes bearing interest at the prime rate with varying terms and repayment conditions. At March 31, 2016, outstanding advances were approximately $0.2 million and related interest amounts were immaterial.
Corporate Aircraft—The Company's corporate aircraft may occasionally be used for business purposes by affiliated entities or for personal use by certain senior executives of the Company. Affiliated entities and senior executives reimburse the Company for their usage based on the incremental cost to the Company of making the aircraft available for such use, and includes direct and indirect variable costs of operating the flights. These reimbursements, included in other income, amounted to approximately $0.1 million for the three months ended March 31, 2016 and was outstanding at March 31, 2016.
Contingent Consideration—At March 31, 2016, the contingent consideration in connection with the Combination that is payable to certain senior executives of the Company was estimated at $43.2 million, as discussed in Note 13.
18. Share-Based Compensation
Director Stock Plan
The Company’s 2009 Non-Executive Director Stock Plan (the “Director Stock Plan”) provides for the grant of restricted stock, restricted stock units and other stock-based awards to its non-executive directors. The maximum number of shares of stock reserved under the Director Stock Plan is 100,000. The individual share awards generally vest one year from the date of grant.
Equity Incentive Plan
The 2014 Equity Incentive Plan (the “Equity Incentive Plan”), an amendment and restatement of the Company’s 2011 Equity Incentive Plan (the “2011 Plan”), provides for the grant of options to purchase shares Class A of common stock, share awards (including restricted stock and stock units), stock appreciation rights, performance awards and annual incentive awards, dividend equivalent rights, long-term incentive units, cash and other equity-based awards. Certain named executive officers of the Company, along with other eligible employees, directors as well as service providers are eligible to receive awards under the Equity Incentive Plan. The Company has reserved a total of 2,500,000 additional shares of Class A common stock for issuance pursuant to the Equity Incentive Plan, in addition to (i) the number of shares of Class A common stock available for issuance under the 2011 Plan and (ii) the number of shares of Class A common stock subject to outstanding awards under the 2011 Plan that terminate by expiration, forfeiture, cancellation or otherwise without the issuance of such shares of Class A common stock. The Equity Incentive Plan will expire in 2024 unless earlier terminated by the Company. The share awards granted under the Equity Incentive Plan generally vest over a 3-year period from the date of grant.
Prior to the Combination, stock grants made to the Manager and its employees were considered non-employee awards and were remeasured at fair value at each period end until the awards fully vested, with such costs forming part of management fee expense. Following the Combination, in which the management and investment personnel of the Manager became employed by the Company, these stock grants are treated as equity classified employee awards. The outstanding awards as of the date of closing of the Combination were remeasured at fair value based on the closing price of the Company's Class A common stock on that date and compensation cost recognized on a straight-line basis over the remaining vesting period of the awards, presented within compensation expense. There were no changes to the existing service requirement or any other terms of the awards, nor new conditions attached to the awards in connection with the Combination.
Stock grants made to non-executive directors of the Company continue to be classified as employee awards. Amortization of stock grants to non-executive directors are included in compensation expense subsequent to the Combination, previously in administrative expense.
Share-based compensation expense recognized was as follows: |
| | | | | | | | |
| | | Three Months Ended March 31, |
| (In thousands) | | 2016 | | 2015 |
Stock grants to the Manager and employees (1) | | $ | 3,361 |
| | $ | 5,897 |
|
| Stock grants to non-executive directors | | 58 |
| | 89 |
|
| | | $ | 3,419 |
| | $ | 5,986 |
|
Changes in the Company’s nonvested share awards are summarized below: |
| | | | | | | | | | | | | |
| | | Restricted Stock Grants |
| | | Non-Executive Directors | | Manager and Employees (1) | | Total | | Weighted Average Grant Date Fair Value |
| Nonvested shares at December 31, 2015 | | 14,928 |
| | 780,906 |
| | 795,834 |
| | $ | 22.51 |
|
| Granted | | — |
| | 1,038,312 |
| | 1,038,312 |
| | 19.27 |
|
| Vested | | (13,928 | ) | | (363,970 | ) | | (377,898 | ) | | 26.02 |
|
| Forfeited | | — |
| | (35,479 | ) | | (35,479 | ) | | 20.93 |
|
| Nonvested shares at March 31, 2016 | | 1,000 |
| | 1,419,769 |
| | 1,420,769 |
| | 21.22 |
|
_________
| |
(1) | All outstanding stock grants made to the Manager prior to the Combination became employee awards effective April 2, 2015. |
Fair value of shares vested was $9.8 million and $12.1 million for the three months ended March 31, 2016 and 2015, respectively. Fair value of shares vested was determined based on the closing price of the Company's Class A common stock on the respective dates of grant for director awards, on respective vesting dates for non-employee awards and on the date of
closing of the Combination for employee awards. The weighted average grant-date fair value per share was $19.27 and $24.40 for the shares granted during the three months ended March 31, 2016 and 2015, respectively.
As of March 31, 2016, aggregate unrecognized compensation cost related to nonvested restricted stock grants was approximately $26.8 million and is expected to be fully recognized over a weighted-average period of approximately 28 months.
19. Income Taxes
The Company is subject to income tax laws of the various jurisdictions in which it operates, including U.S. federal, state and local and non-U.S. jurisdictions, primarily in Europe.
The Company has elected or may elect to treat certain of its existing or newly created corporate subsidiaries as taxable REIT subsidiaries (each a “TRS”). In general, a TRS may perform non-customary services for tenants of the REIT, hold assets that the REIT cannot or does not intend to hold directly and, subject to certain exceptions related to hotels and healthcare properties, may engage in any real estate or non-real estate related business. The Company uses TRS entities to conduct certain activities that cannot be conducted directly by a REIT, including investment management, property management including hotel operations as well as loan servicing and workout activities. A TRS is treated as a regular, taxable corporation for U.S income tax purposes and therefore, is subject to U.S federal corporate tax on its income and property.
The Company's current primary sources of income subject to tax are income from loan resolutions in some of the loan portfolios, income from interests in asset management companies which manage some of the loan portfolios, hotel operations from the real estate equity portfolio and fee income from the investment management business.
Income Tax (Benefit) Expense
|
| | | | | | | | |
| | | Three Months Ended March 31, |
| (In thousands) | | 2016 | | 2015 |
| Current | | | | |
| Federal | | $ | (28 | ) | | $ | 268 |
|
| State and local | | 403 |
| | 210 |
|
| Foreign | | 3,509 |
| | — |
|
| Total current tax expense | | 3,884 |
| | 478 |
|
| Deferred | | | | |
| Federal | | (2,673 | ) | | 114 |
|
| State and local | | (419 | ) | | 58 |
|
| Foreign | | (8 | ) | | — |
|
| Total deferred tax benefit | | (3,100 | ) | | 172 |
|
| Total income tax expense | | $ | 784 |
| | $ | 650 |
|
Deferred Income Tax Assets and Liabilities
The components of deferred tax assets and deferred tax liabilities arising from temporary differences are as follows:
|
| | | | | | | | |
| (In thousands) | | March 31, 2016 | | December 31, 2015 |
| Deferred tax assets | | | | |
| Net operating loss carry forwards | | $ | 11,640 |
| | $ | 9,814 |
|
| Stock-based compensation | | 1,349 |
| | 2,890 |
|
| Investment in partnerships | | 33 |
| | 843 |
|
| Deferred income | | 1,268 |
| | — |
|
| Foreign tax credits | | 419 |
| | — |
|
| Other | | 2,576 |
| | 2,262 |
|
| Total deferred tax assets | | 17,285 |
| | 15,809 |
|
| Deferred tax liabilities | | | | |
| Intangible assets from Combination | | 26,478 |
| | 28,875 |
|
| Gain from remeasurement of consolidated investment entities, net | | 3,237 |
| | 3,237 |
|
| Assumption of tax basis from real estate acquisition (Note 6) | | 28,726 |
| | 26,880 |
|
| Other | | 1,555 |
| | 1,504 |
|
| Total deferred tax liabilities | | 59,996 |
| | 60,496 |
|
| Net deferred tax liability | | $ | (42,711 | ) | | $ | (44,687 | ) |
As of March 31, 2016 and December 31, 2015, the Company has assessed that it is more likely than not that the benefits of its deferred tax assets will be realized and therefore, no valuation allowance was necessary.
20. Commitments and Contingencies
Investment Commitments
Investments in Unconsolidated Joint Ventures—Pursuant to the operating agreements of certain unconsolidated joint ventures, the joint venture partners may be required to fund additional amounts for future investments, unfunded lending commitments, ordinary operating costs, guaranties or commitments of the joint ventures. As of March 31, 2016, the Company’s share of those commitments was $37.7 million.
Consolidated Real Estate Debt Investments—The Company has lending commitments to borrowers pursuant to certain loan agreements in which the borrower may submit a request for funding based on the achievement of certain criteria, which must be approved by the Company as lender, such as leasing, performance of capital expenditures and construction in progress with an approved budget. As of March 31, 2016, total unfunded lending commitments was $417.4 million, of which the Company's share was $245.3 million, net of amounts attributable to noncontrolling interests.
Consolidated Real Estate Equity Investments—As of March 31, 2016, the Company, through a wholly-owned real estate equity investment entity, had a $34.0 million commitment to acquire an operating property upon completion of construction, which is being undertaken as a build-to-suit for a signed long term net lease.
In January 2016, the Company, through an investment entity, partially-owned with its Sponsored Fund, entered into a purchase agreement to acquire an office property in France and made a deposit of $0.9 million. As of March 31, 2016, total unfunded purchase commitment was $17.6 million. As general partner and general partner affiliate of the Sponsored Fund, the Company's share of the deposit and unfunded purchase commitment was approximately $0.2 million and $3.5 million, respectively.
In connection with the Company's acquisition of a light industrial portfolio and operating platform in December 2014, the Company, together with 38% third-party limited partners, may be required to fund additional amounts for future real estate acquisitions and operating costs through ColFin Industrial Partnership, as directed by the general partner of this entity, which is a controlled affiliate of the Company. As of March 31, 2016, the unfunded commitment to ColFin Industrial Partnership was $163.2 million, representing $101.9 million for the Company and $61.3 million for the limited partners.
Sponsored Fund Commitments—In December 2015, the Company, through wholly-owned subsidiaries of OP, held a closing of a global real estate credit fund (the “Global Credit Fund") with total callable capital commitments of $688.6 million, inclusive of capital commitment by certain wholly-owned subsidiaries of the OP. The Company's co-investment activities alongside the Global Credit Fund are conducted through joint ventures between the Company and the Global Credit Fund. As of March 31, 2016, the Company committed capital of $1.0 million as general partner to be funded directly into the Global Credit Fund and an additional $136.7 million as an affiliate of the general partner ("GP Affiliate"), which commitments can be satisfied by funding certain joint ventures between the Company and the Global Credit Fund. At March 31, 2016, the Company has unfunded commitments of $0.7 million as general partner and $92.8 million as GP Affiliate. In subsequent closings, the Company's cumulative capital commitments to the Global Credit Fund will be determined as the lower of $500.0 million or 20% of total capital commitments.
Lease Commitments
Office Leases—The Company leases office space under noncancellable operating leases with expiration dates through 2025. The lease agreements provide for payment of various operating expenses, with certain operating costs incurred by the landlord subject to escalation clauses. Rent expense in connection with leases of office space for the three months ended March 31, 2016 was $1.4 million, included in administrative expenses. Prior to the Combination on April 2, 2015, such administrative cost was incurred directly by the Manager.
Ground Leases—In connection with real estate acquisitions, the Company assumed certain noncancelable operating ground leases as lessee or sublessee with expiration dates through year 2996. Many ground leases require only nominal annual payments and are excluded from the table below. Certain leases require contingent rent payments based on a percentage of gross rental receipts, net of operating expenses, as defined in the lease. Rents paid under the ground leases are recoverable from tenants. For the three months ended March 31, 2016 and 2015, ground rent expense was $106,000 and $77,000, respectively, including contingent rent.
As of March 31, 2016, future minimum rental payments on noncancellable operating ground leases were as follows:
|
| | | | |
(In thousands)
Year Ending December 31, | | Ground Leases |
| Remaining 2016 | | $ | 290 |
|
| 2017 | | 387 |
|
| 2018 | | 387 |
|
| 2019 | | 387 |
|
| 2020 | | 398 |
|
| 2021 and after | | 30,218 |
|
| Total | | $ | 32,067 |
|
Contingent Consideration
The consideration for the Combination included a contingent portion payable in shares of Class A and Class B common stock as well as OP Units, subject to multi-year performance targets. At March 31, 2016, the estimated fair value of the contingent consideration was $43.2 million, as discussed in Note 13.
Litigation
The Company may be involved in litigations and claims in the ordinary course of business. As of March 31, 2016, the Company was not involved in any material legal proceedings.
21. Segment Information
The Company conducts its business through the following reportable segments:
Real Estate Equity
| |
| • | Light industrial real estate assets and operating platform; |
| |
| • | Single-family residential rentals through equity method investments in Colony Starwood Homes subsequent to the merger described below (formerly Colony American Homes, or "CAH" ) and in Colony American Finance, LLC (formerly a subsidiary of CAH); |
| |
| • | Other real estate equity investments; |
Real Estate Debt
| |
| • | Loan originations and acquisitions; and |
Investment Management
| |
| • | Investment management of Company-sponsored funds and other investment vehicles. |
Following the closing of the Combination on April 2, 2015, the acquired investment management business formed a new segment, Investment Management. Additionally, costs previously borne and allocated by its Manager are now incurred directly by the Company and certain assets held by the Manager were transferred to the Company as part of the Combination.
Amounts not allocated to specific segments include corporate level cash and corresponding interest income, fixed assets, corporate level financing and related interest expense, income and expense in relation to cost reimbursement arrangements with affiliates, costs in connection with unconsummated deals, compensation expense not directly attributable to other segments, corporate level administrative and overhead costs, contingent consideration in connection with the Combination, as well as non-real estate investments and related revenues and expenses.
The chief operating decision maker assesses the performance of the business based on net income (loss) of each of the reportable segments, after attribution to noncontrolling interests at segment level, where applicable. The various real estate equity, real estate debt and investment management segments represent distinct revenue streams to the Company, consisting of property operating income, interest income and fee income, respectively. Costs which are directly attributable, or otherwise can be subjected to a reasonable and systematic allocation, have been allocated to each of the reportable segments.
On January 5, 2016, pursuant to a merger agreement in September 2015, CAH and Starwood Waypoint Residential Trust (“SWAY”) completed a merger of the two companies into Colony Starwood Homes, in a stock-for-stock transaction. Colony Starwood Homes continues to trade on the New York Stock Exchange under the ticker symbol "SFR." Upon completion of the merger, based on each company’s net asset value, existing SWAY shareholders and the former owner of the SWAY manager own approximately 41% of the shares of the combined company, while former CAH shareholders own approximately 59%. At closing, the Company received approximately 15.1 million shares of Colony Starwood Homes, representing 13.8% of the combined company. At March 31, 2016, the Company's interest in Colony Starwood Homes increased to 14.0% following a
stock repurchase by Colony Starwood Homes of approximately 2 million shares in the first quarter of 2016. The Company's holdings of SFR stock are subject to lock-up for up to nine months after the closing of the merger. Immediately prior to completion of the merger, CAH effected an internal reorganization to exclude CAH’s residential specialty finance company, Colony American Finance, LLC ("CAF"), from the merger. As a result of the reorganization, the Company retained its 19.0% ownership interest in CAF. The Company accounts for its investment in Colony Starwood Homes under the equity method as it continues to have a significant influence over operating and financial policies of Colony Starwood Homes through its voting interest and board representation. The Company also continues to account for its investment in CAF under the equity method.
The following tables present the operating results of the Company’s reportable segments:
|
| | | | | | | | | | | | | | | | | | | | | | | | | | | | |
| | | Real Estate Equity | | | | | | | | |
| (In thousands) | | Light Industrial Platform | | Single-Family
Residential
Rentals | | Other | | Real Estate Debt | | Investment Management | | Amounts Not Allocated to Segments | | Total |
| Three Months Ended March 31, 2016 | | | | | | | | | | | | | | |
| Income: | | | | | | | | | | | | | | |
| Interest income | | $ | — |
| | $ | — |
| | $ | 3 |
| | $ | 89,347 |
| | $ | — |
| | $ | 11 |
| | $ | 89,361 |
|
| Property operating income | | 45,313 |
| | — |
| | 44,852 |
| | 1,452 |
| | — |
| | — |
| | 91,617 |
|
| Equity in (loss) income of unconsolidated joint ventures | | — |
| | (6,637 | ) | | 3,391 |
| | 5,624 |
| | (349 | ) | | 400 |
| | 2,429 |
|
| Fee income | | — |
| | — |
| | — |
| | — |
| | 16,609 |
| | — |
| | 16,609 |
|
| Other income | | 486 |
| | — |
| | 14 |
| | 1,428 |
| | — |
| | 1,274 |
| | 3,202 |
|
| Total income (loss) | | 45,799 |
| | (6,637 | ) |
| 48,260 |
| | 97,851 |
| | 16,260 |
| | 1,685 |
| | 203,218 |
|
| Expenses: | | | | | | | | | | | | | | |
| Transaction, investment and servicing costs | | 270 |
| | — |
| | 4,558 |
| | 4,280 |
| | 45 |
| | 2,268 |
| | 11,421 |
|
| Interest expense | | 9,418 |
| | — |
| | 10,676 |
| | 10,289 |
| | — |
| | 11,488 |
| | 41,871 |
|
| Property operating expenses | | 13,969 |
| | — |
| | 14,886 |
| | 1,931 |
| | — |
| | — |
| | 30,786 |
|
| Depreciation and amortization | | 21,348 |
| | — |
| | 19,798 |
| | 139 |
| | 3,745 |
| | 1,112 |
| | 46,142 |
|
| Provision for loan losses | | — |
| | — |
| | — |
| | 4,630 |
| | — |
| | — |
| | 4,630 |
|
| Impairment loss | | — |
| | — |
| | — |
| | 1,759 |
| | 320 |
| | — |
| | 2,079 |
|
| Compensation expense | | 1,868 |
| | — |
| | 824 |
| | 3,166 |
| | 9,287 |
| | 11,722 |
| | 26,867 |
|
| Administrative expenses | | 407 |
| | — |
| | 936 |
| | 1,535 |
| | 774 |
| | 9,119 |
| | 12,771 |
|
| Total expenses | | 47,280 |
| | — |
| | 51,678 |
| | 27,729 |
| | 14,171 |
| | 35,709 |
| | 176,567 |
|
| Gain on sale of real estate assets, net | | 781 |
| | — |
| | 49,430 |
| | 908 |
| | — |
| | — |
| | 51,119 |
|
| Other (loss) gain, net | | 31 |
| | — |
| | 3,897 |
| | 308 |
| | (38 | ) | | 9,847 |
| | 14,045 |
|
| Income tax benefit (expense) | | (65 | ) | | — |
| | (3,733 | ) | | (295 | ) | | 3,426 |
| | (117 | ) | | (784 | ) |
| Net (loss) income | | (734 | ) | | (6,637 | ) | | 46,176 |
| | 71,043 |
| | 5,477 |
| | (24,294 | ) | | 91,031 |
|
| Net (loss) income attributable to noncontrolling interests: | | | | | | | | | | | | | |
|
|
| Investment entities | | (901 | ) | | — |
| | 31,381 |
| | 27,115 |
| | — |
| | — |
| | 57,595 |
|
| Operating Company | | 27 |
| | (1,054 | ) | | 2,348 |
| | 6,973 |
| | 869 |
| | (5,742 | ) | | 3,421 |
|
| Net (loss) income attributable to Colony Capital, Inc. | | $ | 140 |
| | $ | (5,583 | ) | | $ | 12,447 |
| | $ | 36,955 |
| | $ | 4,608 |
| | $ | (18,552 | ) | | $ | 30,015 |
|
|
| | | | | | | | | | | | | | | | | | | | | | | | |
| | | Real Estate Equity | | | | | | |
| (In thousands) | | Light Industrial Platform | | Single-Family
Residential
Rentals | | Other | | Real Estate Debt | | Amounts Not Allocated to Segments | | Total |
| Three Months Ended March 31, 2015 | | | | | | | | | | | | |
| Income: | | | | | | | | | | | | |
| Interest income | | $ | 7 |
| | $ | — |
| | $ | 6 |
| | $ | 46,124 |
| | $ | — |
| | $ | 46,137 |
|
| Property operating income | | 36,318 |
| | — |
| | 7,475 |
| | — |
| | — |
| | 43,793 |
|
| Equity in (loss) income of unconsolidated joint ventures | | — |
| | (3,912 | ) | | 5,527 |
| | 24,734 |
| | — |
| | 26,349 |
|
| Other income | | — |
| | — |
| | — |
| | 226 |
| | 107 |
| | 333 |
|
| Total income (loss) | | 36,325 |
| | (3,912 | ) | | 13,008 |
| | 71,084 |
| | 107 |
| | 116,612 |
|
| Expenses: | | | | | | | | | | | | |
| Management fees | | — |
| | — |
| | — |
| | — |
| | 14,961 |
| | 14,961 |
|
| Transaction, investment and servicing costs | | 694 |
| | — |
| | 162 |
| | 839 |
| | 14,748 |
| | 16,443 |
|
| Interest expense | | 7,875 |
| | — |
| | 1,807 |
| | 6,700 |
| | 10,211 |
| | 26,593 |
|
| Property operating expenses | | 12,760 |
| | — |
| | 1,251 |
| | — |
| | — |
| | 14,011 |
|
| Depreciation and amortization | | 19,620 |
| | — |
| | 2,688 |
| | — |
| | — |
| | 22,308 |
|
| Provision for loan losses | | — |
| | — |
| | — |
| | 364 |
| | — |
| | 364 |
|
| Impairment loss | | 450 |
| | — |
| | — |
| | — |
| | — |
| | 450 |
|
| Compensation expense | | — |
| | — |
| | — |
| | — |
| | 615 |
| | 615 |
|
| Administrative expenses | | 502 |
| | — |
| | 112 |
| | 332 |
| | 3,220 |
| | 4,166 |
|
| Total expenses | | 41,901 |
| | — |
| | 6,020 |
| | 8,235 |
| | 43,755 |
| | 99,911 |
|
| Other (loss) gain, net | | (52 | ) | | — |
| | — |
| | — |
| | 216 |
| | 164 |
|
Income tax benefit (expense) (1) | | 122 |
| | — |
| | 49 |
| | (821 | ) | | — |
| | (650 | ) |
| Net (loss) income | | (5,506 | ) | | (3,912 | ) | | 7,037 |
| | 62,028 |
| | (43,432 | ) | | 16,215 |
|
| Net (loss) income attributable to noncontrolling interests—Investment entities | | (1,969 | ) | | — |
| | 869 |
| | 6,786 |
| | — |
| | 5,686 |
|
| Net (loss) income attributable to Colony Capital, Inc. | | $ | (3,537 | ) | | $ | (3,912 | ) | | $ | 6,168 |
| | $ | 55,242 |
| | $ | (43,432 | ) | | $ | 10,529 |
|
Total assets and equity method investments of each of segment are summarized as follows:
|
| | | | | | | | | | | | | | | | |
| | | March 31, 2016 | | December 31, 2015 |
| (In thousands) | | Segment Assets | | Equity Method Investments | | Segment Assets | | Equity Method Investments |
| Light industrial platform | | $ | 1,928,140 |
| | $ | — |
| | $ | 1,926,002 |
| | $ | — |
|
| Single-family residential rentals | | 387,979 |
| | 387,979 |
| | 394,783 |
| | 394,783 |
|
| Other real estate equity | | 2,112,701 |
| | 189,692 |
| | 2,094,794 |
| | 195,353 |
|
| Real estate debt | | 4,627,929 |
| | 216,548 |
| | 4,734,547 |
| | 214,218 |
|
| Investment management | | 790,849 |
| | 9,911 |
| | 798,213 |
| | 9,794 |
|
| Amounts not allocated to segments | | 81,558 |
| | 10,849 |
| | 90,971 |
| | 10,449 |
|
| Total | | $ | 9,929,156 |
| | $ | 814,979 |
| | $ | 10,039,310 |
| | $ | 824,597 |
|
22. Subsequent Events
On April 4, 2016, the Company redeemed 796,194 OP Units upon receipt of redemption notice from OP unitholders, with 153,150 OP units settled for cash of approximately $2.6 million, and at the Company's election, 643,044 OP units exchanged for shares of Class A common stock on a one-for-one basis. Additionally, in connection with such redemption of OP Units, 19,144 shares of Class B common stock held by the Executive Chairman were converted into an equivalent number of shares of Class A common stock on the same date.
On May 9, 2016, the Company issued 28,525 shares of Class A common stock upon redemption of an equal number of OP Units by four different charitable organizations that had, prior to the redemption, received such OP Units as a charitable contribution from certain OP unitholders.
ITEM 2. Management’s Discussion and Analysis of Financial Condition and Results of Operations.
In this quarterly report on Form 10-Q (this “Report”), we refer to Colony Capital, Inc. as “we,” “us,” “Company,” or “our,” unless we specifically state otherwise or the context indicates otherwise. We refer to our manager, Colony Financial Manager, LLC, as the "Manager,” and the former parent company of the Manager, Colony Capital, LLC, together with its consolidated subsidiaries (other than us), as “CCLLC.”
The following discussion should be read in conjunction with our unaudited consolidated financial statements and the accompanying notes thereto, which are included in Item 1 of this Report, as well as the information contained in our Annual Report on Form 10-K, as amended, for the fiscal year ended December 31, 2015, which is accessible on the Securities and Exchange Commission’s (the “SEC”) website at www.sec.gov.
IMPORTANT INFORMATION RELATED TO FORWARD-LOOKING STATEMENTS
Some of the statements contained in this Report constitute forward-looking statements within the meaning of the Private Securities Litigation Reform Act of 1995 and Section 21E of the Securities Exchange Act of 1934, as amended (the “Exchange Act”), and we intend such statements to be covered by the safe harbor provisions contained therein. Forward-looking statements relate to expectations, beliefs, projections, future plans and strategies, anticipated events or trends and similar expressions concerning matters that are not historical facts. In some cases, you can identify forward-looking statements by the use of forward-looking terminology such as “may,” “will,” “should,” “expects,” “intends,” “plans,” “anticipates,” “believes,” “estimates,” “predicts,” or “potential” or the negative of these words and phrases or similar words or phrases which are predictions of or indicate future events or trends and which do not relate solely to historical matters. You can also identify forward-looking statements by discussions of strategy, plans or intentions.
While forward-looking statements reflect our good faith beliefs, assumptions and expectations, they are not guarantees of future performance. Furthermore, we disclaim any obligation to publicly update or revise any forward-looking statement to reflect changes in underlying assumptions or factors, of new information, data or methods, future events or other changes. We caution investors not to place undue reliance on these forward-looking statements and urge you to carefully review the disclosures we make concerning risks in sections entitled “Risk Factors,” “Forward-Looking Statements,” and “Management’s Discussion and Analysis of Financial Condition and Results of Operations” in our most recent Annual Report on Form 10-K.
Overview
We are a leading global real estate and investment management firm headquartered in Los Angeles, California with more than 300 employees. Through our global investment management business, which has operated under the Colony Capital brand for more than 25 years, we have $18.2 billion of assets under management and $7.9 billion of fee-earning equity under management as of March 31, 2016. We rely on the experience and relationships cultivated over this period to target attractive risk-adjusted returns for our investors by investing primarily in real estate and real estate-related assets. We manage capital on behalf of both Company shareholders and limited partners in private investment funds under our management where the Company may earn management fees and carried interests. Our investment portfolio is primarily composed of: (i) real estate equity; (ii) real estate and real estate-related debt; and (iii) investment management of Company-sponsored private equity funds and vehicles.
We were organized on June 23, 2009 as a Maryland corporation. We operate as a REIT and generally are not subject to U.S. federal income taxes on our taxable income to the extent that we annually distribute all of our taxable income to stockholders and maintain qualification as a REIT, although we are subject to U.S. federal income tax on income earned through our taxable subsidiaries. We also operate our business in a manner that will permit us to maintain our exemption from registration as an investment company under the 1940 Act.
Combination Transaction
Prior to April 2, 2015, we were externally managed and advised by the Manager, which was a wholly-owned subsidiary of CCLLC, a privately held global real estate investment firm founded in 1991 by Thomas J. Barrack, Jr., our Executive Chairman.
On March 31, 2015, our shareholders approved the acquisition by our operating subsidiary Colony Capital Operating Company, LLC ("Operating Company" or “OP”) of substantially all of CCLLC's real estate and investment management businesses and operations, which closed on April 2, 2015 (the "Combination").
Prior to the Combination, CCLLC sponsored approximately $24 billion of equity across a variety of distinct funds and investment vehicles that collectively invested over $60 billion of total capital. Our acquisition of CCLLC's investment management business provided us with approximately $9 billion of third party fee-paying equity under management at the time
of closing. Following the Combination, we became a self-managed REIT, led by our Executive Chairman, Mr. Barrack, and Chief Executive Officer, Richard B. Saltzman, and employ the full management and investment team of CCLLC. Pursuant to the Combination, CCLLC's management contracts for its existing real estate and non-real estate funds and investment vehicles, other than CCLLC's interests in then Colony American Homes ("CAH", renamed Colony Starwood Homes, subsequent to a merger with Starwood Waypoint Residential Trust in January 2016), were contributed to the Company. As a result of the Combination, we now have the right to conduct all future Colony-branded investment activities, including the formation of real estate and non-real estate private investment funds, and own the Colony name and related intellectual property. The consideration for the Combination was paid primarily in the form of the Company’s Class A common stock, Class B common stock and membership units in OP ("OP Units," exchangeable for cash based upon the market value of an equivalent number of shares of Class A common stock, or at the Company's election, shares of Class A common stock on a one-for-one basis).
Upon consummation of the Combination, all of CCLLC’s senior executives became employed by the Company. In order to further demonstrate their collective long term commitment to the Company’s business, Messrs. Barrack and Saltzman entered into five-year employment agreements, certain other key senior executives entered into three-year employment agreements, and all such executives entered into or are subject to lock-up arrangements with the Company, which, subject to certain exceptions for estate planning, partial share pledges and tax-related sales, generally restrict them from transferring their respective interests in OP Units and/or shares received in the Combination over the same period as their respective employment agreement terms.
Organizational Structure
In connection with the Combination, the Company reorganized into an umbrella partnership real estate investment trust ("UPREIT"). As part of the restructuring, the Company contributed to OP and its subsidiaries substantially all of the Company's other subsidiaries, assets and liabilities, other than certain indebtedness, in exchange for membership interests in OP ("OP Units"). Following the Combination, OP conducts all of the activities and owns substantially all of the assets and liabilities of the combined business.
The Company's organizational structure before and after the Combination is depicted in the diagrams below.
Pre-Combination
__________
| |
| (1) | At closing of the Combination, CLNY contributed to OP substantially all of CLNY’s other subsidiaries, assets and liabilities in exchange for additional OP Units. |
Post-Combination
Our Business
Our business objective is to provide attractive risk-adjusted returns to our investors through (i) a diversified portfolio of direct and indirect real estate-related equity and real estate debt investments and (ii) fee bearing management contracts on investment funds that we manage. We expect that these returns will be delivered to our investors through both current yield in the form of regular-way and special dividends and potential capital appreciation.
Our investments are diversified across a wide spectrum of commercial real estate property types (including but not limited to, office, industrial, retail, hospitality, education, single-family and multifamily residential), and geographies, primarily within North America and Europe. These investments and our business are organized in five reportable segments as described in "—Segments" below.
Highlights
Significant developments affecting our business and results of operations for the three months ended March 31, 2016 include:
| |
| • | Closing of the merger between our equity method investee, Colony American Homes, and Starwood Waypoint Residential Trust in January 2016; |
| |
| • | Amended our credit facility on March 31, 2016 which increased our borrowing capacity by $50 million to $850 million (with an accordion to $1.275 billion) and at a lower interest rate of one-month LIBOR plus 2.25% per annum (from 2.75% per annum) for a four year term with two six-month extensions; |
| |
| • | Continued to expand our presence in Europe through an acquisition of a portfolio of 23 industrial properties in Spain for a purchase price of $94.4 million, financed by debt of $51.4 million. In the U.S, our light industrial portfolio acquired an additional property for a purchase price of $17.6 million; |
| |
| • | Realized a gain of $49.3 million from the sale of a foreclosed property in Germany, of which OP's share of the gain after attribution to noncontrolling interests was approximately $14.2 million. |
Segments
We operate our business and manage our investments in the following reportable segments:
Real Estate Equity
| |
| • | Light industrial real estate assets and associated operating platform, held through a co-investment partnership formed and managed by us acting as general partner, acquired in December 2014; |
| |
| • | Single-family residential rentals through equity method investments in Colony Starwood Homes ("SFR"), subsequent to the merger of Colony American Homes ("CAH") and Starwood Waypoint Residential Trust ("SWAY") in January 2016, and in Colony American Finance, LLC (formerly a subsidiary of CAH); |
| |
| • | Other real estate equity investments, which include real estate acquired in settlement of loans or from acquisition of operating properties, common equity in real estate or related companies, and certain preferred equity investments with profit participation meeting certain risk or return profiles; |
Real Estate Debt
| |
| • | Originations including senior and subordinated loans, commercial mortgage backed securities and preferred equity, as well as secondary loan acquisitions including performing and non-performing commercial real estate debt; and |
Investment Management
| |
| • | Investment management of Company-sponsored funds and other investment vehicles, which formed a new reportable segment following the Combination on April 2, 2015. |
The five reportable segments represent distinct revenue streams to the Company, consisting of rental and property operating income, interest income and fee income, respectively. Costs which are directly attributable, or otherwise can be subjected to a reasonable and systematic allocation, have been allocated to each of the reportable segments.
Condensed Segment Balance Sheets
|
| | | | | | | | | | | | | | | | | | | | | | | | | | | | |
| | | Real Estate Equity | | | | | | | | |
| ($ in thousands) | | Light Industrial Platform | | Single Family Residential Rentals | | Other | | Real Estate Debt | | Investment Management | | Amounts Not Allocated to Segments | | Total |
| March 31, 2016 | | | | | | | | | | | | | | |
| Assets | | | | | | | | | | | | | | |
| Cash | | $ | 25,371 |
| | $ | — |
| | $ | 66,588 |
| | $ | 53,887 |
| | $ | 17,968 |
| | $ | 7,486 |
| | $ | 171,300 |
|
| Loans receivable held for investment, net | | — |
| | — |
| | — |
| | 4,067,544 |
| | — |
| | — |
| | 4,067,544 |
|
| Real estate assets, net | | | | | | | | | | | | | | |
| Held for investment | | 1,762,969 |
| | — |
| | 1,473,695 |
| | 19,810 |
| | — |
| | — |
| | 3,256,474 |
|
| Held for sale | | 4,658 |
| | — |
| | 69,113 |
| | 79,645 |
| | — |
| | — |
| | 153,416 |
|
| Investments in unconsolidated joint ventures | | — |
| | 387,979 |
| | 289,428 |
| | 216,548 |
| | 9,911 |
| | 10,849 |
| | 914,715 |
|
| Goodwill | | 20,000 |
| | — |
| | — |
| | — |
| | 660,127 |
| | — |
| | 680,127 |
|
| Deferred leasing costs and intangible assets, net | | 77,779 |
| | — |
| | 168,426 |
| | 175 |
| | 81,740 |
| | — |
| | 328,120 |
|
| Other assets | | 37,363 |
| | — |
| | 45,451 |
| | 190,320 |
| | 21,103 |
| | 63,223 |
| | 357,460 |
|
| Total assets | | $ | 1,928,140 |
| | $ | 387,979 |
| | $ | 2,112,701 |
| | $ | 4,627,929 |
| | $ | 790,849 |
| | $ | 81,558 |
| | $ | 9,929,156 |
|
| Liabilities | | | | | | | | | | | | | | |
| Debt, net | | $ | 1,139,209 |
| | $ | — |
| | $ | 1,006,105 |
| | $ | 1,104,279 |
| | $ | — |
| | $ | 937,638 |
| | $ | 4,187,231 |
|
| Intangible liabilities, net | | 11,565 |
| |
|
| | 12,832 |
| | — |
| | — |
| | — |
| | 24,397 |
|
| Other liabilities | | 42,772 |
| | — |
| | 88,039 |
| | 103,296 |
| | 50,977 |
| | 119,034 |
| | 404,118 |
|
| Total liabilities | | 1,193,546 |
| | — |
| | 1,106,976 |
| | 1,207,575 |
| | 50,977 |
| | 1,056,672 |
| | 4,615,746 |
|
| Equity | | | | | | | | | | | | | | |
| Stockholders' equity | | 406,922 |
| | 337,459 |
| | 502,240 |
| | 1,782,783 |
| | 643,531 |
| | (848,142 | ) | | 2,824,793 |
|
| Noncontrolling interests: | | | | | | | | | | | | | | |
| Investment entities | | 266,753 |
| | — |
| | 428,297 |
| | 1,370,678 |
| | — |
| | — |
| | 2,065,728 |
|
| Operating Company | | 60,919 |
| | 50,520 |
| | 75,188 |
| | 266,893 |
| | 96,341 |
| | (126,972 | ) | | 422,889 |
|
| Total equity | | 734,594 |
| | 387,979 |
| | 1,005,725 |
| | 3,420,354 |
| | 739,872 |
| | (975,114 | ) | | 5,313,410 |
|
| Total liabilities and equity | | $ | 1,928,140 |
| | $ | 387,979 |
| | $ | 2,112,701 |
| | $ | 4,627,929 |
| | $ | 790,849 |
| | $ | 81,558 |
| | $ | 9,929,156 |
|
By Geography(1): | | | | | | | | | | | | | | |
| United States | | 100% | | 100% | | 40% | | 78% | | 59% | |
| |
|
| Europe | | —% | | —% | | 60% | | 19% | | 37% | | | |
|
| Other | | —% | | —% | | —% | | 3% | | 4% | | | | |
|
| | | | | | | | | | | | | | | | | | | | | | | | | | | | |
| | | Real Estate Equity | | | | | | | | |
| (In thousands) | | Light Industrial Platform | | Single Family Residential Rentals | | Other | | Real Estate Debt | | Investment Management | | Amounts Not Allocated to Segments | | Total |
| December 31, 2015 | | | | | | | | | | | | | | |
| Assets | | | | | | | | | | | | | | |
| Cash | | $ | 12,129 |
| | $ | — |
| | $ | 61,548 |
| | $ | 70,086 |
| | $ | 28,499 |
| | $ | 13,592 |
| | $ | 185,854 |
|
| Loans receivable, net | | | | | | | | | | | | | | |
| Held for investment | | — |
| | — |
| | — |
| | 4,048,477 |
| | — |
| | — |
| | 4,048,477 |
|
| Held for sale | | — |
| | — |
| | — |
| | 75,002 |
| | — |
| | — |
| | 75,002 |
|
| Real estate assets, net | | | | | | | | | | — |
| | | | |
| Held for investment | | 1,765,159 |
| | — |
| | 1,347,099 |
| | 19,960 |
| | — |
| | — |
| | 3,132,218 |
|
| Held for sale | | 6,110 |
| | — |
| | 197,860 |
| | 93,917 |
| | — |
| | — |
| | 297,887 |
|
| Investments in unconsolidated joint ventures | | — |
| | 394,783 |
| | 295,221 |
| | 214,218 |
| | 9,794 |
| | 10,449 |
| | 924,465 |
|
| Goodwill | | 20,000 |
| | — |
| | — |
| | — |
| | 658,267 |
| | — |
| | 678,267 |
|
| Deferred leasing costs and intangible assets, net | | 81,861 |
| | — |
| | 155,808 |
| | 140 |
| | 87,704 |
| | — |
| | 325,513 |
|
| Other assets | | 40,743 |
| | — |
| | 37,258 |
| | 212,747 |
| | 13,949 |
| | 66,930 |
| | 371,627 |
|
| Total assets | | 1,926,002 |
| | 394,783 |
| | 2,094,794 |
| | 4,734,547 |
| | 798,213 |
| | 90,971 |
| | 10,039,310 |
|
| Liabilities | | | | | | | | | | | | | |
|
| Debt, net | | 1,092,277 |
| | — |
| | 994,160 |
| | 1,143,304 |
| | — |
| | 949,062 |
| | 4,178,803 |
|
| Intangible liabilities, net | | 12,339 |
| | — |
| | 12,183 |
| | — |
| | — |
| | — |
| | 24,522 |
|
| Other liabilities | | 43,717 |
| | — |
| | 71,819 |
| | 126,939 |
| | 45,406 |
| | 131,864 |
| | 419,745 |
|
| Total liabilities | | 1,148,333 |
| | — |
| | 1,078,162 |
| | 1,270,243 |
| | 45,406 |
| | 1,080,926 |
| | 4,623,070 |
|
| Equity | | | | | | | | | | | | | | |
| Stockholders' equity | | $ | 430,140 |
| | $ | 342,938 |
| | $ | 513,124 |
| | $ | 1,766,719 |
| | $ | 653,941 |
| | $ | (859,946 | ) | | $ | 2,846,916 |
|
| Noncontrolling interests : | | | | | | | | | | | | | | |
| Investment entities | | 282,500 |
| | — |
| | 425,934 |
| | 1,430,491 |
| | — |
| | — |
| | 2,138,925 |
|
| Operating Company | | 65,029 |
| | 51,845 |
| | 77,574 |
| | 267,094 |
| | 98,866 |
| | (130,009 | ) | | 430,399 |
|
| Total equity | | 777,669 |
| | 394,783 |
| | 1,016,632 |
| | 3,464,304 |
| | 752,807 |
| | (989,955 | ) | | 5,416,240 |
|
| Total liabilities and equity | | $ | 1,926,002 |
| | $ | 394,783 |
| | $ | 2,094,794 |
| | $ | 4,734,547 |
| | $ | 798,213 |
| | $ | 90,971 |
| | $ | 10,039,310 |
|
By Geography: (1) | | | | | | | | | | | | | |
|
| United States | | 100% | | 100% | | 42% | | 81% | | 62% | | | |
|
| Europe | | —% | | —% | | 58% | | 18% | | 35% | | | | |
| Other | | —% | | —% | | —% | | 1% | | 3% | | | |
|
__________
| |
(1) | Geographic breakdown for each segment is based on the net assets of the underlying investments held by each segment, except for the investment management segment, which is based on assets under management. |
Results of Operations
Our results of operations were substantially impacted by the Combination in April 2015, as discussed below, as well as our continued capital raising efforts and ongoing investment activities, with an increasing focus on investments in real estate equity in addition to real estate debt.
The following table summarizes our segment results:
|
| | | | | | | | | | | | | | | | | | | | | | | | |
| Three Months Ended March 31, | | Total Income | | Net (Loss) Income | | Net (Loss) Income Attributable to Colony Capital, Inc. |
| (In thousands) | | 2016 | | 2015 | | 2016 | | 2015 | | 2016 | | 2015 |
| Light Industrial Platform | | $ | 45,799 |
| | $ | 36,325 |
| | $ | (734 | ) | | $ | (5,506 | ) | | $ | 140 |
| | $ | (3,537 | ) |
| Single Family Residential | | (6,637 | ) | | (3,912 | ) | | (6,637 | ) | | (3,912 | ) | | (5,583 | ) | | (3,912 | ) |
| Other Real Estate Equity | | 48,260 |
| | 13,008 |
| | 46,176 |
| | 7,037 |
| | 12,447 |
| | 6,168 |
|
| Real Estate Debt | | 97,851 |
| | 71,084 |
| | 71,043 |
| | 62,028 |
| | 36,955 |
| | 55,242 |
|
Investment Management (1) | | 16,260 |
| | NA |
| | 5,477 |
| | NA |
| | 4,608 |
| | NA |
|
__________
| |
| (1) | Investment management is a new segment upon consummation of the Combination on April 2, 2015. |
Effects of the Combination
Effective April 2, 2015, with the closing of the Combination, our business has expanded to include investment management, which provides a new source of revenue in the form of fee income. Following the internalization of our Manager, we have replaced management fees with directly incurred costs such as compensation, overhead costs and other administrative expenses.
Additionally, as a result of the Combination in which we became the investment manager of Colony-sponsored funds, we were deemed to hold a controlling financial interest in 52 real estate investment entities that have participating interests from these funds. We previously accounted for these investment entities under the equity method, reflecting only our proportionate interests in these entities. We did not acquire any additional interests nor dispose any existing interests in these investment entities in conjunction with the Combination. Beginning April 2, 2015, we consolidated these 52 investments entities. Consequently, our results for the three months ended March 31, 2016 and 2015 are not directly comparable. For the three months ended March 31, 2016, the consolidation of these investment entities resulted in a gross-up of total income, before the effect of lower equity in income of unconsolidated joint ventures, as well as total expenses, with a corresponding increase in net income attributable to noncontrolling interests in investment entities.
Equity—Light Industrial Platform
|
| | | | | | | | | | | | |
| | | Three Months Ended March 31, | | |
| (In thousands) | | 2016 | | 2015 | | Change |
| Income | | | | | | |
| Interest income | | $ | — |
| | $ | 7 |
| | $ | (7 | ) |
| Property operating income | | 45,313 |
| | 36,318 |
| | 8,995 |
|
| Other income | | 486 |
| | — |
| | 486 |
|
| Total income | | 45,799 |
| | 36,325 |
| | 9,474 |
|
| Expenses | | | | | | |
| Transaction, investment and servicing costs | | 270 |
| | 694 |
| | (424 | ) |
| Interest expense | | 9,418 |
| | 7,875 |
| | 1,543 |
|
| Property operating expenses | | 13,969 |
| | 12,760 |
| | 1,209 |
|
| Depreciation and amortization | | 21,348 |
| | 19,620 |
| | 1,728 |
|
| Impairment loss | | — |
| | 450 |
| | (450 | ) |
| Compensation expense | | 1,868 |
| | — |
| | 1,868 |
|
| Administrative expenses | | 407 |
| | 502 |
| | (95 | ) |
| Total expenses | | 47,280 |
| | 41,901 |
| | 5,379 |
|
| Gain on sale of real estate assets, net | | 781 |
| | — |
| | 781 |
|
| Other loss, net | | 31 |
| | (52 | ) | | 83 |
|
| Income tax (expense) benefit | | (65 | ) | | 122 |
| | (187 | ) |
| Net loss | | (734 | ) | | (5,506 | ) | | 4,772 |
|
| Net income (loss) attributable to noncontrolling interests: | | | | | | |
| Investment entities | | (901 | ) | | (1,969 | ) | | 1,068 |
|
| Operating Company | | 27 |
| | — |
| | 27 |
|
| Net income (loss) attributable to Colony Capital, Inc. | | $ | 140 |
| | $ | (3,537 | ) | | $ | 3,677 |
|
We acquired a portfolio of light industrial properties and operating platform in December 2014. The portfolio acquisition was completed through an indirectly owned operating partnership with third-party limited partners who own approximately 38% of the property portfolio, while we acquired 100% of the associated operating platform. The operating partnership may be required to fund additional amounts for future real estate acquisitions and operating costs, as directed by its general partner, an affiliate entity controlled by us. At March 31, 2016, total unfunded commitment of the operating partnership was $163.2 million, comprising our share of $101.9 million and $61.3 million from the limited partners.
Operating Metrics
See "—Information About Our Real Estate Portfolios" for additional information on the real estate assets held within our light industrial portfolio as of March 31, 2016.
|
| | | | | | | | | | |
| | | Number of Properties | | Number of Buildings | | Rentable Square Feet (in thousands) | | Annualized Base Rent (in thousands) (1) | | Percentage Leased |
| March 31, 2016 | | 277 | | 325 | | 34,773 | | $139,757 | | 94% |
| December 31, 2015 | | 278 | | 325 | | 34,738 | | 135,936 | | 93% |
| March 31, 2015 | | 261 | | 302 | | 30,823 | | 115,178 | | 90% |
_________
| |
(1) | Represents annualized fixed base rental amount using rental revenue computed on a straight-line basis in accordance with GAAP and excludes the impact of amortization of above- and below-market lease values. |
For the three months ended March 31, 2016, we acquired one property with two buildings in Maryland and sold two properties with one building each in Houston and Atlanta. Between December 31, 2015 and March 31, 2016, the size and composition of our light industrial portfolio remained largely consistent with 277 properties and 34.8 million square feet.
Segment Balance Sheets
Real estate assets balance is consistent at $1.8 billion at March 31, 2016 and December 31, 2015. Real estate activity in the three months ended March 31, 2016 included acquisition of one building, including land, at $16.6 million, disposition of two buildings with aggregate carrying values of $6.9 million, and $15.3 million of depreciation on the overall portfolio during the period.
Debt levels remained at $1.1 billion between December 31, 2015 and March 31, 2016. In July 2015, the light industrial portfolio had (i) refinanced $151.1 million of short-term floating rate bridge debt with $165.8 million of longer term, fixed rate debt on assets for longer term hold; and (ii) closed on a new $100.0 million revolving credit facility to pursue additional acquisitions. In March 2016, an additional $17.1 million of floating rate acquisition debt was refinanced with a new fixed rate debt. Over time, the light industrial portfolio expects to replace more of its short-term floating rate acquisition debt with longer term, fixed rate debt.
Segment Results of Operations
Three Months Ended March 31, 2016 and 2015
For the three months ended March 31, 2016 , total income was $9.5 million higher at $45.8 million, while net loss was $4.8 million lower at $0.7 million, compared to the three months ended March 31, 2015. After allocation to noncontrolling interests, net income of $0.1 million was attributable to us for the three months ended March 31, 2016 in comparison to $3.5 million of net loss attributable to us for the three months ended March 31, 2015.
Improvements in operating results stem from growth and scalability of the portfolio. Between March 31, 2015 and March 31, 2016, the light industrial portfolio acquired 32 buildings and sold 9 buildings for a net addition of 23 building, adding approximately four million rentable square feet, with overall leased percentage increasing from 90% to 94%.
As a result, comparing the three months ended March 31, 2016 and 2015, the light industrial portfolio recorded a 24.8% increase in property operating income, consisting of rental income and tenant reimbursements, to $45.3 million, with a lower increase in total expenses by 12.8% to $47.3 million. Additionally, the three months ended March 31, 2016 included $0.8 million of gain from sale of two properties while an impairment loss of approximately $0.5 million was taken in the three months ended March 31, 2015 for selling costs on a property classified as held for sale.
With the growth of the portfolio, property operating expenses increased 9.5% to $14.0 million while depreciation of real estate assets and amortization of related intangibles increased 8.8% to $21.3 million between the three months ended March 31, 2016 and 2015. In the same period, interest expense was $1.5 million higher at $9.4 million for financing of new acquisitions. The three months ended March 31, 2016 also included $1.9 million of compensation costs that we now bear subsequent to the closing of the Combination on April 2, 2015.
For the three months ended March 31, 2016, noncontrolling interests in investment entities was attributed a higher net loss as a result of a disproportionate allocation of net income to our controlled affiliate, as general partner, in accordance with the terms of the operating partnership.
Equity—Single Family Residential Rentals
|
| | | | | | | | | | | | |
| | | Three Months Ended March 31, | | |
| (In thousands) | | 2016 | | 2015 | | Change |
| Equity in loss of unconsolidated joint ventures | | $ | (6,637 | ) | | $ | (3,912 | ) | | $ | (2,725 | ) |
| Net loss attributable to noncontrolling interests in Operating Company | | (1,054 | ) | | — |
| | (1,054 | ) |
| Net loss attributable to Colony Capital, Inc. | | $ | (5,583 | ) | | $ | (3,912 | ) | | $ | (1,671 | ) |
Our investment in single-family residential rental homes represents a 14.0% interest in Colony Starwood Homes (formerly Colony American Homes, LLC or "CAH") and a 19.0% interest in Colony American Finance, LLC ("CAF"), reported under the equity method. Colony Starwood Homes is in the business of acquiring single family residential properties either directly or indirectly through joint venture investments, renovating and managing these properties to hold for investment and generating rental income through operating leases. CAF is a specialty finance company that lends to owners of single family homes for rent.
Significant Development in 2016
On January 5, 2016, pursuant to a merger agreement in September 2015, CAH and SWAY completed a merger of the two companies into Colony Starwood Homes, in a stock-for-stock transaction. Colony Starwood Homes continues to trade on the New York Stock Exchange under the ticker symbol "SFR." The combined internally-managed company has total assets of approximately $7.7 billion and is expected to achieve significant cost synergies.
Upon completion of the merger, based on each company’s net asset value, existing SWAY shareholders and the former owner of the SWAY manager own approximately 41% of the shares of the combined company, while former CAH shareholders own approximately 59%. At closing, we received approximately 15.1 million SFR shares, representing 13.8% of the combined company. At March 31, 2016, our interest in Colony Starwood Homes increased to 14.0% following a stock repurchase by Colony Starwood Homes of approximately 2 million shares in the first quarter of 2016. Our interest in Colony Starwood Homes is valued at approximately $389.6 million based on the closing price of its common stock on May 6, 2016. Our holdings of SFR stock are subject to lock-up for nine months after the closing of the merger.
Immediately prior to completion of the merger, CAH effected an internal reorganization to exclude its subsidiary, CAF, from the merger.
Operating Metrics
|
| | | | |
| | | Number of Homes | | Occupancy Rate |
| March 31, 2016 | | 30,000+ homes | | 95% |
| December 31, 2015 | | 18,800+ homes | | 95% |
Post-merger, Colony Starwood Homes owns and manages more than 30,000 homes with an overall portfolio occupancy of 95% as of March 31, 2016.
In May 2016, Colony Starwood Homes declared a dividend for the second quarter of 2016 of $0.22 per share. Based on our ownership of 15.1 million shares, we will receive $3.3 million, which represents an annualized dividend yield of 3.4% on our cost basis.
Segment Results of Operations
Three Months Ended March 31, 2016 and 2015
At March 31, 2016, our interests in Colony Starwood Homes and CAF had carrying values of $331.5 million and $56.5 million, respectively.
For the three months ended March 31, 2016 and 2015 our share of results from the single family residential rentals business was a net loss before noncontrolling interests of $6.6 million post-merger and $3.9 million pre-merger, respectively. These results include real estate depreciation and amortization expense of $6.0 million and $5.5 million for the three months ended March 31, 2016 and 2015, respectively. Additionally, the post-merger results included our share of $3.1 million of transaction and integration costs of the merger as well as $1.5 million of net loss from the legacy SWAY nonperforming loans business.
Equity—Other Real Estate Equity Investments
|
| | | | | | | | | | | | |
| | | Three Months Ended March 31, | | |
| (In thousands) | | 2016 | | 2015 | | Change |
| Income | | | | | | |
| Interest income | | $ | 3 |
| | $ | 6 |
| | $ | (3 | ) |
| Property operating income | | 44,852 |
| | 7,475 |
| | 37,377 |
|
| Equity in income of unconsolidated joint ventures | | 3,391 |
| | 5,527 |
| | (2,136 | ) |
| Other income | | 14 |
| | — |
| | 14 |
|
| Total income | | 48,260 |
| | 13,008 |
| | 35,252 |
|
| Expenses | | | | | | |
| Transaction, investment and servicing costs | | 4,558 |
| | 162 |
| | 4,396 |
|
| Interest expense | | 10,676 |
| | 1,807 |
| | 8,869 |
|
| Property operating expenses | | 14,886 |
| | 1,251 |
| | 13,635 |
|
| Depreciation and amortization | | 19,798 |
| | 2,688 |
| | 17,110 |
|
| Compensation expense | | 824 |
| | — |
| | 824 |
|
| Administrative expenses | | 936 |
| | 112 |
| | 824 |
|
| Total expenses | | 51,678 |
| | 6,020 |
| | 45,658 |
|
| Gain on sale of real estate assets, net | | 49,430 |
| | — |
| | 49,430 |
|
| Other gain, net | | 3,897 |
| | — |
| | 3,897 |
|
| Income tax (expense) benefit | | (3,733 | ) | | 49 |
| | (3,782 | ) |
| Net income | | 46,176 |
| | 7,037 |
| | 39,139 |
|
| Net income attributable to noncontrolling interests: | | | | | | |
| Investment entities | | 31,381 |
| | 869 |
| | 30,512 |
|
| Operating Company | | 2,348 |
| | — |
| | 2,348 |
|
| Net income attributable to Colony Capital, Inc. | | $ | 12,447 |
| | $ | 6,168 |
| | $ | 6,279 |
|
Our investments in other real estate equity comprise interests in a diverse portfolio of real estate assets that includes multifamily, office, retail, hotel, industrial, educational institutions and other commercial properties. Certain of our equity interests were obtained through foreclosures or deed-in-lieu of foreclosures on collateral assets from originated or acquired debt.
Operating Metrics
See "—Information About Our Real Estate Portfolios" for the composition of properties wholly-owned or partially-owned by us that were consolidated and presented as real estate assets held for investment at March 31, 2016.
With continued expansion of our footprint in Europe along with disposition of an investment in Europe in the first quarter of 2016, 60% of net assets in the other real estate equity segment were located in Europe at March 31, 2016 compared to 58% at December 31, 2015.
Segment Balance Sheets
Between December 31, 2015 and March 31, 2016, our real estate assets and corresponding debt balances were level at $1.5 billion and $1.0 billion, respectively. During the three months ended March 31, 2016, we acquired a portfolio of 23 industrial properties in Spain for a purchase price of $94.4 million, financed with $51.4 million mortgage debt. In the same period, we sold properties with aggregate carrying values of $97.6 million. At March 31, 2016, $69.1 million of our real estate assets were held for sale, consisting primarily of properties in Italy and the United Kingdom, as well as certain properties in our hotel portfolio.
Segment Results of Operations
Three Months Ended March 31, 2016 and 2015
Net income for the three months ended March 31, 2016 and 2015 was $46.2 million and $7.0 million, and after attribution to noncontrolling interests, was $12.4 million and $6.2 million, respectively.
Comparability of the three months ended March 31, 2016 results to the three months ended March 31, 2015 is affected by (i) growth in our real estate equity portfolio through acquisition of 49 properties for approximately $0.9 billion between March 2015 and March 2016 with $0.5 billion of debt outstanding at March 31, 2016; and (ii) the consolidation of previous equity
method investments, which resulted in a gross-up of income and expenses with a larger attribution to noncontrolling interests in investment entities, although this has no net effect to net income attributable to OP for the three months ended March 31, 2016.
Additionally, we sold several properties in the three months ended March 31, 2016, with one property in Germany contributing $49.3 million of the gain, of which approximately $14.2 million was attributable to OP after allocation to noncontrolling interest in the related investment entity.
Comparing the three months ended March 31, 2016 and 2015, property operating income increased by $37.4 million from $7.5 million, of which approximately $20.0 million was contributed by previous equity method investments consolidated in April 2015 and $16.8 million from new acquisitions during this period. Similarly, depreciation and amortization, property operating expenses and interest expense aggregated to $45.3 million and $5.7 million for the three months ended March 31, 2016 and 2015, respectively, with approximately $20.0 million of the increase resulting from the consolidation of previous equity method investments and $19.4 million from new acquisitions.
Net income from unconsolidated investments decreased from $5.5 million to $3.4 million due to higher net income compared to higher net losses from two equity method investments in the three months ended March 31, 2016 and 2015.
For the three months ended March 31, 2016, transaction costs of $3.7 million were incurred on the acquisition of a portfolio of 23 industrial properties in Spain.
As we expand our portfolio in Europe, we are increasingly exposed to the risk of fluctuations in foreign exchange rates. For the most part, we have hedged our foreign exchange risk related to these investments, which has limited the impact to our net income. Other gain of $3.9 million for the three months ended March 31, 2016 represents an unrealized gain of $5.2 million on a forward currency contract, offset by mark-to-market losses on interest rate caps of $1.3 million. These contracts were not designated as hedges for accounting purposes.
For the first quarter of 2016, we recorded an income tax expense of $3.7 million compared to minimal income tax benefit recorded in the same period of 2015. The income tax expense in 2016 reflects our growing real estate equity business in Europe and consisted primarily of income tax on gross revenues from operating real estate held in the United Kingdom as well as taxes related to a property in Germany that was sold in February 2016.
The three months ended March 31, 2016 also included compensation and administrative costs that we incur directly subsequent to the Combination in April 2015, of which approximately $1.8 million was allocated to the other real estate equity segment. In the first quarter of 2015, we incurred a management fee charge which was not allocated to reportable segments.
Real Estate Debt
|
| | | | | | | | | | | | |
| | | Three Months Ended March 31, | | |
| (In thousands) | | 2016 | | 2015 | | Change |
| Income | | | | | | |
| Interest income | | $ | 89,347 |
| | $ | 46,124 |
| | $ | 43,223 |
|
| Property operating income | | 1,452 |
| | — |
| | 1,452 |
|
| Equity in income of unconsolidated joint ventures | | 5,624 |
| | 24,734 |
| | (19,110 | ) |
| Other income | | 1,428 |
| | 226 |
| | 1,202 |
|
| Total income | | 97,851 |
| | 71,084 |
| | 26,767 |
|
| Expenses | | | | | | |
| Transaction, investment and servicing costs | | 4,280 |
| | 839 |
| | 3,441 |
|
| Interest expense | | 10,289 |
| | 6,700 |
| | 3,589 |
|
| Property operating expenses | | 1,931 |
| | — |
| | 1,931 |
|
| Depreciation and amortization | | 139 |
| | — |
| | 139 |
|
| Provision for loan losses | | 4,630 |
| | 364 |
| | 4,266 |
|
| Impairment loss | | 1,759 |
| | — |
| | 1,759 |
|
| Compensation expense | | 3,166 |
| | — |
| | 3,166 |
|
| Administrative expenses | | 1,535 |
| | 332 |
| | 1,203 |
|
| Total expenses | | 27,729 |
| | 8,235 |
| | 19,494 |
|
| Gain on sale of real estate assets, net | | 908 |
| | — |
| | 908 |
|
| Other gain, net | | 308 |
| | — |
| | 308 |
|
| Income tax expense | | (295 | ) | | (821 | ) | | 526 |
|
| Net income | | 71,043 |
| | 62,028 |
| | 9,015 |
|
| Net income attributable to noncontrolling interests: | | | | | | |
| Investment entities | | 27,115 |
| | 6,786 |
| | 20,329 |
|
| Operating Company | | 6,973 |
| | — |
| | 6,973 |
|
| Net income attributable to Colony Capital, Inc. | | $ | 36,955 |
| | $ | 55,242 |
| | $ | (18,287 | ) |
Our real estate debt portfolio includes originations and acquisitions of senior loans and subordinated debt, including preferred equity that meets certain risk and fixed return parameters. We hold our real estate debt investments and generate interest income either directly or indirectly through our investments in unconsolidated investment entities. We have been continually investing in our target assets over time, and therefore, income from some investments may reflect less than a full quarter’s results of operations. We have also sold or received early payoffs on some of our debt investments, sometimes at substantial gains, which affect period over period comparability.
Segment Balance Sheets
At March 31, 2016 and December 31, 2015, our loan and debt balances remained level at $4.1 billion and $1.1 billion, respectively. In the first quarter of 2016, we originated one new loan with a carrying value of $63.4 million, net of origination fees, and sold a loan acquired in December 2015 at approximately its carrying value of $75.0 million.
Our overall net investment exposure to Europe in the real estate debt segment was largely consistent between March 31, 2016 at 19% and December 31, 2015 at 18%.
Segment Results of Operations
Three Months Ended March 31, 2016 and 2015
Beginning in April 2015, the consolidation of previous equity method investments significantly increased the size of our consolidated real estate debt portfolio. In particular, this resulted in consolidation of a large volume of purchased credit-impaired ("PCI") loans held through joint venture entities.
Comparability of our results between the three months ended March 31, 2016 and 2015 is affected by consolidation of these previous equity method investments, which resulted in a gross-up of income and expenses with a larger attribution to noncontrolling interests in investment entities, although this has no net effect to net income attributable to OP for the three months ended March 31, 2016.
Net income for the three months ended March 31, 2016 and 2015 were $71.0 million and $62.0 million, respectively. Net income attributable to us for the three months ended March 31, 2016 after allocation to noncontrolling interests was $37.0
million. The three months ended March 31, 2016 included $7.0 million of net income allocated to noncontrolling interests in OP and net income at the OP level was $43.9 million, compared to $55.2 million for the three months ended March 31, 2015. Key changes in results of the real estate debt segment during this period include the following:
Our loan balance almost doubled from $2.1 billion to $4.1 billion between March 31, 2015 and March 31, 2016, resulting primarily from consolidation of previous equity method investments in April 2015 which added $1.6 billion to our loan balance, new originations and acquisitions of $1.1 billion and net of repayments of $0.8 billion. As a result, interest income increased $43.2 million in this period with $28.6 million contributed by these consolidated investments and $19.6 million from new loan originations and acquisitions, netted by loan repayments and payoffs.
Interest expense increased $3.6 million, primarily from an additional securitization completed in September 2015, which was accounted for as a secured financing.
We periodically assess the credit quality of our real estate debt portfolio and as of March 31, 2016, carried an allowance for loan losses of $39.7 million against our $4.1 billion consolidated loan balance. The majority of our allowance for loan losses, specifically $36.0 million, pertain to PCI loans from previous equity method investments consolidated in April 2015. For the three months ended March 31, 2016, provision for loan losses was $4.6 million, comprising $1.3 million on PCI loans and $3.2 million on two non-PCI loans, including a loan modified as a troubled debt restructure. As these are loans that are partially-owned by us, OP's share of the provision for loan losses for the three months ended March 31, 2016 and allowance for loan losses at March 31, 2016, net of noncontrolling interests in investment entities, were $3.4 million and $12.7 million, respectively. By comparison, our PCI loan portfolio was largely held through our joint venture investments which were accounted for under the equity method prior to April 2015. For the three months ended March 31, 2015, our share of provision for loan losses, included in net income from unconsolidated joint ventures, was approximately $1.2 million.
The consolidation of previous equity method investments contributed largely to the $19.1 million decrease in income from unconsolidated joint ventures, $1.2 million increase in other income, which are mainly expense recoveries from borrowers, and $3.4 million increase in transaction, investment and servicing costs.
Foreclosed properties held by previous equity method investments that were consolidated in April 2015 contributed $1.5 million of net loss, including impairment loss to write down held for sale properties to their fair value less disposal costs. There were no foreclosed properties held directly prior to consolidation of the equity-method investments.
Expenses for the three months ended March 31, 2016 included $4.7 million of compensation and administrative costs that were directly attributable to the real estate debt segment. Prior to the Combination, we incurred a management fee charge and only certain cost reimbursements were allocated to reportable segments.
Investment Management
|
| | | | |
| (In thousands) | | Three Months Ended March 31, 2016 |
| Income | | |
| Equity in loss of unconsolidated joint ventures | | $ | (349 | ) |
| Fee income | | 16,609 |
|
| Total income | | 16,260 |
|
| Expenses | | |
| Transaction, investment and servicing costs | | 45 |
|
| Depreciation and amortization | | 3,745 |
|
| Impairment loss | | 320 |
|
| Compensation expense | | 9,287 |
|
| Administrative expenses | | 774 |
|
| Total expenses | | 14,171 |
|
| Other loss, net | | (38 | ) |
| Income tax benefit | | 3,426 |
|
| Net income | | 5,477 |
|
| Net income attributable to noncontrolling interests in Operating Company | | 869 |
|
| Net income attributable to Colony Capital, Inc. | | $ | 4,608 |
|
Through the Combination which closed on April 2, 2015, we acquired (i) the investment management business of CCLLC, in which we assumed CCLLC's in-place investment advisory contracts that generate management fee income; and (ii) ownership of the Colony trade name under which we sponsor new funds or similar investment vehicles as general partner post-Combination.
Following the closing of the Combination, the acquired investment management business constituted a new segment.
Income from our investment management business is derived primarily from:
| |
| • | Management fee income as investment advisor, comprising (a) base management fees for the day-to-day operations and administration of our managed funds, generally around 1% per annum of the limited partners' net funded capital; and (b) asset management fees, which are one-time fees received upon closing of each investment made by our managed funds, typically calculated as 0.5% of the limited partners' net funded capital on each investment, with a portion of the fee recognized upon completion of underwriting and remaining fee recognized over the holding period of each investment; |
| |
| • | Investment income from (a) our nominal interests in our sponsored funds as general partner, or (b) our investment in third party asset managers in which we have a significant influence, both of which are accounted for as an equity method investment; and in the future, |
| |
| • | Performance based incentive income as general partner, which is earned when the cumulative returns of our sponsored funds are in excess of preferred returns to limited partners. |
In May 2015, we acquired a 50% interest in a German-based asset management platform.
In December 2015, we held a closing of a Company-sponsored global real estate credit fund (the “Global Credit Fund"), with total callable capital commitments of $688.6 million, inclusive of our capital commitment. Our co-investment activities alongside the Global Credit Fund are conducted through joint ventures between us and the Global Credit Fund. As of March 31, 2016, we have committed capital of $1.0 million as general partner to be funded directly into the Global Credit Fund, of which $0.3 million was funded, and an additional $136.7 million as an affiliate of the general partner ("GP Affiliate") with commitments satisfied through direct funding into the co-investment joint ventures, of which $43.9 million was funded. In subsequent closings, our cumulative capital commitments to the Global Credit Fund will be determined as the lower of $500.0 million or 20% of total capital commitments.
Operating Metrics
|
| | | | |
| (In billions) | | March 31, 2016 | | December 31, 2015 |
Assets under management ("AUM") (1) | | $18.2 | | $18.8 |
Fee-earning equity under management ("FEEUM") (2) | | $7.9 | | $9.3 |
__________
| |
(1) | AUM refers to the assets for which the Company provides investment management services and includes assets for which we may or may not charge management fees and/or performance allocations. AUM is the sum of: a) the gross fair value of investments held directly by the Company or managed by the Company on behalf of its private funds, co-investments, or other investment vehicles; b) leverage, inclusive of debt held by investments and deferred purchases prices; c) uncalled limited partner capital commitments that the Company is entitled to call from investors during the given commitment period at its discretion pursuant to the terms of their respective funds; and d) with respect to majority-owned and substantially controlled investments the Company consolidates gross assets attributable to third-party investors. The Company’s calculations of AUM may differ from the calculations of other asset managers, and as a result, these measures may not be comparable to similar measures presented by other asset managers. |
| |
(2) | FEEUM refers to the equity for which the Company provides investment management services and from which it derives management fees and/or performance allocations. At March 31, 2016, FEEUM includes approximately $0.9 billion of uncalled limited partner capital commitments that does not bear fees until such capital is called at the Company’s discretion. Additionally, $0.3 billion pertains to FEEUM of our equity-method investment in a German-based asset management platform. The Company’s calculations of FEEUM may differ from the calculations of other asset managers, and as a result, these measures may not be comparable to similar measures presented by other asset managers. |
Both AUM and FEEUM decreased in the three months ended March 31, 2016. The $0.6 billion decrease in AUM can be attributed primarily to disposition of a non-fee bearing private equity investment and a decline in fair values. FEEUM decreased $1.4 billion, driven by a change in fee basis for two 2006 vintage funds that are in liquidation.
Segment Results of Operations
Three Months Ended March 31, 2016
Net income from our investment management business was $5.5 million, with our share at $4.6 million after attribution to noncontrolling interests. Fee income for the three months ended March 31, 2016 was $16.6 million with a blended base management fee rate of 1.0% per annum. We also recorded $0.3 million in net losses from our equity method investment in a third party asset manager. The carrying value of our equity method investment was $9.9 million at March 31, 2016.
Resulting from the Combination, we recognized identifiable intangible assets, which include the Colony trade name, contractual rights to earn future fee income from in-place investment management contracts and customer relationships with
institutional clients of private funds with an aggregate carrying value of $81.7 million at March 31, 2016. The identifiable intangible assets, other than the trade name, are subject to amortization amounting to $3.7 million for the three months ended March 31, 2016. In the first quarter of 2016, we recognized an impairment loss of $0.3 million on the investment management contracts attributable to a change in fee basis on a liquidating fund.
Compensation and administrative costs of $10.1 million were directly attributable or allocated to the investment management segment for the three months ended March 31, 2016.
Income tax benefit of $3.4 million was recognized for the three months ended March 31, 2016 in connection with amortization of the intangible assets acquired and net operating losses related to our investment management business.
Amounts Not Allocated to Segments
|
| | | | | | | | | | | | |
| | | Three Months Ended March 31, | | |
| (In thousands) | | 2016 | | 2015 | | Change |
| Income | | | | | | |
| Interest income | | $ | 11 |
| | $ | — |
| | $ | 11 |
|
| Equity in income of unconsolidated joint ventures | | 400 |
| | — |
| | 400 |
|
| Other income | | 1,274 |
| | 107 |
| | 1,167 |
|
| Total income | | 1,685 |
| | 107 |
| | 1,578 |
|
| Expenses | | | | | | |
| Management fees | | — |
| | 14,961 |
| | (14,961 | ) |
| Transaction, investment and servicing costs | | 2,268 |
| | 14,748 |
| | (12,480 | ) |
| Interest expense | | 11,488 |
| | 10,211 |
| | 1,277 |
|
| Depreciation and amortization | | 1,112 |
| | — |
| | 1,112 |
|
| Compensation expense | | 11,722 |
| | 615 |
| | 11,107 |
|
| Administrative expenses | | 9,119 |
| | 3,220 |
| | 5,899 |
|
| Total expenses | | 35,709 |
| | 43,755 |
| | (8,046 | ) |
| Other gain, net | | 9,847 |
| | 216 |
| | 9,631 |
|
| Income tax expense | | (117 | ) | | — |
| | (117 | ) |
| Net loss | | (24,294 | ) | | (43,432 | ) | | 19,138 |
|
| Net loss attributable to noncontrolling interests: | | | | | | |
| Operating Company | | (5,742 | ) | | — |
| | (5,742 | ) |
| Net loss attributable to Colony Capital, Inc. | | $ | (18,552 | ) | | $ | (43,432 | ) | | $ | 24,880 |
|
Amounts not allocated to segments represent all corporate level assets and liabilities, as well as costs not directly attributable or allocable to other segments but support our overall business activities and operations.
Resulting from the Combination, costs previously borne and allocated by the Manager through a management fee charge are now incurred directly by us, primarily as compensation, administrative and overhead costs, and certain assets held by CCLLC were transferred to us as part of the Combination. Compensation costs that are directly attributable, or otherwise can be subjected to a reasonable and systematic allocation, have been allocated to each of the reportable segments, with remaining costs unallocated. Administrative expenses and overhead costs that benefit all lines of business as a whole are generally not allocated to reportable segments, and similarly, any reimbursements of such costs by affiliates remain unallocated. Other costs not allocated to reportable segments include interest expense related to corporate level debt, costs associated with unconsummated deals, transaction costs in connection with the Combination and depreciation of fixed assets. Assets and liabilities not allocated to reportable segments consist mainly of cash and other assets not directly identifiable with specific real estate investment activities, including fixed assets, corporate level financing consisting of convertible senior notes issued, credit facility and notes payable, contingent consideration liability in connection with the Combination, as well as non-real estate investments and their results.
In September 2015, we committed seed capital of $15 million for a 15% interest as a founding member in a newly-formed collateralized loan obligation ("CLO") investment fund alongside an unaffiliated third party co-sponsor. As of March 31, 2016, we have funded $11.2 million of our commitment. Our investment in the CLO fund reflects our new secured corporate credit strategy and is presented as an equity method investment. As the underlying loans in the CLO are a non-real estate asset class, we have not allocated our investment in the CLO fund to our existing real estate investment segments. We may co-sponsor new CLO investment vehicles with the unaffiliated third party in the future and share in management fees as well as performance-based incentives.
Results of Operations
Three Months Ended March 31, 2016 and 2015
Equity in Income of Unconsolidated Joint Ventures—Our proportionate share of results from our co-sponsored CLO fund represents interest income and mark-to-market gains on the underlying securities in the CLO fund.
Other Income—Based on an arrangement we assumed from CCLLC in the Combination, we provide administrative and investment services to certain of our affiliates and are reimbursed, generally based on expenses incurred that are directly attributable to the affiliates and a portion of overhead costs, as applicable. These reimbursements are presented as other income and related costs included within the respective expenses. Reimbursements from our consolidated subsidiaries are eliminated.
Management Fees—Subsequent to the Combination, we have internalized our Manager and replaced management fee expense with directly incurred costs such as compensation, overhead costs and other administrative expenses. Management fees were payable to our Manager in 2015 through April 1. Management fees for the three months ended March 31, 2015 amounted to $15.0 million and included share-based compensation expense for stock grants made to the Manager and employees prior to the Combination.
Transaction, Investment and Servicing Costs—Transaction costs of $14.7 million incurred in the first quarter of 2015 was primarily in connection with the Combination, while $2.3 million in the current quarter relates to costs absorbed by us for unconsummated deals.
Interest Expense—Corporate level interest expense increased by $1.3 million between the three months ended March 31, 2016 and 2015 due to (i) $0.7 million of higher interest expense from increased usage of our credit facility to temporarily finance our investing activities or for general corporate purposes, and (ii) $0.6 million of interest expense on notes payable financing the corporate aircraft assumed through the Combination.
Other Expenses—These include depreciation of fixed assets acquired from our Manager, as well as compensation and administrative costs that we bear directly post-Combination that have not been allocated to our reporting segments.
Other Gain, Net—The three months ended March 31, 2016 included a $9.8 million gain which represents a decrease in fair value of the contingent consideration due to senior executives of the Company in connection with the Combination. The fair value estimate of the contingent consideration is impacted by various factors, including projected performance targets and probabilities of achieving those targets, and as the contingent consideration is payable in shares of the Company, our Class A common stock price.
Non-GAAP Supplemental Financial Measures
Beginning fiscal year 2015, the Company adopted funds from operations ("FFO"), a supplemental non-GAAP financial measure widely used in the REIT industry. Historically, the Company presented Core Earnings as a non-GAAP financial measure. Core Earnings was a measure used to calculate incentive fees to the Manager and the use of Core Earnings for this purpose is no longer relevant subsequent to the Combination as we have now become an internally-managed REIT. We believe that FFO provides a measure of our operating performance that is more comparable to our peers as our business model evolves and we expand our footprint within the real estate equity business.
Funds from Operations
We calculate FFO in accordance with standards established by the National Association of Real Estate Investment Trusts (“NAREIT”), which defines FFO as net income or loss calculated in accordance with GAAP, excluding extraordinary items, as defined by GAAP, gains and losses from sales of depreciable real estate and impairment write-downs associated with depreciable real estate, plus real estate-related depreciation and amortization, and after similar adjustments for unconsolidated partnerships and joint ventures.
We believe that FFO is a meaningful supplemental measure of the operating performance of our business because historical cost accounting for real estate assets in accordance with GAAP assumes that the value of real estate assets diminishes predictably over time, as reflected through depreciation. Because real estate values fluctuate with market conditions, management considers FFO an appropriate supplemental performance measure by excluding historical cost depreciation, as well as gains or losses related to sales of previously depreciated real estate.
FFO should not be considered an alternative to GAAP net income as indications of operating performance, or to cash flows from operating activities as measures of liquidity, nor as indications of the availability of funds for our cash needs, including funds available to make distributions. Our calculation of FFO may differ from methodologies utilized by other REITs for similar performance measurements, and, accordingly, may not be comparable to those of other REITs.
The following table presents a reconciliation of net income attributable to common stockholders to FFO attributable to common interests in Operating Company and common stockholders. Amounts in the table include our share of activity in unconsolidated joint ventures.
|
| | | | | | | | |
| | | Three Months Ended March 31, |
| (In thousands) | | 2016 | | 2015 |
| Net income attributable to common stockholders | | $ | 18,135 |
| | $ | 3,557 |
|
| Adjustments for FFO attributable to common interests in Operating Company and common stockholders: | | | | |
| Net income attributable to noncontrolling common interests in Operating Company | | 3,421 |
| | — |
|
| Real estate depreciation and amortization | | 48,411 |
| | 32,145 |
|
| Impairment of real estate | | 1,753 |
| | 1,544 |
|
| Gain on sales of real estate | | (51,265 | ) | | (179 | ) |
Less: Adjustments attributable to noncontrolling interests in investment entities (1) | | 16,274 |
| | (7,404 | ) |
| FFO attributable to common interests in Operating Company and common stockholders | | $ | 36,729 |
| | $ | 29,663 |
|
__________
| |
| (1) | For the three months ended March 31, 2016, adjustments attributable to noncontrolling interests in investment entities include $18.4 million related to real estate depreciation and amortization, $1.5 million related to impairment of real estate, offset by $36.2 million related to gain on sales of real estate. For the three months ended March 31, 2015, adjustments attributable to noncontrolling interests in investment entities include $7.2 million related to real estate depreciation and amortization and $0.2 million related to impairment of real estate. |
Information About Our Real Estate Portfolios
Real Estate Equity Portfolio
The following tables set forth certain information regarding investment properties wholly-owned or partially owned by us that are consolidated and presented as real estate assets, net, on the condensed consolidated balance sheet as of March 31, 2016. At March 31, 2016, no single tenant represented a significant portion of in-place leases. Certain properties are pledged as security under our secured debt, as described in Note 10 to our Consolidated Financial Statements.
Light Industrial Platform
|
| | | | | | | | | | | | | | | | | | | | | | | | |
| Location/Markets | | Property Type | | Number of Properties | | Number of Buildings | | Rentable Square Feet (in thousands) | | Annualized Base Rent (in thousands) (1) | | Percentage Leased | | Number of Leases | | Lease Expiration (2) | | Year Acquired |
| United States |
|
|
|
|
|
|
|
|
|
|
|
|
|
|
|
|
|
|
| Atlanta |
| Industrial |
| 70 |
|
| 84 |
|
| 8,286 |
|
| $ | 32,050 |
|
| 95% |
| 233 |
|
| 4/2016 to 4/2030 |
| 2014-2015 |
| Austin |
| Industrial |
| 3 |
|
| 4 |
|
| 236 |
|
| 1,472 |
|
| 94% |
| 14 |
|
| 6/2016 to 8/2025 |
| 2014 |
| Chicago |
| Industrial |
| 34 |
|
| 34 |
|
| 3,972 |
|
| 16,665 |
|
| 94% |
| 56 |
|
| 5/2016 to 12/2026 |
| 2014 |
| Dallas |
| Industrial |
| 51 |
|
| 58 |
|
| 6,142 |
|
| 22,065 |
|
| 93% |
| 147 |
|
| 5/2016 to 4/2040 |
| 2014-2015 |
| Denver |
| Industrial |
| 8 |
|
| 8 |
|
| 1,128 |
|
| 4,501 |
|
| 100% |
| 26 |
|
| 5/2016 to 3/2023 |
| 2014 |
| Houston |
| Industrial |
| 10 |
|
| 21 |
|
| 1,713 |
|
| 9,240 |
|
| 97% |
| 52 |
|
| 4/2016 to 8/2016 |
| 2014 |
| Kansas City |
| Industrial |
| 9 |
|
| 9 |
|
| 1,664 |
|
| 5,741 |
|
| 98% |
| 24 |
|
| 7/2016 to 11/2024 |
| 2014 |
| Maryland |
| Industrial |
| 3 |
|
| 5 |
|
| 431 |
|
| 2,223 |
|
| 100% |
| 13 |
|
| 7/2016 to 12/2023 |
| 2015-2016 |
| Memphis |
| Industrial |
| 3 |
|
| 3 |
|
| 383 |
|
| 752 |
|
| 85% |
| 5 |
|
| 2/2017 to 9/2024 |
| 2014 |
| Minneapolis |
| Industrial |
| 14 |
|
| 15 |
|
| 1,993 |
|
| 8,728 |
|
| 90% |
| 56 |
|
| 5/2016 to 10/2025 |
| 2014-2015 |
New Jersey South / Philadelphia (3) |
| Industrial |
| 29 |
|
| 30 |
|
| 3,328 |
|
| 13,787 |
|
| 94% |
| 71 |
|
| 6/2016 to 4/2027 |
| 2014-2015 |
| Orlando |
| Industrial |
| 3 |
|
| 3 |
|
| 555 |
|
| 2,317 |
|
| 92% |
| 6 |
|
| 9/2016 to 4/2019 |
| 2014 |
| Phoenix |
| Industrial |
| 13 |
|
| 18 |
|
| 1,701 |
|
| 7,400 |
|
| 86% |
| 46 |
|
| 5/2016 to 8/2024 |
| 2014-2015 |
| Salt Lake City |
| Industrial |
| 15 |
|
| 16 |
|
| 1,269 |
|
| 5,199 |
|
| 93% |
| 32 |
|
| 6/2016 to 11/2023 |
| 2014 |
| St. Louis |
| Industrial | | 8 |
| | 8 |
| | 1,355 |
| | 4,581 |
| | 87% |
| 18 |
|
| 5/2016 to 7/2024 |
| 2014 |
| Tampa |
| Industrial |
| 4 |
|
| 9 |
|
| 617 |
|
| 3,036 |
|
| 92% |
| 32 |
|
| 8/2016 to 1/2024 |
| 2014 |
Total (4) |
|
|
| 277 |
|
| 325 |
|
| 34,773 |
|
| $ | 139,757 |
|
| 94% |
| 831 |
|
|
|
|
|
Other Real Estate Equity Held for Investment
|
| | | | | | | | | | | | | | | | | | | | | | | |
| Location | | Property Type | | Number of Properties | | Number of Buildings | | Rentable Square Feet (in thousands) | | Annualized Base Rent (in thousands) (1) | | Percentage Leased | | Number of Leases | | Lease Expiration (2) | | Year Acquired (5) |
Net Leased (6) | | | | | | | | | | | | | | | | | | |
| Arizona | | Education | | 1 |
| | 2 |
| | 82 |
| | $ | 1,644 |
| | 100% | | 1 | | 6/2027 | | 2014 |
| Minnesota | | Office | | 1 |
| | 2 |
| | 502 |
| | 9,568 |
| | 100% | | 1 | | 9/2020 | | 2013 |
| France | | Office | | 1 |
| | 3 |
| | 187 |
| | 2,675 |
| | 100% | | 1 | | 11/2027 | | 2015 |
| Norway | | Office | | 1 |
| | 26 |
| | 1,291 |
| | 17,852 |
| | 100% | | 1 | | 6/2030 | | 2015 |
| Switzerland | | Education | | 2 |
| | 20 |
| | 304 |
| | 14,054 |
| | 100% | | 2 | | 1/2035 | | 2015 |
| Others | | | | | | | | | | | | | | | | | | |
| Arizona | | Office | | 1 |
| | 1 |
| | 440 |
| | 5,572 |
| | 59% | | 19 | | 12/2016 to 5/2022 | | 2013 |
| Various U.S. states | | Hotel | | 23 |
| | 23 |
| | NA |
| | NA |
| | (7) | | (7) | | NA | | 2012 |
Italy (8) | | Mixed Use | | 78 |
| | 80 |
| | 578 |
| | 5,122 |
| | 34% | | 43 | | 5/2017 to 3/2021 | | 2014 |
| Spain | | Industrial | | 37 |
| | 37 |
| | 2,680 |
| | 12,226 |
| | 97% | | 36 | | 10/2016 to12/2029 | | 2014, 2016 |
| UK | | Office | | 23 |
| | 35 |
| | 999 |
| | 12,807 |
| | 91% | | 104 | | 6/2017 to 12/2042 | | 2014, 2015 |
| UK | | Mixed Use | | 21 |
| | 52 |
| | 2,860 |
| | 35,288 |
| | 90% | | 244 | | 2/2018 to 3/2040 | | 2015 |
| | | | | 189 |
| | 281 |
| | 9,923 |
| | $ | 116,808 |
| | | | | | | | |
__________
| |
(1) | Represents annualized fixed base rental amount in effect as of March 31, 2016 using rental revenue computed on a straight-line basis in accordance with GAAP and excludes the impact of amortization of above- and below-market lease values. Rents denominated in foreign currencies have been translated at the applicable currency exchange rate at March 31, 2016. |
| |
(2) | Excludes renewal options and tenant ground leases. |
(3) Excludes one parcel of vacant land with no lease
| |
(4) | Includes 3 properties with 3 buildings at 147,000 rentable square feet located in Phoenix, Minneapolis and Salt Lake City that were 26% leased and held for sale at March 31, 2016. |
| |
(5) | Reflects year of initial acquisition for properties held through joint ventures that were consolidated on April 2, 2015. |
| |
(6) | These are net leased properties in which the tenants are responsible for all operating expenses associated with the properties. |
| |
(7) | Hotel properties located in 9 states totaling 1,552 rooms with average occupancy of approximately 69%. |
| |
(8) | Excludes one building with approximately 218,000 square feet that is subject to development. Includes 43 properties with 392,000 square feet and 8% leased that were transferred from held for sale to held for investment in the first quarter of 2016 as it is no longer probable that these properties would be sold within a year. |
Real Estate Debt Portfolio
Our real estate debt investment segment comprises originations and acquisitions of senior and subordinated loans and debt securities, including purchased credit-impaired ("PCI") loans. The following table presents the collateral diversification of our consolidated loan portfolio and our proportionate share at March 31, 2016. Carrying values of loans held for investment are presented net of allowance for loan losses. |
| | | | | | | | | | | | | | | | | |
| | Total Portfolio | | Company's Proportionate Share |
| (Amounts in thousands) | Unpaid Principal Balance | | Carrying Values | | Unpaid Principal Balance | | Carrying Values | | Weighted Average Coupon |
| Loans Held for Investment | | | | | | | | | |
| Non-PCI Loans | | | | | | | | | |
| Residential | $ | 107,196 |
| | $ | 106,858 |
| | $ | 53,598 |
| | $ | 53,429 |
| | 13.9% |
| Multifamily | 785,267 |
| | 778,161 |
| | 730,776 |
| | 725,684 |
| | 5.5% |
| Office | 625,499 |
| | 614,209 |
| | 502,345 |
| | 499,435 |
| | 6.7% |
| Retail | 647,080 |
| | 644,961 |
| | 525,364 |
| | 523,790 |
| | 8.1% |
| Hospitality | 889,350 |
| | 881,344 |
| | 516,437 |
| | 512,109 |
| | 9.7% |
| Industrial | 32,140 |
| | 31,963 |
| | 31,942 |
| | 31,765 |
| | 5.5% |
| Other commercial | 219,559 |
| | 218,106 |
| | 214,457 |
| | 213,074 |
| | 7.7% |
| Land | 147,968 |
| | 150,205 |
| | 73,984 |
| | 75,103 |
| | 11.3% |
| | 3,454,059 |
| | 3,425,807 |
| | 2,648,903 |
| | 2,634,389 |
| | 7.6% |
| PCI Loans | | | | | | | | | |
| Residential | 49,264 |
| | 29,155 |
| | 17,004 |
| | 11,232 |
| |
|
| Multifamily | 163,627 |
| | 116,396 |
| | 61,491 |
| | 45,184 |
| |
|
| Office | 199,274 |
| | 128,702 |
| | 96,496 |
| | 57,694 |
| |
|
| Retail | 165,945 |
| | 133,203 |
| | 59,808 |
| | 50,885 |
| |
|
| Hospitality | 48,769 |
| | 34,183 |
| | 8,740 |
| | 6,033 |
| |
|
| Industrial | 102,206 |
| | 77,896 |
| | 35,664 |
| | 28,114 |
| |
|
| Other commercial | 125,774 |
| | 77,030 |
| | 24,349 |
| | 13,804 |
| |
|
| Land | 120,345 |
| | 45,172 |
| | 25,336 |
| | 9,753 |
| |
|
| | 975,204 |
| | 641,737 |
| | 328,888 |
| | 222,699 |
| |
|
| Total loans held for investment, net | $ | 4,429,263 |
| | $ | 4,067,544 |
| | $ | 2,977,791 |
| | $ | 2,857,088 |
| |
|
Liquidity and Capital Resources
Our current primary liquidity needs are to fund:
| |
| • | acquisitions of our target assets and related ongoing commitments; |
| |
| • | our general partner commitments to our future funds and co-investment commitments to other investment vehicles; |
| |
| • | our operations, including compensation, administrative and overhead costs; |
| |
| • | distributions to our stockholders; |
| |
| • | principal and interest payments on our borrowings, including interest obligation on our convertible debt; and |
| |
| • | income tax liabilities of taxable REIT subsidiaries and of the Company subject to limitations as a REIT. |
Our current primary sources of liquidity are:
| |
| • | fees received from our investment management business; |
| |
| • | cash flow generated from our investments, both from operations and return of capital; |
| |
| • | proceeds from full or partial realization of investments; |
| |
| • | investment-level financing; |
| |
| • | proceeds from public or private equity and debt offerings; and |
| |
| • | capital commitments from limited partners of sponsored funds. |
We believe that our capital resources are sufficient to meet our short-term and long-term capital requirements. Distribution requirements imposed on us to qualify as a REIT generally require that we distribute to our stockholders 90% of our taxable income, which constrains our ability to accumulate operating cash flows. We have historically funded investments
in our target assets and sustained our growth through third-party sources of capital, including public and private offerings of securities and debt financings, which may or may not be available on favorable terms, or at all. Subsequent to the Combination, we believe we will be able to reduce our reliance on raising incremental public funding as prospectively, we will have third party investor participation in funds and investment vehicles that we will sponsor.
Additional discussions of our liquidity needs and sources of liquidity are included below.
Liquidity Needs
Commitments
We have commitments in connection with our investment activities as well as lease commitments, as described in “—Contractual Obligations, Commitments and Contingencies."
Dividends
U.S. federal income tax law generally requires that a REIT distribute annually at least 90% of its REIT taxable income, without regard to the deduction for dividends paid and excluding net capital gains, and that it pay tax at regular corporate rates to the extent that it annually distributes less than 100% of its net taxable income. We intend to pay regular quarterly dividends to our stockholders in an amount equal to our net taxable income, if and to the extent authorized by our board of directors. Before we pay any dividend, whether for U.S. federal income tax purposes or otherwise, we must first meet both our operating requirements and debt service, if any. If our cash available for distribution is less than our net taxable income, we could be required to sell assets or borrow funds to make cash distributions or we may make a portion of the required distribution in the form of a taxable stock distribution or distribution of debt securities.
Common Stock—Our board of directors declared the following dividends in 2016:
|
| | | | | | | | |
| Declaration Date | | Record Date | | Payment Date | | Dividend Per Share |
| February 25, 2016 | | March 31, 2016 | | April 15, 2016 | | $ | 0.40 |
|
| May 5, 2016 | | June 30, 2016 | | July 15, 2016 | | 0.40 |
|
Preferred Stock—We are required to make quarterly cash distributions on our outstanding preferred stock. Dividends are payable on or about the 15th of each January, April, July and October.
|
| | | | | | | | | | | | | |
| | | | | Shares Outstanding March 31, 2016 (In thousands) | | Quarterly Cash Distributions |
| Description | | Dividend Rate Per Annum | | | Total (In thousands) | | Per Share |
| Series A 8.5% Cumulative Redeemable Perpetual | | 8.50% | | 10,080 |
| | $ | 5,355 |
| | $ | 0.53125 |
|
| Series B 7.5% Cumulative Redeemable Perpetual | | 7.50% | | 3,450 |
| | 1,617 |
| | 0.46875 |
|
| Series C 7.125% Cumulative Redeemable Perpetual | | 7.125% | | 11,500 |
| | 5,121 |
| | 0.44530 |
|
| | | | | 25,030 |
| | $ | 12,093 |
| | |
Sources of Liquidity
Cash from Investments
Our investments generate cash, either from operations or as a return of our invested capital. We receive monthly or quarterly distributions from some of our unconsolidated joint ventures from earnings, principal receipts or capital transactions, such as financing transactions or full or partial loan sales. We also receive interest and principal on our loans held for investment and rental income from tenants. As loans reach their maturity, we may receive all or a portion of the outstanding principal balance. Certain loans held for investment require minimum principal payments, including partial paydowns of principal in the event of a sale of the underlying collateral. We may also, from time to time, fully or partially realize our investments through sale and expect to continue to resolve loans in our loan pools to generate cash, particularly those in acquired credit-distressed portfolios. We may also pursue opportunities to sell whole or partial positions in our originated loan investments or obtain financing (see “—Investment-Level Financing”) to generate cash and improve the return on our investments. Cash from investments may fluctuate significantly depending upon our loan resolution activity, financing opportunities and unanticipated prepayments by borrowers, among other factors.
Cash from Investment Management Business
Following the closing of the Combination, our investment management business generates an additional source of cash flows in the form of management fees as investment advisor of our managed funds, and in the future, potentially performance-based incentive income from funds or similar investment vehicles sponsored by us as general partner.
Management fees comprise (a) base management fees, which are calculated as a percentage of the limited partners' net funded capital, or in certain cases, fair value of investments, and accrues from the date of the first investment of the fund through the last day of the term of the fund and payable to us generally in arrears at the end of each calendar quarter or each month depending on the type of funds; and (b) asset management fees payable to us upon closing of each investment made by our managed funds, calculated as a fixed percentage of the limited partners' net funded capital on each investment. Our management fee basis is generally a predictable and stable revenue stream.
Performance-based incentive income is typically realized at the end of our sponsored fund's measurement period, when the underlying investments are profitably disposed and the fund's cumulative returns are in excess of preferred returns to limited partners. Performance based incentive income is by nature less predictable in amount and timing.
Additionally, our ability to establish new funds and raise investor capital depends on general market conditions and availability of attractive investment opportunities as well as availability of debt capital.
Investment-Level Financing
We have various forms of investment-level financing from commercial banks on several of our loan and real estate equity investments, described as secured debt in Note 10 to the Consolidated Financial Statements.
We entered into two warehouse facilities with commercial banks in February 2014 and April 2015, which provided $150 million under each facility, to partially finance loans within our Transitional CRE lending platform. In October 2015, the April 2015 facility was increased by $100 million, resulting in a total of $400 million available under both facilities. As of May 6, 2016, a combined $220.5 million was available to be drawn under our warehouse facilities.
In July 2015, we closed on a $100 million revolving credit facility to pursue additional acquisitions under the Light Industrial Platform segment. As of May 6, 2016, $60 million was available to be drawn on this facility.
We may attempt to secure other investment-level financing in the future, if available, including term loans, securitizations, warehouse facilities, and the issuance of debt and equity securities.
We also expect to continue to invest in a number of our assets through co-investments with our Sponsored Funds, private funds or other investment vehicles managed by CCLLC or its affiliates and/or other third parties. Our ability to raise and access capital from the limited partners of these funds or investment vehicles and/or third parties, would allow us to scale our investment activities by pooling capital to access larger transactions and diversify our investment exposure.
Credit Facility
As described in Note 10 to the Consolidated Financial Statements, the JPM Credit Agreement, which was amended and restated on March 31, 2016, provides a secured revolving credit facility in the maximum principal amount of $850 million, an increase of $50 million from December 31, 2015. The maximum principal amount may be increased up to $1.275 billion, subject to customary conditions. The JPM Credit Agreement matures on March 31, 2020, with two six-month extension options.
The maximum amount available at any time is limited by a borrowing base of certain investment assets, with the valuation of such investment assets generally determined according to a percentage of adjusted net book value or a multiple of base management fee EBITDA (as defined in the JPM Credit Agreement).
As of May 6, 2016, the borrowing base valuation was sufficient to permit borrowings of up to the entire $850 million commitment, of which $413.3 million was available to be drawn.
The JPM Credit Agreement contains covenants and restrictions requiring us to meet certain financial ratios. At March 31, 2016, we were in compliance with all of the financial covenants, as follows:
|
| | | |
| | Covenant Level | | Actual Level at March 31, 2016 |
| Financial covenant as defined in the Credit Agreement: | | | |
| Consolidated Tangible Net Worth | Minimum $1,915 million | | $2,549 million |
| Consolidated Fixed Charge Coverage Ratio | Minimum 1.50 to 1.00 | | 2.44 to 1.00 |
| Consolidated Interest Coverage Ratio | Minimum 3.00 to 1.00 | | 15.87 to 1.00 |
| Consolidated Leverage Ratio | Maximum 0.65 to 1.00 | | 0.41 to 1.00 |
Convertible Senior Notes
Convertible Senior Notes issued by us and that remain outstanding are described in Note 10 to the Consolidated Financial Statements.
Public Offerings
In April 2015, we issued 11,500,000 shares of our 7.125% Series C Preferred Stock, par value $0.01 per share, pursuant to a public offering under our current registration statement. In May 2015, we entered into separate “at-the-market” equity distribution agreements with certain sales agents to offer and sell, from time to time, shares of our common stock. See additional information included in Note 14 to the Consolidated Financial Statements and in “—Dividends” above.
We may in the future offer and sell various types of securities under our current shelf registration statement, as well as sell shares under our "at-the-market" offering program. These securities may be issued from time to time at our discretion based on our needs and depending upon market conditions and available pricing.
Cash and Cash Flows
The following table summarizes our cash flow activity for the periods presented:
|
| | | | | | | | |
| | | Three Months Ended March 31, |
| (In thousands) | | 2016 | | 2015 |
| Net cash provided by (used in): | | | | |
| Operating activities | | $ | 77,677 |
| | $ | 57,921 |
|
| Investing activities | | 133,389 |
| | (391,325 | ) |
| Financing activities | | (227,373 | ) | | 255,633 |
|
Operating Activities
Cash inflows from operating activities are primarily interest received from our investments in loans, rental payments collected from tenants of our portfolio of operating real estate properties, distributions of earnings from unconsolidated joint ventures, and fee income collected from our managed funds. Cash inflows from operating activities include interest and property operating income from loans and operating properties held by consolidated joint ventures that were previously unconsolidated prior to the Combination. This is partially offset by payment of operating expenses supporting our investments, including loan servicing and property operating costs. Additionally, following the Combination, we have assumed compensation and administrative costs from our Manager in lieu of a management fee expense. The quarter over quarter increase reflects the operating activities of the consolidated investment entities, as well as continued growth in our investment portfolio. The Company believes cash flows from operations, available cash balances and the Company’s ability to generate cash through short- and long-term borrowings are sufficient to fund the Company’s operating liquidity needs.
Investing Activities
Cash outlay for investing activities comprise investments in real estate assets and loans as well as our contributions to unconsolidated joint ventures, while cash provided by investing activities include loan repayments, proceeds from sales of real estate assets and distributions of capital from unconsolidated joint ventures. Subsequent to the Combination in April 2015, we consolidate most of our joint venture investments and therefore, most of our investing activities are presented as direct investments in loans and real estate assets, rather than through joint venture investments.
Investing activities in the first quarter of 2016 generated a net cash inflow of $133.4 million compared to a net cash outflow of $391.3 million in the first quarter of 2015. For the three months ended March 31, 2016, our investing activities were primarily in our real estate equity segment with acquisitions of $119.9 million of real estate assets with sales generating proceeds of $168.7 million. For the three months ended March 31, 2015, we incurred cash outflows for loan originations, net of repayments of $31.8 million, acquired $225.7 million of real estate assets, and our contributions to unconsolidated joint ventures, net of distributions was $135.7 million.
Financing Activities
The Company’s main financing activities are cash proceeds from borrowings secured by our investments, drawdowns from our credit facility as well as issuance of preferred stock, common stock or convertible senior notes. Subsequent to the Combination in April 2015, as we consolidate most of our joint venture investments, contributions from and distributions to noncontrolling interests in investment entities, primarily our co-investment funds or to a lesser extent, unaffiliated third parties, form a larger part of our financing activities. For the three months ended March 31, 2016 and 2015, cash provided by our financing activities were sourced primarily from secured borrowings and drawdowns from our credit facility. Additionally, for the three months ended March 31, 2016, distributions of $193.5 million were made to noncontrolling interests in investment entities, of which a significant amount was related to proceeds from sale of a foreclosed property in Germany.
Contractual Obligations, Commitments and Contingencies
We have contractual obligations in the form of debt obligations, as described in Note 10 to our Consolidated Financial Statements as well as contingent consideration related to the Combination, subject to achievement of performance targets, as described in Note 20 to our Consolidated Financial Statements. We have investment commitments in connection with our investments in unconsolidated joint ventures, consolidated investments and general partner commitments to sponsored funds, as well as lease commitments, as described in Note 20 to our Consolidated Financial Statements.
Off-Balance Sheet Arrangements
In connection with financing arrangements for certain unconsolidated joint ventures, the Company provided customary non-recourse carve-out guarantees. The Company believes that the likelihood of making any payments under the guarantees is remote and no liability has been recorded as of March 31, 2016.
Risk Management
Risk management is a significant component of our strategy to deliver consistent risk-adjusted returns to our stockholders. Subject to maintaining our qualification as a REIT for U.S. federal income tax purposes and our exemption from registration under the 1940 Act, we closely monitor our portfolio and actively manage risks associated with, among other things, our assets and interest rates. In addition, the Audit Committee of our board of directors, in consultation with management, periodically reviews our policies with respect to risk assessment and risk management, including key risks to which we are subject, including credit risk, liquidity risk, financing risk, foreign currency risk and market risk, and the steps that management has taken to monitor and control such risks.
Underwriting
Prior to making any equity or debt investment, our underwriting team, in conjunction with third party providers, undertakes a rigorous asset-level due diligence process, involving intensive data collection and analysis, to ensure that we understand fully the state of the market and the risk-reward profile of the asset. In addition, we evaluate material accounting, legal, financial and business issues surrounding such investment. These issues and risks are built into the valuation of an asset and ultimate pricing of an investment.
During the underwriting process, we review the following data, including, but are not limited to: property financial data including historic and budgeted financial statements, liquidity and capital expenditure plans, property operating metrics (including occupancy, leasing activity, lease expirations, sales information, tenant credit review, tenant delinquency reports, operating expense efficiency and property management efficacy) and local real estate market conditions including vacancy rates, absorption, new supply, rent levels and comparable sale transactions, as applicable. For debt investments, we also analyze metrics such as loan-to-collateral value ratios, debt service coverage ratios, debt yields, sponsor credit ratings and performance history.
In addition to evaluating the merits of any particular proposed investment, we evaluate the diversification of our portfolio of assets. Prior to making a final investment decision, we determine whether a target asset will cause our portfolio of assets to be too heavily concentrated with, or cause too much risk exposure to, any one real estate sector, geographic region, source of cash flow such as tenants or borrowers, or other geopolitical issues. If we determine that a proposed investment presents excessive concentration risk, we may decide not to pursue an otherwise attractive investment.
Asset Management
For each asset that we originate or acquire, our asset management team engages in active management of the asset, the intensity of which depends on the attendant risks. Once an asset manager has been assigned to a particular asset, the manager works collaboratively with the underwriting team to formulate a strategic plan for the particular asset, which includes evaluating the underlying collateral and updating valuation assumptions to reflect changes in the real estate market and the general economy. This plan also generally outlines several strategies for the asset to extract the maximum amount of value from each asset under a variety of market conditions. Such strategies vary depending on the type of asset, our position in the capitalization of the investment, the availability of refinancing options and in the case of debt investments, recourse and maturity. As long as an asset is in our portfolio, we track the progress of an asset against the original business plan to ensure that the attendant risks of continuing to own the asset do not outweigh the associated rewards.
Subject to maintaining our qualification as a REIT for U.S. federal income tax purposes and our exemption from registration under the 1940 Act, we currently expect that we will typically hold most assets through our managed funds and vehicles for between three and ten years. However, in order to maximize returns and manage portfolio risk while remaining opportunistic, we may dispose of an asset earlier than anticipated or hold an asset longer than anticipated if we determine it to be appropriate depending upon prevailing market conditions or factors regarding a particular asset. We can provide no
assurances, however, that we will be successful in identifying or managing all of the risks associated with acquiring, holding or disposing of a particular asset or that we will not realize losses on certain assets.
Interest Rate and Foreign Currency Hedging
Subject to maintaining our qualification as a REIT for U.S. federal income tax purposes and our exemption from registration under the 1940 Act, we may mitigate the risk of interest rate volatility through the use of hedging instruments, such as interest rate swap agreements and interest rate cap agreements. The goal of our interest rate management strategy is to minimize or eliminate the effects of interest rate changes on the value of our assets, to improve risk-adjusted returns and, where possible, to lock in, on a long-term basis, a favorable spread between the yield on our assets and the cost of financing such assets.
In addition, because we are exposed to foreign currency exchange rate fluctuations, we employ foreign currency risk management strategies, including the use of, among others, currency hedges, and matched currency financing.
We can provide no assurances, however, that our efforts to manage interest rate and foreign currency exchange rate volatility will successfully mitigate the risks of such volatility on our portfolio.
Financing Strategy
Our financing strategy is to employ investment-specific financing principally on a non-recourse basis with matching terms and currencies, as available and applicable, through first mortgages, senior loan participations or securitizations. In addition to investment-specific financings, we may utilize and have utilized credit facilities and repurchase facilities on a shorter term basis and public and private, secured and unsecured debt issuances on a longer term basis. The amount of leverage we utilize is based on our assessment of a variety of factors, including, among others, the anticipated liquidity and price volatility of the assets in our investment portfolio, the potential for losses and extension risk in our portfolio, the ability to raise additional equity to reduce leverage and create liquidity for future investments, the availability of credit at favorable prices or at all, the credit quality of our assets, our outlook for borrowing costs relative to the interest income earned on our assets and financial covenants within our financing facilities. Our decision to use leverage to finance our assets is at our discretion and not subject to the approval of our stockholders. We currently do not expect our overall leverage to exceed a ratio of 3-to-1 on a debt to equity basis. To the extent that we use leverage in the future, we may mitigate interest rate risk through utilization of hedging instruments, primarily interest rate swap and cap agreements, to serve as a hedge against future interest rate increases on our borrowings.
Critical Accounting Policies and Estimates
Our financial statements are prepared in accordance with GAAP, which requires the use of estimates and assumptions that involve the exercise of judgment and that affect the reported amounts of assets, liabilities, and the disclosure of contingent assets and liabilities at the date of the financial statements and the reported amounts of revenues and expenses during the reporting period. There have been no material changes to our critical accounting policies or those of our unconsolidated joint ventures since the filing of our Annual Report on Form 10-K for the fiscal year ended December 31, 2015.
Recent Accounting Updates
Recent accounting updates are included in Note 2 to our consolidated financial statements in Item 1 of this Report.
ITEM 3. Quantitative and Qualitative Disclosures About Market Risk.
Market risk includes the exposure to loss resulting from changes in interest rates, credit curve spreads, foreign currency exchange rates, commodity prices, equity prices and credit risk in our underlying investments. The primary market risks to which the Company is exposed, either directly or indirectly through its investments in unconsolidated joint ventures, are credit risk, interest rate risk, credit curve spread risk and foreign currency risk.
Credit Risk
Our joint venture investments and loans receivable are subject to a high degree of credit risk. Credit risk is the exposure to loss from loan defaults. Default rates are subject to a wide variety of factors, including, but not limited to, borrower financial condition, property performance, property management, supply/demand factors, construction trends, consumer behavior, regional economics, interest rates, the strength of the U.S. economy, and other factors beyond our control. All loans are subject to a certain probability of default. We manage credit risk through the underwriting process, acquiring our investments at the appropriate discount to face value, if any, and establishing loss assumptions. We also carefully monitor the
performance of the loans, including those held by the joint ventures, as well as external factors that may affect their value. For more information, see “Business—Risk Management.”
Interest Rate and Credit Curve Spread Risk
Interest rate risk relates to the risk that the future cash flows of a financial instrument will fluctuate because of changes in market interest rates. Interest rate risk is highly sensitive to many factors, including governmental, monetary and tax policies, domestic and international economic and political considerations and other factors beyond our control. Credit curve spread risk is highly sensitive to the dynamics of the markets for commercial real estate loans and securities we hold. Excessive supply of these assets combined with reduced demand will cause the market to require a higher yield. This demand for higher yield will cause the market to use a higher spread over the U.S. Treasury securities yield curve, or other benchmark interest rates, to value these assets. As U.S. Treasury securities are priced to a higher yield and/or the spread to U.S. Treasuries used to price the assets increases, the price at which we could sell some of our fixed rate financial assets may decline. Conversely, as U.S. Treasury securities are priced to a lower yield and/or the spread to U.S. Treasuries used to price the assets decreases, the value of our fixed rate loans may increase. Fluctuations in LIBOR may affect the amount of interest income we earn on our floating rate loans and interest expense we incur on borrowings indexed to LIBOR, including those under our credit facility and certain investment-level financing.
The interest rate sensitivity table below illustrates the projected impact of changes in interest rates in 1% increments on our net income for twelve months, assuming no changes in our interest-bearing assets and liabilities mix as it stood at March 31, 2016, and excludes investments accounted for under the equity method. The maximum decrease in the interest rates is assumed to be the actual applicable index at March 31, 2016, predominantly the 1-Month LIBOR. All applicable indices were less than 1% at March 31, 2016.
|
| | | | | | | | | | | | |
(Amounts in thousands)
Affected Line Item in the Consolidated Statement of Operations | | +2.00% | | +1.00% | | Maximum Decrease in Applicable Index |
| Interest income | | $ | 41,085 |
| | $ | 20,542 |
| | $ | (9,311 | ) |
| Interest expense | | (38,591 | ) | | (19,456 | ) | | 8,138 |
|
| Net (loss) income | | 2,494 |
| | 1,086 |
| | (1,173 | ) |
| Net (loss) income attributable to noncontrolling interests in investment entities | | (8,320 | ) | | (4,355 | ) | | 957 |
|
| Net (loss) income attributable to Operating Company | | $ | 10,814 |
| | $ | 5,441 |
| | $ | (2,130 | ) |
We utilize a variety of financial instruments on some of our investments, including interest rate swaps, caps, floors and other interest rate exchange contracts, in order to limit the effects of fluctuations in interest rates on our operations. The use of these types of derivatives to hedge interest-earning assets and/or interest-bearing liabilities carries certain risks, including the risk that losses on a hedge position will reduce the funds available for distribution and that such losses may exceed the amount invested in such instruments. A hedge may not perform its intended purpose of offsetting losses of rising interest rates. Moreover, with respect to certain of the instruments used as hedges, we are exposed to the risk that the counterparties with which we trade may cease making markets and quoting prices in such instruments, which may render us unable to enter into an offsetting transaction with respect to an open position. If we anticipate that the income from any such hedging transaction will not be qualifying income for REIT income purposes, we may conduct all or part of our hedging activities through a to-be-formed corporate subsidiary that is fully subject to federal corporate income taxation. Our profitability may be adversely affected during any period as a result of changing interest rates.
Foreign Currency Risk
We have foreign currency rate exposures related to our foreign currency-denominated investments. Changes in foreign currency rates can adversely affect the fair values and earnings of our non-U.S. holdings. As of March 31, 2016, we had approximately €306.6 million, £120.8 million, CHF55.1 million and NOK 898.8 million or a total of $688.4 million, in European investments. A 1% change in these foreign currency rates would result in a $6.9 million increase or decrease in translation gain or loss on our investments in unconsolidated joint ventures, loan investments and real estate assets. We mitigate this risk by utilizing currency instruments to hedge the capital portion of our foreign currency risk. The types of hedging instruments that we employed on our European investments were forwards and costless collars (buying a protective put while writing an out-of-the-money covered call with a strike price at which the premium received is equal to the premium of the protective put purchased) which involved no initial capital outlay. The puts were structured with strike prices up to 15% lower than our cost basis in such investments, thereby limiting any foreign exchange fluctuations to up to 15% of the original capital invested in the deal. At March 31, 2016, our share of net tax-effected accumulated foreign exchange loss on the European investments was approximately $16.3 million, net of effect of hedging.
The following table summarizes the aggregate notional amount of the foreign exchange contracts in place, along with various key terms as of March 31, 2016. The maturity dates of these instruments approximate the projected dates of related cash flows for specific investments. Termination or maturity of currency hedging instruments may result in an obligation for payment to or from the counterparty to the hedging agreement. We are exposed to credit loss in the event of non-performance by counterparties for these contracts. To manage this risk, we select major international banks and financial institutions as counterparties and perform a quarterly review of the financial health and stability of our trading counterparties. Based on our review as of March 31, 2016, we do not expect any counterparty to default on its obligations.
|
| | | | | | | | | | | |
| Hedged Currency | | Instrument Type | | Notional Amount (in thousands) | | FX Rates
($ per unit of foreign currency) | | Range of Expiration Dates |
| EUR | | FX Collar | | € | 142,425 |
| | Min $1.09 / Max $1.53 | | July 2017 to January 2021 |
| GBP | | FX Collar | | £ | 134,000 |
| | Min $1.40 / Max $1.82 | | September 2017 to December 2020 |
| EUR | | FX Forward | | € | 121,150 |
| | Range between $1.07 to $1.27 | | May 2016 to January 2019 |
| GBP | | FX Forward | | £ | 75,150 |
| | Range between $1.49 to $1.51 | | June 2016 to December 2018 |
| CHF | | FX Forward | | CHF | 55,545 |
| | Range between $1.47 to $1.50 | | January 2030 |
| NOK | | FX Forward | | NOK | 923,000 |
| | $0.12 | | May 2016 |
Inflation
Many of our assets and liabilities are interest rate sensitive in nature. As a result, interest rates and other factors influence our performance more so than inflation, although inflation rates can often have a meaningful influence over the direction of interest rates. Furthermore, our financial statements are prepared in accordance with GAAP and our distributions are determined by our board of directors primarily based on our taxable income, and, in each case, our activities and balance sheet are measured with reference to historical cost and/or fair market value without considering inflation.
ITEM 4. Controls and Procedures.
Evaluation of Disclosure Controls and Procedures
We maintain disclosure controls and procedures (as defined in Rule 13a-15(e) and 15d-15(e) of the Exchange Act) that are designed to ensure that information required to be disclosed in our reports that we file or submit under the Exchange Act is recorded, processed, summarized and reported within the time period specified in the SEC’s rules and forms, and that such information is accumulated and communicated to our management, including our Chief Executive Officer and Chief Financial Officer, as appropriate, to allow for timely decisions regarding disclosure. In designing and evaluating the disclosure controls and procedures, management recognizes that any controls and procedures, no matter how well designed and operated, can provide only reasonable assurance of achieving the desired control objectives, and management is required to apply its judgment in evaluating the cost-benefit relationship of possible controls and procedures. Accordingly, even effective disclosure controls and procedures can only provide reasonable assurance of achieving their control objectives.
As required by Rule 13a-15(b) of the Exchange Act, we have evaluated, under the supervision and with the participation of management, including our Chief Executive Officer and Chief Financial Officer, the effectiveness of our disclosure controls and procedures. Based upon our evaluation, our Chief Executive Officer and Chief Financial Officer concluded that our disclosure controls and procedures were effective at March 31, 2016.
Changes in Internal Control over Financial Reporting
There have been no changes in our internal control over financial reporting (as defined in Rule 13a-15(f) and 15d-15(f) of the Exchange Act) during the quarter ended March 31, 2016 that have materially affected, or are reasonably likely to materially affect, our internal control over financial reporting.
PART II—OTHER INFORMATION
ITEM 1. Legal Proceedings.
The Company may be involved in litigations and claims in the ordinary course of business. As of March 31, 2016, the Company was not involved in any material legal proceedings.
ITEM 1A. Risk Factors.
There have been no material changes to the risk factors included in our Annual Report on Form 10-K for the fiscal year ended December 31, 2015.
| |
| ITEM 2. | Unregistered Sales of Equity Securities and Use of Proceeds. |
On April 4, 2016, we issued 643,044 shares of our Class A common stock upon the redemption of an equal number of our OP Units, of which 526,443 OP Units were held by limited liability companies controlled by Thomas J. Barrack, Jr. and 116,601 OP Units were held by FHB Holding LLC (which is controlled by certain of our employees).
On April 4, 2016, in connection with such redemption of OP Units, we issued 19,144 shares of our Class A common stock upon conversion of an equal number of shares of our Class B common stock.
On May 9, 2016, we issued a total of 28,525 shares of our Class A common stock upon the redemption of an equal number of our OP Units, allocated among four different charitable organizations that held OP Units prior to their respective redemption requests. Such charitable organizations received such OP Units as a charitable contribution from FHB Holding LLC.
Such Class A Common Stock was issued and sold in reliance on Section 4(a)(2) of the Securities Act.
| |
| ITEM 3. | Defaults Upon Senior Securities. |
None.
ITEM 4. Mine Safety Disclosures.
Not applicable.
ITEM 5. Other Information.
None.
|
| | |
| Exhibit Number | | Description |
| | | |
| 10.1 | | Amended and Restated Credit Agreement, dated as of March 31, 2016, among Colony Capital Operating Company, LLC, the several lenders from time to time parties thereto and JPMorgan Chase Bank, N.A., as administrative agent (incorporated by reference to Exhibit 10.1 to the Company’s Current Report on Form 8-K filed on April 5, 2016) |
| 31.1* | | Certification of Richard B. Saltzman, President and Chief Executive Officer, pursuant to Rule 13a-14(a)/15d-14(a), as adopted pursuant to Section 302 of the Sarbanes-Oxley Act of 2002 |
| 31.2* | | Certification of Darren J. Tangen, Chief Financial Officer and Treasurer, pursuant to Rule 13a-14(a)/15d-14(a), as adopted pursuant to Section 302 of the Sarbanes-Oxley Act of 2002 |
| 32.1* | | Certification of Richard B. Saltzman, President and Chief Executive Officer, pursuant to 18 U.S.C. Section 1350, as adopted pursuant to Section 906 of the Sarbanes-Oxley Act of 2002 |
| 32.2* | | Certification of Darren J. Tangen, Chief Financial Officer and Treasurer, pursuant to 18 U.S.C. Section 1350, as adopted pursuant to Section 906 of the Sarbanes-Oxley Act of 2002 |
| 101** | | Financial statements from the Quarterly Report on Form 10-Q of Colony Capital, Inc. for the quarter ended March 31, 2016, formatted in XBRL (eXtensible Business Reporting Language): (1) Condensed Consolidated Balance Sheets, (2) Condensed Consolidated Statements of Operations, (3) Condensed Consolidated Statements of Comprehensive Income, (4) Condensed Consolidated Statements of Equity, (5) Condensed Consolidated Statements of Cash Flows and (6) Notes to Condensed Consolidated Financial Statements. |
__________
|
| |
| * | Filed herewith |
| ** | Pursuant to Rule 406T of Regulation S-T, the interactive data files on Exhibit 101 hereto are deemed not filed or part of a registration statement or prospectus for purposes of Sections 11 or 12 of the Securities Act of 1933, as amended, are deemed not filed for purposes of Section 18 of the Securities Exchange Act of 1934, as amended, and otherwise are not subject to liability under those sections. |
SIGNATURES
Pursuant to the requirements of the Securities Exchange Act of 1934, as amended, the registrant has duly caused this report to be signed on its behalf by the undersigned thereunto duly authorized.
Dated: May 10, 2016
|
| | |
| | | |
| COLONY CAPITAL, INC. |
| | | |
| By: | | /s/ Richard B. Saltzman |
| | | Richard B. Saltzman |
| | | Chief Executive Officer and President |
| | | |
| By: | | /s/ Darren J. Tangen |
| | | Darren J. Tangen |
| | | Chief Financial Officer and Treasurer (Principal Financial Officer and Principal Accounting Officer) |