UNITED STATES
SECURITIES AND EXCHANGE COMMISSION
Washington, D.C. 20549
Form 10-K
| x | ANNUAL REPORT PURSUANT TO SECTION 13 OR 15(d) OF THE SECURITIES EXCHANGE ACT OF 1934:For the Fiscal Year Ended December 31, 2011 |
| ¨ | TRANSITION REPORT PURSUANT TO SECTION 13 OR 15(d) OF THE SECURITIES EXCHANGE ACT OF 1934 |
Commission File Number 333-160476
| DEYU AGRICULTURE CORP. |
| (Exact name of registrant as specified in its charter) |
| Nevada | | 80-0329825 |
| (State or other jurisdiction of | | (I.R.S. Employer |
| incorporation or organization) | | Identification No.) |
Headquarters in China
8th Floor, Block 5, Aolinjiatai Building
1 Kehuiqian Street
Chaoyang District, Beijing, China
Zip Code: 100192
Office in the United States
Columbus Circle 5
1790 Broadway, 8th Floor
New York, New York 10019, USA
(Address, including zip code, of principal executive offices)
In China:86-10-5224 1802
In the United States: (646) 820-8060
(Registrants’ telephone number, including area code)
| Securities Registered Under Section 12(b) of the Exchange Act: | None |
| Name of exchange on which registered: | None (OTCQB) |
| Securities registered pursuant to Section 12(g) of the Act: | Common Stock, par value $0.001 per share |
Indicate by check mark if the registrant is a well-known seasoned issuer, as defined in Rule 405 of the Securities Act. Yes¨Nox
Indicate by check mark if the registrant is not required to file reports pursuant to Section 13 or Section 15(d) of the Exchange Act. Yes¨Nox
Indicate by check mark whether the registrant (1) has filed all reports required to be filed by Section 13 or 15(d) of the Securities Exchange Act of 1934 during the preceding 12 months and (2) has been subject to such filing requirements for the past 90 days. YesxNo¨
Indicate by check mark whether the registrant has submitted electronically and posted on its corporate Web site, if any, every Interactive Data File required to be submitted and posted pursuant to Rule 405 of Regulation S-T during the preceding 12 months (or such shorter period that the registrant was required to submit and post such files). YesxNo¨
Indicate by check mark if disclosure of delinquent filers pursuant to Item 405 of Regulation S-K is not contained herein, and will not be contained, to the best of registrant’s knowledge, in definitive proxy or information statements incorporated by reference in Part III of this Form 10-K or any amendment to this Form 10-K. ¨
Indicate by check mark whether the registrant is a large accelerated filer, an accelerated filer, a non-accelerated filer, or a smaller reporting company. See the definitions of “large accelerated filer,” “accelerated filer” and “smaller reporting company” in Rule 12b-2 of the Exchange Act.
| Large accelerated filer ¨ | Accelerated filer ¨ | Non-accelerated filer ¨ |
| | Smaller Reporting Companyx | |
Indicate by check mark whether the registrant is a shell company (as defined in Rule 12b-2 of the Exchange Act). Yes ¨ Nox
As of the end of the issuer’s most recently completed second fiscal quarter, the issuer’s public float was approximately $15,093,705. As of the end of the issuer’s fiscal year ended December 31, 2011, its net revenue from continuing operations was $261,576,666.
The number of outstanding shares of the registrant’s Common Stock on March 27, 2012 was 10,564,774.
Documents Incorporated By Reference:
NONE
DEYU AGRICULTURE CORP.
FORM 10-K
INDEX
| | | | Page |
| PART I | | | |
| Item 1. | Business. | | 3 |
| Item 1A. | Risk Factors. | | 16 |
| Item 1B. | Unresolved Staff Comments. | | 16 |
| Item 2. | Properties. | | 16 |
| Item 3. | Legal Proceedings. | | 17 |
| Item 4. | Mine Safety Disclosures. | | 17 |
| | | | |
| PART II | | | |
| Item 5. | Market for Registrant’s Common Equity, Related Stockholder Matters and Issuer Purchases of Equity Securities. | | 17 |
| Item 6. | Selected Financial Data. | | 20 |
| Item 7. | Management’s Discussion and Analysis of Financial Condition and Results of Operations. | | 20 |
| Item 7A. | Quantitative and Qualitative Disclosures about Market Risk. | | 31 |
| Item 8. | Financial Statements and Supplementary Data. | | 31 |
| Item 9. | Changes in and Disagreements with Accountants on Accounting and Financial Disclosure. | | 31 |
| Item 9A. | Controls and Procedures. | | 31 |
| Item 9B. | Other Information. | | |
| PART III | | | |
| Item 10. | Directors, Executive Officers and Corporate Governance. | | 32 |
| Item 11. | Executive Compensation. | | 38 |
| Item 12. | Security Ownership of Certain Beneficial Owners and Management and Related Stockholder Matters. | | 40 |
| Item 13. | Certain Relationships and Related Transactions, and Director Independence. | | 42 |
| Item 14. | Principal Accountant Fees and Services. | | 43 |
| | | | |
| Part IV | | | |
| Item 15. | Exhibits, Financial Statement Schedules. | | 44 |
| | | | |
| SIGNATURES | | | 48 |
DEYU AGRICULTURE CORP.
PART I
ITEM 1. Business
Overview
In this Annual Report on Form 10-K, unless otherwise indicated, the words “we”, “us” and “our” refer to Deyu Agriculture Corp., a Nevada corporation and all entities owned or controlled by Deyu Agriculture Corp. All references to “Deyu” or the “Company” in this Annual Report mean Deyu Agriculture Corp., and all entities owned or controlled by Deyu Agriculture Corp., except where it is made clear that the term only means the parent or a subsidiary company. References in this Annual Report to the “PRC” or “China” are to the People’s Republic of China and references to “SEC” are to the U.S. Securities and Exchange Commission.
We are a vertically integrated producer, processor, marketer and distributor of organic and other agricultural products made from corn and grains operating in Shanxi Province in the People's Republic of China. The Company has access to over 109,000 acres of farmland in Shanxi Province for breeding, cultivating, processing, warehousing, and distributing grain and corn products. We have an extensive wholesale network in over 15 provinces and a retail distribution network of approximately 20,000 supermarkets and convenience stores in 29 provinces across China. We are equipped with advanced production lines and modern warehouses with production capacity of over 105,000 tons for grain products, capacity of storage of over 100,000 tons and annual turnover of 700,000 tons for our corn products.
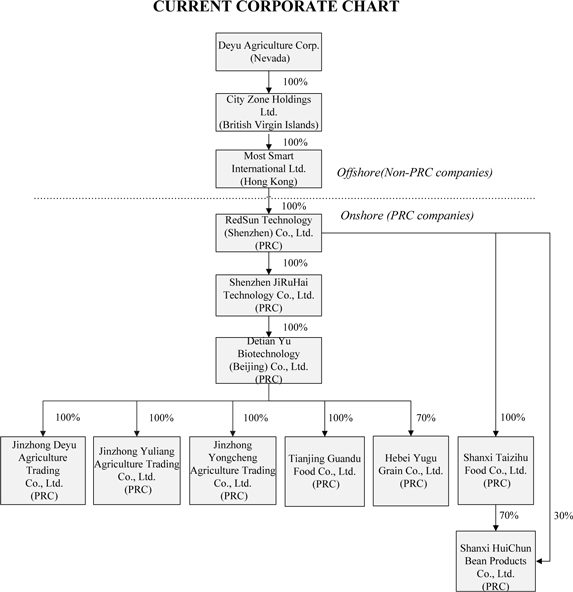
Our farming operations are conducted through our wholly-owned PRC subsidiaries, Jinzhong Deyu Agriculture Trading Co. Limited (“Jinzhong Deyu”), Jinzhong Yongcheng Agriculture Trading Co. Limited (“Yongcheng”) and Jinzhong Yuliang Agriculture Trading Co. Limited (“Yuliang”). Yongcheng and Yuliang focus on processing and distributing our corn and corn byproducts. Our grain processing and distribution are conducted through our wholly-owned PRC subsidiaries, Jinzhong Deyu, Shanxi Taizihu Food Co. Ltd. (“Taizihu”), Shanxi Huichun Bean Products Co., Ltd. Our other wholly-owned PRC subsidiaries, Detian Yu Biotechnology (Beijing) Co., Ltd. ("Detian Yu") and Tianjin Guandu Food Co., Ltd. ("Tianjin Guandu"), and our majority-owned PRC subsidiary Hebei Yugu Grain Co., Ltd. ("Hebei Yugu") together with Jinzhong Deyu are engaged in bulk trading of rice, flour, wheat and other agriculture products and the distribution of our processed grain products.
A brief description of our products is set forth below, by division:
| · | Corn Division –Yongcheng and Yuliang process and distribute corn and corn byproducts. Yongcheng and Yuliang acquire unprocessed corn and perform value-added processes to the corn such as cleaning, drying and packaging. Consumers range from livestock feed companies to corn oil/corn starch manufacturing companies and governmental procurement agencies in China. |
| | |
| · | Grain Division –Jinzhong Deyu acquires unprocessed grains including millet, green bean, soy bean, black rice and many other varieties of grains traditionally grown and consumed in China and performs value-added processes to the grains such as peeling, cleaning, grinding and packaging. Taizihu and Huichun mainly produce and distribute deep processed grain products, including bean based products, fruit vinegars and juices and other grain products. The finished products of this division are then sold directly to supermarkets and convenience stores in China and overseas. |
| | |
| · | Bulk Trading Division –Jinzhong Deyu, Detian Yu, Tianjin Guandu and Hebei Yugu conduct bulk trading through procuring and wholesaling rice, flour, wheat, kidney beans, green beans and other agricultural products. The majority of our customers for this division are food manufacturers, grain trading companies, wholesalers and governmental procurement agencies in China. |
Operating revenue from continuing operations for the year ended December 31, 2011 was $261,576,666, representing a 207% increase from $85,174,884 for the year ended December 31, 2010. Our net income available to common stockholders for the year ended December 31, 2011 was $17,335,442, representing a 50.7% increase from $11,502,253 for the year ended December 31, 2010.
Our principal office is located at 8th Floor, Block 5, Aolinjiatai Building, 1 Kehuiqian Street, Chaoyang District, Beijing, China 100192. Our telephone number in China is +(8610)-5224 1802 and our fax number is +(8610)-5224 1822. Our telephone number in the United States is (646) 820-8060. Our corporate website iswww.deyuagri.com (information on our website is not made a part of this Annual Report).
Corporate History
2010 Share Exchange and Preferred Stock Financings
On April 27, 2010, Deyu (then known as Eco Building International, Inc.) completed the acquisition of City Zone Holdings Limited, an emerging organic and non-organic agricultural products distributor in Shanxi Province, China, engaged in procuring, processing, marketing and distributing various grain and corn products (“City Zone”), by means of a share exchange (the “Exchange”). As a result of the Exchange, City Zone became a wholly-owned subsidiary of Deyu.
Simultaneously with the acquisition, we completed a private placement offering in the gross amount of $8,211,166 of the sale of securities to accredited investors at $4.40 per unit, with each “Unit” consisting of one share of our Series A convertible preferred stock and one warrant to purchase 0.4 shares of our common stock with an exercise price of $5.06 per share. We executed a Securities Purchase Agreement in connection with the offering, which is referenced as Exhibit 10.1 herein.
On May 10, 2010, we closed on the second and final round of the private placement offering as disclosed in our Current Report on Form 8-K filed with the SEC on May 3, 2010 through the sale of 589,689 Units comprised of 589,689 shares of our Series A convertible preferred stock and 235,882 five-year warrants with an exercise price of $5.06 per share, to certain accredited investors for total gross proceeds of $2,594,607. We raised an aggregate amount of $10,805,750 in the two rounds of offerings.
In connection with the financing transaction, we entered into (i) a Registration Rights Agreement, (ii) a Lock-Up Agreement and (iii) a Securities Escrow Agreement for a make good arrangement with our management (together with the Securities Purchase Agreement, these agreements shall be referred to as the “Financing Documents”).
The private placement closed simultaneously with the signing of the Financing Documents and our issuing of 2,455,863 shares of Series A convertible preferred stock and warrants exercisable into 982,362 shares of common stock to certain investors (collectively, the “Investors”). Pursuant to its terms, the Series A convertible preferred stock receive cumulative dividends at a rate of 5% per annum and can be converted into common stock on a 1:1 basis, subject to applicable adjustments. Pursuant to its terms, the warrants can be converted into 982,362 shares of common stock at an exercise price of $5.06 per share (the "Warrants"). The Warrants will expire on April 27, 2015.
Pursuant to the Registration Rights Agreement, we agreed to file a registration statement on Form S-1 (or other applicable Form) within 60 days of the close of such financing. We filed a Registration Statement on Form S-1 with the SEC on June 15, 2010, and on October 21, 2010, the SEC declared the Form S-1 effective.
We also entered into a Lock-Up Agreement with the Investors, pursuant to which the common stock owned by the management of City Zone was locked-up for the six (6) month period following the effectiveness of the Registration Statement is declared effective. The Lock-Up Agreement expired on April 21, 2011.
Lastly, pursuant to the Securities Escrow Agreement, our majority shareholder (Expert Venture Limited) pledged 2,455,863 shares of common stock of the Company (the “Make Good Shares”) to secure the obligation that we reach certain earnings thresholds for the fiscal years ended 2010 and 2011. Since the Make Good Shares have already been issued to Expert Venture Limited, any transfer of the shares pursuant to the terms of the Make Good Agreement will not cause any dilution to existing shareholders. One half (or 1,227,932 shares) of the Make Good Shares were allocated to the 2010 earnings requirement and the other half (1,227,931 shares) of the Make Good Shares were allocated to the 2011 earnings requirement. For the fiscal year 2010, we met our threshold requirement of reporting net income of at least 95% of $11,000,000. If we meet the threshold in 2011 of reporting net income of at least 95% of $15,000,000 (i.e., at least $14,250,000), the remainder of the Make Good Shares will be returned to Expert Venture Limited, however if we fail to meet our threshold, then the Make Good Shares will be released from escrow based on the following terms and conditions:
| · | If we achieve net income of less than 50% of $15,000,000 (or $7,500,000), then 1,227,931 shares shall be released to the investors on a pro rata basis (based on the amount of each investors investment). |
| | |
| · | If we achieve net income of between 50% and less than 95% of $15,000,000, then a portion of the 1,227,931 shares held in escrow shall be disbursed to the Investors (the remaining shares will be returned to Expert Venture Limited). The number of shares released to the investors shall be determined by doubling the percentage missed between the actual net income as compared to the make good target and then multiplying that by the 1,227,931 escrow shares. |
Additionally, as a result of the Exchange, we changed our fiscal year end to December 31.
On May 19, 2010, we filed with the Secretary of State for the State of Nevada a Certificate of Amendment to our Articles of Incorporation changing our name from “Eco Building International, Inc.” to “Deyu Agriculture Corp.” FINRA declared the name change effective on June 2, 2010.
Deyufarm VIE Control Agreements
On November 16, 2010, Detian Yu entered into a series of control agreements (collectively, the “Control Agreements”) with each of (a) Beijing Jundaqianyuan Investment Management Co., Ltd. (“Junda”), a PRC company and equity interest holder in Deyufarm Innovation Food (Beijing) Co., Ltd., a PRC company (“Deyufarm”) and (b) Jinzhong Longyue Investment Consultancy Services Co., Ltd. (“Longyue”), a PRC company and equity interest holder in Deyufarm whereby Detian Yu provided management and consulting services and business cooperation opportunities services to each of Junda and Longyue in exchange for service fees from each of Junda and Longyue equal to 100% (in the aggregate) of the net income after tax of each of Junda and Longyue. Together, Junda and Longyue own 64.2857% of Deyufarm, and each derive 100% of their income from the profits generated by Deyufarm through its wholly-owned subsidiary, Sichuan Haoliangxin Instant Food Co., Ltd., a PRC company, and Beijing Xinggu Deyufarm Food Co. Ltd., a PRC company (together with Deyufarm, Junda and Longyue, the “VIE Group”). A complete description of the transaction is set forth in the Registrant’s Current Report on Form 8-K as filed with the SEC on November 17, 2010.
On December 20, 2011, Detian Yu executed a series of termination agreements whereby Detian Yu terminated its control over the VIE Group (collectively, the “Termination Agreements”), effective immediately. The Company’s Board of Directors and a majority of the preferred shareholders of the Company approved the disposition of the VIE Group.
Other Recent Developments
On June 16, 2011, Tianjin Guandu (previously named Tianjin Detianyu Food Co., Ltd. before October 24, 2011), a newly formed wholly-owned subsidiary of Detian Yu with RMB10,000,000 ($1,544,497) registered capital entered into a Cooperation Agreement with the Administrative Committee of Sino-Singapore Tianjin Eco-city (the “Agency”), the representative organization of the Tianjin Municipal Government. The agreement provides for a cooperative relationship between Tianjin Guandu and the Agency regarding Tianjin Guandu’s establishment of its operations in Tianing’s Eco-city, particularly with respect to certain tax arrangements. Tianjin Guandu is in the business of wholesale distribution of simple-processed and deep-processed packaged food products and staple foods.
On July 25, 2011, we incorporated and registered Hebei Yugu, a 70%-owned subsidiary of Detian Yu with RMB10,000,000 ($1,563,824) in registered capital, in Gaocheng City of Shijiazhuang, Hebei Province,China. Hebei Yugu is primarily engaged in wholesale distribution of grains, beans and potatoes.
On February 2, 2012, RedSun Technology (Shenzhen) Co. Limited ( “Redsun”), a wholly-owned subsidiary of the Company, acquired 100% of the issued and outstanding registered share capital of Taizihu and its subsidiary, Huichun (together with Taizihu, the “Taizihu Group”) in consideration of RMB34,705,000 ($5,502,181). The Taizihu Group is in the business of producing and selling bean based products, fruit vinegars and juices and other grain products. The Company will file the audited financial statements of the Taizihu Group and pro forma financial information required to be filed with the SEC not later than April 19, 2012 in accordance with the rules of the SEC.
Corporate Structure
The Company’s current corporate structure is set forth below:
Competitive Advantages
Cultivation Base
Our grains are mainly grown in the hilly area near Taihang Mountain, at an altitude of between 5,000 to 8,000 feet above sea level. This region has a wide temperature variation between night and day and a long daily exposure to sunlight. These geographic characteristics produce grains that are rich in nutrients, especially minerals, rutin, cellulose, amino acids, chlorophyll, lecithin and linoleic acid.
Partnership with Farmers
Agricultural land for large scale farming of grains is becoming a rarity in China. With the support of our local government, we have adopted the operation mode of“Company + Farmers + Base on a large scale”. We have the cultivation base of 109,000 acres in Jinzhong in Shanxi Province for the supply of corn and grain by obtaining the land use rights of 17, 000 acres of farmland with average remaining use life of 38 years and signing agricultural co-operative agreements with the governments of the counties and villages for the development of 92,000 acres for 20 years. We have established stable partnerships with over 60,000 farmers to grow crops on the farmland. We provide instruction to the farmers for planting crops and technical support for seeding and cultivation. The scale cultivation ensures our stable supply of raw material with high quality.
Advanced Production Lines
We have a modern processing center for corn with five drying cylinders and six warehouses, the construction of which was completed in 2011. Our total capacity of storage and annual turnover of corn has exceeded 100,000 tons and 700,000 tons, respectively. We are also equipped with fully automatic and advancedproduction lines for grain processing with a total production capacity of over105,000 tons. The advanced production lines and production technologies help produce grain products with high quality by maintaining the nutritional components of the products.
Warehousing and Logistics
We operate six self-owned warehouses, one rental warehouse and some temporary warehouses with total storage capacity of over 100,000 tons of food products and an annual turnover of 700,000 tons. This capacity helps us to reach economies of scale with low cost of processing and storage. Our production bases are located in Jinzhong and Quwo in Shanxi Province with convenient transportation. The Jinzhong facilities and warehouses are in proximity to Shitai Railway and Provincial Road 317. The Quwo facilities are several kilometers away from Houma, a transportation hub. We have exclusive lease agreements with three railway lines for freight transportation in Jinzhong: (a) Shanxi Cereal & Oil Group, Mingli Reservation Depot; (b) Shanxi Yuci Cereal Reservation Depot; and (c) Yuci Dongzhao Railway Freight Station. These advantageous geographical positions and exclusive agreements help us ensure speedy delivery of our products at a low cost.
Established Sales Network
We have cultivated an extensive wholesale network for corn and bulk trading with customers including various livestock feed companies, food manufacturers, corn oil/corn starch manufacturing companies, grain trading companies, wholesalers and governmental procurement agencies in approximately 15 provinces. Meanwhile, our retail sales network for processed grain covers approximately 20,000 supermarkets and convenience stores with distribution to over 29 provinces in China, including the cities of Beijing, Tianjin, Jinan, Fuzhou, Chengdu and Shijiazhuang, in some of the world’s widely known supermarkets. We believe the rapid development of our sales network has increased our revenue as well as our brand awareness.
Our Current Products and Product Characteristics
Our products in our Corn Division are simple processed corn. Our products in our Grain Division include approximately 200 types of products sold for retail distribution in supermarkets and convenience stores, including: (1) simple processed grain products packaged under our registered trademarks “Deyu” and “Shitie”; (2) bean based products under the brand name “Huicun” including vegetarian products and instant noodles made from soybeans, black beans and green beans; and (3) fruit vinegars and juices under the brand “Longquan Villa”. Our products in our Bulk Trading Division include rice, flour, wheat, kidney beans, green beans, chicken and other agricultural products. The following table lists our major products in our Grain Division:
| Category | | Product | | Weight/Unit | | Unit |
| Packed grains | | Millet, soy bean, mung bean, black rice and corn grits, etc. | | 400 to 800g | | Bag |
| Packed flour | | Mung bean flour, corn flour, buckwheat flour and sorghum flour, etc. | | 800 to 2,400g | | Bag |
| Grain gift boxes | | Millet & grains mix | | 400 to 425g | | Bag |
| Vacuum-packed grains | | Millet, sorghum, sticky rice, black rice, black bean, soy bean, mung bean, black rice, etc. | | 370 to 440g | | Bag |
| Large-pack beans | | Soy bean, mung bean, red bean, kidney bean, black bean, etc. | | 25kg | | Bag |
| Large-pack rice | | Millet, sorghum, coix seed, black rice, sticky rice and buckwheat rice, etc. | | 25kg | | Bag |
| Large-pack flour | | Sorghum flour, corn four, mung bean flour, bulkwheat flour, oat flour, etc. | | 25kg | | Bag |
| Bean-based products | | Vegetarian chicken wings, vegetarian prawns, vegetarian bean mushroom, thick-strip bean-based noodles, thin-strip bean-based noodles and various bean-based instant noodles. | | 60-500g | | Bag |
| Fruit vinegar and juices | | Apple vinegar, jujube vinegar, grape vinegar, golden pear juice, kiwi vinegar, strawberry juice, etc. | | 250-400g | | Bottle |
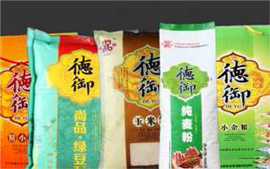 |  |
| Packaged Grains of “Deyu” | Grain Gift Boxes of “Deyu” |
| |
 |  |
| Bean-based Products of “Huichun” | Fruit Vinegars & juices of “Longquan Villa” |
| | |
We also sell unpackaged products of various kinds of grains at special counters under the brand name “Deyu” in supermarkets where customers can scoop the grains into plastic bags to determine the volume they want.
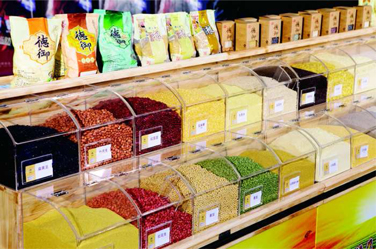 |
| |
| Special Counter Selling Unpacked Grains in Supermarket |
Our farmland is located in the center of Shanxi Province, which has a relatively dry climate and which is ideal for grain cultivation. Grain crop growth relies principally on the climate and rainfall, and is not dependent on the application of chemical fertilizers or pesticides. Our simple and deep processing of grains maintain the grain’s original nutritional components. A portion of Jinzhong Deyu’s grain products are certified as “organic” by the Beijing Zhonglu Huaxia Organic Food Certification Centre, the chief organic food certification organization accredited and approved by the Certification and Accreditation Administration of the PRC (CNCA).
We provide technological guidance and support to our farmers regarding seed dissemination, cultivation methods, ecological fertilizer, irrigation, cultivation, weeding and harvesting. We believe working closely with our farmers helps ensure that we receive high quality raw materials for production. We also utilize an advanced product control system to help ensure high-quality finished products.
Key Customers
No single customer accounted for greater than 10% of the Company’s consolidated gross revenue or consolidated accounts receivable as of December 31, 2011. For the year ended December 31, 2010, one customer accounted for 18% of the Company’s consolidated gross revenue while no other single customer accounted for greater than 10%. The same customer accounted for 3% of the Company’s consolidated accounts receivable as of December 31, 2010 while no single customer accounted for greater than 10%.
Our customers are mainly in China, composed mainly of (1) livestock feed companies, corn oil/corn starch manufacturing companies and governmental procurement agencies in our Corn Division; (2) distributors, chains of supermarkets and convenience stores in our Grain Division; and (3) grain trading companies, wholesalers and governmental procurement agencies in our Bulk Trading Division. Our bean-based products are also sold through our export agencies to Japan, USA, Germany, Canada and other countries in Asia.
For our Corn Division, the portion of revenues derived from new or small customers has increased and the overall number of customers also increased. For our Grain Division, our customers are diversified among distributors and chain of supermarkets. For our Bulk Trading Division, a newly-added business in the fourth quarter of 2010, we have established stable relationships with Tianjin Yimingda Grain Division (a wholesaler), which is one of our largest customers and accounts for 28.3% of gross sales of Bulk Trading Division. We believe we can continue to keep stable relationships with existing customers and enlarge our customer base in the future.
Sources of Raw Materials and Key Suppliers
We procure raw materials at our cultivation base in Jinzhong, Shanxi Province, which produces grains rich in nutrients, especially minerals, rutin, cellulose, amino acids, chlorophyll, lecithin and linoleic acid. Shanxi Province is located on the Loess Plateau in the western part of China. The city of Jinzhong is located in the center of Shanxi Province. We believe the topography of the region creates optimal conditions for growing grains. Favorable weather conditions, combined with our geographical conditions lead to high-quality products. There has been no serious flood or drought in the region in the past 100 years. The temperature difference between day and night is greater than 10 degrees Celsius. The weather is dry and cold. There are about 158 days without frost during the year and the growing period is longer than 135 days. The weather conditions are especially favorable for growing corn and grains. Grains are highly drought resistant. We rely on natural rainfall, and no irrigation is required throughout the year and no application of chemical fertilizer or pesticides is needed. Irrigation by underground water is only required under exceptional circumstances.
The growing season for our corn and grain in the Shanxi Province is 135+ days, which requires only one planting per year of the farmland. Our warehouses have storage capacity of 100,000+ tons and a turnover capacity of 700,000+ tons. We believe that our storage capacity, combined with our ability to expand our network of cooperative farmers and farmer’s agents, as well as the ability to expand our purchasing into other geographical areas in Shanxi Province, reduces our risks which may be attributable to raw material seasonality.
We purchase raw material directly from farmers, farmer’s agents and other various suppliers. We did not have any suppliers who accounted for 10% or more of total purchases of raw materials or 10% or more of total trade payables during the fiscal years ended December 31, 2011 and 2010.
Market Opportunity
Corn and Corn Byproducts
Corn is used extensively in feeds, food for human consumption and highly processed products. According to the United States Department of Agriculture (“USDA”), the demand for corn in the global and Chinese markets has continued to increase with annual growth for 2009 through 2012 of 3% and 7%, respectively, and the growth is expected to continue in the next five years. Further, the global demand for corn has substantially exceeded supply from 2009 through 2012. China is the world’s second-leading consumer and producer of corn, second only to the United States, accounting for over 20% oftheworld’s consumption. The following table shows the statistics of supply and demand for the global and Chinese markets from 2009 to 2012 (including estimated and forecasted):
| Year | | Beginning
Balance | | | Supply | | | Demand | | | Gap Between
Supply and Demand | | | Closing
Balance | | | Demand
Growth Rate | |
| Global | | | | | | | | | | | | | | | | | | | | | | | | |
| 2009/2010 | | | 147,340 | | | | 819,230 | | | | 822,500 | | | | (3,270 | ) | | | 144,070 | | | | 2 | % |
| 2010/2011 (estimated) | | | 144,080 | | | | 827,350 | | | | 843,370 | | | | (16,020 | ) | | | 128,060 | | | | 3 | % |
| 2011/2012 (forecasted) | | | 128,060 | | | | 867,520 | | | | 868,610 | | | | (1,090 | ) | | | 126,970 | | | | 3 | % |
| | | | | | | | | | | | | | | | | | | | | | | | | |
| China | | | | | | | | | | | | | | | | | | | | | | | | |
| 2009/2010 | | | 5,118 | | | | 16,527 | | | | 16,515 | | | | 12 (Note) | | | | 5,130 | | | | 6 | % |
| 2010/2011 (estimated) | | | 5,130 | | | | 17,823 | | | | 17,611 | | | | 212 (Note) | | | | 5,342 | | | | 7 | % |
| 2011/2012 (forecasted) | | | 5,342 | | | | 19,475 | | | | 19,120 | | | | 355 (Note) | | | | 5,697 | | | | 9 | % |
Note: The domestic supply is supplemented by imports.
(Units: '000 tons, Source: USDA)
Corn is primarily used as raw feed material for pigs, cattle, chicken and other livestock. Corn byproducts, including corn stalks, are also used as an important source of feed. Since 1997, feed production has maintained steady growth. China is now the world’s second largest feed producer according to USDA.
In many developed countries, corn is generally regarded as a “health food”. In the United States, it is believed that over 10% of health foods are made with corn or corn byproducts. Corn oil squeezed from corn germ contains over 10 types of fatty acids, more than 50% of which are acids rich in vitamins A and E. Corn oil is low in cholesterol and is believed to have positive effects on high blood pressure and heart disease. Corn oil is also widely used in the pharmaceutical and chemical industries. In recent years, demand for corn for food products in international markets has grown.
Corn is also used as raw material for highly processed industrial products. Corn can be used to produce ethanol as renewable fuels. Global energy shortages make corn an attractive alternative energy source. With the requirement of environmental protection, the demand for corn from ethanol producers has increased dramatically in recent years.
Grain Products
Grain products contain high levels of vitamin B1, dietary fiber and trace elements. Coarse grains are believed to be beneficial to people with diabetes or high blood pressure. The Chinese Nutrition Society, commissioned by the Ministry of Health in 2011 to formulate dietary guidelines, recommends consumption of 250-400 grams per day of processed grain foods for adults. They also recommended that adults consume 50-100 grams per day of coarse grains and whole grain foods and consume 30-50 grams per day of bean or bean-based products. Over 70% of adults in China, amounting to approximately 665 million people, are urban residents. Based on these guidelines, the demand for coarse grain products and bean-based products by people in urban cities could reach 18.2 million tons and 9.7 million tons per year, respectively.
As a result of the economic growth and improved living standards in China, the dietary components of the Chinese population have changed dramatically. In general, the population pays more attention to diet and nutrition. Management believes that the increased awareness of the value and benefits of grain products has resulted in an increased demand for our grain products.
Competitive Landscape
In the corn market and grain bulk trading industry, our current major competitors are smaller and local focus traders such as Jinzhong Dexinchang Trading Co., Ltd., Jinjian Rice Industry Co., Ltd. and Beijing Guchuang Food Co., Ltd., which are mainly engaged in the corn and grain bulk procurement and wholesale businesses.
In the grain consumption marketplace, we primarily compete with smaller grain processers and food manufacturers, which are local in focus, have a single production line, little brand recognition and limited distribution networks. The following table lists our competitors with their main products:
| Competitors | | Products of Competitors Produced
and /or sold by Competitors |
| Shanxi Jin Wei Yuan Grains Company Limited | | packaged and unpackaged grain |
| Shanxi Qinzhou Huang Millet Group Limited Company | | packaged and unpackaged millet, soybean |
| Heshun Xinma Grains Development Co., LTD | | packaged and unpackaged millet,beans, flour |
| Hebei Gaopaidian DouDou Food (Group) Co., Ltd. | | bean products |
| Shandong Daogongfang Food Co., Ltd. | | bean products |
| Yantai Yiyuan Beverage Co., Ltd. | | fruit vinegars, especially apple vinegars |
| Zhengzhou Luer Biotechnology Development Co., Ltd. | | fruit vinegars and fruit juices |
Sales Network
Corn Products and Bulk Trading Products
We have established a diversified customer base in approximately 15provinces in China, including Shanxi, Hebei, Henan, Shandong, Anhui, Shaanxi, Sichuan, Hunan, Hubei, Guangdong, Jiangsu, Liaoning, Beijing, Tianjin and Chongqing, with stable partnerships with various livestock feed companies, corn oil/corn starch manufacturing companies and food manufacturers, grain trading companies, wholesalers and governmental procurement agencies.
Grain Products
We have established a marketing center in Beijing focused on promoting our products throughout China. In addition, we plan to expand our sales network to include offices in the cities of Shenzhen, Hangzhou, Chengdu, Tianjin and Chongqing. Our main sales channels are as follows:
| · | Supermarkets: At present, our sales network covers approximately 20,000 supermarkets and convenience stores with distribution to over 29 provinces in China, including the cities of Beijing, Tianjin, Jinan, Fuzhou, Chengdu and Shijiazhuang, in some of the world’s most widely known supermarket chains. |
| | |
| · | Sales channels of unpackaged products: We also sell unpackaged products of various kinds of grains at special counters under the brand name “Deyu” in over 200 supermarkets open and loosely in baskets where customers can scoop the grains into plastic bags to determine the volume they want, and such sales strategy targets a large number of consumers. |
| | |
| · | Overseas sales: Our bean-based products are also sold through our export agencies to Japan, USA, Germany, Canada and other countries in Asia. |
Processing and Warehousing Capacities
General
We maintain facilities in central and southern Shanxi Province with total site coverage of approximately 1,780,000 square feet (approximately 165,000 square meters) and constructed area of 482,000 square feet (approximately 45,000 square meters). Our facilities are equipped with advanced crop production, processing and packaging lines as well as modern equipment.
Corn Production Capacity
Our Corn Division’s warehousing, processing and logistics center is located in Jinzhong with site coverage of 504,000 square feet (approximately 46,000 square meters) and constructed area of 129,000 square feet (approximately 12,000 square meters). The construction of this processing center was completed in June 2011 with five drying cylinders and six warehouses for the storage of 70,000 tons. We have a large rental cave-type warehouse named Shanxi 661 Warehouse with storage capacity of 30,000 tons. We also have contracts for temporary warehouses near railway stations which supplement our storage capacity. Our total capacity of storage and annual turnover reach over 100,000 tons and 700,000 tons, respectively.
We process drying and water removal treatments for corn before the corn is stored in our warehouses. The five drying cylinders are equipped with the most advanced equipment for corn drying. After the drying process, the corn is packaged in bags and moved into warehouses. Then, the products undergo insecticide and anti-bacterial treatments. After being sealed and air ventilated, the products are then stored in enclosed warehouses.
Our six newly-constructed warehouses are equipped with advanced detection and air ventilation devices to ensure cereals are being kept in good condition. Ventilation ducts are installed on the ground level of the warehouses. Once moisture is detected, air ventilation driven by a blower will help disseminate the overall heat on the cereals. Infrared temperature sensors and 360-degree high resolution cameras have been installed in each warehouse to allow the control room to conduct 24-hour monitoring for real-time analysis of water, moisture, mildew and pests so that we can quickly take corrective measures.
The cave-type warehouse that we rent is fully enclosed and have thermostatic and moisture proof characteristics. The cave-type warehouse is built with 1.5 meter thick walls and moisture proof layers. They maintain a temperature of 10 degrees Celsius throughout the year, which is well-suited for food storage. Since no air conditioning is required, the operating costs of these warehouses are low. These warehouses are also equipped with infrared sensors that can accurately detect temperature changes and the presence of rodents, insects, and other pests.
Grain Production Capacity
We are equipped with three fully automatic production lines for millet, grain and flour at our Jinzhong production base in the center of Shanxi Province, with site coverage of approximately 199,000 square feet (approximately 18,000 square meters) and a constructed area of 118,000 square feet (approximately 11,000 square meters). These lines include various kinds of rice milling machines, filtering machines, elevators, color selection machines, exhaust fans, automatic packing machines and other equipment. The production capacity of grain is over 60,000 tons.
Another production base in Quwo, in the southern part of Shanxi Province, has site coverage of over 1,076,000 square feet (approximately 100,000 square meters) and a constructed area of 234,000 square feet (approximately 22,000 square meters). This base is equipped with three kinds of advanced production lines: (1) two production lines for bean-based products with an annual production capacity of 15,000 tons; (2) two production lines for other grain products with an annual production capacity of over 26,000 tons; and (3) two production lines for fruit vinegar and fruit juices with an annual production capacity of 4,000 tons. These production lines are comprised of advanced grain milling, degreasing, automatic drying, packaging, inspection and testing equipment. At present, less than one third of the land at this production base has been developed. We believe we can develop more production lines for future demand without acquiring land use rights for more land.
To ensure high quality, we have installed fully automated production equipment at our facilities. Characteristics of our productionlinesand equipment are as follows:
| | · | Production equipment for grain processing is fully automated. We use elevators to move raw materials through the production process. The production process is fully enclosed for protection against any pollution or contamination. We have installed equipment with advanced color selection technology for grains. We believe the device is stable and reliable, and it features automatic temperature control, automatic removal of dust and impurities, automatic air pressure detection, self injection and light testing. We have a cooling system that helps millet maintain its nutritious components, color and appearance. Selective application of the polishing process helps maintain nutritional components. |
| | | |
| | · | Soybean food series production uses advanced technology of dry heat extrusion equipment in oil extraction, oil purification filling, milling, squeezing and other equipment which undertake processes of peeling, crushing, oil extraction, milling, forming, drying, shaping, sterilization, packaging and other processes in the production of various soybean products while retaining most of the raw nutrients. |
| | | |
| | · | Production lines for our fruit vinegar and fruit juice include water treatment equipment, sugar devices, dispensing equipment, homogenization equipment, sterilization equipment and aseptic filling equipment. We use Ro water treatment equipment and remote infrared automatic filling equipment. Sterilization technology adopts aseptic filling and high temperature sterilization processes to ensure high quality of products and advanced, reliable, automatic and stable quality for the entire production line. |
Our modern equipment and technology, combined with advanced processing techniques, helps to ensure that grain production is high-quality, natural, green and ecological. Additionally, a portion of our grains can be categorized as organic by the Beijing Zhonglu Huaxia Organic Food Certification Centre. We believe the careful management of breeding, cultivation, production, packaging and storage also leads to high quality products.
We implement strict quality control with each process in purchasing, storage, processing, packaging and distribution. We keep all items that are examined in the course of quality control inspections for one year in accordance with National Technology Quality Supervision Bureau requirements. We cooperate fully with the Bureau during their random testing and examination of our products.
Research and Development
We hire a number of agricultural experts as consultants in sectors including food processing, breeding, cultivation, nutrition and disease prevention. Together with the Shanxi Agricultural Sciences Institute, Shanxi Agricultural University and their Institute of Seeds and Planting, we have established a joint laboratory for research breeding and cultivation. This laboratory also provides quality testing of our products and provides suggestions for the improvement of our products.
Our R&D team and laboratory uses a hybridization technique for breeding rather than a genetically modified approach. They have special characteristics such as strong drought resistance and resistance to pests. None of the seeds are cultivated using pesticides or chemical fertilizers. This not only reduces costs, but also increases the output and, most importantly, allows us to ensure that a portion of our crops are recognized as “organic”.
Research and development expenses were $98,393 and $73,860 for the years ended December 31, 2011 and 2010, respectively.
Target Market
We focus on promoting the concept of “healthy and green”. Target customers of our Grain Division include urban city residents who pursue healthy diets. Management believes health-oriented food products are also important to families in tier 1 and tier 2 cities in China. Beijing, Shanghai and Guangzhou are considered tier 1 cities in China because they were the first to be opened up to competitive economic development and are the most populous, affluent and competitive. Tier 2 cities, such as Tianjin, Suzhou, Dalian, Qingdao and Hangzhou, have a smaller population and are not as developed as tier 1 cities.
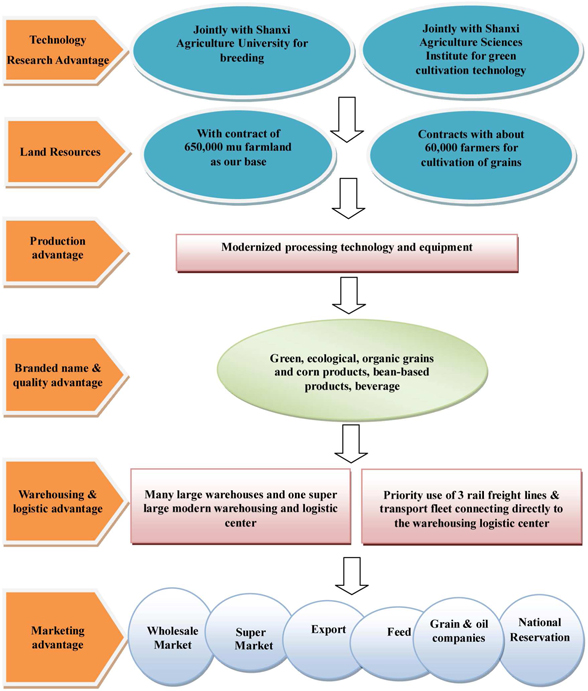
Operating Model
We have adopted the operating model of “Company + Farmers + Base” supplemented by advanced production, strong warehousing capacity and exclusive logistics. We have access to over 109,000 acres (650,000 mu) of farmland in the center of Shanxi Province as our plantation base and we have established partnerships with over 60,000 farmers for the cultivation of high quality grains and corn. Based on our supply base, we have developed the “Deyu” operating chain of breading, cultivating, processing, warehousing and distributing our products. Our operating model is illustrated by the chart below:
Our Growth Strategy
Our principal growth strategy is to expand our market share in the corn and grains businesses by pursuing the following key strategies:
Increase our market share by expanding our sales network and sales promotion.We plan to continue to build up our sales and marketing forces to develop more sales outlets in supermarkets and convenience stores. We also plan to hold more promotional activities to increase sales in each of our stores and to increase our brand awareness.
Continue to develop bulk trading business based on our existing resources. We have accumulated ample resources and advantages such as extensive network of supply and sales, strong warehousing capacity and exclusive logistics. In 2011, our newly-added bulk trading business grew rapidly. We plan to continue to develop our bulk trading business by fully utilizing and diversifying our grain varieties, especially certain rare grain varieties in China such as kidney beans, green beans and sunflower seeds by anticipating the demand trend in the market.
Extend our operating model to other producing areas.During the past several years, we have operated our business through a model of “Company + Farmers + Base” supplemented by advanced production, strong warehousing capacity and exclusive logistics. Given the strong momentum of expanding our economies of scale and increasing demand, we need to expand our supply base of raw materials. We have begun to consider extending our operating model to other producing areas of corn and grain. We have already established subsidiaries in Hebei and Tianjin, and we plan to form a new subsidiary in Northern China to expand our business.
Enrich our product lines through new product innovation or business acquisition.We plan to continue to update existing product lines according to consumer diet trends. We are also considering introducing new products through establishing partnerships with other grain producers or through business acquisitions.
Expand overseas sales network and export product portfolio.We plan to expand our overseas sales network primarily established by Huichun as well as to diversify our export products portfolio. We plan to focus on bean-based products, refined packaged grains and large packaged grains.
Government Regulation
Corn Purchase and Sale Business
We are engaged in the purchase and sale of raw corn products. The supervising authority for the purchase and sale of raw corn products is the State Administration of Grain in China. Pursuant to Regulation 6 of the Food Distribution Management Regulations announced by the State Council of PRC, the State Council Development and Reform Department and the National Food Administration Departments (the commissions of the National Food Authority) are responsible for the mid and long-term planning of China’s overall balance of foods, regulation, restructuring of important food species and food distribution. The National Food Administration Department is responsible for food distribution, guidance to the industry, oversight of the food distribution laws, regulations, policies and implementation of rules and regulations. Pursuant to Regulation 9, food operators must obtain permits and register pursuant to relevant registration regulations. We have obtained the necessary Food Products Purchase Permit and operate in compliance with the relevant standards of food quality, storage, logistics and facilities.
Grain Production and Sales Business
Our production, purchases and sales of grain food products are subject to the following rules and regulations in China:
| · | “The Food Safety Law of the People’s Republic of China” (the “Food Safety Law”) |
| · | “Regulations on the Implementation of the Food Safety Law of the People’s Republic of China” (the “Regulations”) |
| · | “Law of the People’s Republic of China on Quality and Safety of Agricultural Products” and the Food Distribution Management Ordinance. |
We are engaged in exporting grain food products in oversea markets and therefore our production, purchase and sales of grain food products are also subject to the following rules or regulations as they pertain to the food products exporting business:
| · | “Administrative Provisions on the Filing of Export Food Manufacturers)” |
| · | “Hygiene Requirements for Export Food Manufacturers” |
| · | “List of Products Requiring HACCP Audit for Filing of Export Food Manufacturers” |
| · | “List of Products Requiring HACCP Audit for Filing of Export Food Manufacturers” |
We are engaged in the sale of packaged grain products. The supervising authority for such products is the Beijing Bureau of the Industry and Commerce. Pursuant to Regulation 29 of the Food Safety Laws, entities engaging in food production, food distribution and food service, must obtain a Food Production Permit, Food Distribution Permit and Food Service Permit. Those entities that have obtained the Food Production Permit are authorized to operate a food production business and are not required to apply for a Food Distribution Permit. However, we have also obtained the Food Distribution Permit from the Beijing Bureau of Industry and Commerce.
We are also engaged in the production and sale of grain foods. The supervising authority for such production is the Technology Quality Supervision Bureau of Shanxi Province. Pursuant to Food Safety Laws and ancillary regulations, China’s Head Office of the Technology Quality Supervision Bureau supervises technology quality of enterprises which are engaged in food production. The Bureau issues Food Production Permits, undertakes mandatory examinations of technology quality for entry into the industry and is responsible for investigation of incidents regarding food safety. Pursuant to Regulation 29 of the Food Safety Laws, entities engaging in food production, food distribution and food service, must obtain the Food Production Permit, Food Distribution Permit and Food Service Permit. Those who have obtained the Food Production Permit are authorized to operate food production businesses and are not required to apply for a Food Distribution Permit. Deyu has also obtained the nation’s Industrial Production Permit from the Technology Quality Supervision Bureau (Cereals: QS140701040051 and Flour: QS140701016210). Our food labeling complies with the Interim Measures for Labeling of Food Products of Enterprises in Shanxi Province and GB7718-1994 Standards for Food Products Labeling and has obtained the relevant registration certificate (Record number SB/1407000-009-01).
Intellectual Property
With the exception of our registered trademarks “Deyu”, “Shitie”, “Huichun”, “LongQhan Villa” and “Fushite”, we do not own any patents, trademarks, licenses or franchises on our products or processes. We produce processed foods and therefore patents, trademarks and licenses are not necessary for our business operations. We also own the rights to the domain namewww.deyuagri.com, which is currently in good standing.
Employees
We currently have approximately 690 full time employees and various numbers of part-time employees working on a seasonal basis.
ITEM 1A. Risk Factors
We are a “smaller reporting company” and as such, are not required to provide this information.
ITEM 1B. Unresolved Staff Comments
None.
ITEM 2. Properties
Our production facilities are located in Jinzhong and Quwo of Shanxi Province with total site coverage of approximately 1,780,000 square feet (approximately 165,000 square meters) and constructed area of 482,000 square feet (approximately 45,000 square meters). We owned a modern processing center with five drying cylinders for corn and the six warehouses for storage of 70,000 tons and have a large rental warehouse named the Shanxi 661 Warehouse with a storage capacity of 30,000 tons, of which the total capacity of annual turnover may reach more than 700,000 tons. We have eight production lines for grain processing with total production capacity of over 105,000 tons. Our facilities are equipped with advanced crop production, processing and packaging lines as well as modern equipment.
According to government regulations of the PRC, the PRC Government owns all land. We own the following land use rights for farmland and/or industrial lands: (1) land use rights of farmland in Jinzhong Shanxi consisting of 17,000 acres (approximately 70,000,000 square meters) for the remaining average of 38 years; (2) land use right of the industrial land in Quwo, Shanxi consisting of 1,076,000 square feet (approximately 100,000 square meters) for the remaining 45 years, which belongs to the Taizihu Group acquired by the Company on February 2, 2012; (3) land use right of the industrial land in Yuci District of Jinzhong, Shanxi consisting of 504,000 square feet (approximately 47,000 square meters) for the remaining 49 years; (4) land use right of the industrial land in Shanzhuangtou, Jinzhong Deyu of 125,000 square feet (approximately 12,000 square meters), for which the term was terminated on March 14, 2011; however according to the Certification issued by the Jinzhong Municipal Bureau of Land and Resources on March 30, 2011, the Company holds the legal title of the land use rights during the period of the renewal process; (5) land use right of the industrial land in Shanzhuangtou, Jinzhong Deyu of 73,000 square feet (approximately 6,800 square meters) for estimated 50 years, which we obtained on March 19, 2012.
ITEM 3. Legal Proceedings
From time to time, we may be involved in litigation relating to claims arising out of our operations in the normal course of business. As of March 27, 2012, we are not currently a party to in any legal proceeding that we believe would have a material adverse effect on our business, financial condition or operating results.
ITEM 4. Mine Safety Disclosures.
Not applicable.
PART II
| ITEM 5. | Market for Registrant’s Common Equity, Related Stockholder Matters and Issuer Purchases of Equity Securities |
Market Information
Our common stock is quoted on the OTCQB under the symbol “DEYU”. There can be no assurance that a liquid market for our securities will ever develop. Transfer of our common stock may also be restricted under the securities or blue sky laws of various states and foreign jurisdictions. Consequently, investors may not be able to liquidate their investments and should be prepared to hold the common stock for an indefinite period of time.
The following table summarizes the high and low closing sales prices per share of the common stock for the periods indicated as reported on the OTCQB:
Closing Bid Prices
| | | High ($) | | | Low ($) | |
| | | | | | | |
| Fiscal Year Ended December 31, 2011 | | | | | | | | |
| | | | | | | | | |
| 1st Quarter (January 3 – March 31): | | | 4.08 | | | | 2.75 | |
| | | | | | | | | |
| 2rd Quarter (April 1 – June 30): | | | 3.01 | | | | 1.50 | |
| | | | | | | | | |
| 3nd Quarter (July 1 – September 30): | | | 2.20 | | | | 1.01 | |
| | | | | | | | | |
| 4th Quarter (October 3 – December 30): | | | 2.10 | | | | 1.01 | |
| | | | | | | | | |
| Fiscal Year Ended December 31, 2010 | | | | | | |
| | | | | | | |
| 1st Quarter (January 4 – March 31): | | | NONE | | | | NONE | |
| | | | | | | | | |
| 2rd Quarter (April 1 – June 30): | | | 7.10 | | | | 5.00 | |
| | | | | | | | | |
| 3nd Quarter (July 1 – September 30): | | | 7.75 | | | | 6.00 | |
| | | | | | | | | |
| 4th Quarter (October 1 – December 31): | | | 7.00 | | | | 3.00 | |
The following table presents certain information with respect to our equity compensation plan as of December 31, 2011:
| | | | | | | | | Number of |
| | | | | | | | | securities remaining |
| | | Number of securities | | | | | | available for future |
| | | to be issued | | | Weighted-average | | | issuance under equity |
| | | upon exercise of | | | exercise price of | | | compensation plans |
| | | outstanding options, | | | outstanding options, | | | (excluding securities |
| | | warrants and rights | | | warrants and rights | | | reflected in column (a)) |
| Plan Category | | (a) | | | (b) | | | (c) |
| Equity compensation plans | | | | | | | | | | |
| approved by security holders | | | — | | | $ | — | | | — |
| | | | | | | | | | | |
| Equity compensation plans | | | | | | | | | | |
| not approved by security holders(1) | | | 971,000 | | | | 4.40 | | | 29,000 |
| | | | | | | | | | | |
| Total | | | 971,000 | | | $ | 4.40 | | | 29,000 |
(1) On November 4, 2010, the Company’s Board of Directors approved the Company’s 2010 Share Incentive Plan. Under the Plan, 1,000,000 shares of the Company’s common stock were originally allocated to and authorized for use pursuant to the terms of the Plan. On November 8, 2010, a total of 931,000 non-qualified incentive stock options were approved by our Board of Directors and granted under the Plan to executives, key employees, independent directors, and consultants at an exercise price of $4.40 per share and on December 15, 2010, 40,000 non-qualified incentive stock shares were approved by our Board of Directors and granted under the Plan to a consultant at an exercise price of $4.40 per share, of which shall vest as follows:
33 1/3% of the option grants vested one (1) month after the date of grant;
33 1/3% of the option grants vested twelve (12) months after the date of grant; and
33 1/3% of the option grants will vest twenty-four (24) months after the date of grant.
On March 8, 2012, the Company’s Board of Directors allocated to and authorized for use the maximum number of shares allowable pursuant to the terms of the Plan and granted 420,000 options under the Plan, of which 264,000 were new options and 156,000 were re-granted after such options were forfeited by employees as a result of their resignations from the Company in accordance with the terms of their option agreements. All of the newly granted options vest as follows:
50% of the options granted will vest six (6) months after the date of the grant; and
50% of the options granted will vest twelve (12) months after the date of the grant.
On November 5, 2011, we filed a Registration Statement with the SEC on Form S-8 covering up to 1,000,000 shares underlying options which may be granted under the Plan. As of March 28, 2012, none of the options granted pursuant to the Plan have been exercised.
Performance Graph
We are a “smaller reporting company” and as such, are not required to provide this information.
Recent Sales of Unregistered Securities; Use of Proceeds from Registered Securities
In connection with the Share Exchange, on April 27, 2010, we issued an aggregate of 8,736,932 shares of our common stock to the shareholders of City Zone. We received in exchange from the City Zone shareholders 100% of the shares of City Zone, which exchange resulted in City Zone becoming our wholly owned subsidiary. The issuance of such securities was exempt from registration pursuant to Section 4(2) of, and Regulation D and/or Regulation S promulgated under the Securities Act of 1933, as amended.
Simultaneous with the closing the Share Exchange, we entered into the Purchase Agreement with certain accredited Investors for the issuance and sale in a private placement of Units, consisting of, 2,455,863 shares of our Series A convertible preferred stock, par value $0.001 per share and Series A warrants to purchase up to 982,362 shares of our Common Stock, for aggregate gross proceeds of approximately $10,805,750. The issuances of the aforementioned securities were exempt from registration pursuant to Section 4(2) of, and Regulation D and/or Regulation S promulgated under the Securities Act of 1933, as amended.
On November 4, 2010, the Company’s Board of Directors approved the Company’s 2010 Share Incentive Plan. Under the Plan, 1,000,000 shares of the Company’s common stock shall be allocated to and authorized for use pursuant to the terms of the Plan. On November 8, 2010, a total of 931,000 non-qualified incentive stock options were approved by our Board of Directors and granted under the Plan to executives, key employees, independent directors, and consultants at an exercise price of $4.40 per share and on December 15, 2010, 40,000 non-qualified incentive stock shares were approved by our Board of Directors and granted under the Plan to a consultant at an exercise price of $4.40 per share, of which shall vest as follows:
33 1/3% of the option grants vested one (1) month after the date of grant;
33 1/3% of the option grants vested twelve (12) months after the date of grant; and
33 1/3% of the option grants will vest twenty-four (24) months after the date of grant.
On March 8, 2012, the Company’s Board of Directors allocated to and authorized for use the maximum number of shares allowable pursuant to the terms of the Plan and granted 420,000 options under the Plan, of which 264,000 were new options and 156,000 were re-granted after such options were forfeited by employees as a result of their resignations from the Company in accordance with the terms of their option agreements. All of the newly granted options vest as follows:
50% of the options granted will vest six (6) months after the date of the grant; and
50% of the options granted will vest twelve (12) months after the date of the grant.
On November 5, 2011, we filed a Registration Statement with the SEC on Form S-8 covering up to 1,000,000 shares underlying options which may be granted under the Plan. As of March 28, 2012, none of the options granted pursuant to the Plan have been exercised.
Holders of Common Equity
On March 27, 2012, we had 10,564,774 shares of common stock issued and outstanding to 84 holders of record, and the closing price of our common stock as quoted on the OTCQB was $1.60 per share. The number of record holders does not include beneficial owners of common stock whose shares are held in the names of banks, brokers, nominees or other fiduciaries.
Dividends
We have not paid cash dividends on any class of common equity since formation.
In connection with our private placement in May 2010, we issued an aggregate 2,455,863 shares of our Series A convertible preferred shares and warrants exercisable into 982,362 shares of common stock to Investors. Pursuant to the terms of our Series A convertible preferred share designations, the holders of our Series A convertible preferred shares are entitled to receive cumulative dividends at a rate of 5% per annum, and such shares of Series A convertible preferred stock are convertible into shares of our common stock on a 1:1 basis, subject to applicable adjustments.
On July 29, 2011, we distributed 66,379 shares of Series A convertible preferred shares as a cumulative Series A convertible preferred share dividend of $212,420 in aggregate, to such holders of Series A convertible preferred stock on a pro rata basis and on January 27, 2012, we issued a Series A convertible preferred share dividend equal to $219,721, in the aggregate, to such holders of Series A convertible preferred stock on a pro rata basis.
ITEM 6. Selected Financial Data
We are a “smaller reporting company” and as such, are not required to provide this information.
ITEM 7. Management’s Discussion and Analysis of Financial Condition and Results of Operations
Forward Looking Statements
The following is management’s discussion and analysis of certain significant factors which have affected our financial position and operating results during the periods included in the accompanying consolidated financial statements, as well as information relating to the plans of our current management. This Annual Report includes forward-looking statements. Generally, the words “believes ”, “anticipates”, “ may ”, “ will ”, “ should ”, “ expect ”, “ intend ”, “estimate”, “continue” and similar expressions or the negative thereof or comparable terminology are intended to identify forward-looking statements. Such statements are subject to certain risks and uncertainties, including the matters set forth in this Annual Report or other reports or documents we file with the SEC from time to time, which could cause actual results or outcomes to differ materially from those projected. Undue reliance should not be place on these forward-looking statements which speak only as of the date hereof. We undertake no obligation to update these forward-looking statements.
The following discussion and analysis should be read in conjunction with our consolidated financial statements and the related notes thereto and other financial information contained elsewhere in this Annual Report.
Summary of our Business
We are a vertically integrated producer, processor, marketer and distributor of organic and other agricultural products made from corn and grains operating in Shanxi Province in the PRC. The Company has access to over 109,000 acres of farmland in Shanxi Province for breeding, cultivating, processing, warehousing and distributing grain and corn products. We have an extensive wholesale network in over 15 provinces and retail distribution network of around 20,000 supermarkets and convenience stores in 29 provinces across China. We are equipped with advanced production lines and modern warehouses with production capacity of over 105,000 tons for grain products, capacity of storage of over 100,000 tons and annual turnover of 700,000 tons for corn products.
We have experienced high growth in both revenue and net income. Operating revenue from continuing operations for the year ended December 31, 2011 was $261,576,666, representing a 207% increase from $85,174,884 for the year ended December 31, 2010. Our net income attributable to common stockholders for the year ended December 31, 2011 was $17,335,442, representing a 50.7% increase from $11,502,253 for the year ended December 31, 2010.
Restructuring of Business Divisions
In the fourth quarter of 2011, we adjusted the structure of our business divisions in order to better allocate resources and to assess the performance of the group according to our growth strategy. Our Deep Processed Division was dissolved because of the termination of our control agreements with the VIE Group on December 20, 2011, which conducted most of the business of our Deep Processed Division. We changed the name of our Simple Processed Grain Division to the Grain Division, which conducts processed grain products being sold through our retail sales network. With the rapid growth of our bulk trading business, we set up a new division called the Bulk Trading Division, the activities of which were previously conducted in the Grain Division. We now have three business divisions: the Corn Division, the Grain Division and the Bulk Trading Division. According to FASB Accounting Standard Codification Topic 280, we prepared the financial information for these segments for the year ended December 31, 2011 and restated the comparable information for the year ended December 31, 2010.
Because our control over the VIE Group terminated on December 20, 2011, the operations results of the VIE Group have been presented as discontinued operations. Therefore, management’s discussion and analysis set forth herein below are based on the results of continuing operations.
On February 2, 2012, we acquired the Taizihu Group, which is in business of producing and selling bean-based products, fruit vinegars and juices and other grain products. The business of Taizihu Group is conducted as part of the business of the Grain Division. However, management’s discussion and analysis of results of operations for the years ended December 31, 2011 and 2010 set forth herein below do not include the operations results of Taizihu Group, for the Taizihu Group’s financial statements are not required to be consolidated prior to February 2, 2012, the acquisition date according to US GAAP.
Results of Operations for the Year Ended December 31, 2011 as Compared to the Year Ended December 31, 2010
| | | For The Years Ened | | | | | | | |
| | | December 31, | | | | | | | |
| | | 2011 | | | 2010 | | | Change | | | % | |
| | | | | | | | | | | | | |
| Net revenue | | $ | 261,576,666 | | | $ | 85,174,884 | | | $ | 176,401,782 | | | | 207.1 | % |
| Cost of goods sold | | | (218,480,009 | ) | | | (63,250,363 | ) | | | (155,229,646 | ) | | | 245.4 | % |
| Gross Profit | | | 43,096,657 | | | | 21,924,521 | | | | 21,172,136 | | | | 96.6 | % |
| | | | | | | | | | | | | | | | | |
| Selling expenses | | | (13,231,094 | ) | | | (6,281,768 | ) | | | (6,949,326 | ) | | | 110.6 | % |
| General and administrative expenses | | | (8,222,182 | ) | | | (3,627,860 | ) | | | (4,594,322 | ) | | | 126.6 | % |
| Total Operating Expense | | | (21,453,276 | ) | | | (9,909,628 | ) | | | (11,543,648 | ) | | | 116.5 | % |
| Operating income | | | 21,643,381 | | | | 12,014,893 | | | | 9,628,488 | | | | 80.1 | % |
| | | | | | | | | | | | | | | | | |
| Interest income | | | 42,159 | | | | 17,505 | | | | 24,654 | | | | 140.8 | % |
| Interest expense | | | (805,601 | ) | | | (341,555 | ) | | | (464,046 | ) | | | 135.9 | % |
| Non-operating income | | | (180,294 | ) | | | (18,174 | ) | | | (162,120 | ) | | | 892.0 | % |
| Total Other Expense | | | (943,736 | ) | | | (342,224 | ) | | | (601,512 | ) | | | 175.8 | % |
| | | | | | | | | | | | | | | | | |
| Income from continuing operations before income taxes | | | 20,699,645 | | | | 11,672,669 | | | | 9,026,976 | | | | 77.3 | % |
| Income taxes | | | (184,384 | ) | | | 913,785 | | | | (1,098,169 | ) | | | (120.2 | )% |
| Income from continuing operations | | | 20,515,261 | | | | 12,586,454 | | | | 7,928,807 | | | | 63.0 | % |
| Loss from discontinued operations, net of income taxes | | | (3,891,830 | ) | | | (756,480 | ) | | | (3,135,350 | ) | | | 414.5 | % |
| | | | | | | | | | | | | | | | | |
| Net income | | | 16,623,431 | | | | 11,829,974 | | | | 4,793,457 | | | | 40.5 | % |
| Net loss attributable to noncontrolling interests | | | 1,139,928 | | | | - | | | | 1,139,928 | | | | | |
| Net income attributable to Deyu Agriculture Corp. | | | 17,763,359 | | | | 11,829,974 | | | | 5,933,385 | | | | 50.2 | % |
| Preferred stock dividends | | | (427,917 | ) | | | (327,721 | ) | | | (100,196 | ) | | | 30.6 | % |
| Net income available to common stockholders | | $ | 17,335,442 | | | $ | 11,502,253 | | | $ | 5,833,189 | | | | 50.7 | % |
Net Revenue
Our net revenue for the year ended December 31, 2011 was $261.6 million compared with $85.2 million for the year ended December 31, 2010, an increase of $176.4 million, or 207%, of which $108.2 million was attributable to corn sales, $29 million to grain sales and the remaining $39.2 million to bulk trading sales. Sales derived from our Corn Division, Grain Division and Bulk Trading Division for the year ended December 31, 2011 were $177.7 million, $40.5 million and $43.3 million respectively, accounting for 67.9%, 15.5% and 16.6% of total net revenue, respectively.
The following table breaks down the distribution of our sales volume and amount by division and as a percentage of gross sales:
| | | For The Years Ended December 31, | | | | | | | |
| | | 2011 | | 2010 | | | | | | | |
| | | Volume
(ton) | | | Net Revenue | | | % of
total
sales | | | Volume
(ton) | | | Net Revenue | | | % of
total
sales | | | Changes | | | % | |
| Corn Division | | | 531,165 | | | $ | 177,723,149 | | | | 67.9 | % | | | 240,375 | | | $ | 69,516,954 | | | | 81.6 | % | | $ | 108,206,195 | | | | 155.7 | % |
| Grain Division | | | 31,878 | | | | 40,507,527 | | | | 15.5 | % | | | 8,565 | | | | 11,474,912 | | | | 13.5 | % | | | 29,032,615 | | | | 253.0 | % |
| Bulk Trading Division | | | 76,125 | | | | 43,345,990 | | | | 16.6 | % | | | 1,470 | | | | 4,183,018 | | | | 4.9 | % | | | 39,162,971 | | | | 936.2 | % |
| Total | | | 639,168 | | | $ | 261,576,666 | | | | 100.0 | % | | | 250,410 | | | $ | 85,174,884 | | | | 100.0 | % | | $ | 176,401,782 | | | | 207.1 | % |
Net revenue from our Corn Division for the year ended December 31, 2011 was approximately $177.7 million, an increase of $108.2 million, or approximately 155.7%, as compared the year ended December 31, 2010. This growth was attributable to the expansion of our sales network, the increase in our storage capacity and turnover and the obtainment of sufficient working capital. Further, our corn sales network has been extended to approximately 15 provinces in 2011 from 7 provinces in 2010, which now include sales to more livestock feed companies, corn oil/corn starch manufacturing companies and governmental procurement agencies. Our capacity of storage and turnover increased from 50,000 tons and 250,000 tons to over 100,000 tons and 700,000 tons, respectively, when the new processing center with five drying cylinders and six warehouses went into operation in June 2011. We obtained sufficient working capital from bank loans and bank notes to support corn purchases from farmers and suppliers. The average balance of our bank loans and bank notes increased to $9.3 million for the year ended December 31, 2011 from $2.2 million for the year ended December 31, 2010. Our sales volume and revenue from the Corn Division for the year ended December 31, 2011 reached 531,165 tons and $177.7 million, respectively.
Net revenue from our Grain Division for the year ended December 31, 2011 was $40.5 million, an increase of $29 million, or 253%, as compared to the year ended December 31, 2010. The increase was primarily due to growth of our market share through the expansion of our sales network and promotional activities. Our retail distribution network covered approximately 20,000 supermarkets and convenience stores as of December 31, 2011, as compared to approximately 10,000 stores as of December 31, 2010. We developed special counters in over 200 supermarkets with open and loose grains in baskets where customers can scoop the grains into plastic bags to determine the volume they want. This sales strategy targets a large number of consumers and significantly contributes to our net revenue increase. Our marketing initiatives such as promotion and hosting new product press conferences also increased our brand awareness among customers as well as sales revenue. The sales volume and revenue from our Grain Division for the year ended December 31, 2011 reached 31,878 tons and $40.5 million, respectively.
Revenue from our Bulk Trading Division for the year ended December 31, 2011 was $43 million, an increase of $39 million, or 936.2%, as compared to the year ended December 31, 2010. Our bulk trading of grain was a newly-added business commencing from the fourth quarter of 2010, which we found can fully utilize our existing resources including our supply and sales networks, warehousing and logistics. Based on our extensive wholesale network in 15 provinces and sufficient working capital from bank loans and bank notes, the sales volume and revenue from our Bulk Trading Division grew rapidly, reaching 76,124 tons and $43 million, respectively.
Cost of Goods Sold
Cost of goods sold mainly consisted of cost of raw materials, labor, utilities, manufacturing costs, manufacturing related depreciation and packaging costs. Our cost of goods sold increased by 245.4% from $63.3 million in the year ended December 31, 2010 to $218.5 million for the year ended December 31, 2011, due to increases in sales volume and purchase prices. Our total sales volume for the year ended December 31, 2011 increased to 639, 168 tons, or 155.2%, from 250,410 tons for the year ended December 31, 2010.
As a percentage of net revenue, cost of goods sold increased by 920 basis points from 74.3% for the year ended December 31, 2010 to 83.5% for the year ended December 31, 2011. We experienced a purchase cost increase on both corn and grains caused by the inflation in prices of raw materials in China. Our sales expansion strategies that we implemented by lowering the average selling price compared with the market price reduced our profit margin. The increasing percentage by 1170 basis points of bulk trading of total sales with a margin of 8.3% for the year ended December 31, 2011 also negatively affected our overall profit margin.
Gross Profit
The following table breaks down the gross profit and gross margin by division:
| | | For The Years Ened December 31, | |
| | | 2011 | | | 2010 | |
| | | | Gross
Profit | | | | % of total
Gross Profit | | | | Margin | | | | Gross
Profit | | | | % of total
Gross Profit | | | | Margin | |
| Corn Division | | $ | 29,388,328 | | | | 68.2 | % | | | 16.5 | % | | $ | 15,383,113 | | | | 70.2 | % | | | 22.1 | % |
| Grain Division | | | 10,095,678 | | | | 23.4 | % | | | 24.9 | % | | | 6,478,610 | | | | 29.5 | % | | | 56.5 | % |
| Bulk Trading Division | | | 3,612,651 | | | | 8.4 | % | | | 8.3 | % | | | 62,798 | | | | 0.3 | % | | | 1.5 | % |
| Total | | | 43,096,657 | | | | 100.0 | % | | | 16.5 | % | | $ | 21,924,521 | | | | 100.0 | % | | | 25.7 | % |
Our gross profit increased by $21.2 million, or 96.8%, from $21.9 million for the year ended December 31, 2010 to $43.1 million for the year ended December 31, 2011. The increase was attributable to an increase in sales volume, including an increase of $14 million in the Corn Division, $3.6 million in the Grain Division and $3.6 million in the Bulk Trading Division. Our gross margin decreased from 25.7% in the year ended December 31, 2010 to 16.5% in the year ended December 31, 2011. The decrease in gross margin was the combined result of a drop in gross margin in our Corn Division, a drop in grain sales and a low margin contributed by our bulk trading business, a newly-added business in the fourth quarter of 2010.
Gross profit in Corn Division was $29.4 million, contributing to 68.2% of total gross profit for the year ended December 31, 2011. Gross margin for our Corn Division was 16.5% for the year ended December 31, 2011, down by 560 basis points from 22.1% for the year ended December 31, 2010. The decrease of gross margin was mainly due to the continuous increase in the purchase price of raw corn and supplemental procurement from suppliers. The purchase price of raw corn increased by about 12% during the year ended December 31, 2011, but the selling price did not increase consistently. Due to our rapid growth in corn sales, we supplemented the supply of raw materials from farmers by purchasing from other corn traders, of which the purchasing price was usually higher and it negatively affected the gross margin of the Corn Division.
Gross profit in the Grain Division was $10.1 million, contributing to 23.4% of total gross profit for the year ended December 31, 2011. Gross margin for the Grain Division was 24.9% for the year ended December 31, 2011, compared with 56.5% for the year ended December 31, 2010. The decrease was mainly attributable to our sales expansion strategies that we implemented by lowering the average selling price compared with the market price in 2011 and increasing sales percentages of certain types of grains with lower margins such as millet and flour.
Gross profit in the Bulk Trading Division was $3.6 million, contributing to 8.4% of total gross profit for the year ended December 31, 2011. We began to conduct bulk trading business in the fourth quarter of 2010 and its gross profit for the year ended December 31, 2010 was immaterial. The gross margin for the year ended December 31, 2011 was 8.3%, which was relatively lower compared with grain retail business due to its nature of high turnover rate.
Selling Expenses
Selling expenses increased by $6.9 million, or 109.5%, for the year ended December 31, 2011 as compared to $6.3 million for the year ended December 31, 2010. Such increase was mainly attributable to the increase of freight charges, slotting fees for entering more stores and marketing personnel expenses due to increased sales volume.
General and Administrative Expenses
General and administrative expenses increased by $4.6 million to $8.2 million in the year ended December 31, 2011, or 127.8%, compared to $3.6 million for the year ended December 31, 2010. This increase was attributable to increased employee bonuses for good business performance, increased expenses spent on professional services for us as a U.S. public company and other increased expenses due to our business expansion.
Interest Expense
Interest expense for the year ended December 31, 2011 was $806,000 compared to interest expense of $341,000 for the year ended December 31, 2010, an increase of $464,000, or 136%. This increase was mainly due to the increase in short-term loans for working capital.
Provision for Income Taxes
Under the Enterprise Income Tax (“EIT”) Law of the PRC, the standard EIT rate is 25%. Our PRC subsidiaries are subject to PRC income taxes on an entity basis on income arising in or derived from the tax jurisdiction in which they operate. According to the Tax Pronouncement [2008] No. 149 issued by the State Administration of Tax of the PRC, the preliminary processing industry of agricultural products is entitled to EIT exemption starting January 1, 2008. Three of the Company’s wholly-owned subsidiaries located in Shanxi Province, namely Jinzhong Deyu, Jinzhong Yongcheng and Jinzhong Yuliang, are subject to the EIT exemption. All of our other subsidiaries are subject to the 25% EIT rate.
Despite the fact that we earned net income from continuing operations before income tax of $20.7 million, income tax expenses were $184,000 for the year ended December 31, 2011, because most of the net income before income tax was from Jinzhong Deyu and Jinzhong Yuliang, which are subject to the EIT exemption. We recorded income tax benefit of $914,000 for the year ended December 31, 2010 mainly derived from net operating losses carry-forwards for the next five years.
Loss From Discontinued Operations, Net of Income Taxes
Loss from discontinued operations, net of income taxes was incurred from the VIE Group, which we terminated our control over on December 20, 2011.
Net Income
As a result of the above, we had net income available to common stockholders of $17.3 million for the year ended December 31, 2011 compared to a net income of $11.5 million for the year ended December 31, 2010, an increase of $5.8 million, or 50.7%.
Liquidity and Capital Resources
The following summarizes the key components of our cash flows for the year ended December 31, 2011 and 2010:
| | | For the Years Ended December 31, | |
| | | 2011 | | | 2010 | |
| | | | | | | |
| Net cash (used in) provided by operating activities of continuing operations | | $ | (7,774,378 | ) | | $ | 3,933,743 | |
| Net cash used in investing activities of continuing operations | | | (4,032,327 | ) | | | (12,843,958 | ) |
| Net cash provided by financing activities of continuing operations | | | 14,542,773 | | | | 11,866,345 | |
| Net cash (used in) provided by discontinued operations | | | (415,860 | ) | | | 432,520 | |
| Net increase in cash and cash equivalents | | $ | 2,320,208 | | | $ | 3,388,650 | |
For the year ended December 31, 2011, net cash used in operating activities of continuing operations totaled approximately $7.7 million, while net cash provided by operating activities of continuing operations was $3.9 million for the year ended December 31, 2010. This increase of net cash used in operating activities was primarily attributable to an increase of cash used in expanding sales by granting credit to customers and purchasing inventory as a result of the key driver of continuous sales growth of our corn and grain businesses. Our corn and grain business requires immediate cash payments to farmers and their agents before our accounts receivable can be collected from customers. As our business continued to grow, our supply of raw material was supplemented by grain traders or wholesalers, some of which require advanced payments for purchasing, and more cash was used in inventory purchases accordingly. The increase in accounts receivable was $23.8 million for the year ended December 31, 2011 as compared to $6.6 million in the year ended December 31, 2010 as a result of growth of our net revenue and credit offered to new retailers and wholesalers. The continuous increase in inventories and advance to suppliers also contributed to the increase in net cash used in our operating activities of continuing operations, which was $8.7 million and $8.8 million for the years ended December 31, 2011 and 2010 respectively.
For the year ended December 31, 2011, net cash used in investing activities of continuing operations was approximately $4 million, a decrease of approximately $8.8 million, or 68.8%, from approximately $12.8 million for the year ended December 31, 2010. The decrease was the result of the less payments made in 2011 as prepayments were made primarily in 2010 for acquisition of farmland use rights, for majority construction cost of the warehouses, office building and cylinder units in Shanxi Province which commenced in 2010 and was completed in 2011. Cash used in investing activities of continuing operations in the year ended December 31, 2011 was primarily for purchasing machinery and equipment, while cash used in investing activities of continuing operations in year ended December 31, 2010 was primarily for paying for land use rights and construction of warehouses.
Net cash provided by financing activities of continuing operations for the year ended December 31, 2011 was approximately $14.5 million, an increase of approximately $2.6 million, or 21.8%, from approximately $11.9 million for the year ended December 31, 2010. This net cash provided by financing activities of continuing operations for the year ended December 31, 2011 mainly consisted of net proceeds from short term loans from banks, related parties and bank acceptance notes, while the net cash provided by financing activities of continuing operations for the year ended December 31, 2010 was mainly consisted of net proceeds from private placement, short term loans from banks and related parties.
Net cash used by discontinued operations for the year ended December 31, 2011 was $416,000 and net cash provided by discontinued operations for the year ended December 31, 2010 was $433,000.
We believe that our current levels of cash, cash flows from operations, and bank, related party and unrelated party borrowings will be sufficient to meet our anticipated cash needs for at least the next 12 months. However, we may need additional cash resources in the future if we experience changed business conditions or other developments. We may also need additional cash resources in the future if we find and wish to pursue opportunities for investment, acquisition, strategic cooperation or other similar actions. If we ever determine that our cash requirements exceed our amounts of cash and cash equivalents on hand, we may seek to issue debt or equity securities or obtain a credit facility. Any future issuance of equity securities could cause dilution to our shareholders. Any incurrence of indebtedness could increase our debt service obligations and cause us to be subject to restrictive operating and financial covenants. It is possible that, when we need additional cash resources, financing will only be available to us in amounts or on terms that would not be acceptable to us, if at all.
Summary of Certain Liquidity Events
In connection with an exchange agreement, on April 27, 2010, we issued an aggregate of 8,736,932 shares of our common stock to the shareholders of City Zone. We received in exchange from the City Zone shareholders 100% of the shares of City Zone, which exchange resulted in City Zone becoming our wholly owned subsidiary. Immediately after the Exchange, we entered into a Purchase Agreement with certain accredited Investors for the issuance and sale in a private placement of units, consisting of, 2,455,863 shares of our Series A convertible preferred stock and Series A warrants to purchase up to 982,362 shares of our common stock, for aggregate gross proceeds of approximately $10,805,750.
On November 4, 2010, the Company’s Board of Directors approved the Company’s 2010 Share Incentive Plan. Under the Plan, 1,000,000 shares of the Company’s common stock shall be allocated to and authorized for use pursuant to the terms of the Plan. On November 8, 2010, a total of 931,000 non-qualified incentive stock options were approved by our Board of Directors and granted under the Plan to executives, key employees, independent directors, and consultants at an exercise price of $4.40 per share and on December 15, 2010, 40,000 non-qualified incentive stock shares were approved by our Board of Directors and granted under the Plan to a consultant at an exercise price of $4.40 per share, of which shall vest as follows:
33 1/3% of the option grants vested one (1) month after the date of grant;
33 1/3% of the option grants vested twelve (12) months after the date of grant; and
33 1/3% of the option grants will vest twenty-four (24) months after the date of grant.
On March 8, 2012, the Company’s Board of Directors allocated to and authorized for use the maximum number of shares allowable pursuant to the terms of the Plan and granted 420,000 options under the Plan, of which 264,000 were new options and 156,000 were re-granted after such options were forfeited by employees as a result of their resignations from the Company in accordance with the terms of their option agreements. All of the newly granted options vest as follows:
50% of the options granted will vest six (6) months after the date of the grant; and
50% of the options granted will vest twelve (12) months after the date of the grant.
On November 5, 2011, we filed a Registration Statement with the SEC on Form S-8 covering up to 1,000,000 shares underlying options which may be granted under the Plan. As of March 19, 2012, none of the options granted pursuant to the Plan have been exercised.
Contractual Obligations
The following table presents the Company’s material contractual obligations as of December 31, 2011:
| Contractual Obligations | | Total | | | Less than
1 year | | | 1-3 years | | | 3-5 years | | | More than
5 years | |
| | | | | | | | | | | | | | | | |
| Bank Loans | | $ | 14,413,480 | | | $ | 14,413,480 | | | $ | - | | | $ | - | | | $ | - | |
| Notes payable | | | 1,588,840 | | | | 1,588,840 | | | | - | | | | - | | | | - | |
| Operating Lease Obligations | | | 1,389,727 | | | | 134,402 | | | | 175,615 | | | | 170,819 | | | | 908,892 | |
| | | $ | 17,392,047 | | | $ | 16,136,722 | | | $ | 175,615 | | | $ | 170,819 | | | $ | 908,892 | |
Off-Balance Sheet Arrangements
We do not have any off-balance sheet arrangements, financings, or other relationships with unconsolidated entities or other persons, also known as “special purpose entities” (SPEs).
Critical Accounting Policies and Estimates
This discussion and analysis of financial condition and results of operations has been prepared by management based on our consolidated financial statements, which have been prepared in accordance with U.S. GAAP. The preparation of these financial statements requires management to make estimates and judgments that affect the reported amounts of assets, liabilities, revenues, and expenses, and related disclosure of contingent assets and liabilities. On an ongoing basis, management evaluates our critical accounting policies and estimates, including those related to revenue recognition, valuation of accounts receivable, property and equipment, long-lived assets, intangible assets, derivative liabilities and contingencies. Estimates are based on historical experience and on various assumptions believed to be reasonable under the circumstances, the results of which form the basis for making judgments about the carrying values of assets and liabilities that are not readily apparent from other sources. These judgments and estimates affect the reported amounts of assets and liabilities and the reported amounts of revenue and expenses during the reporting periods. We consider the following accounting policies important in understanding our operating results and financial condition:
Use of Estimates
The preparation of the consolidated financial statements in conformity with generally accepted accounting principles requires management to make estimates and assumptions that affect the reported amounts of assets and liabilities and disclosure of contingent assets and liabilities at the date of the financial statements and the reported amounts of revenues and expenses during the reporting period. Management makes its estimates based on historical experience and various other assumptions and information that are available and believed to be reasonable at the time the estimates are made. Therefore, actual results could differ from those estimates under different assumptions and conditions.
Cash and Cash Equivalents
Cash and cash equivalents consist of cash on hand, cash in bank and all highly liquid investments with original maturities of three months or less.
As a result of the financings associated with the Exchange, we had, as of December 31, 2010, $125,560 in a trust account. The use of these funds requires the written approval of our placement agent and us. The funds in the escrow account were designated for certain expenses, such as investor relations, accounting/consulting fees, SEC fees, and stock transfer agent fees. This amount was classified as restricted cash under current assets on our balance sheet as of December 31, 2010, while the restriction was released in 2011.
As of December 31, 2011, $1,588,840 of cash was restricted as a pledge for $1,588,840 (RMB 10,000,000) of notes payable obtained from Jinzhong City Yuci District Rural Credit Union Co., Ltd. in August 2011 and $262,159 of cash was restricted as a pledge for $2,121,101 (RMB13,350,000) for a bank loan obtained from China Merchants Bank (Dongzhimen branch) in November 2011.
Accounts Receivable
Accounts receivable are recorded at net realizable value consisting of the carrying amount less allowance for doubtful accounts, as needed. We assess the collectability of accounts receivable based primarily upon the creditworthiness of the customer as determined by credit checks and analysis, as well as the customer’s payment history. Management reviews the composition of accounts receivable and analyzes historical bad debts, customer concentrations, customer credit worthiness, current economic trends, and changes in customer payment patterns to evaluate the adequacy of these reserves. As of December 31, 2011 and 2010, there were no customers with accounts receivable greater than six months past due.
Inventories
The Company's inventories are stated at lower of cost or market. Cost is determined on moving-average basis. Costs of inventories include purchase and related costs incurred in delivering the products to their present location and condition. Market value is determined by reference to selling prices after the balance sheet date or to management’s estimates based on prevailing market conditions. Management periodically evaluates the composition of its inventories at least quarterly to identify slow-moving and obsolete inventories to determine if valuation allowance is required. As of December 31, 2011 and 2010, management did not identify any slow moving or obsolete inventory. For the years ended December 31, 2011 and 2010, loss on reduction of inventory to the lower of cost or market was $56,140 and $0, respectively.
Assets Held for Sales
A long-lived asset to be sold shall be classified as held for sale in the period in which all of the following criteria are met: (a) Management, having the authority to approve the action, commits to a plan to sell the asset. (b) The asset is available for immediate sale in its present condition subject only to terms that are usual and customary for sales of such assets. (c) An active program to locate a buyer and other actions required to complete the plan to sell the asset have been initiated. (d) The sale of the asset is probable, and transfer of the asset is expected to qualify for recognition as a completed sale, within one year, except as permitted by paragraph ASC 360-10-45-11. The term probable refers to a future sale that is likely to occur. (e) The asset is being actively marketed for sale at a price that is reasonable in relation to its current fair value. The price at which a long-lived asset is being marketed is indicative of whether the entity currently has the intent and ability to sell the asset. A market price that is reasonable in relation to fair value indicates that the asset is available for immediate sale, whereas a market price in excess of fair value indicates that the asset is not available for immediate sale. (f) Actions required to complete the plan indicate that it is unlikely that significant changes to the plan will be made or that the plan will be withdrawn.
A loss shall be recognized for any initial or subsequent write-down to fair value less cost to sell. A gain shall be recognized for any subsequent increase in fair value less cost to sell, but not in excess of the cumulative loss previously recognized (for a write-down to fair value less cost to sell). The loss or gain shall adjust only the carrying amount of a long-lived asset, whether classified as held for sale individually or as part of a disposal group.
Property, Plant, and Equipment
Property, plant, and equipment are stated at cost less accumulated depreciation. Expenditures for maintenance and repairs are charged to earnings as incurred; additions, renewals and betterments are capitalized. When property, plant, and equipment are retired or otherwise disposed of, the related cost and accumulated depreciation are removed from the respective accounts, and any gain or loss is included in operations.
Depreciation is computed using the straight-line method over the estimated useful lives of the assets as follows:
| | Useful Life
(in years) |
| Automobiles | 5 |
| Buildings | 10-30 |
| Office equipment | 5 |
| Machinery and equipment | 5-10 |
| Furniture & fixtures | 5 |
Construction-In-Progress
Construction-in-progress consists of amounts expended for warehouse construction. Construction-in-progress is not depreciated until such time as the assets are completed and put into service. Once warehouse construction is completed, the cost accumulated in construction-in-progress is transferred to property, plant, and equipment.
Long-Lived Assets
The Company applies the provisions of FASB ASC Topic 360 (ASC 360), "Property, Plant, and Equipment" which addresses financial accounting and reporting for the impairment or disposal of long-lived assets. The Company periodically evaluates the carrying value of long-lived assets to be held and used in accordance with ASC 360, at least on an annual basis. ASC 360 requires the impairment losses to be recorded on long-lived assets used in operations when indicators of impairment are present and the undiscounted cash flows estimated to be generated by those assets are less than the assets' carrying amounts. In that event, a loss is recognized based on the amount by which the carrying amount exceeds the fair market value of the long-lived assets. Loss on long-lived assets to be disposed of is determined in a similar manner, except that fair market values are reduced for the cost of disposal.
Goodwill and Intangible Assets
Good is calculated as the purchase premium after adjusting for the fair value of net assets acquired. Goodwill is not amortized but is reviewed for potential impairment on an annual basis, or when events or circumstances indicate a potential impairment, at the reporting unit level. A reporting unit, as defined under applicable accounting guidance, is a business segment or one level below a business segment. Under applicable accounting guidance, the goodwill impairment analysis is a two-step test. The first step of the goodwill impairment test involves comparing the fair value of each reporting unit with its carrying amount including goodwill. If the fair value of the reporting unit exceeds its carrying amount, goodwill of the reporting unit is considered not impaired; however, if the carrying amount of the reporting unit exceeds its fair value, the second step must be performed to measure potential impairment.
The second step involves calculating an implied fair value of goodwill for each reporting unit for which the first step indicated possible impairment. The implied fair value of goodwill is determined in the same manner as the amount of goodwill recognized in a business combination, which is the excess of the fair value of the reporting unit, as determined in the first step, over the aggregate fair values of the assets, liabilities and identifiable intangibles as if the reporting unit was being acquired in a business combination. Measurement of the fair values of the assets and liabilities of a reporting unit is consistent with the requirements of the fair value measurements accounting guidance, which defines fair value as the price that would be received to sell an asset or paid to transfer a liability in an orderly transaction between market participants at the measurement date. The adjustments to measure the assets, liabilities, and intangibles at fair value are for the purpose of measuring the implied fair value of goodwill and such adjustments are not reflected in the consolidation balance sheet. If the implied fair value of goodwill exceeds the goodwill assigned to the reporting unit, there is no impairment. If the goodwill assigned to a reporting unit exceeds the implied fair value of goodwill, an impairment charge is recorded for the excess. An impairment loss recognized cannot exceed the amount of goodwill assigned to a reporting unit. An impairment loss establishes a new basis in the goodwill and subsequent reversals of goodwill impairment losses are not permitted under applicable accounting guidance.
The goodwill in the balance sheet as of December 31, 2010 was generated from the acquisition of Haoliangxin by Deyufarm on July 24, 2010. In 2010, goodwill was tested for impairment and it was determined that goodwill was not impaired as of December 31, 2010. Pursuant to the Termination Agreements for the VIE Group, the Company deconsolidated the VIE Group and no goodwill was presented on the balance sheet as of December 31, 2011, and either as of December 31, 2010 after reclassification of the assets and liabilities of discontinued operations.
For intangible assets subject to amortization, an impairment loss is recognized if the carrying amount of the intangible asset is not recoverable and exceeds fair value. The carrying amount of the intangible asset is considered not recoverable if it exceeds the sum of the undiscounted cash flows expected to result from the use of the asset.
Fair Value Measurements
FASB ASC 820, “Fair Value Measurements” (formerly SFAS No. 157) defines fair value for certain financial and nonfinancial assets and liabilities that are recorded at fair value, establishes a framework for measuring fair value, and expands disclosures about fair value measurements. It requires that an entity measure its financial instruments to base fair value on exit price and maximize the use of observable units and minimize the use of unobservable inputs to determine the exit price. It establishes a hierarchy which prioritizes the inputs to valuation techniques used to measure fair value. This hierarchy increases the consistency and comparability of fair value measurements and related disclosures by maximizing the use of observable inputs and minimizing the use of unobservable inputs by requiring that observable inputs be used when available. Observable inputs are inputs that reflect the assumptions market participants would use in pricing the assets or liabilities based on market data obtained from sources independent of the Company. Unobservable inputs are inputs that reflect the Company’s own assumptions about the assumptions market participants would use in pricing the asset or liability developed based on the best information available in the circumstances. The hierarchy prioritizes the inputs into three broad levels based on the reliability of the inputs as follows:
| · | Level 1 – Inputs are quoted prices in active markets for identical assets or liabilities that the Company has the ability to access at the measurement date. Valuation of these instruments does not require a high degree of judgment as the valuations are based on quoted prices in active markets that are readily and regularly available. |
| · | Level 2 – Inputs other than quoted prices in active markets that are either directly or indirectly observable as of the measurement date, such as quoted prices for similar assets or liabilities; quoted prices in markets that are not active; or other inputs that are observable or can be corroborated by observable market data for substantially the full term of the assets or liabilities. |
| · | Level 3 – Valuations based on inputs that are unobservable and not corroborated by market data. The fair value for such assets and liabilities is generally determined using pricing models, discounted cash flow methodologies, or similar techniques that incorporate the assumptions a market participant would use in pricing the asset or liability. |
This guidance applies to other accounting pronouncements that require or permit fair value measurements. On February 12, 2008, the FASB finalized FASB Staff Position (FSP) No. 157-2, Effective Date of FASB Statement No. 157 (ASC 820). This Staff Position delays the effective date of SFAS No. 157 (ASC 820) for nonfinancial assets and liabilities to fiscal years beginning after November 15, 2008 and interim periods within those fiscal years, except for those items that are recognized or disclosed at fair value in the financial statements on a recurring basis (at least annually). The adoption of SFAS No. 157 (ASC 820) had no effect on the Company's financial position or results of operations.
We also analyze all financial instruments with features of both liabilities and equity under ASC 480-10 (formerly SFAS 150, “Accounting for Certain Financial Instruments with Characteristics of Both Liabilities and Equity”) and ASC 815-40 (formerly EITF 00-19, “Accounting for Derivative Financial Instruments Indexed to, and Potentially Settled in, a Company’s Own Stock”). We have determined ASC 480-10 (formerly SFAS 150) and ASC 815-40 (formerly EITF 00-19) has no material effect on our financial position or results of operations.
Revenue Recognition
The Company’s revenue recognition policies are in compliance with the SEC Staff Accounting Bulletin No. 104 (“SAB 104”). The Company recognizes product revenue when the following fundamental criteria are met: (i) persuasive evidence of an arrangement exists, (ii) delivery has occurred, (iii) our price to the customer is fixed or determinable and (iv) collection of the resulting accounts receivable is reasonably assured. The Company recognizes revenue for product sales upon transfer of title to the customer. Customer purchase orders and/or contracts are generally used to determine the existence of an arrangement. Shipping documents and the completion of any customer acceptance requirements, when applicable, are used to verify product delivery or that services have been rendered. The Company assesses whether a price is fixed or determinable based upon the payment terms associated with the transaction and whether the sales price is subject to refund or adjustment.
The Company’s revenue is recognized net of value-added tax (VAT), reductions to revenue for estimated product returns, and sales discounts based on volume achieved in the same period that the related revenue is recorded. The estimates are based on historical sales returns, analysis of credit memo data, and other factors known at the time. For the years ended December 31, 2011 and 2010, sales discounts from continuing operations were $70,987 and $0, respectively. Commencing from year 2010, the Company had terminated the offering of sales discounts to customers.
We offer a right of exchange on our grain products sold through our relationship with grocery store networks. The consumer who purchases the product may exchange it for the same kind and quantity of product originally purchased. In accordance with FASB ASC 605-15-25-1 and 605-15-15-2, these are not considered returns for revenue recognition purposes. For the years ended December 31, 2011 and 2010, the returns of our product were not material.
Advertising Costs
The Company expenses the cost of advertising as incurred or, as appropriate, the first time the advertising takes place. Advertising costs from continuing operations for the year ended December 31, 2011 and 2010 were $952,472 and $83,576 respectively.
Research and Development
The Company expenses its research and development costs as incurred. Research and development costs from continuing operations for the years ended December 31, 2011 and 2010 were $98,393 and $73,860, respectively.
Stock-Based Compensation
In December 2004, the Financial Accounting Standard Board, or the FASB, issued the Statement of Financial Accounting Standards, or SFAS, No. 123(R), “Share-Based Payment”, which replaces SFAS No. 123 and supersedes APB Opinion No. 25. SFAS No. 123(R) is now included in the FASB’s ASC Topic 718, “Compensation – Stock Compensation.” Under SFAS No. 123(R), companies are required to measure the compensation costs of share-based compensation arrangements based on the grant-date fair value and recognize the costs in the financial statements over the period during which employees or independent contractors are required to provide services. Share-based compensation arrangements include stock options and warrants, restricted share plans, performance-based awards, share appreciation rights and employee share purchase plans. In March 2005, the SEC issued Staff Accounting Bulletin No. 107, or SAB 107, which expresses views of the staff regarding the interaction between SFAS No. 123(R) and certain SEC rules and regulations and provides the staff’s views regarding the valuation of share-based payment arrangements for public companies. SFAS No. 123(R) permits public companies to adopt its requirements using one of two methods. On April 14, 2005, the SEC adopted a new rule amending the compliance dates for SFAS No. 123(R). Companies may elect to apply this statement either prospectively, or on a modified version of retrospective application under which financial statements for prior periods are adjusted on a basis consistent with the pro forma disclosures required for those periods under SFAS No. 123.
The Company has fully adopted the provisions of FASB ASC 718 and related interpretations as provided by SAB 107. As such, compensation cost is measured on the date of grant as the fair value of the share-based payments. Such compensation amounts, if any, are amortized over the respective vesting periods of the option grant.
Income Taxes
The Company accounts for income taxes in accordance with FASB ASC Topic 740, “Income Taxes.” ASC 740 requires a company to use the asset and liability method of accounting for income taxes, whereby deferred tax assets are recognized for deductible temporary differences, and deferred tax liabilities are recognized for taxable temporary differences. Temporary differences are the differences between the reported amounts of assets and liabilities and their tax bases. Deferred tax assets are reduced by a valuation allowance when, in the opinion of management, it is more likely than not that some portion, or all of, the deferred tax assets will not be realized. Deferred tax assets and liabilities are adjusted for the effects of changes in tax laws and rates on the date of enactment.
Under ASC 740, a tax position is recognized as a benefit only if it is “more likely than not” that the tax position would be sustained in a tax examination, with a tax examination being presumed to occur. The amount recognized is the largest amount of tax benefit that is greater than 50% likely of being realized on examination. For tax positions not meeting the “more likely than not” test, no tax benefit is recorded. The adoption had no effect on the Company’s consolidated financial statements.
Foreign Currency Translation and Comprehensive Income
U.S. GAAP requires that recognized revenue, expenses, gains and losses be included in net income. Certain statements, however, require entities to report specific changes in assets and liabilities, such as gain or loss on foreign currency translation, as a separate component of the equity section of the balance sheet. Such items, along with net income, are components of comprehensive income. The functional currency of the Company is Renminbi (“RMB”). The unit of RMB is in Yuan. Translation gains are classified as an item of other comprehensive income in the stockholders’ equity section of the consolidated balance sheet.
Statement of Cash Flows
In accordance with FASB ASC Topic 230, “Statement of Cash Flows,” cash flows from the Company’s operations are calculated based upon the local currencies. As a result, amounts related to assets and liabilities reported on the consolidated statement of cash flows will not necessarily agree with changes in the corresponding balances on the consolidated balance sheets.
Discontinued Operations
Certain prior period amounts have been reclassified in these consolidated financial statements to conform to the 2011 presentation of discontinued operations of the VIE Group for the deep processed grain business.
Reclassifications
Except for the classification for discontinued operations, certain classifications have been made to the prior year financial statements to conform to the current year presentation. The reclassifications have no impact on the Company’s 2010 consolidated statement of operations and retained earnings.
Recent Pronouncements
In January 2010, FASB issued an amendment regarding improving disclosures about fair value measurements. This new guidance requires some new disclosures and clarifies some existing disclosure requirements about fair value measurement. The new disclosures and clarifications of existing disclosures are effective for interim and annual reporting periods beginning after December 15, 2009, except for the disclosures about purchases, sales, issuances and settlements in the roll forward of activity in Level 3 fair value measurements. Those disclosures are effective for fiscal years beginning after December 15, 2010 and for interim periods within those fiscal years. There was no impact from the adoption of this guidance to our consolidated financial position or results of operations as the amendment only addresses disclosures.
In April 2010, FASB issued an amendment to Stock Compensation. The amendment clarifies that an employee stock-based payment award with an exercise price denominated in the currency of a market in which a substantial portion of the entity’s equity shares trades should not be considered to contain a condition that is not a market, performance, or service condition. Therefore, an entity would not classify such an award as a liability if it otherwise qualifies as equity. The amendments are effective for fiscal years, and interim periods within those fiscal years, beginning on or after December 15, 2010. The adoption of this guidance had no impact on our consolidated financial position or results of operations since our stock-based payment awards have an exercise price denominated in the same currency of the market in which our Company shares are traded.
In May 2011, FASB issued an amendment (ASU No. 2011-04) to Fair Value Measurement (ASC Topic 820). In 2006, the FASB and the International Accounting Standards Board (IASB) published a Memorandum of Understanding, which has served as the foundation of the Board’s efforts to a common set of high quality global accounting standards. Consistent with the Memorandum of Understanding and the Board’s commitment to achieving the goal, the amendments in this Update are the result of the work by the FASB and the IASB to develop common requirements for measuring fair value and for disclosing information about fair value measurements in accordance with U.S. GAAP and IFRS. The adoption of this guidance had no impact on our consolidated financial position or results of operations.
In May 2011, FASB issued an amendment (ASU No. 2011-05) to Comprehensive Income (ASC Topic 220). The amendment require that all nonowner changes in stockholders’ equity be presented either in a single continuous statement of comprehensive income or in two separate but consecutive statements. In the two-statement approach, the first statement should present total net income and its components followed consecutively by a second statement that should present total other comprehensive income, the components of other comprehensive income, and the total of comprehensive income. The Company had adopted this guidance to our consolidated financial statements as of and for the year ended December 31, 2011.
In September 2011, FASB issued an amendment (ASU No. 2011-08) to Intangibles–Goodwill and Other (ASC Topic 350). The amendments in the Update permit an entity to first assess qualitative factors to determine whether it is more likely than not that the fair value of a reporting unit is less than its carrying amount as a basis for determining whether it is necessary to perform the two-step goodwill impairment test described in Topic 350. If, after assessing the totality of events or circumstances, an entity determines it is not more likely than not that the fair value of a reporting unit is less than its carrying amount, then performing the two-step impairment test is unnecessary. However, if an entity concludes otherwise, then it is required to perform the first step of the two-step impairment test by calculating the fair value of the reporting unit and comparing the fair value with the carrying amount of the reporting unit, as described in paragraph 350-20-35-4. If the carrying amount of a reporting unit exceeds its fair value, then the entity is required to perform the second step of the goodwill impairment test to measure the amount of the impairment loss, if any, as described in paragraph 350-20-35-9. The Company had adopted this guidance to our consolidated financial statements as of and for the year ended December 31, 2011.
In December 2011, FASB issued an Update (ASU No. 2011-10) to Property, Plant, and Equipment (ASC Topic 360). Under the amendments in this Update, when a parent (reporting entity) ceases to have a controlling financial interest (as described in Subtopic 810-10) in a subsidiary that is in substance real estate as a result of default on the subsidiary’s nonrecourse debt, the reporting entity should apply the guidance in Subtopic 360-20 to determine whether it should derecognize the in substance real estate. Generally, a reporting entity would not satisfy the requirements to derecognize the in substance real estate before the legal transfer of the real estate to the lender and the extinguishment of the related nonrecourse indebtedness. That is, even if the reporting entity ceases to have a controlling financial interest under Subtopic 810-10, the reporting entity would continue to include the real estate, debt, and the results of the subsidiary’s operations in its consolidated financial statements until legal title to the real estate is transferred to legally satisfy the debt. The adoption of this guidance had no impact on our consolidated financial position or results of operations.
In December 2011, FASB issued an Update (ASU No. 2011-11) to Balance Sheet (ASC Topic 210) regarding disclosures about offsetting assets and liabilities. Pursuant to this Update, entities are required to disclose both gross information and net information about both instruments and transactions eligible for offset in the statement of financial position and instruments and transactions subject to an agreement similar to a master netting arrangement. This scope would include derivatives, sale and repurchase agreements and reverse sale and repurchase agreements, and securities borrowing and securities lending arrangements. The adoption of this guidance had no impact on our consolidated financial position or results of operations.
ITEM 7A. Quantitative and Qualitative Disclosures About Market Risk
We are a “smaller reporting company” and as such, are not required to provide this information.
ITEM 8. Financial Statements and Supplementary Data.
Reference is made to the “F” pages herein comprising a portion of this Annual Report.
ITEM 9. Changes in and Disagreements with Accountants on Accounting and Financial Disclosures
None.
Item 9A. Controls and Procedures
Evaluation of Disclosure Controls and Procedures
Under the supervision and with the participation of our management, including our principal executive officer and principal financial officer, we conducted an evaluation of the effectiveness of the design and operation of our disclosure controls and procedures, as defined in Rule 13a-15(e) under the Exchange Act. Based on this evaluation, our management, including our principal executive officer and our principal financial officer, concluded that our disclosure controls and procedures were effective as of the fiscal quarter covered by this Annual Report, to ensure that information required to be disclosed by us in the reports filed or submitted by us under the Exchange Act (i) is recorded, processed, summarized and reported within the time period specified in SEC rules and forms, and (ii) is accumulated and communicated to our management, including our principal executive officer and our principal financial officer, as appropriate to allow appropriate decisions on a timely basis regarding required disclosure.
Management’s Annual Report on Internal Control over Financial Reporting
Management is responsible for establishing and maintaining adequate internal control structure and procedures over financial reporting (as defined in Rules 13a-15(f) and 15d-15(f)) under the Exchange Act. Our management conducted an assessment of the effectiveness of our internal control over financial reporting as of December 31, 2011 based on the framework similarly set forth in Internal Control — Integrated Framework issued by the Committee of Sponsoring Organizations of the Treadway Commission.
Internal control over financial reporting cannot provide absolute assurance of achieving financial reporting objectives because of its inherent limitations. Internal control over financial reporting is a process that involves human diligence and compliance and is subject to lapses in judgment and breakdowns resulting from human failures. Because of such limitations, there is a risk that material misstatements may not be prevented or detected on a timely basis by internal control over financial reporting. Also, projections of any evaluation of effectiveness to future periods are subject to the risk that controls may become inadequate because of changes in conditions, or that the degree of compliance with the policies or procedures may deteriorate.
Based on that evaluation, our principal executive officer and principal financial officer concluded that our internal control over financial reporting as of December 31, 2011 was effective.
This Annual Report does not include an attestation report of the Company’s registered public accounting firm regarding internal control over financial reporting. Management’s report was not subject to attestation by the Company’s registered public accounting firm pursuant to the permanent exemption rules for smaller reporting companies, which require the Company to provide only management’s report in this Annual Report.
Changes in Internal Control over Financial Reporting
There were no changes in our internal control over financial reporting that occurred during our last fiscal quarter that have materially affected, or are reasonably likely to materially affect, our internal control over financial reporting.
PART III
ITEM 10. Directors, Executive Officers and Corporate Governance
Directors and Executive Officers
Provided below is a list of the names, ages and positions of all our directors and executive officers.
| Name | | Age | | Position |
| Jianming Hao | | 37 | | Chairman of the Board of Directors, Chief Executive Officer |
| Wenjun Tian | | 38 | | President, Director |
| Amy He | | 33 | | Acting Chief Financial Officer |
| Jianbin Zhou | | 43 | | Chief Operating Officer |
| Michael Han | | 41 | | Corporate Secretary |
| Al Carmona | | 53 | | Independent Director and member of Audit Committee |
| Longjiang Yuan | | 48 | | Independent Director and member of Audit Committee |
| Timothy Stevens | | 60 | | Independent Director and Chairman of Audit Committee |
Provided below is a list of the names, ages and positions of certain of our significant employees:
| Name | | Age | | Position |
| Junde Zhang | | 40 | | Vice President for the Grain Division |
| Yongqing Ren | | 30 | | Vice President for the Corn Division |
| Yunlin Ding | | 39 | | Vice President |
Family Relationships
There is no family relationship between any of the officers, directors and significant employees of the Company.
Election of Directors and Officers
All directors hold office until the next annual meeting of shareholders and until their successors have been duly elected and qualified. Officers are elected by and serve at the discretion of the Board.
Our directors are reimbursed for expenses incurred by them in connection with attending Board meetings, but they do not receive any other compensation for serving on the Board.
Biographies of Officers and Directors
Mr. Jianming Hao, 37, Chief Executive Officer and Chairman of the Board of Directors
Mr. Hao is our CEO and Chairman. Between December 2001 and May 2004, Mr. Hao served as the Finance Manager of China Merchants Dichain (Asia) Ltd., a Hong Kong listed company. Between May 2004 and November 2007, Mr. Hao served as a director and Vice President of Shenzhen Litong Investments Ltd. Since November 2007, he has been a director of Jinzhong Deyu Agriculture Trading Co. Limited, which is now a subsidiary of Deyu Agriculture Corp. Mr. Hao received a Master’s degree in Finance from Nankai University. He is also a certified public accountant in China.
Mr. Wenjun Tian, 38, Director and President
Mr. Tian is a Director and our President. Between September 2003 and December 2007, Mr. Tian served as the Chairman of Shanxi Dongsheng Auction Co., Ltd. Between January 2008 and November 2009, Mr. Tian served as the Chairman of Dongsheng International Investment Inc. He has been a director of Detian Yu since December 2009. Mr. Tian is the holder of an undergraduate degree and has over 10 years of experience in corporate management. Mr. Tian is particularly experienced in investment in agricultural enterprises.
Ms. Amy He, 33, Acting Chief Financial Officer
Effective February 3, 2012, the Company appointed Ms. Amy He to serve as the Company’s Acting Chief Financial Officer. Ms. He, who is resident in the Company’s headquarters in Beijing, has served as the Company’s Financial Controller since October 2011. Prior to that, Ms. He served as an audit manager for Deloitte Touche Tohmatsu CPA Ltd. in China from July 2005 through September, 2011, where she served multinational corporations and Chinese corporate clients, including private companies and public listed companies in the United States. Ms. He earned a Master’s Degree in Management from the Chinese Academy of Sciences and a Bachelor’s Degree in Accounting from Tsinghua University in China.
Mr. Jianbin Zhou, 43, Chief Operating Officer
Mr. Zhou is our Chief Operating Officer. Between January 2005 and December 2006, Mr. Zhou served as the General Manager of Beijing Kangqiaoshidai Education Development Co., Ltd. Between January 2007 and October 2008, he was the General Manager of Antai Global (Beijing) Risk Management Co., Ltd. Mr. Zhou also served as the Vice President of Dongsheng International (Beijing) Investment Co., Ltd. between October 2008 and August 2009. Mr. Zhou has been a director of Detian Yu since August 2009. Mr. Zhou is the holder of an undergraduate degree.
Mr. Michael Han, 41, Corporate Secretary
Effective January 10, 2011, the Company appointed Mr. Michael Han to serve as the Company’s Corporate Secretary. From April 2009 through January 2011, Mr. Han served as Vice President for Beijing Jinhuanya Management Consulting Co., Ltd., a PRC company. From April 2006 through March 2009, Mr. Han previously served as Vice President and Manager of the Administration Department of General Circuits (Beijing) Ltd., a PRC company, where he was in charge of Administration, Finance, Marketing and International Sales and Business Development. From April 2001 through March 2006, Mr. Han served as Senior Key Account Manager of Shougang NEC Electronics Co., Ltd., a PRC electronics company. Mr. Han earned his Bachelors of Science degree in Metal Forming & Metal Materials from the College of Beijing Iron & Steel Technology and his Master’s in Business Administration degree from Tsinghua University. There is no family relationship between Mr. Han and any of the other officers and directors of the Company.
Mr. Al Carmona, 53, Independent Director and Member of Audit Committee
Mr. Carmona is an independent director of the Company. During the last 25 years, Mr. Carmona has been with Mars & Co, a high end international strategy consulting firm, during which he served as Executive Vice President and Senior Advisor and has coordinated their Global Business Development Council. With the assistance of Mr. Carmona, Mars & Co. grew to over 250 professionals worldwide. Mr. Carmona has deep experience in a wide variety of areas including cost and supply chain optimization, brand strategy, pricing and demand building optimization, competitive analysis, portfolio optimization, business unit turnarounds, as well as acquisition and divestiture analysis. Mr. Carmona has a Bachelor of Science degree in Chemical Engineering from Princeton University and a MBA degree from the Wharton Business School, University of Pennsylvania.
Mr. Longjiangg Yuan, 48, Independent Director and Member of Audit Committee
Mr. Yuan is an independent director of the Company. He is an acknowledged expert in agricultural technology and has been serving as the vice director of the Science and Technology Bureau of the Chinese Academy of Agricultural Sciences, the largest and highest agriculture institute in China (“CAAS”). Prior to joining the Company, Mr. Yuan spent 17 years in the Institute of Crop Science of the CAAS, where he was also the senior director of the R&D team for paddy rice genetic breeding technologies as well as a scientist in the science commission. He is the director of the Crop Science Society of China and an expert for the National Crop Variety Approval Committee. From 2002 to 2004, Mr. Yuan was an independent director of the board of Shanxi Tunyu Seed Industry Co., Ltd. Over the years, Mr. Yuan has participated in and led 13 national R&D programs and has developed 17 new crop breeds. He has published more than 20 academic thesis and 5 books on agricultural sciences. Mr. Yuan was also granted 2 scientific and technological progress awards by the Ministry of Agriculture of China. Mr. Longjiangg Yuan holds a master’s degree in Plant Genetic Breeding from the Graduate School of the Chinese Academy of Agricultural Sciences and a bachelor’s degree in Agriculture from Wan Nan Agriculture University.
Mr. Timothy C. Stevens, 60, Independent Director and Chairman of Audit Committee
Mr. Stevens is an independent director of the Company. Mr. Stevens has over 30 years of executive leadership, management, and client service experience with the world’s leading law, public accounting, and management consulting firms. Since January 2011, Mr. Stevens has served as Chief Operating Officer of an international law firm in Hong Kong. Prior to that since 2004, Mr. Stevens served as the Executive Director of Saul Ewing LLP, a Philadelphia law firm where he oversaw all aspects of its day to day business operations with a focus on improving the bottom line and supporting the Firm’s growth strategy and other key objectives. From 1999 to 2003, he served as the Chief Operating Officer and a member of the Management Committee in the Hong Kong and China offices of the international law firm Baker & McKenzie where he was responsible for all operations (other than client service) for Baker & McKenzie’s large Hong Kong and China practice. From 1995 to 1998, Mr. Stevens served in the Chairman’s office as the Finance and Administrative Partner of PricewaterhouseCoopers China, the world’s largest auditing firm, where he supervised the business plans, office openings and expansions as well as the financial management of the firm. Mr. Stevens graduated from Clifton College and Bristol University in the United Kingdom. He received the ACA qualification from the UK Chartered Accountants’ Qualification Program in 1974. Mr. Stevens is a licensed CPA in Massachusetts as well as being a Hong Kong FCPA.
Mr. Junde Zhang, 40, Vice President for the Grains Division
Mr. Zhang is our Vice President responsible for the operation of the Grains Division. Since April 2004, he has been the Production Director and the General Manager of our Cereal Crops Division. Mr. Zhang is a successful entrepreneur and was appointed as a member of the Yuci People’s Congress. He was awarded the honorable title of Industrial Restructuring Leader by the Yuci Municipal Government. Mr. Zhang is the holder of an undergraduate degree and has over 10 years of experience in grain breeding, cultivation, processing, marketing and management.
Mr. Yongqing Ren, 30, Vice President for the Corn Division
Mr. Ren has been the Vice President and General Manager of our Corn Division since April 2004. He was conferred the honorable title of Industrial Restructuring Leader for two consecutive years and the prize of Top Ten Youth Career Development Contributor by the Yuci Municipal Government. Mr. Ren is the holder of an undergraduate degree. He is well experienced in corn breeding, cultivation, processing, marketing and management.
Mr. Yunlin Ding, 39, Vice President
Effective February, 3, 2012, the Companyappointed Mr. Yunlin Ding to serve as Vice President of Company.Immediately prior to Mr. Ding’s appointment as the Company’s Vice President, he served as Vice President of Detian Yu since July 2009. Mr. Ding also served as vice general manager of the investment department of Beida Qingniao Group, a company organized under the laws of China and the holding company for three companies listed in China and two companies listed in Hong Kong, from February 2002 to July 2009. Mr. Ding earned a Bachelor’s Degree and a Master’s Degree in Economics from Nankai University in 1996 and 1999, respectively.
Director Qualifications and Experience
The Board considers various characteristics, such as experience, qualifications, attributes and skills, in making its decision to appoint and nominate directors to the Board.
Mr. Hao has the experience, qualifications, attributes and skills to qualify him to serve as a director. His experience running the Company and its subsidiaries has contributed to his knowledge of the business and his understanding of the grain and corn products industry. Because of this experience, we expect that he will act in the best interest of the Company.
Mr. Tian has the experience, qualifications, attributes and skills to qualify him to serve as a director. His experience with our subsidiaries and the knowledge he has acquired managing businesses and running our subsidiaries has given him the experience necessary to be ability to sit on our Board of Directors. Because of this experience, we expect that he will act in the best interest of the Company.
Mr. Carmona has the experience, qualifications, attributes and skills to qualify him to serve as a director. His past work experience working with companies to optimize their operations and maximize profits gives us the confidence that he will be an asset to our Board of Directors. Because of this experience, we expect that he will act in the best interest of the Company.
Mr. Yuan has the experience, qualifications, attributes and skills to qualify him to serve as a director. His past work experience and research experience in the genetic breeding field will be an asset to us as we strive to maximize our grain and corn production and manufacturing. Because of this experience, we expect that he will act in the best interest of the Company.
Mr. Stevens has the experience, qualifications, attributes and skills to qualify him to serve as a director. His past work experience overseeing the world’s leading law, public accounting and management consulting firms will be an asset to us and he will be in a strong position to oversee our operations and corporate governance. Mr. Stevens has financial management expertise, he is a certified public accountant (Massachusetts) and he is a chartered accountant (England and Wales). Because of this experience, we expect that he will act in the best interest of the Company.
Legal Proceedings
Unless otherwise indicated, to the knowledge of the Company after reasonable inquiry, no current director or executive officer of the Company during the past ten years, has (i) been convicted in a criminal proceeding (excluding traffic violations or other minor offenses), (ii) been a party to any judicial or administrative proceeding (except for any matters that were dismissed without sanction or settlement) that resulted in a judgment, decree or final order enjoining the person from future violations of, or prohibiting activities subject to, U.S. federal or state securities laws, or a finding of any violation of U.S. federal or state securities laws, (iii) filed a petition under federal bankruptcy laws or any state insolvency laws or has had a receiver appointed for the person’s property or (iv) been subject to any judgment, decree or final order enjoining, suspending or otherwise limiting for more than 60 days, the person from engaging in any type of business practice , acting as a futures commission merchant, introducing broker, commodity trading advisor, commodity pool operator, floor broker, leverage transaction merchant, any other person regulated by the Commodity Futures Trading Commission, or an associated person of any of the foregoing, or as an investment adviser, underwriter, broker or dealer in securities, or as an affiliated person, director or employee of any investment company, bank, savings and loan association or insurance company, or engaging in or continuing any conduct or practice in connection with such activity or engaging in any activity in connection with the purchase or sale of any security or commodity or in connection with any violation of Federal or State securities laws or Federal commodities laws, (v) been found by a court of competent jurisdiction in a civil action or by the Commission to have violated any Federal or State securities law, and the judgment in such civil action or finding by the Commission has not been subsequently reversed, suspended, or vacated, (vi) been found by a court of competent jurisdiction in a civil action or by the Commodity Futures Trading Commission to have violated any Federal commodities law, and the judgment in such civil action or finding by the Commodity Futures Trading Commission has not been subsequently reversed, suspended or vacated, (vii) been the subject of, or a party to, any Federal or State judicial or administrative order, judgment, decree, or finding, not subsequently reversed, suspended or vacated, relating to an alleged violation of: (a) any Federal or State securities or commodities law or regulation, (b) any law or regulation respecting financial institutions or insurance companies including, but not limited to, a temporary or permanent injunction, order of disgorgement or restitution, civil money penalty or temporary or permanent cease-and-desist order, or removal or prohibition order, or (c) any law or regulation prohibiting mail or wire fraud or fraud in connection with any business entity, or (viii) been the subject of, or a party to, any sanction or order, not subsequently reversed, suspended or vacated, of any self-regulatory organization (as defined in Section 3(a)(26) of the Exchange Act (15 U.S.C. 78c(a)(26))), any registered entity (as defined in Section 1(a)(29) of the Commodity Exchange Act (7 U.S.C. 1(a)(29))), or any equivalent exchange, association, entity or organization that has disciplinary authority over its members or persons associated with a member.
There are no material pending legal proceedings to which any of the individuals listed above is party adverse to us or any of our subsidiaries or has a material interest adverse to us or any of our subsidiaries.
CORPORATE GOVERNANCE
Director Independence and Board Committees
Director Independence
Our stock is currently quoted on the OTCQB. The OTCQB does not have rules regarding director independence. Accordingly, although our audit committee charter states that each member shall meet the independence requirements set out by the applicable listing standards of the securities exchange, securities association, SRO, or stock market on which the Company’s securities are quoted or listed for trading, we determined that the NASDAQ Marketplace independence requirements were an appropriate standard to determine independence because these requirements are stricter than the current OTC Bulletin Board’s requirements. Additionally, we adopted these stricter standards to strengthen our corporate governance and improve internal controls.
Subject to certain exceptions, under the listing standards of the NASDAQ Marketplace, a listed company’s board of directors must consist of a majority of independent directors. Currently, our board of directors has determined that each of the non-management directors, Al Carmona, Longjiang Yuan and Timothy Stevens, are “independent” directors as defined by the listing standards of NASDAQ currently in effect and approved by the U.S. Securities and Exchange Commission and all applicable rules and regulations. All members of the Audit Committee satisfy the “independence” standards applicable to members of such committee. The board of directors made this affirmative determination regarding these directors’ independence based on discussions with the directors and on its review of the directors’ responses to a standard questionnaire regarding employment and compensation history; affiliations, family and other relationships; and transactions with the Company. The board of directors considered relationships and transactions between each director or any member of his immediate family and the Company and its subsidiaries and affiliates. The purpose of the board of director’s review with respect to each director was to determine whether any such relationships or transactions were inconsistent with a determination that the director is independent under the NASDAQ rules.
Audit Committee
On August 19, 2010, we established our Audit Committee. The Audit Committee consists of Timothy Stevens, Al Carmona and Longjiang Yuan, each of whom is an independent director. Timothy Stevens, Chairman of the Audit Committee, is an “audit committee financial expert” as defined under Item 407(d) of Regulation S-K. The purpose of the Audit Committee is to represent and assist our board of directors in its general oversight of our accounting and financial reporting processes, audits of the financial statements and internal control and audit functions. The Audit Committee’s responsibilities include:
| · | The appointment, replacement, compensation, and oversight of work of the independent auditor, including resolution of disagreements between management and the independent auditor regarding financial reporting, for the purpose of preparing or issuing an audit report or performing other audit, review or attest services; and |
| · | Reviewing and discussing with management and the independent auditor various topics and events that may have significant financial impact on our company or that are the subject of discussions between management and the independent auditors. |
The board of directors has adopted a written charter for the Audit Committee. During the fiscal year ended December 31, 2011, the Audit Committee met six times.
Procedures for Determining Executive Compensation
On August 19, 2010, our Board of Directors approved the adoption of the independent director oversight of executive officer compensation. Pursuant to NASDAQ Rule 5605(d), all matters regarding executive officer compensation shall be submitted for approval or recommendation by a majority of the independent directors.
Procedures for Selection of Director Nominees
On August 19, 2010, the Board of Directors of the Company approved the adoption of the procedures for the selection of director nominees. Pursuant to NASDAQ Rule 5605(e)(1), a majority of the independent directors shall recommend and select the director nominees.
Section 16(a) Beneficial Ownership Reporting Compliance
Section 16(a) of the Exchange Act requires our officers and directors, and persons who own more than 10% of a registered class of our equity securities, to file reports of ownership and changes in ownership with the SEC. Officers, directors and greater than ten percent shareholders are required by SEC regulation to furnish us with copies of all Section 16(a) forms they file.
To the Company’s knowledge, based solely on a review of the copies of such reports furnished to the Company, all reports under Section 16(a) required to be filed by its officers and directors and greater than 10% beneficial owners were filed as of the date of this filing, except that Charlie Lin failed to file a Form 3 in connection with his appointment as Chief Financial Officer of the Company on January 10, 2011.
Code of Ethics
On August 19, 2010, our Board of Directors adopted a Code of Conduct applicable to all directors, officers and employees. Pursuant to NASDAQ Rule 5610, the Code of Conduct complies with the definition of a “code of ethics” set out in Section 406(c) of the Sarbanes-Oxley Act of 2002. A copy of such Code of Conduct is referenced as Exhibit 14.1 herein.
ITEM 11. Executive Compensation
The following table sets forth all cash compensation paid by us, as well as certain other compensation paid or accrued, in 2010 and 2011, to each of the following named executive officers:
| | | | | | | | | | | | Stock and Option | | | All Other | | | | |
| | | Fiscal | | | Salary | | | Bonus | | | Awards | | | Compensation | | | Total | |
| Name and Principal Position | | Year | | | ($) | | | ($) | | | number | | | ($) | | | ($) | |
| | | | | | | | | | | | | | | | | | | |
| Jianming Hao | | | 2010 | | | | 26,435 | | | | - | | | | 150,000 | | | | 63,444 | | | | 89,879 | |
| (Chief Executive Officer) | | | 2011 | | | | 16,695 | | | | - | | | | - | | | | 64,985 | | | | 81,680 | |
| | | | | | | | | | | | | | | | | | | | | | | | | |
| Wenjun Tian | | | 2010 | | | | 26,435 | | | | - | | | | 150,000 | | | | 63,444 | | | | 89,879 | |
| (President) | | | 2011 | | | | 19,171 | | | | - | | | | - | | | | 64,985 | | | | 84,156 | |
| | | | | | | | | | | | | | | | | | | | | | | | | |
| Amy He (2) | | | 2010 | | | | - | | | | - | | | | - | | | | - | | | | - | |
| (Acting Chief Financial Officer) | | | 2011 | | | | 3,864 | | | | - | | | | - | | | | 14,854 | | | | 18,718 | |
| | | | | | | | | | | | | | | | | | | | | | | | | |
| David Lethem | | | 2010 | | | | 64,334 | | | | - | | | | 25,000 | | | | - | | | | 64,334 | |
| (Former Chief Financial Officer) | | | 2011 | | | | - | | | | - | | | | - | | | | - | | | | - | |
| | | | | | | | | | | | | | | | | | | | | | | | | |
| Charlie Lin (2) | | | 2010 | | | | - | | | | - | | | | - | | | | - | | | | - | |
| (Former Chief Financial Officer) | | | 2011 | | | | 125,333 | | | | - | | | | - | | | | 23,333 | | | | 148,667 | |
| | | | | | | | | | | | | | | | | | | | | | | | | |
| Jianbin Zhou | | | 2010 | | | | 43,807 | | | | - | | | | 40,000 | | | | 15,106 | | | | 58,913 | |
| (Chief Operating Officer} | | | 2011 | | | | 56,305 | | | | 77,363 | | | | - | | | | - | | | | 133,669 | |
| | | | | | | | | | | | | | | | | | | | | | | | | |
| Michael Han | | | 2010 | | | | 13,595 | | | | - | | | | - | | | | - | | | | 13,595 | |
| Corporate Secretary | | | 2011 | | | | 37,541 | | | | - | | | | - | | | | - | | | | 37,541 | |
| | | | | | | | | | | | | | | | | | | | | | | | | |
| Junde Zhang (1) | | | 2010 | | | | 5,287 | | | | - | | | | 40,000 | | | | 37,009 | | | | 42,296 | |
| (Vice President of the Grains Division) | | | 2011 | | | | - | | | | 108,309 | | | | - | | | | 54,154 | | | | 162,463 | |
| | | | | | | | | | | | | | | | | | | | | | | | | |
| Yongqing Ren (1) | | | 2010 | | | | 5,287 | | | | - | | | | 40,000 | | | | 37,009 | | | | 42,296 | |
| (Vice President of the Corn Division) | | | 2011 | | | | - | | | | 123,782 | | | | - | | | | 54,154 | | | | 177,936 | |
| | | | | | | | | | | | | | | | | | | | | | | | | |
| Yunling Ding (1)(3) | | | 2010 | | | | 26,304 | | | | - | | | | 15,000 | | | | - | | | | - | |
| (Vice president) | | | 2011 | | | | 37,738 | | | | - | | | | - | | | | - | | | | 37,738 | |
| | | | | | | | | | | | | | | | | | | | | | | | | |
| Li Ren (1)(3) | | | 2010 | | | | 30,967 | | | | - | | | | 30,000 | | | | 15,106 | | | | 46,073 | |
| (Vice President of Branding and Marketing) | | | 2011 | | | | 56,305 | | | | - | | | | - | | | | - | | | | 56,305 | |
| | | | | | | | | | | | | | | | | | | | | | | | | |
| Weizhong Cai(3) | | | 2010 | | | | 1,133 | | | | - | | | | - | | | | - | | | | 1,133 | |
| (Chief Scientist) | | | 2011 | | | | - | | | | - | | | | - | | | | - | | | | - | |
(1) Based on the compensation received by Mr. Junde Zhang, Mr. Yongqing Ren and Mr. Li Ren, they are qualified as executive officers for purposes of this table.
(2) Effective February 3, 2012, Ms. Amy He was promoted to Acting Chief Financial Officer of the Company. Ms. He replaced Mr. Charlie Lin, whose employment and employment agreement with the Company officially terminated on March 5, 2012 in accordance with the notification procedures set forth in his employment agreement.
(3) Effective February 3, 2012, Mr. Li Ren resigned as the Company’s Vice President - Brand and Marketing and Mr. Weizhong Cai resigned as the Company’s Chief Scientist, and Mr. Yunlin Ding was appointed the Vice President of Company.
Outstanding Equity Awards at the End of the Fiscal Year
The following table summarizes the number of securities underlying outstanding plan awards for each named executive officer as of December 31, 2011:
| | | Option Awards | | | Stock Awards | |
| | | Number of
Securities
Underlying
Unexercised
Options (#) | | | Number of
Securities
Underlying
Unexercised
Options (#) | | | Equity Incentive
Plan
Awards:Number of
Securities
Underlying
Unearned Options
(#) | | | Option
Exercise
Price ($) | | | Option
Expiration
Date | | | Number of
Shares or
Units of Stock
That Have Not
Vested (#) | | | Market
Value of
Shares or
Units of
Stock That
Have Not
Vested ($) | | | Equity
Incentive Plan
Awards:
Number of
Unearned
Shares, Units or
Other Rights
That Have Not
Vested (#) | | | Equity
Incentive Plan
Awards: Market
or Payout Value
of Unearned
Shares, Units or
Other
Rights That
Have Not
Vested ($) | |
| Name | | Exercisable | | | Unexercisable | | | — | | | — | | | — | | | — | | | — | | | — | | | — | |
| Jianming Hao | | | 100,000 | | | | 50,000 | | | | - | | | | 4.4 | | | | 5-Nov-20 | | | | - | | | | -- | | | | - | | | | - | |
| | | | | | | | | | | | | | | | | | | | | | | | | | | | | | | | | | | | | |
| Wenjun Tian | | | 100,000 | | | | 50,000 | | | | - | | | | 4.4 | | | | 5-Nov-20 | | | | - | | | | - | | | | - | | | | - | |
| | | | | | | | | | | | | | | | | | | | | | | | | | | | | | | | | | | | | |
| Amy He | | | - | | | | - | | | | - | | | | - | | | | - | | | | - | | | | - | | | | - | | | | - | |
| | | | | | | | | | | | | | | | | | | | | | | | | | | | | | | | | | | | | |
| Charlie Lin | | | - | | | | - | | | | - | | | | - | | | | - | | | | - | | | | - | | | | - | | | | - | |
| | | | | | | | | | | | | | | | | | | | | | | | | | | | | | | | | | | | | |
| Jianbin Zhou | | | 26,666 | | | | 13,334 | | | | - | | | | 4.4 | | | | 5-Nov-20 | | | | - | | | | - | | | | - | | | | - | |
| | | | | | | | | | | | | | | | | | | | | | | | | | | | | | | | | | | | | |
| Michael Han | | | - | | | | - | | | | - | | | | - | | | | 5-Nov-20 | | | | - | | | | - | | | | - | | | | - | |
| | | | | | | | | | | | | | | | | | | | | | | | | | | | | | | | | | | | | |
| Junde Zhang | | | 26,666 | | | | 13,334 | | | | - | | | | 4.4 | | | | 5-Nov-20 | | | | - | | | | - | | | | - | | | | - | |
| | | | | | | | | | | | | | | | | | | | | | | | | | | | | | | | | | | | | |
| Yongqing Ren | | | 26,666 | | | | 13,334 | | | | - | | | | 4.4 | | | | 5-Nov-20 | | | | - | | | | - | | | | - | | | | - | |
| | | | | | | | | | | | | | | | | | | | | | | | | | | | | | | | | | | | | |
| Yunling Ding | | | 10,000 | | | | 5,000 | | | | - | | | | 4.4 | | | | 5-Nov-20 | | | | - | | | | - | | | | - | | | | - | |
| | | | | | | | | | | | | | | | | | | | | | | | | | | | | | | | | | | | | |
| Li Ren (Note 1) | | | 20,000 | | | | 10,000 | | | | - | | | | 4.4 | | | | 5-Nov-20 | | | | - | | | | - | | | | - | | | | - | |
| | | | | | | | | | | | | | | | | | | | | | | | | | | | | | | | | | | | | |
| Weizhong Cai | | | - | | | | - | | | | - | | | | - | | | | - | | | | - | | | | - | | | | - | | | | - | |
Note (1): As a result of the termination of employment (the "Termination") of Mr. Li Ren as the Vice President effective February, 3, 2012, and pursuant to the terms of the Plan, the unexercised options will expire and be forfeited three months after the Termination.
Option Exercises and Stock Vested
None.
Director Compensation
Our directors are reimbursed for expenses incurred by them in connection with attending Board of Directors’ meetings. The following table presents compensation distributed to our independent directors during the years ended December 31, 2011 and December 31, 2010 for serving on the Board of Directors:
| | | Fees Earned
or Paid in
Cash | | | Option
Awards (1) | | | All Other | | | Total | |
| | | ($) | | | ($) | | | Compensation ($) | | | ($) | |
| 2011 | | | | | | | | | | | | | | | | |
| Timothy Stevens | | $ | 43,810 | | | $ | - | | | $ | - | | | $ | 43,810 | |
| Al Carmona | | | 31,000 | | | | - | | | | - | | | | 31,000 | |
| Longjiang Yuan | | | 7,736 | | | | - | | | | - | | | | 7,736 | |
| | | $ | 82,546 | | | $ | - | | | $ | - | | | $ | 82,546 | |
| | | | | | | | | | | | | | | | | |
| 2010 | | | | | | | | | | | | | | | | |
| Timothy Stevens | | $ | 12,375 | | | $ | 35,997 | | | $ | - | | | $ | 48,372 | |
| Al Carmona | | | 6,000 | | | | 26,998 | | | | - | | | | 32,998 | |
| Longjiang Yuan | | | - | | | | 8,999 | | | | - | | | | 8,999 | |
| | | $ | 18,375 | | | $ | 71,994 | | | $ | - | | | $ | 90,369 | |
(1) The numbers for 2010 represents the aggregated fair value to option awards granted to the directors as at the grant date of the options granted in November 18, 2010, which is determined in accordance with ASC Topic 718. For information regarding the fair value of option awards as at the grant date of the options, please refer to Note 15 of the Consolidated Financial Statements – Share-Based Compensation.
Bonuses and Deferred Compensation
We do not have any bonus, deferred compensation or retirement plan. All decisions regarding compensation are determined by our Board of Directors.
Options and Stock Appreciation Rights
On November 4, 2010, the Company’s Board of Directors approved the Company’s 2010 Share Incentive Plan. Under the Plan, 1,000,000 shares of the Company’s common stock shall be allocated to and authorized for use pursuant to the terms of the Plan. On November 8, 2010, a total of 931,000 non-qualified incentive stock options were approved by our Board of Directors and granted under the Plan to executives, key employees, independent directors, and consultants at an exercise price of $4.40 per share and on December 15, 2010, 40,000 non-qualified incentive stock shares were approved by our Board of Directors and granted under the Plan to a consultant at an exercise price of $4.40 per share, of which shall vest as follows:
33 1/3% of the option grants vested one (1) month after the date of grant;
33 1/3% of the option grants vested twelve (12) months after the date of grant; and
33 1/3% of the option grants will vest twenty-four (24) months after the date of grant.
On March 8, 2012, the Company’s Board of Directors allocated to and authorized for use the maximum number of shares allowable pursuant to the terms of the Plan and granted 420,000 options under the Plan, of which 264,000 were new options and 156,000 were re-granted after such options were forfeited by employees as a result of their resignations from the Company in accordance with the terms of their option agreements. All of the newly granted options vest as follows:
50% of the options granted will vest six (6) months after the date of the grant; and
50% of the options granted will vest twelve (12) months after the date of the grant.
On November 5, 2011, we filed a Registration Statement with the SEC on Form S-8 covering up to 1,000,000 shares underlying options which may be granted under the Plan. As of March 19, 2012, none of the options granted pursuant to the Plan have been exercised.
Employment Agreement
On January 10, 2011, we entered into an employment agreement with Charlie Lin pursuant to which Mr. Lin was hired as our Chief Financial Officer. Effective March 5, 2012, Mr. Lin’s employment and his employment agreement were terminated. A copy of that agreement is referenced herein as Exhibit 10.37.
Payment of Post-Termination Compensation
We do not have change-in-control agreements with any of our directors or executive officers, and we are not obligated to pay severance or other enhanced benefits to executive officers upon termination of their employment.
ITEM 12. Security Ownership of Certain Beneficial Owners and Management
The following table sets forth certain information regarding beneficial ownership of our common stock as of, March 27, 2012: (i) by each of our directors, (ii) by each of the named executive officers, (iii) by all of our executive officers and directors as a group, and (iv) by each person or entity known by us to beneficially own more than 5% of any class of our outstanding shares. As of March 27, 2012, there were10,564,774shares of our common stock outstanding:
| | | | Amount and Nature of | | | Fully Diluted | |
| | Name and Address of | | Beneficial Ownership | | | Percentage of Outstanding | |
| Title of Class | | Beneficial Owner (1)(2) | | (number of shares) | | | Shares of Common Stock (3) | |
| Certain Beneficial Owners - Over 5% Ownership | | | | | | | | |
| Common Stock | | Expert Venture Limited (4)(5) | | | 5,682,998 | | | | 39.85 | % |
| Common Stock | | Sure Glory Holdings Limited(6) | | | 748,636 | | | | 5.25 | % |
| Common Stock | | Charming Action Management Limited(7) | | | 616,364 | | | | 4.32 | % |
| Directors and Executive Officers and Significant Employees | | | | | | | | |
| Common Stock | | Jianming Hao(10) | | | 673,983 | | | | 4.73 | % |
| Common Stock | | Wenjun Tian(11) | | | 1,804,899 | | | | 12.66 | % |
| Common Stock | | Charlie Lin(21) | | | 0 | | | | 0 | % |
| Common Stock | | Amy He (20) | | | 0 | | | | 0 | % |
| Common Stock | | Jianbin Zhou(12) | | | 26,666 | | | | | * |
| Common Stock | | Michael Han | | | 0 | | | | 0 | % |
| Common Stock | | Yongqing Ren(13) | | | 1,163,267 | | | | 8.16 | % |
| Common Stock | | Junde Zhang(14) | | | 1,163,267 | | | | 8.16 | % |
| Common Stock | | Yunlin Ding(15) | | | 10,000 | | | | | * |
| Common Stock | | Li, Ren(16) | | | 20,000 | | | | | * |
| Common Stock | | Al Carmona(17) | | | 83,733 | | | | | * |
| Common Stock | | Longjiang Yuan(18) | | | 3,333 | | | | | * |
| Common Stock | | Timothy Stevens(19) | | | 13,333 | | | | | * |
| Common Stock | | Hong Wang(8)(9) | | | 681,960 | | | | 4.78 | % |
| Officers and Significant Employees and Directors as a Group | | | 5,644,441 | | | | 39.58 | % |
* Less than 1%.
| (1) | Pursuant to Rule 13d-3 under the Exchange Act, a person has beneficial ownership of any securities as to which such person, directly or indirectly, through any contract, arrangement, undertaking, relationship or otherwise has or shares voting power and/or investment power or as to which such person has the right to acquire such voting and/or investment power within 60 days. |
| (2) | Unless otherwise stated, each beneficial owner has sole power to vote and dispose of the shares. |
| | |
| (3) | Applicable percentage of ownership is based on10,564,774 shares of common stock outstanding as of March 27, 2012, together with 1,997,467 shares of common stock issuable upon the conversion of convertible preferred stock, 1,154,272 shares of common stock issuance upon the exercise of warrants, and 543,333 shares of common stock issuance upon the exercise of exercisable stock options within sixty (60) days as of the date hereof for beneficial owner. |
| | |
| (4) | The registered address of Expert Venture Limited is P.O. Box 957, Offshore Incorporation Centre, Road Town, Tortola, British Virgin Islands. |
| | |
| (5) | Mr. Yam Sheung Kwok is the sole and controlling person of Expert Venture Limited, owning all 1,000 shares of Expert Venture Limited (subject to the share transfer agreements discussed below). |
| | |
| (6) | The registered address of Sure Glory Holdings Limited is P.O. Box 957, Offshore incorporation Centre, Road Town, Tortola, British Virgin Islands. Mr. Dai Ai Wei is the sole and controlling person of Sure Glory Holdings Limited, owning the sole share of Sure Glory Holdings Limited. |
| | |
| (7) | The registered address of Charming Action Management Limited is Portcullis TrustNet Chambers, P.O. Box 3444, Road Town, Tortola, British Virgin Islands. Miss Jin Juan Dai is the sole and controlling person of Charming Action Management Limited, owning the sole share of Charming Action Management Limited. |
| | |
| (8) | The registered address of Hong Wang is 7/F, B Tower, Jinshangguoji Building, Jinzhong, China. |
| | |
| (9) | Pursuant to a share transfer agreement, Mr. Hong Wang has the option, subject to certain performance targets (discussed in more detail below), to purchase from Mr. Yam Sheung Kwok, the current sole shareholder of Expert Venture Limited, up to 120 shares of Expert Venture Limited. Accordingly, upon exercise of such option, Mr. Wang will indirectly (through his ownership of Expert Venture Limited) own and control 681,960 shares, which equal 4.78% of the fully-diluted percentage of outstanding shares. Since the performance targets set forth in the share transfer agreement have been met, the option has vested and become exercisable to Mr. Wang. As a result, the number of shares of beneficial ownership has included the 681,960 shares of common stock that have become transferrable to Mr. Wang. |
| | |
| (10) | Pursuant to a share transfer agreement, Mr. Jianming Hao, our Chairman and Chief Executive Officer, has the option, subject to certain performance targets, to purchase from Mr. Yam Sheung Kwok, the current sole shareholder of Expert Venture Limited, up to 101 shares of Expert Venture Limited. Accordingly, upon exercise of such option, Mr. Hao will indirectly (through his ownership of Expert Venture Limited own and control 573,983 shares, which equal 4.03% of the fully-diluted percentage of outstanding shares. Since the performance targets set forth in the share transfer agreement have been met, the option has vested and become exercisable to Mr. Hao. As a result, the number of shares of beneficial ownership has included the 573,983 shares of common stock that have become transferrable to Mr. Hao. In addition, the Company has granted to Mr. Hao options to purchase 250,000 shares of our common stock under the Plan, 100,000 of which have vested. |
| | |
| (11) | Pursuant to a share transfer agreement, Mr. Wenjun Tian, our Executive Director, will have an option, subject to certain performance targets (discussed in more detail below), to purchase from Mr. Yam Sheung Kwok, the current sole shareholder of Expert, up to 300 shares of Expert, which constitutes 30% of Expert. Accordingly, upon exercise of such option, Mr. Tian will indirectly (through his ownership of Expert) own and control 1,704,899 shares, which equal 11.96% of the fully-diluted percentage of outstanding shares. Since the performance targets set forth in the share transfer agreement have been met, the option has vested and become exercisable to Mr. Tian. As a result, the number of shares of beneficial ownership has included the 1,704,899 shares of common stock that have become transferrable to Mr. Tian. In addition, the Company has granted to Mr. Tian options to purchase 150,000 shares of our common stock under the Plan, 100,000 of which have vested. |
| | |
| (12) | The Company has granted to Mr. Zhou options to purchase 40,000 shares of common stock under the Company’s share option plan, 26,667 of which have vested. |
| | |
| (13) | Pursuant to a share transfer agreement, Mr. Yongqing Ren will have an option, subject to certain performance targets (discussed in more detail below), to purchase from Mr. Yam Sheung Kwok, the current sole shareholder of Expert, up to 200 shares of Expert. Accordingly, upon exercise of such option, Mr. Ren will indirectly (through his ownership of Expert) own and control 1,136,600 shares, which equal 7.97% of the fully-diluted percentage of outstanding shares. Since the performance targets set forth in the share transfer agreement have been met, the option has vested and become exercisable to Mr. Ren. As a result, the number of shares of beneficial ownership has included the 1,136,600 shares of common stock that have become transferrable to Mr. Ren. In addition, the Company has granted to Mr. Ren options to purchase 40,000 shares of our common stock under the Plan, 26,667 of which have vested.
|
| (14) | Pursuant to a share transfer agreement, Mr. Junde Zhang will have an option, subject to certain performance targets (discussed in more detail below), to purchase from Mr. Yam Sheung Kwok, the current sole shareholder of Expert, up to 200 shares of Expert. Accordingly, upon exercise of such option, Mr. Zhang will indirectly (through his ownership of Expert) own and control 1,136,600 shares, which equal 7.97% of the fully-diluted percentage of outstanding shares.Since the performance targets set forth in the share transfer agreement have been met, the option has vested and become exercisable to Mr. Zhang. As a result, the number of shares of beneficial ownership has included the 1,136,600 shares of common stock that have become transferrable to Mr. Zhang. In addition, the Company has granted to Mr. Zhang options to purchase 40,000 shares of our common stock under the Plan, 26,667 of which have vested. |
| | |
| (15) | The Company has granted to Mr. Yunling Ding options to purchase 55,000 shares of our common stock under the Plan, 10,000 of which have vested. |
| | |
| (16) | The Company has granted to Mr. Li Ren options to purchase 30,000 shares of our common stock under the Plan, 20,000 of which have vested. As a result of the termination of employment of Mr. Li Ren effective February, 3, 2012, such options shall expire three months after termination such employee in accordance with the terms of the Plan unless exercised by Mr. Li Ren prior to such time. |
| | |
| (17) | Al Carmona was an investor in the financing that closed immediately following the Share Exchange. As of March 27, Mr. Al Carmona owned 46,547 shares of Series A Convertible Preferred Shares, 9,186 shares of Common Stock and a warrant exercisable into 18,000 shares of common stock at an exercise price of $5.06. In addition, the Company has granted to Mr. Carmona options to purchase 75,000 shares of our common stock under the Plan, 10,000 of which have vested. |
| | |
| (18) | The Company has granted to Mr. Longjiang Yuan options to purchase 5,000 shares of our common stock under the Plan, 3,333 of which have vested. |
| | |
| (19) | The Company has granted to Mr. Stevens options to purchase 80,000 shares of our common stock under the Plan, 13,333 of which have vested. |
| (20) | The Company has granted to Ms. Amy He options to purchase 60,000 shares of our common stock under the Plan, none of which have vested. |
| (21) | Mr. Lin’s employment as Chief Financial Officer terminated on March 5, 2012. |
ITEM 13. Certain Relationships and Related Transactions, and Director Independence
Sales Transactions
The Company (a) sold grain products in the aggregate amount of $3.3 million to Beijing Yilian Gifts Tech Development Co., Ltd. ("BYGT"), the Executive Director of which is Jianming Hao, the Company's Chief Executive Officer and (b) sold corn in the aggregate amount of $1.1 million to Tieling Zhongnong Agriculture Technology Development Co., Ltd. ("TZAT"), the legal representative of which is Yongqin Ren, the Company's Vice President of the Corn Division, during the fiscal year ended December 31, 2011. The Company also purchased a batch of sunflower seed for $2.6 million from TZAT in June 2011 and returned the goods at original cost for quality rejection. The prices in the transactions with such related parties were determined according to market price at the time of purchase and sale.
Due from Related Parties
The Company sold grain products to BYGT for $3.3 million in the year 2011 and the amounts due from/ to BYGT as of December 31, 2011 and March 28, 2012 were $468,976 and $285,210 under this transaction, respectively.
The Company paid social insurance and office rental for Deyufarm Innovation Food (Beijing) Co., Ltd. ("Deyufarm"), a former variable interest entity of the Company, for $89,929 in December 2011. The amounts due from Deyufarm as of December 31, 2011 and March 28, 2012 under this transaction were $89,929 and $0, respectively.
The Company sold grain products to Beijing Doukounianhua Biotechnology Co., Ltd., the legal representative of which is Jianbin Zhou, the Company's Chief Operating Officer, for total $24,666 in December 2011. As of December 31, 2011 $24,666 was due under this transaction and remained outstanding as of March 28, 2012.
The Company sold grain products to Jinshang International Finance Leasing Co., Ltd., one of the estimate shareholders of which is Wenjun Tian, The Company’s President and a Director, for $3,537 in September 2011. As of December 31, 2011, $3,537 was due under this transaction and remained outstanding as of March 28, 2012.
Due to Related Parties
Dongsheng International Investment Co., Ltd., the President and Executive Director of which is Wenjun Tian, the Company's President and a Director, loaned the Company in the aggregate amount of $2.9 million in the year ended December 31, 2011. Such loan is unsecured, bears no interest and no due date is specified. As of December 31, 2011 and March 28, 2012, $2.9 million and $2.5 million were due under this loan, respectively.
Wenjun Tian, the Company's President and a Director, loaned the Company in the aggregate amount of $2.5 million in the year ended December 31, 2011. Such loan is unsecured, bears no interest and no due date is specified. As of December 31, 2011, $2.5 million was due under this advance and remained outstanding as of March 28, 2012.
Deyufarm paid the miscellaneous expenses for the Company for $3,338 in the year of 2011. As of December 31, 2011 and March 28, 2012, $3,338 and $0 was due under this transaction, respectively.
Guarantee Transactions
On May 10, 2011, Wenjun Tian, Jianming Hao and an unrelated third party provided a one year guarantee on a $7.9 million short-term bank loan payable to Bank of Communications by Detian Yu, bearing interest at a floating rate of prime rate plus 30% of prime rate, of which prime rate was based on the one-year loan interest rate released by The People's Bank of China. The actual interest rate as of December 31, 2011 was 8.5280%. The maturity date is May 9, 2012. Detian Yu paid $0 towards principal and $408,296 towards interest on the loan during the fiscal year ended December 31, 2011. $7.9 million was outstanding under the loan as of December 31, 2011 and March 28, 2012.
On August 9, 2011, Yuci Jinmao Food Processing Factory, the legal representative of which is Junlian Zheng, the wife of Junde Zhang, the Vice President of the Company, provided a two-year guarantee on a $1.4 million short-term bank loan payable to Jinzhong City Yuci District Rural Credit Union Co., Ltd. by Jinzhong Yongcheng, bearing interest at a floating rate of prime rate plus 130% of prime rate, of which prime rate was based on the six-month to one-year loan interest rate released by The People's Bank of China. The actual interest rate as of December 31, 2011 was 15.084%. The maturity date is August 7, 2012. Jinzhong Yongcheng paid $0 towards principal and $73,291 towards interest on the loan during the fiscal year ended December 31, 2011. $1.4 million was outstanding under the loan as of December 31, 2011 and March 28, 2012,
On August 9, 2011, Yuci Jinmao Food Processing Factory, the legal representative of which is Junlian Zheng, the wife of Junde Zhang, the Vice President of the Company, provided a two-year guarantee on a $1.4 million short-term bank loan payable to Jinzhong City Yuci District Rural Credit Union Co., Ltd. by Jinzhong Yuliang, bearing interest at a floating rate of prime rate plus 130% of prime rate, of which prime rate was based on the six-month to one-year loan interest rate released by The People's Bank of China. The actual interest rate as of December 31, 2011 was 15.084%. The maturity date is August 7, 2012. Jinzhong Yuliang paid $0 towards principal and $73,291 towards interest on the loan during the fiscal year ended December 31, 2011. $1.4 million was outstanding under the loan as of December 31, 2011 and March 28, 2012.
On January 13, 2010, Jinzhong Deyu provided a two year guarantee on a $1.3 million short-term bank loan payable to Jinzhong Economic Development District Rural Credit Union by Jingzhong Yuliang, bearing interest at a floating rate of prime rate plus 129.83% of prime rate, of which prime rate was based on the six-month to one-year loan interest rate released by The People's Bank of China. The loan was originally due March 8, 2011. In January 2011, the Company entered into an agreement with the bank for an extension and the new term was from February 1, 2011 to October 1, 2011. The adjustable interest rate was a rate per annum equal to the prime rate plus 117.23% of prime rate. The prime rate was based on the one to three year loan interest rate released by The People's Bank of China. The loan was fully paid off on May 11, 2011, with Jingzhong Yuliang paying the principal amount of $1.3 million plus $8,865 in accrued interest.
On January 13, 2010, Jinzhong Deyu and Jinzhuong Yuliang provided a two-year guarantee on a $1.3 million short-term bank loan payable to Shanxi Province Rural Credit Union by Jingzhong Yongcheng, bearing interest at a floating rate of prime rate plus 107% of prime rate, of which prime rate was based on the six-month to one-year loan interest rate released by The People's Bank of China. The loan was originally due January 13, 2011. In January 2011, the Company entered into an agreement with the bank for an extension and the new term was from January 14, 2011 to June 11, 2011. The adjustable interest rate was a rate per annum equal to the prime rate plus 107% of prime rate. The prime rate was based on the one to three year loan interest rate released by The People's Bank of China. The loan was fully paid off on May 11, 2011, with Jingzhong Yongcheng paying the principal amount of $1.3 million plus $6,750 in accrued interest.
Promoters and Certain Control Persons
None.
Conflicts of Interest
We have certain potential conflicts of interest that are inherent in the relationships between our officers and directors.
From time to time, one or more of our affiliates may form or hold an ownership interest in and/or manage other businesses both related and unrelated to the type of business that we own and operate. These persons expect to continue to form, hold an ownership interest in and/or manage additional other businesses which may compete with ours with respect to operations, including financing and marketing, management time and services and potential customers. These activities may give rise to conflicts between or among the interests of us and other businesses with which our affiliates are associated. Our affiliates are in no way prohibited from undertaking such activities, and neither we nor our shareholders will have any right to require participation in such other activities.
Further, because we intend to transact business with some of our officers, directors and affiliates, as well as with firms in which some of our officers, directors or affiliates have a material interest, potential conflicts may arise between the respective interests of us and these related persons or entities. We believe that such transactions will be effected on terms at least as favorable to us as those available from unrelated third parties.
With respect to transactions involving real or apparent conflicts of interest, we have adopted policies and procedures which require that: (a) the fact of the relationship or interest giving rise to the potential conflict be disclosed or known to the directors who authorize or approve the transaction prior to such authorization or approval, (b) the transaction be approved by a majority of our disinterested outside directors and (c) the transaction be fair and reasonable to us at the time it is authorized or approved by our directors.
ITEM 14. Principal Accountant Fees and Services
Public Accounting Fees
The following chart sets forth public accounting fees paid and payable to KCCW Accountancy Corp. (“KCCW”) during the years ended December 31, 2010 and 2011:
| | | 2011 | | | 2010 | |
| Audit Fees | | $ | 310,000 | | | $ | 170,000 | |
| Audit Related Fees | | $ | 10,000 | | | $ | 100,000 | |
| Tax Fees | | $ | — | | | $ | — | |
| All Other Fees | | $ | — | | | $ | — | |
Audit fees were for professional services rendered by KCCW for the audit of our annual financial statements and the review of the financial statements included in our quarterly reports on Forms 10-Q, and services that are normally provided by KCCW in connection with statutory and regulatory filings or engagements for that fiscal year.
Audit related fees consist of services by KCCW that are reasonably related to the performance of the audit or review of our financial statements and are not reported above under Audit Fees. This category includes accounting consultations on transaction and proposed transaction related matters. We incurred these fees in connection with registration statements, financing, and acquisition transaction.
KCCW did not bill any other fees for services rendered to us during the years ended December 31, 2010 and 2011 for assurance and related services in connection with the audit or review of our financial statements.
Pre-Approval of Services
The Audit Committee appoints the independent accountant each year and pre-approves the audit services. The Audit Committee chair is authorized to pre-approve specified non-audit services for fees not exceeding specified amounts, if he promptly advises the other Audit Committee members of such approval.
Audit of Financial Statements
During the years ended December 31, 2010 and 2011, KCCW was our principal auditor and no work was performed by persons outside of KCCW.
PART IV
ITEM 15. Exhibits and Financial Statement Schedules
(a) Financial Statements and Schedules
The financial statements are set forth under the “F” pages of this Annual Report. Financial statement schedules have been omitted because they are either not required, not applicable, or the information is otherwise included.
(b) Exhibits
| 2.1 | Share Exchange Agreement Dated April 27, 2010 (1) |
| | |
| 3.1 | Articles of Incorporation of Deyu Agriculture Corp. (2) |
| | |
| 3.2 | Certificate of Amendment of Articles of Incorporation of Deyu Agriculture Corp. (3) |
| | |
| 3.3 | Bylaws of Deyu Agriculture Corp. (2) |
| | |
| 4.1 | Certificate of Designation of Rights and Preferences of Series A Convertible Preferred Stock (1) |
| | |
| 4.2 | Form of Series A Warrant (1) |
| | |
| 10.1 | Securities Purchase Agreement Dated April 27, 2010 (1) |
| | |
| 10.2 | Registration Rights Agreement Dated April 27, 2010 (1) |
| | |
| 10.3 | Form of Lock-Up Agreement Dated April 27, 2010 (1) |
| | |
| 10.4 | Securities Escrow Agreement Dated April 27, 2010 (1) |
| 10.5 | Placement Agent Agreement between the Company and Maxim Group, LLC dated January 27, 2010(6) |
| | |
| 10.6 | Share Transfer Agreement between Hong Wang and Yam Sheung Kwok dated April 26, 2010 (6) |
| | |
| 10.7 | Share Transfer Agreement between Jianming Hao and Yam Sheung Kwok dated April 26, 2010 (6) |
| | |
| 10.8 | Share Transfer Agreement between Wenjun Tian and Yam Sheung Kwok dated April 26, 2010 (6) |
| | |
| 10.9 | Share Transfer Agreement between Yongqing Ren and Yam Sheung Kwok dated April 26, 2010 (6) |
| | |
| 10.10 | Share Transfer Agreement between Junde Zhang and Yam Sheung Kwok dated April 26, 2010 (6) |
| | |
| 10.11 | Employment Agreement between David Lethem, as Chief Financial Officer, and the Company dated June 18, 2010 (4) |
| | |
| 10.12 | Certificate from China Organic Food Certification Center dated December 21, 2009 (6) |
| | |
| 10.13 | Corn Purchase Letter of Intent between Shanghai Yihai Trading Co., Ltd., Shanxi Office and Jinzhong Yuliang Agricultural Trading Co., Limited dated December 20, 2009 (6) |
| | |
| 10.14 | Warehouse Lease Agreement between Shanxi 661 Warehouse and Jinzhong Yongcheng Agricultural Trading Co., Limited dated December 21, 2006 (6) |
| | |
| 10.15 | Warehouse Lease Agreement between Shanxi Means of Production Company, Yuci Warehouse (formerly, the 671 Warehouse) and Jinzhong Yongcheng Agricultural Trading Co., Limited dated December 28, 2008 (6) |
| | |
| 10.16 | Railway Lease Agreement between Shanxi Cereal & Oil Group, Mingli Reservation Depot and Jinzhong Yongcheng Agriculture Trading Co., Limited dated December 21, 2006 (6) |
| | |
| 10.17 | Railway Lease Agreement between Shanxi Yuci Cereal Reservation Depot and Jinzhong Yongcheng Agriculture Trading Co., Limited dated November 15, 2007 (6) |
| | |
| 10.18 | Railway Lease Agreement between Yuci Dongzhao Railway Freight Station and Jinzhong Yongcheng Agriculture Trading Co., Limited dated December 21, 2006 (6) |
| | |
| 10.19 | Agricultural Technology Cooperation Agreement between Jinzhong Deyu Agriculture Trading Co., Ltd. and Millet Research Institute, Shanxi Academy of Agricultural Science dated October 2007 (6) |
| | |
| 10.20 | Agricultural Technology Cooperation Agreement between Sorghum Institute, Shanxi Academy of Agricultural Sciences and Jinzhong Deyu Agriculture Trading Co., Ltd. dated August 24, 2008 (6) |
| | |
| 10.21 | Certificate of Forest Rights for the Yuci Forest Right Certificate (2005) No. 01518 dated August 11, 2006 (6) |
| | |
| 10.22 | Farmland Transfer Agreement between Detian Yu Biotechnology (Beijing) Co. Ltd. and Shanxi Jinbei Plant Technology Co, Ltd. dated September 30, 2010 (6) |
| | |
| 10.23 | Land Use Rights Acquisition Contract Dated September 30, 2010 (5) |
| | |
| 10.24 | Deyu Agriculture Corp. 2010 Share Incentive Plan (7) |
| | |
| 10.25 | Exclusive Management and Consulting Service Agreement, dated November 16, 2010, by and between Detian Yu Biotechnology (Beijing) Co. Limited and Beijing Jundaqianyuan Investment Management Co., Ltd. (English translated version) (8) |
| | |
| 10.26 | Exclusive Management and Consulting Service Agreement, dated November 16, 2010, by and between Detian Yu Biotechnology (Beijing) Co. Limited and Jinzhong Longyue Investment Consulting Co., Ltd. (English translated version) (8) |
| 10.27 | Business Cooperation Agreement, dated November 16, 2010, by and between Detian Yu Biotechnology (Beijing) Co. Limited and Beijing Jundaqianyuan Investment Management Co., Ltd. (English Translated Version) (8) |
| | |
| 10.28 | Business Operation Agreement, dated November 16, 2010, by and among Detian Yu Biotechnology (Beijing) Co. Limited, Beijing Jundaqianyuan Investment Management Co., Ltd. and each of the shareholders of Beijing Jundaqianyuan Investment Management Co., Ltd. (English translated version) (8) |
| | |
| 10.29 | Business Operation Agreement, dated November 16, 2010, by and among Detian Yu Biotechnology (Beijing) Co. Limited, Jinzhong Longyue Investment Consulting Co., Ltd. and both of the shareholders of Jinzhong Longyue Investment Consulting Co., Ltd. (English translated version) (8) |
| | |
| 10.30 | Share Pledge Agreement, dated November 16, 2010, by and among Detian Yu Biotechnology (Beijing) Co. Limited and the following shareholders of Beijing Jundaqianyuan Investment Management Co., Ltd.: Tian Wenjun, Hao Jianming, Yang Jianhui, Zhou Jianbin, Ren Li, Ren Yongqing, Zhang Junde and Wang Tao (English translated version) (8) |
| | |
| 10.31 | Share Pledge Agreement, dated November 16, 2010, by and among Detian Yu Biotechnology (Beijing) Co. Limited and the following shareholders of Jinzhong Longyue Investment Consulting Co., Ltd.: Zhao Jing and Zhao Peilin (English translated version) (8) |
| | |
| 10.32 | Form of Power of Attorney (English translated version) (8) |
| | |
| 10.33 | Equity Acquisition Option Agreement, dated November 16, 2010, by and among Detian Yu Biotechnology (Beijing) Co. Limited and the following shareholders of Beijing Jundaqianyuan Investment Management Co., Ltd.: Tian Wenjun, Hao Jianming, Yang Jianhui, Zhou Jianbin, Ren Li, Ren Yongqing, Zhang Junde and Wang Tao (English translated version) (8) |
| | |
| 10.34 | Equity Acquisition Option Agreement, dated November 16, 2010, by and among Detian Yu Biotechnology (Beijing) Co. Limited and the following shareholders of Jinzhong Longyue Investment Consulting Co., Ltd.: Zhao Jing and Zhao Peilin (English translated version) (8) |
| | |
| 10.35 | Business Cooperation Agreement, dated November 16, 2010, by and between Detian Yu Biotechnology (Beijing) Co. Limited and Jinzhong Longyue Investment Consulting Co., Ltd. (English Translated Version) (8) |
| | |
| 10.36 | Village Collective Farmland Transfer Agreement, dated December 20, 2010, by and between Detian Yu Biotechnology (Beijing) Co., Ltd. and Shanxi Jinbei Plant Technology Development Co., Ltd. (English Translated and Mandarin Versions) (9) |
| | |
| 10.37 | Contract of Agreement, effective as of January 10, 2011, by and between Deyu Agriculture Corp. and Charlie Lin (10) |
| | |
| 14.1 | Code of Conduct (6) |
| | |
| 16.1 | Letter from Auditor (11) |
| | |
| 21 | List of Subsidiaries* |
| | |
| 31.1 | Certifications of the Chief Executive Officer pursuant to Section 302 of the Sarbanes-Oxley Act of 2002* |
| | |
| 31.2 | Certifications of the Chief Financial Officer pursuant to Section 302 of the Sarbanes-Oxley Act of 2002* |
| | |
| 32.1 | Certification Pursuant To 18 U.S.C. Section 1350, As Adopted Pursuant To Section 906 of the Sarbanes-Oxley Act Of 2002** |
| 32.2 | Certification Pursuant To 18 U.S.C. Section 1350, As Adopted Pursuant To Section 906 of the Sarbanes-Oxley Act Of 2002** |
| | |
| 99.1 | Audit Committee Charter adopted August 19, 2010 (6) |
| | |
| 101. INS | XBRL Instance Document* |
| | |
| 101. CAL | XBRL Taxonomy Extension Calculation Link base Document* |
| | |
| 101. DEF | XBRL Taxonomy Extension Definition Link base Document* |
| | |
| 101. LAB | XBRL Taxonomy Label Link base Document* |
| | |
| 101. PRE | XBRL Extension Presentation Link base Document* |
| | |
| 101. SCH | XBRL Taxonomy Extension Scheme Document* |
| (1) | Incorporated by reference to our Form 8-K filed on May 3, 2010. |
| (2) | Incorporated by reference to our Registration Statement on Form S-1 filed on July 8, 2009. |
| (3) | Incorporated by reference to our Form 8-K filed on June 4, 2010. |
| (4) | Incorporated by reference to our Form 8-K filed on June 18, 2010. |
| (5) | Incorporated by reference to our Form 8-K filed on October 6, 2010. |
| (6) | Incorporated by reference to our Form S-1/A filed on October 21, 2010. |
| (7) | Incorporated by reference to our Form S-8 filed on November 5, 2010. |
| (8) | Incorporated by reference to our Form 8-K filed on November 17, 2010. |
| (9) | Incorporated by reference to our Form 8-K filed on December 21, 2010. |
| (10) | Incorporated by reference to our Form 8-K filed on January 10, 2011. |
| (11) | Incorporated by reference to our Form 8-K filed on May 3, 2010. |
* Filed herewith.
** Furnished, not filed herewith.
SIGNATURES
In accordance with Section 13 or 15(d) of the Securities Exchange Act of 1934, the Registrant has duly caused this report to be signed on its behalf by the undersigned, thereunto duly authorized.
| | DEYU AGRICULTURE CORP. |
| | | |
| Date: March 30, 2012 | | |
| | | |
| | By: | /s/ Jianming Hao |
| | | Jianming Hao, Principal Executive Officer, Chief
Executive Officer and Chairman of the Board |
In accordance with the requirements of the Securities Exchange Act of 1934, this report has been signed below by the following persons on behalf of the registrant and in the capacities indicated on the dates indicated.
| Signatures | | Title | | Date |
| | | | | |
| /s/ Jianming Hao | | Principal Executive Officer, Chief Executive Officer and Chairman of the Board | | March 30, 2012 |
| Jianming Hao | | | | |
| | | | | |
| /s/ Wenjun Tian | | President and Director | | March 30, 2012 |
| Wenjun Tian | | | | |
| | | | | |
| /s/ Amy He | | Principal Financial and Accounting Officer and Acting Chief Financial Officer | | March 30, 2012 |
| Amy He | | | | |
| | | | | |
| /s/ Jianbin Zhou | | Chief Operating Officer | | March 30, 2012 |
| Jianbin Zhou | | | | |
| | | | | |
| /s/ Al Carmona | | Independent Director | | March 30, 2012 |
| Al Carmona | | | | |
| | | | | |
| /s/ Longjiang Yuan | | Independent Director | | March 30, 2012 |
| Longjiang Yuan | | | | |
| | | | | |
| /s/ Timothy Stevens | | Independent Director | | March 30, 2012 |
| Timothy Stevens | | | | |
DEYU AGRICULTURE CORP AND SUBSIDIARIES
INDEX TO CONSOLIDATED FINANCIAL STATEMENTS
December 31, 2011
| Report of Independent Registered Public Accounting Firm | | F-1 |
| | | |
| Consolidated Financial Statements: | | |
| | | |
| Consolidated Balance Sheets | | F-2 |
| | | |
Consolidated Statements of Income and Comprehensive Income
| | F-3 |
| | | |
| Consolidated Statements of Stockholders’ Equity | | F-4 |
| | | |
| Consolidated Statements of Cash Flows | | F-5 |
| | | |
| Notes to Consolidated Financial Statements | | F-6 |
 | Audit• Tax• Consulting• FinancialAdvisory Registered with Public Company Accounting Oversight
Board (PCAOB) |
REPORT OF INDEPENDENT REGISTERED PUBLIC ACCOUNTING FIRM
To the Board of Directors and Stockholders of:
Deyu Agriculture Corp.
We have audited the accompanying consolidated balance sheets of Deyu Agriculture Corp. (the “Company”) as of December 31, 2011 and 2010, and the related consolidated statements of income and comprehensive income, stockholders’ equity, and cash flows for the years then ended. These consolidated financial statements are the responsibility of the Company's management. Our responsibility is to express an opinion on these consolidated financial statements based on our audits.
We conducted our audit in accordance with standards of the Public Company Accounting Oversight Board (United States). Those standards require that we plan and perform the audits to obtain reasonable assurance about whether the consolidated financial statements are free of material misstatement. The Company is not required to have, nor were we engaged to perform, an audit of its internal control over financial reporting. Our audits included consideration of internal control over financial reporting as a basis for designing audit procedures that are appropriate in the circumstances, but not for the purpose of expressing an opinion on the effectiveness of the Company’s internal control over financial reporting. Accordingly, we express no such opinion. An audit includes examining, on a test basis, evidence supporting the amounts and disclosures in the consolidated financial statements. An audit also includes assessing the accounting principles used and significant estimates made by management, as well as evaluating the overall consolidated financial statement presentation. We believe that our audits provide a reasonable basis for our opinion.
In our opinion, the consolidated financial statements referred to above present fairly, in all material respects, the consolidated financial position of Deyu Agriculture Corp. as of December 31, 2011 and 2010 and the consolidated results of their operations and their cash flows for the years then ended in conformity with accounting principles generally accepted in the United States of America.
/s/ KCCW Accountancy Corp.
Diamond Bar, California
March 27, 2012
KCCW Accountancy Corp.
22632 Golden Springs Dr. #230, Diamond Bar, CA 91765, USA
Tel: +1 909 348 7228 • Fax: +1 626 529 1580 • info@kccwcpa.com
DEYU AGRICULTURE CORP AND SUBSIDIARIES
CONSOLIDATED BALANCE SHEETS
| Assets | | December 31,
2011 | | | December 31,
2010 | |
| | | | | | | | | |
| Current Assets | | | | | | | | |
| Cash and cash equivalents | | $ | 8,741,703 | | | $ | 5,665,858 | |
| Restricted cash | | | 1,850,999 | | | | 125,560 | |
| Accounts receivable, net | | | 36,167,136 | | | | 11,160,959 | |
| Due from related parties | | | 587,108 | | | | - | |
| Inventory | | | 20,314,090 | | | | 16,541,999 | |
| Advance to supplier | | | 7,233,371 | | | | 1,178,532 | |
| Prepaid expenses | | | 391,537 | | | | 1,324,251 | |
| Assets held for sale | | | 1,634,274 | | | | - | |
| Other current assets | | | 2,204,934 | | | | 669,134 | |
| Current assets of discontinued operations | | | - | | | | 5,806,884 | |
| Total Current Assets | | | 79,125,152 | | | | 42,473,177 | |
| | | | | | | | | |
| Property, plant, and equipment, net | | | 12,355,946 | | | | 4,287,372 | |
| Construction-in-progress | | | - | | | | 6,732,189 | |
| Other assets | | | 727,535 | | | | 10,394,246 | |
| Intangible assets, net | | | 10,651,844 | | | | - | |
| Non-current assets of discontinued operations | | | - | | | | 2,042,168 | |
| | | | | | | | | |
| Total Assets | | $ | 102,860,477 | | | $ | 65,929,152 | |
| | | | | | | | | |
| Liabilities and Equity | | | | | | | | |
| | | | | | | | | |
| Current Liabilities | | | | | | | | |
| Short-term loan | | $ | 14,413,480 | | | $ | 2,631,364 | |
| Accounts payable | | | 1,833,190 | | | | 197,012 | |
| Note payables | | | 1,588,840 | | | | - | |
| Advance from customers | | | 8,488,272 | | | | 6,451,782 | |
| Accrued expenses | | | 1,149,205 | | | | 1,291,227 | |
| Preferred stock dividends payable | | | 219,721 | | | | 238,620 | |
| Due to related parties | | | 5,445,115 | | | | - | |
| Other current liabilities | | | 583,196 | | | | 23,779 | |
| Current liabilities of discontinued operations | | | - | | | | 11,654,915 | |
| Total Current Liabilities | | | 33,721,019 | | | | 22,488,699 | |
| | | | | | | | | |
| Equity | | | | | | | | |
| Series A convertible preferred stock, $.001 par value, 10,000,000 shares authorized, 1,997,467 and 2,106,088 shares outstanding, respectively | | | 1,997 | | | | 2,106 | |
| Common stock, $.001 par value; 75,000,000 shares authorized, 10,564,774 and 10,349,774 shares issued and outstanding, respectively | | | 10,565 | | | | 10,350 | |
| Additional paid-in capital | | | 20,367,138 | | | | 18,770,230 | |
| Other comprehensive income | | | 4,831,353 | | | | 2,272,633 | |
| Retained earnings | | | 43,491,465 | | | | 22,385,134 | |
| Total Stockholders' Equity | | | 68,702,518 | | | | 43,440,453 | |
| Noncontrolling Interests | | | 436,940 | | | | - | |
| Total Equity | | | 69,139,458 | | | | 43,440,453 | |
| | | | | | | | | |
| Total Liabilities and Equity | | $ | 102,860,477 | | | $ | 65,929,152 | |
The accompanying notes are an integral part of these consolidated financial statements.
DEYU AGRICULTURE CORP AND SUBSIDIARIES
CONSOLIDATED STATEMENTS OF OPERATIONS
| | | For The Years Ended | |
| | | December 31, | |
| | | 2011 | | | 2010 | |
| | | | | | | | | |
| Net revenue | | $ | 261,576,666 | | | $ | 85,174,884 | |
| Cost of goods sold | | | (218,480,009 | ) | | | (63,250,363 | ) |
| Gross Profit | | | 43,096,657 | | | | 21,924,521 | |
| | | | | | | | | |
| Selling expenses | | | (13,231,094 | ) | | | (6,281,768 | ) |
| General and administrative expenses | | | (8,222,182 | ) | | | (3,627,860 | ) |
| Total Operating Expense | | | (21,453,276 | ) | | | (9,909,628 | ) |
| Operating income | | | 21,643,381 | | | | 12,014,893 | |
| | | | | | | | | |
| Interest income | | | 42,159 | | | | 17,505 | |
| Interest expense | | | (805,601 | ) | | | (341,555 | ) |
| Non-operating income | | | (180,294 | ) | | | (18,174 | ) |
| Total Other Expense | | | (943,736 | ) | | | (342,224 | ) |
| | | | | | | | | |
| Income from continuing operations before income taxes | | | 20,699,645 | | | | 11,672,669 | |
| Income taxes | | | (184,384 | ) | | | 913,785 | |
| Income from continuing operations | | | 20,515,261 | | | | 12,586,454 | |
| Loss from discontinued operations, net of income taxes | | | (3,891,830 | ) | | | (756,480 | ) |
| | | | | | | | | |
| Net income | | | 16,623,431 | | | | 11,829,974 | |
| | | | | | | | | |
| Net loss attributable to noncontrolling interests: | | | | | | | | |
| Net loss from continuing operations | | | 38,673 | | | | - | |
| Net loss from discontinued operations | | | 1,101,255 | | | | - | |
| Total net loss attributable to noncontrolling interests | | | 1,139,928 | | | | - | |
| Net income attributable to Deyu Agriculture Corp. | | | 17,763,359 | | | | 11,829,974 | |
| Preferred stock dividends | | | (427,917 | ) | | | (327,721 | ) |
| Net income available to common stockholders | | | 17,335,442 | | | | 11,502,253 | |
| Foreign currency translation gain | | | 2,751,687 | | | | 1,363,322 | |
| Comprehensive income | | | 20,087,129 | | | | 12,865,575 | |
| Less: Other comprehensive income attributable to noncontrolling interests | | | (130,653 | ) | | | - | |
| Comprehensive income attributable to Deyu Agriculture Corp. | | $ | 19,956,475 | | | $ | 12,865,575 | |
| | | | | | | | | |
| Amounts attributable to common stockholders: | | | | | | | | |
| Net income from continuing operations, net of income taxes | | $ | 20,126,017 | | | $ | 12,258,733 | |
| Discontinued operations, net of income taxes | | | (2,790,575 | ) | | | (756,480 | ) |
| Net income attributable to common stockholders | | $ | 17,335,442 | | | $ | 11,502,253 | |
| | | | | | | | | |
| Net income attributable to common stockholders per share - basic: | | | | | | | | |
| Income from continuing operations | | $ | 1.91 | | | $ | 1.45 | |
| Loss from discontinuing operations | | | (0.27 | ) | | | (0.09 | ) |
| Net income attributable to common stockholders | | $ | 1.64 | | | $ | 1.36 | |
| | | | | | | | | |
| Net income attributable to common stockholders per share - diluted: | | | | | | | | |
| Income from continuing operations | | $ | 1.64 | | | $ | 1.23 | |
| Loss from discontinuing operations | | | (0.22 | ) | | | (0.07 | ) |
| Net income attributable to common stockholders | | $ | 1.42 | | | $ | 1.16 | |
| | | | | | | | | |
| Weighted average number of common shares outstanding - basic | | | 10,522,432 | | | | 8,445,880 | |
| Weighted average number of common shares outstanding - diluted | | | 12,497,164 | | | | 10,249,041 | |
The accompanying notes are an integral part of these consolidated financial statements.
DEYU AGRICULTURE CORP AND SUBSIDIARIES
CONSOLIDATED STATEMENTS OF STOCKHOLDERS' EQUITY
| | | | Series A
Convertible
Preferred Stock | | | | Common Stock | | | | Additional | | | | Other | | | | | |
| | | | | | | | | | | | | | | | | | | | Paid-in | | | | Comprehensive | | | | Retained | | | | Noncontrolling | | | | | |
| | | | Shares | | | | Amount | | | | Shares | | | | Amount | | | | Capital | | | | Income | | | | Earnings | | | | Interest | | | | Total | |
| | | | | | | | | | | | | | | | | | | | | | | | | | | | | | | | | | | | | |
| Balance at December 31, 2009 | | | - | | | $ | - | | | | 4,930,000 | | | $ | 4,930 | | | $ | 8,978,527 | | | $ | 909,311 | | | $ | 11,805,468 | | | $ | - | | | $ | 21,698,236 | |
| Common stocks cancelled prior to reverse acquisition | | | - | | | | - | | | | (3,666,933 | ) | | | (3,667 | ) | | | 3,667 | | | | - | | | | - | | | | - | | | | - | |
| Common stocks issued for reverse acquisition | | | - | | | | - | | | | 8,736,932 | | | | 8,737 | | | | (8,737 | ) | | | - | | | | - | | | | - | | | | - | |
| Convertible preferred stocks issued for cash in private placement | | | 2,455,863 | | | | 2,456 | | | | - | | | | - | | | | 8,226,221 | | | | - | | | | - | | | | - | | | | 8,228,677 | |
| Warrants issued to investors with issuance of convertible preferred stocks | | | - | | | | - | | | | - | | | | - | | | | 851,342 | | | | - | | | | - | | | | - | | | | 851,342 | |
| Warrants issued to placement agent on issuance of convertible preferred stocks | | | - | | | | - | | | | - | | | | - | | | | 170,104 | | | | - | | | | - | | | | - | | | | 170,104 | |
| Conversion of convertible preferred stocks to common stocks | | | (349,775 | ) | | | (350 | ) | | | 349,775 | | | | 350 | | | | - | | | | - | | | | - | | | | - | | | | - | |
| Share-based compensation | | | - | | | | - | | | | - | | | | - | | | | 549,106 | | | | - | | | | - | | | | - | | | | 549,106 | |
| Net carrying amounts of the VIE Group at initial recognition | | | | | | | | | | | | | | | | | | | | | | | - | | | | (922,587 | ) | | | - | | | | (922,587 | ) |
| Net changes in foreign currency translation adjustment | | | - | | | | - | | | | - | | | | - | | | | - | | | | 1,363,322 | | | | - | | | | - | | | | 1,363,322 | |
| Net earnings for the year ended December 31, 2010 | | | - | | | | - | | | | - | | | | - | | | | - | | | | - | | | | 11,502,253 | | | | - | | | | 11,502,253 | |
| Balance at December 31, 2010 | | | 2,106,088 | | | | 2,106 | | | | 10,349,774 | | | | 10,350 | | | | 18,770,230 | | | | 2,272,633 | | | | 22,385,134 | | | | - | | | | 43,440,453 | |
| | | | | | | | | | | | | | | | | | | | | | | | | | | | | | | | | | | | | |
| Subsidiary equity interest acquired by noncontrolling interest | | | - | | | | - | | | | - | | | | - | | | | 877,892 | | | | (62,314 | ) | | | - | | | | 2,989,303 | | | | 3,804,882 | |
| Subsidiary capital injected by noncontrolling interest | | | - | | | | - | | | | - | | | | - | | | | - | | | | - | | | | - | | | | 469,147 | | | | 469,147 | |
| Conversion of convertible preferred stocks to common stocks | | | (175,000 | ) | | | (175 | ) | | | 175,000 | | | | 175 | | | | - | | | | - | | | | - | | | | - | | | | - | |
| Convertible preferred stocks issued for payment of preferred stock dividends | | | 66,379 | | | | 66 | | | | - | | | | - | | | | 212,354 | | | | - | | | | - | | | | - | | | | 212,420 | |
| Share-based compensation | | | - | | | | - | | | | - | | | | - | | | | 428,702 | | | | - | | | | - | | | | - | | | | 428,702 | |
| Common stocks issued for services | | | - | | | | - | | | | 40,000 | | | | 40 | | | | 77,960 | | | | - | | | | - | | | | - | | | | 78,000 | |
| Net changes in foreign currency translation adjustment | | | - | | | | - | | | | - | | | | - | | | | - | | | | 2,621,034 | | | | - | | | | 130,653 | | | | 2,751,687 | |
| Deconsolidation of the VIE Group | | | | | | | | | | | | | | | | | | | | | | | | | | | 3,770,889 | | | | (2,012,236 | ) | | | 1,758,653 | |
| Net earnings for the year ended December 31, 2011 | | | - | | | | - | | | | - | | | | - | | | | - | | | | - | | | | 17,335,442 | | | | (1,139,928 | ) | | | 16,195,514 | |
| Balance at December 31, 2011 | | | 1,997,467 | | | $ | 1,997 | | | | 10,564,774 | | | $ | 10,565 | | | $ | 20,367,138 | | | $ | 4,831,353 | | | $ | 43,491,465 | | | $ | 436,940 | | | $ | 69,139,458 | |
The accompanying notes are an integral part of these consolidated financial statements.
DEYU AGRICULTURE CORP AND SUBSIDIARIES
CONSOLIDATED STATEMENTS OF CASH FLOWS
| | | For The Years Ended | |
| | | December 31, | |
| | | 2011 | | | 2010 | |
| CASH FLOWS FROM OPERATING ACTIVITIES | | | | | | | | |
| Net income available to common stockholders | | $ | 17,335,442 | | | $ | 11,502,253 | |
| Loss from discontinued operations attributable to Deyu Agriculture Corp. | | | 2,790,575 | | | | 756,480 | |
| Adjustments to reconcile net income to net cash | | | | | | | | |
| provided by operating activities: | | | | | | | | |
| Depreciation & amortization | | | 979,297 | | | | 489,379 | |
| Share-based compensation | | | 428,702 | | | | 549,106 | |
| Preferred stock dividends accrued | | | 219,721 | | | | 232,642 | |
| Dividends paid with Series A preferred stock | | | 212,420 | | | | - | |
| Common stocks issued for services | | | 78,000 | | | | - | |
| Deferred income tax expense (benefit) | | | 184,384 | | | | (913,785 | ) |
| Noncontrolling interests | | | (38,673 | ) | | | - | |
| Loss on disposal of fixed assets | | | - | | | | 7,573 | |
| Decrease (increase) in current assets: | | | | | | | | |
| Accounts receivable | | | (23,824,017 | ) | | | (6,645,744 | ) |
| Related-parties trade receivable | | | (494,752 | ) | | | - | |
| Inventories | | | (2,873,705 | ) | | | (7,816,702 | ) |
| Advance to suppliers | | | (5,840,601 | ) | | | (947,913 | ) |
| Prepaid expense and other current assets | | | (539,339 | ) | | | (853,455 | ) |
| Increase (decrease) in liabilities: | | | | | | | | |
| Accounts payable | | | 1,584,038 | | | | 192,077 | |
| Advance from customers | | | 1,677,638 | | | | 6,284,419 | |
| Accrued expense and other liabilities | | | 346,492 | | | | 1,097,413 | |
| Net cash (used in) provided by operating activities of continuing operations | | | (7,774,378 | ) | | | 3,933,743 | |
| Net cash used in operating activities of discontinued operations | | | (3,858,325 | ) | | | (3,727,140 | ) |
| Net cash (used in) provided by operating activities | | | (11,632,703 | ) | | | 206,603 | |
| | | | | | | | | |
| CASH FLOWS FROM INVESTING ACTIVITIES | | | | | | | | |
| Purchase of machinery and equipment | | | (3,759,859 | ) | | | (1,987,716 | ) |
| Construction and remodeling of factory and warehouses | | | (109,856 | ) | | | (3,281,762 | ) |
| Purchase of software and other assets | | | (8,902 | ) | | | (960,175 | ) |
| Advances to related parties | | | (76,995 | ) | | | - | |
| Prepayments for acquisition of land use rights | | | (76,715 | ) | | | (6,889,032 | ) |
| Proceeds from disposal of fixed assets | | | - | | | | 274,727 | |
| Net cash used in investing activities of continuing operations | | | (4,032,327 | ) | | | (12,843,958 | ) |
| Net cash used in investing activities of discontinued operations | | | (2,476,523 | ) | | | (117,583 | ) |
| Net cash used in investing activities | | | (6,508,850 | ) | | | (12,961,541 | ) |
| | | | | | | | | |
| CASH FLOWS FROM FINANCING ACTIVITIES | | | | | | | | |
| Proceeds from capital contributions | | | 464,180 | | | | 1,831,718 | |
| Net proceeds from short-term loans from related parties | | | 3,101,839 | | | | 3,101,989 | |
| Cash restricted for credit line of bank acceptance notes | | | (1,802,568 | ) | | | - | |
| Release of cash restricted held at a trust account | | | 125,560 | | | | - | |
| Payment of preferred dividends | | | (243,678 | ) | | | - | |
| Net proceeds from short-term loans from bank | | | 11,349,219 | | | | - | |
| Net proceeds from short-term bank acceptance notes | | | 1,547,269 | | | | - | |
| Net proceeds from short-term loan from others | | | 952 | | | | (1,079,701 | ) |
| Net repayments of short-term loans from related parties | | | - | | | | (1,113,632 | ) |
| Proceeds from private placement, net of restricted cash held in escrow | | | - | | | | 8,827,123 | |
| Release of restricted cash related to private placement | | | - | | | | 298,848 | |
| Net cash provided by financing activities of continuing operations | | | 14,542,773 | | | | 11,866,345 | |
| Net cash used in financing activities of discontinued operations | | | 5,918,988 | | | | 4,277,243 | |
| Net cash used in financing activities | | | 20,461,761 | | | | 16,143,588 | |
| | | | | | | | | |
| EFFECT OF EXCHANGE RATE CHANGE ON CASH AND CASH EQUIVALENTS | | | 352,429 | | | | 204,593 | |
| | | | | | | | | |
| NET INCREASE IN CASH & CASH EQUIVALENTS | | | 2,672,637 | | | | 3,593,243 | |
| NET INCREASE IN CASH & CASH EQUIVALENTS FROM DISCONTINUED OPERATIONS | | | (403,208 | ) | | | 489,886 | |
| NET INCREASE IN CASH & CASH EQUIVALENTS FROM CONTINUING OPERATIONS | | | 3,075,845 | | | | 3,103,357 | |
| | | | | | | | | |
| CASH & CASH EQUIVALENTS, BEGINNING BALANCE | | | 5,665,858 | | | | 2,562,501 | |
| CASH & CASH EQUIVALENTS, ENDING BALANCE | | $ | 8,741,703 | | | $ | 5,665,858 | |
| | | | | | | | | |
| SUPPLEMENTAL DISCLOSURES: | | | | | | | | |
| Income tax paid | | $ | 62 | | | $ | - | |
| Interest paid | | $ | 809,448 | | | $ | 323,829 | |
| NONCASH INVESTING AND FINANCING ACTIVITIES: | | | | | | | | |
| Construction completed and transferred to property, plant, and equipment | | $ | 5,914,602 | | | $ | - | |
| Construction completed and transferred to land use rights | | $ | 2,320,904 | | | $ | - | |
| Obtained certificates of farmland use rights | | $ | 8,221,569 | | | $ | - | |
The accompanying notes are an integral part of these consolidated financial statements.
DEYU AGRICULTURE CORP AND SUBSIDIARIES
NOTES TO CONSOLIDATED FINANCIAL STATEMENTS
| NOTE 1. | NATURE OF BUSINESS AND BASIS OF FINANCIAL STATEMENT PREPARATION |
Deyu Agriculture Corp. (the “Company”), formerly known as Eco Building International, Inc., was incorporated under the laws of the State of Nevada on December 23, 2008. We completed the acquisition of City Zone Holdings Limited (“City Zone”), an agricultural products distributor in the Shanxi Province of the People’s Republic of China (the “PRC”) engaged in procuring, processing, marketing, and distributing various grain and corn products, by means of a share exchange, effective April 27, 2010. As a result of the share exchange, City Zone became our wholly-owned subsidiary. We currently conduct our business primarily through the operating PRC subsidiaries, including Jinzhong Deyu Agriculture Trading Co., Ltd. (“Jinzhong Deyu”), Jinzhong Yuliang Agriculture Trading Co., Ltd. (“Jinzhong Yuliang”), Jinzhong Yongcheng Agriculture Trading Co., Ltd. (“Jinzhong Yongcheng”), Shanxi Taizihu Food Co., Ltd. (“Taizihu”) and Shanxi HuiChun Bean Products Co., Ltd. (“Huichun” and together with Taizihu, the “Taizihu Group”, see Note 20) and Betian Yu Biotechnology (Beijing) Co., Ltd. (“Detian Yu”) and its subsidiaries.
On May 11, 2010, our Board of Directors adopted a resolution to change our name to "Deyu Agriculture Corp." FINRA declared the name change effective on June 2, 2010.
Reverse Acquisition
On April 27, 2010, we entered into a Share Exchange Agreement (“Share Exchange”) under which we issued 8,736,932 shares of common stock, par value $0.001 per share, to Expert Venture Limited (“Expert Venture”), a company organized under the laws of the British Virgin Islands, and the other shareholders of City Zone (“the “City Zone Shareholders”). As a result of the Share Exchange, City Zone became our wholly-owned subsidiary and City Zone Shareholders acquired a majority of our issued and outstanding common stocks. Concurrent with the Share Exchange, Mr. Jianming Hao (“Mr. Hao”), the managing director of City Zone and all of its operating subsidiaries, was appointed our Chief Executive Officer.
As a result, the Share Exchange has been accounted for as a reverse acquisition using the purchase method of accounting, whereby City Zone is deemed to be the accounting acquirer (legal acquiree) and we are to be the accounting acquiree (legal acquirer). The financial statements before the date of the Share Exchange are those of City Zone with our results being consolidated from the date of the Share exchange. The equity section and earnings per share have been retroactively restated to reflect the reverse acquisition and no goodwill has been recorded.
City Zone was incorporated in the British Virgin Islands on July 27, 2009 under the BVI Business Companies Act, 2004. In November 2009, pursuant to a restructuring plan set out below, City Zone has become the holding company of a group of companies comprising Most Smart, Shenzhen Redsun, Shenzhen JiRuHai, Beijing Detian Yu, Jinzhong Deyu, Jinzhong Yongcheng, and Jinzhong Yuliang.
Restructuring
In November 2009, pursuant to a restructuring plan (“Restructuring”) intended to ensure compliance with the PRC rules and regulations, City Zone, through a series of acquisitions and wholly-owned subsidiaries, acquired 100% equity interests in Jinzhong Deyu, Jinzheng Yuliang, and Jinzhong Yongcheng. The former shareholders and key management of Jinzhong Deyu, Jinzhong Yongcheng, and Jinzhong Yuliang became the ultimate controlling parties and key management of City Zone. This restructuring exercise has been accounted for as a recapitalization of Jinzhong Deyu, Jinzhong Yongcheng, and Jinzhong Yuliang with no adjustment to the historical basis of the assets and liabilities of these companies, while the historical financial positions and results of operations are consolidated as if the restructuring occurred as of the beginning of the earliest period presented in the accompanying consolidated financial statements. For the purpose of consistent and comparable presentation, the consolidated financial statements have been prepared as if City Zone had been in existence since the beginning of the earliest and throughout the whole periods covered by these consolidated financial statements.
Variable Interest Entities
On November 16, 2010, Detian Yu entered into a series of contractual arrangements (the “Contractual Arrangements”) with each of Beijing Jundaqianyuan Investment Management Co., Ltd. (“Junda”), Jinzhong Longyue Investment Consultancy Services Co., Ltd. (“Longyue”), and their shareholders, pursuant to which Detian Yu effectively took over management of the business activities of Junda and Longyue.
Junda is a limited liability company incorporated in the PRC on June 13, 2010 with registered capital of $14,637 (or RMB 100,000) by Jianming Hao, Chairman and Chief Executive Officer of the Company, and Wenjun Tian, President and Executive Director of the Company. As of December 31, 2010, Junda’s equity interest was 100% held by several executives and managers of the Company, including (a) Jianming Hao, owning 33% of Junda, (b) Wenjun Tian, owning 34% of Junda, (c) Jianbin Zhou, the Chief Operating Officer of the Company, owning 10% of Junda, (d) Li Ren, Vice President of Branding and Marketing of the Company, owning 5% of Junda, (e) Yongqing Ren, Vice President of the Corn Division of the Company, owning 3% of Junda and (f) Junde Zhang, Vice President of the Grains Division of the Company, owning 3% of Junda. As a result, the execution of the Contractual Arrangements with Junda is considered a related party transaction.
The Contractual Arrangements are comprised of a series of agreements with a term of ten (10) years, including:
| · | Exclusive Management and Consulting Service Agreements, through which Detian Yu shall provide to each of Junda and Longyue management consulting services in relation to the business of Junda and Longyue in exchange for 35% of the net income after taxes of Junda and Longyue every fiscal year. |
| · | Business Cooperation Agreements, through which Detian Yu shall provide business cooperation opportunities and services including clients, cooperation partners and market information in the fields of grain processing, sales and financing to each of Junda and Longyue in exchange for cooperation fees and commissions from each of Junda and Longyue equal to 65% of the net income after tax of each of Junda and Longyue in every fiscal year. |
| · | Business Operations Agreements, through which Detian Yu has exclusive authority of all decision-making of ongoing operations, including establishing compensation levels and hiring and firing of key personnel. In order to ensure normal operation of Junda and Longyue, Detian Yu agrees to act as the guarantor and provide guarantee on the performance of the obligations of Junda and Longyue under all contracts executed by Junda and Longyue. |
| · | Share Pledge Agreements, through which the shareholders of Junda and Longyue have agreed to pledge all of their respective equity interests in Junda or Longyue (as the case may be) as security for the performance of all of the obligations or debts under the Exclusive Management and Consulting Service Agreements and Business Cooperation Agreements assumed by Junda and Longyue, and under a counter-guarantee to all the payments made by Detian Yu for the performance of the guarantees assumed by Detian Yu under the Business Operation Agreements. |
| · | Power of Attorney, signed by each of the shareholders of Junda and Longyue, authorizes a designee appointed by Detian Yu to exercise all of their respective voting rights as a shareholder. |
| · | Equity Acquisition Option Agreements, through which the shareholders of Junda and Longyue granted Detian Yu an irrevocable and unconditional right to purchase, or cause a designated party of Detian Yu to purchase, part or all of the equity interests in Junda and Longyue from such shareholders, when and to the extent that, applicable PRC laws permit. The consideration for the equity acquisition option for Junda is RMB 80,000,000 and the consideration for the equity option for Longyue is RMB 120,000,000. |
On February 21, 2011, Deyufarm received capital injection of $3,800,505 (RMB 24,971,218) from SBCVC Fund III Company Limited ("SBCVC"), a company organized under the laws of Hong Kong, in exchange for 35.69% of Deyufarm's equity interest pursuant to the two Investment and Relevant Issues Agreements entered into by each of Junda and Longyue with Deyufarm and SBCVC on September 15, 2010. According to the Investment and Relevant Issues Agreements, SBCVC shall invest an equivalent of RMB 25,000,000 of US dollars to Deyufarm. Before or in the meantime that SBCVC completes such investment to Deyufarm, Longyue shall have invested RMB 35,000,000 to Deyufarm through a capital increase and obtained the relevant capital verification report. Any time within 2 years after completing an investment to Deyufarm, SBCVC has the right to require Deyufarm to repurchase in advance, or Junda or Longyue to purchase part of or all the equity interests of Deyufarm owned by SBCVC. The board of directors of Deyufarm shall be comprised of 3 directors, and Junda, Longyue and SBCVC shall each nominate one director. The board of directors shall nominate a financial administrator agreed to by SBCVC. Forty-eight (48) months after SBCVC completes its investment in Deyufarm, the parties shall consummate a qualified IPO of Deyufarm.
On February 25, 2011, Deyufarm received an additional capital injection of $4,495 (RMB 28,782) from SBCVC for 0.02% of Deyufarm's equity interest.
After the above two capital injections, SBCVC, Junda and Longyue currently own 35.71%, 14.29% and 50% of the equity interests in Deyufarm, respectively. The total registered capital of Deyufarm increased from $6,688,635 (RMB45,000,000) to $10,493,516 (RMB 70,000,000). SBCVC’s 35.71% equity interest in Deyufarm.
On December 20, 2011, Detian Yu entered into a series of termination agreements (collectively, the “Termination Agreements”) with each of Junda, Longyue and their shareholders, pursuant to which Detian Yu gave up the control management of the business activities of Junda and Longyue. According to the Termination Agreements, each side agreed to terminate the Contractual Arrangements entered into on November 16, 2010.
Consolidation Scope:
Details of our subsidiaries subject to consolidation are as follows:
| | | Domicile and | | | | Percentage | | |
| | | Date of | | Registered | | of | | |
| Name of Subsidiary | | Incorporation | | Capital | | Ownership | | Principal Activities |
| City Zone Holdings Limited ("City Zone") | | British Virgin Islands, July 27, 2009 | | $20,283,581 | | 100% | | Holding company of Most Smart |
| | | | | | | | | |
| Most Smart International Limited ("Most Smart") | | Hong Kong,March 11, 2009 | | $1 | | 100% | | Holding company of Shenzhen Redsun |
| | | | | | | | | |
| Redsun Technology (Shenzhen) Co., Ltd. ("Shenzhen Redsun") | | The PRC, August 20, 2009 | | $30,000 | | 100% | | Holding company of Shenzhen JiRuHai, Taizhihu and Huichun |
| | | | | | | | | |
| Shenzhen JiRuHai Technology Co., Ltd.("Shenzhen JiRuHai") | | The PRC, August 20, 2009 | | $14,638 | | 100% | | Holding company of Beijing Detian Yu |
| | | | | | | | | |
| Detian Yu Biotechnology (Beijing) Co., Ltd. ("Detian Yu") | | The PRC, November 30, 2006 | | $7,637,723 | | 100% | | Wholesale distribution of simple-processed and deep-processed packaged food products and staple food. Holding company of the following first five entities |
| | | | | | | | | |
| Jinzhong Deyu Agriculture Trading Co., Ltd. ("Jinzhong Deyu") | | The PRC, April 22, 2004 | | $1,492,622 | | 100% | | Organic grains preliminary processing and wholesale distribution |
| | | | | | | | | |
| Jinzhong Yongcheng Agriculture Trading Co., Ltd. ("Jinzhong Yongcheng") | | The PRC, May 30, 2006 | | $1,025,787 | | 100% | | Corns preliminary processing and wholesale |
| | | | | | | | | |
| Jinzhong Yuliang Agriculture Trading Co., Ltd. ("Jinzhong Yuliang") | | The PRC, March 17, 2008 | | $1,019,516 | | 100% | | Corns preliminary processing and wholesale distribution |
| | | | | | | | | |
| Tianjin Guandu Food Co., Ltd. ("Tianjin Guandu") (1) | | The PRC, June 21, 2011 | | $1,544,497 | | 100% | | Wholesale distribution of simple-processed and deep-processed packaged food products and staple food |
| | | | | | | | | |
| Hebei Yugu Grain Co., Ltd. ("Hebei Yugu") | | The PRC, July 25, 2011 | | $1,563,824 | | 70% | | Wholesale distribution of grain products and operating or acting as an agent of import & export business for grain products |
| | | | | | | | | |
| Beijing Jundaqianyuan Investment Management Co., Ltd. ("Junda")(2) | | The PRC, June 13, 2010 | | $14,637 | | Variable interest | | Shareholding of Deyufarm (14.29%) |
| | | | | | | | | |
| Jinzhong Longyue Investment Consultancy Services Co., Ltd. ("Longyue")(2) | | The PRC, June 2, 2010 | | $4,393 | | Variable interest | | Shareholding of Deyufarm (50%) |
| | | | | | | | | |
| Deyufarm Innovation Food (Beijing) Co., Ltd. ("Deyufarm")(2) | | The PRC, June 13, 2010 | | $10,493,516 | | Variable interest | | Wholesale distribution of packaged food products and instant millet beverage. Holding company of the following two companies |
| | | | | | | | | |
| Sichuan HaoLiangXin Instant Food Co., Ltd. ("HaoLiangXin")(2) | | The PRC, April 25, 2008 | | $1,202,460 | | Variable interest | | Manufacturing and wholesale distribution of instant grain vermicelli and buckwheat tea products |
| | | | | | | | | |
| Beijing Xinggu Deyufarm Food Co., Ltd. ("Xinggu Deyufarm")(2) | | The PRC, November 25, 2010 | | $1,515,152 | | Variable interest | | Manufacturing of instant grain vermicelli products |
| | | | | | | | | |
| Shanxi Taizihu Food Co., Ltd. (“Taizihu”) (3) | | The PRC, July 27, 2003 | | $1,208,233 | | 100% | | producing and selling fruit beverages and soybean products |
| | | | | | | | | |
| Shanxi HuiChun Bean Products Co., Ltd. (“Huichun”)(3) | | The PRC, September 2, 2007 | | $2,636,192 | | 100% | | producing and selling fruit beverages and soybean products |
| | | | | | | | | |
| (1) Tianjing Guandu Food Co., Ltd, ("Tianjing Guandu"), previously was Tianjing Detianyu Food Co., Ltd. changed its company name and completed the name change registration on October 24, 2011. |
| | | | | | | | | |
| (2) Detian Yu terminated its control over the Junda, Longyue, Deyufarm, Haoliangxin, Xinggu Deyufarm, (collectively, the “VIE Group”) on December 20, 2011. The operation results of the VIE Group are included in the consolidated financial statements from January 1 to December 20, 2011 |
| | | | | | | | | |
| (3) Taizihu and Huichun became the wholly-owned subsidiaries of the Company on February 2, 2012 through a business acquisition (see Note 20), but they are not within the consolidation scope as of December 31, 2011 |
| NOTE 2. | SUMMARY OF SIGNIFICANT ACCOUNTING POLICIES |
Basis of presentation
The accompanying consolidated financial statements include the financial statements of Deyu Agriculture Corp., its subsidiaries, and those variable interest entities where the Company is the primary beneficiary. All significant intercompany account balances and transactions have been eliminated in consolidation. Results of operations of companies purchased are included from the dates of acquisition.
These consolidated financial statements have been prepared in accordance with accounting principles generally accepted in the United States of America. The Company’s function currency is the Chinese Yuan, or Renminbi (“RMB”); however, the accompanying consolidated financial statements have been translated and presented in United States Dollars (“USD”).
On April 27, 2010, as a result of the consummation of the Share Exchange, we changed our fiscal year end from May 31 to December 31 to conform to the fiscal year end of City Zone.
Use of estimates
The preparation of the consolidated financial statements in conformity with generally accepted accounting principles requires management to make estimates and assumptions that affect the reported amounts of assets and liabilities and disclosure of contingent assets and liabilities at the date of the financial statements and the reported amounts of revenues and expenses during the reporting period. Management makes its estimates based on historical experience and various other assumptions and information that are available and believed to be reasonable at the time the estimates are made. Therefore, actual results could differ from those estimates under different assumptions and conditions.
Cash and cash equivalents
Cash and cash equivalents consist of cash on hand, cash in bank and all highly liquid investments with original maturities of three months or less.
As a result of the financings associated with the reverse merger, we had, as of December 31, 2010, $125,560 in a trust account. The use of these funds requires the written approval of our placement agent and us. The funds in the escrow account were designated for certain expenses, such as investor relations, accounting/consulting fees, SEC fees, and stock transfer agent fees. This amount was classified as restricted cash under current assets on our balance sheet as of December 31, 2010, while the restriction has been released in 2011.
As of December 31, 2011, $1,588,840 of cash was restricted as a pledge for $1,588,840 (RMB 10,000,000) of notes payable obtained from Jinzhong City Yuci District Rural Credit Union Co., Ltd. in August 2011 and $262,159 of cash was restricted as a pledge for $ 2,121,101 (RMB 13,350,000) of bank loan obtained from China Merchants Bank at Dongzhimen branch in November 2011.
Accounts receivable
Accounts receivable are recorded at net realizable value consisting of the carrying amount less allowance for doubtful accounts, as needed. We assess the collectability of accounts receivable based primarily upon the creditworthiness of the customer as determined by credit checks and analysis, as well as the customer’s payment history. Management reviews the composition of accounts receivable and analyzes historical bad debts, customer concentrations, customer credit worthiness, current economic trends, and changes in customer payment patterns to evaluate the adequacy of these reserves. As of December 31, 2011 and 2010, there were no customers with accounts receivable greater than six months past due.
Inventories
The Company's inventories are stated at lower of cost or market. Cost is determined on moving-average basis. Costs of inventories include purchase and related costs incurred in delivering the products to their present location and condition. Market value is determined by reference to selling prices after the balance sheet date or to management’s estimates based on prevailing market conditions. Management periodically evaluates the composition of its inventories at least quarterly to identify slow-moving and obsolete inventories to determine if valuation allowance is required. As of December 31, 2011 and 2010, management had identified no slow moving or obsolete inventory. For the years ended December 31, 2011 and 2010, loss on reduction of inventory to the lower of cost or market was $56,140 and $0, respectively.
Assets held for sales
A long-lived asset to be sold shall be classified as held for sale in the period in which all of the following criteria are met: (a) Management, having the authority to approve the action, commits to a plan to sell the asset. (b) The asset is available for immediate sale in its present condition subject only to terms that are usual and customary for sales of such assets. (c) An active program to locate a buyer and other actions required to complete the plan to sell the asset have been initiated. (d) The sale of the asset is probable, and transfer of the asset is expected to qualify for recognition as a completed sale, within one year, except as permitted by paragraph ASC 360-10-45-11. The term probable refers to a future sale that is likely to occur. (e) The asset is being actively marketed for sale at a price that is reasonable in relation to its current fair value. The price at which a long-lived asset is being marketed is indicative of whether the entity currently has the intent and ability to sell the asset. A market price that is reasonable in relation to fair value indicates that the asset is available for immediate sale, whereas a market price in excess of fair value indicates that the asset is not available for immediate sale. (f) Actions required to complete the plan indicate that it is unlikely that significant changes to the plan will be made or that the plan will be withdrawn.
A loss shall be recognized for any initial or subsequent write-down to fair value less cost to sell. A gain shall be recognized for any subsequent increase in fair value less cost to sell, but not in excess of the cumulative loss previously recognized (for a write-down to fair value less cost to sell). The loss or gain shall adjust only the carrying amount of a long-lived asset, whether classified as held for sale individually or as part of a disposal group.
Property, plant, and equipment
Property, plant, and equipment are stated at cost less accumulated depreciation. Expenditures for maintenance and repairs are charged to earnings as incurred; additions, renewals and betterments are capitalized. When property, plant, and equipment are retired or otherwise disposed of, the related cost and accumulated depreciation are removed from the respective accounts, and any gain or loss is included in operations.
Depreciation is computed using the straight-line method over the estimated useful lives of the assets as follows:
| | | Useful Life
(in years) | |
| Automobiles | | 5 | |
| Buildings | | 10-30 | |
| Office equipment | | 5 | |
| Machinery and equipment | | 5-10 | |
| Furniture & fixtures | | 5 | |
Construction-in-progress
Construction-in-progress consists of amounts expended for warehouse construction. Construction-in-progress is not depreciated until such time as the assets are completed and put into service. Once warehouse construction is completed, the cost accumulated in construction-in-progress is transferred to property, plant, and equipment.
Long-lived assets
The Company applies the provisions of FASB ASC Topic 360 (ASC 360), "Property, Plant, and Equipment" which addresses financial accounting and reporting for the impairment or disposal of long-lived assets. The Company periodically evaluates the carrying value of long-lived assets to be held and used in accordance with ASC 360, at least on an annual basis. ASC 360 requires the impairment losses to be recorded on long-lived assets used in operations when indicators of impairment are present and the undiscounted cash flows estimated to be generated by those assets are less than the assets' carrying amounts. In that event, a loss is recognized based on the amount by which the carrying amount exceeds the fair market value of the long-lived assets. Loss on long-lived assets to be disposed of is determined in a similar manner, except that fair market values are reduced for the cost of disposal.
Goodwill and intangible assets
Good is calculated as the purchase premium after adjusting for the fair value of net assets acquired. Goodwill is not amortized but is reviewed for potential impairment on an annual basis, or when events or circumstances indicate a potential impairment, at the reporting unit level. A reporting unit, as defined under applicable accounting guidance, is a business segment or one level below a business segment. Under applicable accounting guidance, the goodwill impairment analysis is a two-step test. The first step of the goodwill impairment test involves comparing the fair value of each reporting unit with its carrying amount including goodwill. If the fair value of the reporting unit exceeds its carrying amount, goodwill of the reporting unit is considered not impaired; however, if the carrying amount of the reporting unit exceeds its fair value, the second step must be performed to measure potential impairment.
The second step involves calculating an implied fair value of goodwill for each reporting unit for which the first step indicated possible impairment. The implied fair value of goodwill is determined in the same manner as the amount of goodwill recognized in a business combination, which is the excess of the fair value of the reporting unit, as determined in the first step, over the aggregate fair values of the assets, liabilities and identifiable intangibles as if the reporting unit was being acquired in a business combination. Measurement of the fair values of the assets and liabilities of a reporting unit is consistent with the requirements of the fair value measurements accounting guidance, which defines fair value as the price that would be received to sell an asset or paid to transfer a liability in an orderly transaction between market participants at the measurement date. The adjustments to measure the assets, liabilities, and intangibles at fair value are for the purpose of measuring the implied fair value of goodwill and such adjustments are not reflected in the consolidation balance sheet. If the implied fair value of goodwill exceeds the goodwill assigned to the reporting unit, there is no impairment. If the goodwill assigned to a reporting unit exceeds the implied fair value of goodwill, an impairment charge is recorded for the excess. An impairment loss recognized cannot exceed the amount of goodwill assigned to a reporting unit. An impairment loss establishes a new basis in the goodwill and subsequent reversals of goodwill impairment losses are not permitted under applicable accounting guidance.
The goodwill in the amount of $1,103,309 recorded in the consolidated balance sheet of the VIE Group as of December 31, 2010 (see Note 3) was generated from the acquisition of Haoliangxin by Deyufarm on July 24, 2010. In 2010, goodwill was tested for impairment and it was determined that goodwill was not impaired as of December 31, 2010. Pursuant to the Termination Agreements for the VIE Group, the Company deconsolidated the VIE Group and no goodwill was presented on the consolidated balance sheets as of December 31, 2011 and 2010 of the Company after reclassification of the assets and liabilities of discontinued operations.
For intangible assets subject to amortization, an impairment loss is recognized if the carrying amount of the intangible asset is not recoverable and exceeds fair value. The carrying amount of the intangible asset is considered not recoverable if it exceeds the sum of the undiscounted cash flows expected to result from the use of the asset.
Fair value measurements
FASB ASC 820, “Fair Value Measurements” (formerly SFAS No. 157) defines fair value for certain financial and nonfinancial assets and liabilities that are recorded at fair value, establishes a framework for measuring fair value, and expands disclosures about fair value measurements. It requires that an entity measure its financial instruments to base fair value on exit price and maximize the use of observable units and minimize the use of unobservable inputs to determine the exit price. It establishes a hierarchy which prioritizes the inputs to valuation techniques used to measure fair value. This hierarchy increases the consistency and comparability of fair value measurements and related disclosures by maximizing the use of observable inputs and minimizing the use of unobservable inputs by requiring that observable inputs be used when available. Observable inputs are inputs that reflect the assumptions market participants would use in pricing the assets or liabilities based on market data obtained from sources independent of the Company. Unobservable inputs are inputs that reflect the Company’s own assumptions about the assumptions market participants would use in pricing the asset or liability developed based on the best information available in the circumstances. The hierarchy prioritizes the inputs into three broad levels based on the reliability of the inputs as follows:
| · | Level 1 – Inputs are quoted prices in active markets for identical assets or liabilities that the Company has the ability to access at the measurement date. Valuation of these instruments does not require a high degree of judgment as the valuations are based on quoted prices in active markets that are readily and regularly available. |
| · | Level 2 – Inputs other than quoted prices in active markets that are either directly or indirectly observable as of the measurement date, such as quoted prices for similar assets or liabilities; quoted prices in markets that are not active; or other inputs that are observable or can be corroborated by observable market data for substantially the full term of the assets or liabilities. |
| · | Level 3 – Valuations based on inputs that are unobservable and not corroborated by market data. The fair value for such assets and liabilities is generally determined using pricing models, discounted cash flow methodologies, or similar techniques that incorporate the assumptions a market participant would use in pricing the asset or liability. |
This guidance applies to other accounting pronouncements that require or permit fair value measurements. On February 12, 2008, the FASB finalized FASB Staff Position (FSP) No. 157-2, Effective Date of FASB Statement No. 157 (ASC 820). This Staff Position delays the effective date of SFAS No. 157 (ASC 820) for nonfinancial assets and liabilities to fiscal years beginning after November 15, 2008 and interim periods within those fiscal years, except for those items that are recognized or disclosed at fair value in the financial statements on a recurring basis (at least annually). The adoption of SFAS No. 157 (ASC 820) had no effect on the Company's financial position or results of operations.
We also analyze all financial instruments with features of both liabilities and equity under ASC 480-10 (formerly SFAS 150, “Accounting for Certain Financial Instruments with Characteristics of Both Liabilities and Equity”) and ASC 815-40 (formerly EITF 00-19, “Accounting for Derivative Financial Instruments Indexed to, and Potentially Settled in, a Company’s Own Stock”). We have determined ASC 480-10 (formerly SFAS 150) and ASC 815-40 (formerly EITF 00-19) has no material effect on our financial position or results of operations.
Revenue recognition
The Company’s revenue recognition policies are in compliance with the SEC Staff Accounting Bulletin No. 104 (“SAB 104”). The Company recognizes product revenue when the following fundamental criteria are met: (i) persuasive evidence of an arrangement exists, (ii) delivery has occurred, (iii) our price to the customer is fixed or determinable and (iv) collection of the resulting accounts receivable is reasonably assured. The Company recognizes revenue for product sales upon transfer of title to the customer. Customer purchase orders and/or contracts are generally used to determine the existence of an arrangement. Shipping documents and the completion of any customer acceptance requirements, when applicable, are used to verify product delivery or that services have been rendered. The Company assesses whether a price is fixed or determinable based upon the payment terms associated with the transaction and whether the sales price is subject to refund or adjustment.
The Company’s revenue is recognized net of value-added tax (VAT), reductions to revenue for estimated product returns, and sales discounts based on volume achieved in the same period that the related revenue is recorded. The estimates are based on historical sales returns, analysis of credit memo data, and other factors known at the time. For the years ended December 31, 2011 and 2010, sales discounts from continuing operations were $70,987 and $0, respectively.
We offer a right of exchange on our grain products sold through our relationship with grocery store networks. The consumer who purchases the product may exchange it for the same kind and quantity of product originally purchased. In accordance with FASB ASC 605-15-25-1 and 605-15-15-2, these are not considered returns for revenue recognition purposes. For the years ended December 31, 2011 and 2010, the returns of our product were not material.
Advertising costs
The Company expenses the cost of advertising as incurred or, as appropriate, the first time the advertising takes place. Advertising costs from continuing operations for the year ended December 31, 2011 and 2010 were $952,472 and $83,576 respectively.
Research and development
The Company expenses its research and development costs as incurred. Research and development costs from continuing operations for the years ended December 31, 2011 and 2010 were $98,393 and $73,860, respectively.
Stock-based compensation
In December 2004, the Financial Accounting Standard Board, or the FASB, issued the Statement of Financial Accounting Standards, or SFAS, No. 123(R), “Share-Based Payment”, which replaces SFAS No. 123 and supersedes APB Opinion No. 25. SFAS No. 123(R) is now included in the FASB’s ASC Topic 718, “Compensation – Stock Compensation.” Under SFAS No. 123(R), companies are required to measure the compensation costs of share-based compensation arrangements based on the grant-date fair value and recognize the costs in the financial statements over the period during which employees or independent contractors are required to provide services. Share-based compensation arrangements include stock options and warrants, restricted share plans, performance-based awards, share appreciation rights and employee share purchase plans. In March 2005, the SEC issued Staff Accounting Bulletin No. 107, or SAB 107, which expresses views of the staff regarding the interaction between SFAS No. 123(R) and certain SEC rules and regulations and provides the staff’s views regarding the valuation of share-based payment arrangements for public companies. SFAS No. 123(R) permits public companies to adopt its requirements using one of two methods. On April 14, 2005, the SEC adopted a new rule amending the compliance dates for SFAS No. 123(R). Companies may elect to apply this statement either prospectively, or on a modified version of retrospective application under which financial statements for prior periods are adjusted on a basis consistent with the pro forma disclosures required for those periods under SFAS No. 123.
The Company has fully adopted the provisions of FASB ASC 718 and related interpretations as provided by SAB 107. As such, compensation cost is measured on the date of grant as the fair value of the share-based payments. Such compensation amounts, if any, are amortized over the respective vesting periods of the option grant.
Income taxes
The Company accounts for income taxes in accordance with FASB ASC Topic 740, “Income Taxes.” ASC 740 requires a company to use the asset and liability method of accounting for income taxes, whereby deferred tax assets are recognized for deductible temporary differences, and deferred tax liabilities are recognized for taxable temporary differences. Temporary differences are the differences between the reported amounts of assets and liabilities and their tax bases. Deferred tax assets are reduced by a valuation allowance when, in the opinion of management, it is more likely than not that some portion, or all of, the deferred tax assets will not be realized. Deferred tax assets and liabilities are adjusted for the effects of changes in tax laws and rates on the date of enactment.
Under ASC 740, a tax position is recognized as a benefit only if it is “more likely than not” that the tax position would be sustained in a tax examination, with a tax examination being presumed to occur. The amount recognized is the largest amount of tax benefit that is greater than 50% likely of being realized on examination. For tax positions not meeting the “more likely than not” test, no tax benefit is recorded. The adoption had no effect on the Company’s consolidated financial statements.
Foreign currency translation and comprehensive income
U.S. GAAP requires that recognized revenue, expenses, gains and losses be included in net income. Certain statements, however, require entities to report specific changes in assets and liabilities, such as gain or loss on foreign currency translation, as a separate component of the equity section of the balance sheet. Such items, along with net income, are components of comprehensive income. The functional currency of the Company is Renminbi (“RMB”). The unit of RMB is in Yuan. Translation gains are classified as an item of other comprehensive income in the stockholders’ equity section of the consolidated balance sheet.
Statement of cash flows
In accordance with FASB ASC Topic 230, “Statement of Cash Flows,” cash flows from the Company’s operations are calculated based upon the local currencies. As a result, amounts related to assets and liabilities reported on the consolidated statement of cash flows will not necessarily agree with changes in the corresponding balances on the consolidated balance sheets.
Discontinued operations
Certain prior period amounts have been reclassified in these consolidated financial statements to conform to the 2011 presentation of discontinued operations of the VIE Group for the deep processed grain business. See Note 1 and 3 for additional information.
Reclassifications
Except for the classification for discontinued operations, certain classifications have been made to the prior year financial statements to conform to the current year presentation. The reclassifications have no impact on the Company’s 2010 consolidated statement of operations and retained earnings.
Recent pronouncements
In January 2010, FASB issued an amendment regarding improving disclosures about fair value measurements. This new guidance requires some new disclosures and clarifies some existing disclosure requirements about fair value measurement. The new disclosures and clarifications of existing disclosures are effective for interim and annual reporting periods beginning after December 15, 2009, except for the disclosures about purchases, sales, issuances and settlements in the roll forward of activity in Level 3 fair value measurements. Those disclosures are effective for fiscal years beginning after December 15, 2010 and for interim periods within those fiscal years. There was no impact from the adoption of this guidance to our consolidated financial position or results of operations as the amendment only addresses disclosures.
In April 2010, FASB issued an amendment to Stock Compensation. The amendment clarifies that an employee stock-based payment award with an exercise price denominated in the currency of a market in which a substantial portion of the entity’s equity shares trades should not be considered to contain a condition that is not a market, performance, or service condition. Therefore, an entity would not classify such an award as a liability if it otherwise qualifies as equity. The amendments are effective for fiscal years, and interim periods within those fiscal years, beginning on or after December 15, 2010. The adoption of this guidance had no impact on our consolidated financial position or results of operations since our stock-based payment awards have an exercise price denominated in the same currency of the market in which our Company shares are traded.
In May 2011, FASB issued an amendment (ASU No. 2011-04) to Fair Value Measurement (ASC Topic 820). In 2006, the FASB and the International Accounting Standards Board (IASB) published a Memorandum of Understanding, which has served as the foundation of the Board’s efforts to a common set of high quality global accounting standards. Consistent with the Memorandum of Understanding and the Board’s commitment to achieving the goal, the amendments in this Update are the result of the work by the FASB and the IASB to develop common requirements for measuring fair value and for disclosing information about fair value measurements in accordance with U.S. GAAP and IFRS. The adoption of this guidance had no impact on our consolidated financial position or results of operations.
In May 2011, FASB issued an amendment (ASU No. 2011-05) to Comprehensive Income (ASC Topic 220). The amendment require that all nonowner changes in stockholders’ equity be presented either in a single continuous statement of comprehensive income or in two separate but consecutive statements. In the two-statement approach, the first statement should present total net income and its components followed consecutively by a second statement that should present total other comprehensive income, the components of other comprehensive income, and the total of comprehensive income. The Company had adopted this guidance to our consolidated financial statements as of and for the year ended December 31, 2011.
In September 2011, FASB issued an amendment (ASU No. 2011-08) to Intangibles–Goodwill and Other (ASC Topic 350). The amendments in the Update permit an entity to first assess qualitative factors to determine whether it is more likely than not that the fair value of a reporting unit is less than its carrying amount as a basis for determining whether it is necessary to perform the two-step goodwill impairment test described in Topic 350. If, after assessing the totality of events or circumstances, an entity determines it is not more likely than not that the fair value of a reporting unit is less than its carrying amount, then performing the two-step impairment test is unnecessary. However, if an entity concludes otherwise, then it is required to perform the first step of the two-step impairment test by calculating the fair value of the reporting unit and comparing the fair value with the carrying amount of the reporting unit, as described in paragraph 350-20-35-4. If the carrying amount of a reporting unit exceeds its fair value, then the entity is required to perform the second step of the goodwill impairment test to measure the amount of the impairment loss, if any, as described in paragraph 350-20-35-9. The Company had adopted this guidance to our consolidated financial statements as of and for the year ended December 31, 2011.
In December 2011, FASB issued an Update (ASU No. 2011-10) to Property, Plant, and Equipment (ASC Topic 360). Under the amendments in this Update, when a parent (reporting entity) ceases to have a controlling financial interest (as described in Subtopic 810-10) in a subsidiary that is in substance real estate as a result of default on the subsidiary’s nonrecourse debt, the reporting entity should apply the guidance in Subtopic 360-20 to determine whether it should derecognize the in substance real estate. Generally, a reporting entity would not satisfy the requirements to derecognize the in substance real estate before the legal transfer of the real estate to the lender and the extinguishment of the related nonrecourse indebtedness. That is, even if the reporting entity ceases to have a controlling financial interest under Subtopic 810-10, the reporting entity would continue to include the real estate, debt, and the results of the subsidiary’s operations in its consolidated financial statements until legal title to the real estate is transferred to legally satisfy the debt. The adoption of this guidance had no impact on our consolidated financial position or results of operations.
In December 2011, FASB issued an Update (ASU No. 2011-11) to Balance Sheet (ASC Topic 210) regarding disclosures about offsetting assets and liabilities. Pursuant to this Update, entities are required to disclose both gross information and net information about both instruments and transactions eligible for offset in the statement of financial position and instruments and transactions subject to an agreement similar to a master netting arrangement. This scope would include derivatives, sale and repurchase agreements and reverse sale and repurchase agreements, and securities borrowing and securities lending arrangements. The adoption of this guidance had no impact on our consolidated financial position or results of operations.
| NOTE 3. | DISCONTINUED OPERATIONS |
On December 20, 2011, Detian Yu terminated its control over the VIE Group (see Note 2). The results of the VIE Group have been presented as a discontinued operation in the consolidated statements of operations. Selected operating results for the discontinued business are presented in the following tables:
| | | For The Years Ended | |
| | | December 31, | |
| | | 2011 | | | 2010 | |
| Net revenue | | $ | 15,276,475 | | | $ | 4,000,749 | |
| Cost of goods sold | | | (12,256,832 | ) | | | (3,671,177 | ) |
| Selling, general, and administrative expenses | | | (8,251,364 | ) | | | (1,341,563 | ) |
| Interest (expense) income, net | | | 5,478 | | | | 65 | |
| Other income, net | | | 37,371 | | | | 5,770 | |
| Loss before income taxes | | | (5,188,872 | ) | | | (1,006,156 | ) |
| Income taxes benefits | | | 1,297,042 | | | | 249,676 | |
| Net loss | | $ | (3,891,830 | ) | | $ | (756,480 | ) |
The net assets distributed as of December 20, 2011 were as follows:
| | | December 20, 2011 | |
| Cash & cash equivalents | | $ | 86,678 | |
| Inventory, net | | | 606,300 | |
| Accounts receivable, net | | | 4,001,821 | |
| Advance to suppliers | | | 157,650 | |
| Prepaid expenses | | | 664,081 | |
| All other current assets | | | 4,858,057 | |
| Current assets | | | 10,374,587 | |
| Property, plant, and equipment, net | | | 3,094,778 | |
| Goodwill | | | 1,103,309 | |
| All other assets | | | 766,947 | |
| Non-current assets | | | 4,965,034 | |
| Accounts payable | | | 773,141 | |
| Advance from customer | | | 2,499,636 | |
| Accrued expenses | | | 724,918 | |
| Other payables | | | 4,510,067 | |
| Due to Related Party | | | 8,319,191 | |
| All other current liabilities | | | 271,321 | |
| Current liabilities | | $ | 17,098,274 | |
| NOTE 4. | ACCOUNTS RECEIVABLE |
Accounts receivable consisted of the following:
| | | December 31, | | | December 31, | |
| | | | 2011 | | | | 2010 | |
| Accounts receivable | | $ | 36,167,136 | | | $ | 11,160,959 | |
| Less: Allowance for doubtful accounts | | | - | | | | - | |
| Accounts receivable, net | | $ | 36,167,136 | | | $ | 11,160,959 | |
Inventory consisted of the following:
| | | December 31, | | | December 31, | |
| | | | 2011 | | | | 2010 | |
| Raw materials | | $ | 8,108,503 | | | $ | 784,825 | |
| Work in process | | | 1,971 | | | | 383,960 | |
| Finished goods | | | 12,109,353 | | | | 15,316,045 | |
| Supplies | | | 94,263 | | | | 57,169 | |
| Total Inventory | | $ | 20,314,090 | | | $ | 16,541,999 | |
Prepaid expenses consisted of the following:
| | | December 31, | | | December 31, | |
| | | | 2011 | | | | 2010 | |
| Deductible value-added taxes (VAT) | | $ | 92,531 | | | $ | 1,250,205 | |
| Prepaid rent | | | 88,889 | | | | 52,904 | |
| Prepaid bank loan guarantee fee | | | 83,899 | | | | - | |
| Prepaid other expenses | | | 79,842 | | | | 18,112 | |
| Prepaid advertisement | | | 46,376 | | | | 3,030 | |
| Total | | $ | 391,537 | | | $ | 1,324,251 | |
| NOTE 7. | ASSETS HELD FOR SALE |
Assets held for sale represent the cost of timber, timberland and farmland (collectively the “timberland) amounted to RMB 10.3 million ($1.6 million), which management assessed approximating its fair value. The company exchanged the timberland for an office building with paying cash consideration of RMB 7.2 million ($1.1 million) for the variance between the fair values of the office building and the timberland on March 19, 2012. The cost of the timberland was reclassified from other assets to assets held for sale in the consolidated balance sheets as of December 31, 2011.
According to government regulations of the PRC, the PRC Government owned the timber land as of December 31, 2011. The Company leased and obtained a certificate of right to use farmland of approximately 1,605 acres (or 10,032 mu) for the period from August 2005 to December 2031. For the same farmland, the Company obtained a certificate of the right to timber and 896 acres (or 5,600 mu) of timberland for the period from August 2006 to August 2028. Timber mainly includes pine trees and poplar trees. These timber, timberland and farmland were not for operating use or intended for sale as merchandise. Based on management’s assessment, there was no impairment as of and for the years ended December 31, 2011 and 2010, or as of the date of exchange.
| NOTE 8. | PROPERTY, PLANT, AND EQUIPMENT |
Property, plant, and equipment consisted of the following:
| | | December 31, | | | December 31, | |
| | | | 2011 | | | | 2010 | |
| Automobiles | | $ | 896,648 | | | $ | 840,873 | |
| Buildings | | | 9,593,679 | | | | 1,659,116 | |
| Office equipment | | | 408,203 | | | | 360,841 | |
| Machinery and equipment | | | 2,954,783 | | | | 2,620,243 | |
| Furniture and fixtures | | | 605,705 | | | | 33,479 | |
| Total cost | | | 14,459,018 | | | | 5,514,552 | |
| Less: Accumulated depreciation | | | (2,103,072 | ) | | | (1,227,180 | ) |
| Property, plant, and equipment, net | | $ | 12,355,946 | | | $ | 4,287,372 | |
The buildings owned by the Company located in Jinzhong, Shanxi Province, China are used for production, warehousing and offices for our grains business. The building structure of warehouses and office located in Shanzhuangtou under the title of Jinzhong Deyu is mainly constructed of light steel and bricks. At the same area, the Company acquired buildings of RMB 11.8 million ($1.9 million) on December 27, 2011, of which depreciation commenced in January 2011.
The construction of a warehousing, processing, and logistics center of Jinzhong Yongcheng (the “Yongcheng Plant”) was completed in June 2011. Cost of the six (6) warehouses (total 9,525 square meters), one office building (3,860 square meters), and a processing center with five (5) cylinder storages in the amount of RMB 30.1 million ($4.8 million) of the Yongcheng Plant was reclassified from Construction-in-Progress to Property, Plant and Equipment as reported on the consolidated balance sheet as of December 31, 2011. Also due to the construction completion, cost of the land use rights in the amount of RMB 15 million ($2.4 million) of the Yongcheng Plant was reclassified from Construction-in-Progress to Intangible Assets as reported on the consolidated balance sheet as of December 31, 2011 (see Note 9). Depreciation of the warehouses, office building, and processing center commenced in July 2011.
Depreciation expense from continuing operations for the year ended December 31, 2011 and 2010 was $794,853 and $489,379, respectively.
| NOTE 9. | CONSTRUCTION-IN-PROGRESS |
Construction-in-progress consisted of the following:
| | | December 31, | | | December 31, | |
| | | | 2011 | | | | 2010 | |
| Construction of Jinzhong corn processing and storage center | | $ | - | | | $ | 6,732,189 | |
| Total cost | | $ | - | | | $ | 6,732,189 | |
The Jinzhong processing and storage center and Jinzhong factory heating system located in Jinzhong City, Shanxi Province, PRC are completed and transferred to fixed assets in June 2011 (see Note 8).
| NOTE 10. | INTANGIBLE ASSETS |
Intangible assets consisted of the following:
| | | December 31, | | | December 31, | |
| | | | 2011 | | | | 2010 | |
| Software-ERP System and B2C platform | | $ | 1,032,746 | | | $ | - | |
| Land use rights | | | 9,808,497 | | | | - | |
| Less: Accumulated amortization | | | (189,399 | ) | | | - | |
| Total | | $ | 10,651,844 | | | $ | - | |
According to government regulations of the PRC, the PRC Government owns all land. The Company leases and obtains a certificate of right to use the industrial land of 11,667 square meters with the PRC Government in Jingzhong, Shanxi Province where Jinzhong Deyu’s buildings and production facility are located at. The term of the right is four to five years and renewed upon expiration. The right was fully amortized as of December 31, 2010 using the straight-line method. The term of the right was for the period from March 14, 2007 to March 14, 2011. The Company has been in the process of renewing the land use right certificate since the expiration date. According to a Certification issued by the Jinzhong Municipal Bureau of Land and Resources on March 30, 2011, Jinzhong Deyu holds the legal title of the land use rights during the period of the renewal process.
The construction of a warehousing, processing, and logistics center of Jinzhong Yongcheng (the “Yongcheng Plant”) was completed in June 2011. Cost of the six (6) warehouses (total 9,525 square meters), one office building (3,860 square meters), and a processing center with five (5) cylinder storages in the amount of RMB 30.1 million ($4.8 million) of the Yongcheng Plant was reclassified from Construction-in-Progress to Property, Plant and Equipment upon the construction completion as of June 30, 2011 (see Note 8). Cost of the land use rights in the amount of RMB 15 million ($2.4 million) of the Yongcheng Plant was reclassified from Construction-in-Progress to Intangible Assets upon the construction completion and as reported on the consolidated balance sheet as of December 31, 2011. The industrial land underlying the certificate of the land use rights is 46,860 square meters under the title of Jinzhong Deyu. The term of the rights is fifty (50) years starting from November 26, 2010 to November 25, 2060. The amortization of the land use right was commenced in July, 2011using the straight-line method over 49.40 years.
On September 30, 2010 and December 20, 2010, we entered into Farmland Transfer Agreements with Shanxi Jinbei Plant Technology Co., Ltd. for the transfer of land use rights (the “Rights”) consisting of 53,000 mu (equivalent to 8,731 acres) and 52,337 mu (equivalent to 8,615 acres), respectively. We paid RMB 19,415,000 (approximately $2,900,000) and RMB 27,221,000 (approximately $4,066,000) in September 30, 2010 and December 20, 2010, respectively. The variance in the balance denominated in US Dollars as of September 30, 2011 was the effect of foreign currency translation. Pursuant to the agreement and the terms of the original land use right certificates, the Rights will continue for 43 years (on average). The land will be used for agricultural planting of corn and grains. We obtained land use rights certificates dated September 6, 2011 evidencing our ownership of those land use rights. The terms of the rights stated on the certificates averaged 38.39 years, based on which we commenced the amortization of these land use rights from September, 2011.
Amortization expense of the continuing operations for the year ended December 31, 2011 was $184,444.
Other assets consisted of the following:
| | | December 31, | | | December 31, | |
| | | | 2011 | | | | 2010 | |
| Net deferred tax assets - noncurrent | | $ | 648,759 | | | $ | 749,250 | |
| Timber, timberland, and farmland use rights | | | 78,776 | | | | 1,558,479 | |
| Prepaid for acquisition of land use rights | | | - | | | | 7,066,061 | |
| Installment payment for ERP system | | | - | | | | 984,848 | |
| Others | | | - | | | | 35,608 | |
| Total | | $ | 727,535 | | | $ | 10,394,246 | |
The cost of timber, timberland and farmland amounted to RMB 10.3 million ($1.6 million) as of December 31, 2010 was reclassified to assets held for sale as of December 31, 2011 (see Note 7).
Short-term loan consisted of the following:
| | | December 31,
2011 | | | December 31,
2010 | |
| Bank loan payable to Bank of Communications, bearing interest at a floating rate of prime rate plus 30% of prime rate, of which prime rate was based on one-year loan interest rate released by The People's Bank of China. The actual interest rate as of December 31, 2011 was 8.5280%. The term of the loan started from May 10, 2011 with maturity date on May 9, 2012. The loan was obtained by Detain Yu and guaranteed by Zhongyuan Guoxin Credit Guarantee Co., Ltd., Wenjun Tian and Jianming Hao for a period of one year starting from May 10, 2011. Wenjun Tian and Jianming Hao for a period of one year starting from May 10, 2011. | | $ | 7,944,200 | | | $ | - | |
| | | | | | | | | |
| Bank loan payable to China Merchants Bank Beijing Dongzhimen subbranch, bearing interest at a floating rate of prime rate plus 20% of prime rate, of which prime rate was based on one-year loan interest rate released by The People's Bank of China. The actual interest rate as of December 31, 2011 was 7.8720%. The term of the loan started from November 30, 2011 with maturity date on November 29, 2012. The loan was obtained by Detain Yu and guaranteed by China Agriculture Credit Guarantee Co., Ltd. for a period of one year starting from November 30, 2011. | | | 2,121,101 | | | | - | |
| | | | | | | | | |
| Bank loan payable to Jinzhong City Yuci District Rural Credit Union Co., Ltd, bearing interest at a floating rate of prime rate plus 130% of prime rate, of which prime rate was based on six-month to one-year loan interest rate released by The People's Bank of China. The actual interest rate as of December 31, 2011 was 15.084%. The term of the loan started from August 8, 2011 with maturity date on August 7, 2012. The loan was obtained by Jinzhong Deyu and guaranteed by Jinzhong Juntai Automotive Parts Manufacturing Co., Ltd., for a period of two years starting from August 7, 2012. | | | 1,588,840 | | | | - | |
| | | | | | | | | |
| Bank loan payable to Jinzhong City Yuci District Rural Credit Union Co., Ltd., bearing interest at a floating rate of prime rate plus 130% of prime rate, of which prime rate was based on six-month to one-year loan interest rate released by The People's Bank of China. The actual interest rate as of December 31, 2011 was 15.084%. The term of the loan started from August 9, 2011 with maturity date on August 7, 2012. The loan was obtained by Jinzhong Yongcheng and guaranteed by Yuci Jinmao Food Processing Factory, for a period of two years starting from August 7, 2012. | | | 1,350,514 | | | | - | |
| | | | | | | | | |
| Bank loan payable to Jinzhong City Yuci District Rural Credit Union Co., Ltd., bearing interest at a floating rate of prime rate plus 130% of prime rate, of which prime rate was based on six-month to one-year loan interest rate released by The People's Bank of China. The actual interest rate as of December 31, 2011 was 15.084%. The term of the loan started from August 9, 2011 with maturity date on August 7, 2012. The loan was obtained by Jinzhong Yuliang and guaranteed by Yuci Jinmao Food Processing Factory, for a period of two years starting from August 7, 2012. | | | 1,350,514 | | | | - | |
| | | | | | | | | |
| Loan payable to Hangzhou TianCi Investment Management Co., Ltd., an unrelated party. The loan was unsecured, bearing no interest and no due date was specified. | | | 58,311 | | | | 55,606 | |
| | | | | | | | | |
| Bank loan payable to Jinzhong Economic Development District Rural Credit Union, bearing interest at a floating rate of prime rate plus 129.83% of prime rate, of which prime rate was based on six-month to one-year loan interest rate released by The People's Bank of China. The loan was due March 8, 2011. The use of proceeds from the loan is for purchase of raw materials. The loan was obtained by Jinzhong Yuliang and guaranteed by Jinzhong Deyu for a period of two years starting from January 13, 2010. In January 2011, the Company entered into an agreement with the bank for an extension of the loan. The new term is from February 1, 2011 to October 1, 2011. The adjustable interest rate is a rate per annum equal to the Prime Rate plus 117.23 percentage points of prime rate. The prime rate is based on one- to three-year loan interest rate released by The People's Bank of China. Jinzhong Deyu continues to provide guarantees on the loan for a period of two years starting from October 1, 2011. This loan was paid off on May 11, 2011. | | | - | | | | 1,287,879 | |
| | | | | | | | | |
| Bank loan payable to Shanxi Province Rural Credit Union, bearing interest at a floating rate of prime rate plus 107.00% of prime rate, of which prime rate was based on six-month-to-one-year loan interest rate released by The People's Bank of China and due January 13, 2011. The use of proceeds from the loan is restricted for purchase of corns. The loan was obtained by Jinzhong Yongcheng and guaranteed by Jinzhong Deyu and Jinzhong Yuliang for a period of two years starting from January 13, 2011. In January 2011, the Company entered into an agreement with bank with an extension for the bank loan. The new term of bank loan is from January 14, 2011 to June 11, 2011. The adjustable interest rate is a rate per annum equal to the Prime Rate plus 107 percentage points of prime rate. The prime rate is based one-to-three-year loan interest rate released by The People's Bank of China. Jinzhong Deyu and Jinzhong Yuliang remain providing guarantees on the loan for a period of two years starting from June 11, 2011. This loan was paid off on May 11, 2011. | | | - | | | | 1,287,879 | |
| | | | | | | | | |
| Total | | $ | 14,413,480 | | | $ | 2,631,364 | |
NOTE 13. NOTES PAYABLE
Notes payable consisted of the following:
| | | December 31, | | | December 31, | |
| | | | 2011 | | | | 2010 | |
| Bank notes payable to Jinzhong Haida Nongyi Trading Co., Ltd. issued by Bank of Communication at Beijing Gongzhifen branch, bearing no interest and no finance charge.This note is for August 17, 2011 through February 17, 2012.The note was obtained and issued by Detian Yu Biotechnology (Beijing) Co., Ltd. The note was paid off on March 7, 2012. | | $ | 1,588,840 | | | $ | - | |
| | | | | | | | | |
| Total | | $ | 1,588,840 | | | $ | - | |
Accrued expenses consisted of the following:
| | | December 31, | | | December 31, | |
| | | | 2011 | | | | 2010 | |
| Accrued VAT and other taxes | | $ | 412,437 | | | $ | 877,112 | |
| Accrued payroll | | | 266,983 | | | | 272,587 | |
| Others | | | 469,785 | | | | 141,528 | |
| Total | | $ | 1,149,205 | | | $ | 1,291,227 | |
United States
The Company is incorporated in the United States of America and is subject to the U.S. federal and state taxation. No provision for income taxes have been made as the Company has no taxable income in the U.S.. The applicable income tax rate for the Company for the years ended December 31, 2011 and 2010 was 34%. No tax benefit has been realized since a 100% valuation allowance has offset deferred tax asset resulting from the net operating losses.
British Virgin Islands
City Zone, a wholly-owned subsidiary of the Company, is incorporated in the British Virgin Islands (“BVI”) and, under the current laws of the BVI, is not subject to income taxes.
Hong Kong
Most Smart, a wholly-owned subsidiary of the Company, is incorporated in Hong Kong. Most Smart is subject to Hong Kong taxation on its activities conducted in Hong Kong and income arising in or derived from Hong Kong. No provision for income taxes have been made as Most Smart has no taxable income in Hong Kong.
People’s Republic of China (PRC)
Under the Enterprise Income Tax (“EIT”) Law of the PRC, the standard EIT rate is 25%. The PRC subsidiaries of the Company are subject to PRC income taxes on an entity basis on income arising in or derived from the tax jurisdiction in which they operate. According to the Tax Pronouncement [2008] No. 149 issued by the State Administration of Tax of the PRC, the preliminary processing industry of agricultural products is entitled to EIT exemption starting January 1, 2008. Three of the Company’s wholly-owned subsidiaries located in the Shanxi Province, China, including Jinzhong Deyu, Jinzhong Yongcheng, and Jinzhong Yuliang are subject to the EIT exemption. All other subsidiaries and consolidated VIEs are subject to the 25% EIT rate.
The provision for income taxes from continuing operations on income consists of the following for the years ended December 31, 2011 and 2010:
| | | For the Years Ended | |
| | | Ended | |
| | | December 31, | |
| | | | 2011 | | | | 2010 | |
| Current income tax expense (benefit) | | | | | | | | |
| U.S | | $ | - | | | $ | - | |
| PRC | | | - | | | | - | |
| Total current expense (benefit) | | $ | - | | | $ | - | |
| | | | | | | | | |
| Deferred income tax expense (benefit) | | | | | | | | |
| U.S | | $ | - | | | $ | - | |
| PRC | | | (1,112,658 | ) | | | (1,163,461 | ) |
| Less: Income tax benefit attributable to discontinued operations | | | 1,297,042 | | | | 249,676 | |
| Income tax expense (benefit) attributable to continuing operations | | $ | 184,384 | | | $ | (913,785 | ) |
The following is a reconciliation of the statutory tax rate to the effective tax rate of the continuing operations for the years ended December 31, 2011 and 2010:
| | | For The Years Ended | |
| | | December 31, | |
| | | | 2011 | | | | 2010 | |
| Expected U.S. income tax expense | | | 34.0 | % | | | 34.0 | % |
| Increase (decrease) in taxes resulting from: | | | | | | | | |
| Tax-exempt income | | | -39.0 | % | | | -48.6 | % |
| Foreign tax differential | | | 0.9 | % | | | 2.8 | % |
| Change in valuation allowance | | | 5.6 | % | | | 2.9 | % |
| Intercompany elimination | | | -0.6 | % | | | 0.9 | % |
| Other | | | - | | | | 0.2 | % |
| Income tax benefit attributable to continuing operations | | | 0.9 | % | | | -7.8 | % |
Significant components of the Company’s net deferred tax assets as of December 31, 2011 and 2010 are presented in the following table:
| | | December 31, | | | December 31, | |
| | | | 2011 | | | | 2010 | |
| Deferred tax assets | | | | | | | | |
| Net operating loss carryforwards (NOL) | | $ | 2,255,365 | | | $ | 1,458,421 | |
| Share-based compensation | | | 351,203 | | | | 197,126 | |
| Gross deferred tax assets | | | 2,606,568 | | | | 1,655,547 | |
| Less: Valuation allowance | | | (1,813,056 | ) | | | (466,649 | ) |
| Total deferred tax assets, net | | $ | 793,512 | | | $ | 1,188,898 | |
| NOTE 16. | NET INCOME PER SHARE |
Reconciliation of the basic and diluted net income per share was as follows:
| | | Amounts | | | Shares | | | Per Share | |
| | | (Numerator) | | | (Denominator) | | | Amount | |
| For the year ended December 31, 2011: | | | | | | | | | | | | |
| Net income from continuing operations attributable to common stockholders - basic | | $ | 20,126,017 | | | | 10,522,432 | | | $ | 1.91 | |
| Preferred dividends applicable to convertible preferred stocks | | | 427,917 | | | | 1,974,732 | | | | | |
| Net income from continuing operations attributable to common stockholders - diluted | | $ | 20,553,934 | | | | 12,497,164 | | | $ | 1.64 | |
| | | | | | | | | | | | | |
| Net income attributable to common stockholders - basic | | $ | 17,335,442 | | | | 10,522,432 | | | $ | 1.64 | |
| Preferred dividends applicable to convertible preferred stocks | | | 427,917 | | | | 1,974,732 | | | | | |
| Net income attributable to common stockholders - diluted | | $ | 17,763,359 | | | | 12,497,164 | | | $ | 1.42 | |
| | | | | | | | | | | | | |
| For the year ended December 31, 2010: | | | | | | | | | | | | |
| Net income from continuing operations attributable to common stockholders - basic | | $ | 12,258,733 | | | | 8,445,880 | | | $ | 1.45 | |
| Preferred dividends applicable to convertible preferred stocks | | | 327,721 | | | | 1,803,161 | | | | | |
| Net income from continuing operations attributable to common stockholders - diluted | | $ | 12,586,454 | | | | 10,249,041 | | | $ | 1.23 | |
| | | | | | | | | | | | | |
| Net income attributable to common stockholders - basic | | $ | 11,502,253 | | | | 8,445,880 | | | $ | 1.36 | |
| Preferred dividends applicable to convertible preferred stocks | | | 327,721 | | | | 1,803,161 | | | | | |
| Net income attributable to common stockholders - diluted | | $ | 11,829,974 | | | | 10,249,041 | | | $ | 1.16 | |
| NOTE 17. | SHAREHOLDERS’ EQUITY |
Reverse Acquisition and Private Placement
On April 27, 2010, we completed the acquisition of City Zone by means of a share exchange. Simultaneously with the acquisition, we completed a private placement for gross proceeds of $8,211,166 from the sale of our securities to accredited investors at $4.40 per unit, with each “Unit” consisting of one share of Series A Convertible Preferred Stock, and a warrant to purchase 0.4 shares of common stock with an exercise price of $5.06 per share.
On April 27, 2010, the (the “Closing Date”), we entered into a Share Exchange Agreement (“Exchange Agreement”) by and among (i) City Zone, (ii) City Zone’s shareholders, (iii) us, and (iv) our principal stockholders. Pursuant to the terms of the Exchange Agreement, Expert Venture Limited, a company organized under the laws of the British Virgin Islands (“Expert Venture”) and the other City Zone shareholders will transfer to us all of the shares of City Zone in exchange for the issuance of 8,736,932 shares of our common stock as set forth in the Exchange Agreement, so that Expert Venture and other minority shareholders of City Zone shall own at least a majority of our outstanding shares (the “Share Exchange”).
Our directors approved the Exchange Agreement and the transactions contemplated thereby. The directors of City Zone also approved the Exchange Agreement and the transactions contemplated thereby.
As a result of the Exchange Agreement effective April 27, 2010, we acquired 100% of the equity interest of City Zone, the business and operations of which now constitutes our primary business and operations through its wholly-owned PRC subsidiaries. Specifically, as a result of the Exchange Agreement:
| · | We issued 8,736,932 shares of our common stock to the City Zone Shareholders; |
| · | The ownership position of our shareholders who were holders of common stock immediately prior to the Exchange Agreement changed from 100% to 9.5% (fully diluted) of our outstanding shares; and |
| · | City Zone Shareholders were issued our common stock constituting approximately 65.71% of our fully diluted outstanding shares. |
Immediately after the Share Exchange, we entered into a securities purchase agreement (the “Purchase Agreement”) with certain accredited investors (the “Investors”) for the issuance and sale in a private placement of 1,866,174 Units, consisting of 1,866,174 shares of our Series A Convertible Preferred Stock, par value $0.001 per share (the “Investor Shares”) and Series A Warrants to purchase up to 746,479 shares of our Common Stock (the “Warrants”), for aggregate gross proceeds of $8,211,166 (the “Private Placement”). In connection with the Private Placement, we also entered into a registration rights agreement (the “Registration Rights Agreement”) with the Investors, in which we agreed to file a registration statement (the “Registration Statement”) with the Securities and Exchange Commission (the “SEC”) to register for resale the Investor Shares, within 60 calendar days of the Closing Date of the Private Placement, and use our best efforts to have the Registration Statement declared effective within 180 calendar days of the Closing Date of the Private Placement. We will pay monthly liquidated damages in cash to each Investor of 0.5% of the dollar amount of the purchase price of the Investor Shares, on a pro rata basis, for each 30 day period the Registration Statement is not declared effective, up to a maximum of 8% of the purchase price. However, no liquidated damages shall be paid with respect to any shares that we are not permitted to include in the Registration Statement due to the SEC’s application of Rule 415. On October 21, 2010, the SEC declared our Form S-1 effective.
In connection with the Private Placement, Maxim Group, LLC acted as our financial advisor and placement agent (the “Placement Agent”). Maxim received a cash fee equal to 7% of the gross proceeds of the Private Placement. Maxim also received warrants to purchase 171,911 shares of our Common Stock at a price per share of $5.06 (the “Placement Agent Warrants”). Pursuant to the Original Placement Agreement entered into by Detian Yu on January 27, 2010 with the Placement Agent (the “ Original Placement Agreement”), we engaged the Placement Agent to act as the exclusive agent to sell the Units in this Offering on a “commercially reasonable efforts basis.” The Placement Agent received cash fees equal to 7% of our gross proceeds received in connection with an equity financing and a cash corporate finance fee equally to 1% of our gross proceeds raised in the Offering, payable at the time of each Closing; five (5) year warrants to purchase that number of Series A Preferred Shares and Shares equal to 5% of the aggregate number of Series A Preferred Shares and Shares underlying the Units issued pursuant to this Offering; and a non-refundable cash retainer (or restricted shares) of $25,000 payable upon the execution of the retainer agreement. We also agreed to pay for all of the reasonable expenses the Placement Agent incurred in connection with the Offering.
On May 10, 2010, we closed on the second and final round (the “Final Closing”) of the private placement offering for the issuance and sale of 589,689 Units, consisting of 589,689 shares of Series A Convertible Preferred Stock and 235,883 five-year Series A Warrants with an exercise price of $5.06 per share, to certain accredited investors (the “Investors”) for total gross proceeds of $2,594,607.
We raised an aggregate amount of $10,805,750 in the Offering. As of the Final Closing, we had 9,999,999 shares of common stock issued and outstanding. In connection with the offering, we issued a total of 2,455,863 shares of Series A Convertible Preferred Shares and 982,362 Series A Warrants to the investors. Additionally, the Placement Agent received 171,911 warrants.
Make Good Escrow Agreement
We also entered into a make good escrow agreement with the Investors (the “Securities Escrow Agreement”), pursuant to which the City Zone Shareholders placed a number of shares of Common Stock equal to 100% of the number of shares of Common Stock underlying the Investor Shares, which were initially convertible into 1,866,174 shares of Common Stock (the “Escrow Shares”) in an escrow account. The Escrow Shares were being held as security in the event we did not achieve $11 million in audited net income for the fiscal year 2010 (the “2010 Performance Threshold”) and $15 million in audited net income for the fiscal year 2011 (the “2011 Performance Threshold”). If we achieved the 2010 Performance Threshold and the 2011 Performance Threshold, the Escrow Shares would be released back to the City Zone Shareholders. If either the 2010 Performance Threshold or 2011 Performance Threshold was not achieved, an aggregate number of Escrow Shares (such number to be determined by the formula set forth in the Securities Escrow Agreement) would be distributed to the Investors, based upon the number of Investor Shares (on an as-converted basis) purchased in the Private Placement and still beneficially owned by such Investor, or such successor, assign or transferee, at such time. If any Investor transfers Investor Shares purchased pursuant to the Purchase Agreement, the rights to the Escrow Shares shall similarly transfer to such transferee, with no further action required by the Investor, the transferee or us.
Common Stock
As of the Final Closing, we had 9,999,999 shares of common stock issued and outstanding. Between the Final Closing date to December 31, 2011, an aggregate of 524,775 shares of Series A Preferred were converted to 524,775 common stocks. For the year ended December 31, 2011, an aggregate of 40,000 common stocks were issued for investor relations services, valued at the market price of the Company’s common stock at the time of issuance, or $78,000 in total, and charged to operating expenses. As of December 31, 2011, total number of common stock issued and outstanding was 10,564,774 shares.
Series A Convertible Preferred Stock
The holders of Series A Convertible Preferred Shares (“Series A Preferred”) will be entitled to receive, cumulative dividends in preference to the holders of Common Stock at an annual rate of 5% of the applicable per Series A Preferred original purchase price (the “Dividend Preference” and the “Dividends”). If, after the Dividend Preference has been fully paid or declared and set apart, the Company shall make any additional distributions, then the holders of Series A Preferred shall participate with the holders of common stock on an as-converted basis with respect to such distributions. Dividends will be payable in cash or stock, at the Company’s option.
Upon any liquidation, dissolution or winding up of the Company, the holders of Series A Preferred will be entitled to receive, out of the assets of the Company available for distribution to its stockholders, an amount equal to $4.40 per share (the amount, the “Liquidation Preference Amount”), before any payment shall be made or any assets distributed to the holders of the common stock (the “Liquidation Preference”).
Each holder of Series A Preferred will have the right, at the option of the holder at any time on or after the issuance of the Series A Preferred, without the payment of additional consideration, to convert Series A Preferred into a number of fully paid and nonassessable shares of common stock equal to: (i) the Liquidation Preference Amount of such share divided by (ii) the Conversion Price in effect as of the date of the conversion.
For a period of two (2) years following the issuance of the Series A Preferred, the conversion price of Series A Preferred will be subject to adjustment for issuances of common stock (or securities convertible or exchangeable into shares of Common Stock) at a purchase price less than the conversion price of the Series A Preferred. The Series A Preferred Stock does not contain any repurchase or redemption rights.
Current accounting standards require that we evaluate the terms and conditions of convertible preferred stock to determine (i) if the nature of the hybrid financial instrument, based upon its economic risks, is more akin to an equity contract or a debt contract for purposes of establishing classification of the embedded conversion feature and (ii) the classification of the host or hybrid financial instrument. Based upon a review of the terms and conditions of the Series A Preferred, the Company has concluded that the financial instrument is more akin to an equity financial instrument. The major consideration underlying this conclusion is that the Series A Preferred is a perpetual financial instrument with no stated maturity or redemption date, or other redemption that is not within the Company’s control. Other considerations in support of the equity conclusion included the voting rights and conversion feature into common shares. While the cumulative dividend feature may, in some instances, be likened to a debt-type coupon, the absence of a stated maturity date was determined to establish the cumulative dividend as a residual return, which does not obviate the equity nature of the financial instrument. Further, there are no cash redemption features that are not within the control of our management. As a result, classification in stockholders’ equity is appropriate for the Series A Preferred.
As of December 31, 2011, an aggregate of 524,775 shares of Series A Preferred were converted to common stocks. On July 29, 2011, 66,739 shares of Series A Preferred were issued as dividends to the shareholders of Series A Preferred. As of December 31, 2011, total number of Series A Preferred Shares issued and outstanding was 1,997,467 shares.
For the year ended December 31, 2011, the Company recorded $427,917 preferred dividend expense, of which $212,420 was distributed in 66,739 shares of Series A Preferred on July 29, 2011, valued approximating to their fair value at the time of issuance. The remaining $219,712 was accrued as preferred dividend payable on the consolidated balance sheet as of December 31, 2011.
For the year ended December 31, 2010, the Company recorded $327,721 preferred dividend expense, of which $96,051 was distributed in cash on July 22, 2010 and the remaining $231,670 was accrued as preferred dividend payable on the consolidated balance sheet as of December 31, 2010. The distribution of $231,670 preferred dividend was made on January 28, 2011.
Series A Warrants
The warrants issued to the investors and placement agent have strike prices of $5.06 and $4.84, respectively, and expire in five years. The strike prices are subject to adjustment only for changes in our capital structure, but allow for cashless exercise under a formula that limits the aggregate issuable common shares. There are no redemption features embodied in the warrants and they have met the conditions provided in current accounting standards for equity classification.
There were 982,362 Series A Warrants sold together with the Series A Preferred to the investors, which:
| (a) | entitle the holder to purchase 1 shares of Common Stock; |
| (b) | are exercisable at any time after consummation of the transactions contemplated by the Securities Purchase Agreement and shall expire on the date that is five years following the original issuance date of the Series A Warrants; |
| (c) | are exercisable, in whole or in part, at an exercise price of $5.06 per share of Common Stock; and |
| (d) | are exercisable only for cash (except that there will be a cashless exercise option if, after twelve months from the Issue Date, (i) the Per Share Market Value of one share of Common Stock is greater than the Warrant Price (at the date of calculation) and (ii) a registration statement under the Securities Act providing for the resale of the Common Stock issuable upon exercise of Warrant Shares is not in effect, in lieu of exercising this Warrant by payment of cash). |
Aggregate gross proceeds from the two closing events amounted to $10,805,750. Direct financing costs totaled $1,742,993 of which $1,555,627 was paid in cash and the balance of $187,366 represents the fair value of warrants linked to 171,911 shares of our common stock that were issued to a placement agent. The proceeds and the related direct financing costs were allocated to the Series A Preferred and the warrants (classified in paid-in capital) based upon their relative fair values. The following table summarizes the components of the allocation:
| | | Series A
Preferred | | | Paid-in
Capital
Warrants | | | Total | |
| Fair values of financial instruments | | $ | 10,248,092 | | | $ | 1,039,978 | | | $ | 11,288,070 | |
| | | | | | | | | | | | | |
| Gross proceeds | | $ | 9,810,227 | | | $ | 995,523 | | | $ | 10,805,750 | |
| Direct financing costs | | | (1,581,550 | ) | | | (161,443 | ) | | | (1,742,993 | ) |
| Fair value of placement agent warrants | | | - | | | | 187,366 | | | | 187,366 | |
| | | $ | 8,228,677 | | | $ | 1,021,446 | | | $ | 9,250,123 | |
Fair value considerations:
Our accounting for the sale of Series A Preferred and warrants, and the issuance of warrants to the Placement Agent required the estimation of fair values of the financial instruments on the financing inception date. The development of fair values of financial instruments requires the selection of appropriate methodologies and the estimation of often subjective assumptions. We selected the valuation techniques based upon consideration of the types of assumptions that market participants would likely consider in exchanging the financial instruments in market transactions. The Series A Preferred was valued based upon a common stock equivalent method, enhanced by the cumulative dividend feature. The dividend feature was valued as the estimated cash flows of the dividends discounted to present value using an estimated weighted average cost of capital. The warrants were valued using a Black-Scholes-Merton Valuation Technique because it embodies all of the requisite assumptions (including trading volatility, estimated terms and risk free rates) necessary to fair value these instruments.
These fair values were necessary to develop relative fair value calculation for allocations of certain elements of the financing arrangement, principally proceeds and the related direct financing costs. The following tables reflect assumptions used to determine the fair value of the Series A Preferred stock:
| | | Fair Value
Hierarchy
Level | | | Series A
Preferred
April 27,
2010 | | | Series A
Preferred
May 10,
2010 | |
| Indexed common shares | | | | | | | 1,866,174 | | | | 589,689 | |
| | | | | | | | | | | | | |
| Components of fair value: | | | | | | | | | | | | |
| Common stock equivalent value | | | | | | $ | 6,631,403 | | | $ | 2,083,094 | |
| Dividend feature | | | | | | | 659,821 | | | | 209,439 | |
| | | | | | | $ | 7,791,224 | | | $ | 2,292,533 | |
| | | | | | | | | | | | | |
| Significant assumptions: | | | | | | | | | | | | |
| Common stock price | | | 3 | | | | 3.55 | | | | 3.53 | |
| Horizon for dividend cash flow projection | | | 3 | | | | 2.00 | | | | 2.00 | |
| Weighted average cost of capital ("WACC") | | | 3 | | | | 15.91% | | | | 15.55% | |
Fair value hierarchy of the above assumptions can be categorized as follows:
| (1) | Level 1 inputs are quoted prices in active markets for identical assets and liabilities, or derived there from. There were no level 1 inputs. |
| (2) | Level 2 inputs are significant other observable inputs. There were no level 2 inputs. |
| (3) | Level 3 inputs are unobservable inputs. Inputs for which any parts are level 3 inputs are classified as level 3 in their entirety. |
| ● | Stock price- Given that management did not believe our trading market price was indicative of the fair value of our common stock at the measurement date, the common stock price value was derived implicitly from an iterative process based upon the assumption that the consideration of the Private Placement was the result of an arm’s length transaction. The Private Placement was composed of Series A Preferred Stock and Series A Warrants which were both indexed to our common stock; accordingly, we used an iterative process to determine the value of our common stock in order for the fair value of the Series A Preferred and Series A Warrants to equal the amount of consideration received in the Private Placement. |
| ● | Dividend horizon- We estimated the horizon for dividend payment at 2 years. |
| ● | WACC- The rates utilized to discount the cumulative dividend cash flows to their present values were based on a weighted average cost of capital of 18.94% and 18.60%, as of April 27, 2010 and May 10, 2010, respectively. This discount rate was determined after consideration of the rate of return on debt capital and equity that typical investors would require in an investment in companies similar in size and operating in similar markets as Deyu Agriculture Corporation. The cost of equity was determined using a build-up method which begins with a risk free rate and adds expected risk premiums designed to reflect the additional risk of the investment. Additional premiums or discounts related specifically to us and the industry are also added or subtracted to arrive at the final cost of equity rate. The cost of debt was determined based upon available financing terms. |
| ● | Significant inputs and assumptions underlying the model calculations related to the warrant valuations are as follows: |
The following tables reflect assumptions used to determine the fair value of the Warrants:
| | | | | | April 27, 2010 | | | May 10, 2010 | |
| | | Fair Value
Hierarchy
Level | | | Investor
warrants | | | Agent
warrants | | | Investor
warrants | | | Agent
Warrants | |
| | | | | | | | | | | | | | | | |
| Indexed shares | | | | | | | 746,479 | | | | 130,632 | | | | 235,883 | | | | 41,279 | |
| Exercise price | | | | | | | 5.06 | | | | 4.84 | | | | 5.06 | | | | 4.84 | |
| | | | | | | | | | | | | | | | | | | | | |
| Significant assumptions: | | | | | | | | | | | | | | | | | | | |
| Stock price | | 3 | | | | 3.55 | | | | 3.55 | | | | 3.53 | | | | 3.53 | |
| Remaining term | | 3 | | | | 5 years | | | | 5 years | | | | 5 years | | | | 5 years | |
| Risk free rate | | 2 | | | | 2.39% | | | | 2.39% | | | | 2.24% | | | | 2.24% | |
| Expected volatility | | 2 | | | | 45.25 | % | | | 45.25 | % | | | 45.47 | % | | | 45.47 | % |
Fair value hierarchy of the above assumptions can be categorized as follows:
| (1) | There were no Level 1 inputs. |
| (2) | Level 2 inputs include: |
| ● | Risk-free rate- This rate is based on publicly-available yields on zero-coupon Treasury securities with remaining terms to maturity consistent with the remaining contractual term of the warrants |
| ● | Expected volatility- We did not have a historical trading history sufficient to develop an internal volatility rate for use in the model. As a result, we have used a peer approach wherein the historical trading volatilities of certain companies with similar characteristics as ours and who had a sufficient trading history were used as an estimate of our volatility. In developing this model, no one company was weighted more heavily. |
| (3) | Level 3 inputs include: |
| ● | Stock price- Given that management did not believe our trading market price was indicative of the fair value of our common stock at the measurement date, the stock price was determined implicitly from an iterative process based upon the assumption that the consideration of the Private Placement was the result of an arm’s length transaction. |
| ● | Remaining term- We do not have a history to develop the expected term for our warrants. Accordingly, we have used the contractual remaining term in our calculations. |
The following is a summary of the status and activity of warrants outstanding as of December 31, 2010:
| Outstanding Warrants |
| Exercise Price | | Number of Warrants | | | Average Remaining Contractual Life |
| $5.06 | | | 982,362 | | | 3.32 years |
| $4.84 | | | 171,911 | | | 3.32 years |
| Total | | | 1,154,273 | | | |
| | | Number of Warrants | |
| Outstanding as of January 1, 2011 | | | 1,154,273 | |
| Granted | | | - | |
| Forfeited | | | - | |
| Exercised | | | - | |
| Outstanding as of December 31, 2011 | | | 1,154,273 | |
| NOTE 18. | SHARE-BASED COMPENSATION |
As of December 31, 2011, the Company had one share-based compensation plan as described below. The compensation cost that had been charged against income for the plan was $428,702 and $549,106 for the years ended December 31, 2011 and 2010 respectively. The related income tax benefit recognized was $150,046 and $192,187 for the years ended December 31, 2011 and 2010, respectively. A 100% valuation allowance was assessed against the deferred tax assets derived from such tax benefit as of December 31, 2011 and 2010.
On November 4, 2010, the Company’s Board of Directors approved the Company’s 2010 Share Incentive Plan (the “Plan”). Under the Plan, 1,000,000 shares of the Company’s common stock shall be allocated to and authorized for use pursuant to the terms of the Plan. On November 8, 2010, a total of 931,000 non-qualified incentive stock options were approved by our Board of Directors and granted under the Plan, including 851,000 options granted to the Company’s executives and key employees (collectively, “Employees”) and 80,000 options granted to consultants and independent directors of the Board (collectively, “Non-employees”), at an exercise price of $4.40 per share. On December 15, 2010, 40,000 non-qualified incentive stock options were approved by our Board of Directors and granted under the Plan to a consultant at an exercise price of $4.40 per share. The option award granted in 2010 shall vest as follows:
| (i) | | 33 1/3% of the option grants be vested one (1) month after the date of grant; |
| (ii) | | 33 1/3% of the option grants be vested twelve (12) months after the date of grant; and |
| (iii) | | 33 1/3% of the option grants be vested twenty-four (24) months after the date of grant |
The fair value of each option award was estimated on the date of grant using a Black-Scholes option pricing model that uses the assumptions noted in the following table. The model is based on the assumption that it is possible to set up a perfectly hedged position consisting of owning the shares of stock and selling a call option on the stock. Any movement in the price of the underlying stock will be offset by an opposite movement in the options value, resulting in no risk to the investor. This perfect hedge is riskless and, therefore, should yield the riskless rate of return. As the Black-Scholes option pricing model applies to stocks that do not pay dividends, we made an adjustment developed by Robert Merton to approximate the option value of a dividend-paying stock. Under this adjustment method, it is assumed that the Company’s stock will generate a constant dividend yield during the remaining life of the options.
The following tables reflect assumptions used to determine the fair value of the option award:
Options granted on November 8, 2010:
| Exercisable Period | | 12/8/2010 - 11/8/2020 | | | 11/8/2011 - 11/8/2020 | | | 11/8/2012 - 11/8/2020 | |
| Risk-free Rate (%) | | | 1.12 | | | | 1.27 | | | | 1.46 | |
| Expected Lives (years) | | | 5.04 | | | | 5.50 | | | | 6.00 | |
| Expected Volatility (%) | | | 46.10 | | | | 44.49 | | | | 43.04 | |
| Expected forfeitures per year (%) | | | 0.00-18.00 | | | | 0.00-18.00 | | | | 0.00-18.00 | |
| Dividend Yield (%) | | | 0.00 | | | | 0.00 | | | | 0.00 | |
Options granted on December 15, 2010:
| Exercisable Period | | 1/15/2011 - 12/15/2020 | | | 12/15/2011 - 12/15/2020 | | | 12/15/2012 - 12/15/2020 | |
| Risk-free Rate (%) | | | 2.15 | | | | 2.32 | | | | 2.50 | |
| Expected Lives (years) | | | 5.04 | | | | 5.50 | | | | 6.00 | |
| Expected Volatility (%) | | | 46.15 | | | | 44.52 | | | | 43.09 | |
| Expected forfeitures per year (%) | | | 0.00 | | | | 0.00 | | | | 0.00 | |
| Dividend Yield (%) | | | 0.00 | | | | 0.00 | | | | 0.00 | |
Fair value hierarchy of the above assumptions can be categorized as follows:
| (1) | There were no Level 1 inputs. |
| (2) | Level 2 inputs include: |
| ● | Risk-free rate- This rate is based on continuous compounding of publicly-available yields on U.S. Treasury securities with remaining terms to maturity consistent with the expected term of the options at the dates of grant. |
| ● | Expected volatility- We did not have a historical trading history sufficient to develop an internal volatility rate for use in the model. As a result, we have used a peer approach wherein the historical trading volatilities of certain companies with similar characteristics as ours and who had a sufficient trading history were used as an estimate of our volatility. In developing this model, no one company was weighted more heavily. |
| (3) | Level 3 inputs include: |
| ● | Expected lives- The expected lives of options granted were derived from the output of the option valuation model and represented the period of time that options granted are expected to be outstanding. |
| ● | Expected forfeitures per year- The expected forfeitures are estimated at the dates of grant and will be revised in subsequent periods pursuant to actual forfeitures, if significantly different from the previous estimates. |
The estimates of fair value from the model are theoretical values of stock options and changes in the assumptions used in the model could result in materially different fair value estimates. The actual value of the stock options will depend on the market value of the Company’s common stock when the stock options are exercised.
A summary of option activity under the Plan as of December 31, 2011, and changes during the year then ended is presented below:
| Options | | Shares | | | Weighted-
Average
Exercise
Price | | | Weighted-
Average
Remaining
Contractual
Term |
| Outstanding as of January 1, 2011 | | | 971,000 | | | $ | 4.40 | | | |
| Granted | | | - | | | | - | | | |
| Exercised | | | - | | | | - | | | |
| Forfeited | | | (156,000 | ) | | $ | 4.40 | | | |
| Outstanding as of December 31, 2011 | | | 815,000 | | | $ | 4.40 | | | 4.57 years |
| Exercisable as of December 31, 2011 | | | 543,333 | | | $ | 4.40 | | | 4.43 years |
| Vested and expected to vest * | | | 672,145 | | | $ | 4.40 | | | 4.56 years |
* Includes vested shares and unvested shares after a forfeiture rate is applied.
A summary of the status of the Company’s unvested shares as of December 31, 2011, and changes during the year ended December 31, 2011, is presented below:
| Unvested Shares | | Shares | | | Weighted-
Average
Grant-
Date Fair
Value | |
| Unvested as of January 1, 2011 | | | 647,334 | | | $ | 1,162,373 | |
| Granted | | | - | | | | - | |
| Vested | | | (271,667 | ) | | | (487,814 | ) |
| Forfeited | | | (104,000 | ) | | | (186,746 | ) |
| Unvested as of December 31, 2011 | | | 271,667 | | | $ | 487,813 | |
| NOTE 19. | RELATED PARTY TRANSACTIONS |
Transactions
| | | For The Years Ended | |
| | | Decmeber 31, | |
| | | | |
| | | | 2011 | | | | 2010 | |
| Sales to Beijing Yilian Gifts Tech. Development Co., Ltd. | | $ | 3,250,946 | | | $ | - | |
| Sales to Tieling Zhongnong Agriculture Technology Development Co., Ltd. | | | 1,114,581 | | | | - | |
| Sales to Beijing Doukounianhua Biotechnology Co., Ltd. | | | 21,471 | | | | - | |
Mr. Yongqin Ren, Vice President of the corn division of the Company is the legal representative of Tieling Zhongnong Agriculture Technology Development Co., Ltd. Mr. Jianming Hao, Chief Executive Officer of the Company is the Executive Director of Beijing Yilian Gifts Tech. Development Co., Ltd. Mr. Wenjun Tian, the President and Executive Director of the Company is the Executive Director of Jinshang International Finance Leasing Co., Ltd. The prices in the transactions with related parties were determined according to market price sold to or purchased from third parties.
The company purchased a batch of sunflower seed of RMB 16 million ($2,6 million) from Tieling Zhongnong Agriculture Technology Development Co., Ltd. in June, 2011 and returned the goods at original cost for quality rejection.
Due from related parties
| | | December 31, | | | December 31, | |
| | | | 2011 | | | | 2010 | |
| | | | | | | | | |
| Due from Beijing Yilian Gifts Tech. Development Co., Ltd. | | $ | 468,976 | | | $ | - | |
| Due from Deyufarm Innovation Food (Beijing) Co., Ltd. | | | 89,929 | | | | - | |
| Due from Beijing Doukounianhua Biotechnology Co., Ltd. | | | 24,666 | | | | - | |
| Due form Jinshang International Finance Leasing Co., Ltd. | | | 3,537 | | | | - | |
| Total | | $ | 587,108 | | | $ | - | |
Due to related parties
| | | December 31, | | | December 31, | |
| | | | 2011 | | | | 2010 | |
| | | | | | | | | |
| Due to Dongsheng International Investment Co., Ltd. | | $ | 2,899,633 | | | $ | - | |
| Due to Mr. Wenjun Tian | | | 2,542,144 | | | | - | |
| Due to Deyufarm Innovation Food(Beijing) Co., Ltd. | | | 3,338 | | | | | |
| Total | | $ | 5,445,115 | | | $ | - | |
Mr. Wenjun Tian, the President and Executive Director of the Company is also the President and Executive Director of Dongsheng International Investment Co., Ltd. Those advances as of December 31, 2011 and 2010 are unsecured, bear no interest and no due date is specified.
Guarantees
As of December 31, 2011, Zhongyuan Guoxin Credit Guarantee Co., Ltd., China Agriculture Credit Guarantee Co., Ltd., Tian Wenjun and Jianming Hao provided guarantees on short-term loans obtained by Detain Yu. Yuci Jinmao Food Processing Factory of which the legal representative is Junlian Zheng, the wife of Junde Zhang, Vice President of the Company provided guarantees on short-term loans obtained by Jinzhong Yongcheng and Jinzhong Yulian.
As of December 31, 2010, Jinzhong Deyu provided guarantees on short-term loans obtained by Jinzhong Yuliang and Jinzhong Yongcheng. Jinzhong Yuliang also provided guarantees on a short-term loan obtained by Jinzhong Yongcheng.
| NOTE 20. | SEGMENT REPORTING |
The Company defined reportable segments according to ASC Topic 280. In the fourth quarter of 2011, the management changed the structure of allocating resources and assessing performance of the group. The new three segments were identified primarily based on the structure of allocating resources and assessing performance of the group, including corn division, grain division and bulk trade division. The segment reporting information for the year ended December 31, 2011 was based on these three segments and that for the year ended December 31, 2010 was restated.
The corn division is in the business of purchasing corns from farmers, processing simply and distributing to agricultural product trading companies through wholesale. The business of grain division is conducted by purchasing of grains from farmers and distributing to wholesalers and supermarkets after processing with our own brand names, including “Deuu” and “Shi-Tie” for certified organic grain products. The business of bulk trading division is conducted by bulk purchasing and selling of raw grain.
| For The Year Ended | | Corn | | | Grain | | | Bulk Trading | | | | | | | |
| December 31, 2011 | | Division | | | Division | | | Division | | | Others | | | Total | |
| Revenues from external customers | | $ | 177,723,149 | | | $ | 40,507,527 | | | $ | 43,345,990 | | | $ | - | | | $ | 261,576,666 | |
| Intersegment revenues | | | - | | | | - | | | | - | | | | - | | | | - | |
| Interest revenue | | | 33,733 | | | | 3,867 | | | | 4,469 | | | | 90 | | | | 42,159 | |
| Interest expense | | | (608,337 | ) | | | (119,835 | ) | | | (77,429 | ) | | | - | | | | (805,601 | ) |
| Net interest (expense) income | | | (574,604 | ) | | | (115,968 | ) | | | (72,960 | ) | | | 90 | | | | (763,442 | ) |
| Depreciation and amortization | | | 479,538 | | | | 475,854 | | | | 92 | | | | 23,813 | | | | 979,297 | |
| Noncontrolling interest | | | - | | | | - | | | | - | | | | 38,673 | | | | 38,673 | |
| Segment net profit (loss) | | | 19,388,742 | | | | 2,500,612 | | | | 2,964,146 | | | | (4,338,239 | ) | | | 20,515,261 | |
| | | | | | | | | | | | | | | | | | | | | |
| | | | | | | | | | | | | | | | | | | | | |
| For The Year Ended | | Corn | | | Grain | | | Bulk Trading | | | | | | | | |
| December 31, 2010 | | Division | | | Division | | | Division | | | Others | | | Total | |
| Revenues from external customers | | $ | 69,516,954 | | | $ | 11,474,912 | | | $ | 4,183,018 | | | $ | - | | | $ | 85,174,884 | |
| Intersegment revenues | | | - | | | | - | | | | - | | | | - | | | | - | |
| Interest revenue | | | 4,823 | | | | 8,283 | | | | 4,394 | | | | 5 | | | | 17,505 | |
| Interest expense | | | (317,142 | ) | | | (24,413 | ) | | | - | | | | - | | | | (341,555 | ) |
| Net interest (expense) income | | | (312,319 | ) | | | (16,130 | ) | | | 4,394 | | | | 5 | | | | (324,050 | ) |
| Depreciation and amortization | | | (164,598 | ) | | | (372,597 | ) | | | 63,171 | | | | (15,355 | ) | | | (489,379 | ) |
| Noncontrolling interest | | | - | | | | - | | | | - | | | | - | | | | - | |
| Segment net profit (loss) | | | 11,298,781 | | | | 3,321,566 | | | | (255,912 | ) | | | (1,777,981 | ) | | | 12,586,454 | |
All of our revenues were generated from customers in China. All long-lived assets are located in China. The following tables set forth our three major customers in each segment:
| | | For The Years Ended | |
| | | December 31, | |
| | | | | | | |
| Corn Division: | | | 2011 | | | | 2010 | |
| Chengdu Zhengda Co., Ltd. | | | 5.7 | % | | | 3.7 | % |
| Shanxi Pingyao Longhai Industrial Co., Ltd. | | | 3.8 | % | | | - | |
| Chengdu Yifenghang Feed Co., Ltd. | | | 3.7 | % | | | 0.9 | % |
| Top Three Customers as % of Total Gross Sales: | | | 13.2 | % | | | 4.6 | % |
| | | | | | | | | |
| Grain Division: | | | | | | | | |
| Beijing Yilian Gifts Tech. Development Co., Ltd. | | | 8.0 | % | | | 0.1 | % |
| Tianjing Haoshoucheng Logestic Co., Ltd. | | | 4.8 | % | | | 0.9 | % |
| Tianjing Hongfuyongsheng Trading Co., Ltd. | | | 4.1 | % | | | 0.3 | % |
| Top Three Customers as % of Total Gross Sales | | | 16.9 | % | | | 1.3 | % |
| | | | | | | | | |
| Bulk Trading Division: | | | | | | | | |
| Tianjin Yimingda Grain Division | | | 28.3 | % | | | 27.0 | % |
| Shanxi Helifeihua Trading Co., Ltd. | | | 8.9 | % | | | - | |
| Shanxi Guchuan Food Co., Ltd. | | | 8.3 | % | | | - | |
| Top Three Customers as % of Total Gross Sales: | | | 45.5 | % | | | 27.0 | % |
| NOTE 21. | CONCENTRATION OF CREDIT RISK |
As of December 31, 2011 and 2010, all of the Company’s cash balances in bank were maintained within the PRC where no rule or regulation currently in place to provide obligatory insurance for bank deposits in the event of bank failure. However, the Company has not experienced any losses in such accounts and believes it is not exposed to such risks on its cash balances in bank.
For the years ended December 31, 2011 and 2010, all of the Company’s sales were generated in the PRC. In addition, all accounts receivable as of December 31, 2011 and 2010 were due from customers located in the PRC.
No single customer accounted for greater than 10% of the Company’s consolidated gross revenue for the year ended December 31, 2011 or consolidated accounts receivable as of December 31, 2011. For the year ended December 31, 2010, one customer accounted for 18% of the Company’s consolidated gross revenue while no other single customer accounted for greater than 10%. The same customer accounted for 3% of the Company’s consolidated accounts receivable as of December 31, 2010 while no single customer accounted for greater than 10%.
| NOTE 22. | COMMITMENTS AND CONTINGENCIES |
Lease Commitments
The Company leases railroad lines, warehouses, and offices under operating leases. Future minimum lease payments under operating leases with initial or remaining terms of one year or more are as follows:
| As of December 31, | | | Operating Leases | |
| 2,012 | | | $ | 134,402 | |
| 2,013 | | | | 90,206 | |
| 2,014 | | | | 85,409 | |
| 2,015 | | | | 85,409 | |
| 2,016 | | | | 85,409 | |
| | Thereafter | | | | 908,892 | |
| | | | | $ | 1,389,727 | |
Contingencies
On February 12, 2012, the Company’s former Chief Financial Officer alleged that the Company may have violated certain regulations and upon receipt of such allegations, the Company's Audit Committee retained K&L Gates LLP to conduct an inquiry into such allegations. On March 27, 2012, the Company received a letter asserting a claim of wrongful termination wherein the former Chief Financial Officer seeks payment of $250,000 plus the issuance of 60,000 common stock options in settlement for the claimed damages therein.
The Company believes that such allegations and claims are without merit and intends to vigorously defend such allegations and claims. Because the inquiry is in its initial stages, the Company is not currently able to predict the probability of a favorable or unfavorable outcome, or the amount of any possible loss in the event of an unfavorable outcome. Consequently, no material provision or liability has been recorded for such allegations and claims as of December 31, 2011. However, management is confident in its defenses to such allegations and claims.
| NOTE 23. | SUBSEQUENT EVENTS |
On January 11, 2012, Detain Yu obtained a bank loan of $262,158 (or RMB 1,650,000) from China Merchants Bank Beijing, bearing interest at a floating rate of prime rate plus 20% of prime rate, of which prime rate was based on one-year loan interest rate released by The People's Bank of China. The term of the loan started from January 11, 2012 with maturity date on January 10, 2013. The loan was guaranteed by China Agriculture Credit Guarantee Co., Ltd. for a period of one year starting from January 11, 2012.
On February 2, 2012, Shenzhen Redsun, a wholly-owned subsidiary of the Company entered into a Stock Equity Transfer Agreement whereby Shenzhen Redsun acquired 100% of the issued and outstanding registered share capital of Taizihuand its subsidiary, Huichun. The total amount of the consideration paid for the acquisition of the Taizihu Group is RMB34.7 million ($5.5 million), and such consideration was determined pursuant to arm’s length negotiations between the parties. As a result of the acquisition, the Company now owns and controls 100% of the Taizihu Group.
On March 19, 2012, Jinzhong Deyu, a wholly-owned subsidiary of the Company entered into an Assets Exchange Agreement with a third party whereby Jinzhong Deyu exchange its timberland with RMB10.3 million ($1.6 million) of carrying amount for an office building with paying cash consideration of RMB7.2 million ($1.1 million) for the variance between the fair values of the office building and the timberland. No material gain or loss was generated from this exchange transaction.
On March 8, 2012, the Company’s Board of Directors allocated to and authorized for use the maximum number of shares allowable pursuant to the terms of the Plan and granted 420,000 options under the Plan, of which 264,000 were new options and 156,000 were re-granted after such options were forfeited by employees as a result of their resignations from the Company in accordance with the terms of their option agreements. All of the newly granted options vest as follows:
50% of the options granted will vest six (6) months after the date of the grant; and
50% of the options granted will vest twelve (12) months after the date of the grant.
Management was in the process of completing the fair value measurement of the 420,000 options granted as of the date of this filing.