Free signup for more
- Track your favorite companies
- Receive email alerts for new filings
- Personalized dashboard of news and more
- Access all data and search results
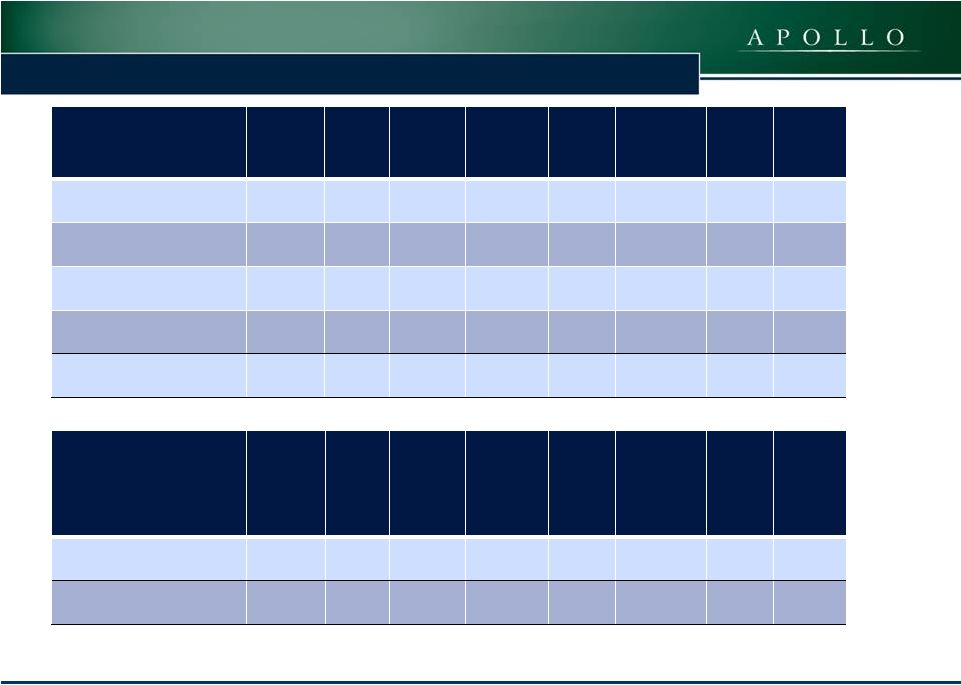
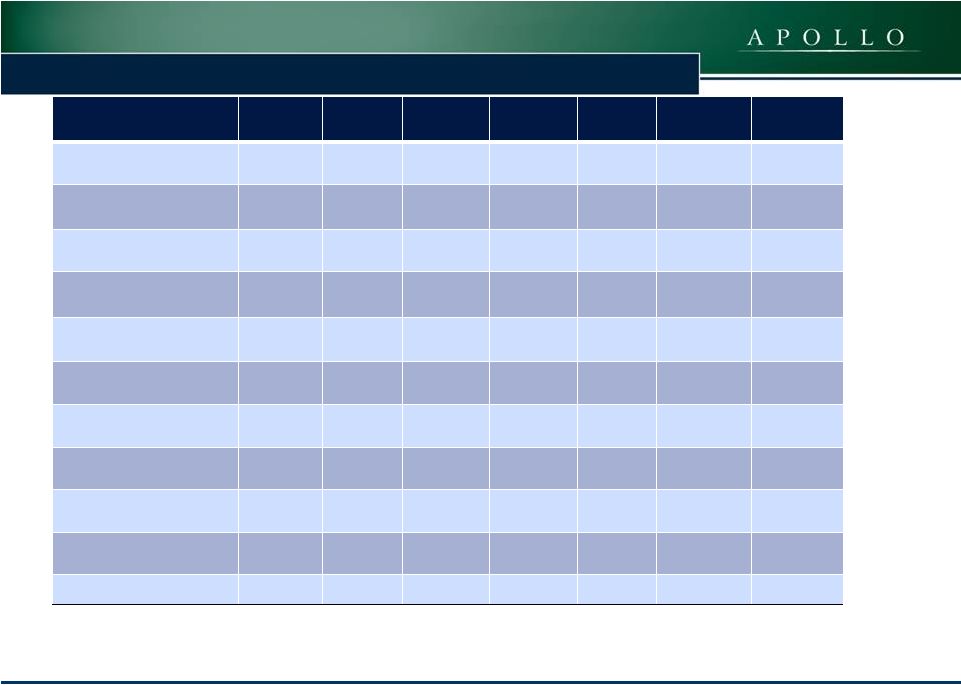
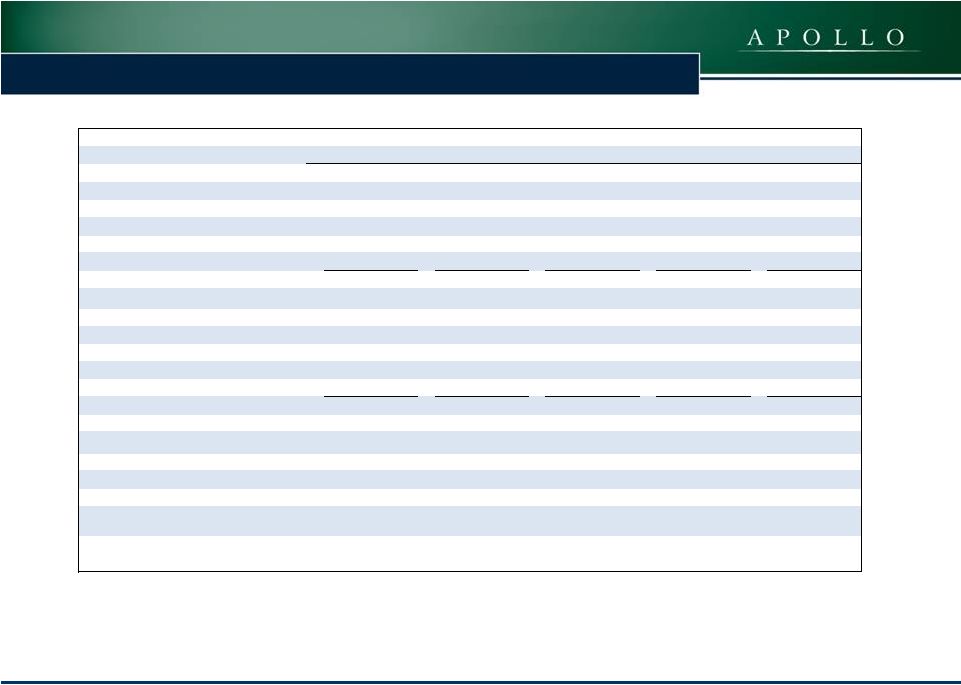
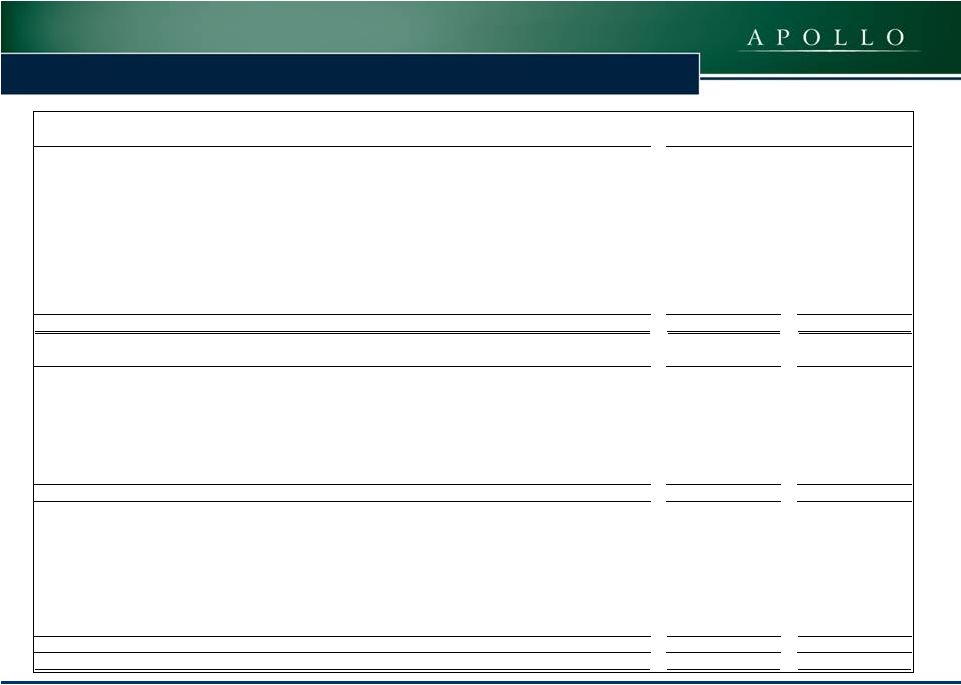
Filing tables
Related financial report
ARI similar filings
- 26 Feb 13 Creation of a Direct Financial Obligation or an Obligation under an Off-Balance Sheet Arrangement of a Registrant
- 7 Feb 13 Creation of a Direct Financial Obligation or an Obligation under an Off-Balance Sheet Arrangement of a Registrant
- 4 Jan 13 Creation of a Direct Financial Obligation or an Obligation under an Off-Balance Sheet Arrangement of a Registrant
- 2 Nov 12 Third Quarter 2012 Financial Results and Declares a $0.40
- 9 Oct 12 Entry into a Material Definitive Agreement
- 2 Oct 12 Other Events
- 7 Aug 12 Second Quarter 2012 Financial Results and Declares a $0.40
Filing view
External links