 February 28, 2013 Supplemental Financial Information Presentation Q4 2012 Information is as of December 31, 2012 except as otherwise noted. It should not be assumed that investments made in the future will be profitable or will equal the performance of investments in this document. Exhibit 99.2 |
 Legal Disclaimer COMMERCIAL REAL ESTATE FINANCE, INC. (“ARI”) We make forward-looking statements in this presentation and other filings we make with the SEC within the meaning of Section 27A of the Securities Act of 1933, as amended, and Section 21E of the Securities Exchange Act of 1934, as amended, and such statements are intended to be covered by the safe harbor provided by the same. Forward-looking statements are subject to substantial risks and uncertainties, many of which are difficult to predict and are generally beyond our control. These forward-looking statements include information about possible or assumed future results of our business, financial condition, liquidity, results of operations, plans and objectives. When we use the words “believe,” “expect,” “anticipate,” “estimate,” “plan,” “continue,” “intend,” “should,” “may” or similar expressions, we intend to identify forward- looking statements. Statements regarding the following subjects, among others, may be forward-looking: our business and investment strategy; our operating results; our ability to obtain and maintain financing arrangements; the return on equity, the yield on investments and risks associated with investing in real estate assets, including changes in business conditions and the general economy. The forward-looking statements are based on our beliefs, assumptions and expectations of our future performance, taking into account all information currently available to us. Forward-looking statements are not predictions of future events. These beliefs, assumptions and expectations can change as a result of many possible events or factors, not all of which are known to us. Some of these factors are described under “Risk Factors,” and “Management’s Discussion and Analysis of Financial Condition and Results of Operations” as included in ARI’s Annual Report on Form 10-K for the fiscal year ended December 31, 2011 and other periodic reports filed with the Securities and Exchange Commission. If a change occurs, our business, financial condition, liquidity and results of operations may vary materially from those expressed in our forward- looking statements. Any forward-looking statement speaks only as of the date on which it is made. New risks and uncertainties arise over time, and it is not possible for us to predict those events or how they may affect us. Except as required by law, we are not obligated to, and do not intend to, update or revise any forward-looking statements, whether as a result of new information, future events or otherwise. This presentation may contain statistics and other data that in some cases has been obtained from or compiled from information made available by third-party service providers. 1 |
 2 Apollo Commercial Real Estate Finance, Inc. 2012 Fourth Quarter Earnings Call February 28, 2013 Stuart Rothstein Chief Executive Officer, President and Chief Financial Officer Scott Weiner Chief Investment Officer of the Manager Megan Gaul Controller of the Manager Hilary Ginsberg Investor Relations Manager COMMERCIAL REAL ESTATE FINANCE, INC. (“ARI”) |
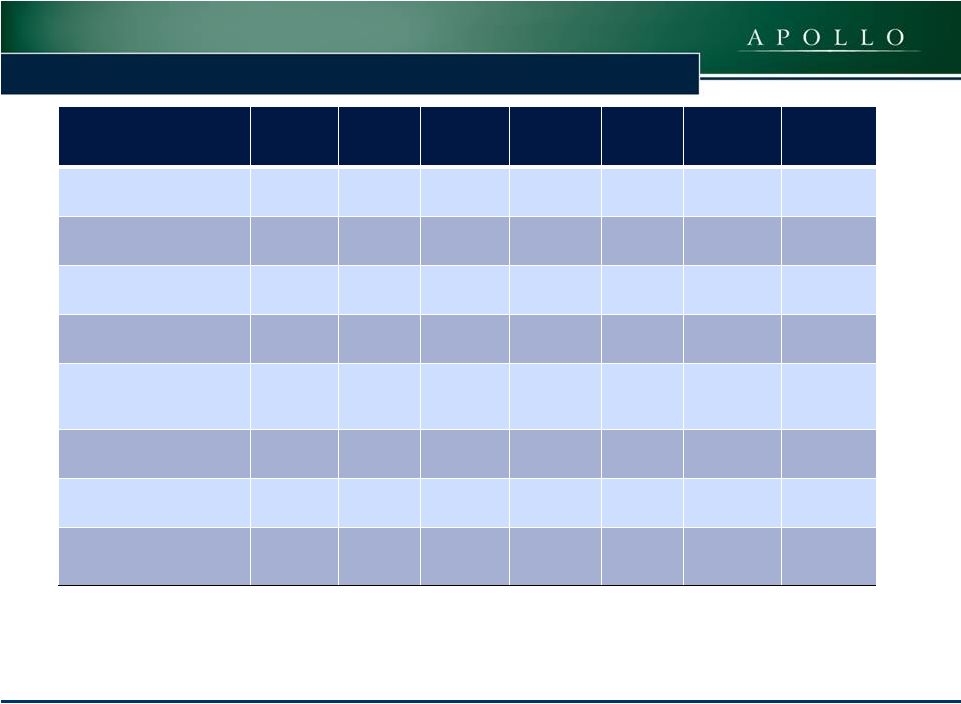
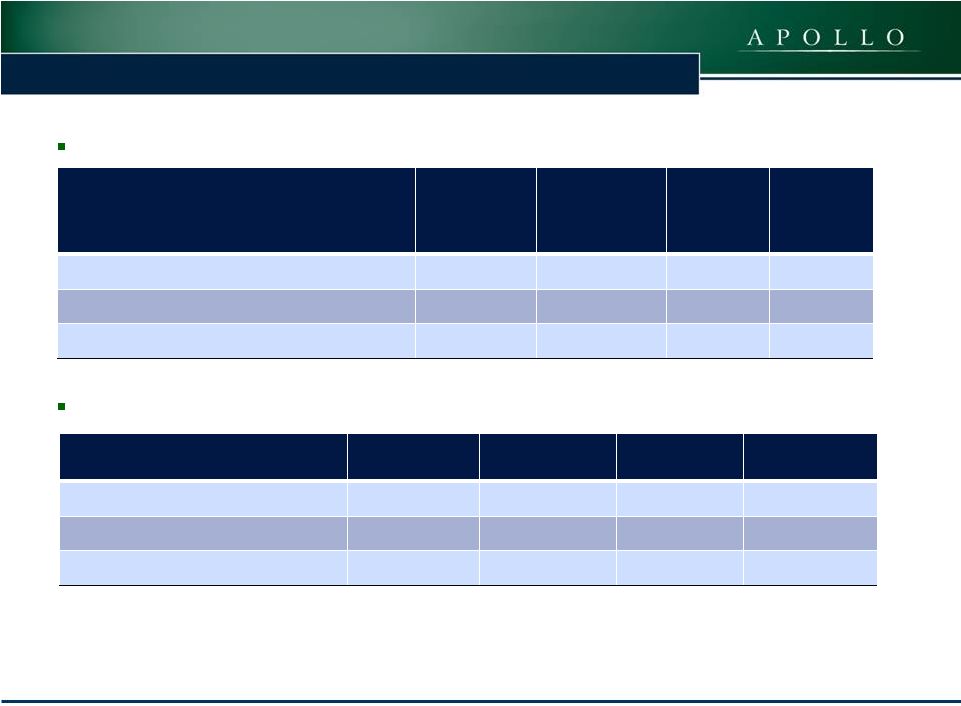
 3 ARI – Financial Summary (1) Operating Earnings is a non-GAAP financial measure that is used to approximate cash available for distribution and is defined by the Company as net income, computed in accordance with GAAP, adjusted for (i) non-cash equity compensation expense (a portion of which may become cash-based upon final vesting and settlement of awards should the holder elect net share settlement to satisfy income tax withholding) and (ii) any unrealized gains or losses or other non-cash items included in net income. Please see slide 25 for a reconciliation of Operating Earnings and Operating Earnings per Share to GAAP net income and GAAP net income per share. (2) Fixed rate debt refers to the TALF borrowings which were refinanced with the Wells repurchase facility during January 2012. (3) Fixed charge coverage is EBITDA divided by interest expense plus the preferred stock dividends. Income Statement December 31, 2012 December 31, 2011 % Change December 31, 2012 December 31, 2011 % Change 13,766 $ 14,564 $ -5.5% 57,079 $ 52,918 $ 7.9% (1,463) $ (3,618) $ -59.6% (8,402) $ (14,454) $ -41.9% Net interest income (in thousands) 12,303 $ 10,946 $ 12.4% 48,677 $ 38,464 $ 26.6% 0.27 $ 0.39 $ -30.8% 1.50 $ 1.47 $ 2.0% 27,608,787 20,561,032 34.3% 22,648,819 18,840,954 20.2% Balance sheet December 31, 2012 December 31, 2011 % Change 669,478 $ 860,247 $ -22.2% 444,320 $ 318,220 $ 39.6% Common stockholders equity 460,674 $ 336,978 $ 36.7% 86,250 $ - $ - $ 251,327 $ 225,158 $ 290,700 $ 0.5x 1.6x 3.3x 3.9x Three Months Ended Twelve Months Ended Interest income (in thousands) Interest expense (in thousands) Operating earnings per share (1) Basic and diluted weighted average common shares outstanding Investments at amortized cost (in thousands) Net equity in investments at cost (in thousands) Preferred stockholders equity Debt to common equity Fixed rate debt (in thousands) (2) Fixed charge coverage (3) Floating rate debt (in thousands) COMMERCIAL REAL ESTATE FINANCE, INC. (“ARI”) |
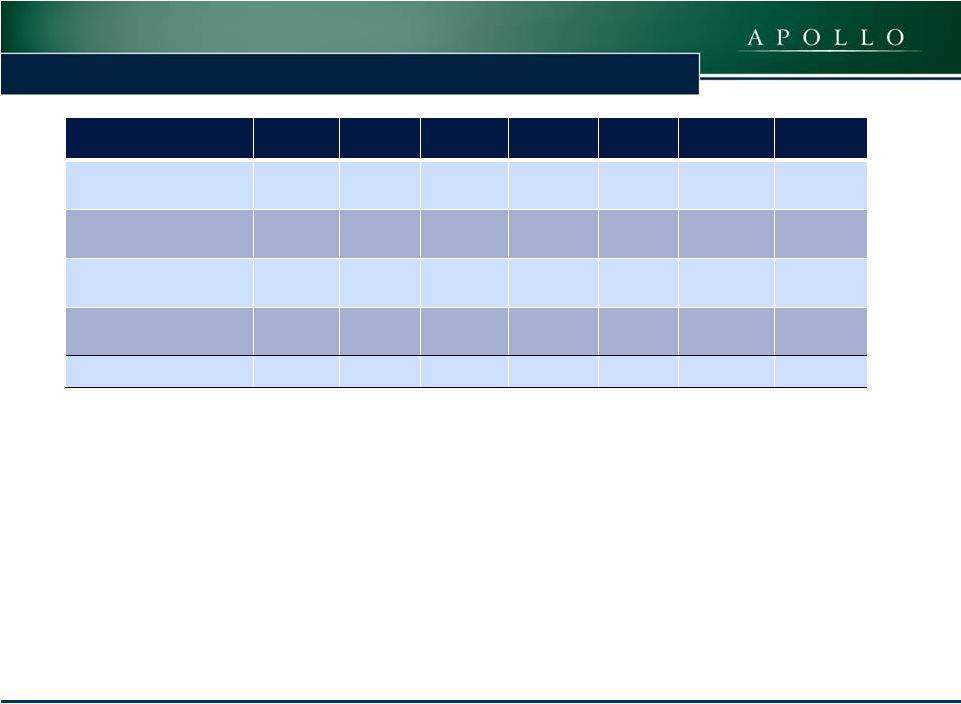
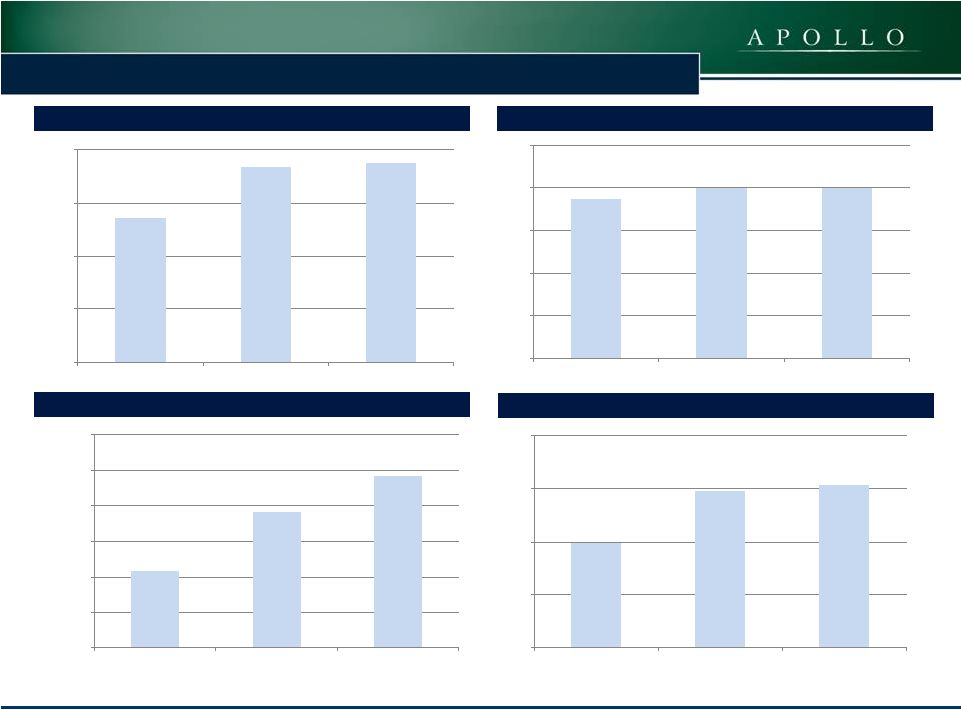 ARI – Historical Overview Operating Earnings per Share (1) Dividends per Common Share Net Interest Income ($000s) Return on Common Equity Based on Operating Earnings (2) $1.50 $1.60 $1.60 $0.00 $0.40 $0.80 $1.20 $1.60 $2.00 2010 2011 2012 $1.09 $1.47 $1.50 $0.00 $0.40 $0.80 $1.20 $1.60 2010 2011 2012 $21,771 $38,464 $48,677 $0 $10,000 $20,000 $30,000 $40,000 $50,000 $60,000 2010 2011 2012 5.9% 8.9% 9.2% 0.0% 3.0% 6.0% 9.0% 12.0% 2010 2011 2012 COMMERCIAL REAL ESTATE FINANCE, INC. (“ARI”) 4 (1) Operating Earnings is a non-GAAP financial measure that is used to approximate cash available for distribution and is defined by the Company as net income, computed in accordance with GAAP, adjusted for (i) non-cash equity compensation expense (a portion of which may become cash-based upon final vesting and settlement of awards should the holder elect net share settlement to satisfy income tax withholding) and (ii) any unrealized gains or losses or other non-cash items (2) Return on common equity is calculated as annualized Operating Earnings for the period as a percentage of average stockholders equity for the period. included in net income. Please see slide 25 for a reconciliation of Operating Earnings and Operating Earnings per Share to GAAP net income and GAAP net income per share. |
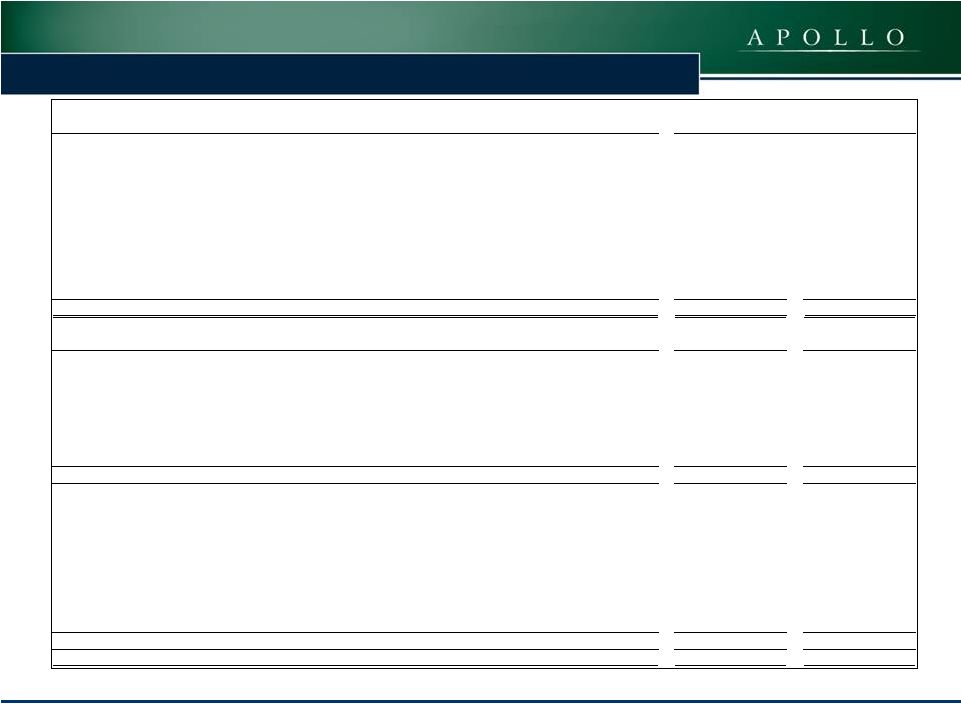
 COMMERCIAL REAL ESTATE FINANCE, INC. (“ARI”) 5 COMMERCIAL REAL ESTATE FINANCE, INC. (“ARI”) ARI – Q4 Highlights Financial Results & Earnings Per Share Operating Earnings for the quarter ended December 31, 2012 of $7.4 million, or $0.27 per diluted common share (1) – Decline in operating earnings primarily due to the timing of the deployment of capital raised from the July preferred stock offering and the October common stock offering – Net interest income of $12.3 million for Q4 2012 – Total expenses of $3.3 million, comprised of management fees of $2.0 million, G&A of $0.9 million and non-cash stock based compensation of $0.4 million – GAAP net income available to common stockholders for the quarter ended December 31, 2012 of $7.1 million, or $0.26 per diluted common share Dividends Declared a dividend of $0.40 per share of common stock for the quarter ended March 31, 2013 – Eleventh consecutive quarter of maintaining consistent dividend level – 9.2% annualized dividend yield based on $17.36 closing price on February 26, 2013 Declared a dividend on the Company’s 8.625% Series A Cumulative Redeemable Perpetual Preferred Stock of $0.5391 per share for stockholders of record on December 31, 2012 (1) Operating Earnings is a non-GAAP financial measure that is used to approximate cash available for distribution and is defined by the Company as net income, computed in accordance with GAAP, adjusted for (i) non-cash equity compensation expense (a portion of which may become cash-based upon final vesting and settlement of awards should the holder elect net share settlement to satisfy income tax withholding) and (ii) any unrealized gains or losses or other non-cash items included in net income. Please see slide 25 for a reconciliation of Operating Earnings and Operating Earnings per Share to GAAP net income and GAAP net income per share. 5 |
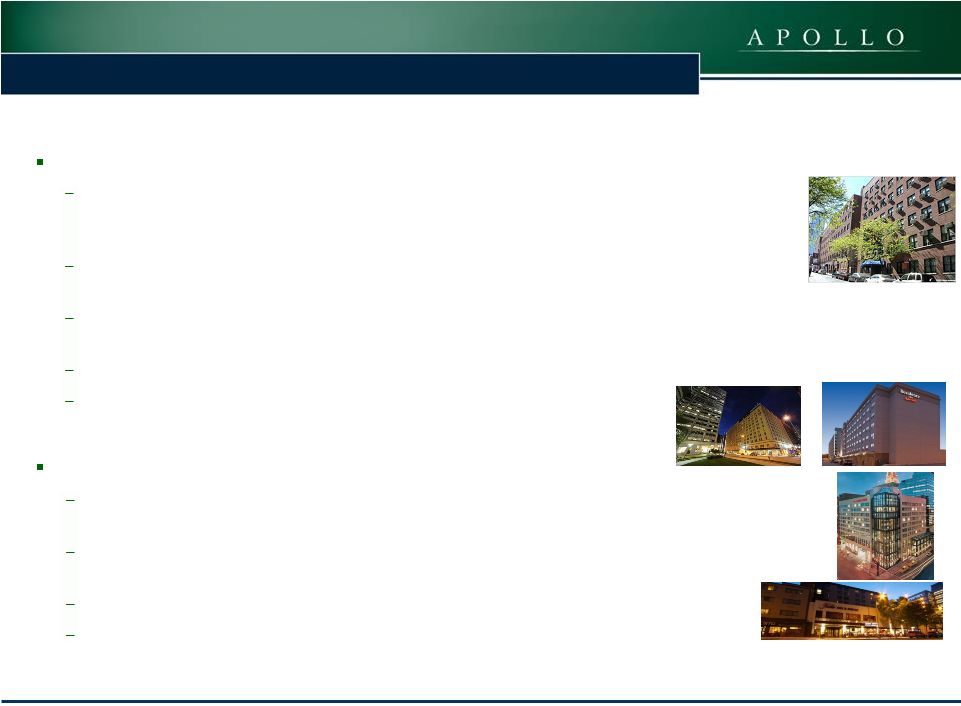
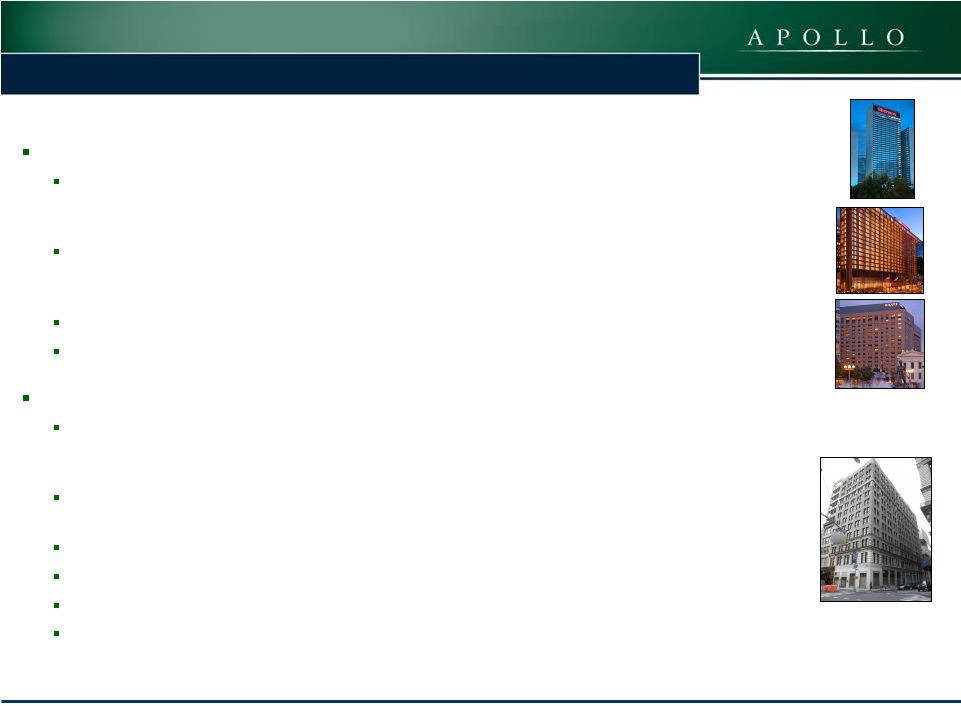 6 COMMERCIAL REAL ESTATE FINANCE, INC. (“ARI”) ARI – Q4 Highlights Investment and Portfolio Activity Mezzanine Loan, Hotel Portfolio $50 million junior mezzanine loan secured by a pledge of the equity interest in a borrower that owns three full-service conference hotels located in Dallas, TX, Denver, CO and St. Louis, MO, totaling 3,981 keys Part of a new $410 million, four-year floating rate financing comprised of a $295 million first mortgage loan and a $115 million mezzanine loan, which was bifurcated into a $65 million senior mezzanine loan and the $50 million junior mezzanine loan Appraised LTV – 61%; Interest rate – LIBOR + 10.9%; 30-year amortization; Origination Fee – 0.5% Underwritten IRR (1) ~ 13% Whole Loan, Condominium Conversion, New York, NY $80 million whole loan commitment for a condominium conversion located in the TriBeCa neighborhood of NYC; The property will have 66 units with approximately 96,000 net salable square feet and approximately 3,000 square feet of retail space $45 million first mortgage loan and $0.4 million of a $35 million mezzanine loan were funded at closing; the balance is expected to be funded throughout the conversion process Initial term of two years, with two 12-month extensions, subject to completion hurdles Interest rate – LIBOR+8.5% (0.5% LIBOR floor); 1.0% origination fee; 1.0% exit fee Underwritten loan-to-net sellout (assuming loan is fully funded) – 55% Underwritten unlevered IRR (1) ~ 11% (1) The internal rates of return (“IRR”) for the investments listed reflect the returns underwritten by the Manager, calculated on a weighted average basis assuming no dispositions, early prepayments or defaults but assumes extensions as well as the cost of borrowings and derivative instruments under the Company’s master repurchase agreement with Wells Fargo Bank, N.A. (“Wells Facility”). The calculation for the New York City whole loan also assumes certain estimates with respect to the timing and magnitude of future fundings for the remaining commitments and associated loan repayments, as well as assuming no defaults. There can be no assurance the actual IRRs will equal the underwritten IRRs shown. See “Risk Factors” in the Company’s Annual Report on Form 10-K for the year ended December 31, 2011 for a discussion of some of the factors that could adversely impact the returns received by the Company from the investments over time. 6 |
 COMMERCIAL REAL ESTATE FINANCE, INC. (“ARI”) ARI – Q4 Highlights Capital Markets Activity Common Stock Offering Completed an underwritten public offering of 7,404,460 shares of common stock, including the partial exercise of the underwriters’ option to purchase additional shares, raising net proceeds of approximately $124.1 million Portfolio Summary Total investments with an amortized cost of $669 million at December 31, 2012 Current weighted average underwritten IRR of approximately 12.7% and levered weighted average underwritten IRR of approximately 14.1% at December 31, 2012 (1) Book Value GAAP book value of $16.43 per share as of December 31, 2012 Fair value of $16.84 per share as of December 31, 2012 (2) ARI closed at $17.36 on February 26, 2013, a 5.7% premium to GAAP book value per share (1) The internal rates of return (“IRR”) for the investments listed reflect the returns underwritten by the Manager, calculated on a weighted average basis assuming no dispositions, early prepayments or defaults but assumes extensions as well as the cost of borrowings and derivative instruments under the Wells Facility. The calculation also assumes extension options on the Wells Facility with respect to the Hilton CMBS are exercised. The calculation for the New York City whole loan also assumes certain estimates with respect to the timing and magnitude of future fundings for the remaining commitments and associated loan repayments, as well as assuming no defaults. There can be no assurance the actual IRRs will equal the underwritten IRRs shown. See “Risk Factors” in the Company’s Annual Report on Form 10-K for the year ended December 31, 2011 for a discussion of some of the factors that could adversely impact the returns received by the Company from the investments over time. Substantially all of the Company’s borrowings under the Company's master repurchase facility with JPMorgan Chase Bank, N.A. (the "JPMorgan Facility") were repaid upon the closing of the Company’s Series A Preferred Stock offering in August 2012. The Company's ability to achieve its levered weighted average underwritten IRR is additionally dependent upon the Company re-borrowing approximately $53 million under the JPMorgan Facility or any replacement facility. Without such re-borrowing, the levered weighted average IRR with regard to its portfolio of first mortgage loan will be significantly lower than the amount shown above, as indicated by the current weighted average underwritten IRR above. (2) The Company carries loans at amortized cost and its CMBS securities are marked to market. Management has estimated that the fair value of the Company’s financial assets at December 31, 2012 was approximately $11.5 million greater than the carrying value of the Company’s investment portfolio as of the same date. This represents a premium of $0.41 per share over the Company's GAAP book value as of December 31, 2012. 7 |
 COMMERCIAL REAL ESTATE FINANCE, INC. (“ARI”) ARI – Subsequent Events Subsequent Events Mezzanine Loan – Multifamily Conversion, New York, NY $18 million mezzanine loan commitment secured by a pledge of the equity interests in the owner of two buildings in Midtown Manhattan which contain a total of 181,637 rentable square feet that is being converted into 215 multifamily units Part of a $90 million, three year, interest only, floating rate financing comprised of the $18 million mezzanine loan and a $72 million first mortgage loan Interest rate – LIBOR+10.0%, increasing to LIBOR+11.0% as certain funding hurdles are met; 1.0% origination fee Underwritten LTV (assuming first mortgage loan is fully funded) – 60% Underwritten IRR (1) ~ 13% Mezzanine Loan – Hotel Portfolio, Rochester, MN $25 million mezzanine loan secured by a pledge of the equity interests in the owner of a portfolio of four hotels totaling 1,231 keys located in Rochester, Minnesota Part of a $145 million, five-year, fixed-rate financing comprised of a $120 million first mortgage loan and the $25 million mezzanine loan provided in connection with the acquisition of the portfolio Interest rate – 11.0%; Appraised LTV – 69% Underwritten IRR (1) ~ 12% (1) The internal rates of return (“IRR”) for the investments listed reflect the returns underwritten by the Manager, calculated on a weighted average basis assuming no dispositions, early prepayments or defaults but assumes extensions as well as the cost of borrowings and derivative instruments under the Wells Facility. There can be no assurance the actual IRRs will equal the underwritten IRRs shown. See “Risk Factors” in the Company’s Annual Report on Form 10-K for the year ended December 31, 2011 for a discussion of some of the factors that could adversely impact the returns received by the Company from the investments over time. 8 |
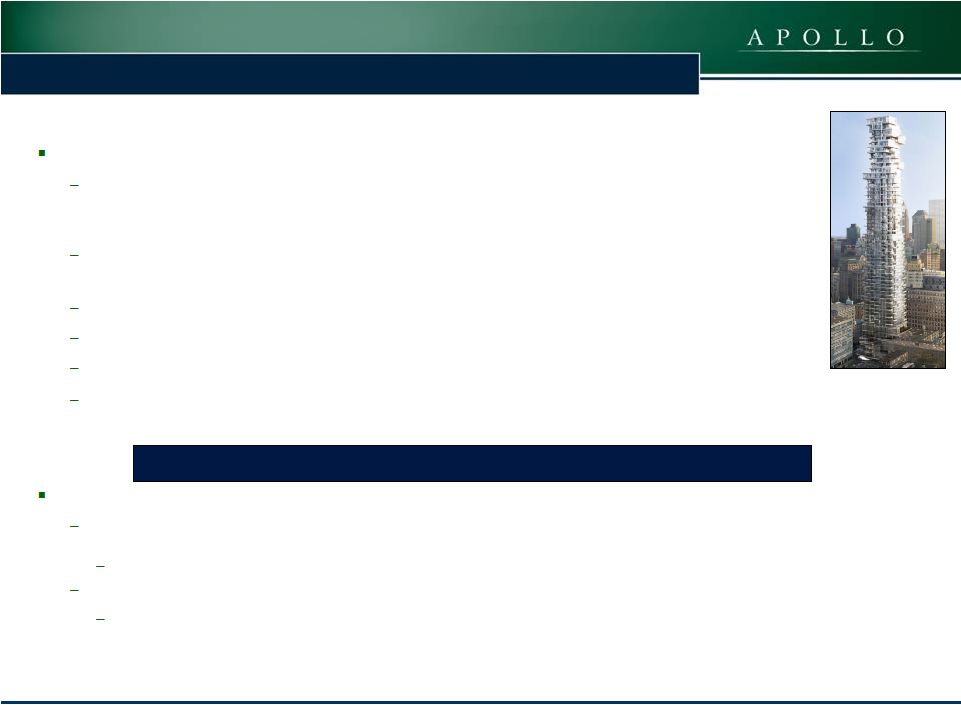 ARI – Subsequent Events (cont.) Mezzanine Loan – Condominium Development, New York, NY $60 million mezzanine loan commitment secured by a pledge of preferred equity interests in the owner of a to-be-developed 352,624 net saleable square foot, 57-story, 146-unit condominium tower located in the TriBeCa neighborhood of New York City $46 million funded at closing with the remaining $14 million expected to be funded in six months following closing Interest rate – 13.25%; 1.0% origination fee and 1.0% exit fee Initial term of 54 months, with one extension option for 12-months Underwritten loan-to-net sellout (assuming loan is fully funded) – 55%; Underwritten IRR (1) ~ 16% Repayments Principal repayment on two mezzanine loans totaling $50 million secured by a portfolio of shopping centers Received $2.5 million yield maintenance payment; Total realized IRR on investment – 15% Full principal repayment on repurchase agreement secured by CDO bonds Total realized IRR on investment – 17% 9 (1) The internal rates of return (“IRR”) for the investment listed reflects the returns underwritten by the Manager, calculated on a weighted average basis assuming no dispositions, early prepayments or defaults but assumes extensions as well as the cost of borrowings and derivative instruments under the Wells Facility. The calculation for this investment also assumes certain estimates with respect to the timing and magnitude of future fundings for the remaining commitments and associated loan repayments, as well as assuming no defaults. There can be no assurance the actual IRRs will equal the underwritten IRRs shown. See “Risk Factors” in the Company’s Annual Report on Form 10-K for the year ended December 31, 2011 for a discussion of some of the factors that could adversely impact the returns received by the Company from the investments over time. Total YTD 2013 Investment Activity - $103 million COMMERCIAL REAL ESTATE FINANCE, INC. (“ARI”) Subsequent Events |
 10 ARI – Subsequent Events (cont.) Subsequent Events Amendment to JP Morgan Facility Extended the term of the facility for two years (one-year term with one, 364 day extension) Pricing to remain at LIBOR+2.50% ARI paid a 0.5% fee for the first year and will pay a 0.25% extension fee for the 364 day extension Amendment to Wells Facility Reduced interest rate for outstanding borrowings used to finance AAA CMBS to LIBOR+1.05% from LIBOR+1.25% - 1.50% Reduced interest rate for outstanding borrowings used to finance Hilton CMBS to LIBOR+1.75% from LIBOR+2.35% Extended the term for the outstanding borrowings used to finance the AAA CMBS until March 2014 Corporate Governance Board of Directors appointed Megan Gaul to the positions of Chief Financial Officer, Treasurer and Secretary, effective April 1, 2013 COMMERCIAL REAL ESTATE FINANCE, INC. (“ARI”) |
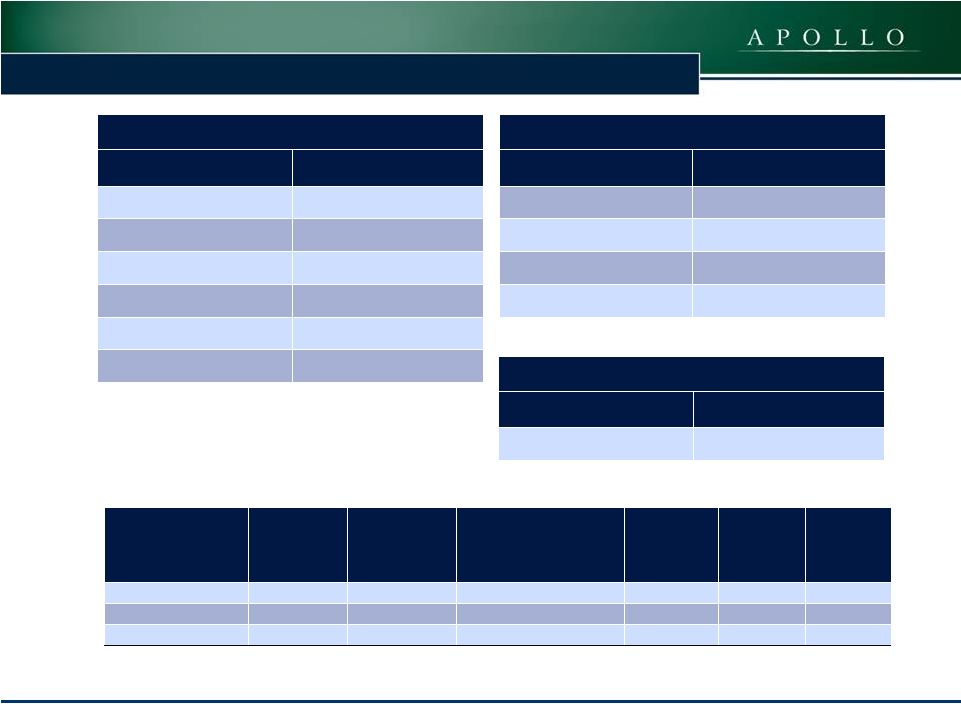
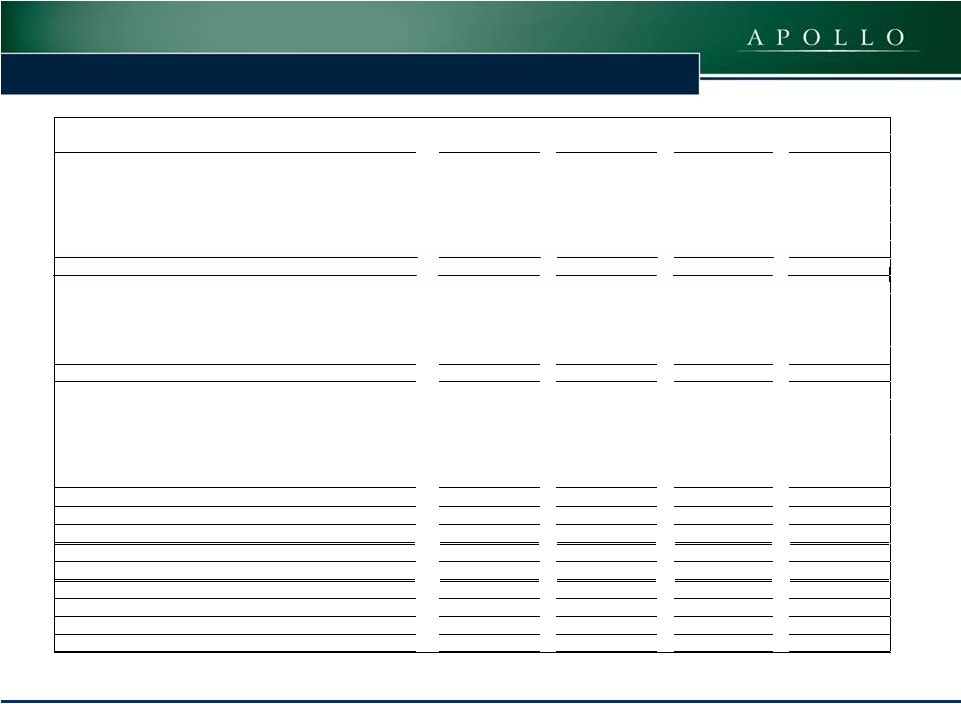
 11 ARI – Portfolio Overview Asset Type ($000s) Amortized Cost Borrowings Equity at Cost Remaining Weighted Average Life (years ) (1) Current Weighted Average IRR (2)(3) Levered Weighted Average IRR (4) First Mortgage Loans (2) $142,921 $3 $142,918 2.6 10.8% 15.6% Subordinate Loans 246,246 - 246,246 4.7 13.6 13.6 Repurchase Agreements 6,598 - 6,598 1.2 13.7 13.7 CMBS - AAA 203,463 176,827 26,636 1.8 15.3 15.3 CMBS - Hilton 70,250 48,328 21,922 2.9 11.6 11.6 Investments at December 31, 2012 $669,478 $225,158 $444,320 3.1 Years 12.7% 14.1% As of December 31, 2012. (1) Remaining Weighted Average Life assumes all extension options are exercised. (2) Borrowings under the Company’s master repurchase facility with JPMorgan (the “JPMorgan Facility”) bear interest at LIBOR plus 250 basis points, or 2.7% at December 31, 2012. The IRR calculation further assumes the JPM Facility or any replacement facility will remain available over the life of these investments. (3) The IRR for the investments shown in the above table reflect the returns underwritten by the Manager, calculated on a weighted average basis assuming no dispositions, early prepayments or defaults but assumes extensions as well as the cost of borrowings and derivative instruments under the Wells Facility. The calculation also assumes extension options on the Wells Facility with respect to the Hilton CMBS are exercised. The calculation for the New York City whole loan also assumes certain estimates with respect to the timing and magnitude of future fundings for the remaining commitments and associated loan repayments, as well as assuming no defaults. There can be no assurance the actual IRRs will equal the underwritten IRRs shown in the table. See “Risk Factors” in the Company’s Annual Report on Form 10-K for the year ended December 31, 2011 for a discussion of some of the factors that could adversely impact the returns received by the Company from the investments shown in the table over time. (4) Substantially all of the Company’s borrowings under the JPMorgan Facility were repaid upon the closing of the Company’s Series A Preferred Stock offering in August 2012. The Company's ability to achieve its underwritten levered weighted average IRR with regard to its portfolio of first mortgage loans is additionally dependent upon the Company re-borrowing approximately $53,000 under the JPMorgan Facility or any replacement facility. Without such re-borrowing, the levered weighted average IRRs will be as indicated in the current weighted average IRR column above. COMMERCIAL REAL ESTATE FINANCE, INC. (“ARI”) |
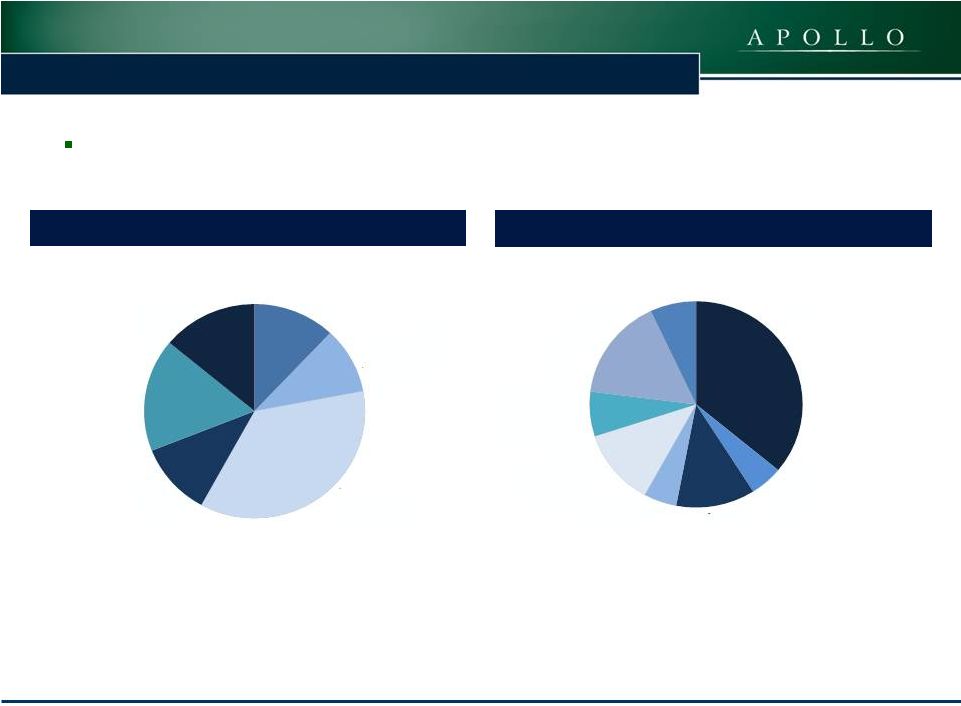
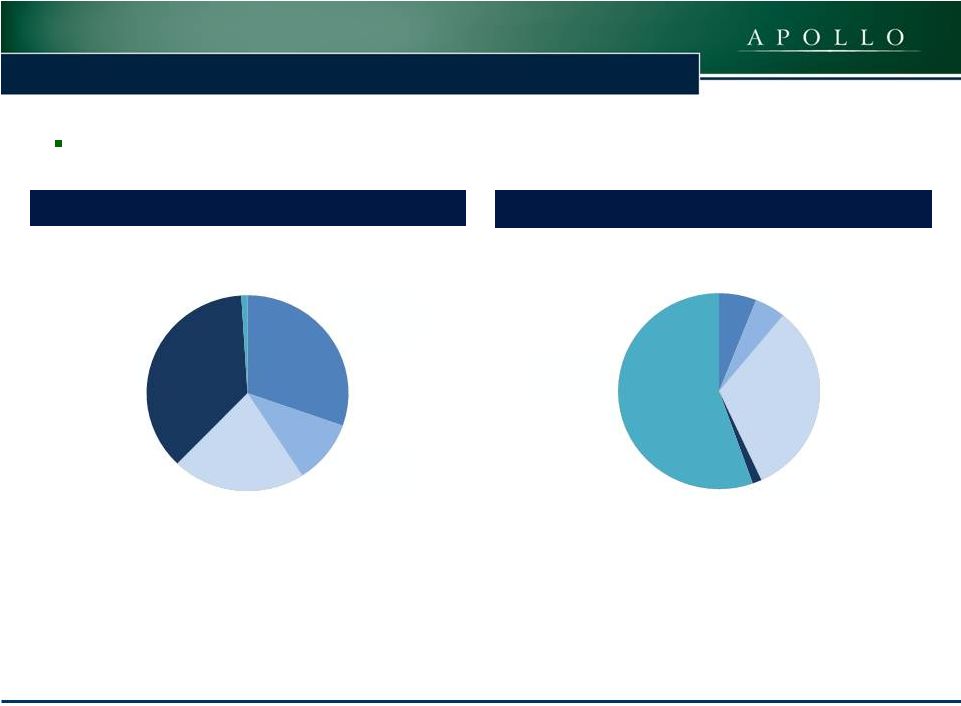 12 COMMERCIAL REAL ESTATE FINANCE, INC. (“ARI”) ARI – Portfolio Overview Diversified Investment Portfolio with Amortized Cost Basis of $669 million Net Invested Equity at Amortized Cost Basis Gross Assets at Amortized Cost Basis CMBS - AAA 30% CMBS - Hilton 10% First Mortgages 21% Subordinate Loans 37% Repurchase Agreements 1% CMBS - AAA 6% CMBS - Hilton 5% First Mortgages 32% Repurchase Agreements 1% Subordinate Loans 55% 12 |
 ARI – Portfolio Diversification The portfolio is diversified by property type and geographic location Geographic Diversification by Net Equity Property Type by Net Equity (1) Other category includes the subordinate financing on a ski resort and a first mortgage loan on a development site with income producing parking lots. Securities 12% Residential 10% Hotel 36% Office 11% Retail 17% Mixed Use/Other(1) 14% New York City 36% Northeast (excluding NYC) 5% Securities 12% Southeast 5% Mid-Atlantic 12% Midwest 7% West 16% Southwest 7% COMMERCIAL REAL ESTATE FINANCE, INC. (“ARI”) 13 |
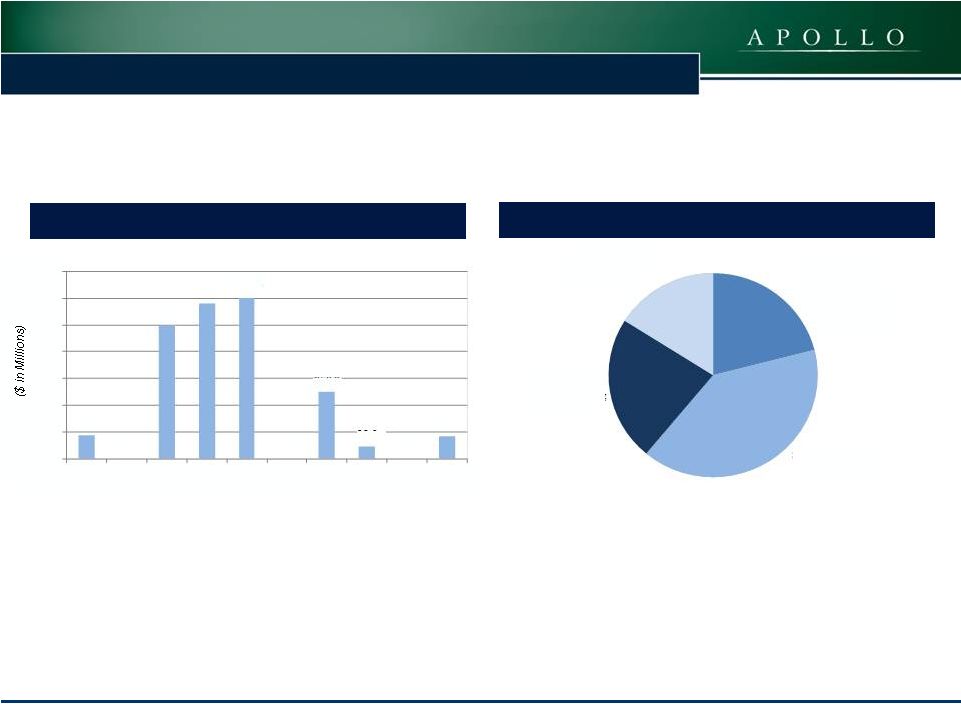 COMMERCIAL REAL ESTATE FINANCE, INC. (“ARI”) ARI – Loan Portfolio - Maturity and Type (1) Based upon Face Amount of Loans; Does not include CMBS (AAA or Hilton) or repurchase agreement investment secured by CDO bond. Fully Extended Loan Maturity Schedule ($000s) (1) Loan Position and Rate Type (1) 14 $17.3 $- $99.3 $116.2 $120.0 $- $50.0 $8.9 $- $16.5 $0 $20 $40 $60 $80 $100 $120 $140 2013 2014 2015 2016 2017 2018 2019 2020 2021 2022 Senior Loan Fixed 21% Subordinate Loan Fixed 40% Subordinate Loan Floating 23% Senior Loan Floating 16% |
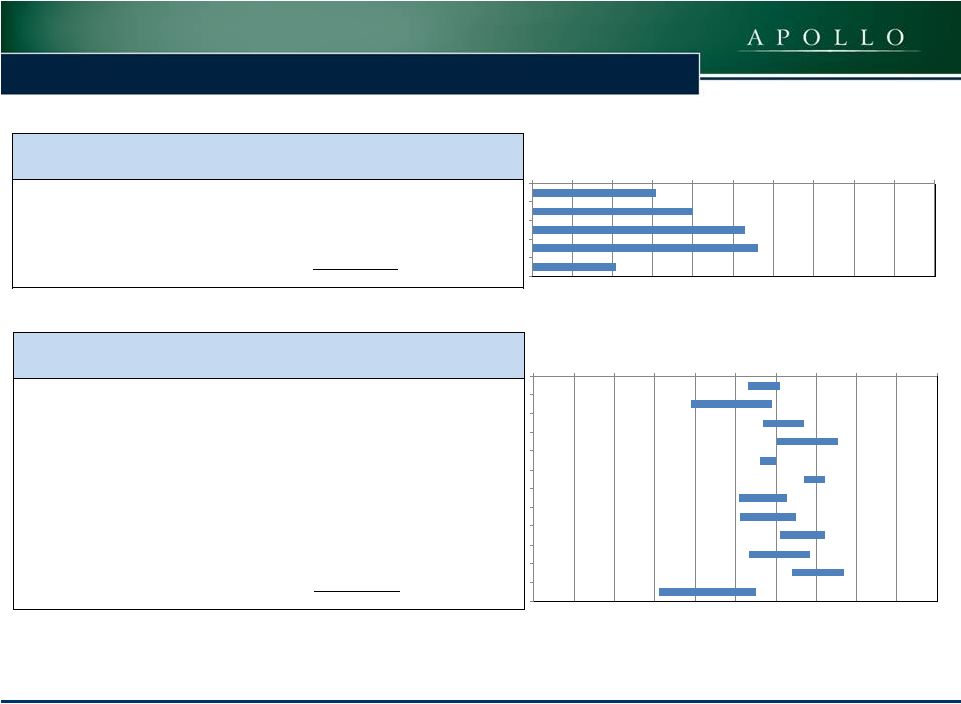 15 ARI – Loan Portfolio – Loan Level LTV (Through Last Invested Dollar) First Mortgage Loans Subordinate Financing 0% 10% 20% 30% 40% 50% 60% 70% 80% 90% 100% 0% 10% 20% 30% 40% 50% 60% 70% 80% 90% 100% Description ($ in thousands) Location Balance at December 31, 2012 Starting LTV Ending LTV (1) Subordinate - Hotel Portfolio Various 49,950 $ 53% 61% Subordinate - Ski Resort California 40,000 $ 29% 56% Subordinate - Retail Various 30,000 $ 58% 68% Subordinate - Retail Virginia 26,243 $ 60% 74% Subordinate - Hotel Portfolio New York 25,000 $ 40% 60% Subordinate - Retail Various 20,000 $ 58% 72% Subordinate - Hotel New York 15,000 $ 51% 63% Subordinate - Hotel New York 15,000 $ 51% 65% Subordinate - Office Missouri 9,979 $ 62% 72% Subordinate - Office Michigan 8,912 $ 53% 68% Subordinate - Mixed Use North Carolina 6,525 $ 65% 77% Subordinate - Condo Conversion (2) New York 350 $ 31% 55% Total 246,959 $ Description ($ in thousands) Location Balance at December 31, 2012 Starting LTV Ending LTV (1) First Mortgage - Condo Conversion (2) New York 45,000 $ 0% 31% First Mortgage - Hotel New York 31,571 $ 0% 40% First Mortgage - Office New York 27,419 $ 0% 53% First Mortgage - Hotel Maryland 25,273 $ 0% 56% First Mortgage - Parking/Development Site (3) Massachusetts 17,287 $ 0% 21% Total 146,550 $ (1) Ending LTV represents the current loan balance as a percentage of the value as of the date of investment for all loans except the $31,633 New York, NY hotel loan, which is as of March 2011. (2) Both loans are for the same property; Ending LTV for the Condominium Conversion mezzanine loan is based upon the committed amount of $35 million. (3) Ending LTV is based upon the aggregate face value ($23.8 million) of the senior sub-participation interests at the date of investment; ARI purchased the senior sub-participation interests for $17.8 million (75% of face value). COMMERCIAL REAL ESTATE FINANCE, INC. (“ARI”) |
 16 ARI – Senior Loan Portfolio Description ($000’s) Date of Investment Maturity Date (1) Original Face Amount Current Face Amount Coupon Amortization Schedule Property Size LTV (2) Hotel New York, NY Jan-10 Feb-15 $32,000 $31,571 8.25% 30 year 151 rooms 40% Office Condo (Headquarters) New York, NY Feb-10 Feb-15 28,000 27,419 8.00 30 year 73,419 sq. ft. 53% Hotel Silver Spring, MD Mar-10 Apr-15 26,000 25,273 9.00 25 year 263 rooms 56% Parking/Development Site Boston, MA Apr-12 Dec-13 23,844 17,287 1.98% (L+1.72%) Interest only 20 acres 21% Condominium Conversion (3) New York, NY Dec-12 Jan-15 45,000 45,000 9.00 Interest only 66 units 31% Total $154,844 $146,550 7.82% (1) Maturity date assumes all extension options are exercised. (2) LTV represents the current loan balance as a percentage of the value as of the date of investment for all loans except the $31,633 New York, NY hotel loan, which is as of March 2011. (3) Includes a 1.00% origination fee, a LIBOR floor of 0.50%, two one-year extension options subject to certain conditions and the payment of a 0.50% fee for each extension. (4) Interest rate includes 10% current payment with a 3% accrual. Description ($000’s) Date of Investment Maturity Date Original Face Amount Current Face Amount Coupon Amortization Schedule Property Size LTV (2) Repurchase Agreement (4) Sept-10 Mar-14 $47,439 $6,598 13.00% Interest only N/A N/A Total $47,439 $6,598 13.00% COMMERCIAL REAL ESTATE FINANCE, INC. (“ARI”) |
 17 ARI – Subordinate Loan Portfolio Description ($000’s) Date of Investment Maturity Date (1) Original Face Amount Current Face Amount Coupon Amortization Schedule LTV (2) Senior Mezz – Retail Various Dec-09 Dec-19 (3) $30,000 $30,000 12.24% Interest only 68% Junior Mezz – Retail Various Dec-09 Dec-19 (3) 20,000 20,000 14.00 Interest only 72% Office Troy, MI May-10 Jun-20 9,000 8,912 13.00 25 year 68% Ski Resort Mammoth Lakes, CA Apr-11 May-17 (4) 40,000 40,000 14.00 Interest only 56% Hotel Portfolio New York, NY (5) Aug-11 July-16 (6) 25,000 25,000 11.49 (L+10.49%) Interest only 60% Retail Center Woodbridge, Virginia (7) Oct-11 Oct-16 (7) 25,000 26,243 14.00 Interest only 74% Hotel New York, NY (8) Jan-12 Jan-15 15,000 15,000 12.00 Interest only 63% Hotel New York, NY (9) Mar-12 Feb-16 15,000 15,000 11.50 (L+11.00%) Interest only 65% (1) Maturity date assumes all extension options are exercised. (2) LTV represents the current loan balance as a percentage of the value as of the date of investment. (3) Prepayments are prohibited prior to the fourth year of the loan and any prepayments thereafter are subject to prepayment penalties ranging from 5% to 1%. (4) Prepayments are prohibited prior to the third year of the loan and any prepayments thereafter are subject to prepayment penalties ranging from 5% to 1%. (5) Includes a LIBOR floor of 1% and three one-year extension options subject to certain conditions and the payment of a 0.25% fee for the fourth and fifth year extensions. (6) Prepayments are prohibited prior to February 2013 and any prepayments thereafter are subject to spread maintenance premiums. (7) Interest rate of 14.0% includes a 10.0% current payment with a 4.0% accrual. There are two one-year extension options subject to certain conditions. (8) Includes a 1.00% origination fee, a one-year extension option subject to certain conditions and a 0.50% extension fee as well as a 1.50% exit fee. (9) Includes a LIBOR floor of 0.50%, two one-year extension options subject to certain conditions and the payment of a 0.50% fee for the second extension. COMMERCIAL REAL ESTATE FINANCE, INC. (“ARI”) |
 18 Description ($000’s) Date of Investment Maturity Date (1) Original Face Amount Current Face Amount Coupon Amortization Schedule LTV (2) Mixed Use Chapel Hill, NC July-12 July-22 6,525 6,525 11.10 Interest only 77% Office Kansas City, MO Sept-12 Sept-22 10,000 9,979 11.75 30 year 72% Hotel Portfolio (3) Various Locations Nov-12 Nov-15 50,000 49,950 11.11 30 Year 61% Condominium Conversion (4) New York, NY Dec-12 Jan-15 350 350 9.00% Interest Only 55% Total $245,875 $246,959 12.46% ARI – Subordinate Loan Portfolio (cont.) (1) Maturity date assumes all extension options are exercised. (2) LTV represents the current loan balance as a percentage of the value as of the date of investment. (3) Includes a 0.50% origination fee, a one-year extension option subject to certain conditions and a 0.25% extension fee. (4) Includes a 1.00% origination fee on the entire balance of the loan (funded and unfunded), a LIBOR floor of 0.50%, two one-year extension options subject to certain conditions and the payment of a 0.50% fee for each extension. COMMERCIAL REAL ESTATE FINANCE, INC. (“ARI”) |
 19 ARI – CMBS Portfolio Face Amortized Cost Remaining Weighted Average Life with Extensions (years) Estimated Fair Value Debt Net Equity at Cost CMBS – AAA $200,104 $203,463 1.8 $205,327 $176,827 26,636 CMBS – Hilton 73,239 70,250 2.9 73,561 48,328 21,922 CMBS – Total $273,343 273,713 2.1 $278,888 $225,155 $48,558 CMBS - AAA CUSIP Description 07388YAB8 BSCMS 07-PW16 A2 07401DAB7 BSCMS 2007-PW18 A2 12513YAC4 CD 2007-CD4 A2B 46629MAB1 JPMCC 2006-LDP8 A2 61754KAC9 MSC 07-IQ14 A2 92978YAB6 WBCMT 07-C32 A2 CMBS - AAA CUSIP Description 36246LAB7 GSMS 2007-GG10 A2 46630JAK5 JPMCC 2007-LDPX A2S 61751NAD4 MSC 2007-HQ11 A31 92978TAB7 WBCMT 2007-C31 A2 CMBS – Hilton CUSIP Description 05956KAA6 BALL 2010-HLTN COMMERCIAL REAL ESTATE FINANCE, INC. (“ARI”) |
 20 Portfolio Metrics – Quarterly Migration Summary (1) The IRR for the investments shown in the above table reflect the returns underwritten by the Manager, calculated on a weighted average basis assuming no dispositions, early prepayments or defaults but assumes extensions as well as the cost of borrowings and derivative instruments under the Wells Facility. The calculation also assumes extension options on the Wells Facility with respect to the Hilton CMBS are exercised. The calculation for the New York City whole loan also assumes certain estimates with respect to the timing and magnitude of future fundings for the remaining commitments and associated loan repayments, as well as assuming no defaults. There can be no assurance the actual IRRs will equal the underwritten IRRs shown in the table. See “Risk Factors” in the Company’s Annual Report on Form 10-K for the year ended December 31, 2011 for a discussion of some of the factors that could adversely impact the returns received by the Company from the investments shown in the table over time. (2) Represents an underwritten levered weighted average IRR. The Company's ability to achieve the underwritten levered weighted average IRR, additionally depends upon the Company re-borrowing approximately $53,000 under the JPMorgan Facility or any replacement facility with regard to its portfolio of first mortgage loans. Without such re-borrowing, the levered weighted average IRR will be significantly lower than the amount shown above, as indicated in the weighted average IRR column on page 11. (3) Does not include CMBS (AAA or Hilton) or repurchase agreement investment secured by CDO bond. COMMERCIAL REAL ESTATE FINANCE, INC. (“ARI”) Portfolio Metrics ($ in thousands) Q4 2012 Q3 2012 Q2 2012 Q1 2012 Q4 2011 (Investment balances represent amortized cost) First Mortgage Loans 142,921 $ 104,101 $ 103,320 $ 108,817 $ 109,006 $ Subordinate Loans 246,246 196,177 179,602 179,336 149,086 Repurchase Agreement 6,598 10,975 41,696 47,439 47,439 CMBS - AAA 203,463 223,781 280,697 330,413 554,716 CMBS - Hilton 70,250 70,521 70,719 - - Total Investments 669,478 $ 605,555 $ 676,034 $ 666,005 $ 860,247 $ (Investment balances represent net equity) First Mortgage Loans 142,918 $ 104,098 $ 50,260 $ 40,210 $ 40,286 $ Subordinate Loans 246,246 196,177 179,602 179,336 149,086 Repurchase Agreement 6,598 10,975 41,696 47,439 47,439 CMBS - AAA 26,636 29,712 32,520 43,763 81,409 CMBS - Hilton 21,922 21,623 21,260 - - Net Equity in Investments at Cost 444,320 $ 362,585 $ 325,338 $ 310,748 $ 318,220 $ Weighted Average IRR (1) 14.1% (2) 14.9% (2) 15.0% 14.7% 14.2% Weighted Average Duration 3.1 Years 3.3 Years 2.9 Years 2.8 Years 2.2 Years Loan Portfolio Weighted Average Ending LTV (3) 55.6% 58.0% 57.1% 59.3% 58.8% Borrowings 225,158 $ 242,970 $ 350,696 $ 355,257 $ 542,027 $ |
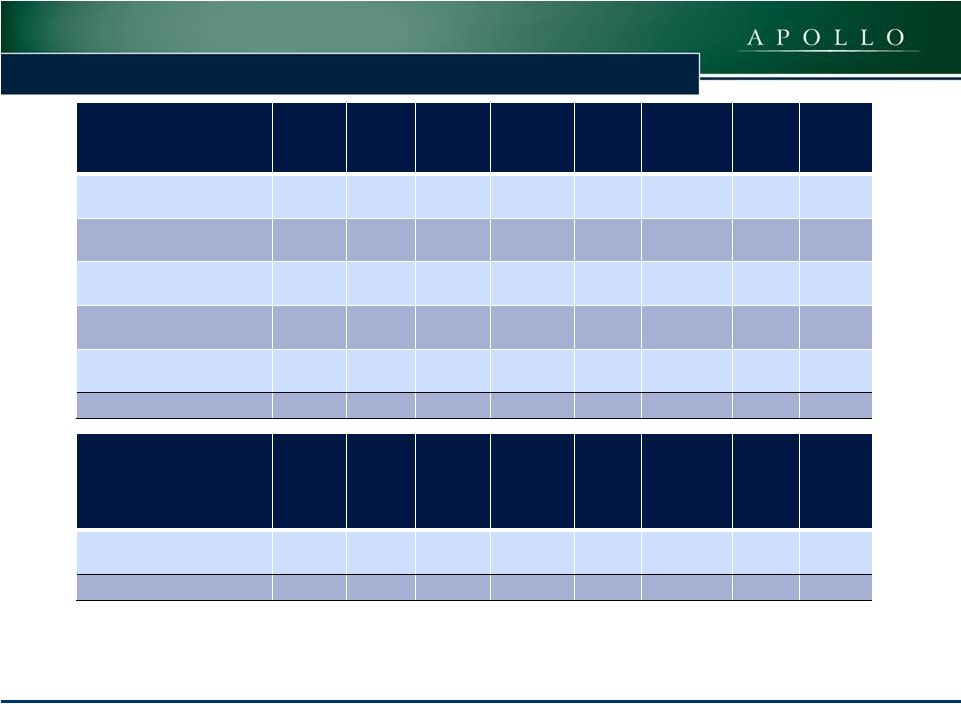
 COMMERCIAL REAL ESTATE FINANCE, INC. (“ARI”) ARI had total borrowings outstanding of $225 million at December 31, 2012 ARI’s borrowings had the following remaining maturities at December 31, 2012: Financing Overview Facility ($000s) Debt Balance Weighted Average Remaining Maturity (1) Cost of Funds Hedged Cost of Funds Wells Facility (1) $225,155 1.1 years 1.8% 1.9% JP Morgan Facility (2) 3 5 days 2.7% 2.7% Total Borrowings at December 31, 2012 $225,158 1.1 years 1.8% 1.9% Facility ($000s) Less than 1 year 1 to 3 years 3 to 5 years Total Wells Facility (1) $179,068 $46,087 $- $225,155 JP Morgan Facility (2) 3 - - 3 Total Borrowings at December 31, 2012 $179,071 $46,087 $- $225,158 21 (1) Assumes extension options on Wells Facility are exercised. At December 31, 2012, the interest rate on the outstanding borrowings on the Wells Facility was LIBOR plus 125bps, 150bps or 235bps depending on the collateral pledged. In February, 2013, the Wells Facility was amended and the interest rate with respect to outstanding borrowings used to finance AAA CMBS was reduced to LIBOR plus 105bps and the interest rate with respect to outstanding borrowings used to finance the Hilton CMBS was reduced to LIBOR plus 175bps. In addition, the term of the Wells Facility with respect to the outstanding borrowings used to finance the Hilton CMBS was extended to March 2014. The JP Morgan Facility was renewed for a term of two years (one year renewal with a 364 day extension) in February, 2013. (2) |
 22 Financials COMMERCIAL REAL ESTATE FINANCE, INC. (“ARI”) |
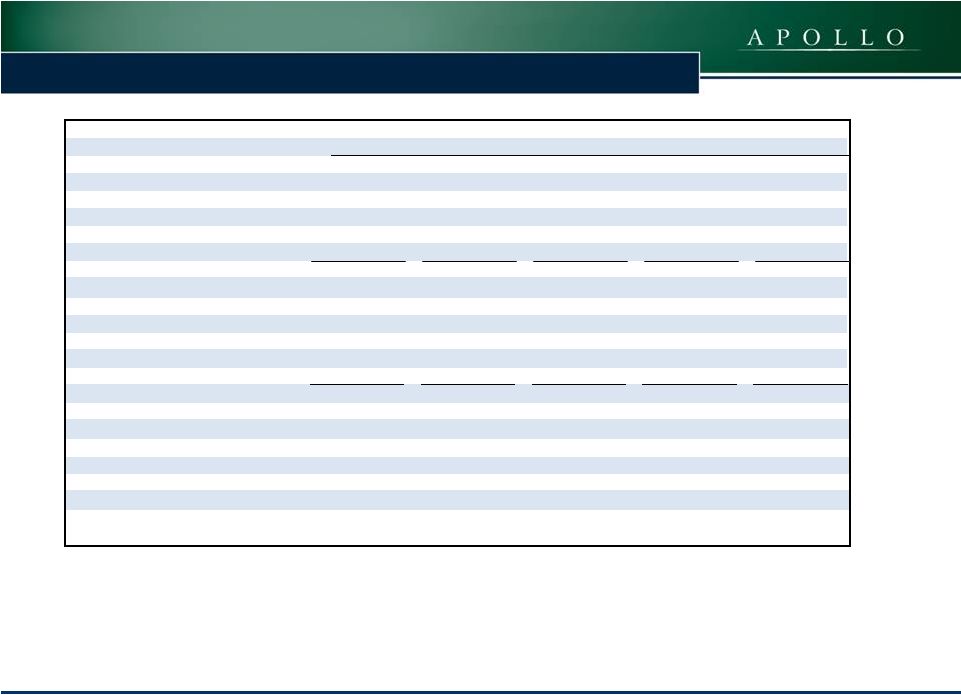
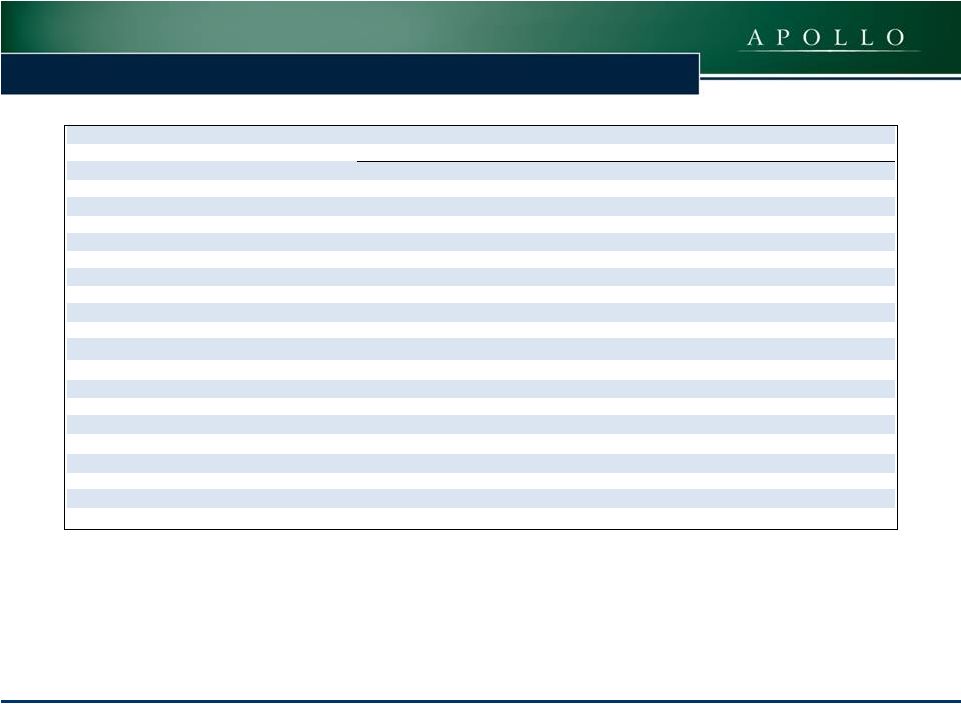
 23 Consolidated Balance Sheets (in thousands—except share and per share data) December 31, 2012 December 31, 2011 Assets: Cash 108,619 $ 21,568 $ Securities available-for-sale, at estimated fair value 67,079 302,543 Securities, at estimated fair value 211,809 251,452 Commercial mortgage loans, held for investment 142,921 109,006 Subordinate loans, held for investment 246,246 149,086 Repurchase agreements, held for investment 6,598 47,439 Principal and interest receivable 4,277 8,075 Deferred financing costs, net 678 2,044 Other assets 203 17 Total Assets 788,430 $ 891,230 $ Liabilities and Stockholders' Equity Liabilities: Borrowings under repurchase agreements 225,158 $ 290,700 $ TALF Borrowings - 251,327 Derivative instruments, net 155 478 Accounts payable and accrued expenses 1,265 1,746 Payable to related party 2,037 1,298 Dividends payable 12,891 8,703 Total Liabilities 241,506 554,252 Stockholders' Equity: Preferred stock, $0.01 par value, 50,000,000 shares authorized and 3,450,000 shares issued and outstanding in 2012 35 - Common stock, $0.01 par value, 450,000,000 shares authorized 28,044,106 and 20,561,032 shares issued and outstanding in 2012 and 2011, respectively 280 206 Additional paid-in-capital 546,065 336,209 Retained earnings 574 - Accumulated other comprehensive income (loss) (30) 563 Total Stockholders' Equity 546,924 336,978 Total Liabilities and Stockholders' Equity 788,430 $ 891,230 $ COMMERCIAL REAL ESTATE FINANCE, INC. (“ARI”) |
 24 Consolidated Statement of Operations 2012 2011 2012 2011 Net interest income: Interest income from securities 3,120 $ 5,904 $ 15,347 $ 25,323 $ Interest income from commercial mortgage loans 2,930 2,267 10,780 9,153 Interest income from subordinate loans 7,350 4,817 24,666 13,678 Interest income from repurchase agreements 366 1,576 6,286 4,764 Interest expense (1,463) (3,618) (8,402) (14,454) Net interest income 12,303 10,946 48,677 38,464 Operating expenses: General and administrative expenses (includes $380 and $3,624 of non-cash stock based compensation in 2012 and $634 and $1,788 in 2011, respectively) (1,315) (1,563) (8,543) (5,652) Management fees to related party (2,040) (1,297) (6,139) (4,728) Total operating expenses (3,355) (2,860) (14,682) (10,380) Interest income from cash balances 6 1 7 13 Realized gain on sale of securities - - 262 - Unrealized gain on securities 16 600 6,489 481 Loss on derivative instruments (includes unrealized gains (losses) of $96 and $323 in 2012 and $426 and $(865) in 2011, respectively) (2) (18) (572) (2,696) Net income 8,968 $ 8,669 $ 40,181 $ 25,882 $ Preferred dividends (1,860) - (3,079) - Net Income available to common shareholders 7,108 $ 8,669 $ 37,102 $ 25,882 $ Basic and diluted net income per share of common stock 0.26 $ 0.41 $ 1.64 $ 1.35 $ Basic and diluted weighted average common shares outstanding 27,297,600 20,561,032 22,648,819 18,840,954 Dividend declared per share of common stock 0.40 $ 0.40 $ 1.60 $ 1.60 $ Three months ended December 31, Twelve months ended December 31, COMMERCIAL REAL ESTATE FINANCE, INC. (“ARI”) |
 Reconciliation of Operating Earnings to Net Income December 31, 2012 Earnings Per Share (Diluted) December 31, 2011 Earnings Per Share (Diluted) Operating Earnings: Net income available to common stockholders $7,108 $0.26 $8,669 $0.41 Adjustments: Unrealized gain on securities (16) - (600) (0.03) Unrealized gain on derivative instruments (96) - (426) (0.02) Non-cash stock-based compensation expense 380 0.01 634 0.03 Total adjustments: 268 0.01 (392) (0.02) Operating Earnings 7,376 $0.27 $8,277 $0.39 Basic and diluted weighted average common shares outstanding 27,608,787 20,561,032 Three Months Ended COMMERCIAL REAL ESTATE FINANCE, INC. (“ARI”) December 31, 2012 Earnings Per Share (Diluted) December 31, 2011 Earnings Per Share (Diluted) Operating Earnings: Net income available to common stockholders $37,102 $1.64 $25,882 $1.35 Adjustments: Unrealized gain on securities (6,489) (0.29) (481) (0.03) Unrealized (gain) loss on derivative instruments (323) (0.01) 865 0.05 Non-cash stock-based compensation expense 3,624 0.16 1,788 0.10 Total adjustments: (3,188) (0.14) 2,172 0.12 Operating Earnings 33,914 $1.50 $28,054 $1.47 Basic and diluted weighted average common shares outstanding 22,648,819 18,840,954 Twelve Months Ended 25 |
 26 Financial Metrics – Quarterly Migration Summary (1) Operating Earnings is a non-GAAP financial measure that is used to approximate cash available for distribution and is defined by the Company as net income, computed in accordance with GAAP, adjusted for (i) non-cash equity compensation expense (a portion of which may become cash-based upon final vesting and settlement of awards should the holder elect net share settlement to satisfy income tax withholding) and (ii) any unrealized gains or losses or other non-cash items included in net income. Please see slide 25 for a reconciliation of Operating Earnings and Operating Earnings per Share to GAAP net income and GAAP net income per share. (2) The Company carries loans at amortized cost and its CMBS securities are marked to market. Management estimates the fair value of the Company’s financial assets. (3) Return on common equity is calculated as annualized Operating Earnings for the period as a percentage of average stockholders equity for the period. COMMERCIAL REAL ESTATE FINANCE, INC. (“ARI”) Financial Metrics ($ in thousands, except per share data) Q4 2012 Q3 2012 Q2 2012 Q1 2012 Q4 2011 Net Interest Income 12,303 $ 13,236 $ 11,951 $ 11,187 $ 10,946 $ Management Fee 2,040 1,518 1,292 1,289 1,297 General and Administrative Costs 935 1,154 1,876 953 929 Non-Cash Stock Based Compensation 380 1,276 886 1,083 634 Net Income Available to Common Stockholders 7,108 $ 10,992 $ 9,910 $ 9,093 $ 8,669 $ GAAP Diluted EPS 0.26 $ 0.52 $ 0.47 $ 0.43 $ 0.41 $ Operating Earnings (1) 7,375 $ 9,218 $ 8,526 $ 8,795 $ 8,278 $ Operating EPS (1) 0.27 $ 0.44 $ 0.41 $ 0.42 $ 0.39 $ Distributions Declared to Common Stockholders 0.40 $ 0.40 $ 0.40 $ 0.40 $ 0.40 $ GAAP Book Value per Common Share 16.43 $ 16.58 $ 16.59 $ 16.46 $ 16.39 $ Fair Value per Common Share (2) 16.84 $ 17.16 $ 17.22 $ 17.04 $ 16.80 $ Total Stockholders' Equity 546,924 $ 427,421 $ 341,518 $ 338,377 $ 336,978 $ Return on Common Equity Based on Operating Earnings (3) 6.8% 10.8% 10.0% 10.4% 9.8% |