 Investor Presentation September 2013 Information is as of June 30, 2013 except as otherwise noted. It should not be assumed that investments made in the future will be profitable or will equal the performance of investments in this document. Exhibit 99.1 |
 1 COMMERCIAL REAL ESTATE FINANCE, INC. (“ARI”) Legal Disclaimer We make forward-looking statements in this presentation and other filings we make with the SEC within the meaning of Section 27A of the Securities Act of 1933, as amended, and Section 21E of the Securities Exchange Act of 1934, as amended, and such statements are intended to be covered by the safe harbor provided by the same. Forward-looking statements are subject to substantial risks and uncertainties, many of which are difficult to predict and are generally beyond our control. These forward-looking statements include information about possible or assumed future results of our business, financial condition, liquidity, results of operations, plans and objectives. When we use the words “believe,” “expect,” “anticipate,” “estimate,” “plan,” “continue,” “intend,” “should,” “may” or similar expressions, we intend to identify forward-looking statements. Statements regarding the following subjects, among others, may be forward-looking: our business and investment strategy; our operating results; our ability to obtain and maintain financing arrangements; the return on equity, the yield on investments and risks associated with investing in real estate assets, including changes in business conditions and the general economy. The forward-looking statements are based on our beliefs, assumptions and expectations of our future performance, taking into account all information currently available to us. Forward-looking statements are not predictions of future events. These beliefs, assumptions and expectations can change as a result of many possible events or factors, not all of which are known to us. Some of these factors are described under “Risk Factors,” and “Management’s Discussion and Analysis of Financial Condition and Results of Operations” as included in Apollo Commercial Real Estate Finance, Inc.’s (“ARI”) Annual Report on Form 10-K for the fiscal year ended December 31, 2012 and other periodic reports filed with the Securities and Exchange Commission. If a change occurs, our business, financial condition, liquidity and results of operations may vary materially from those expressed in our forward-looking statements. Any forward-looking statement speaks only as of the date on which it is made. New risks and uncertainties arise over time, and it is not possible for us to predict those events or how they may affect us. Except as required by law, we are not obligated to, and do not intend to, update or revise any forward-looking statements, whether as a result of new information, future events or otherwise. This presentation may contain statistics and other data that in some cases has been obtained from or compiled from information made available by third-party service providers. Past performance is not indicative nor a guarantee of future returns. Index performance and yield data are shown for illustrative purposes only and have limitations when used for comparison or for other purposes due to, among other matters, volatility, credit or other factors (such as number and types of securities). Indices are unmanaged, do not charge any fees or expenses, assume reinvestment of income and do not employ special investment techniques such as leveraging or short selling. No such index is indicative of the future results of any investment by ARI. |
 2 COMMERCIAL REAL ESTATE FINANCE, INC. (“ARI”) Company Overview Ticker (NYSE) ARI Equity Capitalization (1) $676 million Dividend per Common Share (2) $1.60 Portfolio as of 6/30/2013 $733 million Levered Weighted Average Portfolio IRR as of 6/30/2013 (4) 14.2% Dividend Yield (3) 10.0% Apollo Commercial Real Estate Finance, Inc. is a commercial mortgage real estate investment trust focused on investing in performing senior and subordinate mortgage loans and commercial mortgage-backed securities (1) Includes common equity market capitalization as of September 23, 2013 and preferred equity outstanding at June 30, 2013. (2) Current dividend per common share of $0.40 annualized. (3) Based upon the annualized current dividend per common share and ARI’s closing common share price of $15.99 on September 23, 2013. (4) The Internal Rate of Return (“IRR”) reflects the returns on the investments in the Company’s portfolio underwritten by the Manager, calculated on a weighted average basis assuming no dispositions, early prepayments or defaults but assumes extensions are exercised and that the cost of borrowings and derivative instruments under the Company’s master repurchase agreement with Wells Fargo Bank N.A. (the “Wells Facility”) remains constant over the remaining terms and extension terms under the facility. The calculation also assumes extension options on the Wells Facility with respect to the Hilton CMBS are exercised. With respect to the mezzanine loan for the New York City multifamily condominium conversion that closed in December 2012 and the mezzanine loan for the New York City condominium construction that closed in January 2013, the IRR calculation assumes certain estimates with respect to the timing and magnitude of future fundings for the remaining commitments and associated loan repayments, as well as assuming no defaults. IRR is the annualized effective compounded return rate that accounts for the time-value of money and represents the rate of return on an investment over a holding period expressed as a percentage of the investment. It is the discount rate that makes the net present value of all cash outflows (the costs of investment) equal to the net present value of cash inflows (returns on investment). It is derived from the negative and positive cash flows resulting from or produced by each transaction (or for a transaction involving more than one investment, cash flows resulting from or produced by each of the investments), whether positive, such as investment returns, or negative, such as transaction expenses or other costs of investment, taking into account the dates on which such cash flows occurred or are expected to occur, and compounding interest accordingly. See “Risk Factors” in the Company’s Annual Report on Form 10-K for the year ended December 31, 2012, and subsequent filings by ARI, for a discussion of some of the factors that could adversely impact the returns received by the Company from the investments over time. Substantially all of the Company’s borrowings under the Company's master repurchase facility with JPMorgan Chase Bank, N.A. (the "JPMorgan Facility") were repaid. The Company's ability to achieve its levered weighted average underwritten IRR is additionally dependent upon the Company re-borrowing approximately $53 million under the JPMorgan Facility or any replacement facility. Without such re-borrowing, the levered weighted average IRR with regard to its portfolio of first mortgage loan will be significantly lower than the amount shown above, as indicated by the current weighted average underwritten IRR on slide 8. |
 3 COMMERCIAL REAL ESTATE FINANCE, INC. (“ARI”) Investment Highlights Experienced Management Team and Relationship with Apollo Stable Investment Portfolio Well Positioned in Rising Interest Rate Environment Macro Environment Continues to Create Opportunities $1.6 trillion of commercial mortgage debt will mature over the next five years in the U.S. (1) Increased CRE transaction volume has led to increased need for financing U.S. CMBS issuance YTD 2013 is $56.7 billion compared to $28.1 billion YTD 2012 (2) Apollo’s CRE debt platform has invested $3.8 billion of equity into $7 billion of CRE debt investments since 2009 Long standing and deep relationships with global investment banks, insurances companies and CRE owners Amortized cost basis of $733 million with a levered weighted average IRR of approximately 14.2% (3) Weighted average duration of 3.0 Years Investments diversified by geographic region and underlying property type Attractive Price and Dividend Yield 34% of loans in the portfolio have floating interest rates; Fixed rate loans had WAC of 11.1% at June 30, 2013 ARI continues to be low-levered; As of June 30, 2013, the debt-to-common equity ratio was 0.4:1 As loans mature or pay-off, ARI can re-deploy capital in a higher rate environment As of September 23, 2013 10.0% dividend yield 0.98 price/book, based upon June 30, 2013 book value per common share of $16.26 Capacity to structure and underwrite complex transactions across a broad spectrum of property types (1) Source: Trepp, LLC (2) Source: Commercial Mortgage Alert, September 17, 2013 (3) The IRR for the investments listed reflect the returns underwritten by the Manager, calculated on a weighted average basis assuming no dispositions, early prepayments or defaults but assumes extensions as well as the cost of borrowings and derivative instruments under the Wells Facility. The calculation also assumes extension options on the Wells Facility with respect to the Hilton CMBS are exercised. With respect to the mezzanine loan for the New York City multifamily condominium conversion that closed in December 2012 and the mezzanine loan for the New York City condominium construction that closed in January 2013, the IRR calculation assumes certain estimates with respect to the timing and magnitude of future fundings for the remaining commitments and associated loan repayments, as well as assuming no defaults. IRR is the annualized effective compounded return rate that accounts for the time-value of money and represents the rate of return on an investment over a holding period expressed as a percentage of the investment. It is the discount rate that makes the net present value of all cash outflows (the costs of investment) equal to the net present value of cash inflows (returns on investment). It is derived from the negative and positive cash flows resulting from or produced by each transaction (or for a transaction involving more than one investment, cash flows resulting from or produced by each of the investments), whether positive, such as investment returns, or negative, such as transaction expenses or other costs of investment, taking into account the dates on which such cash flows occurred or are expected to occur, and compounding interest accordingly. See “Risk Factors” in the Company’s Annual Report on Form 10-K for the year ended December 31, 2012, and subsequent filings by ARI, for a discussion of some of the factors that could adversely impact the returns received by the Company from the investments over time. Substantially all of the Company’s borrowings under the JPMorgan Facility were repaid. The Company's ability to achieve its levered weighted average underwritten IRR is additionally dependent upon the Company re- borrowing approximately $53 million under the JPMorgan Facility or any replacement facility. Without such re-borrowing, the levered weighted average IRR with regard to its portfolio of first mortgage loan will be significantly lower than the amount shown above, as indicated by the current weighted average underwritten IRR on slide 8. |
 4 COMMERCIAL REAL ESTATE FINANCE, INC. (“ARI”) CRE Debt Market Overview $1.6 trillion of commercial mortgage debt is maturing in the next five years in the U.S. (1) U.S. CMBS issuance is gaining momentum but is significantly lower than the 2005-2007 peak levels (2) Pricing in the CMBS market has stabilized U.S. CRE Loan and CMBS Maturities (1) (1) Source: Trepp, LLC (2) Source: Commercial Mortgage Alert, September 2013 (3) Source: JP Morgan $210 $185 $156 $112 $85 $24 $23 $22 $24 $23 $62 $67 $102 $112 $133 $72 $69 $59 $59 $52 $0 $100 $200 $300 $400 2013 2014 2015 2016 2017 Bank Insurance Company CMBS Other U.S. CMBS Issuance (2) Lack of Issuance Flood of Capital New-Issue 10-Year AAA and BBB Spreads Over Swaps (3) $293 $368 $344 $339 $307 |
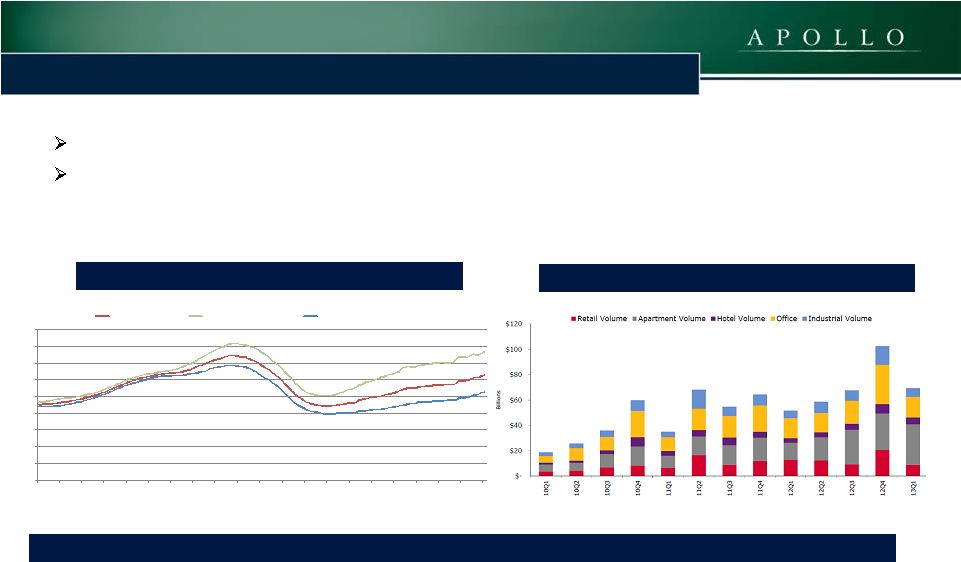 5 COMMERCIAL REAL ESTATE FINANCE, INC. (“ARI”) CRE Property Market Overview Commercial property transaction volume is accelerating, leading to an increased need for financing U.S. commercial property values have increased 32% from the March 2010 trough, and 39% in major markets (1) U.S. CRE Property Sales Volume (2) Moody’s/RCA Commercial Property Price Index (1) (1) Source: Moody’s and Real Capital Analytics. Index is equal to 100 as of 12/31/2000 (2) Source: Wells Fargo and Real Capital Analytics Price recovery has led to an increase in CRE transactions, which leads to an increased need for CRE debt financing 0 25 50 75 100 125 150 175 200 225 Jul-03 Jan-04 Jul-04 Jan-05 Jul-05 Jan-06 Jul-06 Jan-07 Jul-07 Jan-08 Jul-08 Jan-09 Jul-09 Jan-10 Jul-10 Jan-11 Jul-11 Jan-12 Jul-12 Jan-13 Jul-13 National All-Property Major Markets (All-Property) Non-Major Markets (All-Property) |
 6 COMMERCIAL REAL ESTATE FINANCE, INC. (“ARI”) Apollo Global Management LLC’s Platform Private Equity $40bn AUM Opportunistic buyouts Distressed buyouts and debt investments Corporate carve-outs Credit (3) $62bn AUM U.S. Performing Credit Opportunistic Credit European Credit Non-Performing Loans Structured Credit Athene Real Estate $9bn AUM Residential and commercial Global private equity and distressed debt investments Performing fixed income (CMBS, CRE Loans) Firm Profile (1) Founded: 1990 AUM: $113 bn (2) Employees: 660 Inv. Prof.: 253 Global Offices: 9 Investment Approach Value-oriented Contrarian Integrated investment platform Opportunistic across market cycles and capital structures Focus on nine core industries Principal Investment Businesses (1) (1) As of June 30, 2013 (2) Includes $1.2 billion of commitments that have yet to be deployed into one of the funds managed by Apollo Global Management LLC’s (together with its subsidiaries, “Apollo”) three business segments. Please refer to slide 15 for a definition of Assets Under Management (3) Includes six funds that are denominated in Euros and translated into U.S. dollars at an exchange rate of €1.00 to $1.30 as of June 30, 2013 Global Footprint |
 7 ARI’s Competitive Advantages Ability to underwrite transactions with complexity in execution, operations or structure Proven track record to negotiate and execute transactions quickly “Solutions provider” for sponsors and sectors in need of capital “First Call” for Wall Street firms, brokers and borrowers for subordinate debt Leverage off of Apollo’s relationships and reputation – Apollo’s CRE Debt Platform has invested $3.8 billion of equity into $7 billion of CRE debt investments since 2009 Recent Strategic Focus NYC Construction/Conversion Transactions In the past 12-months, ARI has committed to ~ $275 million in six separate NYC transactions and ~ $414 million since inception Compelling risk adjusted returns achieved by targeting transactions with an attractive basis, strong sponsorship and creative structuring Structured as first mortgages, mezzanine loans or preferred equity NYC continues to be one of the strongest residential markets, with a 2% multifamily vacancy rate (1) Non-Core Opportunistic Investments Triple Net Lease Partnering with a best-in-class operator to target triple net lease investments in secondary markets throughout the United States Expected to target $50 million equity deployment over the next eighteen months Minority Participation in KBC Bank Deutschland Commitment to invest up to $50 million, representing 21% of the ownership of scalable German banking platform Expected to close within nine months, pending antitrust and regulatory approval (1) Source: Green Street Advisors ARI Strategic Focus COMMERCIAL REAL ESTATE FINANCE, INC. (“ARI”) |
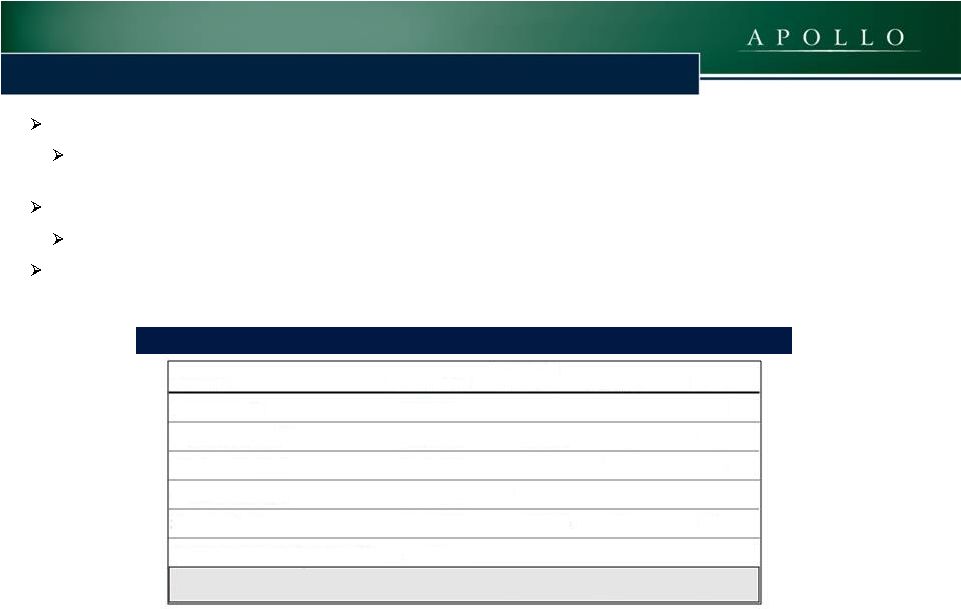
 8 COMMERCIAL REAL ESTATE FINANCE, INC. (“ARI”) Portfolio Overview Asset Type ($000s) Amortized Cost Borrowings Equity at Cost Remaining Weighted Average Life (years ) (1) Current Weighted Average IRR (2)(3) Levered Weighted Average IRR (4) First Mortgage Loans (2) $143,492 $3 $143,489 2.1 11.0% 15.8% Subordinate Loans 354,865 - 354,865 4.2 13.8 13.8 CMBS - AAA 165,553 144,200 21,353 1.4 15.8 15.8 CMBS - Hilton 69,521 47,109 22,412 2.4 12.6 12.6 Investments at June 30, 2013 $733,431 $191,312 $542,119 3.0 Years 13.1% 14.2% As of June 30, 2013. (1) Remaining Weighted Average Life assumes all extension options are exercised. (2) Borrowings under the Company’s JPMorgan Facility bear interest at LIBOR plus 250 basis points, or 2.7% at June 30, 2013. The IRR calculation further assumes the JPMorgan Facility or any replacement facility will remain available over the life of these investments. (3) The IRR for the investments shown in the above table reflect the returns underwritten by the Manager, calculated on a weighted average basis assuming no dispositions, early prepayments or defaults but assumes extensions are exercised and that the cost of borrowings and derivative instruments under the Wells Facility remains constant over the remaining terms and extension terms under this facility. The calculation also assumes extension options on the Wells Facility with respect to the Hilton CMBS are exercised. With respect to the mezzanine loan for the New York City multifamily condominium conversion that closed in December 2012 and the mezzanine loan for the New York City condominium construction that closed in January 2013, the IRR calculation assumes certain estimates with respect to the timing and magnitude of future fundings for the remaining commitments and associated loan repayments, as well as assuming no defaults. IRR is the annualized effective compounded return rate that accounts for the time-value of money and represents the rate of return on an investment over a holding period expressed as a percentage of the investment. It is the discount rate that makes the net present value of all cash outflows (the costs of investment) equal to the net present value of cash inflows (returns on investment). It is derived from the negative and positive cash flows resulting from or produced by each transaction (or for a transaction involving more than one investment, cash flows resulting from or produced by each of the investments), whether positive, such as investment returns, or negative, such as transaction expenses or other costs of investment, taking into account the dates on which such cash flows occurred or are expected to occur, and compounding interest accordingly. There can be no assurance the actual IRRs will equal the underwritten IRRs shown in the table. See “Risk Factors” in the Company’s Annual Report on Form 10-K for the year ended December 31, 2012, and subsequent filings by ARI, for a discussion of some of the factors that could adversely impact the returns received by the Company from the investments shown in the table over time. (4) Substantially all of the Company’s borrowings under the JPMorgan Facility were repaid. The Company's ability to achieve its underwritten levered weighted average IRR with regard to its portfolio of first mortgage loans is additionally dependent upon the Company re-borrowing approximately $53,000 under the JPMorgan Facility or any replacement facility. Without such re-borrowing, the levered weighted average IRRs will be as indicated in the current weighted average IRR column above. |
 9 COMMERCIAL REAL ESTATE FINANCE, INC. (“ARI”) Net Invested Equity at Amortized Cost Basis Gross Assets at Amortized Cost Basis Geographic Diversification by Net Equity Property Type by Net Equity As of June 30, 2013 (1) Other category includes the subordinate financing on a ski resort and a first mortgage loan on a development site with income producing parking lots. Portfolio Diversification |
 10 COMMERCIAL REAL ESTATE FINANCE, INC. (“ARI”) Loan Portfolio Overview Fully Extended Loan Maturity Schedule ($000s) (1)(2) As of June 30, 2013 (1) Based upon Face Amount of Loans; Does not include CMBS (AAA or Hilton). (2) For the NYC condominium conversion loan that closed in December 2012 and the NYC condominium construction loan that closed in January 2013, the maturities reflect the fully funded amounts of the loans. Loan Position and Rate Type (1) $16.9 $44.0 $116.8 $98.1 $120.0 $84.9 $- $8.9 $- $16.4 $32.0 $0 $20 $40 $60 $80 $100 $120 $140 2013 2014 2015 2016 2017 2018 2019 2020 2021 2022 2023 66% Fixed Rate with an 11.1% WAC 34% Floating Rate Senior Loan Fixed 17% Subordinate Loan Fixed 49% Subordinate Loan Floating 22% Senior Loan Floating 12% |
 11 COMMERCIAL REAL ESTATE FINANCE, INC. (“ARI”) Recent Transactions NYC Condominium Mezzanine Loan $60 million mezzanine loan commitment secured by the pledge of preferred equity interests in a 352,624 net salable square foot, 146-unit condominium tower being constructed in downtown New York City. On a fully funded basis, the Company’s loan basis represents an underwritten loan- to-net sellout of approximately 48% Underwritten IRR (1) ~ 16% Warehouse Portfolio Mezzanine Loan $32 million mezzanine loan commitment secured by pledge of the equity interests in the owner of a portfolio of 15 warehouse facilities totaling 2.8 million square feet spanning nine states Part of a $322 million, ten-year, fixed rate financing comprised of the $32 million junior mezzanine loan, a $70 million senior mezzanine loan and a $220 million first mortgage loan Underwritten LTV – 75% Underwritten IRR (1) ~ 12% (1) The IRR for the investment listed reflects the returns underwritten by the Manager, calculated on a weighted average basis assuming no dispositions, early prepayments or defaults but assumes extensions as well as the cost of borrowings and derivative instruments under the Wells Facility.With respect to the mezzanine loan for the New York City condominium development that closed in January 2013, the IRR calculation assumes certain estimates with respect to the timing and magnitude of future fundings for the remaining commitments and associated loan repayments, as well as assuming no defaults. IRR is the annualized effective compounded return rate that accounts for the time-value of money and represents the rate of return on an investment over a holding period expressed as a percentage of the investment. It is the discount rate that makes the net present value of all cash outflows (the costs of investment) equal to the net present value of cash inflows (returns on investment). It is derived from the negative and positive cash flows resulting from or produced by each transaction (or for a transaction involving more than one investment, cash flows resulting from or produced by each of the investments), whether positive, such as investment returns, or negative, such as transaction expenses or other costs of investment, taking into account the dates on which such cash flows occurred or are expected to occur, and compounding interest accordingly. There can be no assurance the actual IRRs will equal the underwritten IRRs shown. See “Risk Factors” in the Company’s Annual Report on Form 10-K for the year ended December 31, 2012, and subsequent filings by ARI, for a discussion of some of the factors that could adversely impact the returns received by the Company from the investments over time. |
 12 COMMERCIAL REAL ESTATE FINANCE, INC. (“ARI”) Portfolio Performance Loan Returns – All Fully Realized Investments Since Inception Since inception through September 23, 2013, ARI has had 6 loans fully repay, representing ~$147.7 million of equity The repaid loans resulted in a weighted average realized IRR of 17.0% and a multiple on invested capital (“MOIC”) of 1.31x The remaining $43.7 million of equity invested in CMBS continues to outperform projections Bonds purchased at a premium continue to extend beyond the initial underwriting No Realized or Projected Losses Across the Portfolio Investment Investment Date Initial Equity Investment Realized IRR MOIC Mezzanine - Retail December 2009 $50,000,000 15.3% 1.45x First Mortgage - Hotel (1) August 2010 $8,556,000 17.5% 1.29x Bridge Loan - Multifamily March 2011 $8,800,000 7.9% 1.01x Repurchase Agreement March 2011 $47,439,169 16.6% 1.23x Mezzanine - Hotel March 2012 $15,000,000 19.2% 1.22x First Mortgage - Parking/Development Site April 2012 $17,883,212 25.1% 1.31x Total/Weighted Average $147,678,381 17.0% 1.31x (1) IRR and MOIC represent the levered return, assuming the mortgage was financed with 64% leverage on the JP Morgan Facility during the full term of the loan. |
 13 COMMERCIAL REAL ESTATE FINANCE, INC. (“ARI”) Capitalization Over the past 18-months, ARI completed three equity capital raises totaling $355.7 million In August 2012, ARI completed an underwritten public offering of 3.45 million shares of 8.625% Series A Cumulative Redeemable Perpetual Preferred Stock, raising net proceeds of $83.2 million In October 2012, ARI completed an underwritten public offering of 7.4 million shares of common stock at a price of $16.81 per share, raising net proceeds of $124.1 million In March 2013, ARI completed an underwritten public offering of 8.8 million shares of common stock at a price of $16.90 per share, raising net proceeds of approximately $148.5 million Capitalization June 30, 2013 ($ in thousands) (unaudited) Wells Fargo Facilility 191,309 JP Morgan Facility 3 Total Debt $191,312 Preferred Equity 86,250 Common Equity 599,744 Total Equity Capitalization $685,994 |
 14 COMMERCIAL REAL ESTATE FINANCE, INC. (“ARI”) Investment Highlights First call relationships for subordinate loan transactions Experienced management team Strong sponsorship through Apollo Global Management, LLC Well positioned in a rising interest rate environment Opportune time for CRE debt investing Attractive 10.0% dividend yield |
 15 COMMERCIAL REAL ESTATE FINANCE, INC. (“ARI”) Definition of Assets Under Management – refers to the investments managed by Apollo Global Management, LLC, together with its subsidiaries (“Apollo”), or with respect to which Apollo has control, including capital Apollo has the right to call from its investors pursuant to their capital commitments to various funds managed by Apollo. AUM equals the sum of: (i) the fair value of Apollo’s private equity investments plus the capital that Apollo is entitled to call from its investors pursuant to the terms of their capital commitments to the extent a fund is within the commitment period in which management fees are calculated based on total commitments to the fund; (ii) the net asset value of the credit funds managed by Apollo, other than certain collateralized loan obligations or certain CLOs, which Apollo measures by using the mark-to-market value of the aggregate principal amount of the underlying CLO and collateralized debt obligation credit funds that have a fee generating basis other than mark-to-market assets or liabilities, plus used or available leverage and/or capital commitments; (iii) the gross asset value or net asset value of Apollo’s real estate entities and the structured portfolio company investments included within the funds Apollo manages, which includes the leverage used by such structured portfolio companies; (iv) the incremental value associated with the reinsurance investments of the portfolio company assets that Apollo manages; and (v) the fair value of any other investments that Apollo manages plus unused credit facilities, including capital commitments for investments that may require pre-qualification before investment plus any other capital commitments available for investment that are not otherwise included in the clauses above. The AUM measure includes AUM for which Apollo charges either no or nominal fees. The definition of AUM is not based on any definition of AUM contained in Apollo’s operating agreement or in any of Apollo’s fund management agreements. Apollo considers multiple factors for determining what should be included in the definition of AUM. Such factors include but are not limited to (1) Apollo’s ability to influence the investment decisions for existing and available assets; (2) Apollo’s ability to generate income from the underlying assets in the funds it manages; and (3) the AUM measures that Apollo uses internally or believes are used by other investment managers. Given the differences in the investment strategies and structures among other alternative investment managers, Apollo’s calculation of AUM may differ from the calculations employed by other investment managers and, as a result, this measure may not be directly comparable to similar measures presented by other investment managers. Assets Under Management (“AUM”) Definition |