|
Exhibit 99.2 
|
Supplemental Financial Information Presentation Q4 2013
February 27, 2014
Information is as of December 31, 2013 except as otherwise noted.
It should not be assumed that investments made in the future will be profitable or will equal the performance of investments in this document.
Legal Disclaimer COMMERCIAL REAL ESTATE FINANCE, INC.
We make forward-looking statements in this presentation and other filings we make with the SEC within the meaning of Section 27A of the Securities Act of 1933, as amended, and Section 21E of the Securities Exchange Act of 1934, as amended, and such statements are intended to be covered by the safe harbor provided by the same. Forward-looking statements are subject to substantial risks and uncertainties, many of which are difficult to predict and are generally beyond our control. These forward-looking statements include information about possible or assumed future results of our business, financial condition, liquidity, results of operations, plans and objectives. When we use the words “believe,” “expect,” “anticipate,” “estimate,” “plan,” “continue,” “intend,” “should,” “may” or similar expressions, we intend to identify forward-looking statements. Statements regarding the following subjects, among others, may be forward-looking: our business and investment strategy; our operating results; our ability to obtain and maintain financing arrangements; the return on equity, the yield on investments and risks associated with investing in real estate assets, including changes in business conditions and the general economy.
The forward-looking statements are based on our beliefs, assumptions and expectations of our future performance, taking into account all information currently available to us. Forward-looking statements are not predictions of future events. These beliefs, assumptions and expectations can change as a result of many possible events or factors, not all of which are known to us. Some of these factors are described under “Risk Factors,” and “Management’s Discussion and Analysis of Financial Condition and Results of Operations” as included in Apollo Commercial Real Estate Finance, Inc.’s (“ARI”) Annual Report on Form 10-K for the fiscal year ended December 31, 2012 and other periodic reports filed with the Securities and Exchange Commission. If a change occurs, our business, financial condition, liquidity and results of operations may vary materially from those expressed in our forward-looking statements. Any forward-looking statement speaks only as of the date on which it is made. New risks and uncertainties arise over time, and it is not possible for us to predict those events or how they may affect us. Except as required by law, we are not obligated to, and do not intend to, update or revise any forward-looking statements, whether as a result of new information, future events or otherwise.
This presentation may contain statistics and other data that in some cases has been obtained from or compiled from information made available by third-party service providers.
Past performance is not indicative nor a guarantee of future returns.
Index performance and yield data are shown for illustrative purposes only and have limitations when used for comparison or for other purposes due to, among other matters, volatility, credit or other factors (such as number and types of securities). Indices are unmanaged, do not charge any fees or expenses, assume reinvestment of income and do not employ special investment techniques such as leveraging or short selling. No such index is indicative of the future results of any investment by ARI.
Apollo Commercial Real Estate Finance, Inc.
COMMERCIAL REAL ESTATE FINANCE, INC. (“ARI”)
2013 Fourth Quarter and Year End Earnings Call
February 27, 2014
Stuart Rothstein
Chief Executive Officer and President
Scott Weiner
Chief Investment Officer of the Manager
Megan Gaul
Chief Financial Officer, Treasurer and Secretary
Hilary Ginsberg
Investor Relations Manager
ARI – Financial Summary COMMERCIAL REAL ESTATE FINANCE, INC. (“ARI”)
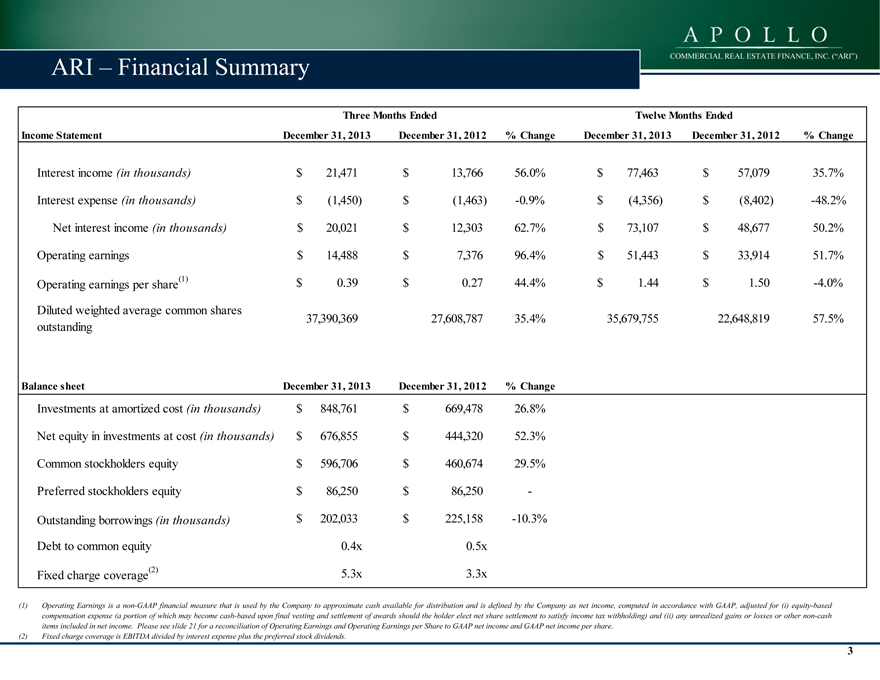
Three Months Ended Twelve Months Ended
Income Statement December 31, 2013 December 31, 2012 % Change December 31, 2013 December 31, 2012 % Change
Interest income (in thousands) $ 21,471 $ 13,766 56.0% $ 77,463 $ 57,079 35.7%
Interest expense (in thousands) $ (1,450) $ (1,463) -0.9% $ (4,356) $ (8,402) -48.2%
Net interest income (in thousands) $ 20,021 $ 12,303 62.7% $ 73,107 $ 48,677 50.2%
Operating earnings $ 14,488 $ 7,376 96.4% $ 51,443 $ 33,914 51.7%
Operating earnings per share(1) $ 0.39 $ 0.27 44.4% $ 1.44 $ 1.50 -4.0%
Diluted weighted average common shares
outstanding 37,390,369 27,608,787 35.4% 35,679,755 22,648,819 57.5%
Balance sheet December 31, 2013 December 31, 2012 % Change
Investments at amortized cost (in thousands) $ 848,761 $ 669,478 26.8%
Net equity in investments at cost (in thousands) $ 676,855 $ 444,320 52.3%
Common stockholders equity $ 596,706 $ 460,674 29.5%
Preferred stockholders equity $ 86,250 $ 86,250 —
Outstanding borrowings (in thousands) $ 202,033 $ 225,158 -10.3%
Debt to common equity 0.4x 0.5x
Fixed charge coverage(2) 5.3x 3.3x
(1) Operating Earnings is a non-GAAP financial measure that is used by the Company to approximate cash available for distribution and is defined by the Company as net income, computed in accordance with GAAP, adjusted for (i) equity-based
compensation expense (a portion of which may become cash-based upon final vesting and settlement of awards should the holder elect net share settlement to satisfy income tax withholding) and (ii) any unrealized gains or losses or other non-cash
items included in net income. Please see slide 21 for a reconciliation of Operating Earnings and Operating Earnings per Share to GAAP net income and GAAP net income per share.
(2) | | Fixed charge coverage is EBITDA divided by interest expense plus the preferred stock dividends. |
COMMERCIAL REAL ESTATE FINANCE, INC. (“ARI”)
ARI – Historical Financial Overview
Operating Earnings ($000s) (1) Operating Earnings per Share(1)
$60,000 $2.00
$51,443
$50,000
$1.60 $1.47 $1.50
$1.44
$40,000
$33,914 $1.20
$1.09
$30,000 $28,054
$0.80
$20,000 $13,830
$10,000 $0.40
$0 $0.00
2010 2011 2012 2013 2010 2011 2012 2013
Net Interest Income ($000s) Dividends per Common Share
$80,000 $2.00
$73,107
$70,000
$1.60 $1.50 $1.60 $1.60 $1.60
$60,000
$50,000 $48,677
$1.20
$38,464
$40,000
$30,000 $0.80
$21,771
$20,000
$0.40
$10,000
$0 $0.00
2010 2011 2012 2013 2010 2011 2012 2013
(1) Operating Earnings is a non-GAAP financial measure that is used by the Company to approximate cash available for distribution and is defined by the Company as net income, computed in accordance with GAAP, adjusted for (i) equity-based compensation expense (a portion of which may
and become Operating cash-based Earnings upon per final Share vesting to GAAP and settlement net income of and awards GAAP should net income the holder per elect share. net share settlement to satisfy income tax withholding) and (ii) any unrealized gains or losses or other non-cash items included in net income. Please see slide 21 for a reconciliation of Operating Earnings 4
ARI – Q4 Highlights COMMERCIAL REAL ESTATE FINANCE, INC. (“ARI”)
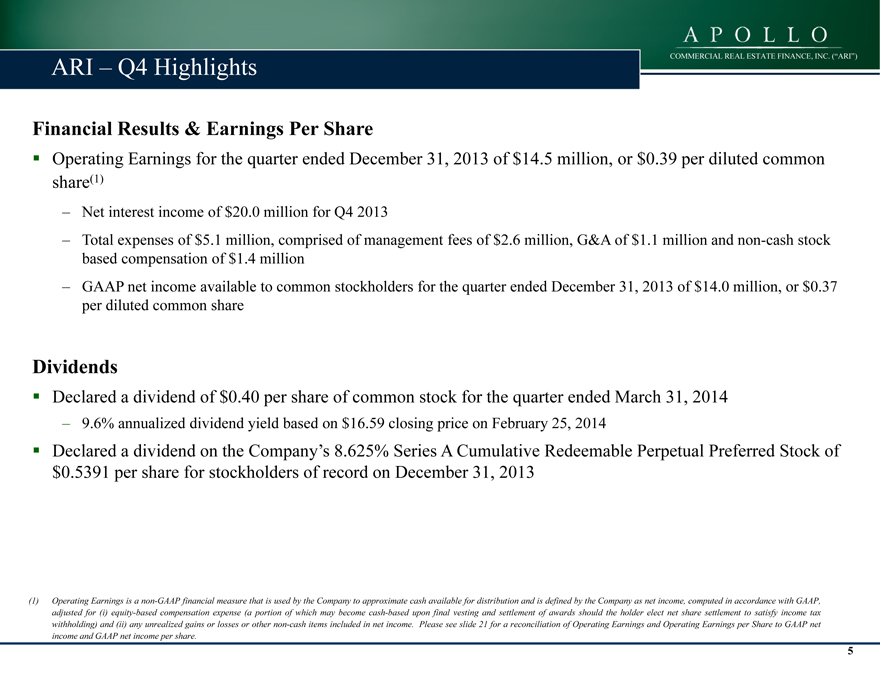
Financial Results & Earnings Per Share
??Operating Earnings for the quarter ended December 31, 2013 of $14.5 million, or $0.39 per diluted common share(1)
– Net interest income of $20.0 million for Q4 2013
– Total expenses of $5.1 million, comprised of management fees of $2.6 million, G&A of $1.1 million and non-cash stock based compensation of $1.4 million
– GAAP net income available to common stockholders for the quarter ended December 31, 2013 of $14.0 million, or $0.37 per diluted common share
Dividends
??Declared a dividend of $0.40 per share of common stock for the quarter ended March 31, 2014
– 9.6% annualized dividend yield based on $16.59 closing price on February 25, 2014
??Declared a dividend on the Company’s 8.625% Series A Cumulative Redeemable Perpetual Preferred Stock of $0.5391 per share for stockholders of record on December 31, 2013
(1) Operating Earnings is a non-GAAP financial measure that is used by the Company to approximate cash available for distribution and is defined by the Company as net income, computed in accordance with GAAP, adjusted for (i) equity-based compensation expense (a portion of which may become cash-based upon final vesting and settlement of awards should the holder elect net share settlement to satisfy income tax withholding) and (ii) any unrealized gains or losses or other non-cash items included in net income. Please see slide 21 for a reconciliation of Operating Earnings and Operating Earnings per Share to GAAP net income and GAAP net income per share.
ARI – Q4 Highlights COMMERCIAL REAL ESTATE FINANCE, INC. (“ARI”)
Investment and Portfolio Activity
??Mezzanine Participations – National Healthcare Portfolio
? $47.0 million of floating rate mezzanine participations secured by a pledge of the equity interests in a borrower that owns a healthcare portfolio consisting of 193 skilled nursing facilities, long-term acute care hospitals and senior housing facilities
? Remaining 9-month term
? Underwritten Loan-to-Value (“LTV”) (inclusive of cash held as collateral) – 58%
? Underwritten IRR(1) ~ 12%
??Mezzanine Loan – Florida Office Portfolio
? $50.0 million floating rate mezzanine loan secured by a pledge of the equity interests in the owner of seven office parks throughout Florida
? Five-year term (three-year initial term and two one-year extension options)
? Underwritten LTV – 82%
? Underwritten IRR(1) ~ 12%
The IRR for the investments shown in this presentation reflect the returns underwritten by ACREFI Management, LLC, the Company’s external manager (the “Manager”), calculated on a weighted average basis assuming no dispositions, early prepayments or defaults but assuming that extension options are exercised and that the cost of borrowings under the master repurchase agreement with Wells Fargo Bank, N.A. (the “Wells Facility”) remains constant over the remaining terms and extension terms under this facility. With respect to certain loans, the IRR calculation assumes certain estimates with respect to the timing and magnitude of future fundings for the remaining commitments and associated loan repayments, and assumes no defaults. IRR is the annualized effective compounded return rate that accounts for the time-value of money and represents the rate of return on an investment over a holding period expressed as a percentage of the investment. It is the discount rate that makes the net present value of all cash outflows (the costs of investment) equal to the net present value of cash inflows (returns on investment). It is derived from the negative and positive cash flows resulting from or produced by each transaction (or for a transaction involving more than one investment, cash flows resulting from or produced by each of the investments), whether positive, such as investment returns, or negative, such as transaction expenses or other costs of investment, taking into account the dates on which such cash flows occurred or are expected to occur, and compounding interest accordingly. There can be no assurance that the actual IRRs will equal the underwritten IRRs shown above. See “Item 1A—Risk Factors—The Company may not achieve its underwritten internal rate of return on its investments which may lead to future returns that may be significantly lower than anticipated” included in the Company’s Annual Report on Form 10-K for the year ended December 31, 2012 for a discussion of some of the factors that could adversely impact the returns received by the Company from the investments shown in the table over time.
ARI – Q4 Highlights COMMERCIAL REAL ESTATE FINANCE, INC. (“ARI”)
Investment and Portfolio Activity (cont.)
??Preferred Equity – National Multifamily, Condo and Hotel Portfolio
? $19.5 million preferred equity investment ($17.0 million of which was funded at closing) for the refinancing of a portfolio of three multifamily properties located in Florida and Illinois, 70 for-sale condominium units in Atlanta, Georgia and a 48-room hotel in Miami, Florida
? ARI received a full payment guarantee on its investment from the owner, an international real estate owner and operator
? Five-year term
? Underwritten LTV – 90%
? Underwritten IRR(1) ~ 16%
??Commercial Mortgage Backed Securities (“CMBS”) Investment
? $9.6 million of equity deployed to acquire legacy CMBS originally rated AAA with an aggregate purchase price of $42.5 million
? In total, ARI deployed $30.1 million of equity to purchase legacy CMBS originally rated AAA with an aggregate purchase price of $133.9 million and a weighted average life of 3.7 years
? Underwritten IRR(1) for all CMBS purchased in 2013 ~ 13%
The IRR for the investments shown in this presentation reflect the returns underwritten by the Manager, calculated on a weighted average basis assuming no dispositions, early prepayments or defaults but assuming that extension options are exercised and that the cost of borrowings under the Wells Facility remains constant over the remaining terms and extension terms under this facility. With respect to certain loans, the IRR calculation assumes certain estimates with respect to the timing and magnitude of future fundings for the remaining commitments and associated loan repayments, and assumes no defaults. IRR is the annualized effective compounded return rate that accounts for the time-value of money and represents the rate of return on an investment over a holding period expressed as a percentage of the investment. It is the discount rate that makes the net present value of all cash outflows (the costs of investment) equal to the net present value of cash inflows (returns on investment). It is derived from the negative and positive cash flows resulting from or produced by each transaction (or for a transaction involving more than one investment, cash flows resulting from or produced by each of the investments), whether positive, such as investment returns, or negative, such as transaction expenses or other costs of investment, taking into account the dates on which such cash flows occurred or are expected to occur, and compounding interest accordingly. There can be no assurance that the actual IRRs will equal the underwritten IRRs shown above. See “Item 1A—Risk Factors—The Company may not achieve its underwritten internal rate of return on its investments which may lead to future returns that may be significantly lower than anticipated” included in the Company’s Annual Report on Form 10-K for the year ended December 31, 2012 for a discussion of some of the factors that could adversely impact the returns received by the Company from the investments shown in the table over time.
ARI – Q4 Highlights COMMERCIAL REAL ESTATE FINANCE, INC. (“ARI”)
Investment and Portfolio Activity (cont.)
??Repayments
? $25 million principal repayment from a mezzanine loan secured by the equity interest in the owner of a New York City hotel portfolio; Realized IRR ~ 12%
? $22 million principal repayment from a subordinate financing secured by the equity interest in the owner of a retail center in Woodbridge, Virginia; Realized IRR ~ 15%
? Full repayment at par from the Hilton CMBS in the amount of $24.1 million; Realized IRR ~ 16%
Portfolio Summary
??Total investments with an amortized cost of $849 million at December 31, 2013
??Current weighted average underwritten IRR of approximately 12.9% and levered weighted average underwritten IRR of approximately 14.1% at December 31, 2013(1)
Book Value Per Share
??GAAP book value of $16.18 per share as of December 31, 2013
??Fair value of $16.42 per share as of December 31, 2013(2)
(1) The IRR for the investments shown in this presentation reflect the returns underwritten by the Manager, calculated on a weighted average basis assuming no dispositions, early prepayments or defaults but assuming that extension options are exercised and that the cost of borrowings under the Wells Facility remains constant over the remaining terms and extension terms under this facility. With respect to certain loans, the IRR calculation assumes certain estimates with respect to the timing and magnitude of future fundings for the remaining commitments and associated loan repayments, and assumes no defaults.
IRR is the annualized effective compounded return rate that accounts for the time-value of money and represents the rate of return on an investment over a holding period expressed as a percentage of the investment. It is the discount rate that makes the net present value of all cash outflows (the costs of investment) equal to the net present value of cash inflows (returns on investment). It is derived from the negative and positive cash flows resulting from or produced by each transaction (or for a transaction involving more than one investment, cash flows resulting from or produced by each of the investments), whether positive, such as investment returns, or negative, such as transaction expenses or other costs of investment, taking into account the dates on which such cash flows occurred or are expected to occur, and compounding interest accordingly. There can be no assurance that the actual IRRs will equal the underwritten IRRs shown above. See “Item 1A—Risk Factors—The Company may not achieve its underwritten internal rate of return on its investments which may lead to future returns that may be significantly lower than anticipated” included in the Company’s Annual Report on Form 10-K for the year ended December 31, 2012 for a discussion of some of the factors that could adversely impact the returns received by the Company from the investments shown in the table over time. In addition, substantially all of the Company’s borrowings under the Company’s master repurchase agreement with JP Morgan Chase Bank, N.A. (the “ JPMorgan Facility”) were repaid. The Company’s ability to achieve its underwritten levered weighted average IRR with regard to its portfolio of first mortgage loans is additionally dependent upon the Company re-borrowing approximately $69,000 under the JPMorgan Facility or any replacement facility. Without such re-borrowing, the levered weighted average IRRs will be the current weighted average IRR.
(2) The Company carries loans at amortized cost and its CMBS are marked to market. Management has estimated that the fair value of the Company’s financial assets at December 31, 2013 was approximately $9.0 million greater than the carrying value of the Company’s investment portfolio as of the same date. This represents a premium of $0.24 per share over the Company’s GAAP book value as of December 31, 2013.
ARI – Subsequent Events COMMERCIAL REAL ESTATE FINANCE, INC. (“ARI”)
Investment Activity
??First Mortgage Loan – Condominium Development, Bethesda, Maryland
? $80 million floating rate first mortgage loan ($25 million of which was funded at closing) for the development of a 50-unit luxury condominium
? Term – 30 months with a 6-month extension option
? Underwritten loan-to-net-sellout (inclusive of cash held as collateral) – 68%
? Underwritten IRR(1) ~ 15%
??Loan Repayment
? Principal repayment from a $15 million mezzanine loan secured by a hotel in New York City
? Realized IRR ~ 14%
??Amendment of Wells Facility
? Extended the maturity date for one year to March 2015 and lowered the interest rate to LIBOR+80 basis points
(1) The IRR for the investments shown in this presentation reflect the returns underwritten by the Manager, calculated on a weighted average basis assuming no dispositions, early prepayments or defaults but assuming that extension options are exercised and that the cost of borrowings under the Wells Facility remains constant over the remaining terms and extension terms under this facility. With respect to certain loans, the IRR calculation assumes certain estimates with respect to the timing and magnitude of future fundings for the remaining commitments and associated loan repayments, and assumes no defaults. IRR is the annualized effective compounded return rate that accounts for the time-value of money and represents the rate of return on an investment over a holding period expressed as a percentage of the investment. It is the discount rate that makes the net present value of all cash outflows (the costs of investment) equal to the net present value of cash inflows (returns on investment). It is derived from the negative and positive cash flows resulting from or produced by each transaction (or for a transaction involving more than one investment, cash flows resulting from or produced by each of the investments), whether positive, such as investment returns, or negative, such as transaction expenses or other costs of investment, taking into account the dates on which such cash flows occurred or are expected to occur, and compounding interest accordingly. There can be no assurance that the actual IRRs will equal the underwritten IRRs shown above. See “Item 1A—Risk Factors—The Company may not achieve its underwritten internal rate of return on its investments which may lead to future returns that may be significantly lower than anticipated” included in the Company’s Annual Report on Form 10-K for the year ended December 31, 2012 for a discussion of some of the factors that could adversely impact the returns received by the Company from the investments shown in the table over time.
9
ARI – Portfolio Overview COMMERCIAL REAL ESTATE FINANCE, INC. (“ARI”)
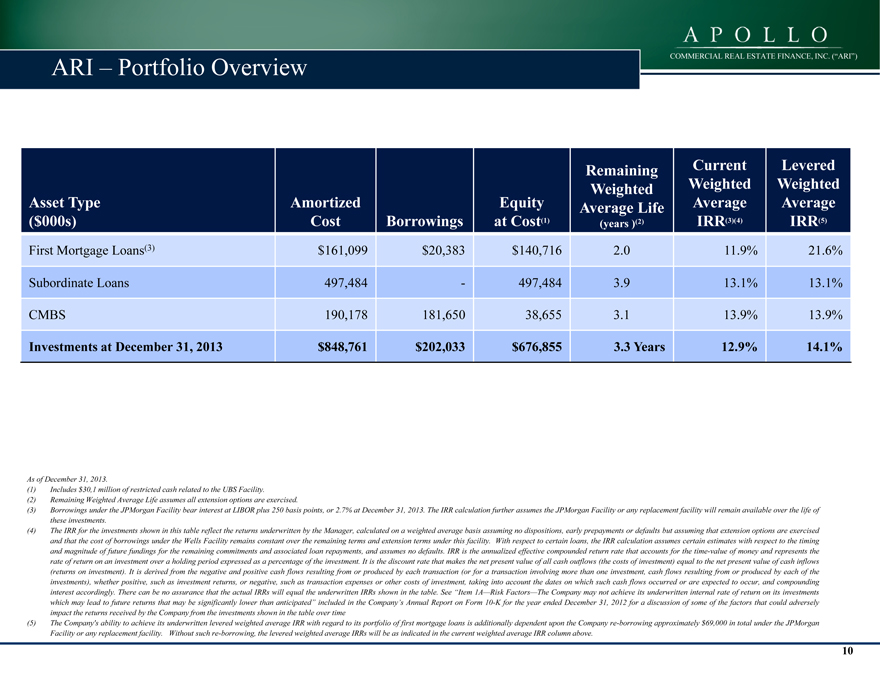
Remaining Current Levered Weighted Weighted Weighted Asset Type Amortized Equity Average Life Average Average
($000s) Cost Borrowings at Cost(1) (years )(2) IRR(3)(4) IRR(5)
First Mortgage Loans(3) $161,099 $20,383 $140,716 2.0 11.9% 21.6% Subordinate Loans 497,484—497,484 3.9 13.1% 13.1% CMBS 190,178 181,650 38,655 3.1 13.9% 13.9%
Investments at December 31, 2013 $848,761 $202,033 $676,855 3.3 Years 12.9% 14.1%
As of December 31, 2013.
(1) | | Includes $30,1 million of restricted cash related to the UBS Facility. |
(2) | | Remaining Weighted Average Life assumes all extension options are exercised. |
(3) Borrowings under the JPMorgan Facility bear interest at LIBOR plus 250 basis points, or 2.7% at December 31, 2013. The IRR calculation further assumes the JPMorgan Facility or any replacement facility will remain available over the life of these investments.
(4) The IRR for the investments shown in this table reflect the returns underwritten by the Manager, calculated on a weighted average basis assuming no dispositions, early prepayments or defaults but assuming that extension options are exercised and that the cost of borrowings under the Wells Facility remains constant over the remaining terms and extension terms under this facility. With respect to certain loans, the IRR calculation assumes certain estimates with respect to the timing and magnitude of future fundings for the remaining commitments and associated loan repayments, and assumes no defaults. IRR is the annualized effective compounded return rate that accounts for the time-value of money and represents the rate of return on an investment over a holding period expressed as a percentage of the investment. It is the discount rate that makes the net present value of all cash outflows (the costs of investment) equal to the net present value of cash inflows (returns on investment). It is derived from the negative and positive cash flows resulting from or produced by each transaction (or for a transaction involving more than one investment, cash flows resulting from or produced by each of the investments), whether positive, such as investment returns, or negative, such as transaction expenses or other costs of investment, taking into account the dates on which such cash flows occurred or are expected to occur, and compounding interest accordingly. There can be no assurance that the actual IRRs will equal the underwritten IRRs shown in the table. See “Item 1A—Risk Factors—The Company may not achieve its underwritten internal rate of return on its investments which may lead to future returns that may be significantly lower than anticipated” included in the Company’s Annual Report on Form 10-K for the year ended December 31, 2012 for a discussion of some of the factors that could adversely impact the returns received by the Company from the investments shown in the table over time (5) The Company’s ability to achieve its underwritten levered weighted average IRR with regard to its portfolio of first mortgage loans is additionally dependent upon the Company re-borrowing approximately $69,000 in total under the JPMorgan Facility or any replacement facility. Without such re-borrowing, the levered weighted average IRRs will be as indicated in the current weighted average IRR column above.
10
ARI – Portfolio Overview COMMERCIAL REAL ESTATE FINANCE, INC. (“ARI”)
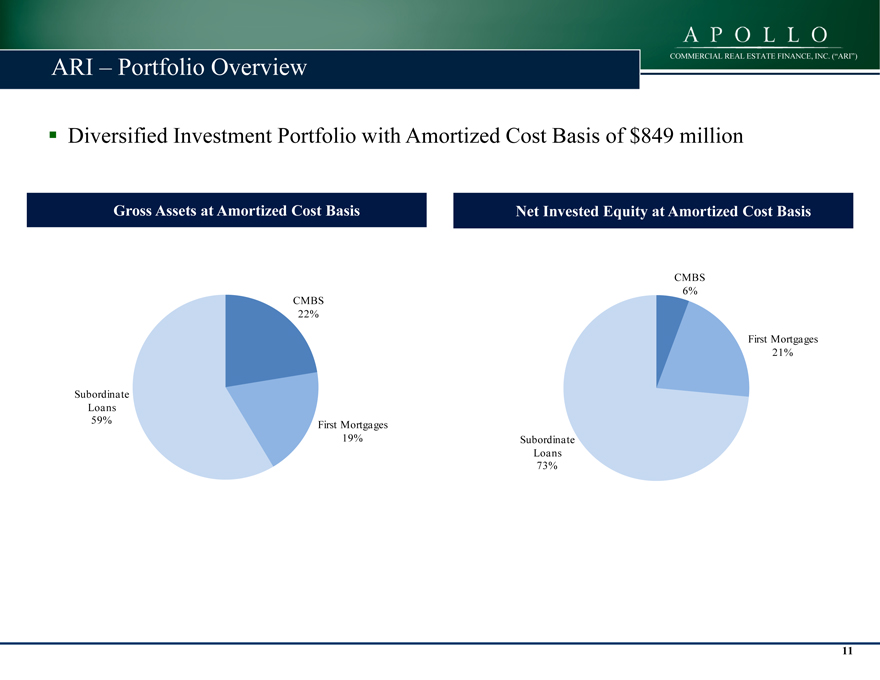
??Diversified Investment Portfolio with Amortized Cost Basis of $849 million
Gross Assets at Amortized Cost Basis Net Invested Equity at Amortized Cost Basis
CMBS
6%
CMBS
22%
First Mortgages
21%
Subordinate
Loans
59% First Mortgages
19% Subordinate
Loans
73%
11
ARI – Portfolio Diversification COMMERCIAL REAL ESTATE FINANCE, INC. (“ARI”)
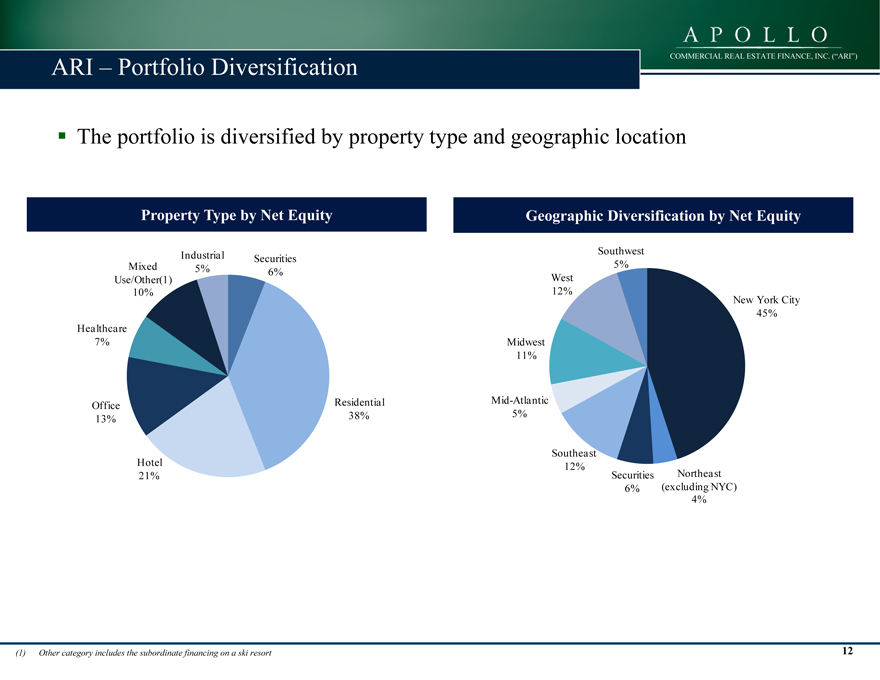
??The portfolio is diversified by property type and geographic location
Property Type by Net Equity Geographic Diversification by Net Equity
Southwest
Industrial Securities
Mixed 5% 6% 5%
Use/Other(1) West
10% 12%
New York City
45%
Healthcare
7% Midwest
11%
Office Residential Mid-Atlantic
13% 38% 5%
Southeast
Hotel 12%
21% Securities Northeast
6% (excluding NYC)
4%
(1) | | Other category includes the subordinate financing on a ski resort 12 |
COMMERCIAL REAL ESTATE FINANCE, INC. (“ARI”)
ARI – Loan Portfolio—Maturity and Type
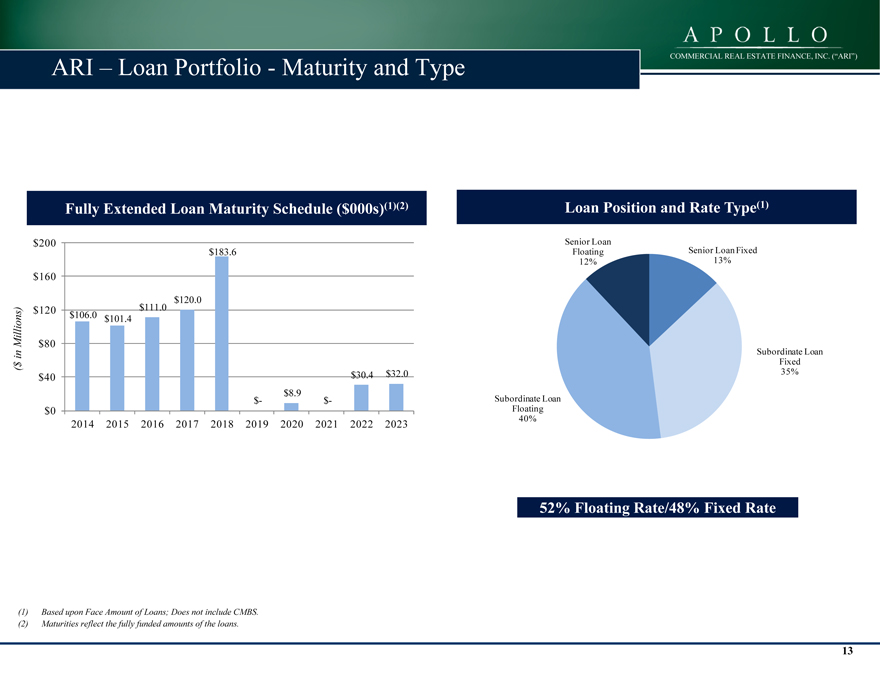
Fully Extended Loan Maturity Schedule ($000s)(1)(2) Loan Position and Rate Type(1)
$200 Senior Loan
$183.6 Floating Senior Loan Fixed
12% 13%
$160
$120.0
$120 $106.0 $111.0
illions) $101.4
M $80
in Subordinate Loan
$ Fixed
(
$40 $30.4 $32.0 35%
$8.9
$- $- Subordinate Loan
$0 Floating
2014 2015 2016 2017 2018 2019 2020 2021 2022 2023 40%
52% Floating Rate/48% Fixed Rate
(1) | | Based upon Face Amount of Loans; Does not include CMBS. |
(2) | | Maturities reflect the fully funded amounts of the loans. |
13
COMMERCIAL REAL ESTATE FINANCE, INC. (“ARI”)
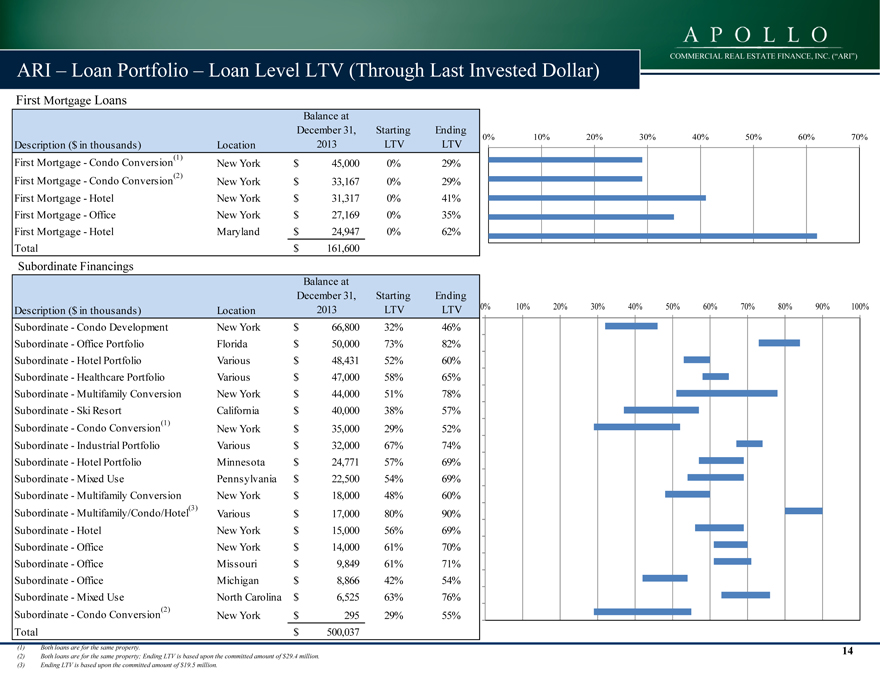
ARI – Loan Portfolio – Loan Level LTV (Through Last Invested Dollar)
First Mortgage Loans
Balance at
December 31, Starting Ending
0% 10% 20% 30% 40% 50% 60% 70%
Description ($ in thousands) Location 2013 LTV LTV
First Mortgage—Condo Conversion(1) New York $ 45,000 0% 29%
First Mortgage—Condo Conversion(2) New York $ 33,167 0% 29%
First Mortgage—Hotel New York $ 31,317 0% 41%
First Mortgage—Office New York $ 27,169 0% 35%
First Mortgage—Hotel Maryland $ 24,947 0% 62%
Total $ 161,600
Subordinate Financings
Balance at
December 31, Starting Ending
Description ($ in thousands) Location 2013 LTV LTV 0% 10% 20% 30% 40% 50% 60% 70% 80% 90% 100%
Subordinate—Condo Development New York $ 66,800 32% 46%
Subordinate—Office Portfolio Florida $ 50,000 73% 82%
Subordinate—Hotel Portfolio Various $ 48,431 52% 60%
Subordinate—Healthcare Portfolio Various $ 47,000 58% 65%
Subordinate—Multifamily Conversion New York $ 44,000 51% 78%
Subordinate—Ski Resort California $ 40,000 38% 57%
Subordinate—Condo Conversion(1) New York $ 35,000 29% 52%
Subordinate—Industrial Portfolio Various $ 32,000 67% 74%
Subordinate—Hotel Portfolio Minnesota $ 24,771 57% 69%
Subordinate—Mixed Use Pennsylvania $ 22,500 54% 69%
Subordinate—Multifamily Conversion New York $ 18,000 48% 60%
Subordinate—Multifamily/Condo/Hotel(3) Various $ 17,000 80% 90%
Subordinate—Hotel New York $ 15,000 56% 69%
Subordinate—Office New York $ 14,000 61% 70%
Subordinate—Office Missouri $ 9,849 61% 71%
Subordinate—Office Michigan $ 8,866 42% 54%
Subordinate—Mixed Use North Carolina $ 6,525 63% 76%
Subordinate—Condo Conversion(2) New York $ 295 29% 55%
Total $ 500,037
(1) | | Both loans are for the same property. 14 |
(2) | | Both loans are for the same property; Ending LTV is based upon the committed amount of $29.4 million. |
(3) | | Ending LTV is based upon the committed amount of $19.5 million. |
COMMERCIAL REAL ESTATE FINANCE, INC. (“ARI”)
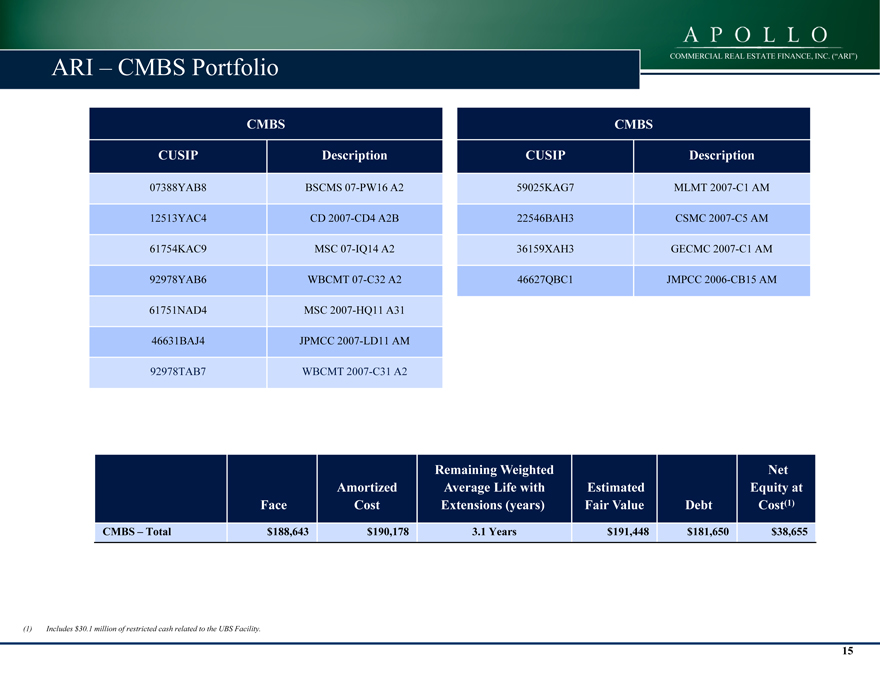
ARI – CMBS Portfolio
CMBS CMBS
CUSIP Description CUSIP Description
07388YAB8 BSCMS 07-PW16 A2 59025KAG7 MLMT 2007-C1 AM
12513YAC4 CD 2007-CD4 A2B 22546BAH3 CSMC 2007-C5 AM
61754KAC9 MSC 07-IQ14 A2 36159XAH3 GECMC 2007-C1 AM
92978YAB6 WBCMT 07-C32 A2 46627QBC1 JMPCC 2006-CB15 AM
61751NAD4 MSC 2007-HQ11 A31
46631BAJ4 JPMCC 2007-LD11 AM
92978TAB7 WBCMT 2007-C31 A2
Remaining Weighted Net
Amortized Average Life with Estimated Equity at
Face Cost Extensions (years) Fair Value Debt Cost(1)
CMBS – Total $188,643 $190,178 3.1 Years $191,448 $181,650 $38,655
(1) | | Includes $30.1 million of restricted cash related to the UBS Facility. |
15
COMMERCIAL REAL ESTATE FINANCE, INC. (“ARI”)
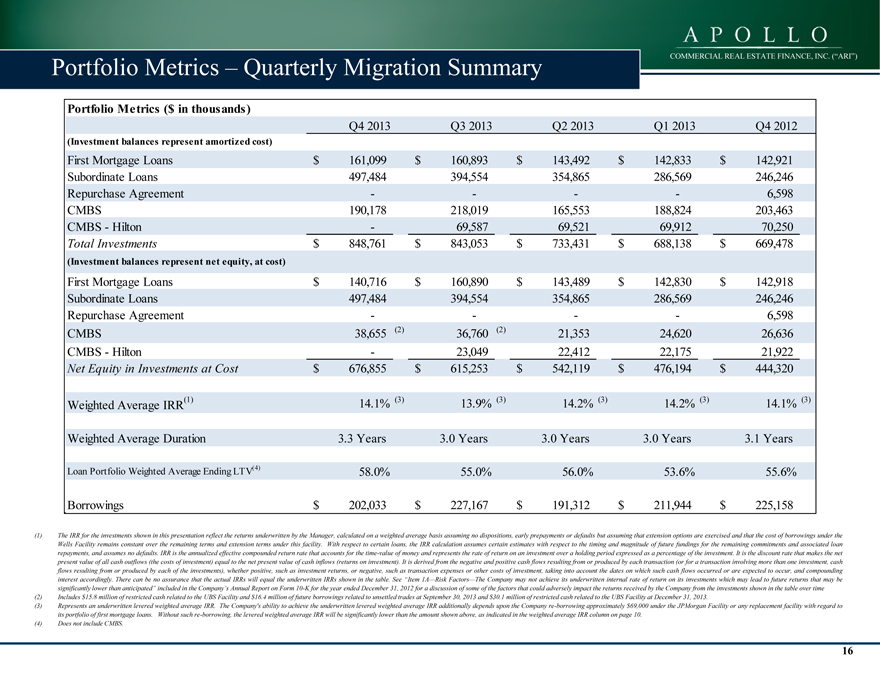
Portfolio Metrics – Quarterly Migration Summary
Portfolio Metrics ($ in thousands)
Q4 2013 Q3 2013 Q2 2013 Q1 2013 Q4 2012
(Investment balances represent amortized cost)
First Mortgage Loans $ 161,099 $ 160,893 $ 143,492 $ 142,833 $ 142,921
Subordinate Loans 497,484 394,554 354,865 286,569 246,246
Repurchase Agreement — — — — 6,598
CMBS 190,178 218,019 165,553 188,824 203,463
CMBS—Hilton — 69,587 69,521 69,912 70,250
Total Investments $ 848,761 $ 843,053 $ 733,431 $ 688,138 $ 669,478
(Investment balances represent net equity, at cost)
First Mortgage Loans $ 140,716 $ 160,890 $ 143,489 $ 142,830 $ 142,918
Subordinate Loans 497,484 394,554 354,865 286,569 246,246
Repurchase Agreement — — — — 6,598
CMBS 38,655 (2) 36,760 (2) 21,353 24,620 26,636
CMBS—Hilton — 23,049 22,412 22,175 21,922
Net Equity in Investments at Cost $ 676,855 $ 615,253 $ 542,119 $ 476,194 $ 444,320
Weighted Average IRR(1) 14.1% (3) 13.9% (3) 14.2% (3) 14.2% (3) 14.1% (3)
Weighted Average Duration 3.3 Years 3.0 Years 3.0 Years 3.0 Years 3.1 Years
Loan Portfolio Weighted Average Ending LTV(4) 58.0% 55.0% 56.0% 53.6% 55.6%
Borrowings $ 202,033 $ 227,167 $ 191,312 $ 211,944 $ 225,158
(1) The IRR for the investments shown in this presentation reflect the returns underwritten by the Manager, calculated on a weighted average basis assuming no dispositions, early prepayments or defaults but assuming that extension options are exercised and that the cost of borrowings under the
Wells Facility remains constant over the remaining terms and extension terms under this facility. With respect to certain loans, the IRR calculation assumes certain estimates with respect to the timing and magnitude of future fundings for the remaining commitments and associated loan
repayments, and assumes no defaults. IRR is the annualized effective compounded return rate that accounts for the time-value of money and represents the rate of return on an investment over a holding period expressed as a percentage of the investment. It is the discount rate that makes the net
present value of all cash outflows (the costs of investment) equal to the net present value of cash inflows (returns on investment). It is derived from the negative and positive cash flows resulting from or produced by each transaction (or for a transaction involving more than one investment, cash
flows resulting from or produced by each of the investments), whether positive, such as investment returns, or negative, such as transaction expenses or other costs of investment, taking into account the dates on which such cash flows occurred or are expected to occur, and compounding
interest accordingly. There can be no assurance that the actual IRRs will equal the underwritten IRRs shown in the table. See “Item 1A—Risk Factors—The Company may not achieve its underwritten internal rate of return on its investments which may lead to future returns that may be
significantly lower than anticipated” included in the Company’s Annual Report on Form 10-K for the year ended December 31, 2012 for a discussion of some of the factors that could adversely impact the returns received by the Company from the investments shown in the table over time
(2) Includes $15.8 million of restricted cash related to the UBS Facility and $16.4 million of future borrowings related to unsettled trades at September 30, 2013 and $ 30.1 million of restricted cash related to the UBS Facility at December 31, 2013.
(3) Represents an underwritten levered weighted average IRR. The Company’s ability to achieve the underwritten levered weighted average IRR additionally depends upon the Company re-borrowing approximately $ 69,000 under the JPMorgan Facility or any replacement facility with regard to
its portfolio of first mortgage loans. Without such re-borrowing, the levered weighted average IRR will be significantly lower than the amount shown above, as indicated in the weighted average IRR column on page 10.
(4) | | Does not include CMBS. |
16
COMMERCIAL REAL ESTATE FINANCE, INC. (“ARI”)
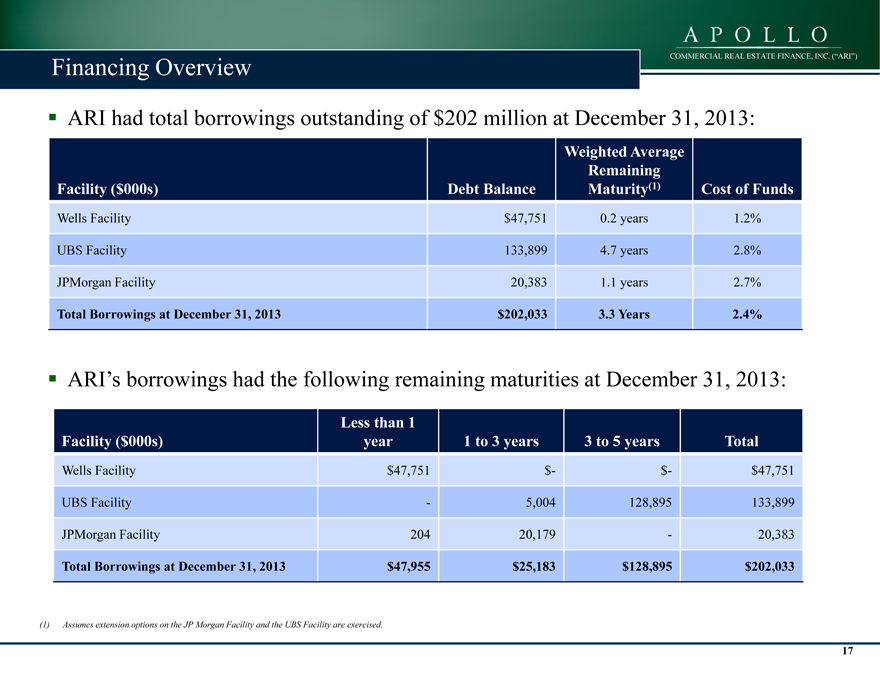
Financing Overview
? ARI had total borrowings outstanding of $202 million at December 31, 2013:
Weighted Average
Remaining
Facility ($000s) Debt Balance Maturity(1) Cost of Funds
Wells Facility $47,751 0.2 years 1.2%
UBS Facility 133,899 4.7 years 2.8%
JPMorgan Facility 20,383 1.1 years 2.7%
Total Borrowings at December 31, 2013 $202,033 3.3 Years 2.4%
? ARI’s borrowings had the following remaining maturities at December 31, 2013:
Less than 1
Facility ($000s) year 1 to 3 years 3 to 5 years Total
Wells Facility $ 47,751 $- $- $47,751
UBS Facility — 5,004 128,895 133,899
JPMorgan Facility 204 20,179 — 20,383
Total Borrowings at December 31, 2013 $ 47,955 $25,183 $128,895 $202,033
(1) | | Assumes extension options on the JP Morgan Facility and the UBS Facility are exercised. |
17
COMMERCIAL REAL ESTATE FINANCE, INC. (“ARI”)
Financials
18
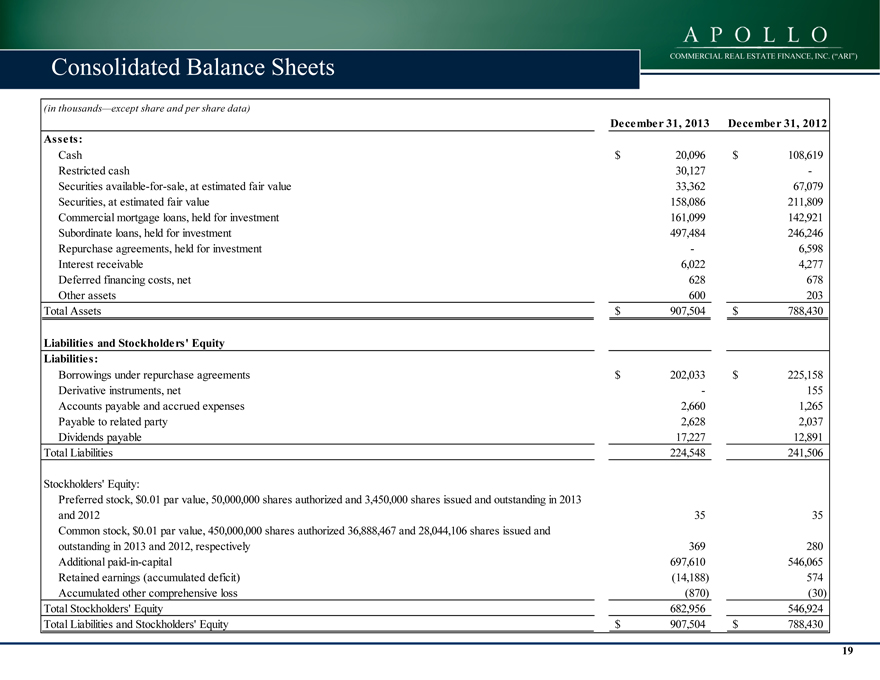
Consolidated Balance Sheets COMMERCIAL REAL ESTATE FINANCE, INC. (“ARI”)
(in thousands—except share and per share data)
December 31, 2013 December 31, 2012
Assets:
Cash $ 20,096 $ 108,619
Restricted cash 30,127 -
Securities available-for-sale, at estimated fair value 33,362 67,079
Securities, at estimated fair value 158,086 211,809
Commercial mortgage loans, held for investment 161,099 142,921
Subordinate loans, held for investment 497,484 246,246
Repurchase agreements, held for investment — 6,598
Interest receivable 6,022 4,277
Deferred financing costs, net 628 678
Other assets 600 203
Total Assets $ 907,504 $ 788,430
Liabilities and Stockholders’ Equity
Liabilities:
Borrowings under repurchase agreements $ 202,033 $ 225,158
Derivative instruments, net — 155
Accounts payable and accrued expenses 2,660 1,265
Payable to related party 2,628 2,037
Dividends payable 17,227 12,891
Total Liabilities 224,548 241,506
Stockholders’ Equity:
Preferred stock, $0.01 par value, 50,000,000 shares authorized and 3,450,000 shares issued and outstanding in 2013
and 2012 35 35
Common stock, $0.01 par value, 450,000,000 shares authorized 36,888,467 and 28,044,106 shares issued and
outstanding in 2013 and 2012, respectively 369 280
Additional paid-in-capital 697,610 546,065
Retained earnings (accumulated deficit) (14,188) 574
Accumulated other comprehensive loss (870) (30)
Total Stockholders’ Equity 682,956 546,924
Total Liabilities and Stockholders’ Equity $ 907,504 $ 788,430
19
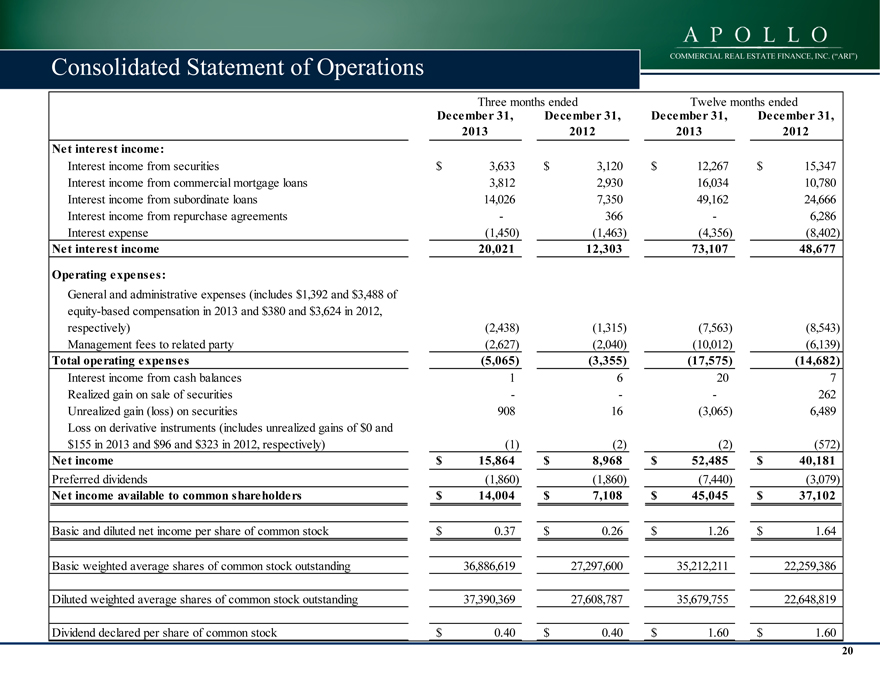
Consolidated Statement of Operations COMMERCIAL REAL ESTATE FINANCE, INC. (“ARI”)
Three months ended Twelve months ended
December 31, December 31, December 31, December 31,
2013 2012 2013 2012
Net interest income:
Interest income from securities $ 3,633 $ 3,120 $ 12,267 $ 15,347
Interest income from commercial mortgage loans 3,812 2,930 16,034 10,780
Interest income from subordinate loans 14,026 7,350 49,162 24,666
Interest income from repurchase agreements — 366 — 6,286
Interest expense (1,450) (1,463) (4,356) (8,402)
Net interest income 20,021 12,303 73,107 48,677
Operating expenses:
General and administrative expenses (includes $1,392 and $3,488 of
equity-based compensation in 2013 and $380 and $3,624 in 2012,
respectively) (2,438) (1,315) (7,563) (8,543)
Management fees to related party (2,627) (2,040) (10,012) (6,139)
Total operating expenses (5,065) (3,355) (17,575) (14,682)
Interest income from cash balances 1 6 20 7
Realized gain on sale of securities — — — 262
Unrealized gain (loss) on securities 908 16 (3,065) 6,489
Loss on derivative instruments (includes unrealized gains of $0 and
$155 in 2013 and $96 and $323 in 2012, respectively) (1) (2) (2) (572)
Net income $ 15,864 $ 8,968 $ 52,485 $ 40,181
Preferred dividends (1,860) (1,860) (7,440) (3,079)
Net income available to common shareholders $ 14,004 $ 7,108 $ 45,045 $ 37,102
Basic and diluted net income per share of common stock $ 0.37 $ 0.26 $ 1.26 $ 1.64
Basic weighted average shares of common stock outstanding 36,886,619 27,297,600 35,212,211 22,259,386
Diluted weighted average shares of common stock outstanding 37,390,369 27,608,787 35,679,755 22,648,819
Dividend declared per share of common stock $ 0.40 $ 0.40 $ 1.60 $ 1.60
20
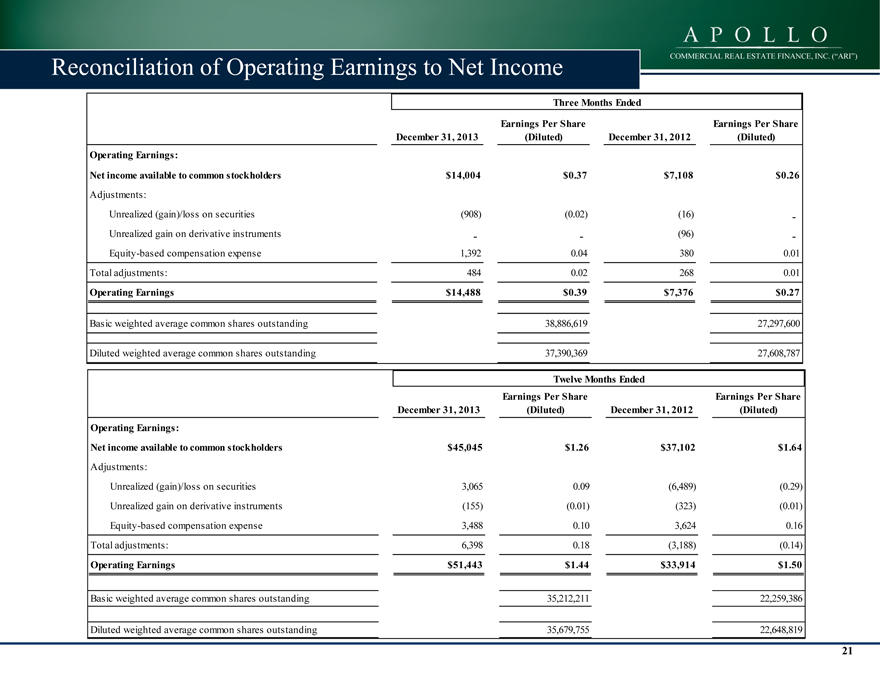
Reconciliation of Operating Earnings to Net Income COMMERCIAL REAL ESTATE FINANCE, INC. (“ARI”)
Three Months Ended
Earnings Per Share Earnings Per Share
December 31, 2013 (Diluted) December 31, 2012 (Diluted)
Operating Earnings:
Net income available to common stockholders $14,004 $0.37 $7,108 $0.26
Adjustments:
Unrealized (gain)/loss on securities (908) (0.02) (16) -
Unrealized gain on derivative instruments —— (96) -
Equity-based compensation expense 1392, 004. 380 001.
Total adjustments: 484 0.02 268 0.01
Operating Earnings $14,488 $0.39 $7,376 $0.27
Basic weighted average common shares outstanding 38,886,619 27,297,600
Diluted weighted average common shares outstanding 37,390,369 27,608,787
Twelve Months Ended
Earnings Per Share Earnings Per Share
December 31, 2013 (Diluted) December 31, 2012 (Diluted)
Operating Earnings:
Net income available to common stockholders $45,045 $1.26 $37,102 $1.64
Adjustments:
Unrealized (gain)/loss on securities 3,065 0.09 (6,489) (0.29)
Unrealized gain on derivative instruments (155) (0.01) (323) (0.01)
Equity-based compensation expense 3,488 0.10 3,624 0.16
Total adjustments: 6,398 0.18 (3,188) (0.14)
Operating Earnings $51,443 $1.44 $33,914 $1.50
Basic weighted average common shares outstanding 35,212,211 22,259,386
Diluted weighted average common shares outstanding 35,679,755 22,648,819
21
COMMERCIAL REAL ESTATE FINANCE, INC. (“ARI”)
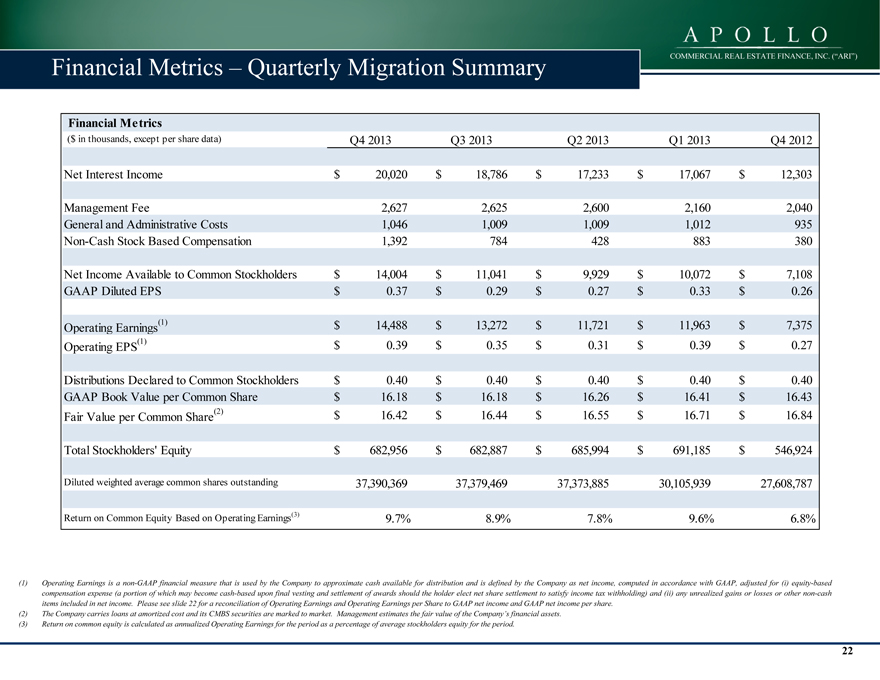
Financial Metrics – Quarterly Migration Summary
Financial Metrics
($ in thousands, except per share data) Q4 2013 Q3 2013 Q2 2013 Q1 2013 Q4 2012
Net Interest Income $ 20,020 $ 18,786 $ 17,233 $ 17,067 $ 12,303
Management Fee 2,627 2,625 2,600 2,160 2,040
General and Administrative Costs 1,046 1,009 1,009 1,012 935
Non-Cash Stock Based Compensation 1,392 784 428 883 380
Net Income Available to Common Stockholders $ 14,004 $ 11,041 $ 9,929 $ 10,072 $ 7,108
GAAP Diluted EPS $ 0.37 $ 0.29 $ 0.27 $ 0.33 $ 0.26
Operating Earnings(1) $ 14,488 $ 13,272 $ 11,721 $ 11,963 $ 7,375
Operating EPS(1) $ 0.39 $ 0.35 $ 0.31 $ 0.39 $ 0.27
Distributions Declared to Common Stockholders $ 0.40 $ 0.40 $ 0.40 $ 0.40 $ 0.40
GAAP Book Value per Common Share $ 16.18 $ 16.18 $ 16.26 $ 16.41 $ 16.43
Fair Value per Common Share(2) $ 16.42 $ 16.44 $ 16.55 $ 16.71 $ 16.84
Total Stockholders’ Equity $ 682,956 $ 682,887 $ 685,994 $ 691,185 $ 546,924
Diluted weighted average common shares outstanding 37,390,369 37,379,469 37,373,885 30,105,939 27,608,787
Return on Common Equity Based on Operating Earnings(3) 9.7% 8.9% 7.8% 9.6% 6.8%
Operating Earnings is a non-GAAP financial measure that is used by the Company to approximate cash available for distribution and is defined by the Company as net income, computed in accordance with GAAP, adjusted for (i) equity-based
compensation expense (a portion of which may become cash-based upon final vesting and settlement of awards should the holder elect net share settlement to satisfy income tax withholding) and (ii) any unrealized gains or losses or other non-cash
items included in net income. Please see slide 22 for a reconciliation of Operating Earnings and Operating Earnings per Share to GAAP net income and GAAP net income per share.
The Company carries loans at amortized cost and its CMBS securities are marked to market. Management estimates the fair value of the Company’s financial assets.
Return on common equity is calculated as annualized Operating Earnings for the period as a percentage of average stockholders equity for the period.
22