![]() April 30, 2014 Supplemental Financial Information Presentation Q1 2014 Information is as of March 31, 2014 except as otherwise noted. It should not be assumed that investments made in the future will be profitable or will equal the performance of investments in this document. Exhibit 99.2 |
![]() 1 COMMERCIAL REAL ESTATE FINANCE, INC. (“ARI”) Legal Disclaimer We make forward-looking statements in this presentation and other filings we make with the SEC within the meaning of Section 27A of the Securities Act of 1933, as amended, and Section 21E of the Securities Exchange Act of 1934, as amended, and such statements are intended to be covered by the safe harbor provided by the same. Forward-looking statements are subject to substantial risks and uncertainties, many of which are difficult to predict and are generally beyond our control. These forward-looking statements include information about possible or assumed future results of our business, financial condition, liquidity, results of operations, plans and objectives. When we use the words “believe,” “expect,” “anticipate,” “estimate,” “plan,” “continue,” “intend,” “should,” “may” or similar expressions, we intend to identify forward-looking statements. Statements regarding the following subjects, among others, may be forward-looking: our business and investment strategy; our operating results; our ability to obtain and maintain financing arrangements; the return on equity, the yield on investments and risks associated with investing in real estate assets, including changes in business conditions and the general economy. The forward-looking statements are based on our beliefs, assumptions and expectations of our future performance, taking into account all information currently available to us. Forward-looking statements are not predictions of future events. These beliefs, assumptions and expectations can change as a result of many possible events or factors, not all of which are known to us. Some of these factors are described under “Risk Factors,” and “Management’s Discussion and Analysis of Financial Condition and Results of Operations” as included in ARI’s Annual Report on Form 10-K for the fiscal year ended December 31, 2013 and other periodic reports filed with the Securities and Exchange Commission. If a change occurs, our business, financial condition, liquidity and results of operations may vary materially from those expressed in our forward-looking statements. Any forward-looking statement speaks only as of the date on which it is made. New risks and uncertainties arise over time, and it is not possible for us to predict those events or how they may affect us. Except as required by law, we are not obligated to, and do not intend to, update or revise any forward-looking statements, whether as a result of new information, future events or otherwise. This presentation may contain statistics and other data that in some cases has been obtained from or compiled from information made available by third-party service providers. Apollo makes no representation or warranty, expressed or implied, with respect to the accuracy, reasonableness or completeness of such information. Past performance is not indicative nor a guarantee of future returns. Index performance and yield data are shown for illustrative purposes only and have limitations when used for comparison or for other purposes due to, among other matters, volatility, credit or other factors (such as number and types of securities). Indices are unmanaged, do not charge any fees or expenses, assume reinvestment of income and do not employ special investment techniques such as leveraging or short selling. No such index is indicative of the future results of any investment by ARI. |
![]() 2 COMMERCIAL REAL ESTATE FINANCE, INC. (“ARI”) Apollo Commercial Real Estate Finance, Inc. 2014 First Quarter Earnings Call April 30, 2014 Stuart Rothstein Chief Executive Officer and President Scott Weiner Chief Investment Officer of the Manager Megan Gaul Chief Financial Officer, Treasurer and Secretary Hilary Ginsberg Investor Relations Manager |
![]() 3 COMMERCIAL REAL ESTATE FINANCE, INC. (“ARI”) ARI – Financial Summary Income Statement March 31, 2014 March 31, 2013 % Change 21,160 $ 18,135 $ 16.7% (1,757) $ (1,068) $ 64.5% Net interest income (in thousands) 19,403 $ 17,067 $ 13.7% Operating earnings (in thousands) 13,991 $ 11,963 $ 17.0% 0.37 $ 0.39 $ -5.1% 37,341,050 30,480,689 22.5% Balance sheet March 31, 2014 December 31, 2013 % Change 843,669 $ 848,761 $ -0.6% 706,802 $ 676,855 $ 4.4% Common stockholders equity (in thousands) 601,662 $ 596,706 $ 0.8% 86,250 $ 86,250 $ - 166,994 $ 202,033 $ -17.3% Convertible senior notes (in thousands) 139,163 $ - $ 100.0% 0.5x 0.4x 5.1x 5.3x Three Months Ended Interest income (in thousands) Interest expense (in thousands) Operating earnings per share (1) Diluted weighted average shares of common stock outstanding Investments at amortized cost (in thousands) Net equity in investments at cost (in thousands Preferred stockholders equity (in thousands) Debt to common equity Outstanding borrowings (in thousands) Fixed charge coverage (2) ) (1) Operating Earnings is a non-GAAP financial measure that is used by the Company to approximate cash available for distribution and is defined by the Company as net income available to common stockholders, computed in accordance with GAAP, adjusted for (i) equity-based compensation expense (a portion of which may become cash-based upon final vesting and settlement of awards should the holder elect net share settlement to satisfy income tax withholding) (ii) any unrealized gains or losses or other non-cash items included in net income and (iii) the non-cash amortization expense related to the reclassification of a portion of the senior convertible notes to stockholders’ equity in accordance with GAAP. Please see slide 20 for a reconciliation of Operating Earnings and Operating Earnings per Share to GAAP net income and GAAP net income per share. (2) Fixed charge coverage is EBITDA divided by interest expense plus the preferred stock dividends. |
![]() 4 COMMERCIAL REAL ESTATE FINANCE, INC. (“ARI”) ARI – Historical Financial Overview Operating Earnings ($000s) (1) Net Interest Income ($000s) Dividends per Common Share Operating Earnings per Share (1) (1) Operating Earnings is a non-GAAP financial measure that is used by the Company to approximate cash available for distribution and is defined by the Company as net income available to common stockholders, computed in accordance with GAAP, adjusted for (i) equity-based compensation expense (a portion of which may become cash-based upon final vesting and settlement of awards should the holder elect net share settlement to satisfy income tax withholding) (ii) any unrealized gains or losses or other non-cash items included in net income and (iii) the non-cash amortization expense related to the reclassification of a portion of the senior convertible notes to stockholders’ equity in accordance with GAAP. Please see slide 20 for a reconciliation of Operating Earnings and Operating Earnings per Share to GAAP net income and GAAP net income per share. $13,830 $28,054 $33,914 $51,443 $13,991 $0 $10,000 $20,000 $30,000 $40,000 $50,000 $60,000 2010 2011 2012 2013 Q1 2014 $1.09 $1.44 $0.37 $0.00 $0.40 $0.80 $1.20 $1.60 $2.00 2010 2011 2012 2013 Q1 2014 $1.50 $1.60 $1.60 $1.60 $0.40 $0.00 $0.40 $0.80 $1.20 $1.60 $2.00 2010 2011 2012 2013 Q1 2014 $21,771 $38,464 $48,677 $73,107 $19,403 $0 $10,000 $20,000 $30,000 $40,000 $50,000 $60,000 $70,000 $80,000 2010 2011 2012 2013 Q1 2014 $1.47 $1.50 |
![]() 5 COMMERCIAL REAL ESTATE FINANCE, INC. (“ARI”) ARI – Q1 Highlights Financial Results & Earnings Per Share Operating Earnings for the quarter ended March 31, 2014 of $14.0 million, or $0.37 per diluted share of common stock (1) – Net interest income of $19.4 million for Q1 2014 – Total expenses of $4.0 million, comprised of management fees of $2.6 million, G&A of $1.0 million and equity-based compensation of $0.4 million – GAAP net income available to common stockholders for the quarter ended March 31, 2014 of $15.7 million, or $0.42 per diluted share of common stock Dividends Declared a dividend of $0.40 per share of common stock for the quarter ended June 30, 2014 – 9.4% annualized dividend yield based on $17.04 closing price on April 28, 2014 Declared a dividend on the Company’s 8.625% Series A Cumulative Redeemable Perpetual Preferred Stock of $0.5391 per share for stockholders of record on March 31, 2014 (1) Operating Earnings is a non-GAAP financial measure that is used by the Company to approximate cash available for distribution and is defined by the Company as net income available to common stockholders, computed in accordance with GAAP, adjusted for (i) equity-based compensation expense (a portion of which may become cash-based upon final vesting and settlement of awards should the holder elect net share settlement to satisfy income tax withholding) (ii) any unrealized gains or losses or other non-cash items included in net income and (iii) the non-cash amortization expense related to the reclassification of a portion of the senior convertible notes to stockholders’ equity in accordance with GAAP. Please see slide 20 for a reconciliation of Operating Earnings and Operating Earnings per Share to GAAP net income and GAAP net income per share. |
![]() 6 COMMERCIAL REAL ESTATE FINANCE, INC. (“ARI”) ARI – Q1 Highlights Investment and Portfolio Activity First Mortgage Loan – Maryland Condominium Development $80 million floating rate first mortgage loan ($25 million of which was funded at closing) for the development of a 50-unit luxury condominium Term – 30 months with a 6-month extension option Underwritten loan-to-net-sellout (inclusive of cash held as collateral) – 68% Underwritten IRR (1) ~ 15% Loan Repayment Principal repayment from a $15 million mezzanine loan secured by a hotel in New York City Realized IRR ~ 14% Capital Market Activity Amendment of Wells Facility Extended the maturity date for one year to March 2015 and lowered the interest rate to LIBOR+80 basis points (1) The IRR for the investments shown in this presentation reflect the returns underwritten by ACREFI Management, LLC, the Company’s external manager (the “Manager”), calculated on a weighted average basis assuming no dispositions, early prepayments or defaults but assuming that extension options are exercised and that the cost of borrowings under the master repurchase agreement with Wells Fargo Bank, N.A. (the “Wells Facility”) remains constant over the remaining terms and extension terms under this facility. With respect to certain loans, the IRR calculation assumes certain estimates with respect to the timing and magnitude of future fundings for the remaining commitments and associated loan repayments, and assumes no defaults. IRR is the annualized effective compounded return rate that accounts for the time-value of money and represents the rate of return on an investment over a holding period expressed as a percentage of the investment. It is the discount rate that makes the net present value of all cash outflows (the costs of investment) equal to the net present value of cash inflows (returns on investment). It is derived from the negative and positive cash flows resulting from or produced by each transaction (or for a transaction involving more than one investment, cash flows resulting from or produced by each of the investments), whether positive, such as investment returns, or negative, such as transaction expenses or other costs of investment, taking into account the dates on which such cash flows occurred or are expected to occur, and compounding interest accordingly. There can be no assurance that the actual IRRs will equal the underwritten IRRs shown above. See “Item 1A—Risk Factors—The Company may not achieve its underwritten internal rate of return on its investments which may lead to future returns that may be significantly lower than anticipated” included in the Company’s Annual Report on Form 10-K for the year ended December 31, 2013 for a discussion of some of the factors that could adversely impact the returns received by the Company from the investments shown in the table over time. |
![]() 7 COMMERCIAL REAL ESTATE FINANCE, INC. (“ARI”) Capital Markets Activity (cont.) Convertible Notes Offering $143.75 million aggregate principal amount of 5.50% Convertible Senior Notes due 2019 (the “Notes”) Initial conversion rate equals 55.3649 shares of common stock per $1,000 principal amount of Notes, which is equivalent to a conversion price of $18.06 per share of common stock, representing a 10% conversion premium based upon the closing price of the Company’s common stock of $16.42 per share on March 11, 2014 Portfolio Summary Total investments with an amortized cost of $844 million at March 31, 2014 Current weighted average underwritten IRR of approximately 12.6% and levered weighted average underwritten IRR of approximately 14.1% at March 31, 2014 (1) Book Value Per Share GAAP book value of $16.21 per share as of March 31, 2014 Fair value of $16.31 per share as of March 31, 2014 (2) ARI – Q1 Highlights (1) The underwritten IRR for the investments shown in this presentation reflect the returns underwritten by the Manager, calculated on a weighted average basis assuming no dispositions, early prepayments or defaults but assuming that extension options are exercised and that the cost of borrowings under the Wells Facility remains constant over the remaining terms and extension terms under this facility. With respect to certain loans, the underwritten IRR calculation assumes certain estimates with respect to the timing and magnitude of future fundings for the remaining commitments and associated loan repayments, and assumes no defaults. IRR is the annualized effective compounded return rate that accounts for the time-value of money and represents the rate of return on an investment over a holding period expressed as a percentage of the investment. It is the discount rate that makes the net present value of all cash outflows (the costs of investment) equal to the net present value of cash inflows (returns on investment). It is derived from the negative and positive cash flows resulting from or produced by each transaction (or for a transaction involving more than one investment, cash flows resulting from or produced by each of the investments), whether positive, such as investment returns, or negative, such as transaction expenses or other costs of investment, taking into account the dates on which such cash flows occurred or are expected to occur, and compounding interest accordingly. There can be no assurance that the actual IRRs will equal the underwritten IRRs shown above. See “Item 1A—Risk Factors—The Company may not achieve its underwritten internal rate of return on its investments which may lead to future returns that may be significantly lower than anticipated” included in the Company’s Annual Report on Form 10-K for the year ended December 31, 2013 for a discussion of some of the factors that could adversely impact the returns received by the Company from the investments shown in the table over time. In addition, substantially all of the Company’s borrowings under the Company’s master repurchase agreement with JP Morgan Chase Bank, N.A. (the “ JPMorgan Facility”) were repaid. The Company's ability to achieve its underwritten levered weighted average IRR with regard to its portfolio of first mortgage loans is additionally dependent upon the Company re-borrowing approximately $88,000 under the JPMorgan Facility or any replacement facility. Without such re-borrowing, the levered weighted average underwritten IRRs would be the current weighted average underwritten IRR. (2) The Company carries loans at amortized cost and its CMBS are marked to market. Management has estimated that the fair value of the Company’s financial assets at March 31, 2014 was approximately $3.7 million greater than the carrying value of the Company’s investment portfolio as of the same date. This represents a premium of $0.10 per share over the Company's GAAP book value as of March 31, 2014. |
![]() 8 COMMERCIAL REAL ESTATE FINANCE, INC. (“ARI”) ARI – Subsequent Events First Mortgage Loan – Portfolio of Luxury Destination Club Residences Mezzanine Loan – Pre-development of London Condominium Commercial Mortgage Backed Securities (“CMBS”) Investment $210 million fixed rate, five-year first mortgage loan secured by a portfolio of 229 single-family and condominium homes located across North and Central America, the Caribbean and England; Simultaneously with closing, ARI syndicated $104 million of the first mortgage to other funds managed by affiliates of Apollo Global Management, LLC and retained a $106 million participation Underwritten unlevered IRR (1) ~ 8.2%; Underwritten levered IRR (1) ~ 15% $54.0 million (£32.1 million) fixed rate, nine-month mezzanine loan in connection with the purchase of an existing commercial building that is expected to be re-developed into a 173,000 salable square foot residential condominiums in Central London Appraised LTV – 78% Underwritten IRR (1) ~ 12% $24.7 million of equity deployed to acquire legacy CMBS originally rated AAA with an aggregate purchase price of $123.4 million and a weighted average life of 3.2 years Financed using $98.7 million of borrowings under a new $100 million term repurchase facility Underwritten IRR (1) ~ 17% (1) The underwritten IRR for the investments shown in this presentation reflect the returns underwritten by the Manager, calculated on a weighted average basis assuming no dispositions, early prepayments or defaults but assuming that extension options are exercised and that the cost of borrowings under the Wells Facility remains constant over the remaining terms and extension terms under this facility. With respect to certain loans, the underwritten IRR calculation assumes certain estimates with respect to the timing and magnitude of future fundings for the remaining commitments and associated loan repayments, and assumes no defaults. IRR is the annualized effective compounded return rate that accounts for the time-value of money and represents the rate of return on an investment over a holding period expressed as a percentage of the investment. It is the discount rate that makes the net present value of all cash outflows (the costs of investment) equal to the net present value of cash inflows (returns on investment). It is derived from the negative and positive cash flows resulting from or produced by each transaction (or for a transaction involving more than one investment, cash flows resulting from or produced by each of the investments), whether positive, such as investment returns, or negative, such as transaction expenses or other costs of investment, taking into account the dates on which such cash flows occurred or are expected to occur, and compounding interest accordingly. There can be no assurance that the actual IRRs will equal the underwritten IRRs shown above. See “Item 1A—Risk Factors—The Company may not achieve its underwritten internal rate of return on its investments which may lead to future returns that may be significantly lower than anticipated” included in the Company’s Annual Report on Form 10-K for the year ended December 31, 2013 for a discussion of some of the factors that could adversely impact the returns received by the Company from the investments shown in the table over time. Appraised Loan-to-Value (“LTV”) – 49% |
![]() 9 COMMERCIAL REAL ESTATE FINANCE, INC. (“ARI”) ARI – Portfolio Overview Asset Type ($000s) Amortized Cost Borrowings Equity at Cost (1) Remaining Weighted Average Life (years ) (2) Current Weighted Average Underwritten IRR (3)(4) Levered Weighted Average Underwritten IRR (3)(5) First Mortgage Loans $ 185,513 1.9 11.1% 18.8% Subordinate Loans 484,979 - 484,979 3.7 13.1% 13.1% CMBS 173,174 166,991 36,310 3.1 13.9% 13.9% Investments at March 31, 2014 3.2 Years 12.6% 14.1% As of March 31, 2014. (1) Includes $30.1 million of restricted cash related to the UBS Facility. (2) Remaining Weighted Average Life assumes all extension options are exercised. (3) Borrowings under the JPMorgan Facility bear interest at LIBOR plus 250 basis points, or 2.7% at March 31, 2014. The IRR calculation further assumes the JPMorgan Facility or any replacement facility will remain available over the life of these investments. (4) The underwritten IRR for the investments shown in this table reflect the returns underwritten by the Manager, calculated on a weighted average basis assuming no dispositions, early prepayments or defaults but assuming that extension options are exercised and that the cost of borrowings under the Wells Facility remains constant over the remaining terms and extension terms under this facility. With respect to certain loans, the underwritten IRR calculation assumes certain estimates with respect to the timing and magnitude of future fundings for the remaining commitments and associated loan repayments, and assumes no defaults. IRR is the annualized effective compounded return rate that accounts for the time-value of money and represents the rate of return on an investment over a holding period expressed as a percentage of the investment. It is the discount rate that makes the net present value of all cash outflows (the costs of investment) equal to the net present value of cash inflows (returns on investment). It is derived from the negative and positive cash flows resulting from or produced by each transaction (or for a transaction involving more than one investment, cash flows resulting from or produced by each of the investments), whether positive, such as investment returns, or negative, such as transaction expenses or other costs of investment, taking into account the dates on which such cash flows occurred or are expected to occur, and compounding interest accordingly. There can be no assurance that the actual IRRs will equal the underwritten IRRs shown in the table. See “Item 1A—Risk Factors—The Company may not achieve its underwritten internal rate of return on its investments which may lead to future returns that may be significantly lower than anticipated” included in the Company’s Annual Report on Form 10-K for the year ended December 31, 2013 for a discussion of some of the factors that could adversely impact the returns received by the Company from the investments shown in the table over time (5) The Company's ability to achieve its underwritten levered weighted average IRR with regard to its portfolio of first mortgage loans is additionally dependent upon the Company re-borrowing approximately $88,000 in total under the JPMorgan Facility or any replacement facility with similar terms. Without such re-borrowing, the levered weighted average underwritten IRRs will be as indicated in the current weighted average underwritten IRR column above. 706,802 $ 166,994 $ 3 $ 843,669 $ 185,516 $ |
![]() 10 COMMERCIAL REAL ESTATE FINANCE, INC. (“ARI”) ARI – Portfolio Overview Diversified Investment Portfolio with Amortized Cost Basis of $844 million Net Invested Equity at Amortized Cost Basis Gross Assets at Amortized Cost Basis |
![]() 11 COMMERCIAL REAL ESTATE FINANCE, INC. (“ARI”) ARI – Portfolio Diversification The portfolio is diversified by property type and geographic location Geographic Diversification by Net Equity Property Type by Net Equity (1) Other category includes the subordinate financing on a ski resort |
![]() 12 COMMERCIAL REAL ESTATE FINANCE, INC. (“ARI”) ARI – Loan Portfolio - Maturity and Type Fully Extended Loan Maturity Schedule ($000s) (1)(2) (1) Based upon Face Amount of Loans; Does not include CMBS. (2) Maturities reflect the fully funded amounts of the loans. Loan Position and Rate Type (1) 54% Floating Rate/46% Fixed Rate Senior Loan Fixed 13% Subordinate Loan Fixed 33% Subordinate Loan Floating 39% Senior Loan Floating 15% $91.0 $200.0 $- $8.8 $- $0 $40 $80 $120 $160 $200 $240 2014 2015 2016 2017 2018 2019 2020 2021 2022 2023 $32.0 $30.3 $111.0 $101.2 $185.7 |
![]() 13 COMMERCIAL REAL ESTATE FINANCE, INC. (“ARI”) ARI – Loan Portfolio – Loan Level LTV (Through Last Invested Dollar) First Mortgage Loans Subordinate Financings Description ($ in thousands) Location Balance at March 31, 2014 Starting LTV Ending LTV First Mortgage - Condo Conversion (1) New York 45,000 $ 0% 29% First Mortgage - Condo Conversion (2) New York 33,333 $ 0% 29% First Mortgage - Hotel New York 31,242 $ 0% 41% First Mortgage - Office New York 27,095 $ 0% 35% First Mortgage - Condo Development Maryland 25,000 $ 0% 65% First Mortgage - Hotel Maryland 24,853 $ 0% 62% Total 186,523 $ Description ($ in thousands) Location Balance at March 31, 2014 Starting LTV Ending LTV Subordinate - Condo Development New York 69,035 $ 32% 46% Subordinate - Office Portfolio Florida 50,000 $ 73% 82% Subordinate - Hotel Portfolio Various 48,271 $ 52% 60% Subordinate - Healthcare Portfolio Various 47,000 $ 58% 64% Subordinate - Multifamily Conversion New York 44,000 $ 51% 78% Subordinate - Ski Resort California 40,000 $ 34% 54% Subordinate - Condo Conversion (1) New York 35,000 $ 29% 52% Subordinate - Industrial Portfolio Various 32,000 $ 66% 74% Subordinate - Hotel Portfolio Minnesota 24,696 $ 57% 68% Subordinate - Mixed Use Pennsylvania 22,500 $ 54% 69% Subordinate - Multifamily Conversion New York 18,000 $ 48% 60% Subordinate - Multifamily/Condo/Hotel (3) Various 17,500 $ 80% 90% Subordinate - Office New York 14,000 $ 61% 70% Subordinate - Office Missouri 9,814 $ 60% 70% Subordinate - Office Michigan 8,849 $ 42% 54% Subordinate - Mixed Use North Carolina 6,525 $ 63% 76% Subordinate - Condo Conversion (2) New York 297 $ 29% 55% Total 487,487 $ (1) Both loans are for the same property. (2) Both loans are for the same property. The mezzanine loan ending LTV is based upon the committed amount of $29.4 million. (3) Ending LTV is based upon the committed amount of $19.5 million. |
![]() 14 COMMERCIAL REAL ESTATE FINANCE, INC. (“ARI”) ARI – CMBS Portfolio Face Amortized Cost Remaining Weighted Average Life with Extensions (years) Estimated Fair Value Debt Net Equity at Cost (1) CMBS – Total $171,778 $173,174 3.1 Years $176,611 $166,991 $36,310 CMBS CUSIP Description 07388YAB8 BSCMS 07-PW16 A2 61754KAC9 MSC 07-IQ14 A2 92978YAB6 WBCMT 07-C32 A2 61751NAD4 MSC 2007-HQ11 A31 92978TAB7 WBCMT 2007-C31 A2 CMBS CUSIP Description 59025KAG7 MLMT 2007-C1 AM 22546BAH3 CSMC 2007-C5 AM 36159XAH3 GECMC 2007-C1 AM 46627QBC1 JMPCC 2006-CB15 AM 46631BAJ4 JPMCC 2007-LD11 AM (1) Includes $30.1 million of restricted cash related to the UBS Facility. |
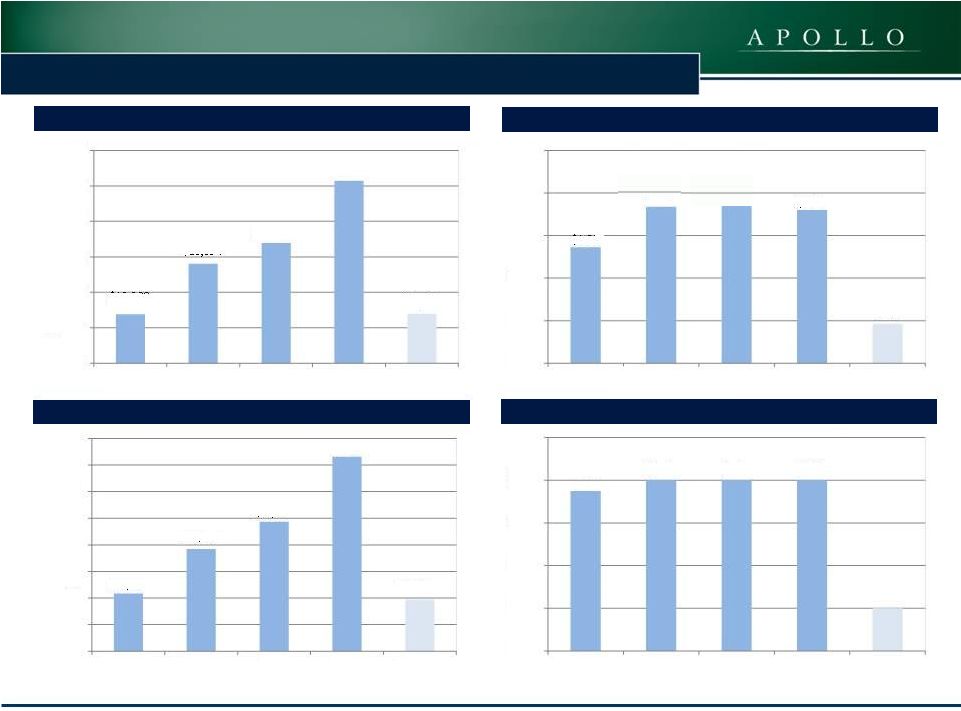
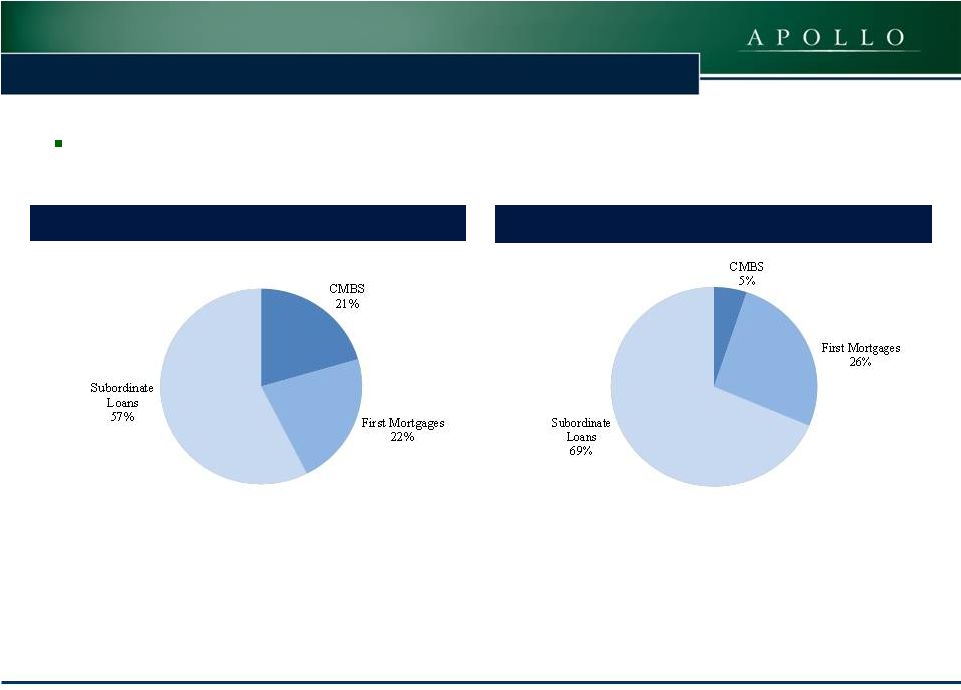
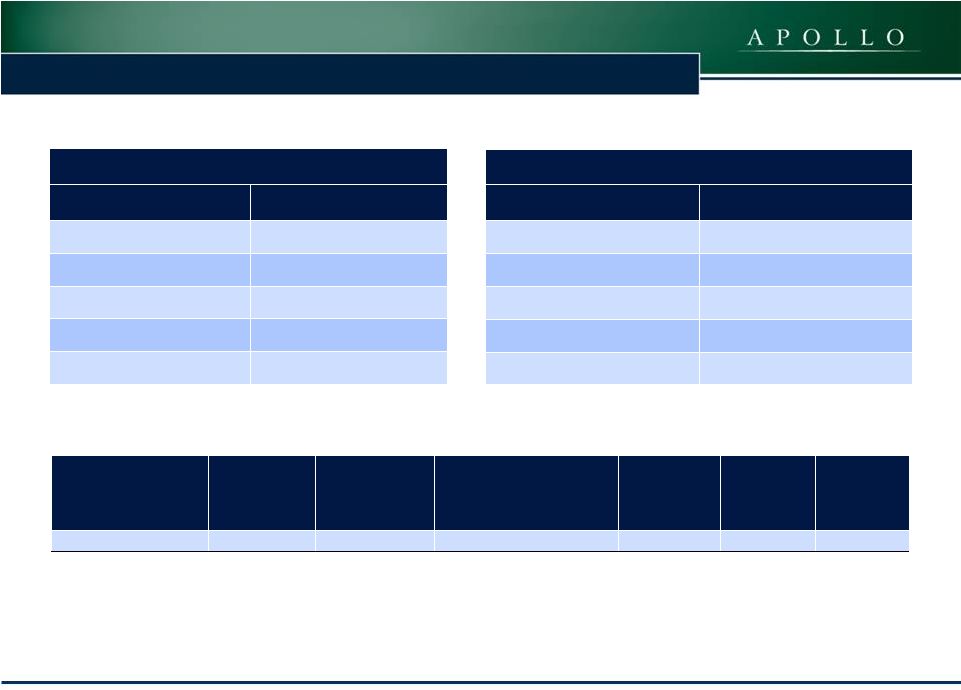
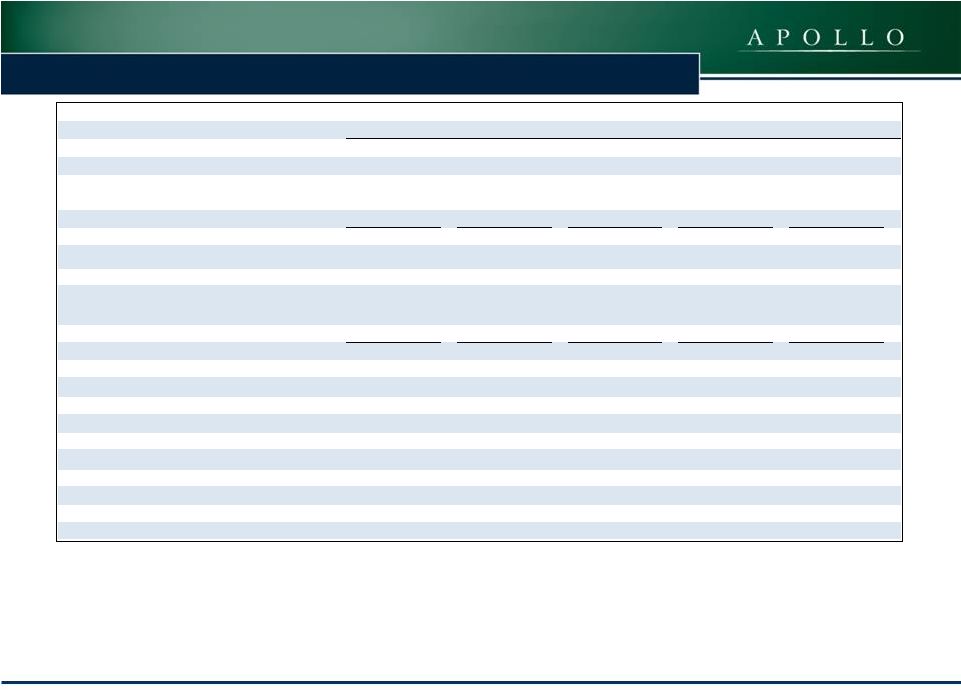
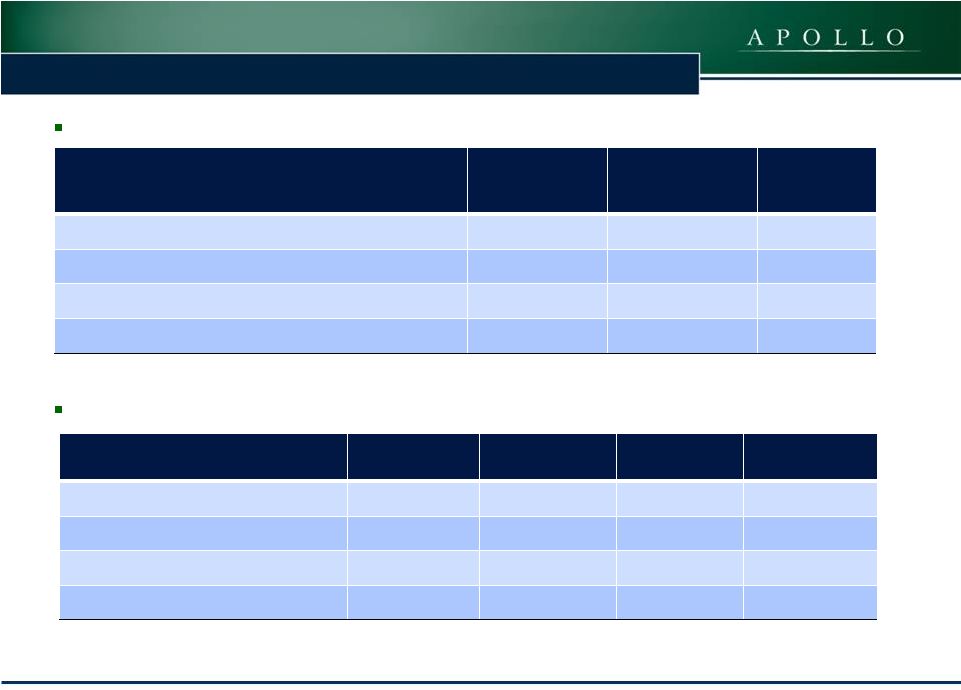
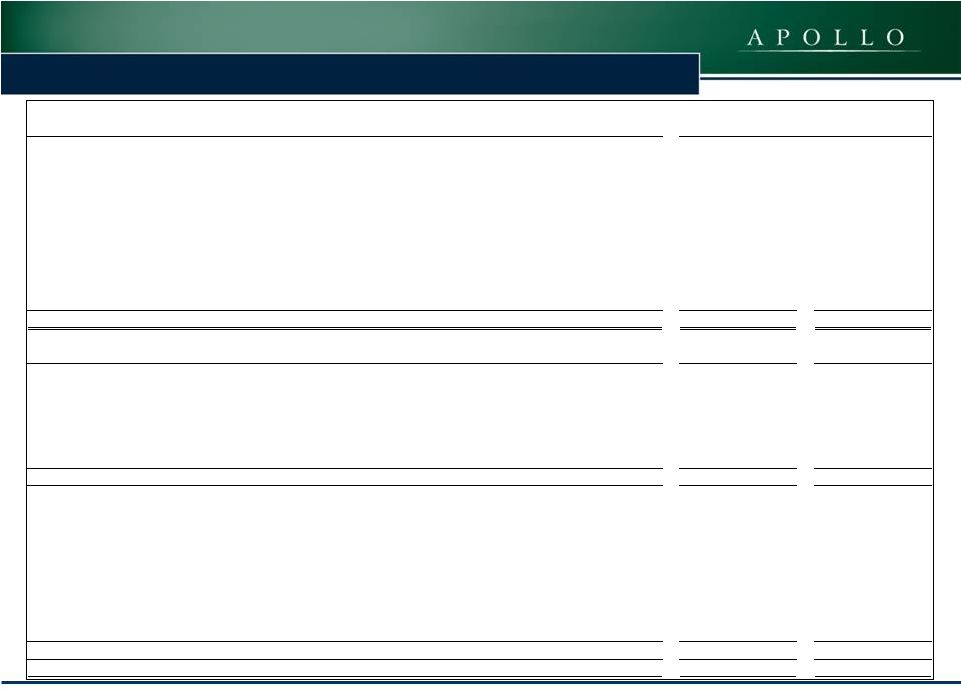
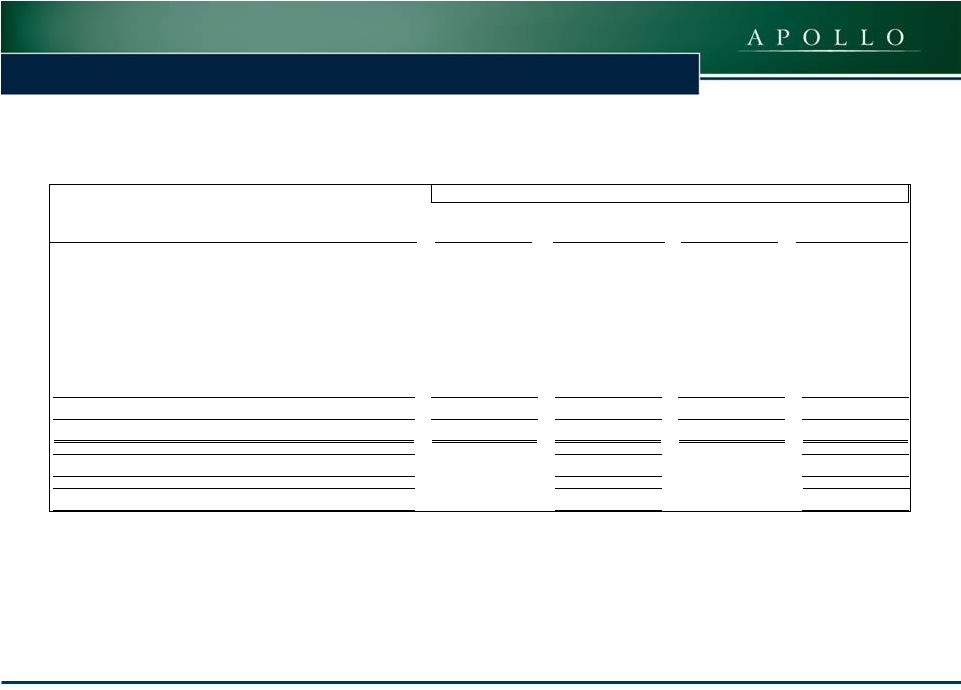
![]() 15 COMMERCIAL REAL ESTATE FINANCE, INC. (“ARI”) Portfolio Metrics – Quarterly Migration Summary Portfolio Metrics ($ in thousands) Q1 2014 Q4 2013 Q3 2013 Q2 2013 Q1 2013 (Investment balances represent amortized cost) First Mortgage Loans 185,516 $ 161,099 $ 160,893 $ 143,492 $ 142,833 $ Subordinate Loans 484,979 497,484 394,554 354,865 286,569 CMBS 173,174 190,178 218,019 165,553 188,824 CMBS - Hilton - - 69,587 69,521 69,912 Total Investments 843,669 $ 848,761 $ 843,053 $ 733,431 $ 688,138 $ (Investment balances represent net equity, at cost) First Mortgage Loans 185,513 $ 140,716 $ 160,890 $ 143,489 $ 142,830 $ Subordinate Loans 484,979 497,484 394,554 354,865 286,569 CMBS 36,310 (2) 38,655 (2) 36,760 (2) 21,353 24,620 CMBS - Hilton - - 23,049 22,412 22,175 Net Equity in Investments at Cost 706,802 $ 676,855 $ 615,253 $ 542,119 $ 476,194 $ Levered Weighted Average Underwritten IRR (1) 14.1% (3) 14.1% (3) 13.9% (3) 14.2% (3) 14.2% (3) Weighted Average Duration 3.2 Years 3.3 Years 3.0 Years 3.0 Years 3.0 Years Loan Portfolio Weighted Average Ending LTV (4) 58.0% 58.0% 55.0% 56.0% 53.6% Borrowings under repurchase agreements 166,994 $ 202,033 $ 227,167 $ 191,312 $ 211,944 $ Convertible senior notes 139,163 $ - $ - $ - $ - $ (1) The underwritten IRR for the investments shown in this presentation reflect the returns underwritten by the Manager, calculated on a weighted average basis assuming no dispositions, early prepayments or defaults but assuming that extension options are exercised and that the cost of borrowings under the Wells Facility remains constant over the remaining terms and extension terms under this facility. With respect to certain loans, the underwritten IRR calculation assumes certain estimates with respect to the timing and magnitude of future fundings for the remaining commitments and associated loan repayments, and assumes no defaults. IRR is the annualized effective compounded return rate that accounts for the time-value of money and represents the rate of return on an investment over a holding period expressed as a percentage of the investment. It is the discount rate that makes the net present value of all cash outflows (the costs of investment) equal to the net present value of cash inflows (returns on investment). It is derived from the negative and positive cash flows resulting from or produced by each transaction (or for a transaction involving more than one investment, cash flows resulting from or produced by each of the investments), whether positive, such as investment returns, or negative, such as transaction expenses or other costs of investment, taking into account the dates on which such cash flows occurred or are expected to occur, and compounding interest accordingly. There can be no assurance that the actual IRRs will equal the underwritten IRRs shown in the table. See “Item 1A—Risk Factors—The Company may not achieve its underwritten internal rate of return on its investments which may lead to future returns that may be significantly lower than anticipated” included in the Company’s Annual Report on Form 10-K for the year ended December 31, 2013 for a discussion of some of the factors that could adversely impact the returns received by the Company from the investments shown in the table over time (2) Includes $15.8 million of restricted cash related to the UBS Facility and $16.4 million of future borrowings related to unsettled trades at September 30, 2013 and $30.1 million of restricted cash related to the UBS Facility at December 31, 2013 and March 31, 2014, respectively. (3) Represents an underwritten levered weighted average IRR. The Company's ability to achieve the underwritten levered weighted average IRR additionally depends upon the Company re-borrowing approximately $88,000 under the JPMorgan Facility or any replacement facility with similar terms with regard to its portfolio of first mortgage loans. Without such re-borrowing, the levered weighted average underwritten IRR will be lower than the amount shown above, as indicated in the current weighted average underwritten IRR column on page 9. (4) Does not include CMBS. |
![]() 16 COMMERCIAL REAL ESTATE FINANCE, INC. (“ARI”) ARI had total borrowings outstanding of $167 million at March 31, 2014: ARI’s borrowings had the following remaining maturities at March 31, 2014: Financing Overview Facility ($000s) Debt Balance Weighted Average Remaining Maturity (1) Cost of Funds Wells Facility $ 33,092 0.9 years 1.0% UBS Facility 133,899 4.5 years 2.8% JPMorgan Facility 3 0.8 years 2.7% Total Borrowings at March 31, 2014 $ 166,994 3.8 years 2.4% Facility ($000s) Less than 1 year 1 to 3 years 3 to 5 years Total Wells Facility $ 33,092 $ - $ - $ 33,092 UBS Facility (1) - 5,004 128,895 $ 133,899 JPMorgan Facility 3 - - $ 3 Total Borrowings at March 31, 2014 $ 33,095 $ 5,004 $ 128,895 $ 166,994 (1) Assumes extension options on the UBS Facility are exercised. |
![]() 17 COMMERCIAL REAL ESTATE FINANCE, INC. (“ARI”) Financials |
![]() ![]() 18 COMMERCIAL REAL ESTATE FINANCE, INC. (“ARI”) Consolidated Balance Sheets (Unaudited) (in thousands—except share and per share data) March 31, 2014 December 31, 2013 Assets: Cash 126,473 $ 20,096 $ Restricted cash 30,127 30,127 Securities available-for-sale, at estimated fair value 25,477 33,362 Securities, at estimated fair value 151,134 158,086 Commercial mortgage loans, held for investment 185,516 161,099 Subordinate loans, held for investment 484,979 497,484 Interest receivable 6,220 6,022 Deferred financing costs, net 5,135 628 Other assets 550 600 Total Assets 1,015,611 $ 907,504 $ Liabilities and Stockholders' Equity Liabilities: Borrowings under repurchase agreements 166,994 $ 202,033 $ Convertible senior notes, net 139,163 - Accounts payable and accrued expenses 2,289 2,660 Payable to related party 2,565 2,628 Dividends payable 16,688 17,227 Total Liabilities 327,699 224,548 Stockholders' Equity: Preferred stock, $0.01 par value, 50,000,000 shares authorized and 3,450,000 shares issued and outstanding in 2013 and 2012 35 35 Common stock, $0.01 par value, 450,000,000 shares authorized 37,125,475 and 36,888,467 shares issued and outstanding in 2014 and 2013, respectively 371 369 Additional paid-in-capital 701,797 697,610 Retained earnings (accumulated deficit) (13,404) (14,188) Accumulated other comprehensive loss (887) (870) Total Stockholders' Equity 687,912 682,956 Total Liabilities and Stockholders' Equity 1,015,611 $ 907,504 $ |
![]() 19 COMMERCIAL REAL ESTATE FINANCE, INC. (“ARI”) Consolidated Statement of Operations (Unaudited) March 31, 2014 March 31, 2013 Net interest income: Interest income from securities 2,419 $ 3,087 $ Interest income from commercial mortgage loans 4,011 3,592 Interest income from subordinate loans 14,730 11,454 Interest income from repurchase agreements - 2 Interest expense (1,757) (1,068) Net interest income 19,403 17,067 Operating expenses: General and administrative expenses (includes $426 and $883 of equity-based compensation in 2014 and in 2013, respectively) (1,442) (1,895) Management fees to related party (2,565) (2,160) Total operating expenses (4,007) (4,055) Unrealized gain (loss) on securities 2,184 (1,080) Loss on derivative instruments (includes $72 of unrealized gains in 2013) - - Net income 17,580 $ 11,932 $ Preferred dividends (1,860) (1,860) Net income available to common stockholders 15,720 $ 10,072 $ Basic and diluted net income per share of common stock 0.42 $ 0.33 $ Basic weighted average shares of common stock outstanding 37,122,842 30,105,939 Diluted weighted average shares of common stock outstanding 37,341,050 30,480,689 Dividend declared per share of common stock 0.40 $ 0.40 $ Three months ended |
![]() Reconciliation of Operating Earnings to Net Income 20 COMMERCIAL REAL ESTATE FINANCE, INC. (“ARI”) March 31, 2014 Earnings Per Share (Diluted) March 31, 2013 Earnings Per Share (Diluted) Operating Earnings: Net income available to common stockholders $15,720 $0.42 $10,072 $0.33 Adjustments: Unrealized (gain)/loss on securities (2,184) (0.06) 1,080 0.04 Unrealized gain on derivative instruments - - (72) - Equity-based compensation expense 426 0.01 883 0.02 Amortization of convertible notes related to equity reclassification 29 - - - Total adjustments: (1,729) (0.05) 1,891 0.06 Operating Earnings 13,991 $0.37 $11,963 $0.39 Basic weighted average shares of common stock outstanding 37,122,842 30,105,939 Diluted weighted average shares of common stock outstanding 37,341,050 30,480,689 Three Months Ended |
![]() Financial Metrics – Quarterly Migration Summary COMMERCIAL REAL ESTATE FINANCE, INC. (“ARI”) 21 (1) Operating Earnings is a non-GAAP financial measure that is used by the Company to approximate cash available for distribution and is defined by the Company as net income available to common stockholders, computed in accordance with GAAP, adjusted for (i) equity-based compensation expense (a portion of which may become cash-based upon final vesting and settlement of awards should the holder elect net share settlement to satisfy income tax withholding) (ii) any unrealized gains or losses or other non-cash items included in net income and (iii) the non-cash amortization expense related to the reclassification of a portion of the senior convertible notes to stockholders’ equity in accordance with GAAP. Please see slide 20 for a reconciliation of Operating Earnings and Operating Earnings per Share to GAAP net income and GAAP net income per share. (2) The Company carries loans at amortized cost and its CMBS securities are marked to market. Management estimates the fair value of the Company’s financial assets. (3) Return on common equity is calculated as annualized Operating Earnings for the period as a percentage of average stockholders’ equity for the period. Financial Metrics ($ in thousands, except per share data) Q1 2014 Q4 2013 Q3 2013 Q2 2013 Q1 2013 Net Interest Income 19,403 $ 20,020 $ 18,786 $ 17,233 $ 17,067 $ Management Fee 2,565 2,627 2,625 2,600 2,160 General and Administrative Costs 1,016 1,046 1,009 1,009 1,012 Non-Cash Stock Based Compensation 426 1,392 784 428 883 Net Income Available to Common Stockholders 15,720 $ 14,004 $ 11,041 $ 9,929 $ 10,072 $ GAAP Diluted EPS 0.42 $ 0.37 $ 0.29 $ 0.27 $ 0.33 $ Operating Earnings (1) 13,991 $ 14,488 $ 13,272 $ 11,721 $ 11,963 $ Operating EPS (1) 0.37 $ 0.39 $ 0.35 $ 0.31 $ 0.39 $ Distributions Declared to Common Stockholders 0.40 $ 0.40 $ 0.40 $ 0.40 $ 0.40 $ GAAP Book Value per Common Share 16.21 $ 16.18 $ 16.18 $ 16.26 $ 16.41 $ Fair Value per Common Share (2) 16.31 $ 16.42 $ 16.44 $ 16.55 $ 16.71 $ Total Stockholders' Equity 687,912 $ 682,956 $ 682,887 $ 685,994 $ 691,185 $ Diluted weighted average shares of common stock outstanding 37,341,050 37,390,369 37,379,469 37,373,885 30,105,939 9.4% 9.7% 8.9% 7.8% 9.6% Return on Common Equity Based on Operating Earnings (3) |