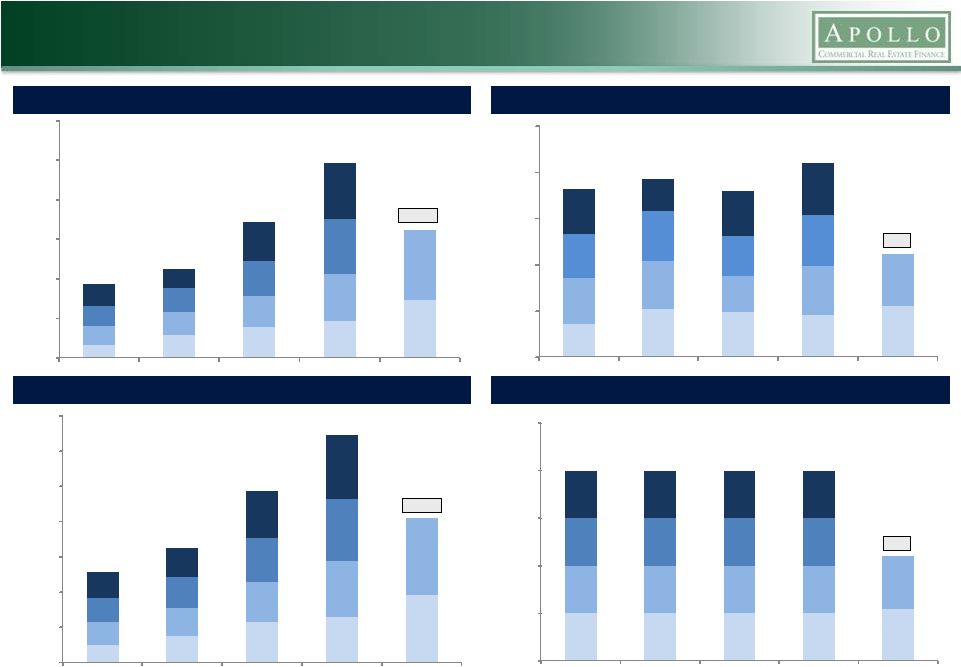
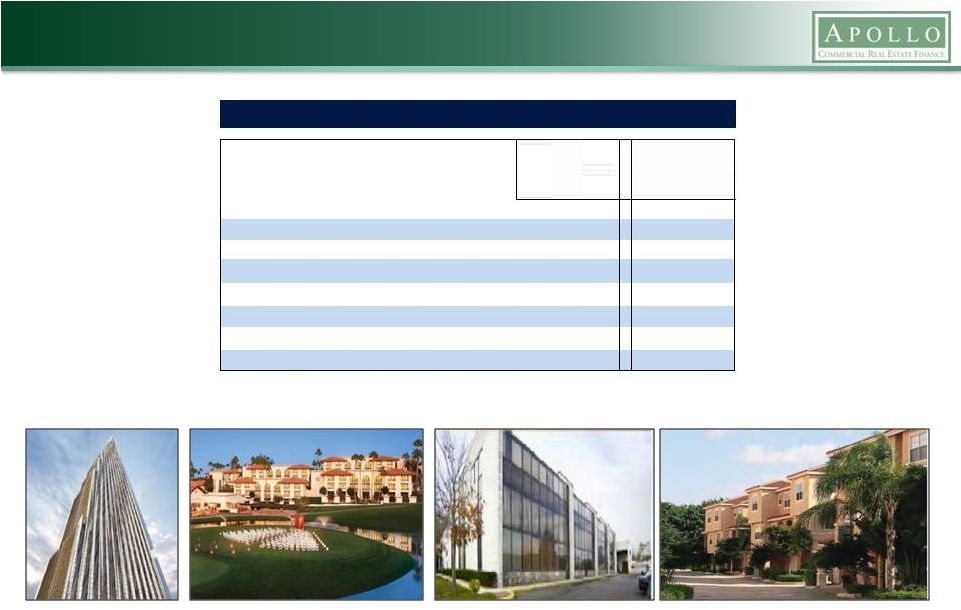
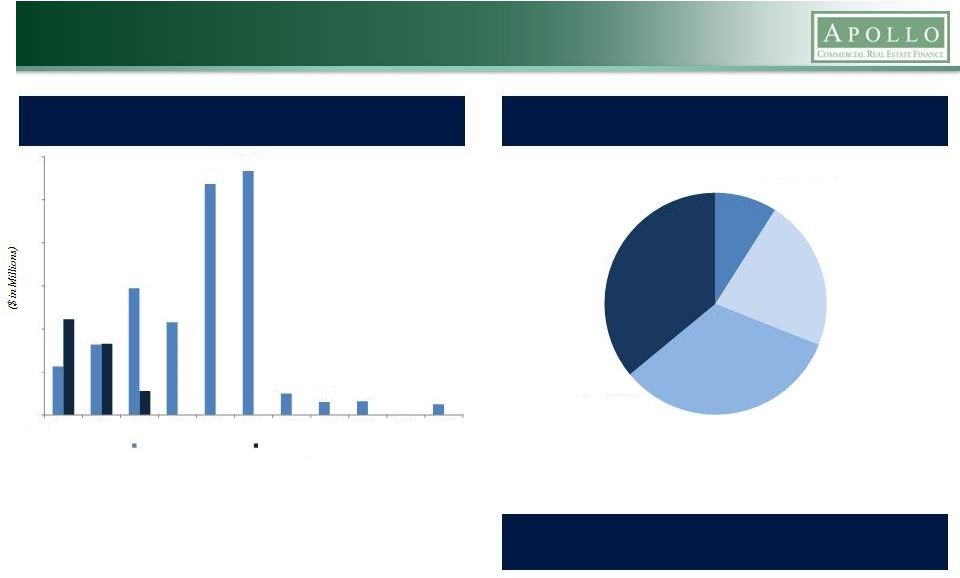
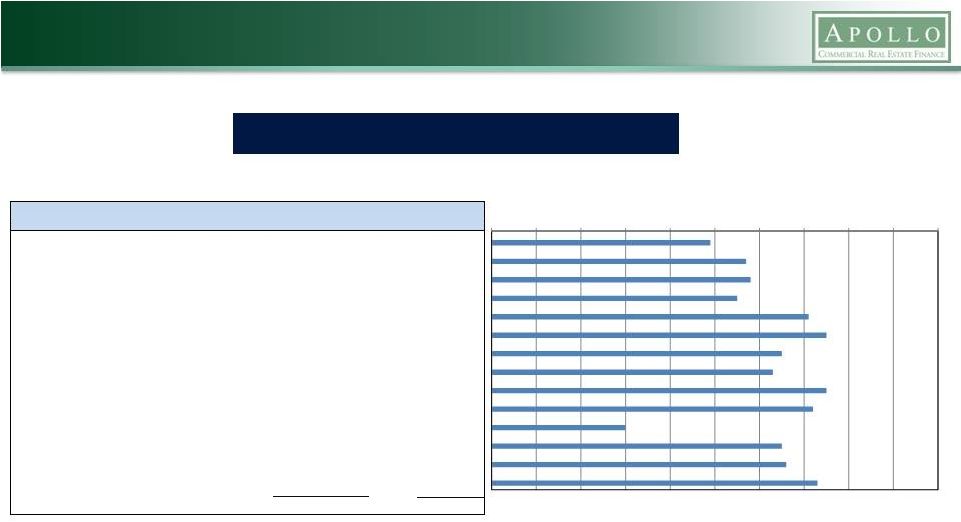
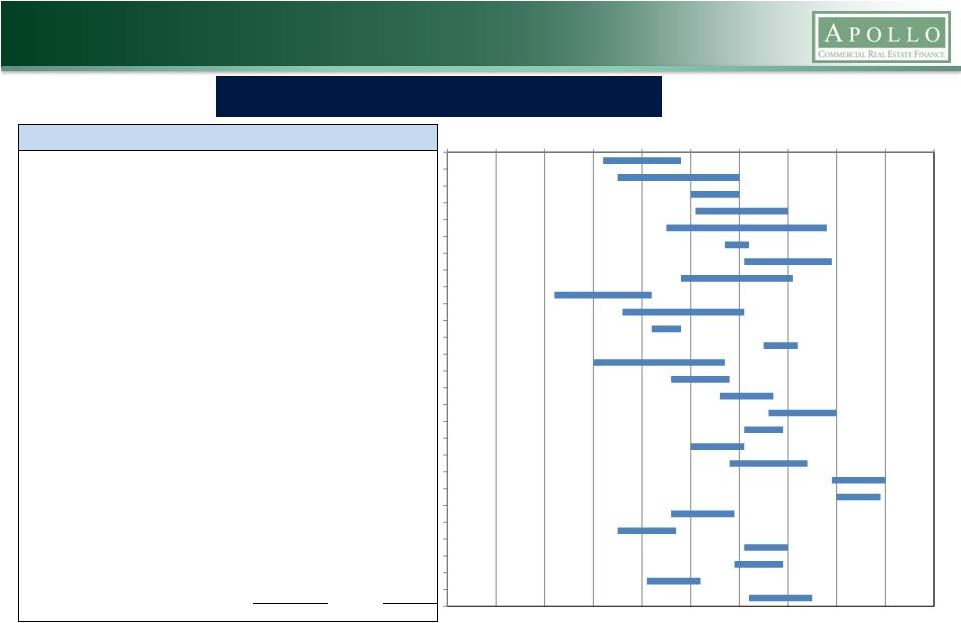
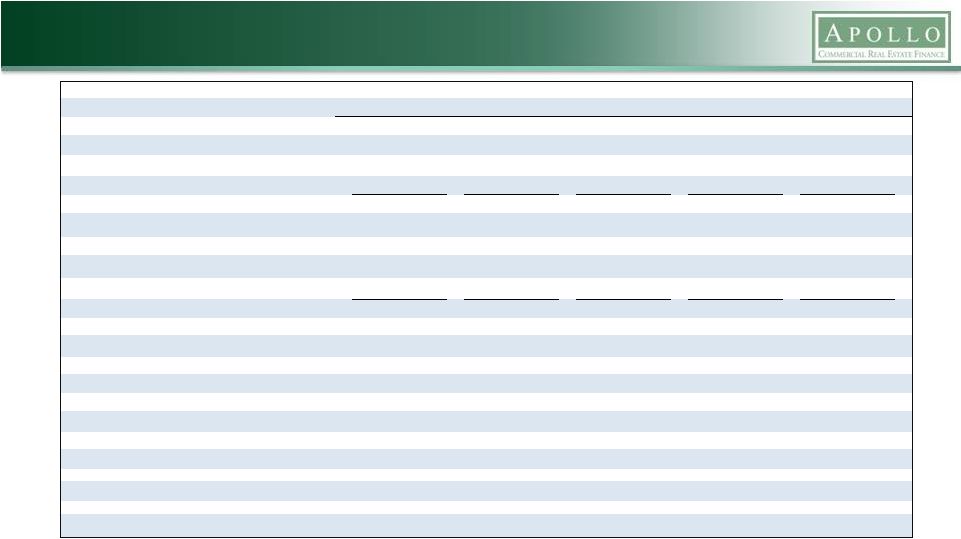
Portfolio Metrics – Quarterly Migration Summary 13 (1) Subordinate loans include CMBS, held-to-maturity and are net of participations sold of $120,991. ARI presents the participations sold as both assets and non-recourse liabilities because the participation does not qualify as a sale according to GAAP. (2) The underwritten IRR for the investments shown in this presentation reflect the returns underwritten by the Manager, calculated on a weighted average basis assuming no dispositions, early prepayments or defaults but assuming that extension options are exercised and that the cost of borrowings remains constant over the remaining term. With respect to certain loans, the underwritten IRR calculation assumes certain estimates with respect to the timing and magnitude of future fundings for the remaining commitments and associated loan repayments, and assumes no defaults. IRR is the annualized effective compounded return rate that accounts for the time-value of money and represents the rate of return on an investment over a holding period expressed as a percentage of the investment. It is the discount rate that makes the net present value of all cash outflows (the costs of investment) equal to the net present value of cash inflows (returns on investment). It is derived from the negative and positive cash flows resulting from or produced by each transaction (or for a transaction involving more than one investment, cash flows resulting from or produced by each of the investments), whether positive, such as investment returns, or negative, such as transaction expenses or other costs of investment, taking into account the dates on which such cash flows occurred or are expected to occur, and compounding interest accordingly. There can be no assurance that the actual IRRs will equal the underwritten IRRs shown in the table. See “Item 1A—Risk Factors—The Company may not achieve its underwritten internal rate of return on its investments which may lead to future returns that may be significantly lower than anticipated” included in the Company’s Annual Report on Form 10-K for the year ended December 31, 2014 for a discussion of some of the factors that could adversely impact the returns received by the Company from the investments shown in the table over time (3) Does not include CMBS. (4) Includes $30.1 million of restricted cash related to the UBS Facility. (5) Includes $30.1 million of restricted cash related to the UBS Facility and $26.5 million related to investments purchased not yet settled. (6) Represents an underwritten levered weighted average IRR. The Company's ability to achieve the underwritten levered weighted average IRR additionally depends upon the Company re-borrowing under the JPMorgan Facility or any replacement facility with similar terms with regard to its portfolio of first mortgage loans. Without such re-borrowing, the levered weighted average underwritten IRR will be lower than the amount shown above, as indicated in the current weighted average underwritten IRR column on slide 7. (7) Net of participations sold. Portfolio Metrics ($ in thousands) Q2 2015 Q1 2015 Q4 2014 Q3 2014 Q2 2014 (Investment balances represent amortized cost) First Mortgage Loans 704,040 $ 563,390 $ 458,520 $ 369,924 $ 343,810 $ Subordinate Loans (1) 894,926 736,838 625,881 650,084 659,045 CMBS 511,412 510,740 534,222 511,445 339,724 Total Investments 2,110,378 $ 1,810,968 $ 1,618,623 $ 1,531,453 $ 1,342,579 $ (Investment balances represent net equity, at cost) First Mortgage Loans 275,205 $ 421,862 $ 290,396 $ 247,202 $ 197,112 $ Subordinate Loans (1) 847,968 707,201 625,881 650,084 659,045 CMBS 107,635 (4) 106,963 (4) 110,279 (4) 99,988 (5) 70,325 (4) Net Equity in Investments at Cost 1,230,808 $ 1,236,026 $ 1,026,556 $ 997,274 $ 926,482 $ Levered Weighted Average Underwritten IRR (2) 14.6% (6) 14.2% (6) 13.4% (6) 13.7% (6) 13.9% (6) Weighted Average Duration 3.1 Years 3.0 Years 3.2 Years 3.0 Years 3.2 Years Loan Portfolio Weighted Average Ending LTV (3) 62.0% 62.0% 62.0% 58.0% 58.0% Borrowings Under Repurchase Agreements 878,352 $ 575,433 $ 622,194 $ 537,766 $ 446,224 $ Convertible Senior Notes 247,305 $ 246,881 $ 246,464 $ 246,054 $ 139,362 $ Debt-to-Common Equity 1.2x (7) 0.9x (7) 1.2x (7) 1.1x (7) 0.8x (7) |