Exhibit 99.2
APOLLO COMMERCIAL REAL ESTATE FINANCE, INC. Supplemental Financial Information Q4 2018 February 13, 2019 Information is as of December 31, 2018, except as otherwise noted. It should not be assumed that investments made in the future will be profitable or will equal the performance of the investments in this document.
Forward Looking Statements and Other Disclosures This presentation may contain forward-looking statements that are within the meaning of Section 27A of the Securities Act of 1933, as amended, and Section 21E of the Securities Exchange Act of 1934, as amended, and such statements are intended to be covered by the safe harbor provided by the same. Forward-looking statements are subject to substantial risks and uncertainties, many of which are difficult to predict and are generally beyond management’s control. These forward-looking statements may include information about possible or assumed future results of Apollo Commercial Real Estate Finance, Inc.’s (“ARI” or the “Company”) business, financial condition, liquidity, results of operations, plans and objectives. When used in this presentation, the words “believe,” “expect,” “anticipate,” “estimate,” “plan,” “continue,” “intend,” “should,” “may” or similar expressions, are intended to identify forward-looking statements. Statements regarding the following subjects, among others, may be forward-looking: ARI’s business and investment strategy; ARI’s operating results; ARI’s ability to obtain and maintain financing arrangements; and the return on equity, the yield on investments and risks associated with investing in real estate assets including changes in business conditions and the general economy. The forward-looking statements are based on management’s beliefs, assumptions and expectations of future performance, taking into account all information currently available to ARI. Forward-looking statements are not predictions of future events. These beliefs, assumptions and expectations can change as a result of many possible events or factors, not all of which are known to ARI. Some of these factors are described under “Risk Factors,” and “Management’s Discussion and Analysis of Financial Condition and Results of Operations” included in ARI’s Annual Report on Form10-K for the fiscal year ended December 31, 2018 and other filings with the Securities and Exchange Commission (“SEC”), which are accessible on the SEC’s website at www.sec.gov. If a change occurs, ARI’s business, financial condition, liquidity and results of operations may vary materially from those expressed in ARI’s forward-looking statements. Any forward-looking statement speaks only as of the date on which it is made. New risks and uncertainties arise over time, and it is not possible for management to predict those events or how they may affect ARI. Except as required by law, ARI is not obligated to, and does not intend to, update or revise any forward-looking statements, whether as a result of new information, future events or otherwise. This presentation contains information regarding ARI’s financial results that is calculated and presented on the basis of methodologies other than in accordance with accounting principles generally accepted in the United States (“GAAP”), including Operating Earnings and Operating Earnings per share. Please refer to slide 19 for a definition of “Operating Earnings” and the reconciliation of the applicable GAAP financial measures tonon-GAAP financial measures set forth on slide 18. This presentation may contain statistics and other data that in some cases has been obtained from or compiled from information made available by third-party service providers. ARI makes no representation or warranty, expressed or implied, with respect to the accuracy, reasonableness or completeness of such information. Past performance is not indicative nor a guarantee of future returns. Index performance and yield data are shown for illustrative purposes only and have limitations when used for comparison or for other purposes due to, among other matters, volatility, credit or other factors (such as number and types of securities). Indices are unmanaged, do not charge any fees or expenses, assume reinvestment of income and do not employ special investment techniques such as leveraging or short selling. No such index is indicative of the future results of any investment by ARI. 1
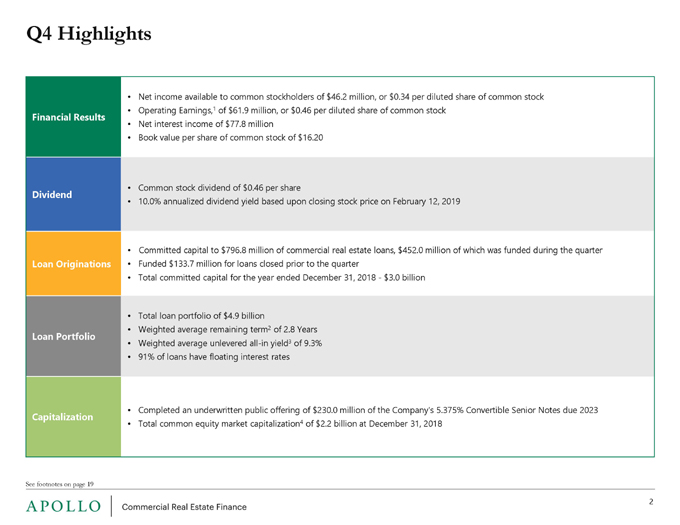
Q4 Highlights Net income available to common stockholders of $46.2 million, or $0.34 per diluted share of common stock Financial Results Operating Earnings, 1 of $61.9 million, or $0.46 per diluted share of common stock Net interest income of $77.8 million Book value per share of common stock of $16.20 Common stock dividend of $0.46 per share Dividend 10.0% annualized dividend yield based upon closing stock price on February 12, 2019 Committed capital to $796.8 million of commercial real estate loans, $452.0 million of which was funded during the quarter Loan Originations Funded $133.7 million for loans closed prior to the quarter Total committed capital for the year ended December 31, 2018—$3.0 billion Total loan portfolio of $4.9 billion Loan Portfolio Weighted average remaining term 2 of 2.8 Years Weighted average unleveredall-in yield 3 of 9.3% 91% of loans have floating interest rates Completed an underwritten public offering of $230.0 million of the Company’s 5.375% Convertible Senior Notes due 2023 Capitalization Total common equity market capitalization 4 of $2.2 billion at December 31, 2018 See footnotes on page 19 2
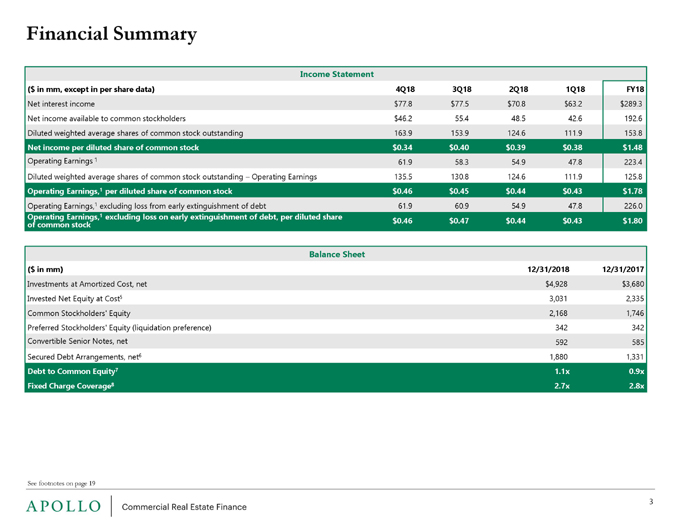
Financial Summary Income Statement ($ in mm, except in per share data) 4Q 18 3Q 18 2Q 18 1Q 18 FY18 Net interest income $77.8 $77.5 $70.8 $63.2 $289.3 Net income available to common stockholders $46.2 55.4 48.5 42.6 192.6 Diluted weighted average shares of common stock outstanding 163.9 153.9 124.6 111.9 153.8 Net income per diluted share of common stock $0.34 $0.40 $0.39 $0.38 $1.48 Operating Earnings 1 61.9 58.3 54.9 47.8 223.4 Diluted weighted average shares of common stock outstanding – Operating Earnings 135.5 130.8 124.6 111.9 125.8 Operating Earnings,1 per diluted share of common stock $0.46 $0.45 $0.44 $0.43 $1.78 Operating Earnings,1 excluding loss from early extinguishment of debt 61.9 60.9 54.9 47.8 226.0 Operating Earnings,1 excluding loss on early extinguishment of debt, per diluted share $0.46 $0.47 $0.44 $0.43 $1.80 of common stock Balance Sheet ($ in mm) 12/31/2018 12/31/2017 Investments at Amortized Cost, net $4,928 $3,680 Invested Net Equity at Cost 5 3,031 2,335 Common Stockholders’ Equity 2,168 1,746 Preferred Stockholders’ Equity (liquidation preference) 342 342 Convertible Senior Notes, net 592 585 Secured Debt Arrangements, net 6 1,880 1,331 Debt to Common Equity 7 1.1x 0.9x Fixed Charge Coverage 8 2.7x 2.8x See footnotes on page 19 3
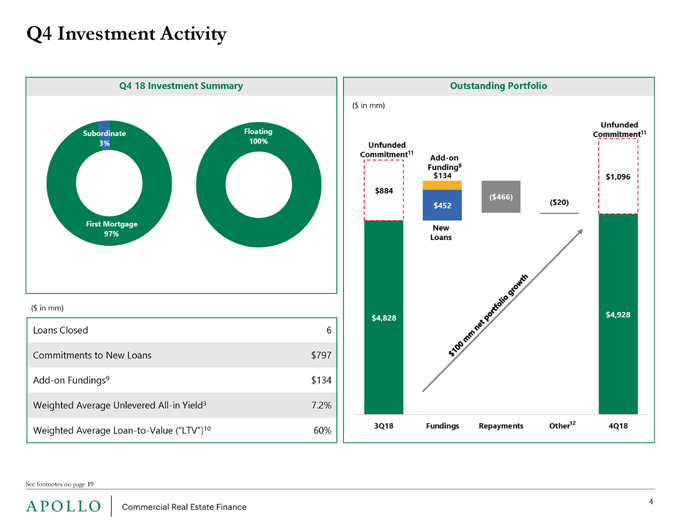
Q4 Investment Activity Q4 18 Investment Summary Outstanding Portfolio ($ in mm) ($ in mm) Loans Closed 6 Commitments to New Loans $797Add-on Fundings9 $134 Weighted Average UnleveredAll-in Yield3 7.2% 12 Weighted AverageLoan-to-Value (“LTV”)10 60% See footnotes on page 19 4
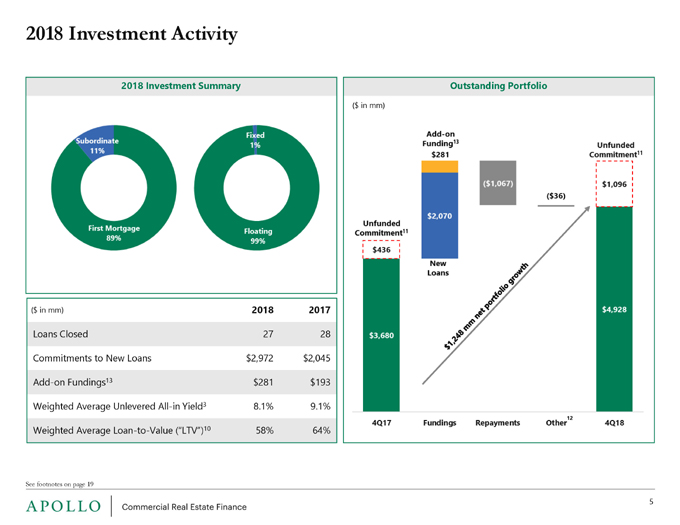
2018 Investment Activity 2018 Investment Summary Outstanding Portfolio ($ in mm) ($ in mm) 2018 2017 Loans Closed 27 28 Commitments to New Loans $2,972 $2,045Add-on Fundings 13 $281 $193 Weighted Average UnleveredAll-in Yield3 8.1% 9.1% 12 Weighted AverageLoan-to-Value (“LTV”)10 58% 64% See footnotes on page 19 5
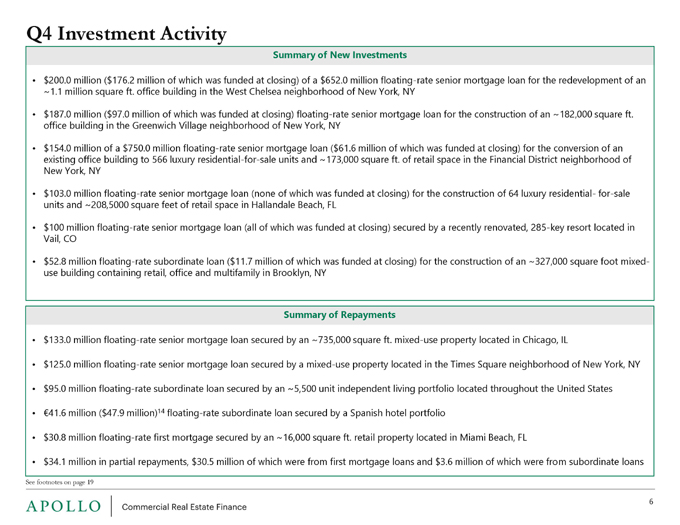
Q4 Investment Activity Summary of New Investments $200.0 million ($176.2 million of which was funded at closing) of a $652.0 million floating-rate senior mortgage loan for the redevelopment of an ~1.1 million square ft. office building in the West Chelsea neighborhood of New York, NY $187.0 million ($97.0 million of which was funded at closing) floating-rate senior mortgage loan for the construction of an ~182,000 square ft. office building in the Greenwich Village neighborhood of New York, NY $154.0 million of a $750.0 million floating-rate senior mortgage loan ($61.6 million of which was funded at closing) for the conversion of an existing office building to 566 luxuryresidential-for-sale units and ~173,000 square ft. of retail space in the Financial District neighborhood of New York, NY $103.0 million floating-rate senior mortgage loan (none of which was funded at closing) for the construction of 64 luxury residential-for-sale units and ~208,5000 square feet of retail space in Hallandale Beach, FL $100 million floating-rate senior mortgage loan (all of which was funded at closing) secured by a recently renovated,285-key resort located in Vail, CO $52.8 million floating-rate subordinate loan ($11.7 million of which was funded at closing) for the construction of an ~327,000 square footmixed-use building containing retail, office and multifamily in Brooklyn, NY Summary of Repayments $133.0 million floating-rate senior mortgage loan secured by an ~735,000 square ft.mixed-use property located in Chicago, IL $125.0 million floating-rate senior mortgage loan secured by amixed-use property located in the Times Square neighborhood of New York, NY $95.0 million floating-rate subordinate loan secured by an ~5,500 unit independent living portfolio located throughout the United States €41.6 million ($47.9 million)14 floating-rate subordinate loan secured by a Spanish hotel portfolio $30.8 million floating-rate first mortgage secured by an ~16,000 square ft. retail property located in Miami Beach, FL $34.1 million in partial repayments, $30.5 million of which were from first mortgage loans and $3.6 million of which were from subordinate loans See footnotes on page 19 6
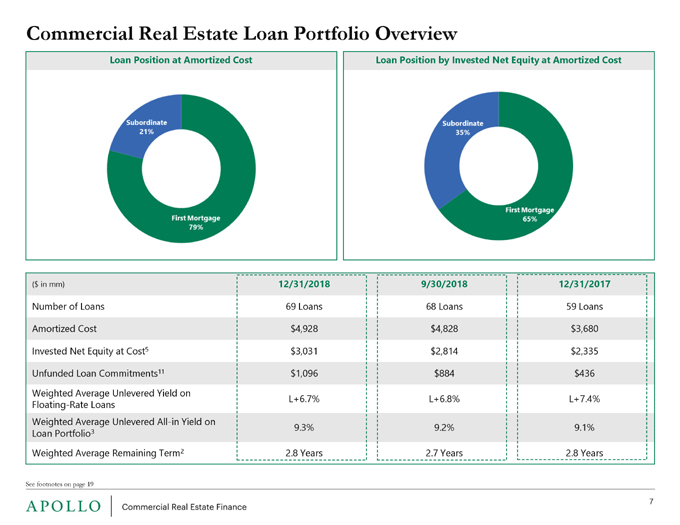
Commercial Real Estate Loan Portfolio Overview Loan Position at Amortized Cost Loan Position by Invested Net Equity at Amortized Cost ($ in mm) 12/31/2018 9/30/2018 12/31/2017 Number of Loans 69 Loans 68 Loans 59 Loans Amortized Cost $4,928 $4,828 $3,680 Invested Net Equity at Cost 5 $3,031 $2,814 $2,335 Unfunded Loan Commitments 11 $1,096 $884 $436 Weighted Average Unlevered Yield on L+6.7% L+6.8% L+7.4% Floating-Rate Loans Weighted Average UnleveredAll-in Yield on 3 9.3% 9.2% 9.1% Loan Portfolio Weighted Average Remaining Term 2 2.8 Years 2.7 Years 2.8 Years See footnotes on page 19 7
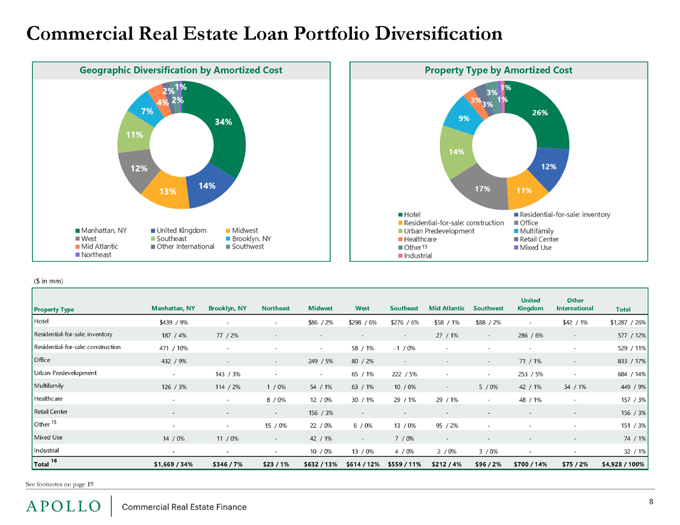
Commercial Real Estate Loan Portfolio Diversification Geographic Diversification by Amortized Cost Property Type by Amortized Cost 15 ($ in mm) United Other Property Type Manhattan, NY Brooklyn, NY Northeast Midwest West Southeast Mid Atlantic Southwest Kingdom International Total Hotel $439 / 9% — $86 / 2% $298 / 6% $276 / 6% $58 / 1% $88 / 2%—$42 / 1% $1,287 / 26%Residential-for-sale: inventory 187 / 4% 77 / 2% — — 27 / 1%—286 / 6%—577 / 12%Residential-for-sale: construction 471 / 10% ——58 / 1%-1 / 0% — — 529 / 11% Office 432 / 9% — 249 / 5% 80 / 2% ——71 / 1%—833 / 17% Urban Predevelopment—143 / 3% — 65 / 1% 222 / 5% — 253 / 5%—684 / 14% Multifamily 126 / 3% 114 / 2% 1 / 0% 54 / 1% 63 / 1% 10 / 0%—5 / 0% 42 / 1% 34 / 1% 449 / 9% Healthcare — 8 / 0% 12 / 0% 30 / 1% 29 / 1% 29 / 1%—48 / 1%—157 / 3% Retail Center ——156 / 3% — — — 156 / 3% Other 15 — 15 / 0% 22 / 0% 6 / 0% 13 / 0% 95 / 2% ——151 / 3% Mixed Use 14 / 0% 11 / 0%—42 / 1%—7 / 0% — — 74 / 1% Industrial ——10 / 0% 13 / 0% 4 / 0% 2 / 0% 3 / 0% — 32 / 1% 16 Total $1,669 / 34% $346 / 7% $23 / 1% $632 / 13% $614 / 12% $559 / 11% $212 / 4% $96 / 2% $700 / 14% $75 / 2% $4,928 / 100% See footnotes on page 19 8
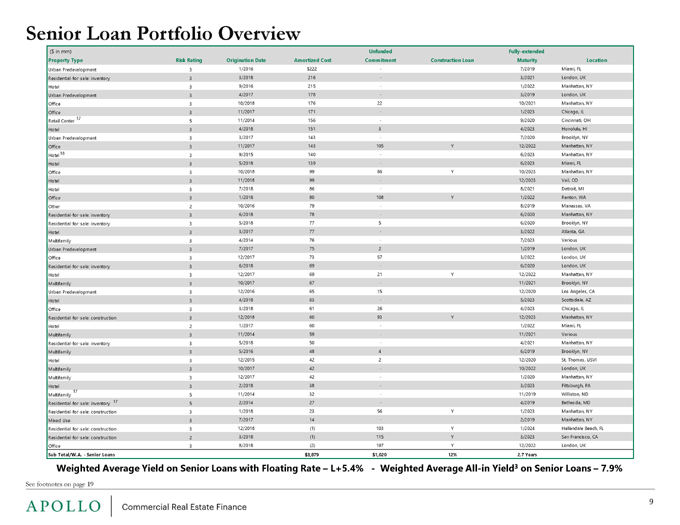
Senior Loan Portfolio Overview ($ in mm) Unfunded Fully-extended Property Type Risk Rating Origination Date Amortized Cost Commitment Construction Loan Maturity Location Urban Predevelopment 3 1/2016 $222—7/2019 Miami, FLResidential-for-sale: inventory 3 3/2018 216—3/2021 London, UK Hotel 3 9/2016 215—1/2022 Manhattan, NY Urban Predevelopment 3 4/2017 178—3/2019 London, UK Office 3 10/2018 176 22 10/2021 Manhattan, NY Office 3 11/2017 171—1/2023 Chicago, IL Retail Center 17 5 11/2014 156—9/2020 Cincinnati, OH Hotel 3 4/2018 151 3 4/2023 Honolulu, HI Urban Predevelopment 3 3/2017 143—7/2020 Brooklyn, NY Office 3 11/2017 143 105 Y 12/2022 Manhattan, NY Hotel18 3 9/2015 140—6/2023 Manhattan, NY Hotel 3 5/2018 139—6/2023 Miami, FL Office 3 10/2018 99 86 Y 10/2023 Manhattan, NY Hotel 3 11/2018 99—12/2023 Vail, CO Hotel 3 7/2018 86—8/2021 Detroit, MI Office 3 1/2018 80 108 Y 1/2022 Renton, WA Other 2 10/2016 79—8/2019 Manassas, VAResidential-for-sale: inventory 3 6/2018 78—6/2020 Manhattan, NYResidential-for-sale: inventory 3 5/2018 77 5 6/2020 Brooklyn, NY Hotel 3 3/2017 77—3/2022 Atlanta, GA Multifamily 3 4/2014 76—7/2023 Various Urban Predevelopment 3 7/2017 75 2 1/2019 London, UK Office 3 12/2017 73 57 3/2022 London, UKResidential-for-sale: inventory 3 6/2018 69—6/2020 London, UK Hotel 3 12/2017 69 21 Y 12/2022 Manhattan, NY Multifamily 3 10/2017 67—11/2021 Brooklyn, NY Urban Predevelopment 3 12/2016 65 15 12/2020 Los Angeles, CA Hotel 3 4/2018 63—5/2023 Scottsdale, AZ Office 3 3/2018 61 26 4/2023 Chicago, ILResidential-for-sale: construction 3 12/2018 60 93 Y 12/2023 Manhattan, NY Hotel 2 1/2017 60—1/2022 Miami, FL Multifamily 3 11/2014 59—11/2021 VariousResidential-for-sale: inventory 3 5/2018 50—4/2021 Manhattan, NY Multifamily 3 5/2016 48 4 6/2019 Brooklyn, NY Hotel 3 12/2015 42 2 12/2020 St. Thomas, USVI Multifamily 3 10/2017 42—10/2022 London, UK Multifamily 3 12/2017 42—1/2020 Manhattan, NY Hotel 3 2/2018 38—3/2023 Pittsburgh, PA Multifamily 17 5 11/2014 32—11/2019 Williston, NDResidential-for-sale: inventory 17 5 2/2014 27—4/2019 Bethesda, MDResidential-for-sale: construction 3 1/2018 23 56 Y 1/2023 Manhattan, NY Mixed Use 3 7/2017 14—2/2019 Manhattan, NYResidential-for-sale: construction 3 12/2018 (1) 103 Y 1/2024 Hallandale Beach, FLResidential-for-sale: construction 2 3/2018 (1) 115 Y 3/2023 San Francisco, CA Office 3 8/2018 (2) 197 Y 12/2022 London, UK Sub Total/W.A.—Senior Loans $3,879 $1,020 12% 2.7 Years Weighted Average Yield on Senior Loans with Floating Rate – L+5.4%—Weighted AverageAll-in Yield3 on Senior Loans – 7.9% See footnotes on page 19 9
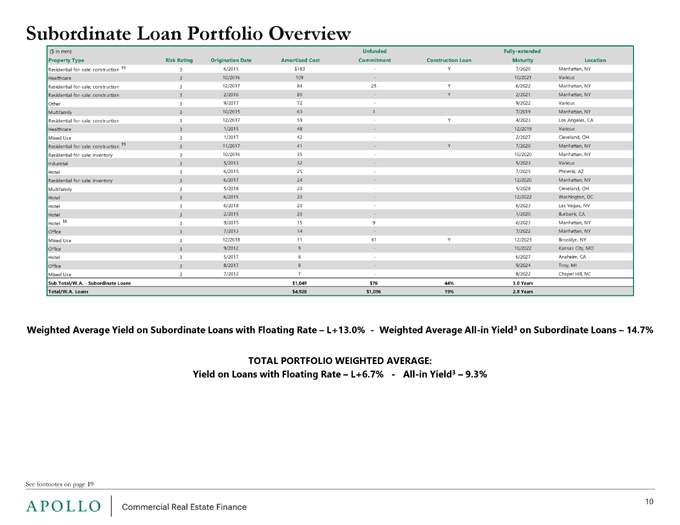
Subordinate Loan Portfolio Overview ($ in mm) Unfunded Fully-extended Property Type Risk Rating Origination Date Amortized Cost Commitment Construction Loan Maturity LocationResidential-for-sale: construction 19 3 6/2015 $183—Y 7/2020 Manhattan, NY Healthcare 3 10/2016 109—10/2021 VariousResidential-for-sale: construction 3 12/2017 84 25 Y 6/2022 Manhattan, NYResidential-for-sale: construction 3 2/2016 80—Y 2/2021 Manhattan, NY Other 3 9/2017 72—9/2022 Various Multifamily 3 10/2015 63 1 7/2019 Manhattan, NYResidential-for-sale: construction 3 12/2017 59—Y 4/2023 Los Angeles, CA Healthcare 3 1/2015 48—12/2019 Various Mixed Use 3 1/2017 42—2/2027 Cleveland, OHResidential-for-sale: construction 19 3 11/2017 41—Y 7/2020 Manhattan, NYResidential-for-sale: inventory 3 10/2016 35—10/2020 Manhattan, NY Industrial 3 5/2013 32—5/2023 Various Hotel 3 6/2015 25—7/2025 Phoenix, AZResidential-for-sale: inventory 3 6/2017 24—12/2020 Manhattan, NY Multifamily 3 5/2018 20—5/2028 Cleveland, OH Hotel 3 6/2015 20—12/2022 Washington, DC Hotel 3 6/2018 20—6/2023 Las Vegas, NV Hotel 3 2/2015 20—1/2020 Burbank, CA Hotel 18 3 9/2015 15 9 6/2023 Manhattan, NY Office 3 7/2013 14—7/2022 Manhattan, NY Mixed Use 3 12/2018 11 41 Y 12/2023 Brooklyn, NY Office 3 9/2012 9—10/2022 Kansas City, MO Hotel 3 5/2017 8—6/2027 Anaheim, CA Office 3 8/2017 8—9/2024 Troy, MI Mixed Use 3 7/2012 7—8/2022 Chapel Hill, NC Sub Total/W.A.—Subordinate Loans $1,049 $76 44% 3.0 Years Total/W.A. Loans $4,928 $1,096 19% 2.8 Years Weighted Average Yield on Subordinate Loans with Floating Rate – L+13.0%—Weighted AverageAll-in Yield3 on Subordinate Loans – 14.7% TOTAL PORTFOLIO WEIGHTED AVERAGE: Yield on Loans with Floating Rate –L+6.7%—All-in Yield3 – 9.3% See footnotes on page 19 10
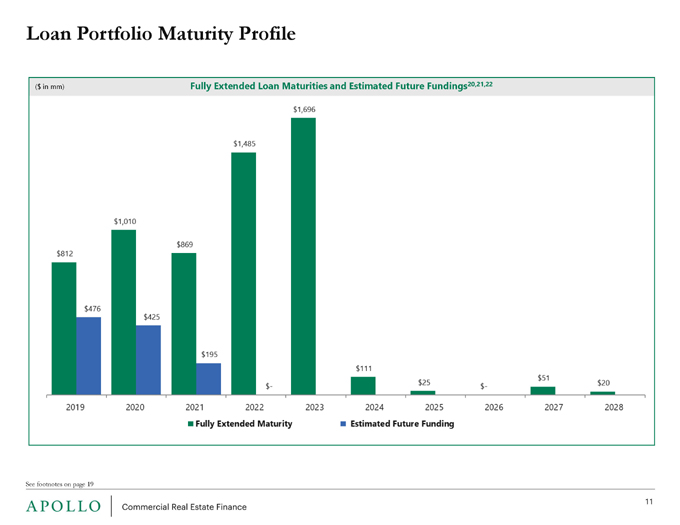
Loan Portfolio Maturity Profile ($ in mm) Fully Extended Loan Maturities and Estimated Future Fundings 20,21,22 See footnotes on page 19 11
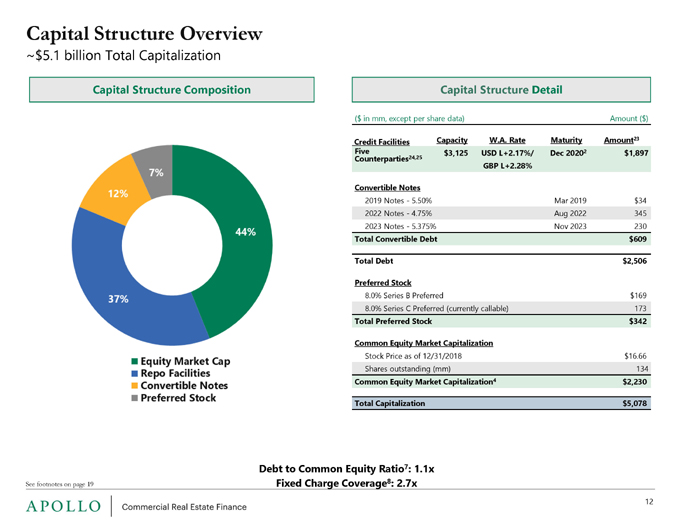
Capital Structure Overview ~$5.1 billion Total Capitalization Capital Structure Composition Capital Structure Detail ($ in mm, except per share data) Amount ($) Credit Facilities Capacity W.A. Rate Maturity Amount 23 Five Counterparties 24,25 $3,125 USD L+2.17%/ Dec 20202 $1,897 GBP L+2.28% Convertible Notes 2019 Notes—5.50% Mar 2019 $34 2022 Notes—4.75% Aug 2022 345 2023 Notes—5.375% Nov 2023 230 Total Convertible Debt $609 Total Debt $2,506 Preferred Stock 8.0% Series B Preferred $169 8.0% Series C Preferred (currently callable) 173 Total Preferred Stock $342 Common Equity Market Capitalization Stock Price as of 12/31/2018 $16.66 Shares outstanding (mm) 134 Common Equity Market Capitalization 4 $2,230 Total Capitalization $5,078 Debt to Common Equity Ratio 7: 1.1x See footnotes on page 19 Fixed Charge Coverage 8: 2.7x 12
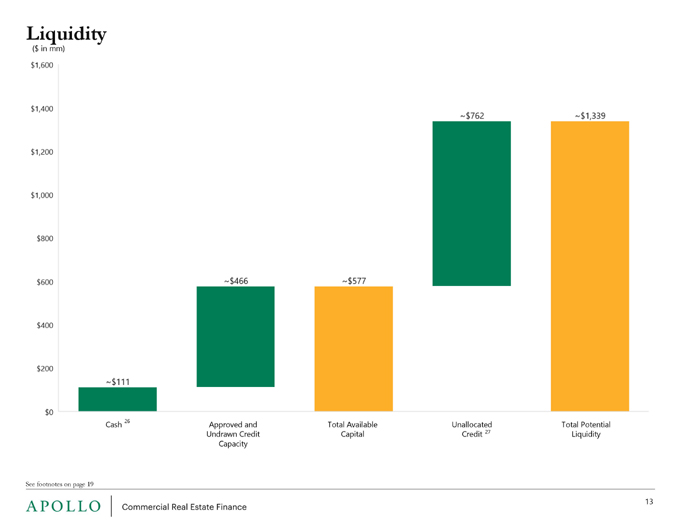
Liquidity ($ in mm) Cash 26 Approved and Total Available Unallocated Total Potential Undrawn Credit Capital Credit 27 Liquidity Capacity See footnotes on page 19 13
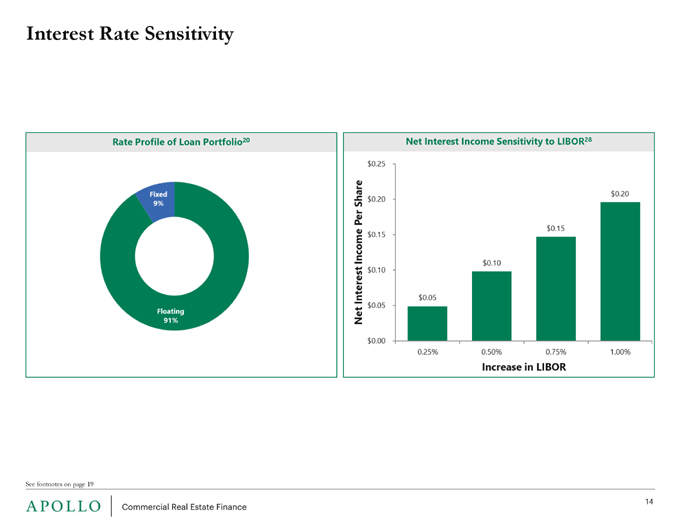
Interest Rate Sensitivity Rate Profile of Loan Portfolio 20 Net Interest Income Sensitivity to LIBOR 28 See footnotes on page 19 14

Financials
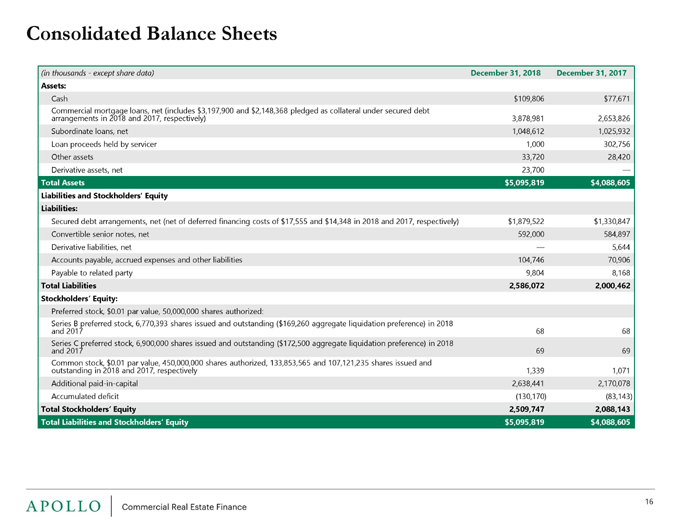
Consolidated Balance Sheets (in thousands—except share data) December 31, 2018 December 31, 2017 Assets: Cash $109,806 $77,671 Commercial mortgage loans, net (includes $3,197,900 and $2,148,368 pledged as collateral under secured debt arrangements in 2018 and 2017, respectively) 3,878,981 2,653,826 Subordinate loans, net 1,048,612 1,025,932 Loan proceeds held by servicer 1,000 302,756 Other assets 33,720 28,420 Derivative assets, net 23,700 Total Assets $5,095,819 $4,088,605 Liabilities and Stockholders’ Equity Liabilities: Secured debt arrangements, net (net of deferred financing costs of $17,555 and $14,348 in 2018 and 2017, respectively) $1,879,522 $1,330,847 Convertible senior notes, net 592,000 584,897 Derivative liabilities, net 5,644 Accounts payable, accrued expenses and other liabilities 104,746 70,906 Payable to related party 9,804 8,168 Total Liabilities 2,586,072 2,000,462 Stockholders’ Equity: Preferred stock, $0.01 par value, 50,000,000 shares authorized: Series B preferred stock, 6,770,393 shares issued and outstanding ($169,260 aggregate liquidation preference) in 2018 and 2017 68 68 Series C preferred stock, 6,900,000 shares issued and outstanding ($172,500 aggregate liquidation preference) in 2018 and 2017 69 69 Common stock, $0.01 par value, 450,000,000 shares authorized, 133,853,565 and 107,121,235 shares issued and outstanding in 2018 and 2017, respectively 1,339 1,071 Additionalpaid-in-capital 2,638,441 2,170,078 Accumulated deficit (130,170) (83,143) Total Stockholders’ Equity 2,509,747 2,088,143 Total Liabilities and Stockholders’ Equity $5,095,819 $4,088,605 16
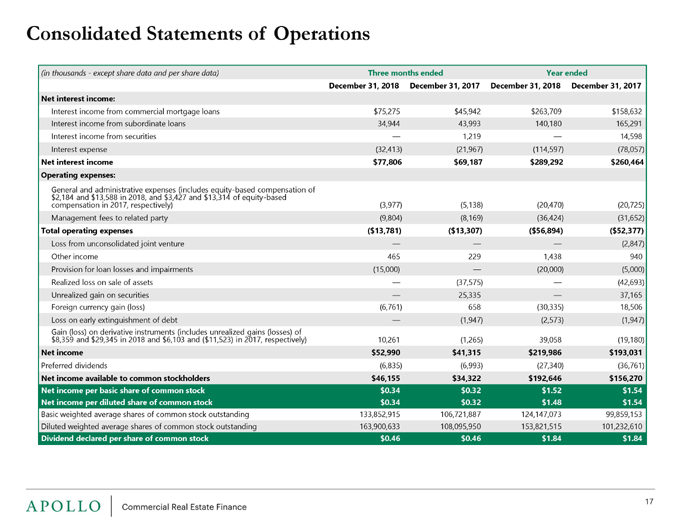
Consolidated Statements of Operations (in thousands—except share data and per share data) Three months ended Year ended December 31, 2018 December 31, 2017 December 31, 2018 December 31, 2017 Net interest income: Interest income from commercial mortgage loans $75,275 $45,942 $263,709 $158,632 Interest income from subordinate loans 34,944 43,993 140,180 165,291 Interest income from securities 1,219 14,598 Interest expense (32,413) (21,967) (114,597) (78,057) Net interest income $77,806 $69,187 $289,292 $260,464 Operating expenses: General and administrative expenses (includes equity-based compensation of $2,184 and $13,588 in 2018, and $3,427 and $13,314 of equity-based compensation in 2017, respectively) (3,977) (5,138) (20,470) (20,725) Management fees to related party (9,804) (8,169) (36,424) (31,652) Total operating expenses ($13,781) ($13,307) ($56,894) ($52,377) Loss from unconsolidated joint venture (2,847) Other income 465 229 1,438 940 Provision for loan losses and impairments (15,000) (20,000) (5,000) Realized loss on sale of assets (37,575) (42,693) Unrealized gain on securities 25,335 37,165 Foreign currency gain (loss) (6,761) 658 (30,335) 18,506 Loss on early extinguishment of debt (1,947) (2,573) (1,947) Gain (loss) on derivative instruments (includes unrealized gains (losses) of $8,359 and $29,345 in 2018 and $6,103 and ($11,523) in 2017, respectively) 10,261 (1,265) 39,058 (19,180) Net income $52,990 $41,315 $219,986 $193,031 Preferred dividends (6,835) (6,993) (27,340) (36,761) Net income available to common stockholders $46,155 $34,322 $192,646 $156,270 Net income per basic share of common stock $0.34 $0.32 $1.52 $1.54 Net income per diluted share of common stock $0.34 $0.32 $1.48 $1.54 Basic weighted average shares of common stock outstanding 133,852,915 106,721,887 124,147,073 99,859,153 Diluted weighted average shares of common stock outstanding 163,900,633 108,095,950 153,821,515 101,232,610 Dividend declared per share of common stock $0.46 $0.46 $1.84 $1.84 17
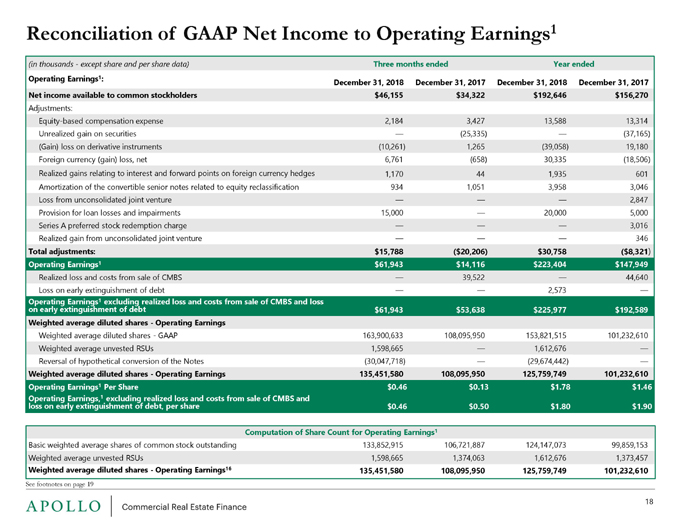
Reconciliation of GAAP Net Income to Operating Earnings 1 (in thousands—except share and per share data) Three months ended Year ended Operating Earnings 1: December 31, 2018 December 31, 2017 December 31, 2018 December 31, 2017 Net income available to common stockholders $46,155 $34,322 $192,646 $156,270 Adjustments: Equity-based compensation expense 2,184 3,427 13,588 13,314 Unrealized gain on securities (25,335) (37,165) (Gain) loss on derivative instruments (10,261) 1,265 (39,058) 19,180 Foreign currency (gain) loss, net 6,761 (658) 30,335 (18,506) Realized gains relating to interest and forward points on foreign currency hedges 1,170 44 1,935 601 Amortization of the convertible senior notes related to equity reclassification 934 1,051 3,958 3,046 Loss from unconsolidated joint venture 2,847 Provision for loan losses and impairments 15,000 20,000 5,000 Series A preferred stock redemption charge 3,016 Realized gain from unconsolidated joint venture 346 Total adjustments: $15,788 ($20,206) $30,758 ($8,321) Operating Earnings 1 $61,943 $14,116 $223,404 $147,949 Realized loss and costs from sale of CMBS 39,522 44,640 Loss on early extinguishment of debt 2,573 Operating Earnings 1 excluding realized loss and costs from sale of CMBS and loss on early extinguishment of debt $61,943 $53,638 $225,977 $192,589 Weighted average diluted shares—Operating Earnings Weighted average diluted shares—GAAP 163,900,633 108,095,950 153,821,515 101,232,610 Weighted average unvested RSUs 1,598,665 1,612,676 Reversal of hypothetical conversion of the Notes (30,047,718) (29,674,442) Weighted average diluted shares—Operating Earnings 135,451,580 108,095,950 125,759,749 101,232,610 Operating Earnings 1 Per Share $0.46 $0.13 $1.78 $1.46 Operating Earnings,1 excluding realized loss and costs from sale of CMBS and loss on early extinguishment of debt, per share $0.46 $0.50 $1.80 $1.90 Computation of Share Count for Operating Earnings 1 Basic weighted average shares of common stock outstanding 133,852,915 106,721,887 124,147,073 99,859,153 Weighted average unvested RSUs 1,598,665 1,374,063 1,612,676 1,373,457 Weighted average diluted shares—Operating Earnings 16 135,451,580 108,095,950 125,759,749 101,232,610 See footnotes on page 19 18
Footnotes 1. Operating Earnings is anon-GAAP financial measure that we define as net income available to common stockholders, computed in accordance with GAAP, adjusted for (i) equity-based compensation expense (a portion of which may become cash-based upon final vesting and settlement of awards should the holder elect net share settlement to satisfy income tax withholding), (ii) any unrealized gains or losses or othernon-cash items included in net income available to common stockholders, (iii) unrealized income from unconsolidated joint ventures, (iv) foreign currency gains (losses), other than (a) realized gains/(losses) related to interest income, and (b) forward point gains/(losses) realized on our foreign currency hedges, (v) thenon-cash amortization expense related to the reclassification of a portion of the convertible senior notes to stockholders’ equity in accordance with GAAP, and (vi) provision for loan losses and impairments. Please see slide 18 for a reconciliation of GAAP net income to Operating Earnings. Operating Earnings may also be adjusted to exclude certain othernon-cash items, as determined by ACREFI Management, LLC, the Company’s external manager (the “Manager”) and approved by a majority of the Company’s independent directors. 2. Assumes exercise of all extension options. 3. Weighted Average UnleveredAll-in Yield on the loan portfolio is based on the applicable benchmark rates as of December 31, 2018 on the floating rate loans and includes accrual of origination, extension, and exit fees. 4. Common equity market capitalization represents shares of common stock outstanding times the closing stock price on December 31, 2018. 5. Invested Net Equity at Cost is the amortized cost of loans less principal balance of secured debt arrangements; does not include debt secured by proceeds held by servicer. 6. Total debt balance less $17,555 and $14,348 at December 31, 2018 and December 31, 2017, respectively, in deferred financing costs. 7. Represents total secured debt arrangements and convertible senior notes, less cash and loan proceeds held by servicer divided by common equity. 8. Fixed charge coverage is EBITDA divided by interest expense and preferred stock dividends. 9. For loans closed prior to Q4 2018. 10. Reflects LTV as of date loans were originated or acquired. 11. Unfunded loan commitments are primarily funded to finance property improvements or lease-related expenditures by the borrowers. These future commitments are funded over the term of each loan, subject in certain cases to an expiration date. 12. Includes foreign currency appreciation/depreciation, PIK interest, loan loss reserves, and the accretion of loan costs and fees. 13. For loans closed prior to 2018. 14. Conversion to USD on date of repayment. 15. Other includes a data center and water park resorts. 16. Amounts and percentages may not foot due to rounding. 17. Amortized cost for these loans is net of the recorded provisions for loan losses and impairments. 18. Both loans are secured by the same property. 19. Both loans are secured by the same property. 20. Based upon face amount of loans. 21. Maturities reflect the fully funded amounts of the loans. 22. Future funding dates are based upon the Manager’s estimates based upon the best information available to the Manager at the time. There is no assurance that the payments will occur in accordance with these estimates or at all, which could affect the Company’s operating results. 23. Unless otherwise noted, represents outstanding principal balance or liquidation preference. 24. Debt balance as of December 31, 2018 includes asset specific borrowing: currently $177 million max capacity, all of which is drawn. 25. Debt balance includes GBP converted to USD using applicable December 31, 2018 spot rate. 26. Amount includes cash proceeds held by servicer. 27. Subject to availability of qualifying collateral assets and approval of lenders. 28. Any such hypothetical impact on interest rates on the Company’s variable rate borrowings does not consider the effect of any change in overall economic activity that could occur in a rising interest rate environment. Further, in the event of a change in interest rates of that magnitude, the Company may take actions to further mitigate the Company’s exposure to such a change. However, due to the uncertainty of the specific actions that would be taken and their possible effects, this analysis assumes no changes in the Company’s financial structure. The analysis incorporates movements in both USD LIBOR and GBP LIBOR. 19