 General Motors Company Q2 2010 Results August 12, 2010 Exhibit 99.2 |
 Forward Looking Statements 1 In this press release and in related comments by our management, our use of the words “expect,” “anticipate,” “possible,” “potential,” “target,” “believe,” “commit,” “intend,” “continue,” “may,” “would,” “could,” “should,” “project,” “projected,” “positioned” or similar expressions is intended to identify forward-looking statements that represent our current judgment about possible future events. We believe these judgments are reasonable, but these statements are not guarantees of any events or financial results, and our actual results may differ materially due to a variety of important factors. Among other items, such factors might include: our ability to realize production efficiencies and to achieve reductions in costs as a result of our restructuring initiatives and labor modifications; our ability to maintain quality control over our vehicles and avoid material vehicle recalls; our ability to maintain adequate liquidity and financing sources and an appropriate level of debt, including as required to fund our planning significant investment in new technology; our ability to realize successful vehicle applications of new technology; and our ability to comply with the continuing requirements related to U.S. and other government support. GM's most recent annual report on Form 10-K and quarterly report on Form 10-Q provides information about these and other factors, which we may revise or supplement in future reports to the SEC. |
 Q1 2010 Q2 2010 GAAP Net Revenue ($B) 31.5 33.2 Operating Income ($B) 1.2 1.8 Net Income Attr. Common Stockholders ($B) 0.9 1.3 EPS – Diluted ($/Share) 1.66 2.55 Non- GAAP EBIT - Adj. ($B) 1.7 2.0 Free Cash Flow ($B) 1.0 2.8 Summary of Q2 2010 Results 2 |
 Q2 Operating Income Walk to EBIT - Adj. 3 ($ B) Q2 2010 Operating Income 1.8 Equity Income 0.4 Non-Controlling Interests (0.1) Non-Operating Income (0.1) Earnings Before Interest & Taxes (EBIT) 2.0 Less Adjustments 0.0 EBIT - Adj. 2.0 |
 Q2 2010 EBIT & EBIT - Adj. 4 ($B) * Included in Earnings Before Interest and Taxes (EBIT) 1.6 (0.2) 0.7 (0.1) 2.0 0.0 2.0 GMNA GME GMIO Corp. / Elims EBIT Less Adjustments* EBIT - Adj. |
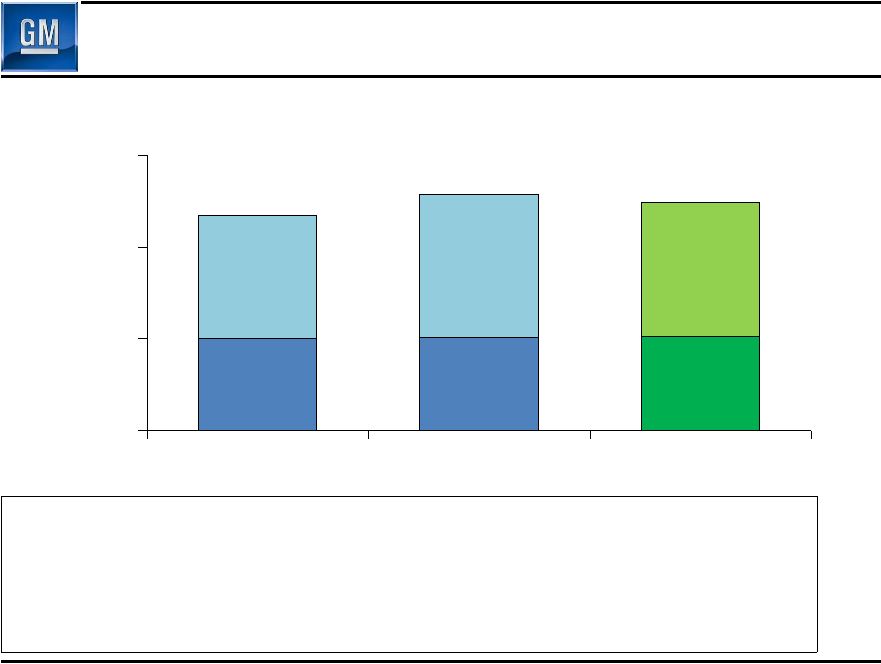
 Q2 2010 Global Deliveries 5 (000’s) Global Share 11.5% 11.1% 11.6% GM deliveries & market share include vehicles sold around the world under GM and JV brands, and through GM branded distribution network 1,952 1,999 2,153 1,000 1,600 2,200 Q4 2009 Q1 2010 Q2 2010 |
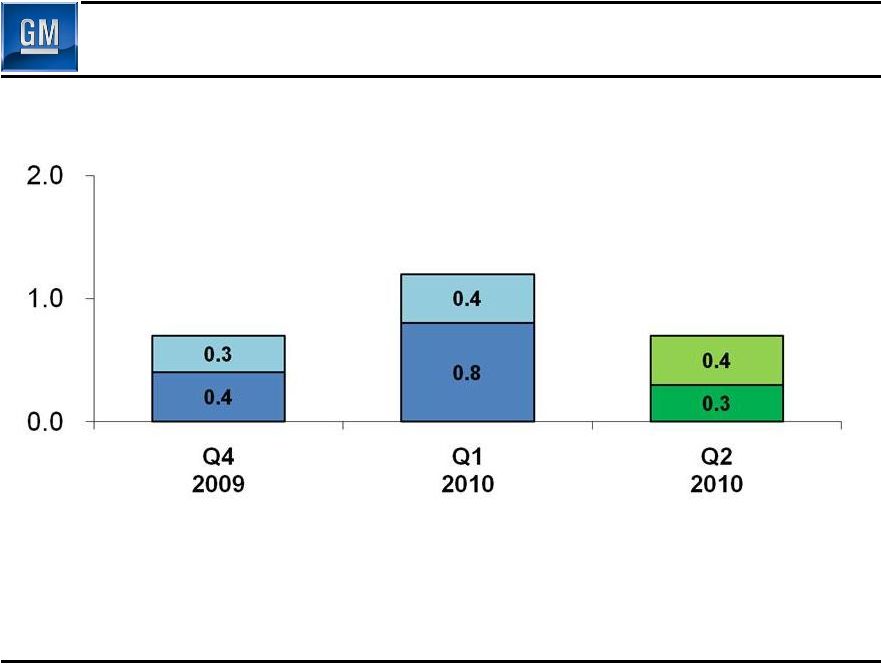
 587 551 708 50 0 400 800 Q4 2009 Q1 2010 Q2 2010 Q2 2010 GMNA Deliveries 6 (000’s) GMNA Share 19.3% 17.8% 18.7% U.S. Share 20.2% 18.4% 19.4% U.S. 4 Brand Share 18.6% 18.1% 19.3% Discontinued Brands Chevy, Buick, GMC, Cadillac 637 564 716 |
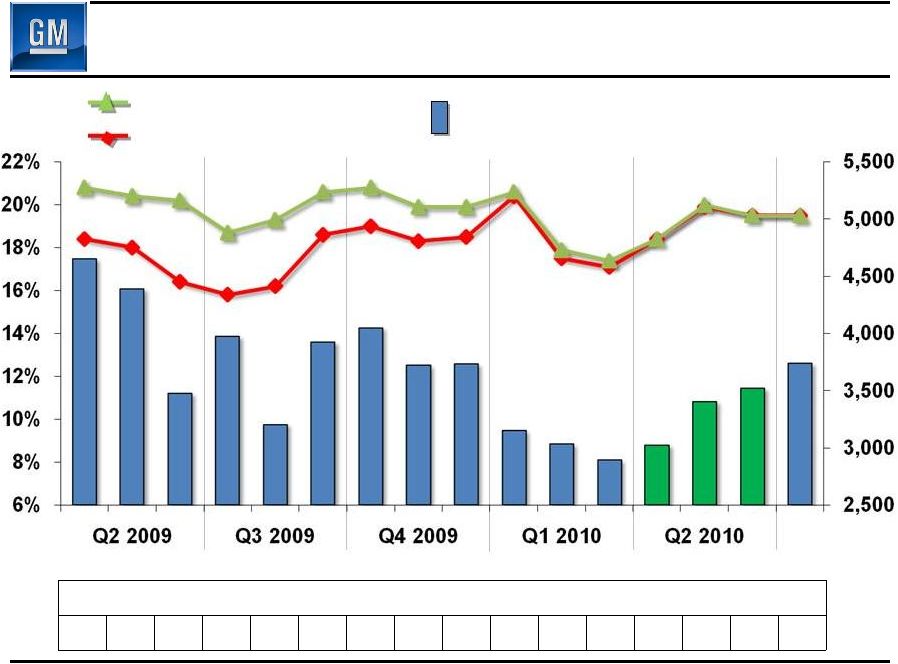 Key GMNA Performance Indicators 7 GM Average U.S. Retail Incentive (4 Brand) % of Industry Average 137 137 121 143 135 149 154 141 132 119 106 98 108 115 121 125 Share $/Unit U.S. 4 Brand Share U.S. Total Share Jul 2010 Avg. GM U.S. Retail Incentive – 4 Brands Note: Incentive Information Based on J.D. Power and Associates Power Information Network data |
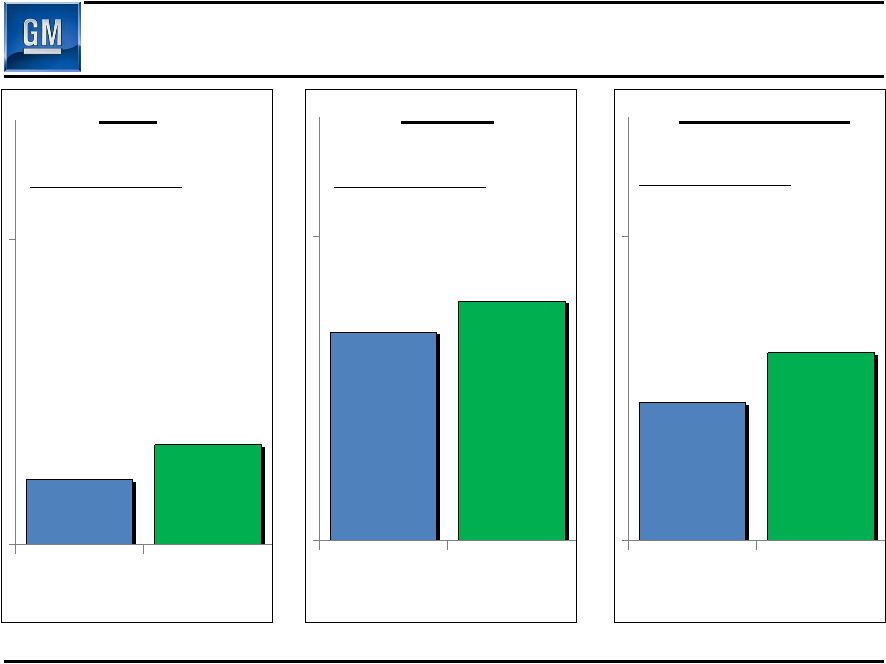 Q2 '09 Q2 '10 $23,800 $25,900 GM U.S Retail Transaction Prices Note: ATP Information Based on J.D. Power and Associates Power Information Network data 8 + $2,100 or 9% Car Q2 '09 Q2 '10 $32,300 $34,100 + $1,800 or 6% Q2 '09 Q2 '10 $28,100 $31,100 + $3,000 or 11% Increase due to: Nameplate Mix $1,700 Price/Content $400 Increase due to: Nameplate Mix $200 Price/Content $1,600 Increase due to: Nameplate Mix $(100) Price/Content $3,100 Truck Crossover |
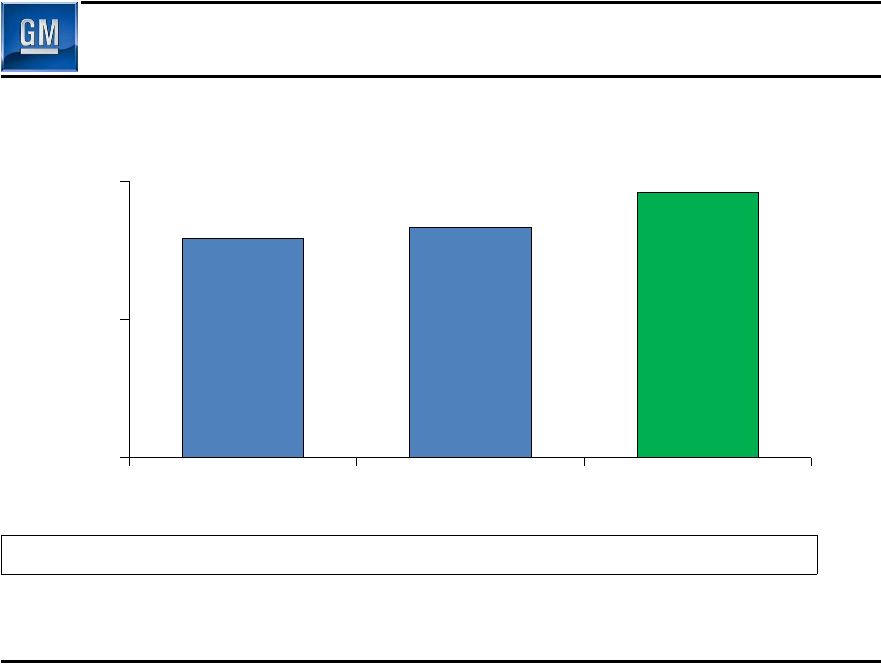
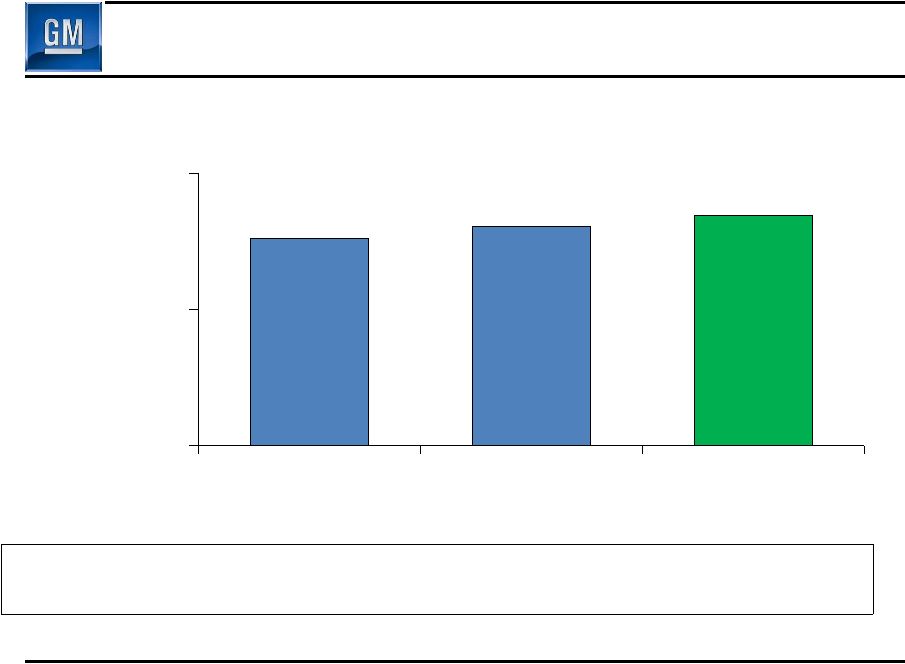 18.3 19.3 20.3 0 12 24 Q4 2009 Q1 2010 Q2 2010 Q2 2010 GMNA Net Revenue 9 ($B) GMNA Production (000’s) 616 668 731 U.S. Dealer Inv (000’s) 385 428 438 |
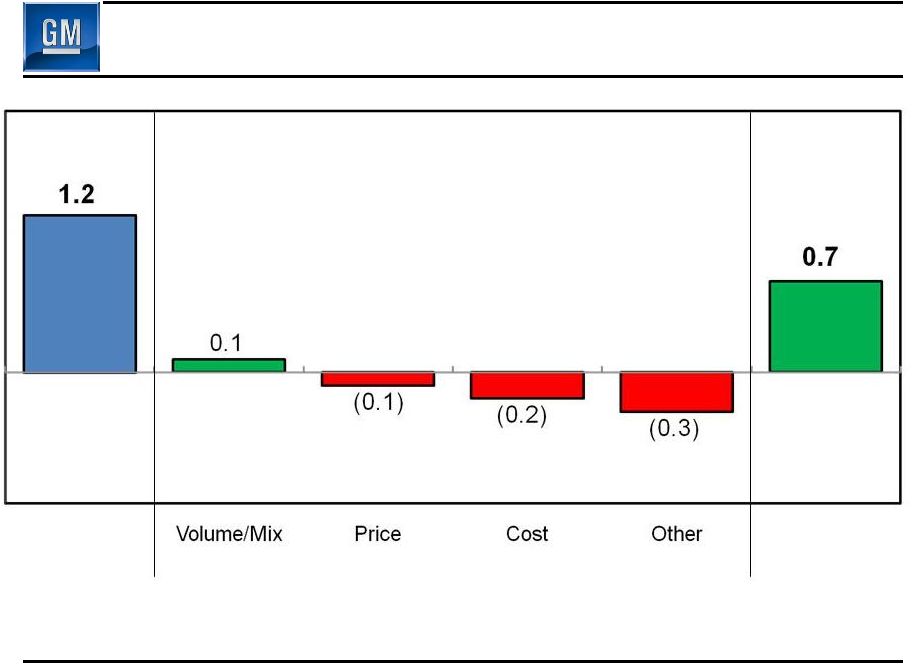
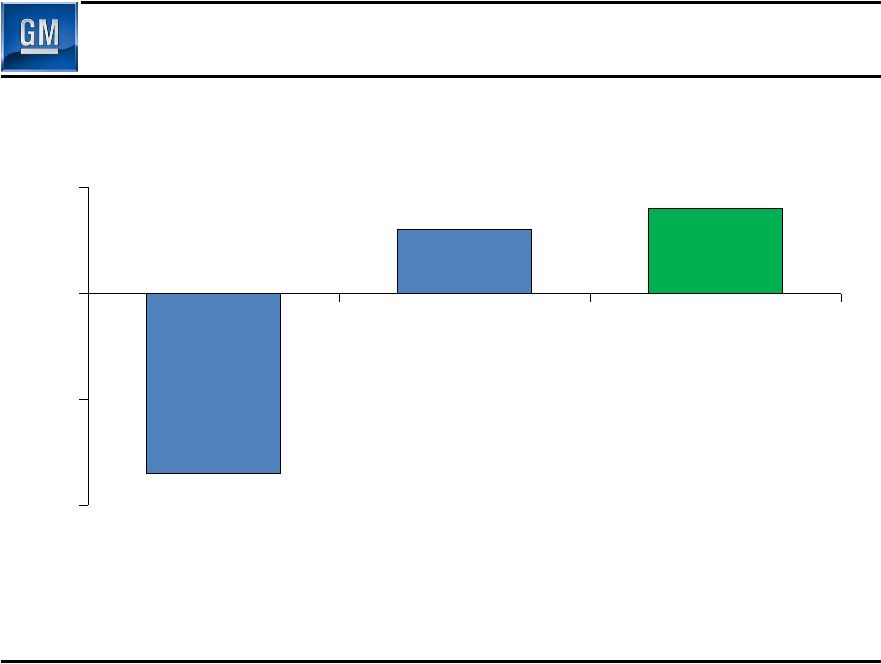 Q2 2010 GMNA Earnings Before Interest & Taxes 10 ($B) (3.4) 1.2 1.6 (4.0) (2.0) 0.0 2.0 Q4 2009 Q1 2010 Q2 2010 |
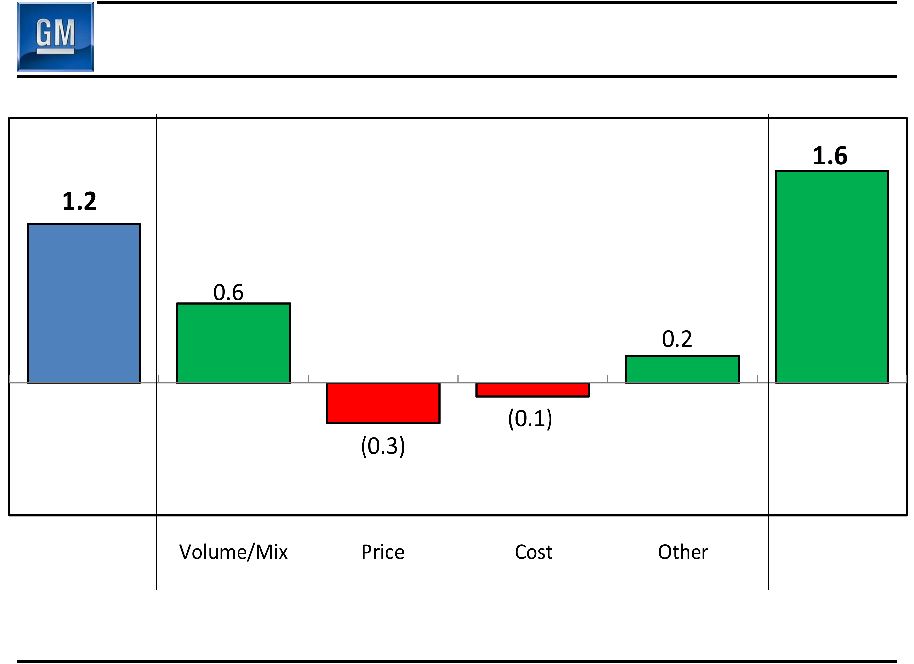 Q1 2010 EBIT GMNA EBIT - Q1 2010 vs. Q2 2010 ($B) Q2 2010 EBIT $0.4B Improvement 11 |
 271 299 315 107 105 127 0 400 800 Q4 2009 Q1 2010 Q2 2010 378 404 442 Q2 2010 GME Deliveries 12 (000’s) GME Share 8.2% 8.5% 8.8% Germany Share 8.8% 8.2% 8.0% U.K. Share 11.2% 12.0% 13.7% Chevrolet GME Excl. Chevrolet GME deliveries and market share include unit sales of Chevrolets produced by GMIO. Revenue and associated costs of these unit sales are reported by GMIO |
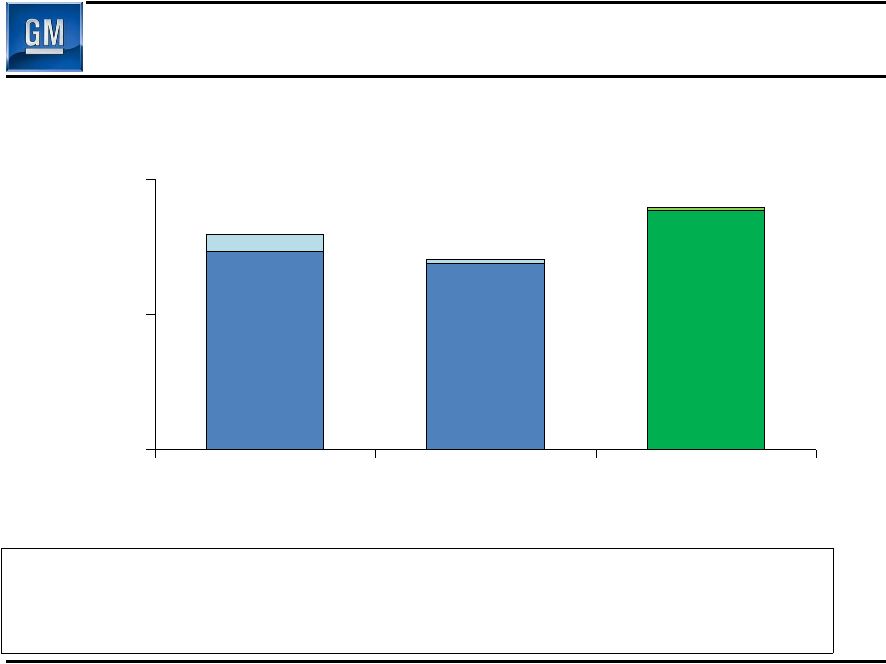
 6.2 6.0 5.5 0 12 24 Q4 2009 Q1 2010 Q2 2010 Q2 2010 GME Net Revenue 13 Production (000’s) 256 305 331 ($B) |
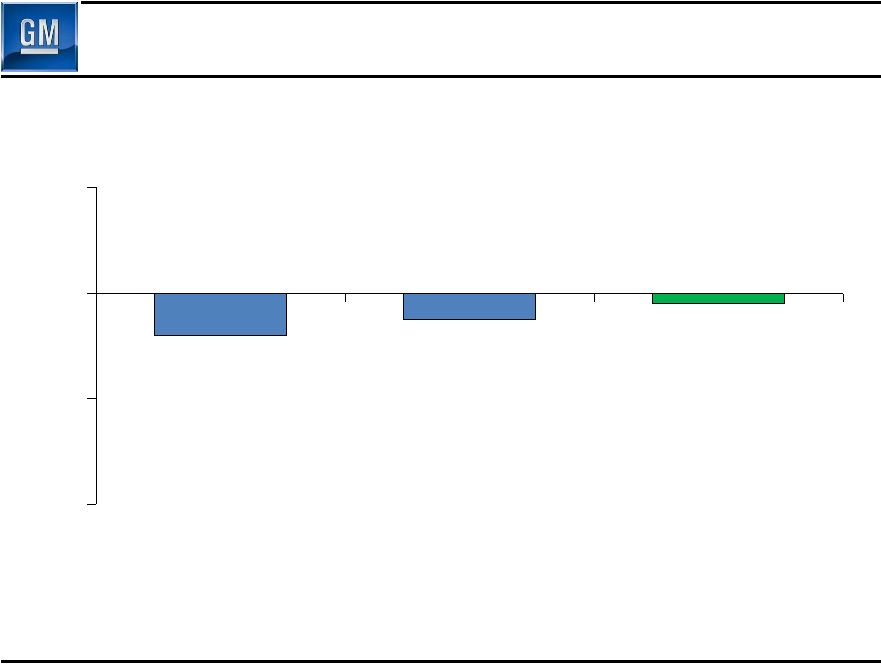 (0.8) (0.5) (0.2) (4.0) (2.0) 0.0 2.0 Q4 2009 Q1 2010 Q2 2010 Q2 2010 GME Earnings Before Interest & Taxes 14 ($B) |
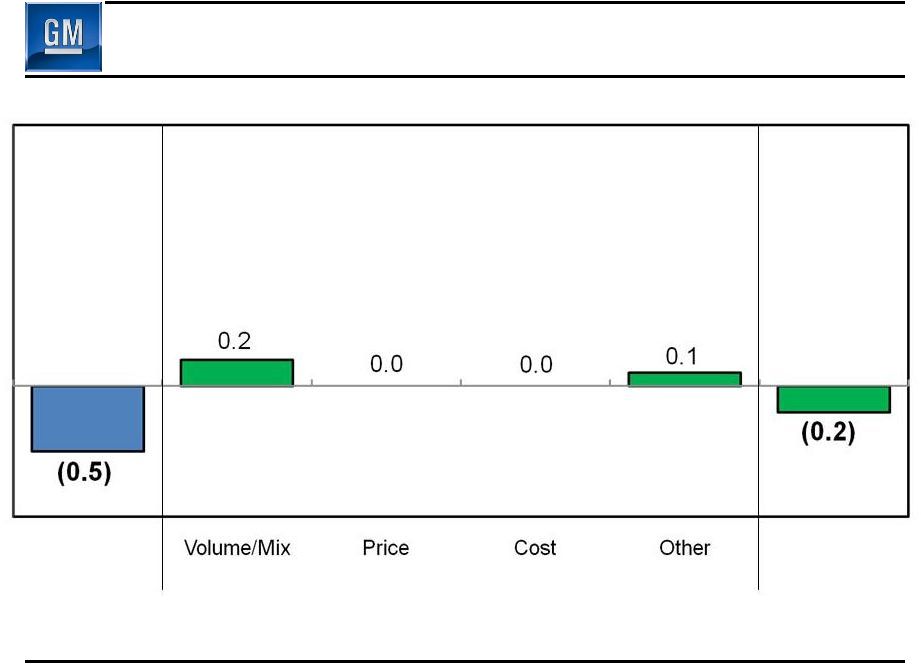 GME EBIT - Q1 2010 vs. Q2 2010 ($B) Q1 2010 EBIT Q2 2010 EBIT $0.3B Improvement 15 |
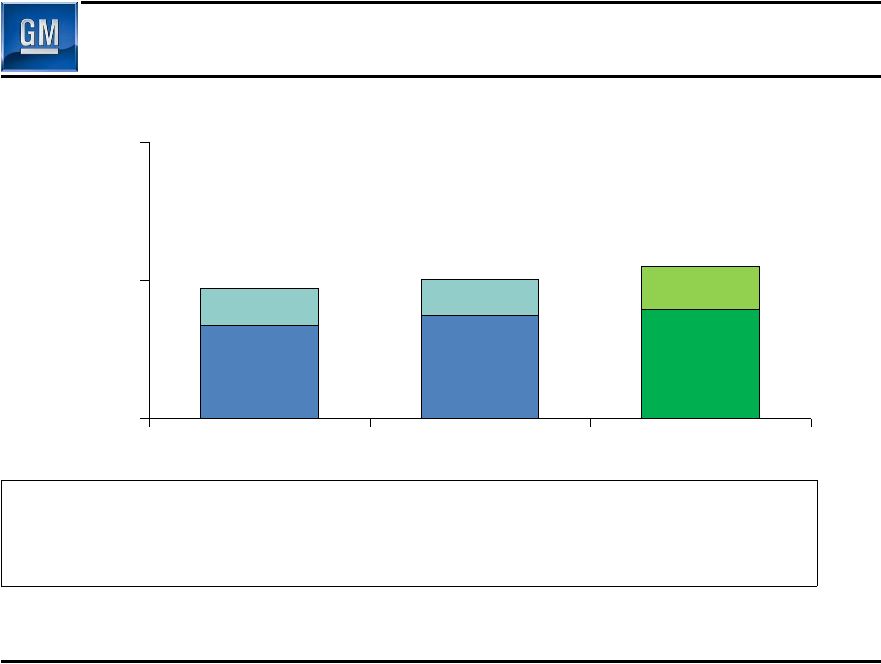
 403 407 409 534 624 586 0 400 800 1,200 Q4 2009 Q1 2010 Q2 2010 937 1,031 995 Q2 2010 GMIO Deliveries 16 (000’s) GMIO Share 10.3% 10.2% 10.3% China Share 13.2% 13.3% 13.1% Brazil Share 18.7% 19.9% 18.4% India Share 3.7% 4.2% 4.0% China GMIO Excl. China |
 Q2 2010 GMIO Net Revenue 17 ($B) Production (000’s) Fully Consolidated 458 458 498 Joint Venture 592 654 697 Total 1,050 1,112 1,195 9.1 8.1 8.6 0 12 24 Q4 2009 Q1 2010 Q2 2010 |
 Q2 2010 GMIO Earnings Before Interest & Taxes 18 ($B) 0.7 1.2 0.7 Equity Income Inc. Before Int/Tax/Equity |
 GMIO EBIT - Q1 2010 vs. Q2 2010 ($B) Q1 2010 EBIT Q2 2010 EBIT $0.5B Reduction 19 |
 Cash Flow 20 ($B) Q1 2010 Q2 2010 Net Income Attr. Common Stockholders 0.9 1.3 Add-back Non-Controlling Interests & Preferred Dividends 0.3 0.3 Net Income 1.2 1.6 Depreciation / Amortization 1.8 1.7 Working Capital (0.9) 0.1 Pension / OPEB & Other (0.3) 0.5 Net cash provided/(used) operating activities 1.8 3.9 Capital Expenditures (0.8) (1.1) Free Cash Flow 1.0 2.8 |
 Key Balance Sheet Items ($B) March 31 2010 June 30 2010 Cash & marketable securities* 35.7 32.5 Key Obligations: Debt 14.2 8.2 Preferred Stock 7.0 7.0 Underfunded Pensions 26.9 26.4 Underfunded OPEB 9.4 9.3 21 * Includes UST & Canadian HC Trust Restricted Cash |
 Q2 Key Messages • Two straight quarters of profitability and positive cash flow • Expect financial results to moderate in second half • Company continues to deliver on major business objectives – Product development – Cost discipline – European restructuring – AmeriCredit 22 |
 General Motors Company Select Supplemental Financial Information |
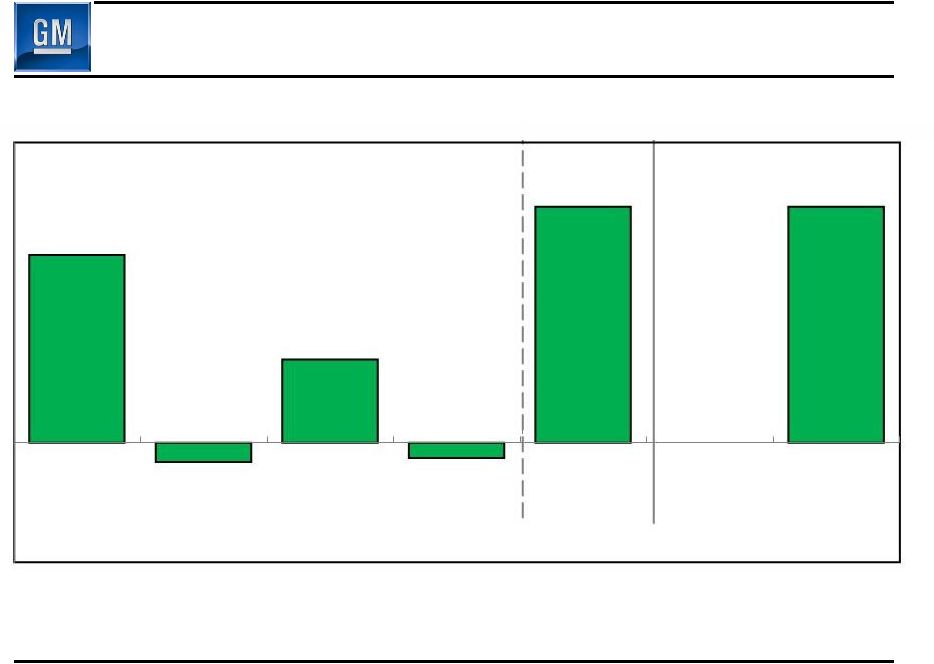
 Operating Income Walk to EBIT - Adj S1 ($B) Q4 2009 Q1 2010 Q2 2010 Operating Income (3.9) 1.2 1.8 Equity Income 0.3 0.4 0.4 Non-Controlling Interests (0.2) (0.1) (0.1) Non-Operating Income/(Expense) (0.2) 0.4 (0.1) Earnings Before Interest & Taxes (4.0) 1.8 2.0 Less Adjustments (3.0) 0.1 0.0 EBIT- Adj. (1.0) 1.7 2.0 |
 Detail of Adjustments S2 ($B) Q4 2009 Q1 2010 Q2 2010 Earnings Before Interest & Taxes (EBIT) (4.0) 1.8 2.0 Less Adjustments - Gain on Saab Sale 0.0 0.1 - VEBA Settlement (2.5) - GMAC Investment Impairment (0.3) - Delphi Related (0.1) - CAMI Debt Ext. (0.1) Total Adjustments (3.0) 0.1 0.0 EBIT – Adj. (1.0) 1.7 2.0 |
 Restructuring Excluded From Adjustments S3 ($B) Q4 2009 Q1 2010 Q2 2010 GMNA – Dealer Related (0.1) 0.0 0.0 GMNA – Non-Dealer Related (0.2) 0.1 0.0 Total GMNA (0.3) 0.1 0.0 Total GME 0.0 (0.3) (0.2) Total GMIO (0.1) 0.0 0.0 Total (0.4) (0.2) (0.2) |