 General Motors Company Q4 & CY 2010 Results February 24, 2011 Exhibit 99.2 |
 Forward Looking Statements 1 In this presentation and in related comments by our management, our use of the words “expect,” “anticipate,” “possible,” “potential,” “target,” “believe,” “commit,” “intend,” “continue,” “may,” “would,” “could,” “should,” “project,” “projected,” “positioned” or similar expressions is intended to identify forward looking statements that represent our current judgment about possible future events. We believe these judgments are reasonable, but these statements are not guarantees of any events or financial results, and our actual results may differ materially due to a variety of important factors. Among other items, such factors might include: our ability to realize production efficiencies and to achieve reductions in costs as a result of our restructuring initiatives and labor modifications; our ability to maintain quality control over our vehicles and avoid material vehicle recalls; our ability to maintain adequate liquidity and financing sources and an appropriate level of debt, including as required to fund our planning significant investment in new technology; our ability to realize successful vehicle applications of new technology; and our ability to continue to attract new customers, particularly for our new products. GM's most recent annual report on Form 10-K and quarterly report on Form 10- Q provides information about these and other factors, which we may revise or supplement in future reports to the SEC. |
 Summary of Q4 & CY 2010 Results 2 * EBIT-Adj. includes GM Financial on an Earnings Before Tax (EBT) basis * * Automotive Free Cash Flow Includes $(4.0)B Impact of Voluntary U.S. Pension Contribution Q4 2010 CY 2010 GAAP Net Revenue ($B) 36.9 135.6 Operating Income ($B) 0.3 5.1 Net Income Attr. Common Stockholders ($B) 0.5 4.7 EPS – Diluted ($/Share) 0.31 2.89 Non- GAAP EBIT- Adj. ($B) 1.0* 7.0* Automotive Free Cash Flow ($B) (2.8)** 2.4** |
 Presentation of Results • Standardized and consistent approach • Q4 2010 marks first quarter which prior year results are on a equivalent fresh-start accounting basis – Transition quarterly EBIT bridges to year-over-year comparisons • New GM South America segment has been introduced – GMIO prior quarter results adjusted to reflect breakout of GMSA • GM Financial segment has been added as result of October 1 acquisition – GMF included in EBIT & EBIT-Adjusted on a Earnings Before Tax (EBT) basis 3 |
 Net Income Attr. Common Stockholders 4 Note: Results may not foot due to rounding Q4 2010 CY 2010 Net Income Attr. Common Stockholders ($B) 0.5 4.7 EPS – Diluted ($/Share) 0.31 2.89 Included in Above ($B): - Gain on Extinguishment of VEBA Note 0.2 0.2 - Gain on Sale of Nexteer & Purchase of Strasbourg 0.1 0.1 - Gain on Saab Sale 0.0 0.1 - Loss on Purchase of UST Preferred (0.7) (0.7) Total Impact Net Income Attr. Common Stockholders ($B) (0.4) (0.2) Total Impact EPS – Diluted ($/Share) (0.21) (0.14) |
 CY Operating Income Walk to EBIT - Adj. 5 Note: EBIT & EBIT-Adj. includes GM Financial on an Earnings Before Tax (EBT) basis Note: Results may not foot due to rounding ($ B) CY 2010 Operating Income 5.1 Equity Income 1.4 Non-Controlling Interests (0.3) Non-Operating Income 1.3 Earnings Before Interest & Taxes (EBIT) 7.5 Less Adjustments 0.4 EBIT- Adj. 7.0 |
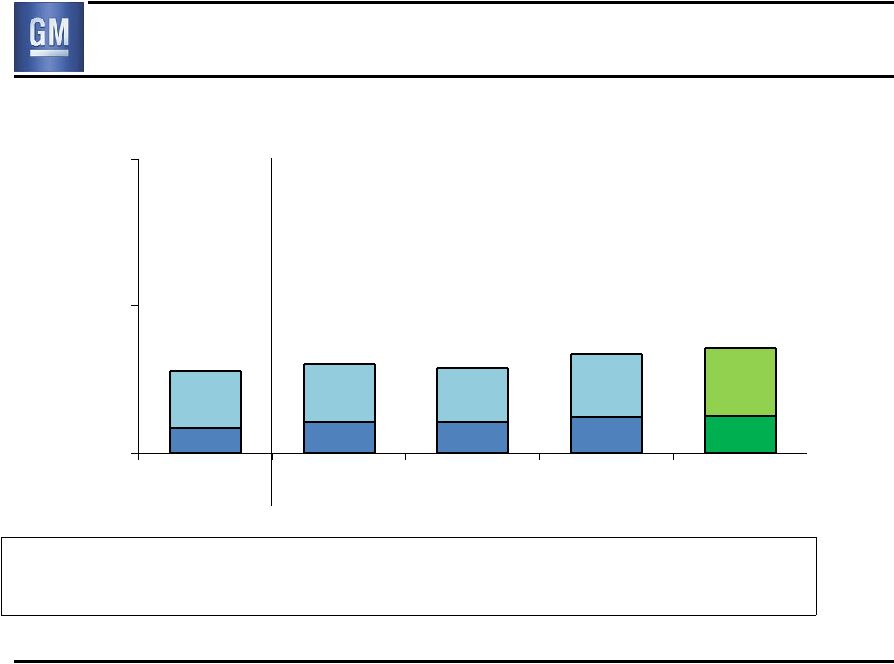
 CY 2010 EBIT & EBIT- Adj. ($B) * GMF at an Earnings Before Tax basis (EBT) ** Included in Earnings Before Interest and Taxes (EBIT) 6 Note: Results may not foot due to rounding 5.7 (1.8) 2.3 0.8 0.3 0.1 7.5 0.4 7.0 GMNA GME GMIO GMSA Corp. / Elims GMF* EBIT Less** Adjustments EBIT - Adj. |
 Q4 Operating Income Walk to EBIT- Adj. 7 Note: EBIT-Adj. includes GM Financial on an Earnings Before Tax (EBT) basis ($ B) Q4 2010 Operating Income 0.3 Equity Income 0.3 Non-Controlling Interests (0.1) Non-Operating Income 0.8 Earnings Before Interest & Taxes (EBIT) 1.3 Less Adjustments 0.3 EBIT- Adj. 1.0 |
 Q4 2010 EBIT & EBIT- Adj. ($B) Note: Results may not foot due to rounding 8 * GMF at an Earnings Before Tax basis (EBT) ** Included in Earnings Before Interest and Taxes (EBIT) 0.8 (0.6) 0.3 0.2 0.4 0.1 1.3 0.3 1.0 GMNA GME GMIO GMSA Corp. / Elims GMF* EBIT Less** Adjustments EBIT - Adj. |
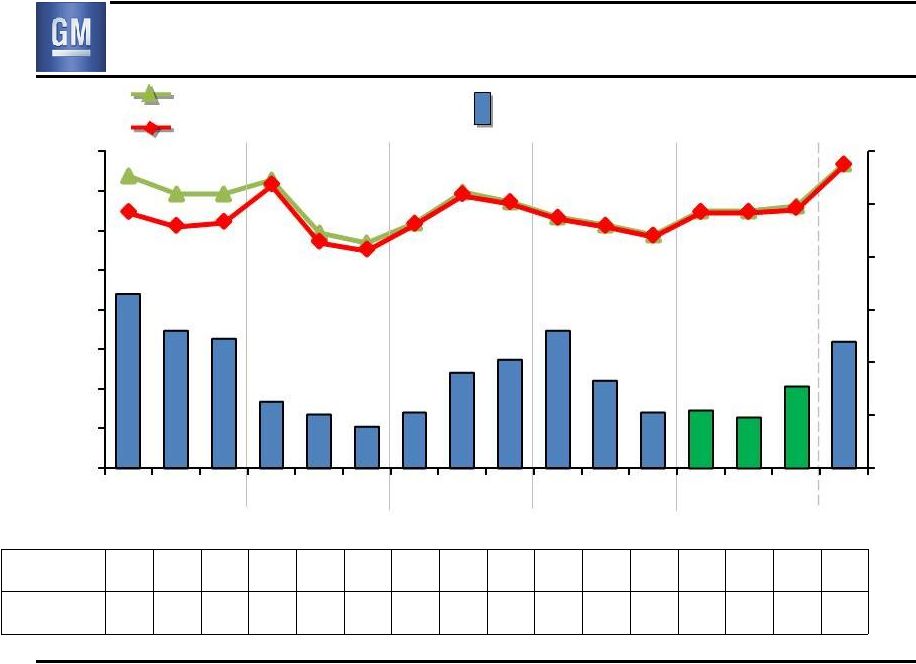
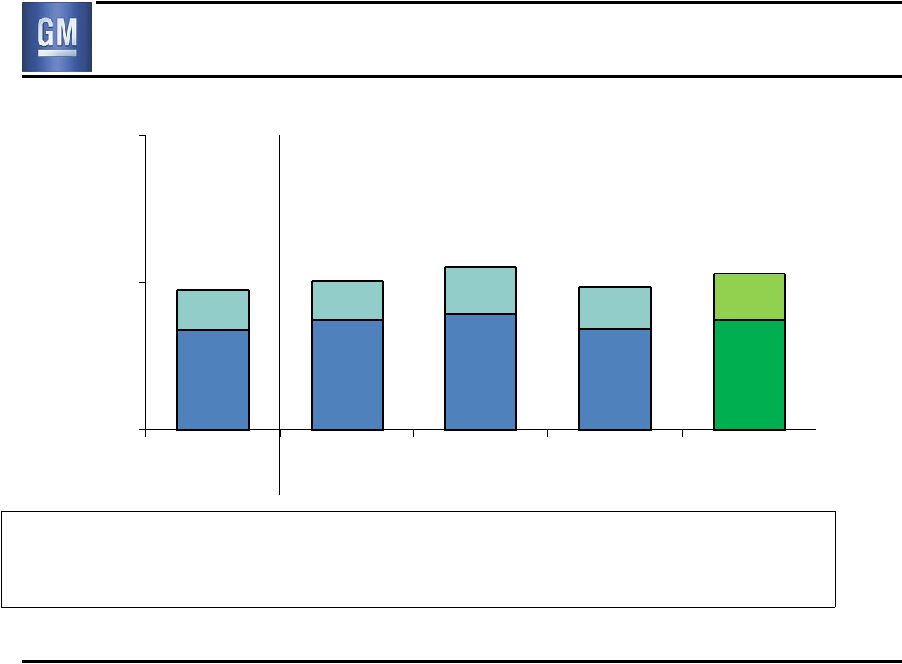
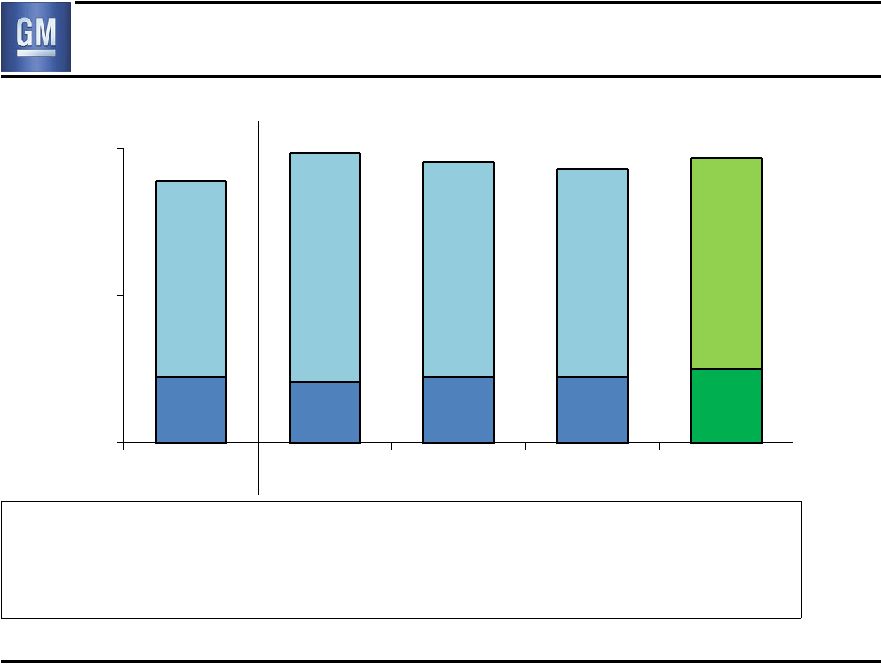
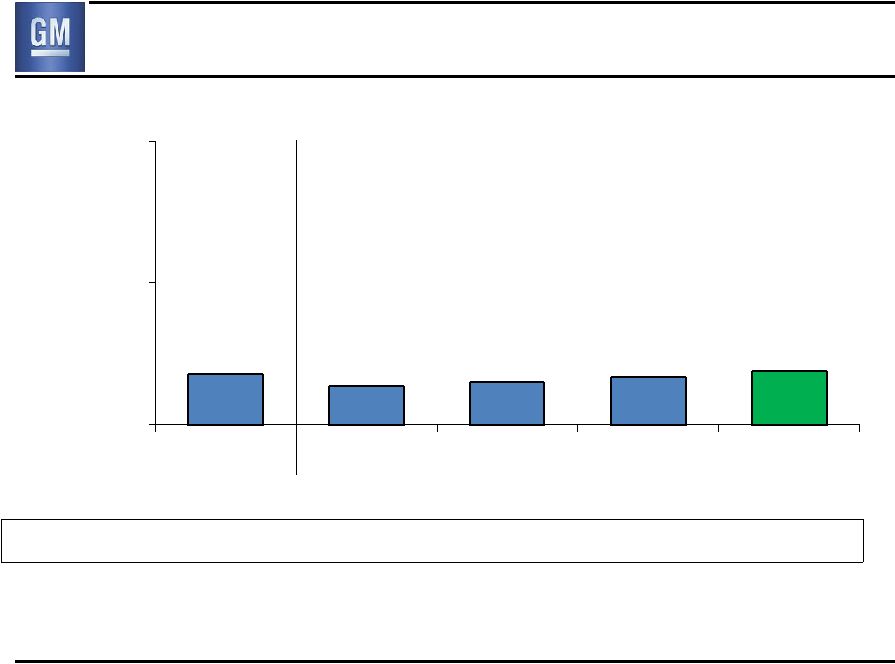
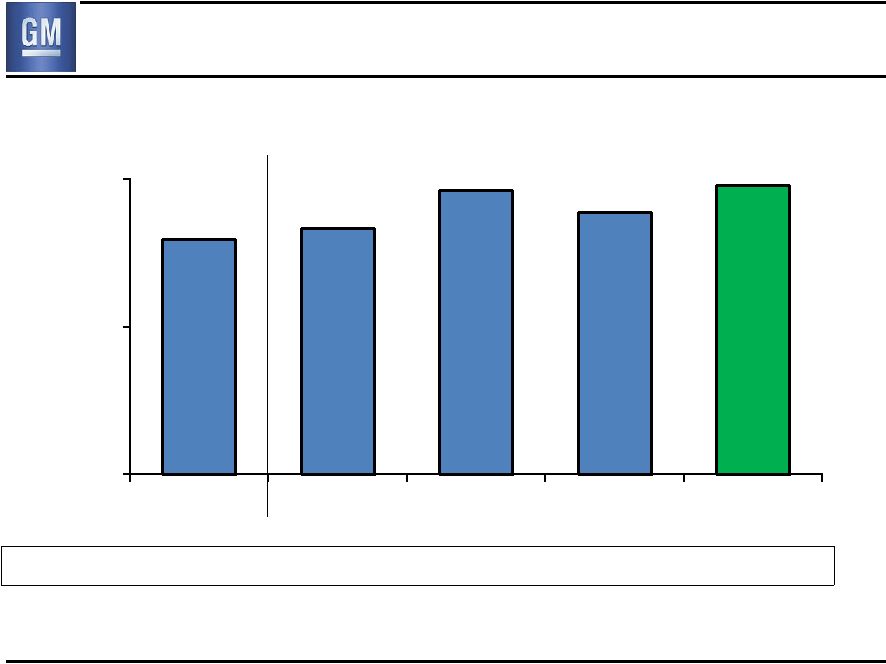 Global Deliveries (000’s) Global Share 11.4% 11.0% 11.6% 11.5% 11.5% GM deliveries & market share include vehicles sold around the world under GM and JV brands, and through GM branded distribution network 9 1,952 1,999 2,155 2,062 2,173 1,000 1,600 2,200 Q4 2009 Q1 2010 Q2 2010 Q3 2010 Q4 2010 |
 GMNA Deliveries (000’s) GMNA Share 19.2% 17.8% 18.7% 17.7% 18.5% U.S. Share 20.2% 18.4% 19.4% 18.3% 19.1% U.S. 4 Brand Share 18.6% 18.1% 19.3% 18.3% 19.1% Chevy, Buick, GMC, Cadillac 564 716 660 685 10 637 587 551 708 658 683 0 400 800 Q4 2009 Q1 2010 Q2 2010 Q3 2010 Q4 2010 |
 Key GMNA Performance Indicators Avg. U.S. Retail Incentive, as % of ATP GM (4-Brand) % 13.3 12.2 12.0 10.3 9.7 9.3 9.9 11.2 11.7 12.6 10.7 9.6 9.6 9.4 10.4 12.6 GM vs. Ind. (GM % / Ind. %) 1.40 1.29 1.20 1.06 0.93 0.85 0.95 1.03 1.10 1.12 1.01 0.95 1.02 0.97 1.00 1.26 Share $/Unit U.S. 4-Brand Share U.S. Total Share Avg. GM U.S. Retail Incentive (4-Brands) Note: Incentive & ATP Information Based on J.D. Power and Associates Power Information Network data Jan 2011 11 2,500 3,000 3,500 4,000 4,500 5,000 5,500 6% 8% 10% 12% 14% 16% 18% 20% 22% Q4 2009 Q1 2010 Q2 2010 Q3 2010 Q4 2010 |
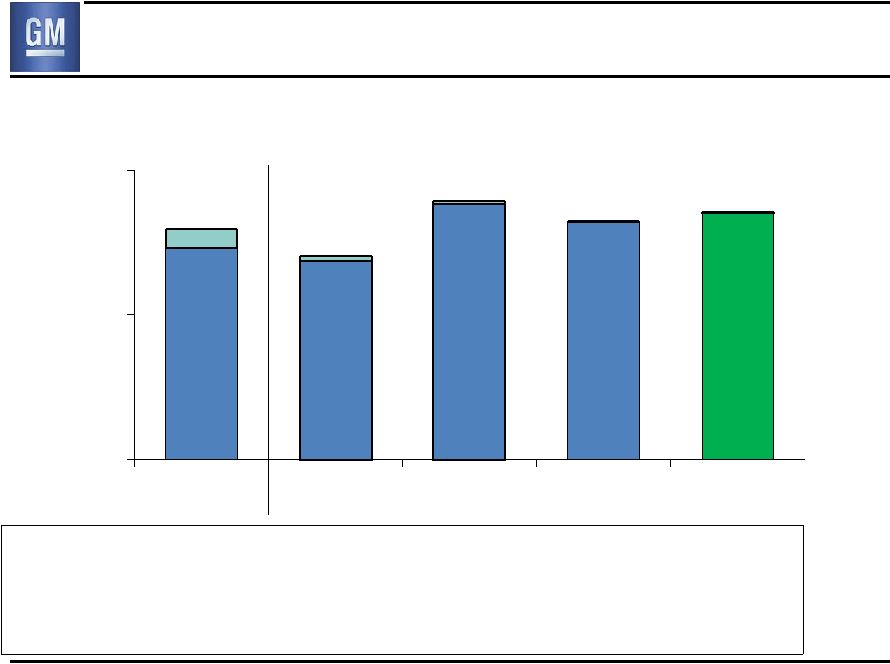
 GMNA Net Revenue ($B) Production (000’s) 616 668 731 707 703 U.S. Dealer Inv (000’s) 385 428 438 478 511 12 18.3 19.3 20.3 21.5 22.0 0 12 24 Q4 2009 Q1 2010 Q2 2010 Q3 2010 Q4 2010 |
 GMNA Earnings Before Interest & Taxes ($B) 13 Q4 2009 Q1 2010 Q2 2010 Q3 2010 Q4 2010 (3.4 ) (3.5) 1.2 1.6 2.1 0.8 (1.0) 0.0 1.0 2.0 3.0 |
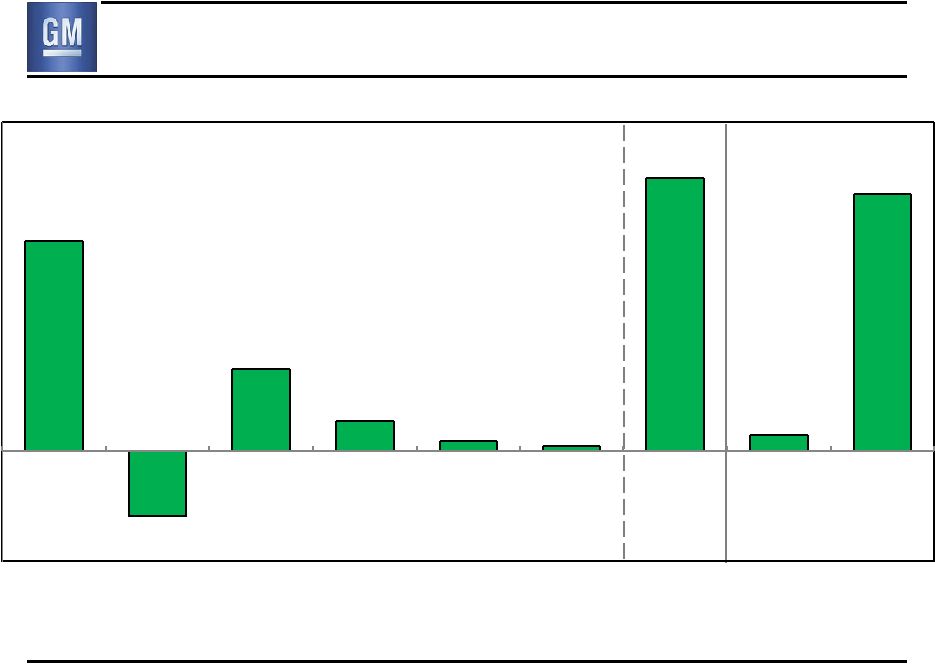
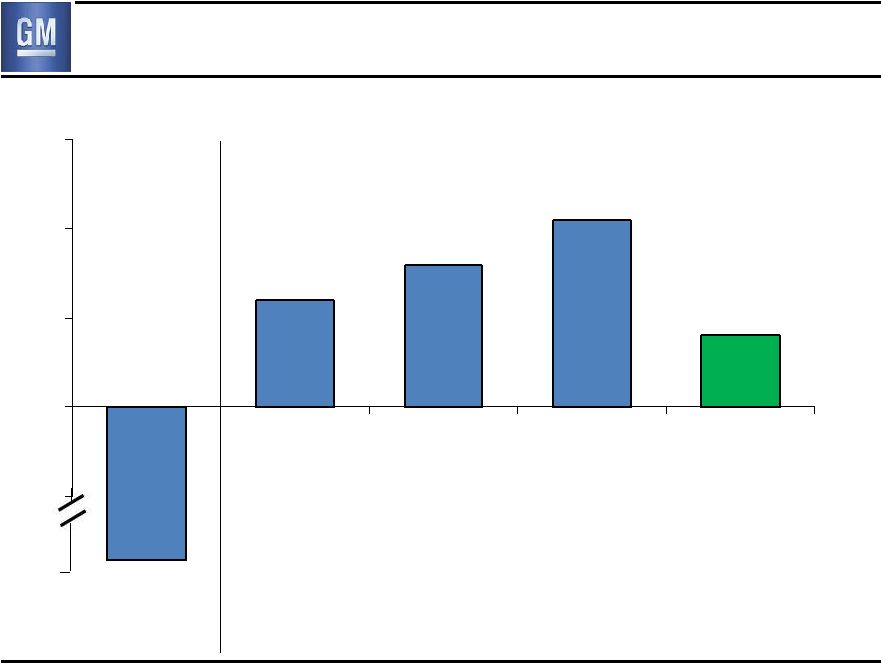
 GMNA EBIT – Q4 2009 vs. Q4 2010 ($B) Q4 2009 EBIT Q4 2010 EBIT $4.2B Improvement 14 (3.4) 0.9 0.1 2.9 0.3 0.8 Volume/Mix Price Cost Other |
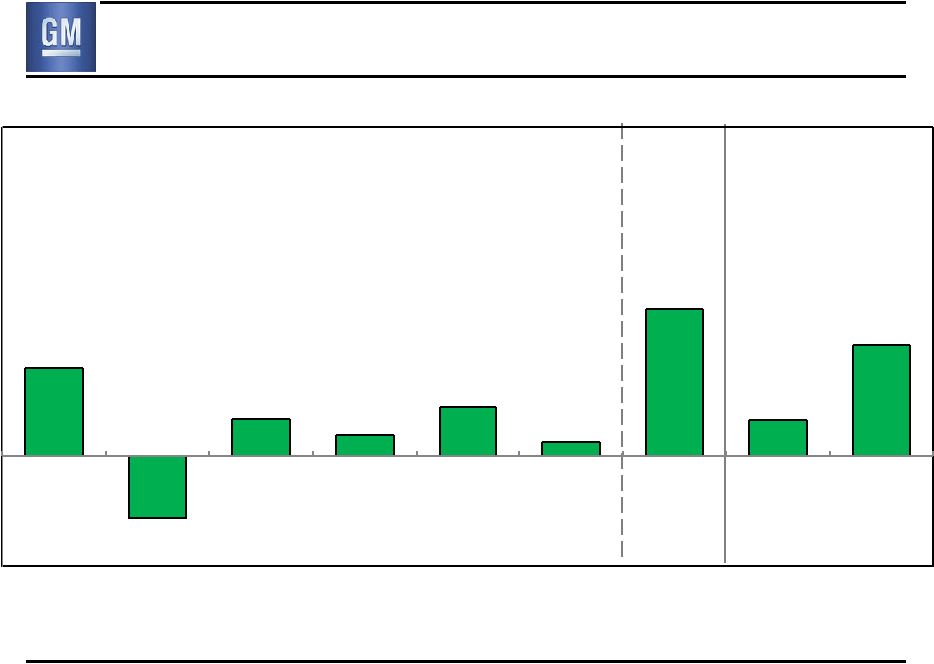
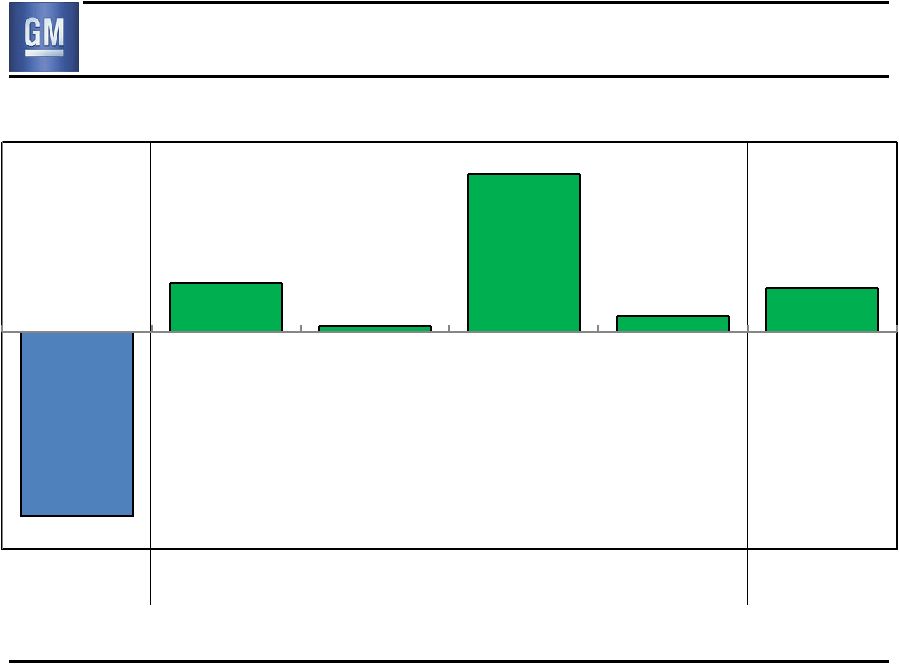
 GMNA EBIT – Q3 2010 vs. Q4 2010 ($B) Q3 2010 EBIT Q4 2010 EBIT $1.3B Reduction 15 2.1 (0.4) (0.3) (0.6) 0.0 0.8 Volume/Mix Price Cost Other |
 GME Deliveries (000’s) GME Share 8.2% 8.5% 8.8% 8.9% 9.0% Germany Share 8.8% 8.2% 8.0% 8.5% 9.0% U.K. Share 11.2% 12.0% 13.8% 12.6% 12.4% Chevrolet GME Excl. Chevrolet GME deliveries and market share include unit sales of Chevrolets produced by GMIO and delivered to customers in GME. Revenue and associated costs of these unit sales are reported by GMIO 16 271 298 315 273 298 107 106 128 115 128 0 400 800 Q4 2009 Q1 2010 Q2 2010 Q3 2010 Q4 2010 404 443 388 426 378 |
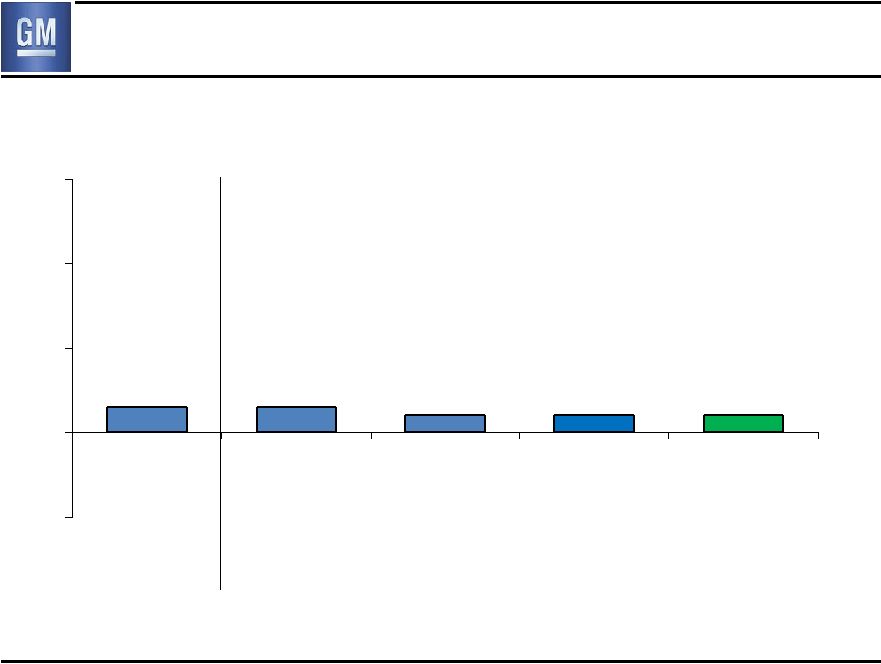
 GME Net Revenue Production (000’s) 256 305 331 286 313 ($B) 17 6.2 5.5 6.0 5.7 6.9 0 12 24 Q4 2009 Q1 2010 Q2 2010 Q3 2010 Q4 2010 |
 GME Earnings Before Interest & Taxes ($B) 18 (0.8) (0.5) (0.2) (0.6) (0.6) (1.0) 0.0 1.0 2.0 3.0 Q4 2009 Q1 2010 Q2 2010 Q3 2010 Q4 2010 |
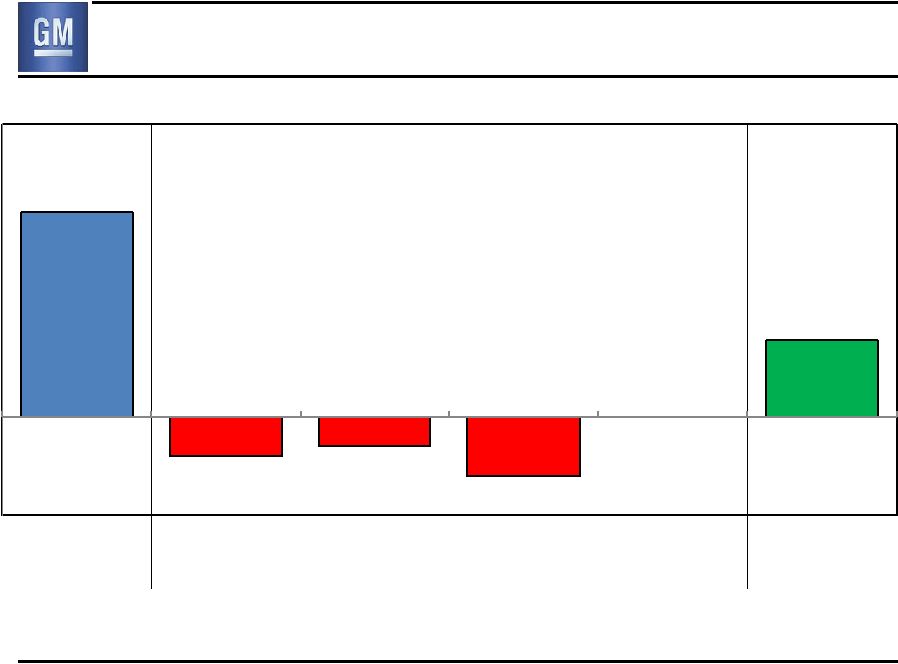
 GME EBIT – Q4 2009 vs. Q4 2010 ($B) Q4 2009 EBIT Q4 2010 EBIT $0.2B Improvement 19 (0.8) 0.2 0.0 (0.3) 0.3 (0.6) Volume/Mix Price Cost Other |
 GMIO Deliveries (000’s) GMIO Share 8.9% 8.8% 9.0% 8.7% 8.6% China Share 13.2% 13.3% 13.1% 13.6% 11.4% India Share 3.7% 4.2% 4.0% 3.0% 3.5% China GMIO Excl. China 20 Note: Prior results have been adjusted to reflect the breakout of GMSA separately 179 166 179 178 200 534 624 586 567 576 0 400 800 Q4 2009 Q1 2010 Q2 2010 Q3 2010 Q4 2010 790 765 745 776 713 |
 GMIO Net Revenue ($B) Production (000’s) Consolidated 229 248 268 235 265 Joint Venture 592 654 697 631 747 Total 821 902 965 866 1,012 21 Note: Prior results have been adjusted to reflect the breakout of GMSA separately 5.1 5.0 5.3 5.1 6.1 0 12 24 Q4 2009 Q1 2010 Q2 2010 Q3 2010 Q4 2010 |
 GMIO Earnings Before Interest & Taxes ($B) 0.9 0.5 0.5 Equity Income 0.3 22 0.4 Note: Prior results have been adjusted to reflect the breakout of GMSA separately 0.5 0.3 0.4 0.4 0.3 0.2 (1.0) 0.0 1.0 2.0 3.0 Q4 2009 Q1 2010 Q2 2010 Q3 2010 Q4 2010 |
 GMIO EBIT – Q4 2009 vs. Q4 2010 ($B) Q4 2009 EBIT Q4 2010 EBIT $0.1B Reduction 23 Note: Prior results have been adjusted to reflect the breakout of GMSA separately 0.4 0.1 0.1 (0.4) 0.1 0.3 Volume/Mix Price Cost Other |
 GMSA Deliveries (000’s) GMSA Share 19.6% 20.7% 19.5% 19.8% 19.6% Brazil Share 18.7% 19.9% 18.4% 18.3% 18.4% Brazil GMSA Other 24 67 85 85 99 100 157 156 146 169 186 0 400 800 Q4 2009 Q1 2010 Q2 2010 Q3 2010 Q4 2010 241 231 268 286 224 |
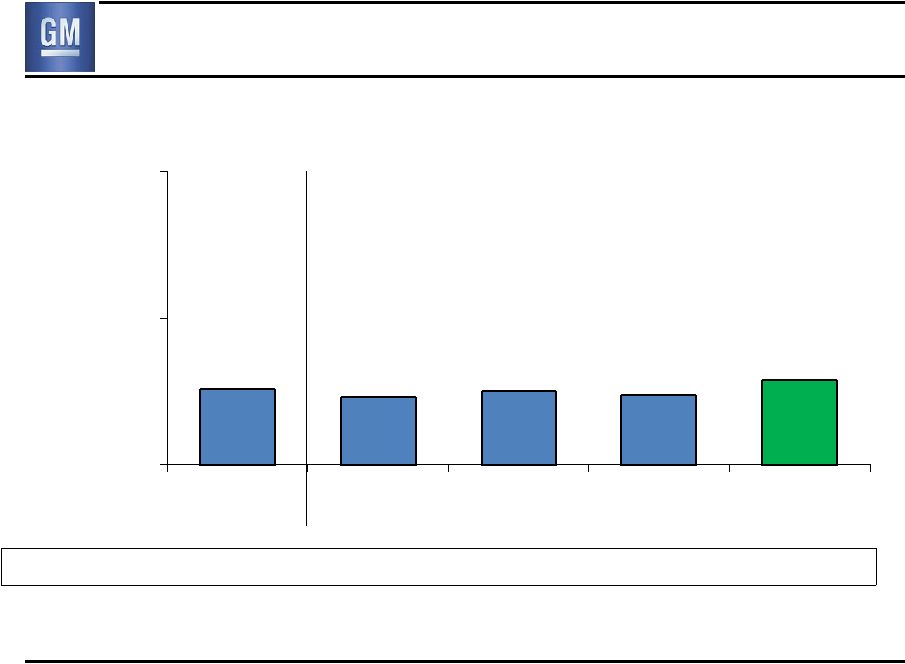
 GMSA Net Revenue ($B) Production (000’s) 229 210 230 245 241 25 4.3 3.3 3.6 4.0 4.5 0 12 24 Q4 2009 Q1 2010 Q2 2010 Q3 2010 Q4 2010 |
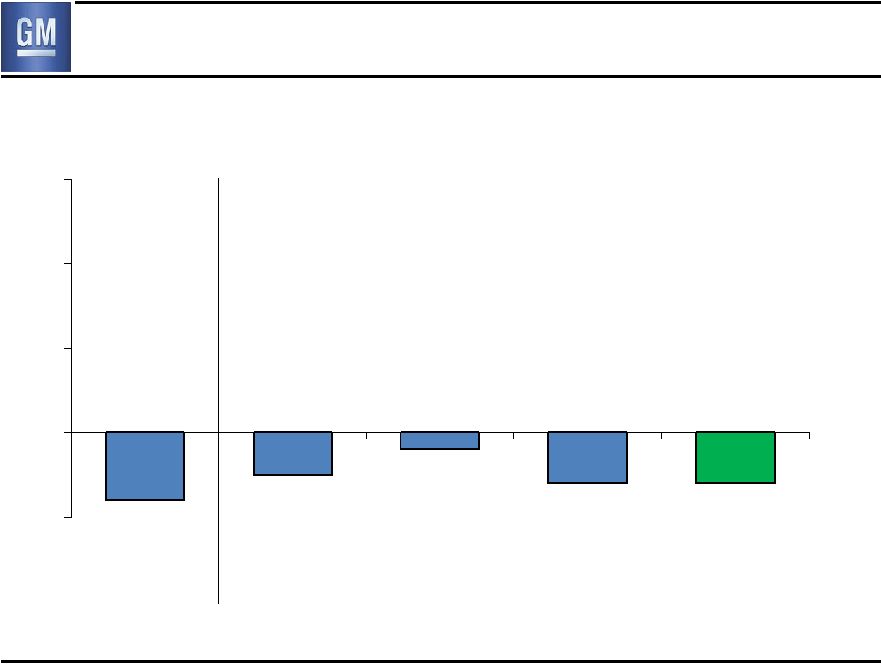
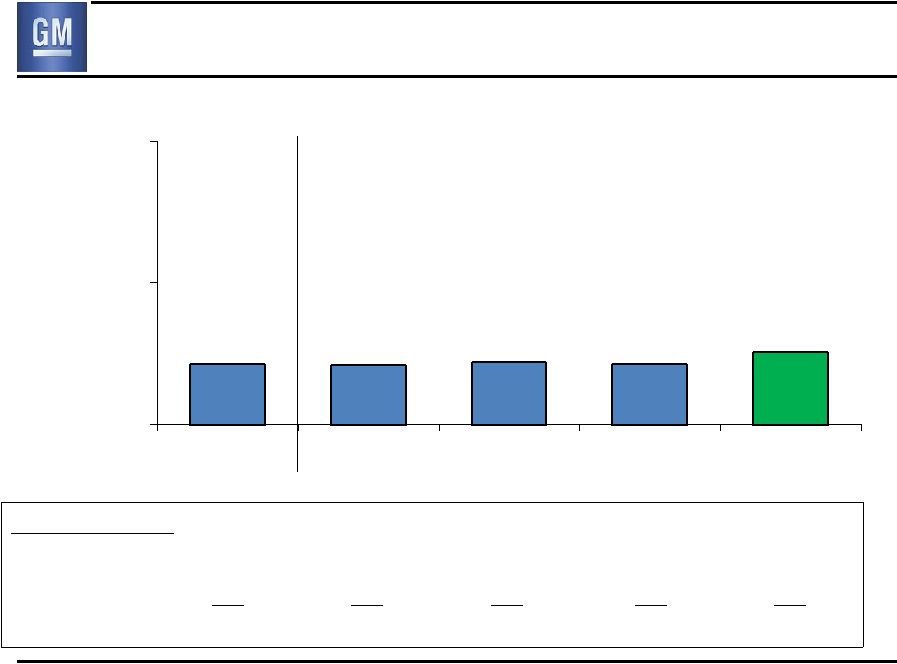
 GMSA Earnings Before Interest & Taxes ($B) 26 0.3 0.3 0.2 0.2 0.2 (1.0) 0.0 1.0 2.0 3.0 Q4 2009 Q1 2010 Q2 2010 Q3 2010 Q4 2010 |
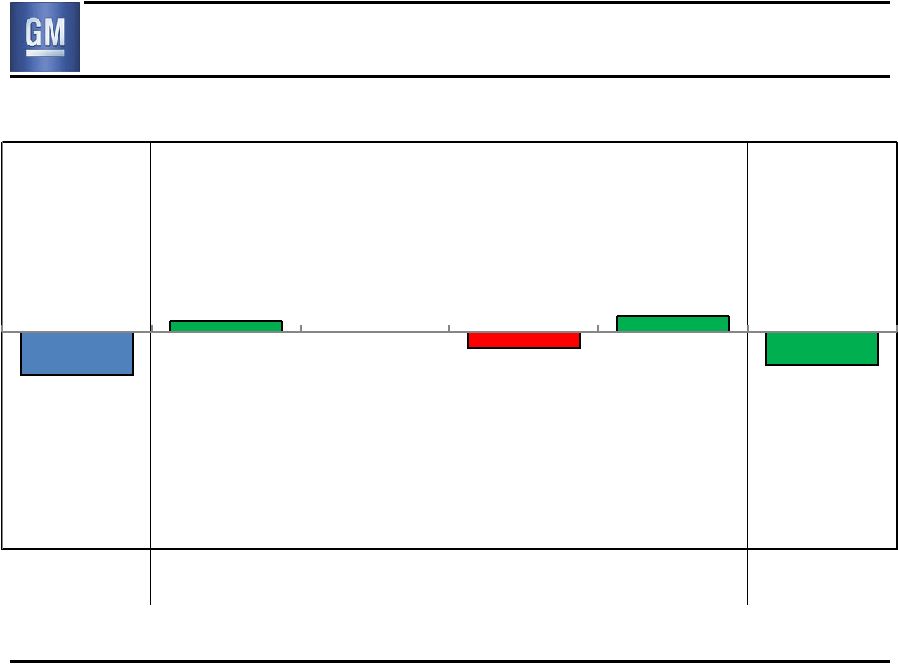
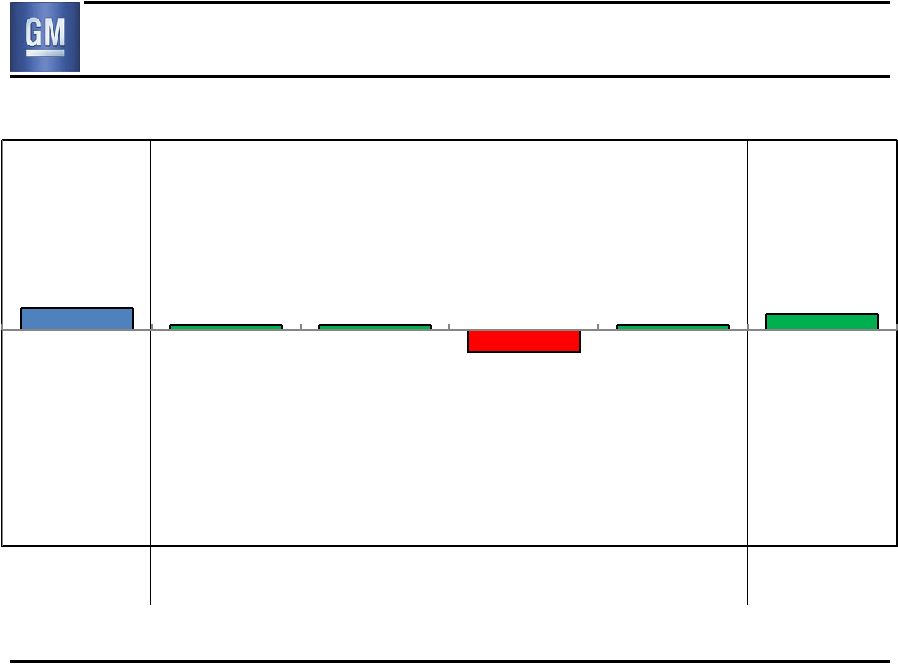
 GMSA EBIT – Q4 2009 vs. Q4 2010 ($B) Q4 2009 EBIT Q4 2010 EBIT $0.1B Reduction 27 0.3 0.1 0.1 (0.2) (0.1) 0.2 Volume/Mix Price Cost Other |
 Automotive Free Cash Flow 28 ($B) Q4 2010 CY 2010 Net Income Attr. Common Stockholders 0.5 4.7 Add-back Non-Controlling Interests & Preferred Dividends 1.0 1.8 Deduct Non-Auto (GM Financial) (0.1) (0.1) Automotive Net Income 1.4 6.4 Depreciation / Amortization 1.7 6.9 Working Capital 0.7 (0.6) Pension / (OPEB) Expense Net of Cash Payments (0.4) (1.3) Voluntary U.S. Pension Plan Contribution (4.0) (4.0) Other (1.1) (0.8) Automotive Net Cash Provided/(Used) Operating Activities (1.7) 6.6 Capital Expenditures (1.1) (4.2) Automotive Free Cash Flow (2.8) 2.4 |
 Key Automotive Balance Sheet Items * Includes Canadian HC Trust Restricted Cash 29 ** Excludes U.S. Non-Qualified plan PBO of $0.9 billion & ~ $2B stock contribution completed 1/13/11 ($B) Dec. 31 2009 Dec. 31 2010 Cash & marketable securities * 36.2 27.6 Available Credit Facilities 0.6 5.9 Available Liquidity * 36.9 33.5 Key Obligations: Debt 15.8 4.6 Series A Preferred Stock 7.0 5.5 U.S. Pension Underfunded Status** 16.2 11.5 Unfunded OPEB 9.6 9.9 |
 12/31/09 Funded Status Service & Interest Cost Asset Returns Discount Rate Cash Contributions 12/31/10 Funded Status (5.2) 11.6 4.0 U.S. Pension Funded Status – CY2010 vs. CY2009 Note: Funded status excludes U.S. Non-Qualified plan PBO of $0.9 billion & ~ $2B stock contribution completed 1/13/11 30 (16.2) (5.7) (11.5) Funded Status 84% Funded Status 89% ($B) |
 GM Financial – Key Metrics 31 * Q4 2009 not included in consolidated GM results, does not reflect purchase accounting and is not directly comparable to Q4 2010. ($M) Q4 2010 Memo: Q4 2009* Earnings Before Tax 129 72 Total Originations 935 379 GM new vehicles as % of total 18.1% 10.8% Finance Receivables 8,648 9,305 Delinquencies (>30 days) 8.6% 11.4% Annualized net charge-offs as % of avg. receivables 5.5% 8.9% |
 Status of Material Weakness 32 After assessing remediation efforts put in place, the management team and Audit Committee of the Board of Directors concluded that as of Dec 31, 2010: – Material weakness regarding financial reporting process no longer exists – Disclosure controls and procedures effective – Internal control over financial reporting effective |
 Key Messages • CY 2010 Net Income to Common Stockholders of $4.7B & Automotive Free Cash Flow of $6.4B (excluding $4B Q4 pension contribution) • 2011 key areas of focus – Launch great products – Drive improved business results – Technology – Continue to improve balance sheet • Build on our progress and generate momentum in marketplace – Expect first quarter to be strong start 33 |
 General Motors Company Select Supplemental Financial Information |
 EBIT Walk to Net Income Attr. Common Stockholders S2 Note: EBIT includes GM Financial on an Earnings Before Tax (EBT) basis ($B) Q4 2009 Q4 2010 CY 2010 GMNA (3.4) 0.8 5.7 GME (0.8) (0.6) (1.8) GMIO 0.4 0.3 2.3 GMSA 0.3 0.2 0.8 Corp & Elims (0.5) 0.4 0.3 GMF N/A 0.1 0.1 Total EBIT (4.0) 1.3 7.5 Interest Expense / (Income) 0.3 0.1 0.6 Income Tax Expense / (Benefit) (0.9) (0.2) 0.7 Net Income Attr. Stockholders (3.4) 1.4 6.2 Dividends on Preferred Stock (0.1) 0.9 1.5 Net Income Attr. Common Stockholders (3.5) 0.5 4.7 |
 Reconciliation of 2010 EBIT-Adj. S3 Note: Results may not foot due to rounding Note: Q4 &CY EBIT & EBIT-Adj. includes GM Financial on an Earnings Before Tax (EBT) basis ($B) Q1 2010 Q2 2010 Q3 2010 Q4 2010 CY 2010 Net Income Attr. Common Stockholders 0.9 1.3 2.0 0.5 4.7 Add Back: Dividends on Preferred Stock 0.2 0.2 0.2 0.9 1.5 Interest Expense / (Income) 0.2 0.1 0.1 0.1 0.6 Income Tax Expense / (Benefit) 0.5 0.4 0.0 (0.2) 0.7 Earnings Before Interest & Taxes (EBIT) 1.8 2.0 2.3 1.3 7.5 Less Adjustments: - Gain on Saab Sale 0.1 - - - 0.1 - Gain on VEBA Note - - - 0.2 0.2 - Gain on Nexteer Sale & Purchase of Strasbourg - - - 0.1 0.1 Total Adjustments 0.1 0.0 0.0 0.3 0.4 EBIT – Adj. 1.7 2.0 2.3 1.0 7.0 |
 S4 Note: Results may not foot due to rounding Reconciliation of Q4 2009 EBIT-Adj. ($B) Q4 2009 Net Income Attr. Common Stockholders (3.5) Add Back: Dividends on Preferred Stock 0.1 Interest Expense / (Income) 0.3 Income Tax Expense / (Benefit) (0.9) Auto Earnings Before Interest & Taxes (EBIT) (4.0) Less Adjustments: - VEBA Settlement (2.6) - GMAC Investment Impairment (0.3) - Delphi Related (0.1) - CAMI Debt Ext. (0.1) Total Adjustments (3.0) Auto EBIT – Adj. (1.0) |
 Restructuring Excluded From Adjustments S5 ($B) Q1 2010 Q2 2010 Q3 2010 Q4 2010 CY 2010 GMNA – Dealer Related 0.0 0.0 0.0 0.0 0.0 GMNA – Non-Dealer Related 0.1 0.0 0.0 0.2 0.3 Total GMNA 0.1 0.0 0.0 0.2 0.3 Total GME (0.3) (0.2) (0.1) (0.1) (0.7) Total GMIO 0.0 0.0 0.0 0.0 0.0 Total GMSA 0.0 0.0 0.0 0.0 0.0 Total (0.2) (0.2) (0.1) 0.1 (0.4) |
 Operating Income Walk to EBIT- Adj S6 Note: Q4 &CY 2010 EBIT & EBIT-Adj. includes GM Financial on an Earnings Before Tax (EBT) basis ($B) Q4 2009 Q1 2010 Q2 2010 Q3 2010 Q4 2010 Operating Income (3.9) 1.2 1.8 1.9 0.3 Equity Income 0.3 0.4 0.4 0.4 0.3 Non-Controlling Interests (0.2) (0.1) (0.1) (0.1) (0.1) Non-Operating Income/(Expense) (0.2) 0.3 (0.1) 0.1 0.8 Earnings Before Interest & Taxes (EBIT) (4.0) 1.8 2.0 2.3 1.3 Less Adjustments (3.0) 0.1 0.0 0.0 0.3 EBIT- Adj. (1.0) 1.7 2.0 2.3 1.0 |
 Reconciliation of Automotive Free Cash Flow S7 ($B) Q4 2010 CY 2010 Net cash provided by operating activities (1.5) 6.8 Less net cash provided by operating activities-GM Financial 0.2 0.2 Automotive Net Cash Provided/(Used) Operating Activities (1.7) 6.6 Capital expenditures (1.1) (4.2) Automotive Free Cash Flow (2.8) 2.4 |