 |
Exhibit 99.2
General Motors Company
Q1 2011 Results
May 5, 2011
 |
Forward Looking Statements
In this presentation and in related comments by our management, our use of the words “expect,” “anticipate,” “possible,” “potential,” “target,” “believe,” “commit,” “intend,” “continue,” “may,” “would,” “could,” “should,” “project,” “projected,” “positioned” or similar expressions is intended to identify forward looking statements that represent our current judgment about possible future events. We believe these judgments are reasonable, but these statements are not guarantees of any events or financial results, and our actual results may differ materially due to a variety of important factors. Among other items, such factors might include: our ability to realize production efficiencies and to achieve reductions in costs as a result of our restructuring initiatives and labor modifications; our ability to maintain quality control over our vehicles and avoid material vehicle recalls; our suppliers’ ability to deliver parts, systems and components at such times to allow us to meet production schedules; our ability to maintain adequate liquidity and financing sources and an appropriate level of debt, including as required to fund our planned significant investment in new technology; our ability to realize successful vehicle applications of new technology; and our ability to continue to attract new customers, particularly for our new products.
GM’s most recent annual report on Form 10-K and quarterly report on Form 10-Q provides information about these and other factors, which we may revise or supplement in future reports to the SEC.
1
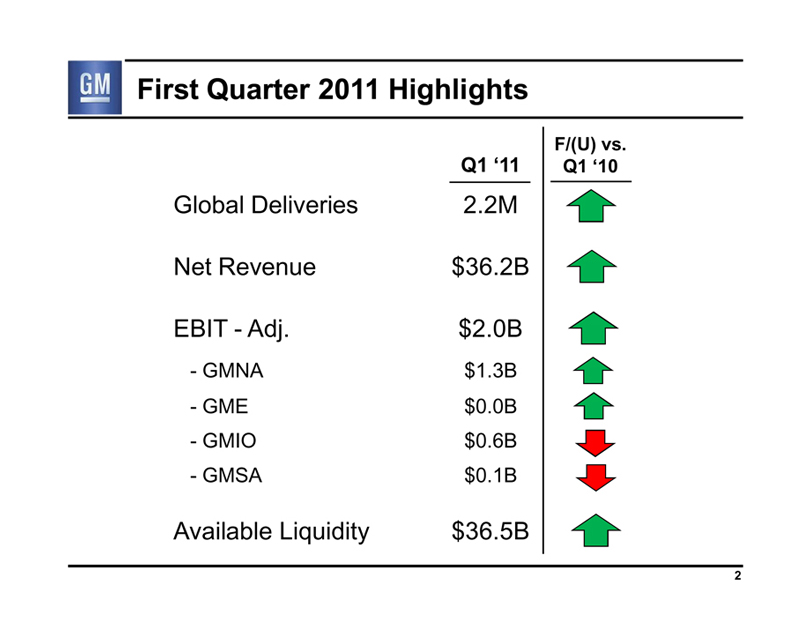 |
First Quarter 2011 Highlights
Q1 ‘11 F/(U) vs. Q1 ‘10
Global Deliveries 2.2M
Net Revenue $36.2B
EBIT - Adj. $2.0B
- GMNA $1.3B
- GME $0.0B
- GMIO $0.6B
- GMSA $0.1B
Available Liquidity $36.5B
2
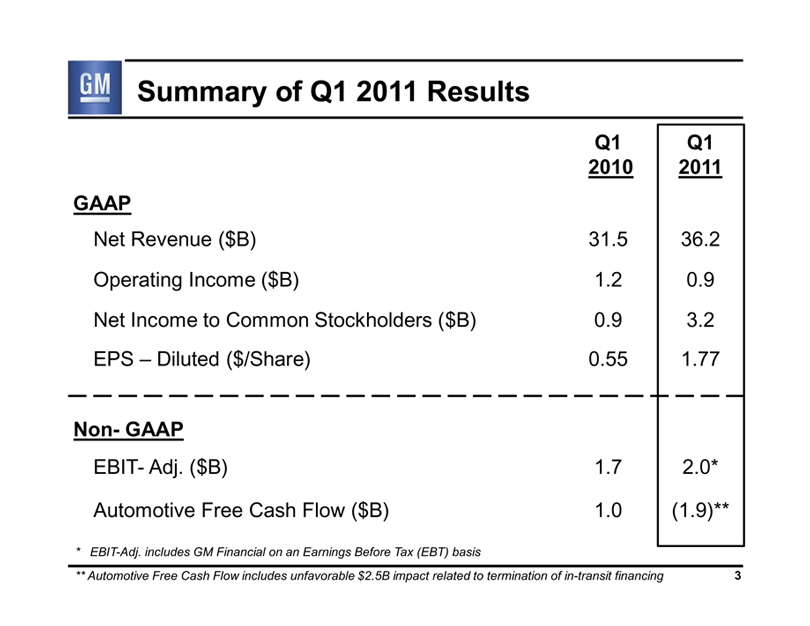 |
Summary of Q1 2011 Results
Q1 2010 Q1 2011
GAAP
Net Revenue ($B) 31.5 36.2
Operating Income ($B) 1.2 0.9
Net Income to Common Stockholders ($B) 0.9 3.2
EPS – Diluted ($/Share) 0.55 1.77
Non- GAAP
EBIT- Adj. ($B) 1.7 2.0*
Automotive Free Cash Flow ($B) 1.0 (1.9)**
* EBIT-Adj. includes GM Financial on an Earnings Before Tax (EBT) basis
** Automotive Free Cash Flow includes unfavorable $2.5B impact related to termination of in-transit financing
3
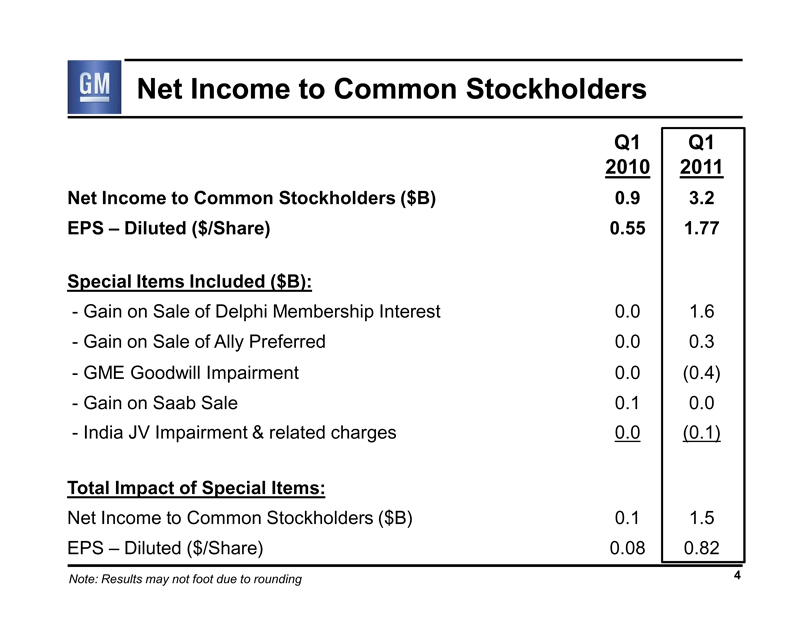 |
Net Income to Common Stockholders
Q1 2010 Q1 2011
Net Income to Common Stockholders ($B) 0.9 3.2
EPS – Diluted ($/Share) 0.55 1.77
Special Items Included ($B):
- Gain on Sale of Delphi Membership Interest 0.0 1.6
- Gain on Sale of Ally Preferred 0.0 0.3
- GME Goodwill Impairment 0.0 (0.4)
- Gain on Saab Sale 0.1 0.0
- India JV Impairment & related charges 0.0 (0.1)
Total Impact of Special Items:
Net Income to Common Stockholders ($B) 0.1 1.5
EPS – Diluted ($/Share) 0.08 0.82
Note: Results may not foot due to rounding
4
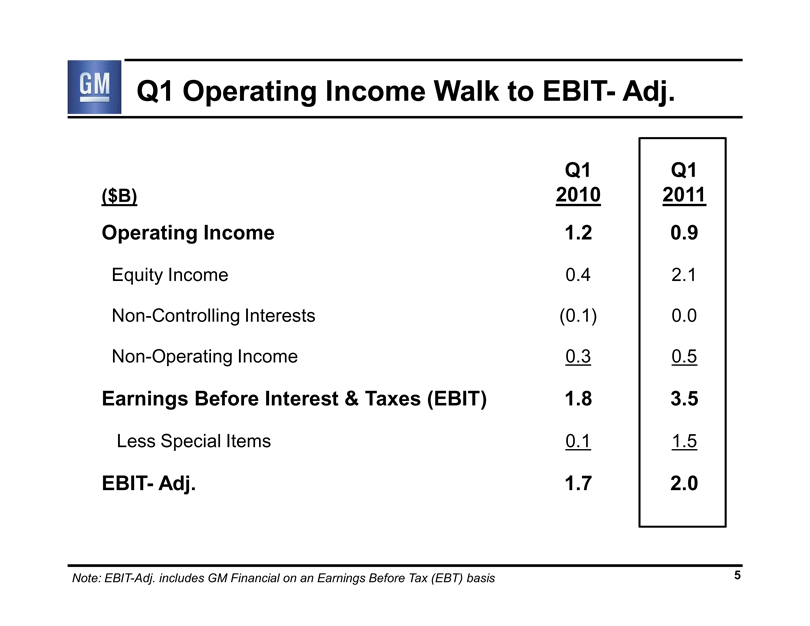 |
Q1 Operating Income Walk to EBIT- Adj.
($B) Q1 2010 Q1 2011
Operating Income 1.2 0.9
Equity Income 0.4 2.1
Non-Controlling Interests (0.1) 0.0
Non-Operating Income 0.3 0.5
Earnings Before Interest & Taxes (EBIT) 1.8 3.5
Less Special Items 0.1 1.5
EBIT- Adj. 1.7 2.0
Note: EBIT-Adj. includes GM Financial on an Earnings Before Tax (EBT) basis
5
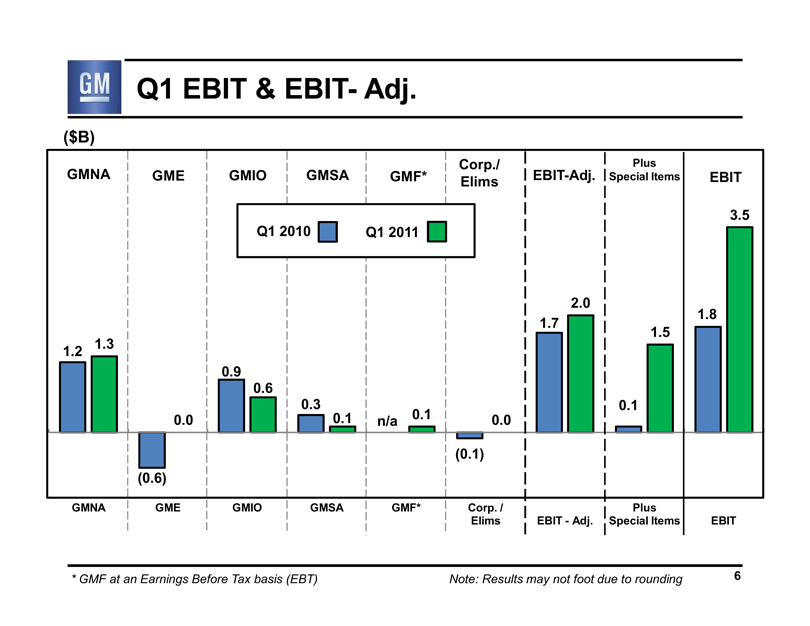 |
Q1 EBIT & EBIT- Adj.
($B)
GMNA GME GMIO GMSA GMF* Corp./Elims EBIT-Adj. Plus Special Items EBIT
Q1 2010 Q1 2011
1.2 1.3 0.0 0.9 0.6 0.3 0.1 n/a 0.1 0.0 1.7 2.0 0.1 1.5 1.8 3.5
0.6 0.1
GMNA GME GMIO GMSA GMF* Corp. / Elims EBIT - Adj. Plus Special Items EBIT
* GMF at an Earnings Before Tax basis (EBT) Note: Results may not foot due to rounding
6
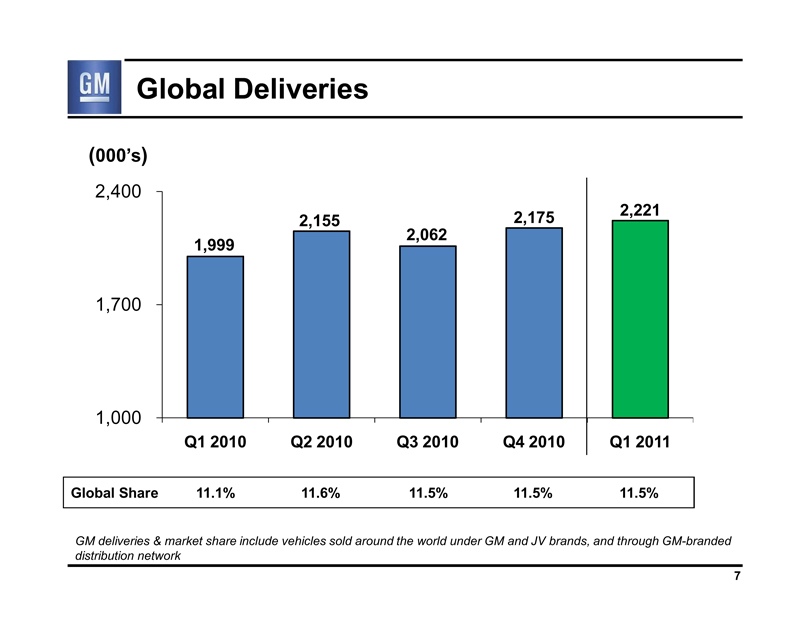 |
Global Deliveries
(000’s)
2,400 1,999 2,155 2,062 2,175 2,221
1,700
1,000
Q1 2010 Q2 2010 Q3 2010 Q4 2010 Q1 2011
Global Share 11.1% 11.6% 11.5% 11.5% 11.5%
GM deliveries & market share include vehicles sold around the world under GM and JV brands, and through GM-branded distribution network
7
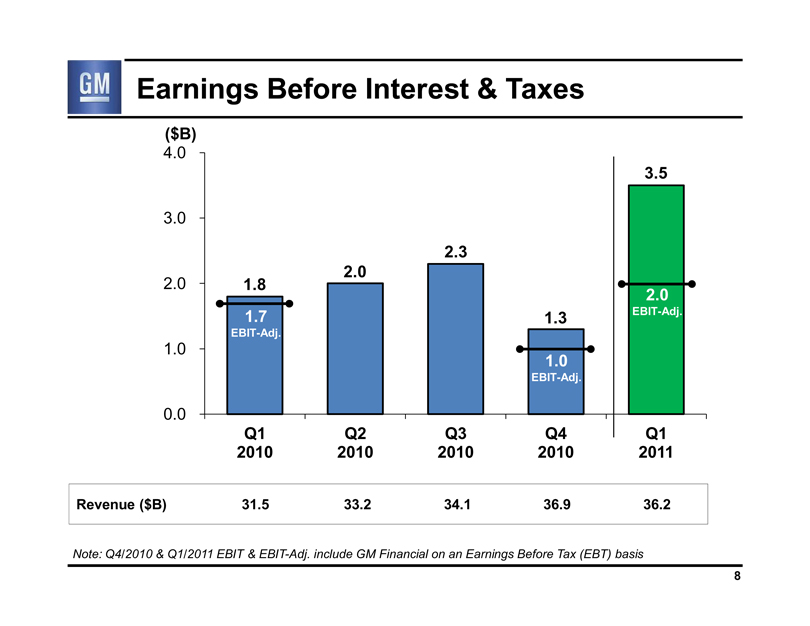 |
Earnings Before Interest & Taxes
($B)
4.0
3.5
3.0
2.3
2.0
2.0 1.8
2.0
1.7 1.3 EBIT-Adj.
EBIT-Adj.
1.0
1.0
EBIT-Adj.
0.0
Q1 Q2 Q3 Q4 Q1
2010 2010 2010 2010 2011
Revenue ($B) 31.5 33.2 34.1 36.9 36.2
Note: Q4/2010 & Q1/2011 EBIT & EBIT-Adj. include GM Financial on an Earnings Before Tax (EBT) basis
8 |
|
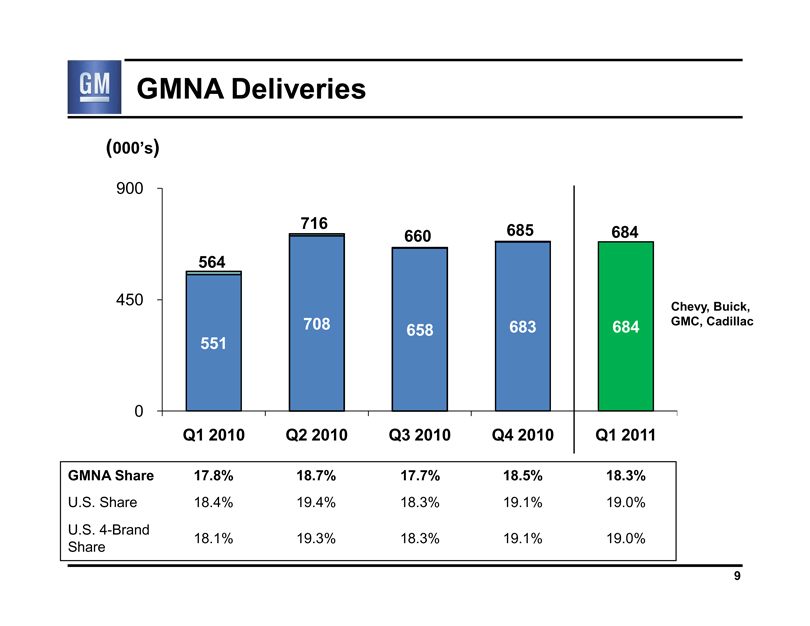 |
GMNA Deliveries
(000’s)
900
716 685
660 684
564
450 Chevy, Buick,
708 658 683 684 GMC, Cadillac
551
0
Q1 2010 Q2 2010 Q3 2010 Q4 2010 Q1 2011
GMNA Share 17.8% 18.7% 17.7% 18.5% 18.3%
U.S. Share 18.4% 19.4% 18.3% 19.1% 19.0%
U.S. 4-Brand Share
18.1% 19.3% 18.3% 19.1% 19.0%
9
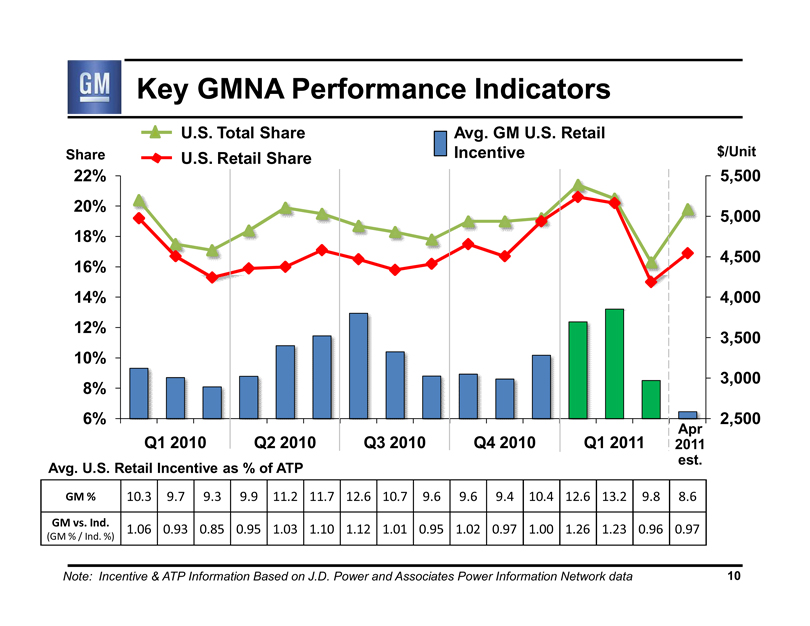 |
Key GMNA Performance Indicators
U.S. Total Share Avg. GM U.S. Retail
Share U.S. Retail Share Incentive $/Unit
22% 5,500
20%
5,000
18%
4,500
16%
14% 4,000
12%
3,500
10%
3,000
8%
6% 2,500
Apr
Q1 2010 Q2 2010 Q3 2010 Q4 2010 Q1 2011 2011
est.
Avg. U.S. Retail Incentive as % of ATP
GM % 10.3 9.7 9.3 9.9 11.2 11.7 12.6 10.7 9.6 9.6 9.4 10.4 12.6 13.2 9.8 8.6
GM vs. Ind. 1.06 0.93 0.85 0.95 1.03 1.10 1.12 1.01 0.95 1.02 0.97 1.00 1.26 1.23 0.96 0.97
(GM % / Ind. %)
Note: Incentive & ATP Information Based on J.D. Power and Associates Power Information Network data 10
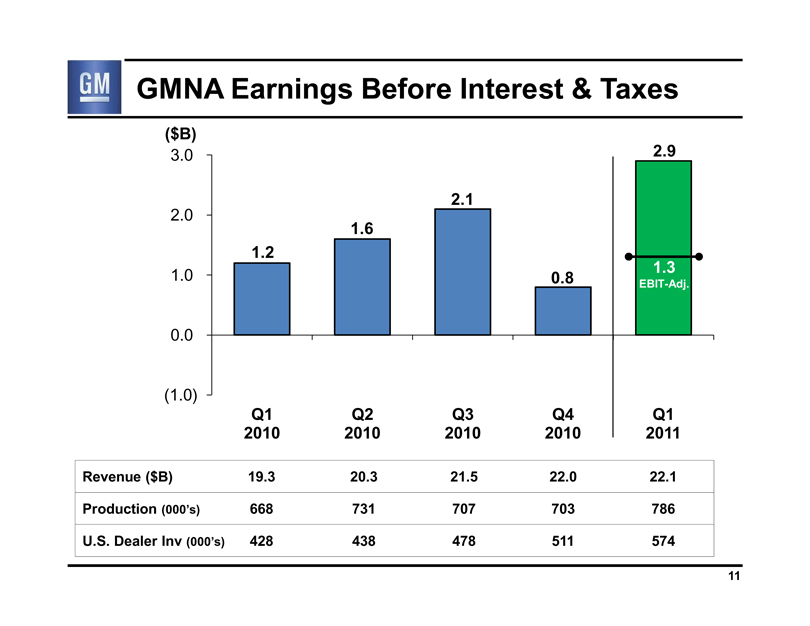 |
GMNA Earnings Before Interest & Taxes
($B)
3.0 2.9
2.1
2.0
1.6
1.2
1.0 0.8 1.3
EBIT-Adj.
0.0
(1.0)
Q1 Q2 Q3 Q4 Q1
2010 2010 2010 2010 2011
Revenue ($B) 19.3 20.3 21.5 22.0 22.1
Production (000’s) 668 731 707 703 786
U.S. Dealer Inv (000’s) 428 438 478 511 574
11
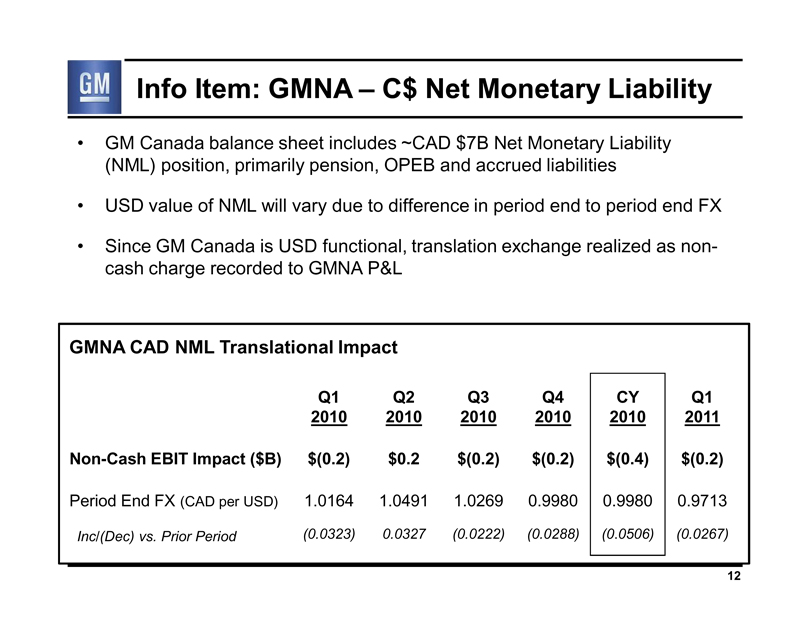 |
Info Item: GMNA – C$ Net Monetary Liability
GM Canada balance sheet includes ~CAD $7B Net Monetary Liability (NML) position, primarily pension, OPEB and accrued liabilities
USD value of NML will vary due to difference in period end to period end FX
Since GM Canada is USD functional, translation exchange realized as non-cash charge recorded to GMNA P&L
GMNA CAD NML Translational Impact
Q1 Q2 Q3 Q4 CY Q1
2010 2010 2010 2010 2010 2011
Non-Cash EBIT Impact ($B) $(0.2) $0.2 $(0.2) $(0.2) $(0.4) $(0.2)
Period End FX (CAD per USD) 1.0164 1.0491 1.0269 0.9980 0.9980 0.9713
Inc/(Dec) vs. Prior Period (0.0323) 0.0327 (0.0222) (0.0288) (0.0506) (0.0267)
12
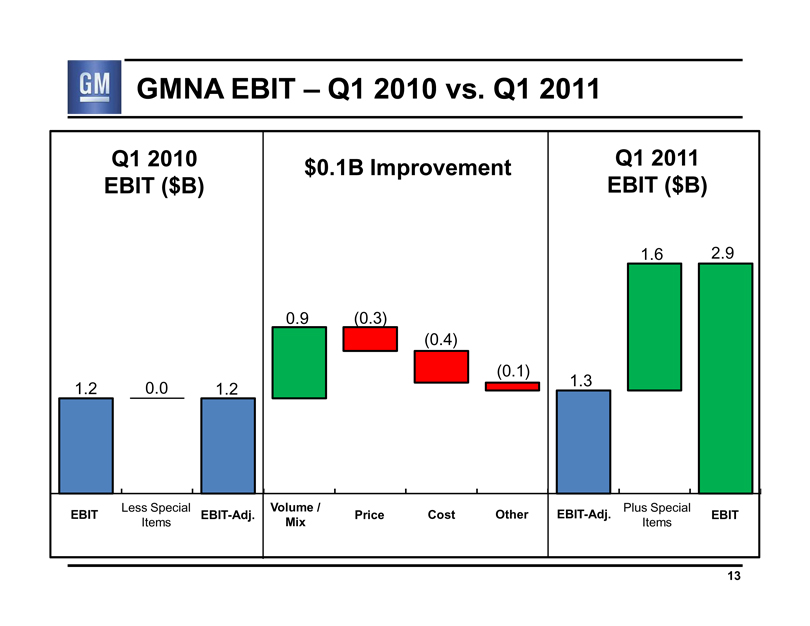 |
GMNA EBIT – Q1 2010 vs. Q1 2011
Q1 2010 EBIT ($B) $0.1B Improvement Q1 2011 EBIT ($B)
1.6 2.9
0.9 (0.3)
(0.4)
(0.1)
1.2 0.0 1.2 1.3
Less Special Volume / Plus Special
EBIT EBIT-Adj. Price Cost Other EBIT-Adj. EBIT
Items Mix Items
13
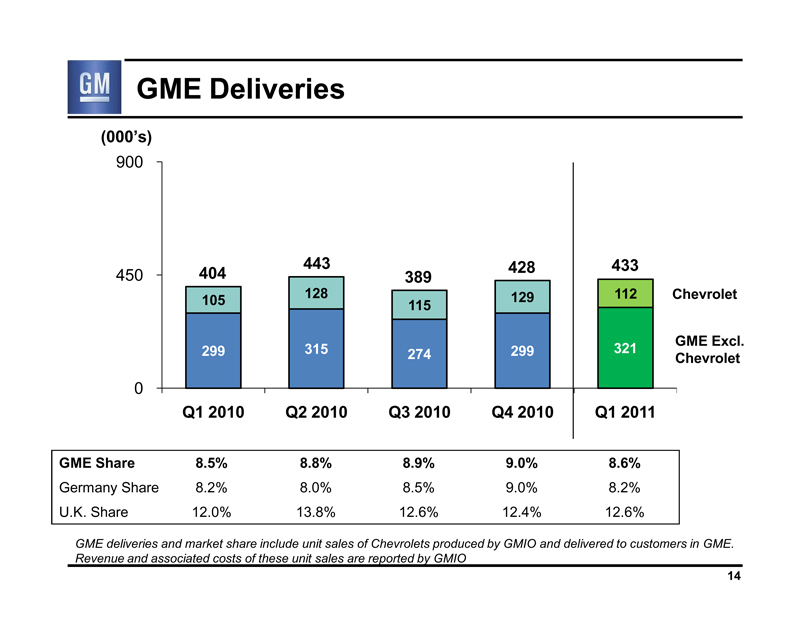 |
GME Deliveries
(000’s)
900
443 428 433
450 404 389
105 128 129 112 Chevrolet
115
GME Excl.
299 315 274 299 321 Chevrolet
0
Q1 2010 Q2 2010 Q3 2010 Q4 2010 Q1 2011
GME Share 8.5% 8.8% 8.9% 9.0% 8.6%
Germany Share 8.2% 8.0% 8.5% 9.0% 8.2%
U.K. Share 12.0% 13.8% 12.6% 12.4% 12.6%
GME deliveries and market share include unit sales of Chevrolets produced by GMIO and delivered to customers in GME. Revenue and associated costs of these unit sales are reported by GMIO
14
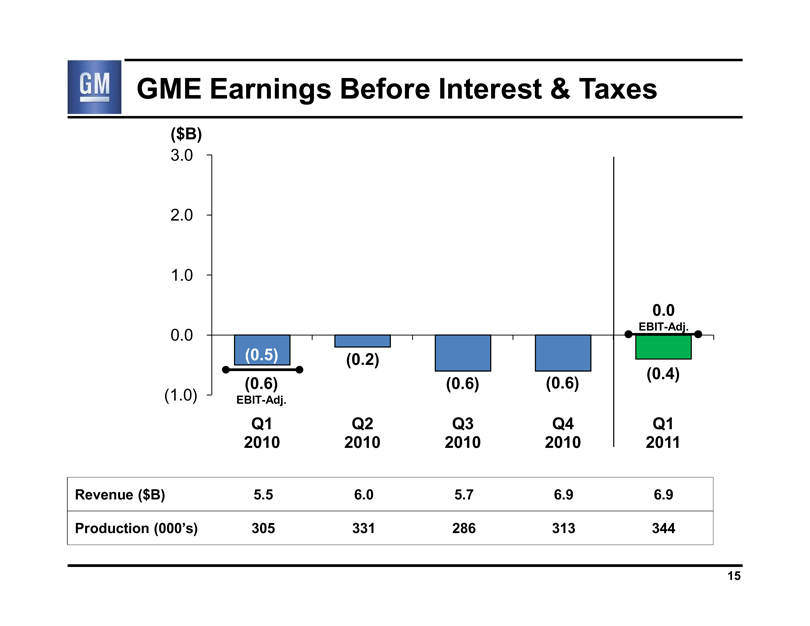 |
GME Earnings Before Interest & Taxes
($B)
3.0
2.0
1.0
0.0
EBIT-Adj.
0.0
(0.5) (0.2)
(0.4)
(0.6) (0.6) (0.6)
(1.0) EBIT-Adj.
Q1 Q2 Q3 Q4 Q1
2010 2010 2010 2010 2011
Revenue ($B) 5.5 6.0 5.7 6.9 6.9
Production (000’s) 305 331 286 313 344
15
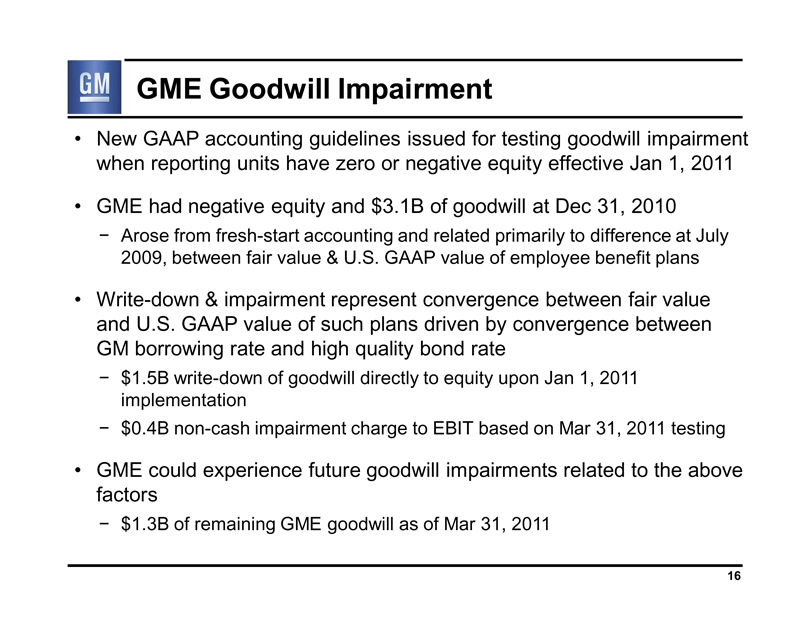 |
GME Goodwill Impairment
New GAAP accounting guidelines issued for testing goodwill impairment when reporting units have zero or negative equity effective Jan 1, 2011
GME had negative equity and $3.1B of goodwill at Dec 31, 2010
– Arose from fresh-start accounting and related primarily to difference at July 2009, between fair value & U.S. GAAP value of employee benefit plans
Write-down & impairment represent convergence between fair value and U.S. GAAP value of such plans driven by convergence between GM borrowing rate and high quality bond rate
– $1.5B write-down of goodwill directly to equity upon Jan 1, 2011 implementation
– $0.4B non-cash impairment charge to EBIT based on Mar 31, 2011 testing
GME could experience future goodwill impairments related to the above factors
– $1.3B of remaining GME goodwill as of Mar 31, 2011
16
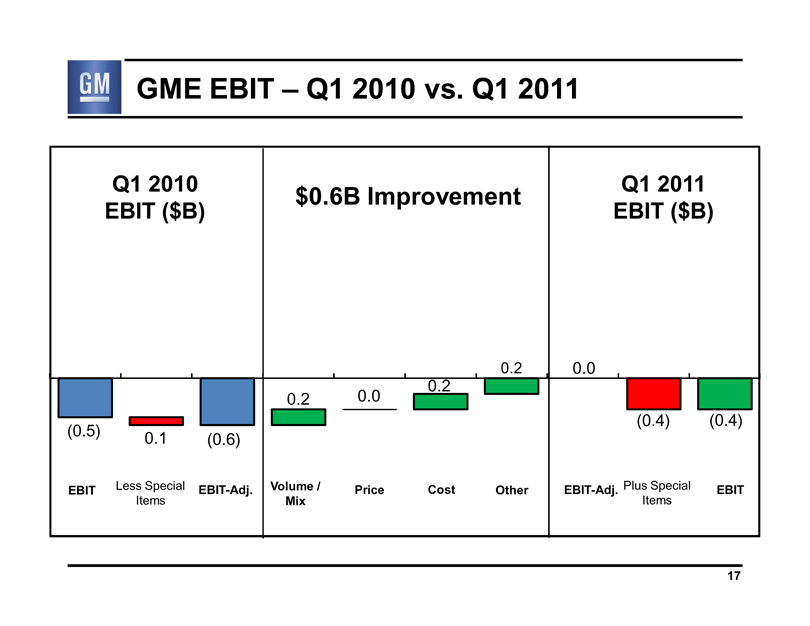 |
GME EBIT — Q1 2010 vs. Q1 2011
Q1 2010 EBIT ($B)
(0.5) 0.1 (0.6)
EBIT Less Special Items EBIT-Adj.
$0.6B Improvement
0.2 0.0 0.2 0.2
Volume / Mix Price Cost Other
Q1 2011 EBIT ($B)
0.0 (0.4) (0.4)
EBIT-Adj. Plus Special Items EBIT
17
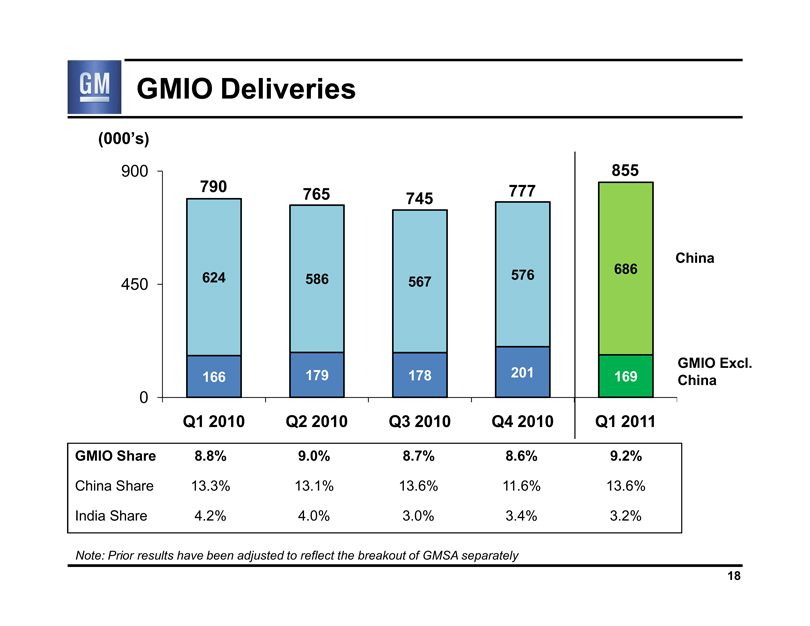 |
GMIO Deliveries
(000’s)
900 855
790 765 745 777
450 624 586 567 576 686 China
0 166 179 178 201 169 GMIO Excl. China
Q1 2010 Q2 2010 Q3 2010 Q4 2010 Q1 2011
GMIO Share 8.8% 9.0% 8.7% 8.6% 9.2%
China Share 13.3% 13.1% 13.6% 11.6% 13.6%
India Share 4.2% 4.0% 3.0% 3.4% 3.2%
Note: Prior results have been adjusted to reflect the breakout of GMSA separately
18
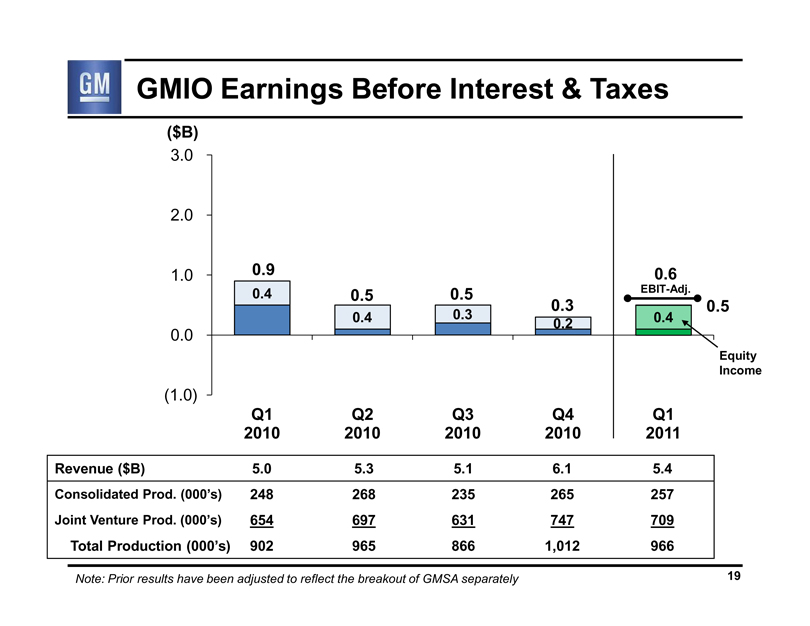 |
GMIO Earnings Before Interest & Taxes
($B)
3.0
2.0
1.0 0.9 0.6
0.4 0.5 0.5 0.3 0.5 EBIT-Adj.
0.4 0.3 0.2 0.4
0.0
Equity Income
(1.0)
Q1 Q2 Q3 Q4 Q1
2010 2010 2010 2010 2011
Revenue ($B) 5.0 5.3 5.1 6.1 5.4
Consolidated Prod. (000’s) 248 268 235 265 257
Joint Venture Prod. (000’s) 654 697 631 747 709
Total Production (000’s) 902 965 866 1,012 966
Note: Prior results have been adjusted to reflect the breakout of GMSA separately 19
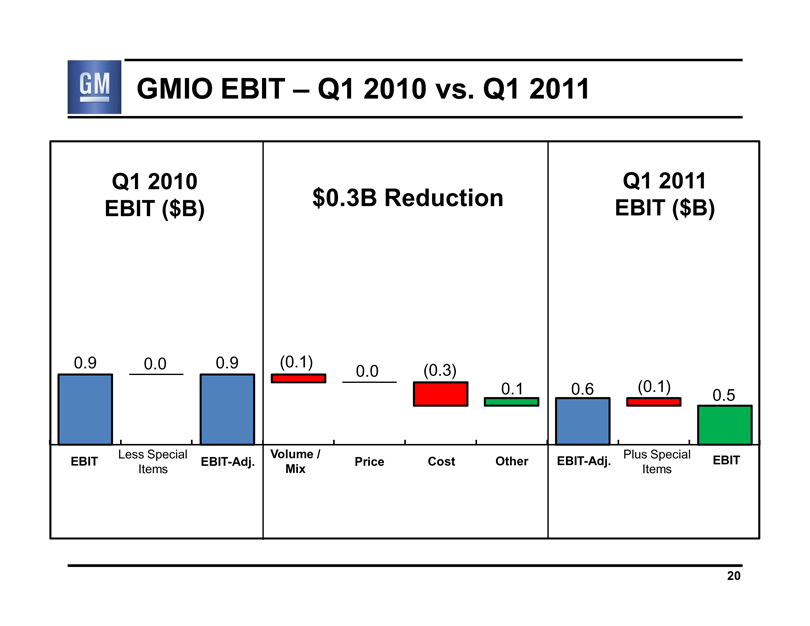 |
GMIO EBIT — Q1 2010 vs. Q1 2011
Q1 2010 Q1 2011
EBIT($B) $0.3B Reduction EBIT ($B)
0.9 0.0 0.9 (0.1) 0.0 (0.3) 0.1 0.6 (0.1) 0.5
EBIT Less Special Items EBIT-Adj.
Volume / Mix Price Cost Other
EBIT-Adj. Plus Special Items EBIT
20
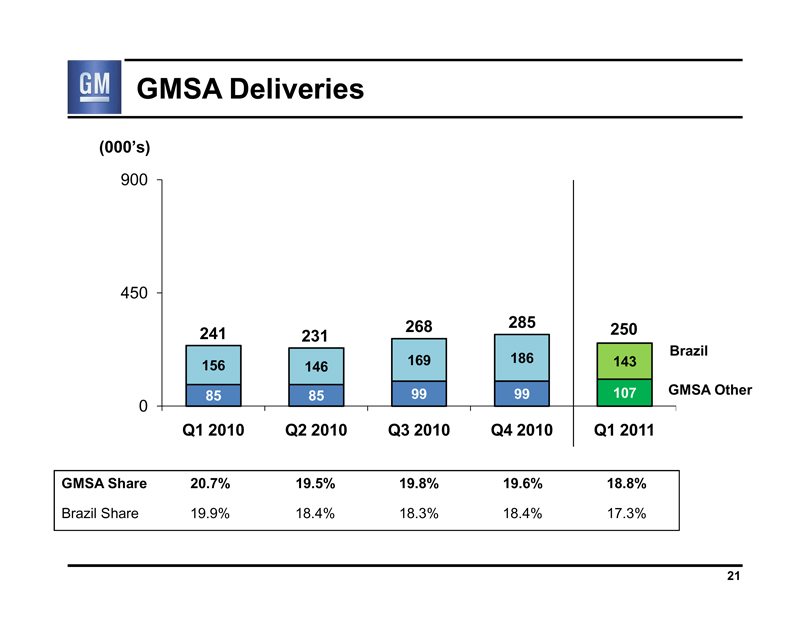 |
GMSA Deliveries
(000’s)
900
450
241 231 268 285 250 Brazil
156 146 169 186 143
0
85 85 99 99 107 GMSA Other
Q1 2010 Q2 2010 Q3 2010 Q4 2010 Q1 2011
GMSA Share 20.7% 19.5% 19.8% 19.6% 18.8%
Brazil Share 19.9% 18.4% 18.3% 18.4% 17.3%
21
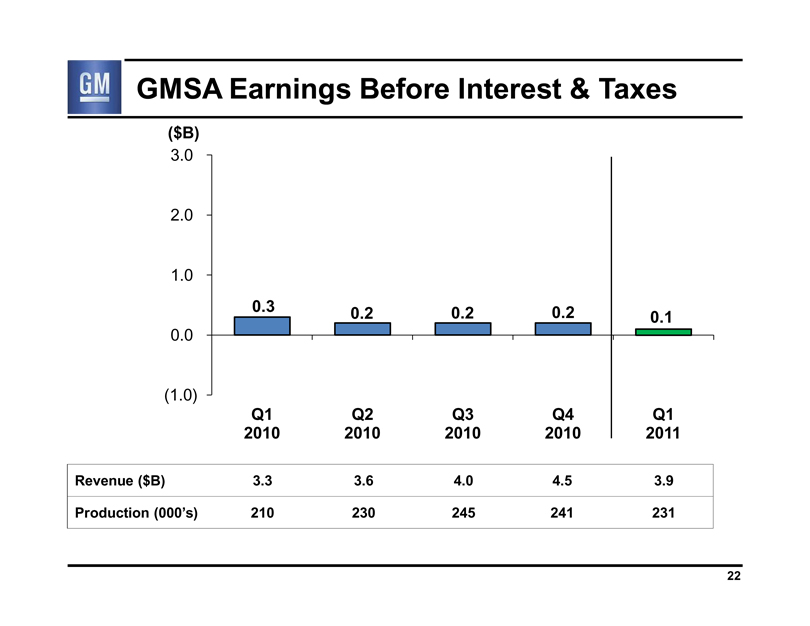 |
GMSA Earnings Before Interest & Taxes
($B)
3.0
2.0
1.0
0.0
(1.0)
0.3 0.2 0.2 0.2 0.1
Q1 Q2 Q3 Q4 Q1
2010 2010 2010 2010 2011
Revenue ($B) 3.3 3.6 4.0 4.5 3.9
Production (000’s) 210 230 245 241 231
22
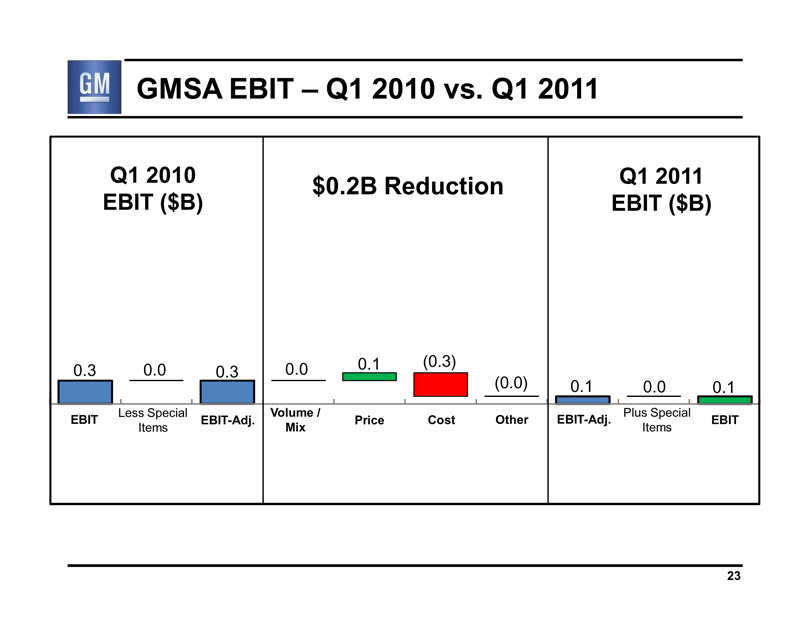 |
GMSA EBIT – Q1 2010 vs. Q1 2011
Q1 2010 Q1 2011
$0.2B Reduction
EBIT ($B) EBIT ($B)
0.3 0.0 0.3 0.0 0.1 (0.3)
(0.0) 0.1 0.0 0.1
Less Special Volume / Plus Special
EBIT EBIT-Adj. Price Cost Other EBIT-Adj. EBIT
Items Mix Items
23
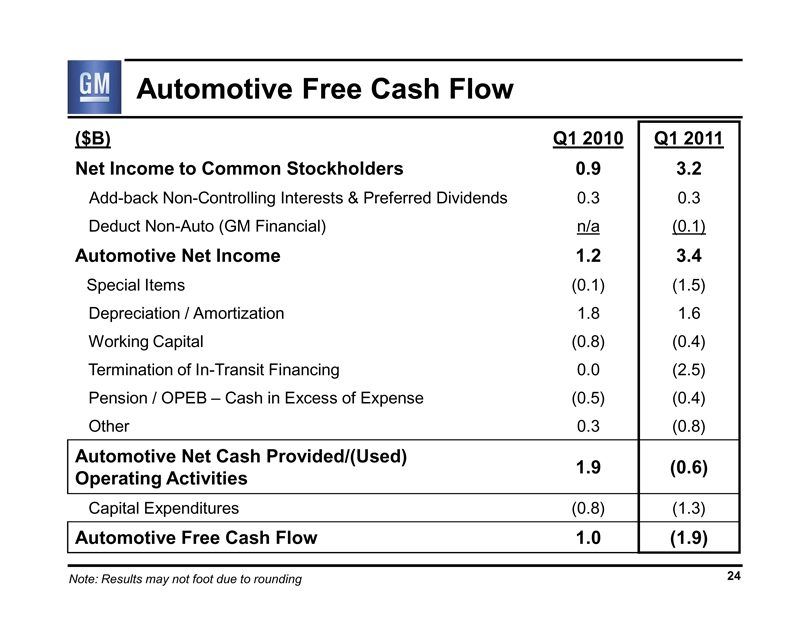 |
Automotive Free Cash Flow
($B) Q1 2010 Q1 2011
Net Income to Common Stockholders 0.9 3.2
Add-back Non-Controlling Interests & Preferred Dividends 0.3 0.3
Deduct Non-Auto (GM Financial) n/a (0.1)
Automotive Net Income 1.2 3.4
Special Items (0.1) (1.5)
Depreciation / Amortization 1.8 1.6
Working Capital (0.8) (0.4)
Termination of In-Transit Financing 0.0 (2.5)
Pension / OPEB – Cash in Excess of Expense (0.5) (0.4)
Other 0.3 (0.8)
Automotive Net Cash Provided/(Used)
1.9 (0.6)
Operating Activities
Capital Expenditures (0.8) (1.3)
Automotive Free Cash Flow 1.0 (1.9)
Note: Results may not foot due to rounding 24
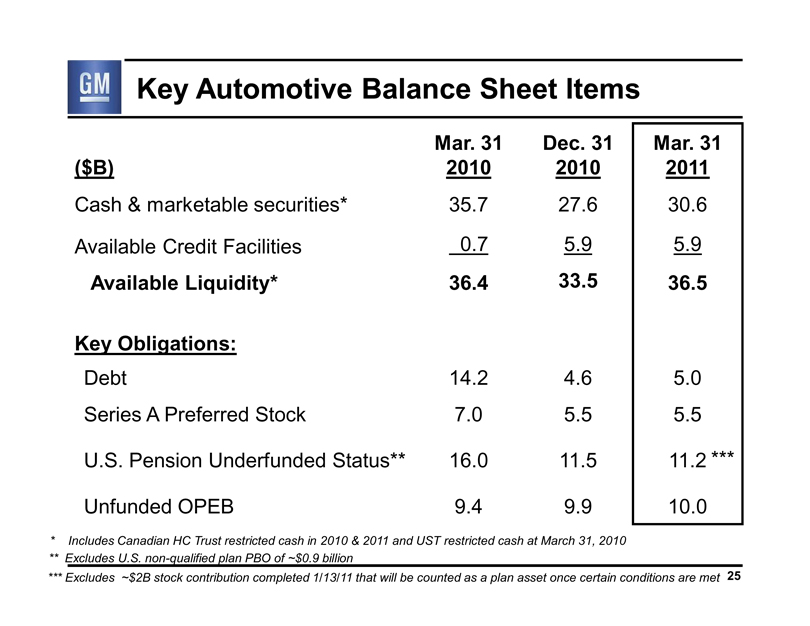 |
Key Automotive Balance Sheet Items
Mar. 31 Dec. 31 Mar. 31
($B) 2010 2010 2011
Cash & marketable securities* 35.7 27.6 30.6
Available Credit Facilities 0.7 5.9 5.9
Available Liquidity* 36.4 33.5 36.5
Key Obligations:
Debt 14.2 4.6 5.0
Series A Preferred Stock 7.0 5.5 5.5
U.S. Pension Underfunded Status** 16.0 11.5 11.2 ***
Unfunded OPEB 9.4 9.9 10.0
* Includes Canadian HC Trust restricted cash in 2010 & 2011 and UST restricted cash at March 31, 2010
** Excludes U.S. non-qualified plan PBO of ~$0.9 billion
*** Excludes ~$2B stock contribution completed 1/13/11 that will be counted as a plan asset once certain conditions are met 25
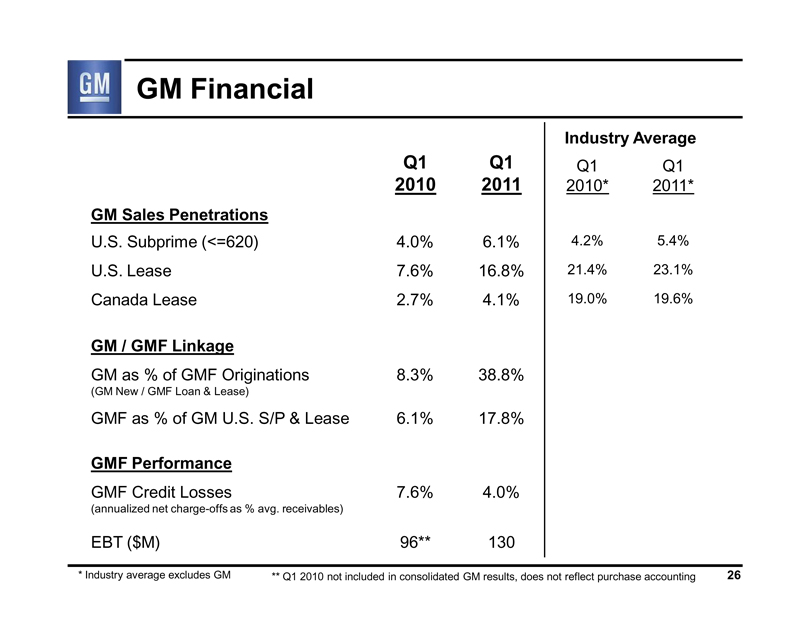 |
GM Financial
Industry Average
Q1 Q1 Q1 Q1
2010 2011 2010* 2011*
GM Sales Penetrations
U.S. Subprime (<=620) 4.0% 6.1% 4.2% 5.4%
U.S. Lease 7.6% 16.8% 21.4% 23.1%
Canada Lease 2.7% 4.1% 19.0% 19.6%
GM / GMF Linkage
GM as % of GMF Originations 8.3% 38.8%
(GM New / GMF Loan & Lease)
GMF as % of GM U.S. S/P & Lease 6.1% 17.8%
GMF Performance
GMF Credit Losses 7.6% 4.0%
(annualized net charge-offs as % avg. receivables)
EBT ($M) 96** 130
* Industry average excludes GM ** Q1 2010 not included in consolidated GM results, does not reflect purchase accounting 26
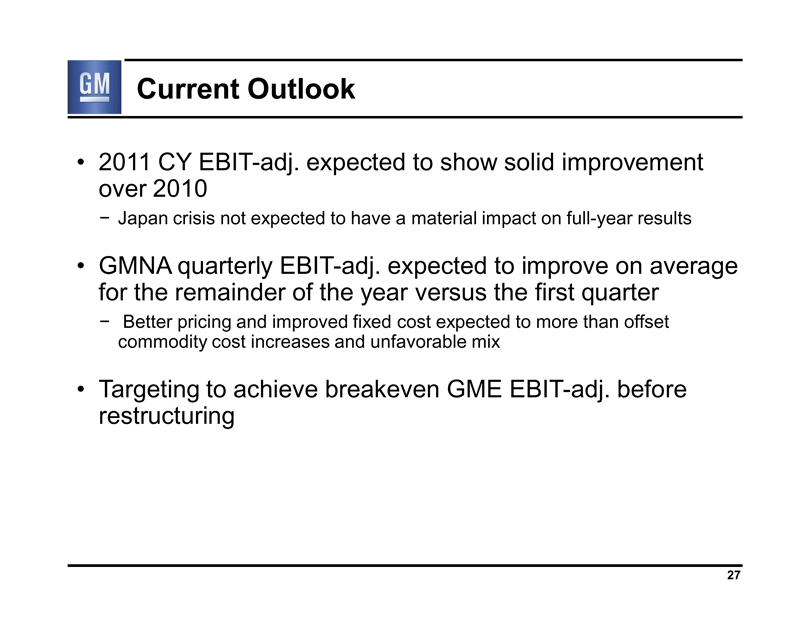 |
Current Outlook
2011 CY EBIT-adj. expected to show solid improvement over 2010
- Japan crisis not expected to have a material impact on full-year results
GMNA quarterly EBIT-adj. expected to improve on average for the remainder of the year versus the first quarter
- Better pricing and improved fixed cost expected to more than offset commodity cost increases and unfavorable mix
Targeting to achieve breakeven GME EBIT-adj. before restructuring
27
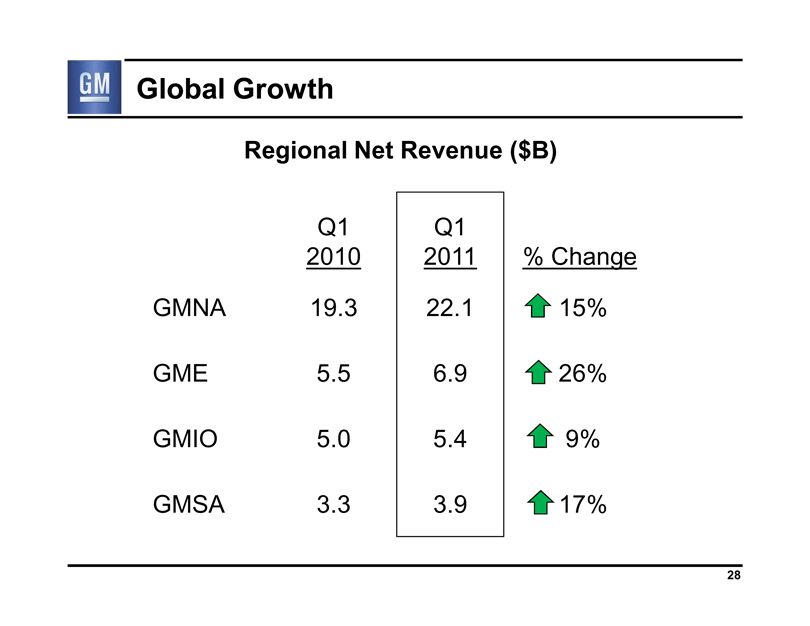 |
Global Growth
Regional Net Revenue ($B)
Q1 Q1
2010 2011 % Change
GMNA 19.3 22.1 15%
GME 5.5 6.9 26%
GMIO 5.0 5.4 9%
GMSA 3.3 3.9 17%
28
 |
Summary
On plan
Important to leverage global growth
Cost containment is key, as commodity and launch costs increase
Expect full-year 2011 EBIT-adjusted results to be solid improvement over 2010
29
 |
General Motors Company
Select Supplemental Financial Information
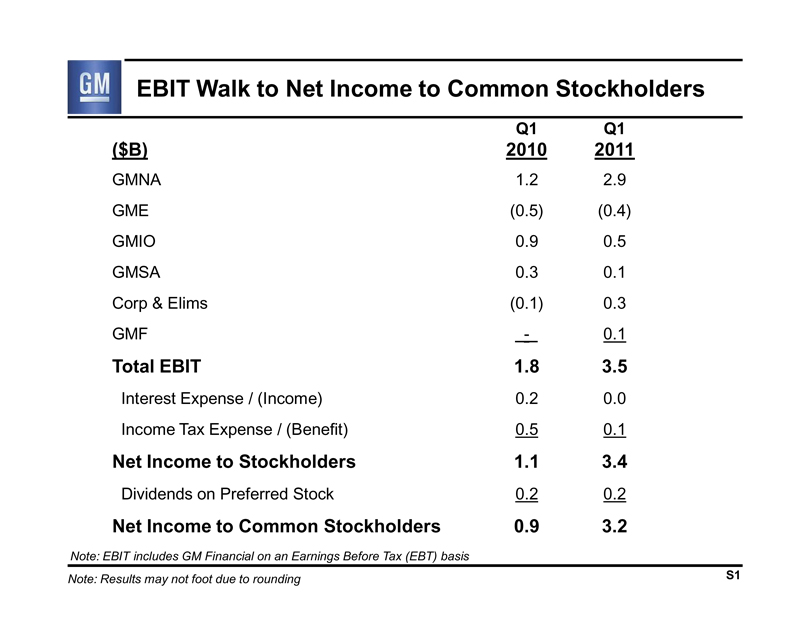 |
EBIT Walk to Net Income to Common Stockholders
Q1 Q1
($B) 2010 2011
GMNA 1.2 2.9
GME (0.5) (0.4)
GMIO 0.9 0.5
GMSA 0.3 0.1
Corp & Elims (0.1) 0.3
GMF - 0.1
Total EBIT 1.8 3.5
Interest Expense / (Income) 0.2 0.0
Income Tax Expense / (Benefit) 0.5 0.1
Net Income to Stockholders 1.1 3.4
Dividends on Preferred Stock 0.2 0.2
Net Income to Common Stockholders 0.9 3.2
Note: EBIT includes GM Financial on an Earnings Before Tax (EBT) basis
Note: Results may not foot due to rounding S1
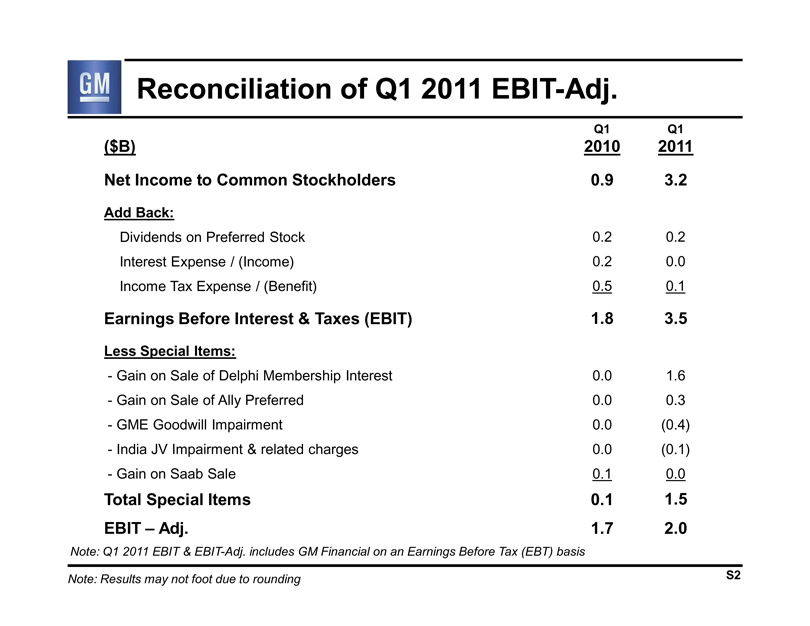 |
Reconciliation of Q1 2011 EBIT-Adj.
Q1 Q1
($B) 2010 2011
Net Income to Common Stockholders 0.9 3.2
Add Back:
Dividends on Preferred Stock 0.2 0.2
Interest Expense / (Income) 0.2 0.0
Income Tax Expense / (Benefit) 0.5 0.1
Earnings Before Interest & Taxes (EBIT) 1.8 3.5
Less Special Items:
- Gain on Sale of Delphi Membership Interest 0.0 1.6
- Gain on Sale of Ally Preferred 0.0 0.3
- GME Goodwill Impairment 0.0 (0.4)
- India JV Impairment & related charges 0.0 (0.1)
- Gain on Saab Sale 0.1 0.0
Total Special Items 0.1 1.5
EBIT – Adj. 1.7 2.0
Note: Q1 2011 EBIT & EBIT-Adj. includes GM Financial on an Earnings Before Tax (EBT) basis
Note: Results may not foot due to rounding S2
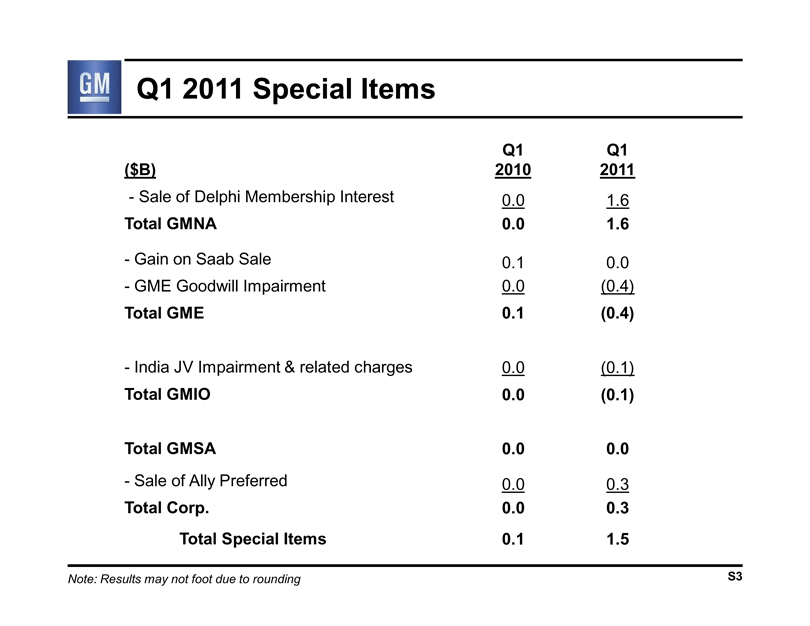 |
Q1 2011 Special Items
Q1 Q1
($B) 2010 2011
- Sale of Delphi Membership Interest 0.0 1.6
Total GMNA 0.0 1.6
- Gain on Saab Sale 0.1 0.0
- GME Goodwill Impairment 0.0 (0.4)
Total GME 0.1 (0.4)
- India JV Impairment & related charges 0.0 (0.1)
Total GMIO 0.0 (0.1)
Total GMSA 0.0 0.0
- Sale of Ally Preferred 0.0 0.3
Total Corp. 0.0 0.3
Total Special Items 0.1 1.5
Note: Results may not foot due to rounding S3
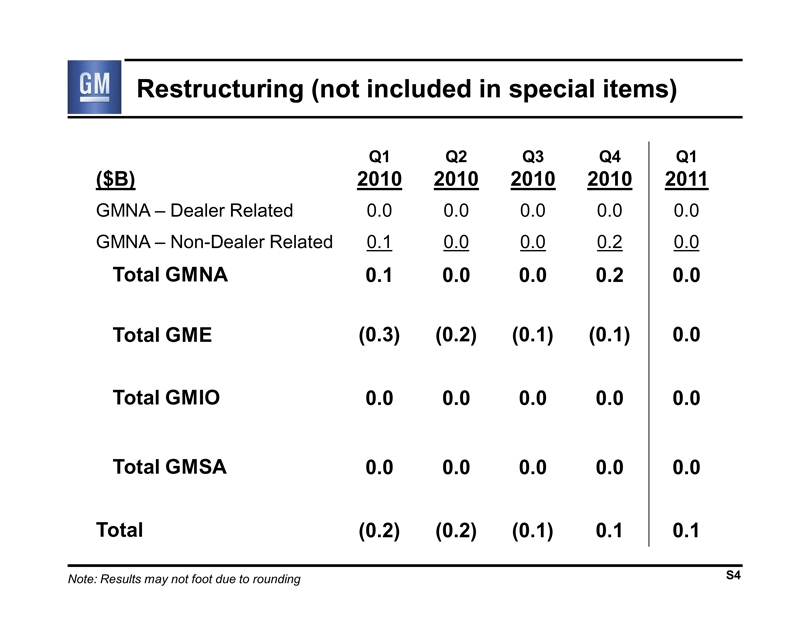 |
Restructuring (not included in special items)
Q1 Q2 Q3 Q4 Q1
($B) 2010 2010 2010 2010 2011
GMNA – Dealer Related 0.0 0.0 0.0 0.0 0.0
GMNA – Non-Dealer Related 0.1 0.0 0.0 0.2 0.0
Total GMNA 0.1 0.0 0.0 0.2 0.0
Total GME (0.3) (0.2) (0.1) (0.1) 0.0
Total GMIO 0.0 0.0 0.0 0.0 0.0
Total GMSA 0.0 0.0 0.0 0.0 0.0
Total (0.2) (0.2) (0.1) 0.1 0.1
Note: Results may not foot due to rounding S4
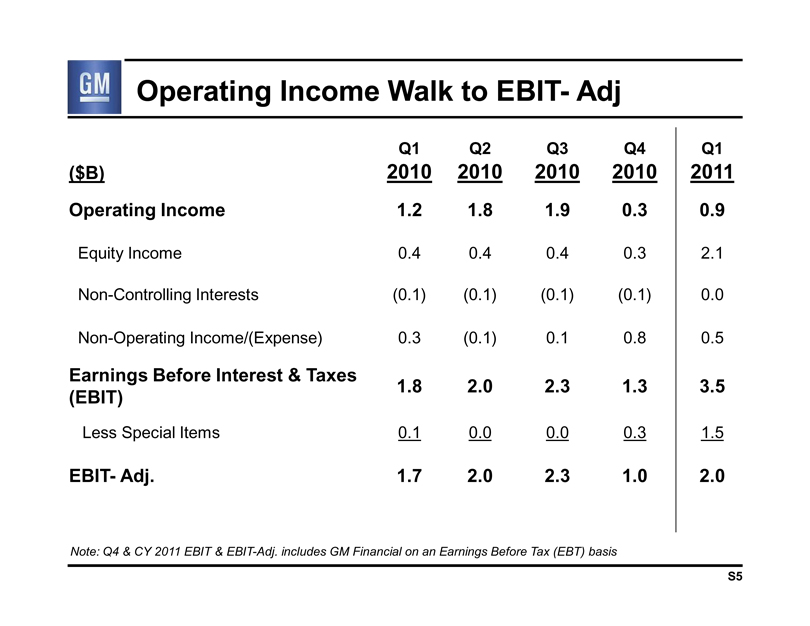 |
Operating Income Walk to EBIT- Adj
Q1 Q2 Q3 Q4 Q1
($B) 2010 2010 2010 2010 2011
Operating Income 1.2 1.8 1.9 0.3 0.9
Equity Income 0.4 0.4 0.4 0.3 2.1
Non-Controlling Interests (0.1) (0.1) (0.1) (0.1) 0.0
Non-Operating Income/(Expense) 0.3 (0.1) 0.1 0.8 0.5
Earnings Before Interest & Taxes
1.8 2.0 2.3 1.3 3.5
(EBIT)
Less Special Items 0.1 0.0 0.0 0.3 1.5
EBIT- Adj. 1.7 2.0 2.3 1.0 2.0
Note: Q4 & CY 2011 EBIT & EBIT-Adj. includes GM Financial on an Earnings Before Tax (EBT) basis
S5
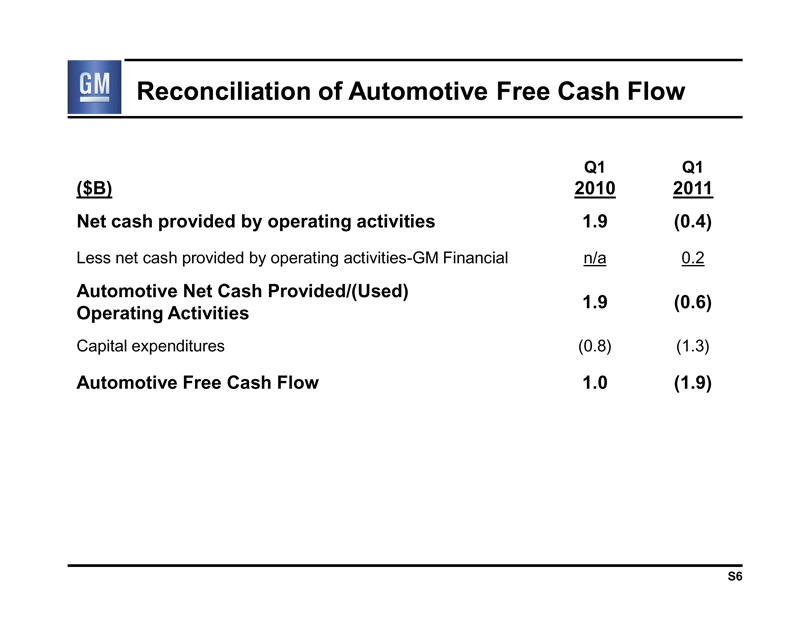 |
Reconciliation of Automotive Free Cash Flow
Q1 Q1
($B) 2010 2011
Net cash provided by operating activities 1.9 (0.4)
Less net cash provided by operating activities-GM Financial n/a 0.2
Automotive Net Cash Provided/(Used)
1.9 (0.6)
Operating Activities
Capital expenditures (0.8) (1.3)
Automotive Free Cash Flow 1.0 (1.9)
S6
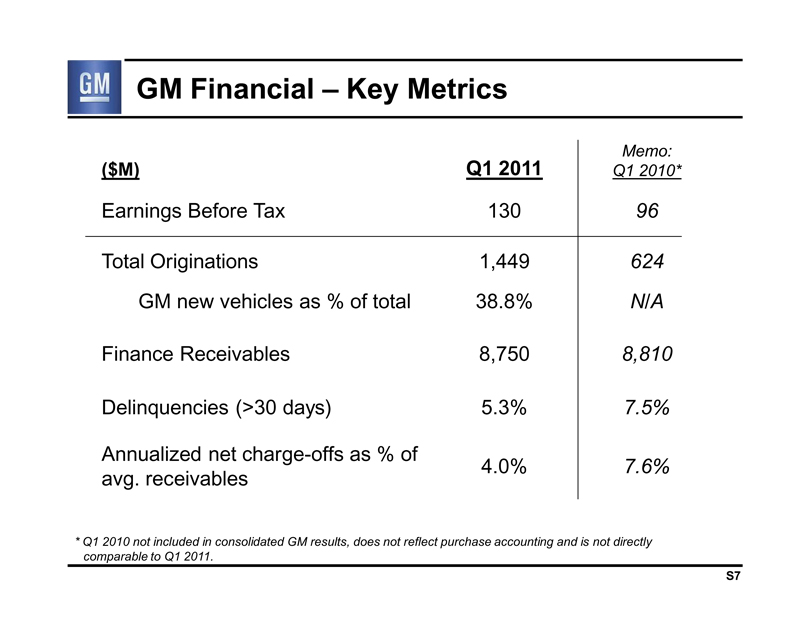 |
GM Financial – Key Metrics
($M) Q1 2011 Memo: Q1 2010*
Earnings Before Tax 130 96
Total Originations 1,449 624
GM new vehicles as % of total 38.8% N/A
Finance Receivables 8,750 8,810
Delinquencies (>30 days) 5.3% 7.5%
Annualized net charge-offs as % of 4.0% 7.6%
avg. receivables
* Q1 2010 not included in consolidated GM results, does not reflect purchase accounting and is not directly comparable to Q1 2011.
S7