General Motors Company Q1 2014 Results April 24, 2014 Exhibit 99.2
Forward-Looking Statements In this presentation and in related comments by our management, our use of the words “expect,” “anticipate,” “possible,” “potential,” “target,” “believe,” “commit,” “intend,” “continue,” “may,” “would,” “could,” “should,” “project,” “appears,” “projected,” “positioned,” “outlook” or similar expressions is intended to identify forward-looking statements that represent our current judgment about possible future events. We believe these judgments are reasonable, but these statements are not guarantees of any events or financial results, and our actual results may differ materially due to a variety of important factors. Among other items, such factors may include: our ability to realize production efficiencies and to achieve reductions in costs as a result of our restructuring initiatives and labor modifications; our ability to maintain quality control over our vehicles and avoid material vehicle recalls and the cost and effect on our reputation of product recalls; our ability to maintain adequate financing sources, including as required to fund our planned significant investment in new technology; our ability to successfully integrate Ally Financial’s International Operations; the ability of our suppliers to timely deliver parts, components and systems; our ability to realize successful vehicle applications of new technology; overall strength and stability of our markets, particularly outside of North America and China; costs and risks associated with litigation and government investigations including those related to our recent recalls; our ability to remain competitive in Korea and our ability to continue to attract new customers, particularly for our new products. GM's most recent annual report on Form 10-K provides information about these and other factors, which we may revise or supplement in future reports to the SEC. 1
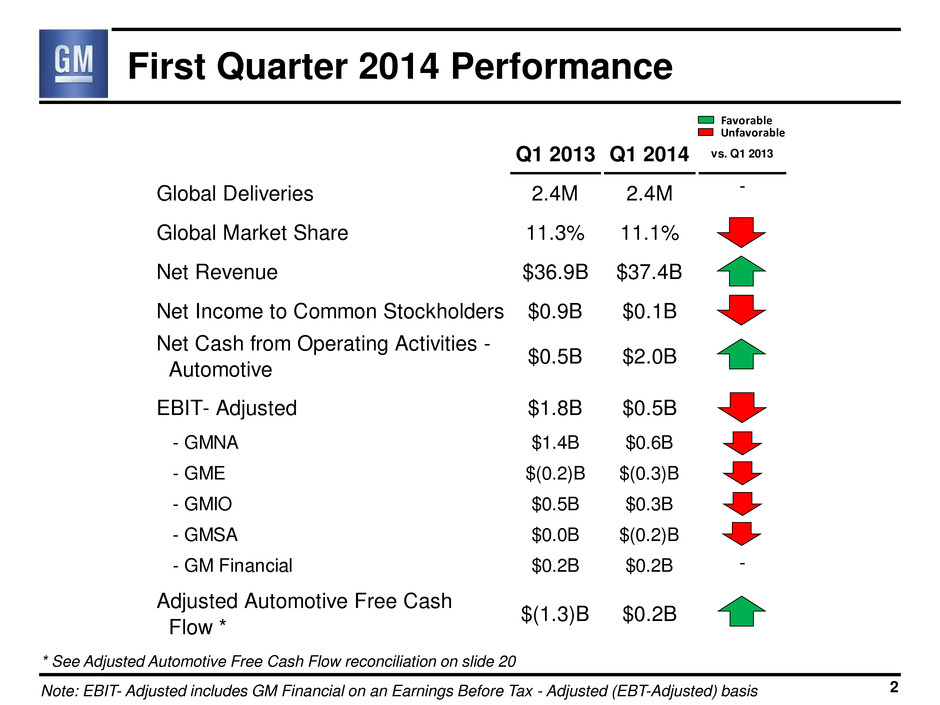
First Quarter 2014 Performance 2 Note: EBIT- Adjusted includes GM Financial on an Earnings Before Tax - Adjusted (EBT-Adjusted) basis * See Adjusted Automotive Free Cash Flow reconciliation on slide 20 Q1 2013 Q1 2014 vs. Q1 2013 Global Deliveries 2.4M 2.4M - Global Market Share 11.3% 11.1% Net Revenue $36.9B $37.4B Net Income to Common Stockholders $0.9B $0.1B Net Cash from Operating Activities - Automotive $0.5B $2.0B EBIT- Adjusted $1.8B $0.5B - GMNA $1.4B $0.6B - GME $(0.2)B $(0.3)B - GMIO $0.5B $0.3B - GMSA $0.0B $(0.2)B - GM Financial $0.2B $0.2B - Adjusted Automotive Free Cash Flow * $(1.3)B $0.2B Favorable Unfavorable
First Quarter 2014 Highlights 3 • Paid first common stock dividend since IPO • Record China sales • Opel Mokka and Insignia propel GME results • Record Average Transaction Prices in GMNA • Full-Size SUV and HD truck launches in GMNA • All brands ranked above industry average in JD Power 2014 U.S. Customer Service Index (CSI) study – Cadillac highest ranked luxury brand – Buick highest ranked mainstream brand
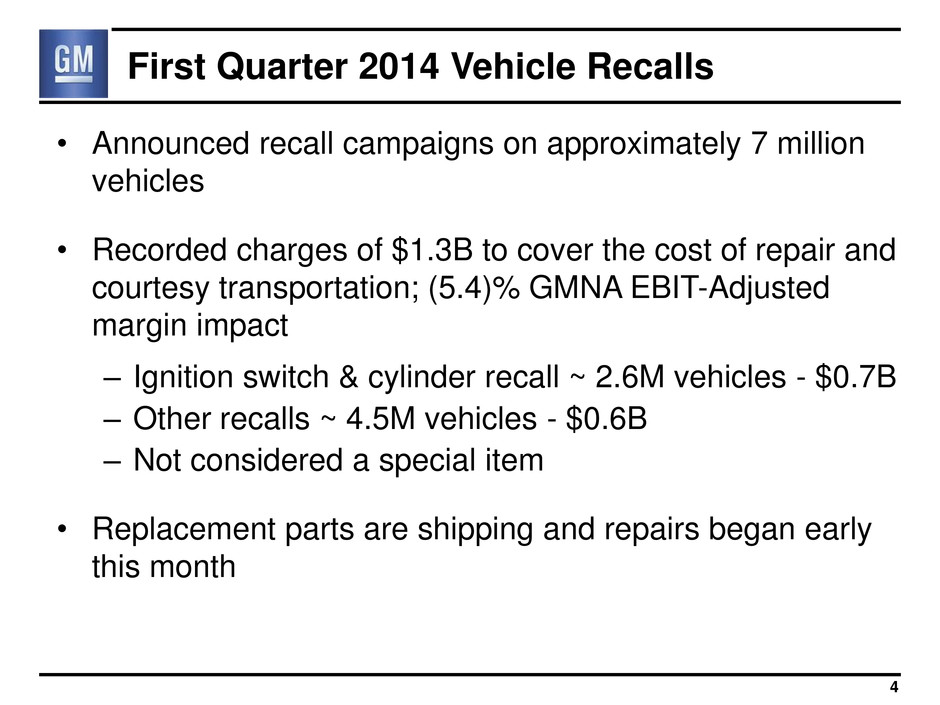
First Quarter 2014 Vehicle Recalls 4 • Announced recall campaigns on approximately 7 million vehicles • Recorded charges of $1.3B to cover the cost of repair and courtesy transportation; (5.4)% GMNA EBIT-Adjusted margin impact – Ignition switch & cylinder recall ~ 2.6M vehicles - $0.7B – Other recalls ~ 4.5M vehicles - $0.6B – Not considered a special item • Replacement parts are shipping and repairs began early this month
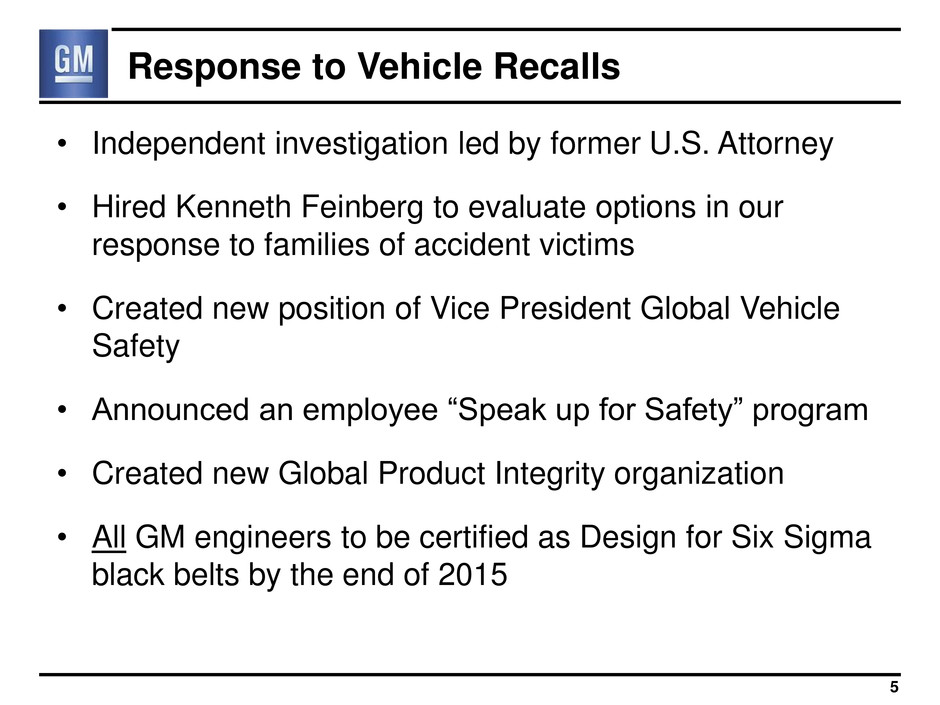
Response to Vehicle Recalls 5 • Independent investigation led by former U.S. Attorney • Hired Kenneth Feinberg to evaluate options in our response to families of accident victims • Created new position of Vice President Global Vehicle Safety • Announced an employee “Speak up for Safety” program • Created new Global Product Integrity organization • All GM engineers to be certified as Design for Six Sigma black belts by the end of 2015

Summary of Q1 2014 Results 6 Note: EBIT- Adjusted includes GM Financial on an EBT-Adjusted basis Q1 Q1 2013 2014 Net Revenue ($B) 36.9 37.4 Operating Income / (Loss) ($B) 1.0 (0.5) Net Income to Common Stockholders ($B) 0.9 0.1 EPS – Diluted ($/Share) 0.58 0.06 Net Cash from Operating Activities – Automotive ($B) 0.5 2.0 EBIT- Adjusted ($B) 1.8 0.5 EBIT- Adjusted % Revenue 4.8% 1.2% Adjusted Automotive Free Cash Flow ($B) (1.3) 0.2 GAAP Non- GAAP
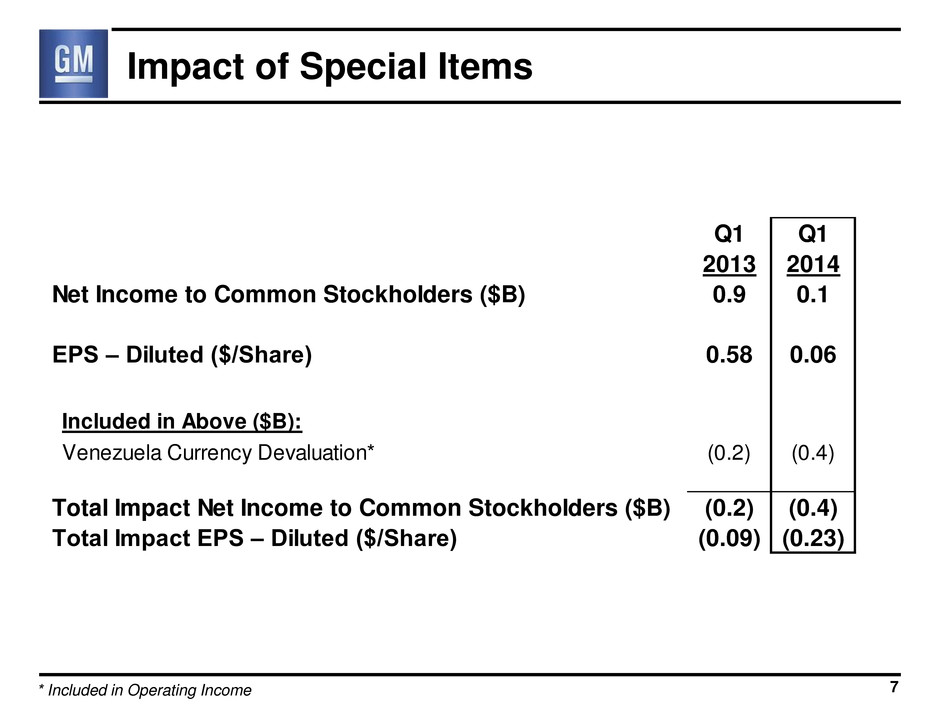
7 Impact of Special Items * Included in Operating Income Q1 Q1 2013 2014 Net Income to Common Stockholders ($B) 0.9 0.1 EPS – Diluted ($/Share) 0.58 0.06 Included in Above ($B): Venezuela Currency Devaluation* (0.2) (0.4) Total Impact Net Income to Common Stockholders ($B) (0.2) (0.4) Total Impact EPS – Diluted ($/Share) (0.09) (0.23)
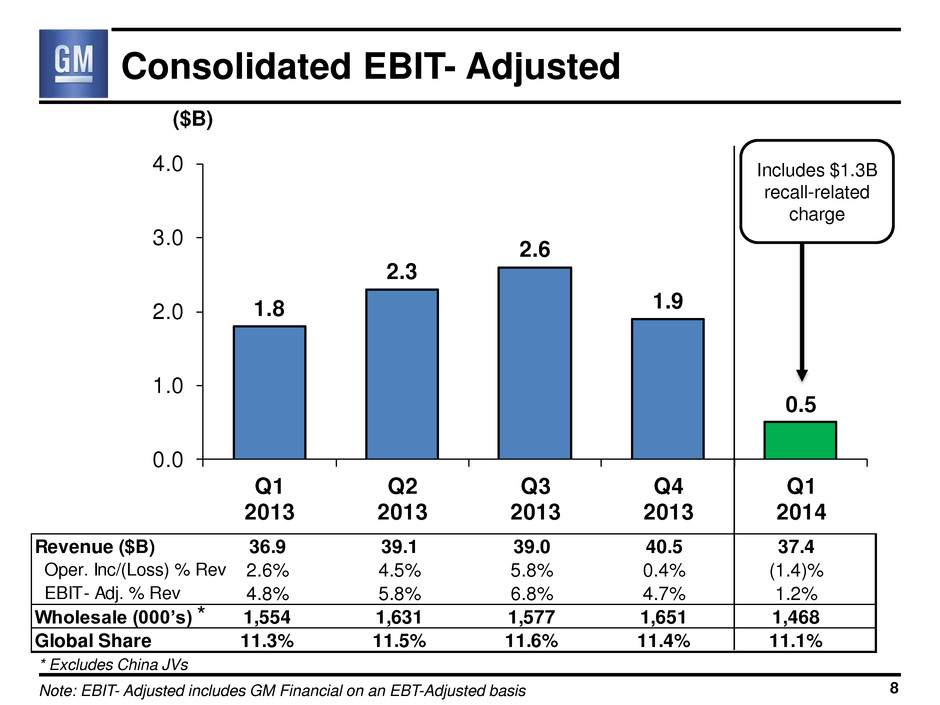
Revenue ($B) 36.9 39.1 39.0 40.5 37.4 Op r. Inc/(Loss) % Rev 2. % 4.5% 5.8% 0.4% (1.4)% EBIT- Adj. % Rev 4.8 5.8 6. 4.7 .2% Wholesale (000’s) 1,554 1,631 1,577 1,651 1,468 Global Share 1.3% 1.5% 1.6% 1.4% 1.1% 1.8 2.3 2.6 1.9 0.5 0.0 1.0 2.0 3.0 4.0 Q1 2013 Q2 2013 Q3 2013 Q4 2013 Q1 2014 Consolidated EBIT- Adjusted ($B) Note: EBIT- Adjusted includes GM Financial on an EBT-Adjusted basis 8 * Excludes China JVs * Includes $1.3B recall-related charge
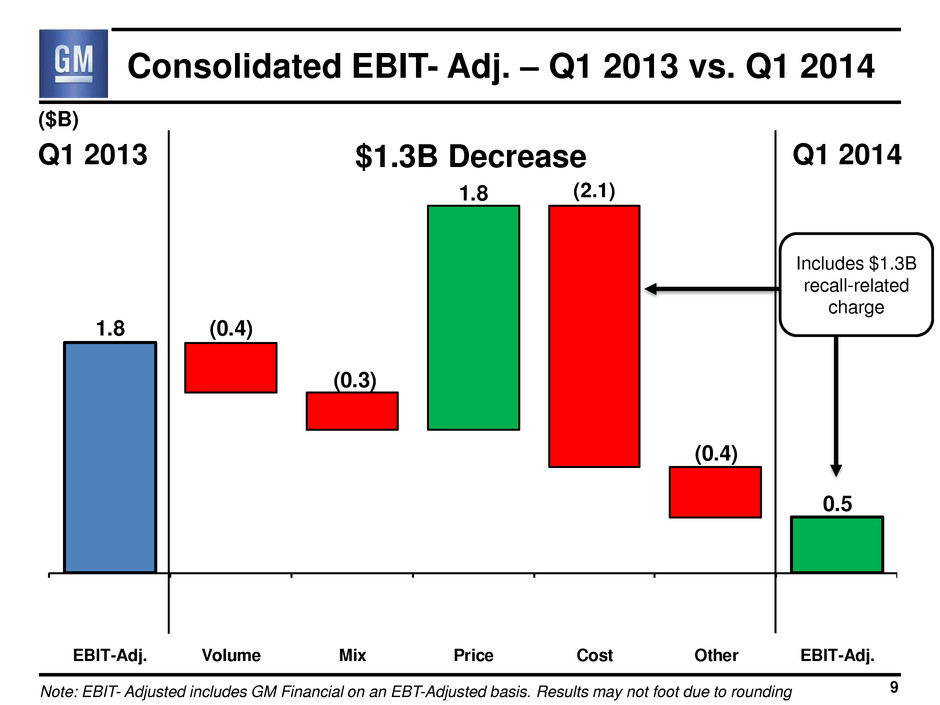
1.8 0.5 (0.4) (0.3) (2.1) (0.4) 1.8 EBIT-Adj. Volume Mix Price Cost Other EBIT-Adj. 9 Consolidated EBIT- Adj. – Q1 2013 vs. Q1 2014 Note: EBIT- Adjusted includes GM Financial on an EBT-Adjusted basis. Results may not foot due to rounding ($B) Q1 2013 Q1 2014 $1.3B Decrease Includes $1.3B recall-related charge
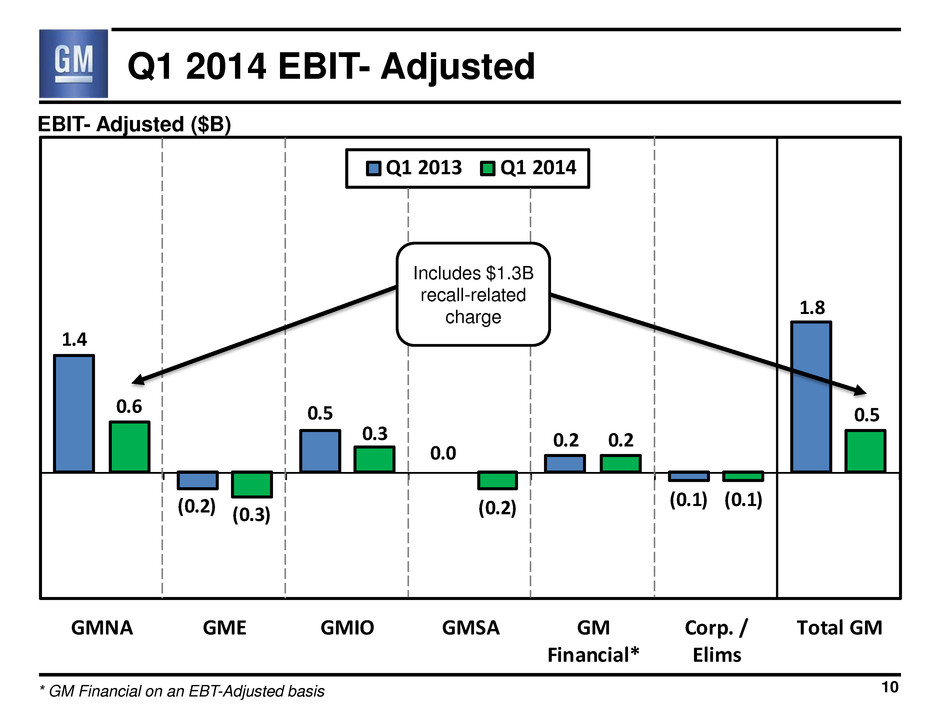
1.4 (0.2) 0.5 0.0 0.2 (0.1) 1.8 0.6 (0.3) 0.3 (0.2) 0.2 (0.1) 0.5 GMNA GME GMIO GMSA GM Financial* Corp. / Elims Total GM Q1 2013 Q1 2014 EBIT- Adjusted ($B) 10 Q1 2014 EBIT- Adjusted * GM Financial on an EBT-Adjusted basis Includes $1.3B recall-related charge
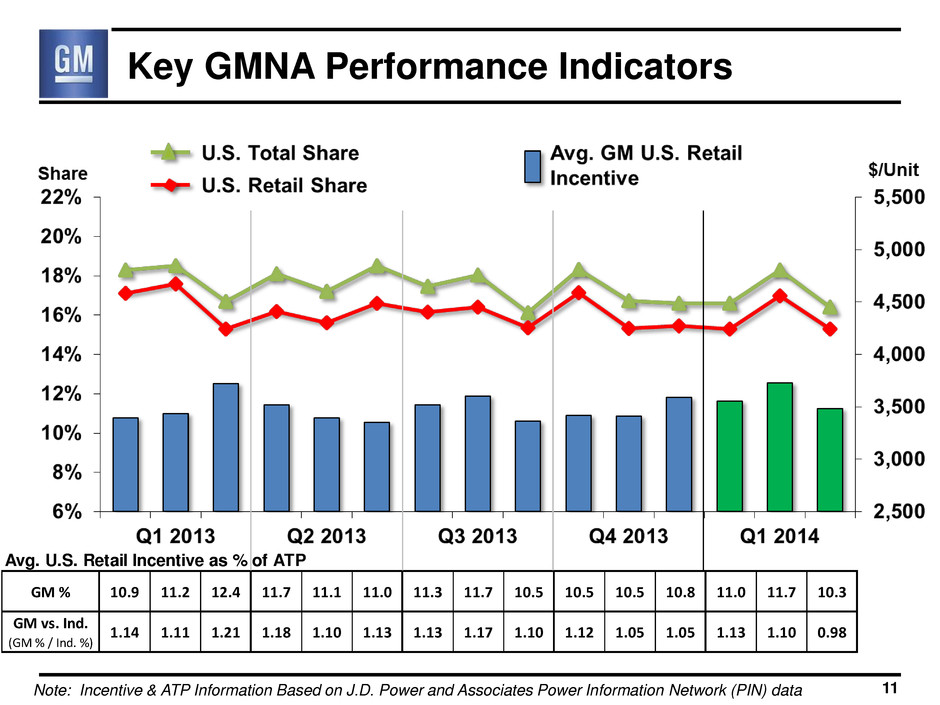
Key GMNA Performance Indicators Note: Incentive & ATP Information Based on J.D. Power and Associates Power Information Network (PIN) data 11 Avg. U.S. Retail Incentive as % of ATP GM % 10.9 11.2 12.4 11.7 11.1 11.0 11.3 11.7 10.5 10.5 10.5 10.8 11.0 11.7 10.3 GM vs. Ind. ( % / Ind. %) 1.14 1.11 1.21 1.18 1.10 1.13 1.13 1.17 1.10 1.12 1.05 1.05 1.13 1.10 0.98
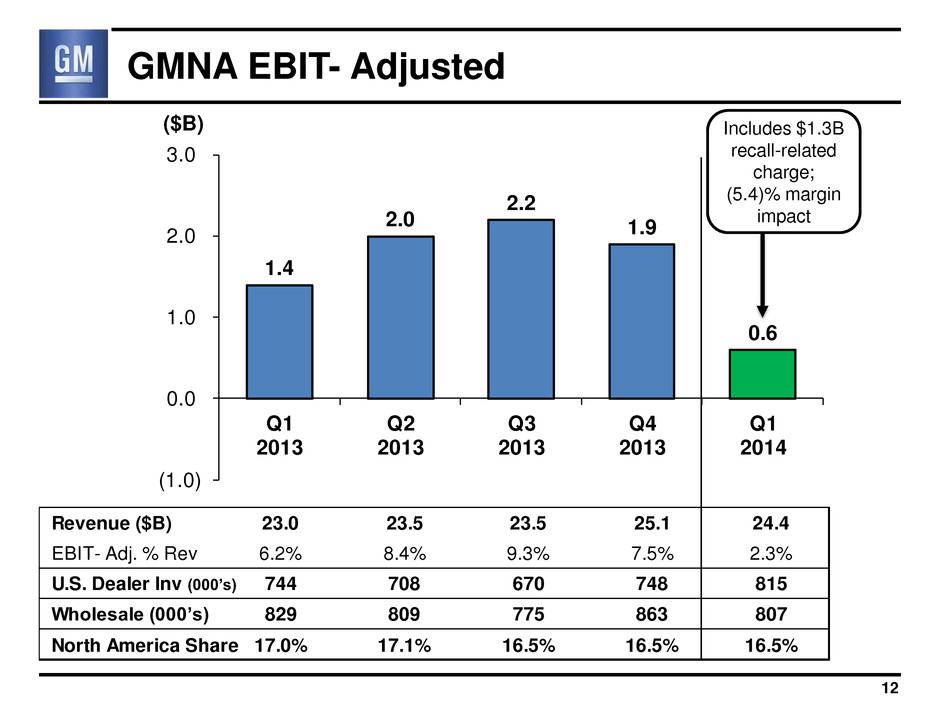
1.4 2.0 2.2 1.9 0.6 (1.0) 0.0 1.0 2.0 3.0 Q1 2013 Q2 2013 Q3 2013 Q4 2013 Q1 2014 Revenue ($B) 23.0 23.5 23.5 25.1 24.4 EBIT- Adj. % Rev 6.2% 8.4% 9.3% 7.5% 2.3% U.S. Dealer Inv (000’s) 744 708 670 748 815 Wholesale (000’s) 829 809 775 863 807 North America Share 17.0% 17.1% 16.5% 16.5% 16.5% GMNA EBIT- Adjusted ($B) 12 Includes $1.3B recall-related charge; (5.4)% margin impact
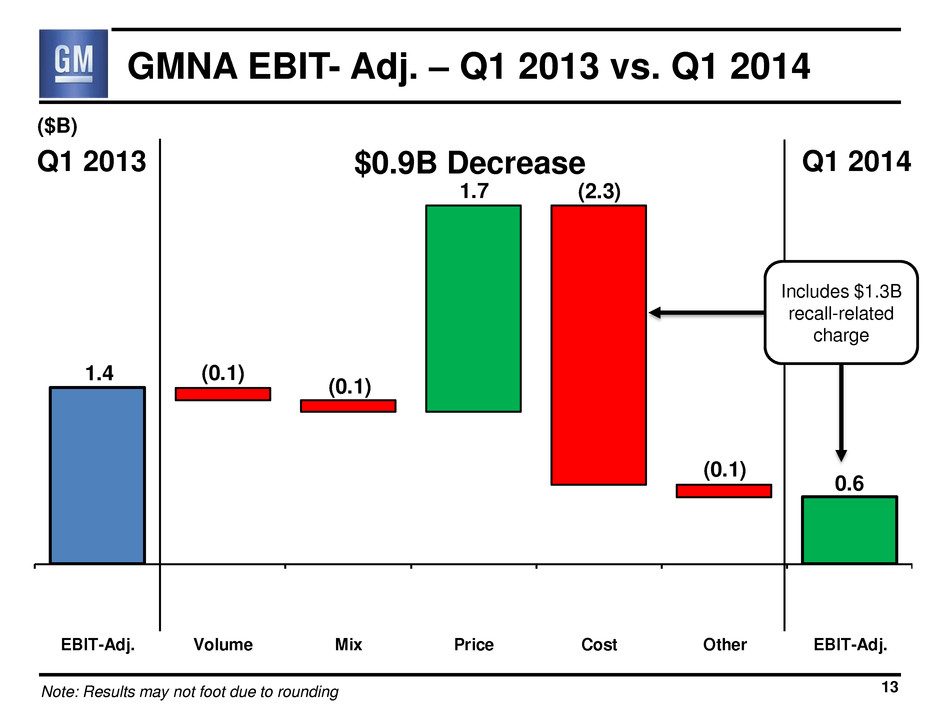
1.4 0.6 (0.1) (0.1) (2.3) (0.1) 1.7 EBIT-Adj. Volume Mix Price Cost Other EBIT-Adj. GMNA EBIT- Adj. – Q1 2013 vs. Q1 2014 13 ($B) Q1 2013 Q1 2014 $0.9B Decrease Note: Results may not foot due to rounding Includes $1.3B recall-related charge
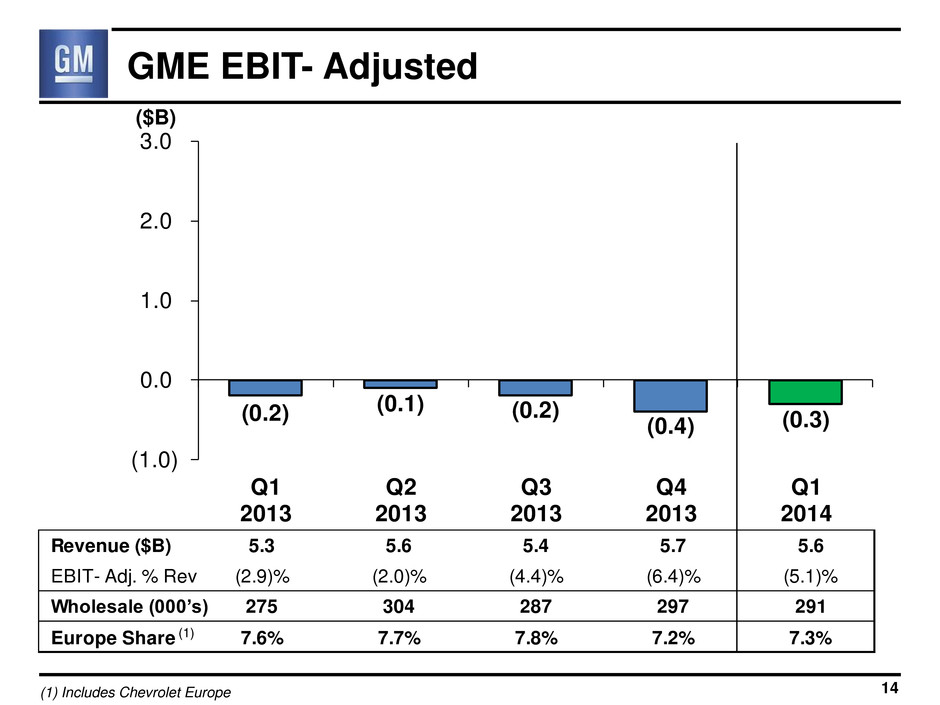
Revenue ($B) 5.3 5.6 5.4 5.7 5.6 EBIT- Adj. % Rev (2.9)% (2.0)% (4.4)% (6.4)% (5.1)% Wholesale (000’s) 275 304 287 297 291 Europe Share 7.6% 7.7% 7.8% 7.2% 7.3% (0.2) (0.1) (0.2) (0.4) (0.3) (1.0) 0.0 1.0 2.0 3.0 Q1 2013 Q2 2013 Q3 2013 Q4 2013 Q1 2014 GME EBIT- Adjusted ($B) 14 (1) Includes Chevrolet Europe (1)
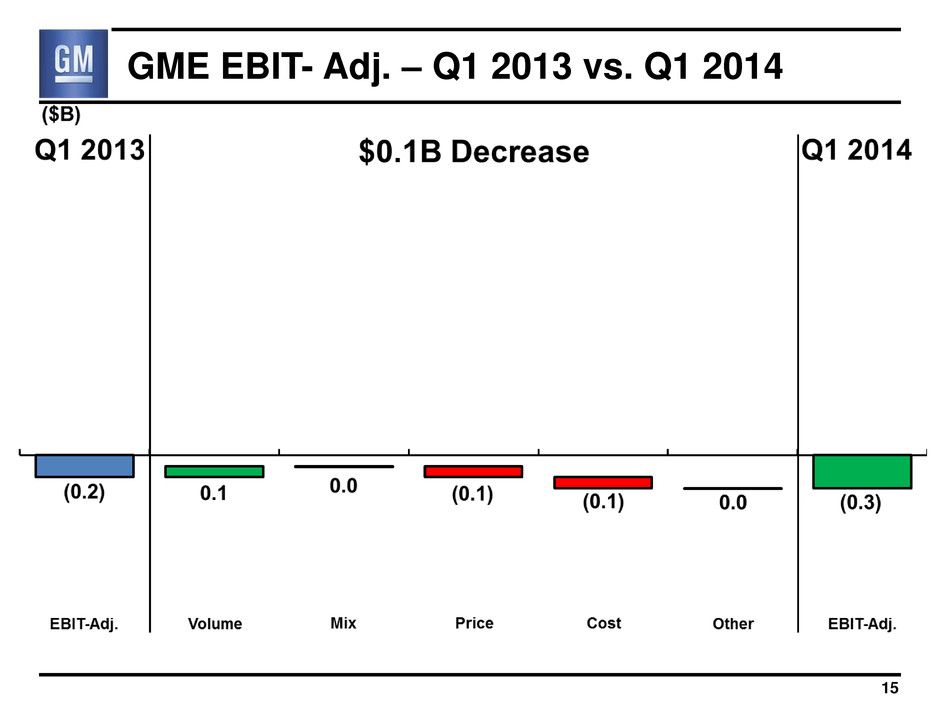
GME EBIT- Adj. – Q1 2013 vs. Q1 2014 15
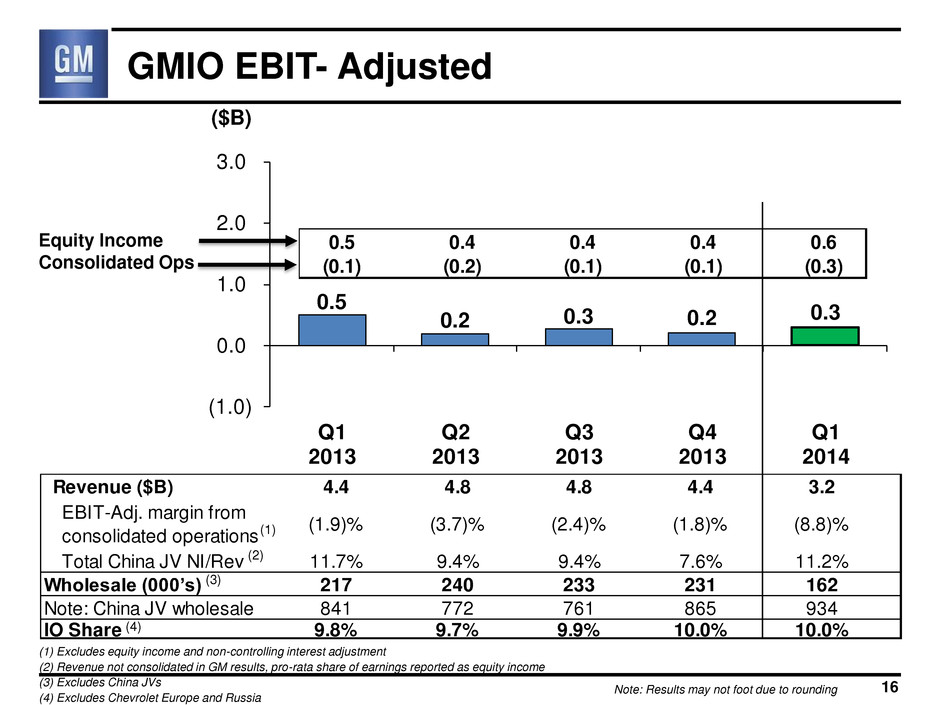
0.5 0.2 0.3 0.2 0.3 (1.0) 0.0 1.0 2.0 3.0 Q1 2013 Q2 2013 Q3 2013 Q4 2013 Q1 2014 GMIO EBIT- Adjusted 16 Revenue ($B) 4.4 4.8 .8 4.4 3.2 EBIT-Adj. margin from consolidated operations (1.9)% (3.7)% (2.4)% (1.8)% (8.8)% Total China JV NI/Rev 11.7% 9.4% 9.4% 7.6% 11.2% Wholesale (000’s) 217 240 233 231 162 Note: China JV wholesale 841 772 761 865 934 IO Share 9.8% 9.7% 9.9% 10.0% 10.0% ($B) (1) Excludes equity income and non-controlling interest adjustment (2) Revenue not consolidated in GM results, pro-rata share of earnings reported as equity income (3) Excludes China JVs (4) Excludes Chevrolet Europe and Russia (3) (2) (4) (1) 0.5 0.4 0.4 0.4 0.6 ( .1) ( .2) ( .1) ( .1) ( .3) Equity Income Consolidated Ops Note: Results may not foot due to rounding
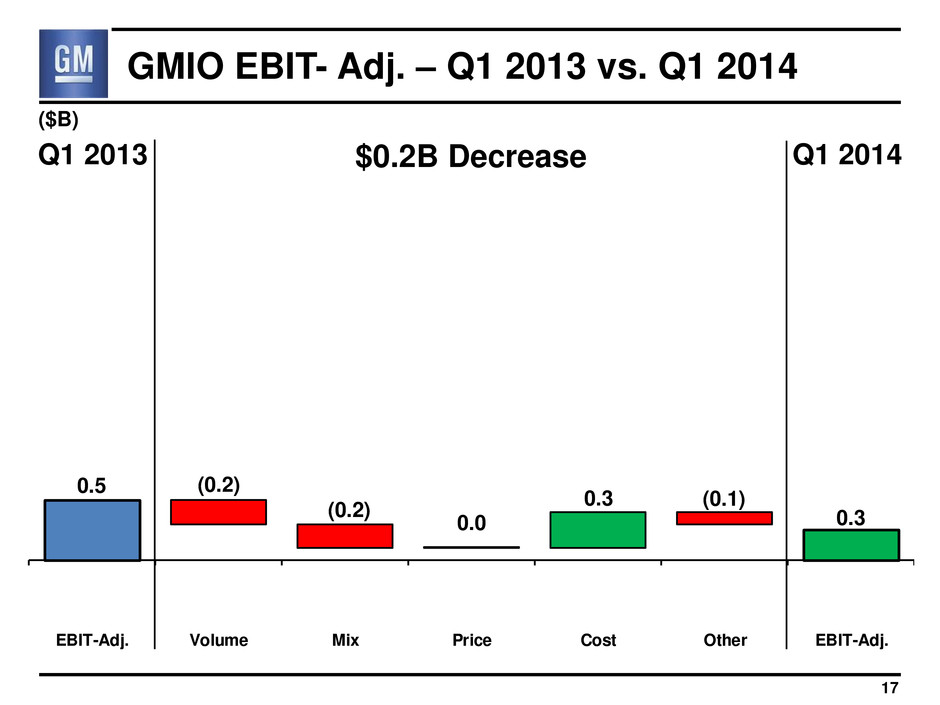
0.5 0.3 (0.2) (0.2) (0.1) 0.0 0.3 EBIT-Adj. Volume Mix Price Cost Other EBIT-Adj. GMIO EBIT- Adj. – Q1 2013 vs. Q1 2014 17 ($B) Q1 2013 Q1 2014 $0.2B Decrease
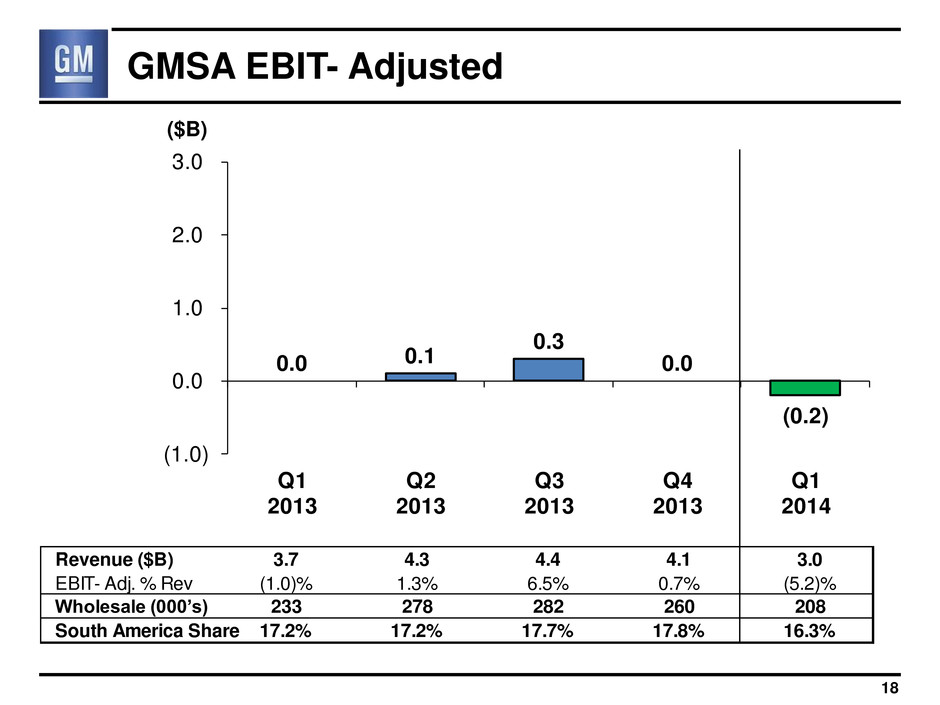
Revenue ($B) 3.7 4.3 4.4 4.1 3.0 EBIT- Adj. % Rev (1.0)% 1.3% 6.5% 0.7% (5.2)% Wholesale (000’s) 233 278 282 260 208 South America Share 17.2% 17.2% 17.7% 17.8% 16.3% 0.0 0.1 0.3 0.0 (0.2) (1.0) 0.0 1.0 2.0 3.0 Q1 2013 Q2 2013 Q3 2013 Q4 2013 Q1 2014 GMSA EBIT- Adjusted ($B) 18
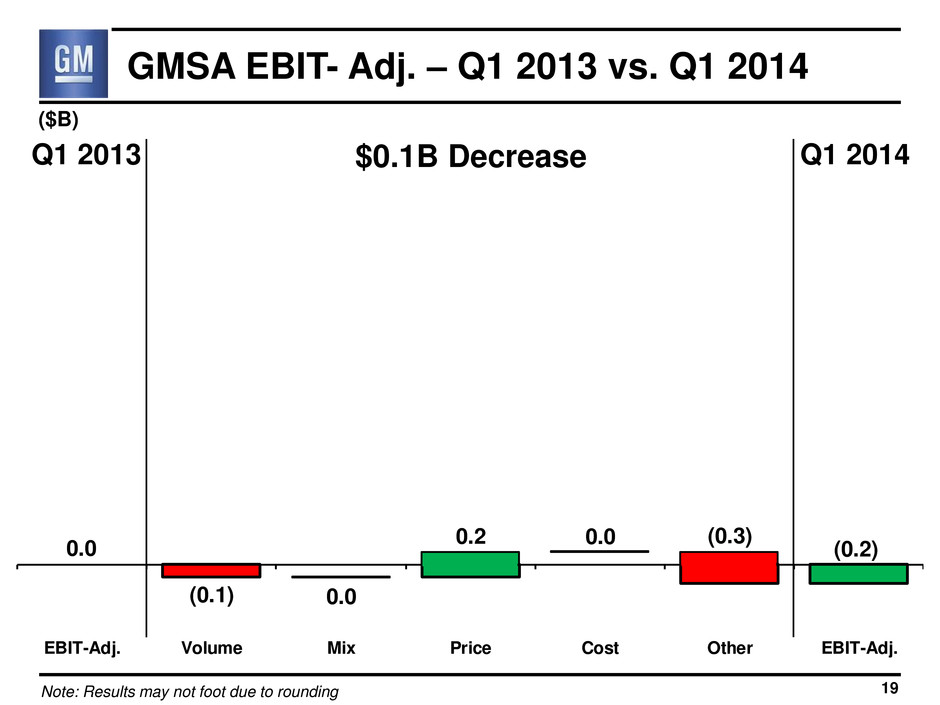
0.0 (0.2) (0.3) (0.1) 0.0 0.2 0.0 EBIT-Adj. Volume Mix Price Cost Other EBIT-Adj. GMSA EBIT- Adj. – Q1 2013 vs. Q1 2014 19 ($B) Q1 2013 Q1 2014 $0.1B Decrease Note: Results may not foot due to rounding
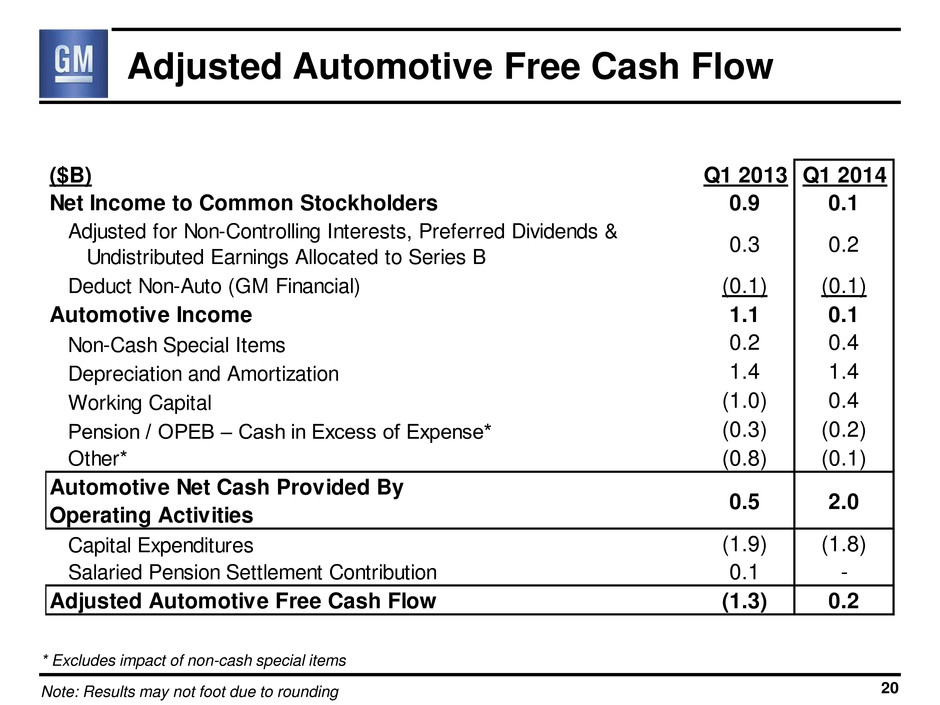
($B) Q1 2013 Q1 2014 Net Income to Common Stockholders 0.9 0.1 Adjusted for Non-Controlling Interests, Preferred Dividends & Undistributed Earnings Allocated to Series B 0.3 0.2 Deduct Non-Auto (GM Financial) (0.1) (0.1) Automotive Income 1.1 0.1 Non-Cash Special Items 0.2 0.4 Depreciation and Amortization 1.4 1.4 Working Capital (1.0) 0.4 Pension / OPEB – Cash in Excess of Expense* (0.3) (0.2) Other* (0.8) (0.1) Automotive Net Cash Provided By Operating Activities 0.5 2.0 Capital Expenditures (1.9) (1.8) Salaried Pension Settlement Contribution 0.1 - Adjusted Automotive Free Cash Flow (1.3) 0.2 Adjusted Automotive Free Cash Flow 20 * Excludes impact of non-cash special items Note: Results may not foot due to rounding
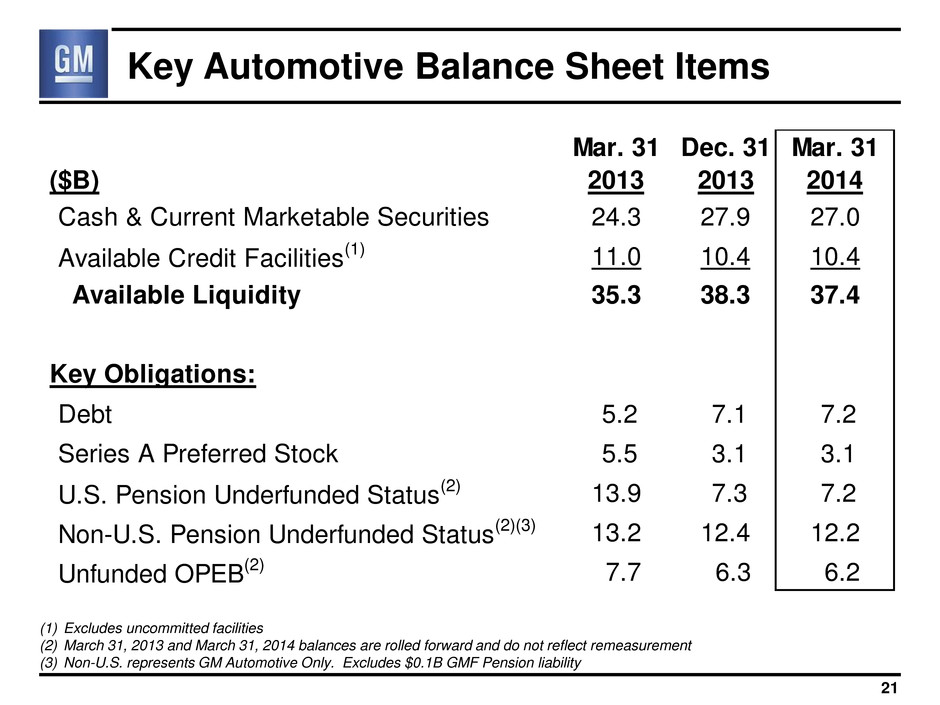
Mar. 31 Dec. 31 Mar. 31 ($B) 2013 2013 2014 Cash & Current Marketable Securities 24.3 27.9 27.0 Available Credit Facilities(1) 11.0 10.4 10.4 Available Liquidity 35.3 38.3 37.4 Key Obligations: Debt 5.2 7.1 7.2 Series A Preferred Stock 5.5 3.1 3.1 U.S. Pension Underfunded Status(2) 13.9 7.3 7.2 Non-U.S. Pension Underfunded Status(2)(3) 13.2 12.4 12.2 Unfunded OPEB(2) 7.7 6.3 6.2 Key Automotive Balance Sheet Items 21 (1) Excludes uncommitted facilities (2) March 31, 2013 and March 31, 2014 balances are rolled forward and do not reflect remeasurement (3) Non-U.S. represents GM Automotive Only. Excludes $0.1B GMF Pension liability
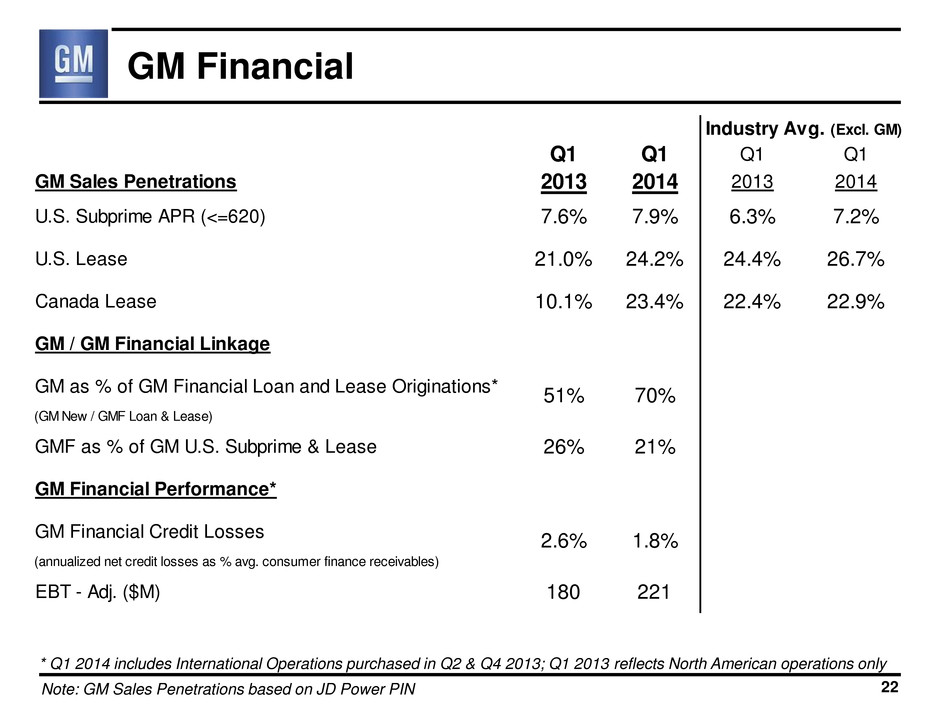
Q1 Q1 Q1 Q1 GM Sales Penetrations 2013 2014 2013 2014 U.S. Subprime APR (<=620) 7.6% 7.9% 6.3% 7.2% U.S. Lease 21.0% 24.2% 24.4% 26.7% Canada Lease 10.1% 23.4% 22.4% 22.9% GM / GM Financial Linkage GM as % of GM Financial Loan and Lease Originations* (GM New / GMF Loan & Lease) GMF as % of GM U.S. Subprime & Lease 26% 21% GM Financial Performance* GM Financial Credit Losses (annualized net credit losses as % avg. consumer finance receivables) EBT - Adj. ($M) 180 221 2.6% 1.8% Industry Avg. (Excl. GM) 51% 70% GM Financial 22 Note: GM Sales Penetrations based on JD Power PIN * Q1 2014 includes International Operations purchased in Q2 & Q4 2013; Q1 2013 reflects North American operations only
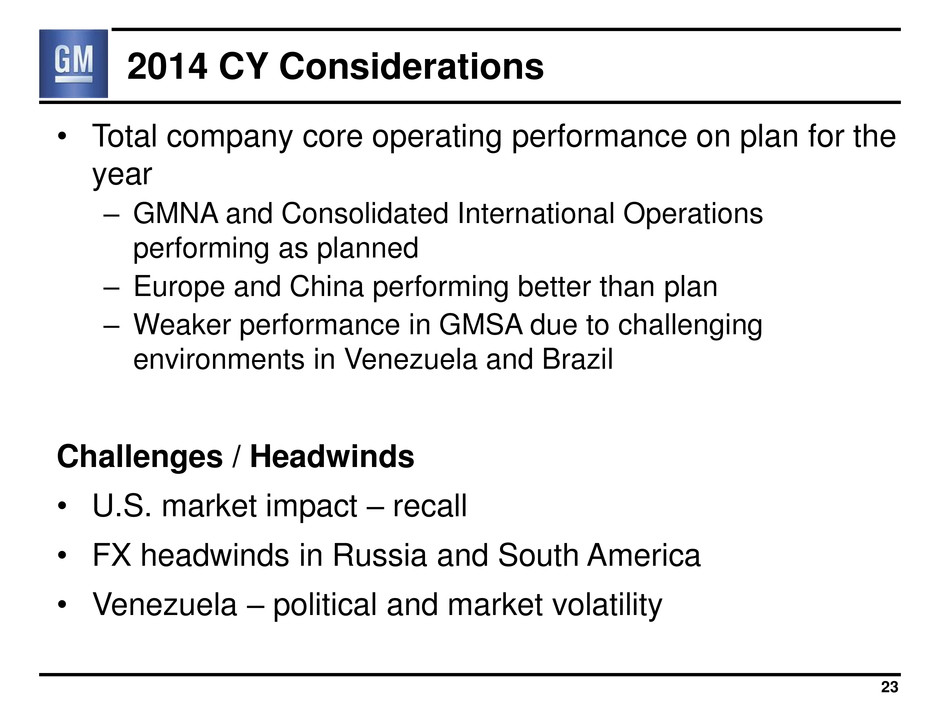
2014 CY Considerations • Total company core operating performance on plan for the year – GMNA and Consolidated International Operations performing as planned – Europe and China performing better than plan – Weaker performance in GMSA due to challenging environments in Venezuela and Brazil Challenges / Headwinds • U.S. market impact – recall • FX headwinds in Russia and South America • Venezuela – political and market volatility 23
General Motors Company Select Supplemental Financial Information
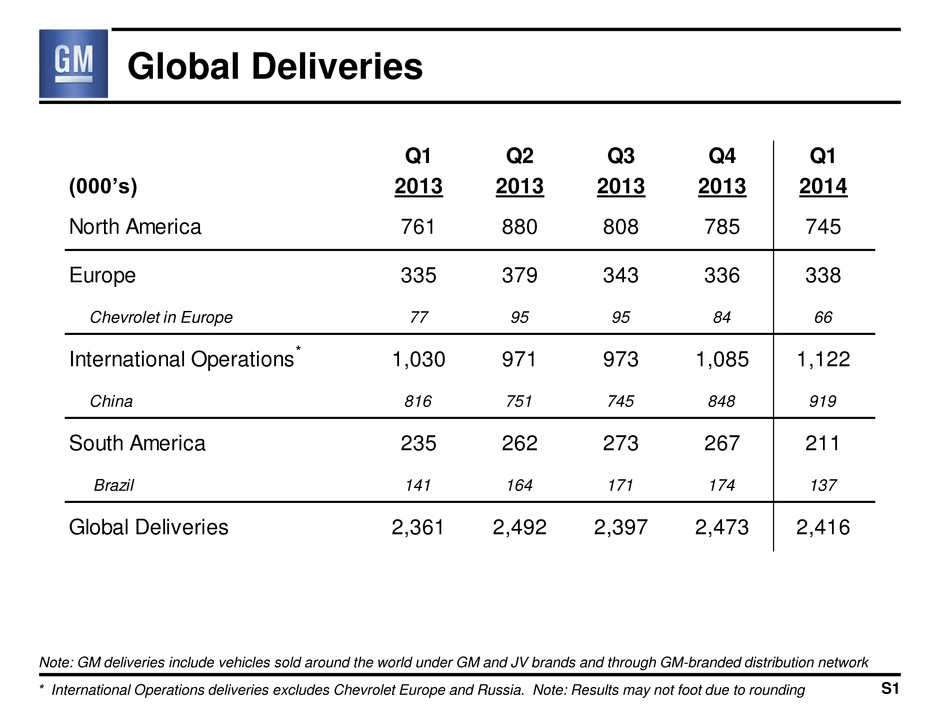
Q1 Q2 Q3 Q4 Q1 (000’s) 2013 2013 2013 2013 2014 North America 761 880 808 785 745 Europe 335 379 343 336 338 Chevrolet in Europe 77 95 95 84 66 International Operations 1,030 971 973 1,085 1,122 China 816 751 745 848 919 South America 235 262 273 267 211 Brazil 141 164 171 174 137 Global Deliveries 2,361 2,492 2,397 2,473 2,416 Global Deliveries Note: GM deliveries include vehicles sold around the world under GM and JV brands and through GM-branded distribution network S1 * * International Operations deliveries excludes Chevrolet Europe and Russia. Note: Results may not foot due to rounding
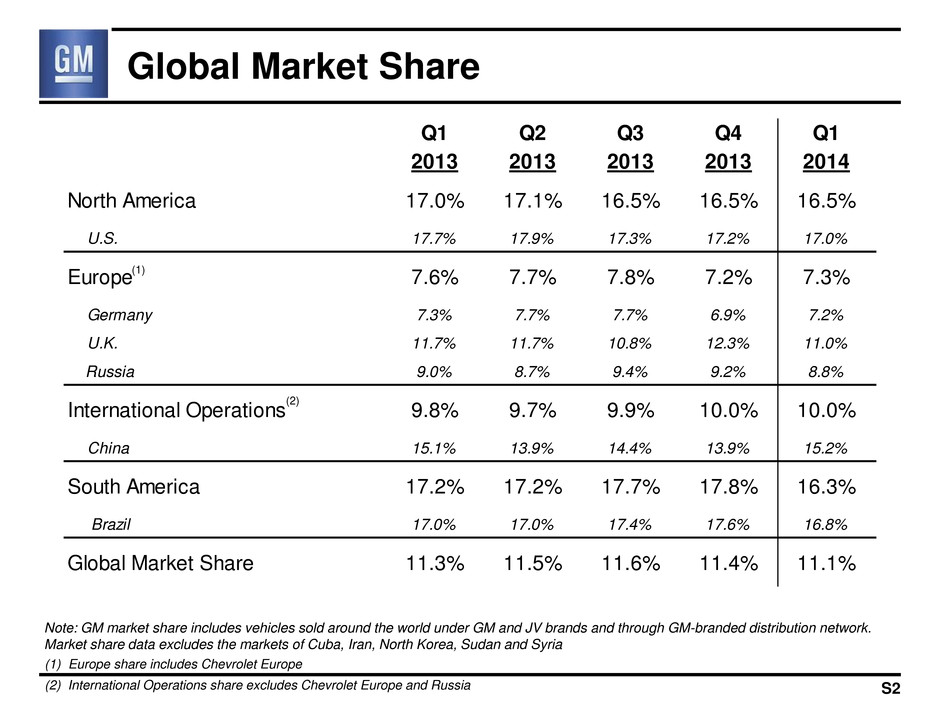
Q1 Q2 Q3 Q4 Q1 2013 2013 2013 2013 2014 North America 17.0% 17.1% 16.5% 16.5% 16.5% U.S. 17.7% 17.9% 17.3% 17.2% 17.0% Europe 7.6% 7.7% 7.8% 7.2% 7.3% Germany 7.3% 7.7% 7.7% 6.9% 7.2% U.K. 11.7% 11.7% 10.8% 12.3% 11.0% Russia 9.0% 8.7% 9.4% 9.2% 8.8% International Operations 9.8% 9.7% 9.9% 10.0% 10.0% China 15.1% 13.9% 14.4% 13.9% 15.2% South America 17.2% 17.2% 17.7% 17.8% 16.3% Brazil 17.0% 17.0% 17.4% 17.6% 16.8% Global Market Share 11.3% 11.5% 11.6% 11.4% 11.1% Global Market Share Note: GM market share includes vehicles sold around the world under GM and JV brands and through GM-branded distribution network. Market share data excludes the markets of Cuba, Iran, North Korea, Sudan and Syria S2 (1) Europe share includes Chevrolet Europe (2) International Operations share excludes Chevrolet Europe and Russia (1) (2)

Reconciliation of EBIT- Adjusted S3 Note: EBIT-Adj. includes GM Financial on an EBT-Adjusted basis. Results may not foot due to rounding * Included in Operating Income Q1 Q1 2013 2014 Income Before Income Taxes 1.6 0.1 Add Back: Net Income Attributable to Noncontrolling Interests 0.0 (0.1) Interest Expense 0.1 0.1 Interest Income (0.1) (0.1) Special Items: Venezuela Currency Devaluation* 0.2 0.4 EBIT- Adjusted 1.8 0.5 ($B)
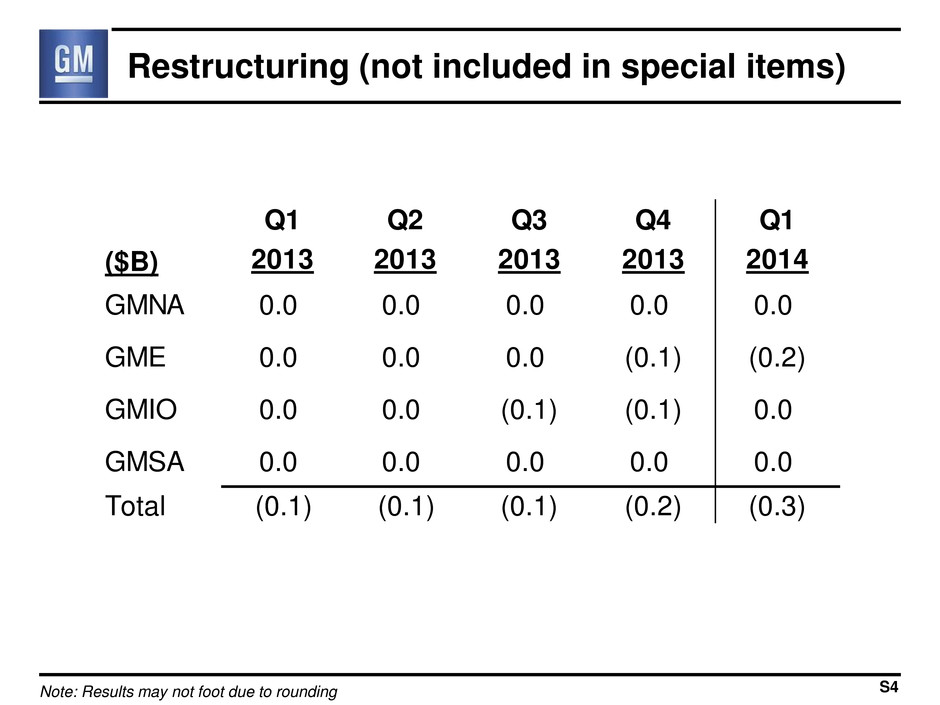
Restructuring (not included in special items) S4 Note: Results may not foot due to rounding Q1 Q2 Q3 Q4 Q1 ($B) 2013 2013 2013 2013 2014 GMNA 0.0 0.0 0.0 0.0 0.0 GME 0.0 0.0 0.0 (0.1) (0.2) GMIO 0.0 0.0 (0.1) (0.1) 0.0 GMSA 0.0 0.0 0.0 0.0 0.0 Total (0.1) (0.1) (0.1) (0.2) (0.3)
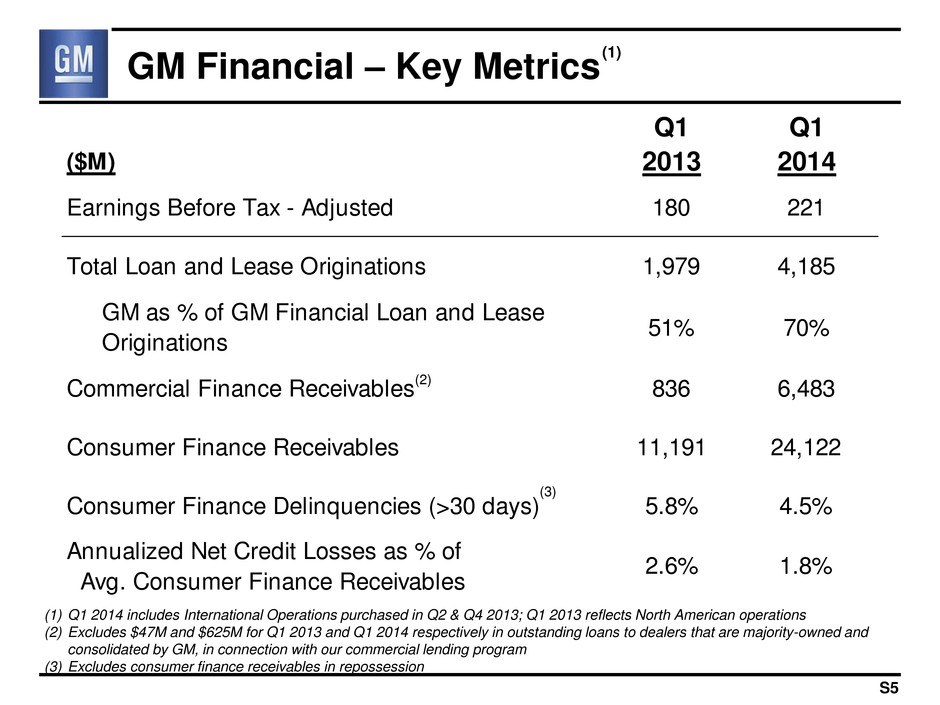
Q1 Q1 ($M) 2013 2014 Earnings Before Tax - Adjusted 180 221 Total Loan and Lease Originations 1,979 4,185 GM as % of GM Financial Loan and Lease Originations 51% 70% Commercial Finance Receivables 836 6,483 Consumer Finance Receivables 11,191 24,122 Consumer Finance Delinquencies (>30 days) 5.8% 4.5% Annualized Net Credit Losses as % of Avg. Consumer Finance Receivables 2.6% 1.8% GM Financial – Key Metrics S5 (1) (3) (2) (1) Q1 2014 includes International Operations purchased in Q2 & Q4 2013; Q1 2013 reflects North American operations (2) Excludes $47M and $625M for Q1 2013 and Q1 2014 respectively in outstanding loans to dealers that are majority-owned and consolidated by GM, in connection with our commercial lending program (3) Excludes consumer finance receivables in repossession


