Table of Contents
As filed with the Securities and Exchange Commission on July 14, 2011
Registration No. 333-175348
UNITED STATES
SECURITIES AND EXCHANGE COMMISSION
Washington, D.C. 20549
Amendment No. 2
to
Form F-1
REGISTRATION STATEMENT
UNDER
THE SECURITIES ACT OF 1933
Union Agriculture Group Corp
(Exact name of Registrant as specified in its charter)
| British Virgin Islands | 200 | None | ||
(State or other jurisdiction of incorporation or organization) | (Primary Standard Industrial Classification Code Number) | (I.R.S. Employer Identification Number) |
Union Agriculture Group Corp
Plaza Independencia 737 – 11000
Montevideo
Uruguay
+598 2900-0000
(Address, including zip code, and telephone number, including area code, of registrant’s principal executive offices)
CT Corporation System
111 Eighth Avenue
New York, New York 10011
(212) 894-8800
(Name, address, including zip code, and telephone number, including area code, of agent for service)
Copies to:
Adam M. Givertz Paul, Weiss, Rifkind, Wharton & Garrison LLP 1285 Avenue of the Americas New York, New York 10019 United States (212) 373-3000 | Jorge U. Juantorena Francesca L. Odell Cleary Gottlieb Steen & Hamilton LLP One Liberty Plaza New York, New York 10006 United States (212) 225-2000 |
Approximate date of commencement of proposed sale to the public: As soon as practicable after the effective date of this registration statement.
If any of the securities being registered on this Form are to be offered on a delayed or continuous basis pursuant to Rule 415 under the Securities Act of 1933, check the following box. ¨
If this Form is filed to register additional securities for an offering pursuant to Rule 462(b) under the Securities Act, check the following box and list the Securities Act registration statement number of the earlier effective registration statement for the same offering. ¨
If this Form is a post-effective amendment filed pursuant to Rule 462(c) under the Securities Act, check the following box and list the Securities Act registration statement number of the earlier effective registration statement for the same offering. ¨
If this Form is a post-effective amendment filed pursuant to Rule 462(d) under the Securities Act, check the following box and list the Securities Act registration statement number of the earlier effective registration statement for the same offering. ¨
CALCULATION OF REGISTRATION FEE
Title of Each Class of Securities to be Registered | Amount to be Registered | Proposed Maximum Aggregate Offering Price Per Share | Proposed Maximum Aggregate Offering Price(1)(2) | Amount of Registration Fee | ||||||||||||
Common Shares, without par value | Not Applicable | Not Applicable | $ | 246,428,580 | $ | 28,610.36 | ||||||||||
| (1) | Estimated solely for the purpose of calculating the registration fee pursuant to Rule 457(o) under the Securities Act of 1933, as amended, and based on a bona fide estimate of the public offering price. |
| (2) | Includes offering price of shares which the underwriters have the option to purchase. |
The Registrant hereby amends this Registration Statement on such date or dates as may be necessary to delay its effective date until the Registrant shall file a further amendment which specifically states that this Registration Statement shall thereafter become effective in accordance with Section 8(a) of the Securities Act of 1933 or until the Registration Statement shall become effective on such date as the Securities and Exchange Commission, acting pursuant to said Section 8(a), may determine.
Table of Contents
The information in this prospectus is not complete and may be changed. We may not sell these securities until the registration statement filed with the Securities and Exchange Commission is effective. This prospectus is not an offer to sell these securities and is not soliciting an offer to buy these securities in any jurisdiction where the offer or sale is not permitted.
SUBJECT TO COMPLETION, DATED JULY 14, 2011

14,285,715 Shares
Union Agriculture Group Corp
Common Shares
$ per share
This is an initial public offering of the common shares of Union Agriculture Group Corp. We are offering 14,285,715 common shares.
Prior to this offering, there has been no public market for our common shares. The initial public offering price of the common shares is expected to be between $13.00 and $15.00 per common share. We have been authorized to list our common shares on the New York Stock Exchange, or the NYSE, under the symbol “UAGR.”
We have granted the underwriters an option to purchase a maximum of 2,142,857 additional common shares to cover over-allotments.
Investing in our common shares involves risks. See “Risk Factors” on page 12.
| Price to Public | Underwriting Discounts and Commissions | Proceeds to Issuer | ||||||||||
Per Share | $ | $ | $ | |||||||||
Total | $ | $ | $ | |||||||||
Delivery of the common shares will be made on or about , 2011.
Neither the Securities and Exchange Commission nor any state securities commission has approved or disapproved of these securities or determined if this prospectus is truthful or complete. Any representation to the contrary is a criminal offense.
| Credit Suisse | J.P. Morgan | |
| Itau BBA | Wellington West Capital Markets | |
The date of this prospectus is , 2011.
Table of Contents
UAG’s acquired farmland as of July 13, 2011
($ in millions)
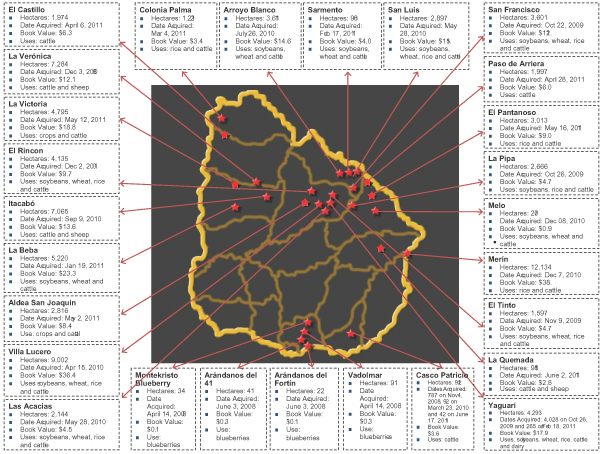
Table of Contents
| Page | ||||
| iii | ||||
| vi | ||||
| 1 | ||||
| 8 | ||||
| 10 | ||||
| 12 | ||||
| 29 | ||||
| 31 | ||||
| 32 | ||||
| 33 | ||||
| 34 | ||||
| 36 | ||||
MANAGEMENT’S DISCUSSION AND ANALYSIS OF FINANCIAL CONDITION AND RESULTS OF OPERATIONS | 38 | |||
| 73 | ||||
| 83 | ||||
| 107 | ||||
| 118 | ||||
| 127 | ||||
| 129 | ||||
| 130 | ||||
| 140 | ||||
| 142 | ||||
| 149 | ||||
| 158 | ||||
| 159 | ||||
| 160 | ||||
| 161 | ||||
| F-1 | ||||
We have not authorized anyone to provide any information other than that contained or incorporated by reference in this prospectus or in any free writing prospectus prepared by or on behalf of us or to which we have referred you. We take no responsibility for, and can provide no assurance as to the reliability of, any other information that others may give you. This document may only be used where it is legal to sell these common shares. The information in this document may only be accurate as of the date of this document. Our business, financial condition, results of operations and prospects may have changed since then.
This prospectus has been prepared on the basis that all offers of common shares will be made pursuant to an exemption under the Prospectus Directive, as implemented in member states of the European Economic Area, or EEA, from the requirement to produce a prospectus for offers of the common shares. Accordingly, any person making or intending to make any offer within the EEA of common shares which are the subject of the offering contemplated in this prospectus should only do so in circumstances in which no obligation arises for us or any of the underwriters to produce a prospectus for such offer. Neither we nor the underwriters have authorized, nor do they authorize, the making of any offer of common shares through any financial intermediary, other than offers made by the underwriters which constitute the final offering of common shares contemplated in this prospectus.
i
Table of Contents
The distribution of this prospectus and the offering and sale of the common shares in certain jurisdictions may be restricted by law. Persons who receive this prospectus must inform themselves about and observe any such restrictions. This prospectus does not constitute an offer of, or an invitation to purchase, any of the common shares in any jurisdiction in which such offer or invitation would be unlawful.
ii
Table of Contents
PRESENTATION OF FINANCIAL AND OTHER INFORMATION
Certain Defined Terms
In this prospectus, unless otherwise specified or if the context so requires:
| • | References to the terms “UAG,” “we,” “us,” “our” and “our company” refer to the registrant, Union Agriculture Group Corp, a company incorporated under the laws of the British Virgin Islands, or BVI, and its subsidiaries, unless otherwise indicated or the context otherwise requires. |
| • | References to “$,” “US$,” “U.S. dollars,” “dollars” and “USD” are to U.S. dollars. |
| • | References to “Uruguayan Pesos,” “Pesos” or “Ps.” are to Uruguayan Pesos, the legal currency of Uruguay. |
| • | References to “Canadian dollars” and “Cdn$” are to Canadian dollars, the legal currency of Canada. |
Financial Statements
Our audited consolidated financial statements as of June 30, 2010, 2009 and 2008, and for the years ended June 30, 2010 and 2009 and for the period from our inception on January 2, 2008 through June 30, 2008, or our Audited Consolidated Financial Statements, are prepared in accordance with International Financial Reporting Standards, or IFRS, as issued by the International Accounting Standards Board, or the IASB, and the interpretations of the International Financial Reporting Interpretations Committee, or the IFRIC. All IFRS issued by the IASB effective at the time of preparing our Audited Consolidated Financial Statements have been applied. We applied IFRS for the first time for the fiscal year ended June 30, 2010 with a transition date of January 2, 2008. See note 3 to our Audited Consolidated Financial Statements for details regarding our transition to IFRS and application of IFRS 1 “First Time Adoption of IFRS.” Our audited consolidated interim financial statements as of March 31, 2011 and for the nine-month periods ended March 31, 2011 and 2010, or our Audited Interim Consolidated Financial Statements, are prepared in accordance with IFRS as issued by the IASB, and the interpretations of the IFRIC, including IAS 34 “Interim Financial Reporting.” Our Audited Consolidated Financial Statements and our Audited Interim Consolidated Financial Statements, or, collectively, our Consolidated Financial Statements, are prepared under the historical cost convention as modified by financial assets and liabilities at fair value through profit or loss and biological assets and agricultural produce at the point of harvest measured at fair value. Earnings per share data included in our Consolidated Financial Statements was restated for all periods presented to give effect to the reverse stock split (as defined below) in accordance with IAS 33 “Earnings Per Share.” All other share data presented in our Consolidated Financial Statements was not retrospectively adjusted, as the reverse stock split is a non-adjusting event in accordance with IAS 10 “Events After the Reporting Period.”
We present our Consolidated Financial Statements in U.S. dollars, which is our functional and presentation currency.
Exchange Rates
Our financial statements are prepared and presented in U.S. dollars, and a portion of our expenses are transacted in Uruguayan Pesos. As a result, we are exposed to fluctuations in the exchange rates among the U.S. dollar and the Uruguayan Peso. See “Management’s Discussion and Analysis of Financial Condition and Results of Operations—Quantitative and Qualitative Disclosures About Market Risks.”
iii
Table of Contents
The following table sets forth the annual high, low, average and period-end daily interbank end-of-day bid rates for the periods indicated, expressed in Pesos per U.S. dollar, as reported by the Central Bank of Uruguay.
| Exchange Rate(1) | ||||||||||||
| High | Low | Average | ||||||||||
| (Peso per Dollar) | ||||||||||||
Year Ended June 30, | ||||||||||||
2008 | 24.550 | 19.100 | 20.950 | (2) | ||||||||
2009 | 24.350 | 19.534 | 22.414 | (2) | ||||||||
2010 | 21.329 | 19.042 | 20.027 | (2) | ||||||||
Month Ended | ||||||||||||
January 31, 2011 | 20.000 | 19.650 | 19.862 | (3) | ||||||||
February 28, 2011 | 19.650 | 19.468 | 19.584 | (3) | ||||||||
March 31, 2011 | 19.450 | 19.193 | 19.334 | (3) | ||||||||
April 30, 2011 | 19.150 | 18.885 | 18.996 | (3) | ||||||||
May 31, 2011 | 18.984 | 18.600 | 18.846 | (3) | ||||||||
June 30, 2011 | 18.600 | 18.400 | 18.521 | (3) | ||||||||
July 1 – 12 | 18.583 | 18.300 | 18.444 | (3) | ||||||||
| (1) | Daily interbank end-of-day bid rates (Dolar USA Fondo BCU). |
| (2) | Calculated using the average of the exchange rates on the last day of each month during the period. |
| (3) | Calculated using the average of the exchange rates on each day during the period. |
The exchange rate on July 12, 2011 was Ps. 18.550 to $1.00.
Fiscal Year
Our fiscal year begins on July 1 of each year and ends on June 30 of the following year.
Reverse Stock Split
Unless otherwise indicated, all information in this prospectus reflects, for all of our fiscal periods, the 6:1 reverse split of our outstanding common shares, or the reverse stock split, which became effective on June 23, 2011.
Market Data and Forecasts
We have obtained information and statistical data relating to the markets in which we operate from independent consultant reports, reports and publications published by governmental agencies and other publications, including, but not limited to, the Food and Agriculture Organization of the United Nations, or FAO, the Economist Intelligence Unit, or EIU, the Organisation for Economic Co-operation and Development, or OECD, the World Bank, the World Trade Organization, or WTO, the United States Department of Agriculture, or USDA, the Central Bank of Uruguay (Banco Central del Uruguay), or BCU, and the Agriculture Statistics Bureau’s 2010 Agricultural Statistics Yearbook, or DIEA, of the Uruguayan Ministry of Fishing, Agriculture and Livestock (Ministerio de Ganadería, Agricultura y Pesca), or MFAL, Transparency International, the Heritage Freedom Index’s “Economic Freedom Index”, the Mercer Eco-City Ranking, the Central Intelligence Agency’s World Factbook, or CIA World Factbook, the World Organization for Animal Health, the World Economic Forum’s Global Competitiveness Report 2008-2009, Uruguay XXI Investment and Export Promotion Agency, or Uruguay XXI, the World Soil Resources Report of the FAO, or the World Soil Resources Report, the Uruguayan Fruit Growers and Exporters Union (Unión de Productores y Exportadores de Frutas del Uruguay), or UPEFRUY, the Uruguayan Rice Growers Association (Asociasción de Cultivadores de Arroz del Uruguay), or ACA, the National Agricultural Research Institute (Instituto Nacional de Investigación Agropecuaria), or INIA, the GeoNova Group, or GeoNova, and the IBISWorld Industry Report 11111 (February 2011) and the
iv
Table of Contents
IBISWorld Industry Report 11115 (March 2011), or the IBISWorld Industry Reports. Although we have no reason to believe that any of this information is inaccurate in any material respect, we have not independently verified such information. The economic conditions in the markets in which we sell our products may deteriorate, and those economies may not grow at the rates projected by market data, or at all. The deterioration of the economic conditions in the markets in which we sell our products may have a material adverse effect on our business, financial condition and results of operations and the market price of our common shares.
Rounding
Some percentages and other amounts included in this prospectus were rounded up or down for ease of presentation. Accordingly, some of the figures shown as totals may not represent the exact sum of the amounts that precede them.
v
Table of Contents
We are a company incorporated under the laws of BVI. All of our assets are located outside the United States and Canada. Furthermore, all of our directors and officers and the experts named in this prospectus reside outside the United States and Canada and a substantial portion of their assets are located outside the United States and Canada. As a result, investors may not be able to effect service of process within the United States or Canada upon us or our directors or officers or experts or to enforce against us or them in United States courts judgments predicated upon the civil liability provisions of U.S. federal securities law or in Canadian courts predicated on Canadian securities laws. Likewise, it may also be difficult for an investor to enforce judgments obtained against us, or these persons in courts located in jurisdictions outside the U.S. or Canada, in U.S. or Canadian courts. It may also be difficult for an investor to bring an original action in a BVI or other foreign court predicated upon the civil liability provisions of the U.S. federal securities laws against us or these persons.
We have appointed CT Corporation System as our agent to receive service of process with respect to any action brought against us in the United States District Court for the Southern District of New York under the federal securities laws of the United States or of any states in the United States or any action brought against us in the Supreme Court of the State of New York under the securities laws of the State of New York. We will also appoint Cassels Brock & Blackwell LLP, Suite 2100, 40 King Street West, Toronto, Ontario M5H 3C2 as our agent for service of process in Canada.
It is possible for civil liabilities predicated upon U.S. federal securities law to be enforced through proceedings commenced in the courts of BVI, assuming such liabilities constitute a cause of action that is recognizable under the laws of BVI. Enforceability in BVI of judgments of U.S. courts based upon the civil liability provisions of U.S. federal securities law is, however, predicated upon such judgments fulfilling certain requirements under BVI law, including the conditions that:
| • | the proceedings pursuant to which such judgements were obtained were not contrary to natural justice, nor would they violate BVI’s public policy; and |
| • | these judgments were not in respect of penalties, taxes, fines or similar fiscal or revenue obligations of the party against whom or in respect of which such judgments were obtained. |
vi
Table of Contents
This summary highlights selected information about us and our common shares. Before investing in the common shares, you should read this entire prospectus carefully for a more complete understanding of our business and this offering, including our Consolidated Financial Statements and the related notes, and the sections entitled “Risk Factors,” “Management’s Discussion and Analysis of Financial Condition and Results of Operations” and “Regulatory and Environmental Overview” included elsewhere in this prospectus.
Our Company
We are one of the largest corporate agricultural landholders and operators in Uruguay and a leading producer of agricultural products for export to the global market. We have grown rapidly since our formation in 2008 and have fully paid for and acquired approximately 84,670 hectares of agricultural land in Uruguay for our operations. Substantially all of our land is held underpromesas, pursuant to which we expect to receive title at a later date. See “Business—Farmland Overview.” Our diversified agricultural operations include crops (soybeans and wheat), rice, dairy, cattle, sheep and other products (blueberries and honey). By combining our management’s experience and operational knowledge with state-of-the-art agricultural techniques, we have created a hard-to-replicate agricultural production platform in Uruguay.
We are focused on acquiring high-quality agricultural land that we believe is underutilized, developing such land for increased productivity and exploiting it in an efficient and sustainable manner. We have demonstrated our ability to identify attractive land acquisition opportunities by acquiring approximately 84,670 hectares since our formation in 2008, and signed contracts to purchase an additional 7,718 hectares of land, for a total average cost of approximately $3,213 per hectare. As of April 30, 2011, 70,901 hectares of our land, or 83.7% of our total land holdings, was valued at approximately $270.0 million by Deloitte S.C. We purchased this land for a total purchase price of $220.3 million. Based on Deloitte S.C.’s appraisal, as of April 30, 2011 the value of the properties appraised by Deloitte S.C. exceeded the purchase price by more than 20%. The price of agricultural land in Uruguay increased approximately 540% from 2001 to 2010. See “Business—Land—Price Development.” These land acquisitions have enabled us to rapidly expand our production scale, diversify our product and revenue mix and achieve significant negotiation power in the sale of our products.
After acquisition of new land, our focus is on rapidly optimizing its use, for example, by planting soybeans or rice on land previously only used for cattle grazing. We have an in-house group of agronomists and over 300 farmland employees to plan and execute our optimization process to increase productivity and returns on our acquired land. To further enhance our efficiency, we organize our operations by productive regions, with a dedicated manager and technical staff supervising nearby farmlands. Each regional manager is guided by a plan developed by management based on analyses of product performance metrics. This allows us to reduce our personnel and machinery expenses. By consolidating land in proximity, we reduce potential economies of scale for new entrants and increase barriers to entry for competitors. Finally, we impose tight controls on our costs of operations by managing all planning, hiring and purchasing activities centrally from our headquarters in Montevideo. To support these centralized operations, we rely on our ISO 9001-certified processes and our custom-built information management system. We believe our processes and system allow us to control our input costs and negotiate lower purchasing prices and higher selling prices.
We have financed our land acquisitions solely with funds from private placements of our common shares. Since our initial private placement in 2008 through March 31, 2011, we have raised aggregate net proceeds of $353.3 million. We believe that listing our shares in the public capital markets should allow us to access a larger pool of capital and enable us to accelerate our growth plan. We recorded net losses of $1.6 million and $0.4 million in the nine months ended March 31, 2011 and in our fiscal year ended June 30, 2010, respectively, and have recorded cumulative net losses of $4.6 million since our formation in 2008.
1
Table of Contents
Our strategy is to continue to expand our operations by acquiring more high-quality land that we believe is underutilized in Uruguay at attractive prices, and to be a large low-cost producer of food for global export. We intend to continue integrating new land acquisitions into our operations in order to increase our operational efficiency, continue to gain economies of scale, and to enhance profitability. Finally, we plan to achieve higher returns by leveraging our existing investments in employees, equipment and infrastructure for use on leased farmland close to our lands, with minimum additional investment.
Under the laws of Uruguay, we are not permitted to obtain legal title to rural land without first obtaining governmental authorization. As a result, we acquire land in Uruguay under purchase promise agreements, orpromesas. Under apromesa, the seller agrees to transfer legal title to us once the requisite governmental authorization has been obtained. We pay the full purchase price of the land at the time of execution of apromesa and have full rights to use such land, as well as the right to sell, transfer or assign thepromesa and the rights to the underlying land to a third-party purchaser. Approximately 99.8% of our land is held underpromesas. We recently obtained governmental authorization to obtain title to 17,846 hectares of land we hold underpromesas, or 21% of our total land holdings. We have applied for governmental authorization to obtain title with respect to 66,645 hectares of land we hold underpromesas, or 78.7% of our total land holdings, and we currently expect to obtain such governmental authorization by June 2012. In addition, as of July 1, 2011, under the laws of Uruguay, we are not entitled to use rural land without first obtaining governmental authorization. Until June 30, 2011, we were permitted to use 64,505 hectares of our land we hold underpromesas, or 76.2% of our total land holdings, pursuant to an exemption under the law. On June 22, 2011, we applied for governmental authorization to continue using such land. On June 23, 2011, the executive branch of the Uruguayan government issued a decree confirming that companies that had properly applied to obtain authorization could continue to use the land pending government determination of their applications. We expect to obtain this authorization 30 business days after the date we made the application, although there can be no assurance that the government will not deny the application. A proper application to obtain governmental authorization under the expedited process is an application submitted to the Uruguayan Ministry of Fishing, Agriculture and Livestock, or the MFAL, by an entity that has obtained prior authorization to own or use land and has timely requested that such authorization be extended to own or use additional land. We have concluded that we properly applied for governmental authorization and therefore are permitted to continue using the 64,505 hectares of land because the application was submitted by our wholly-owned subsidiary, Boisy S.A., which had previously obtained governmental authorization to use land, and that such application was submitted on June 22, 2011, and therefore it was timely filed. The Uruguayan government will review the application based on three factors: whether the applicant had previously received governmental authorization to use land; whether the land that is the subject of the application can be used for the requested purposes; and whether the application was timely filed. We fully expect that we will be granted the authorization under the expedited process based on (1) a certificate issued to us by the MFAL on June 24, 2011, certifying that the Uruguayan government does not have any comments with respect to the application as of the date of such certificate and (2) direct discussions with officials of the MFAL, who have indicated that such authorization is expected to be granted upon the expiration of the 30 business day waiting period. There can be no assurance that the government will not deny the expedited process application. If our application for authorization to use the land is denied under the expedited process, processing of our application will continue under the standard process, which process generally takes 12 to 16 months from the date of application to complete. However, during such time, we would continue to be able to use the land that is the subject of the standard authorization process. We are currently authorized to use all of our land held underpromesas, as the use of all of our land held underpromesas has either been authorized by the Uruguayan government or is subject to applications for authorization.Upon the completion of this offering, we intend to submit an application for governmental authorization to obtain title to, and use of, our lands held underpromesas under a different provision of the applicable law, namely the public company exception, which we would be permitted to apply for once this offering is completed and our common shares are traded on the NYSE, which we refer to as the Public Company Exception. We fully expect that we will receive such authorizations under the Public CompanyException in due course following completion of this offering. If, however, the Uruguayan government denies our requests for authorization under the exemptions available to us,or it is determined that
2
Table of Contents
the required authorization has not been adequately obtained, we could lose our rights to the use of such land, andany of our subsidiaries that has not obtained such authorization would be required to dissolve and liquidate its assets to our parent company. Although we do not intend to do so, we also have the right at any time to, and could, sell thepromesasto a third-party purchaser at market value. See “Business—Farmland Overview.”
Our Strengths
We believe the following are our competitive strengths:
| • | Unique farmland portfolio benefiting from the strategic advantages of Uruguay. We have acquired approximately 84,670 hectares of agricultural land in Uruguay on which we produce a diversified range of agricultural products for export to the global market. Our farmland portfolio makes us one of the largest corporate agricultural landholders in Uruguay and we believe this places us in a favorable competitive position that is very difficult to replicate by potential competitors. We believe Uruguay offers unique competitive advantages for agricultural exploitation and business development and has significant amounts of high-quality arable land that is currently underutilized. According to a 2007 FAO study, Uruguay has the world’s top rated soil quality. In addition, according to GeoNova, the country’s abundant rainfall, freshwater resources and moderate temperatures offer an ideal climate for agricultural production, allowing for two annual harvests by mixing certain crops such as planting soybeans and wheat in separate harvests in the same year. Furthermore, Uruguay’s trade relationships, infrastructure and close proximity to maritime transportation make it ideally suited for exporting agriculture production to the global market. Finally, we believe that Uruguay benefits from a stable political environment with limited land use regulation and low taxation compared to other countries in South America. |
| • | Proven track record of acquiring high-quality farmland. Our in-house farmland acquisition team has been able to quickly deploy our capital to acquire approximately 84,670 hectares of agricultural land in Uruguay since our formation in 2008. For example, we have already acquired approximately 36,000 hectares of land using approximately $130.0 million of the $155.0 million of net proceeds we received from our last private placement in December 2010 and January 2011. We believe that the farmland we have acquired is high-quality based on Uruguay’s top-rated soil quality, abundant rainfall, freshwater resources and moderate climate allowing for two annual harvests. |
| • | Identified pipeline provides substantial growth opportunities. According to the FAO, Uruguay has 14.2 million hectares of arable land, of which only 1.7 million hectares were cultivated in 2008. Our management team has identified approximately 145,000 hectares of underutilized land for potential acquisitions in the short term. We believe that this pipeline will provide us with the ability to acquire additional land at attractive prices, as we have done in the past. For example, between January and March 2011, we acquired an additional 7,677 hectares of land at an aggregate cost of $31.7 million. |
| • | Ability to develop underutilized land with a diversified business model and operating efficiency.We have acquired land that we believe was underutilized, either because it was used for a single and less efficient purpose than our intended use or because of the previous owners’ investment restrictions. We seek to optimize our operations and cost structure through the deployment of state-of-the-art agricultural techniques, including crop rotation systems and double cropping, which we believe allow us to achieve increased efficiency, enhanced returns and higher margins relative to other local competitors. To further our operating expertise and mitigate risks, we have developed a diversified portfolio of agricultural products, including wheat, soybeans, rice, dairy, cattle, sheep, blueberries and honey. This business model allows us to reduce the risks associated with climatic conditions that may adversely affect a particular product and lessens our exposure to the volatility of prices for a specific |
3
Table of Contents
commodity. Moreover, our crops are harvested at different points throughout the year, which enables us to better leverage capital allocated to harvesting machinery and reduces working capital needs. |
| • | Economies of scale provide us with negotiation power and lower our production costs. As a landholder of approximately 84,670 hectares of productive agricultural land, we have attained the size to achieve significant economies of scale in our agricultural operations. Currently, we have active operations on 75,414 hectares of land, or approximately 89.1% of our 84,670 hectares of land. With our size of operations, we are able to obtain higher selling prices for our products and better terms in the purchase of our primary supplies. We are also able to lower our costs of production by consolidating our personnel and machinery expenses. Our operations benefit from our ability to purchase state-of-the-art machinery and equipment that would not be economically viable for smaller enterprises. |
| • | Experienced local management with ownership stake.Our senior management team has an average of approximately 25 years of experience. Members of our management team have been active in the Latin American agricultural sector since the 1980s. Our founders, directors and management own approximately 5.8% of our company before giving effect to this offering, which we believe creates a strong alignment of incentives. |
Our Business Strategy
The key elements of our business strategy are:
| • | Acquire and develop underutilized farmland at attractive prices. Our objective is to increase our landholdings in Uruguay to 160,000 hectares, through acquisitions at attractive prices. To achieve our objective, we have identified more than 33 properties, for a total of approximately 145,000 hectares of underutilized agricultural land that could complement our existing landholdings. After acquisition of new land, we develop the land and optimize its use, for example, by planting soybeans or rice on land previously only used for cattle grazing. We have an in-house group of agronomists and over 300 farmland employees to plan and execute our optimization process to increase productivity and returns on our acquired land. |
| • | Continue to increase efficiency and achieve profitability of our farmland operations. We intend to operate our properties with high standards of efficiency, which we believe will make us a profitable and low-cost producer and enhance our position in the agricultural sector in South America. In addition, we believe that our strong financial position, with total assets of $364.8 million and liabilities of only $12.9 million as of March 31, 2011, will allow us to continue to invest in state-of-the-art machinery and equipment to maximize yields. |
| • | Produce premium products with sustainable methods. To ensure that our products meet a high standard that distinguishes us in the international market, we intend to continue using sustainable farming practices that comply with applicable environmental regulations, ensure crop rotation throughout the year, maximize efficient water use and minimize soil degradation. We are guided by the belief that premium agricultural products can only be grown through sustainable farming practices. |
| • | Generate additional returns by operating leased farmland located near our properties. In addition to managing the farmland we acquired, we plan to augment our existing operations by opportunistically leasing farmland located in close proximity to our existing operations. We believe that selectively adding leased lands to our operations will allow us to achieve higher returns by leveraging our existing investments in our employees, equipment and infrastructure for use on leased farmland, with minimum additional investment. |
4
Table of Contents
Global Agricultural Sector
We believe that the global agricultural sector can be expected to continue growing over the coming years, based on attractive supply and demand dynamics, including:
| • | rising demand due to economic growth, expanding populations, urbanization and changing diets; |
| • | increasing protein consumption driving an exponential increase in grain demand; |
| • | the emergence of grain-based biofuels as a substitute for non-renewable fuels, driving demand for grains for non-food uses; and |
| • | the expected continued increase in commodity prices over the medium term as a result of global arable land growth lagging increase in demand. |
According to the United Nations, the world population is expected to increase from 6.9 billion in 2010 to approximately 8.3 billion in 2030. Accordingly, we believe that agriculture will assume an even greater role in supplying products to satisfy the demand of a growing population.
Uruguay’s Competitive Advantages
Latin America, as a net exporter of agricultural products, is expected to benefit from the growth in agricultural demand and we believe that Uruguay is particularly well-positioned to capitalize on this growth. Specifically, we believe that Uruguay’s competitive advantages and low cost of production provide us with favorable dynamics to grow our agriculture, livestock and dairy businesses.
Soil
Agricultural activities in Uruguay enjoy the advantage of high quality soil. A 2007 FAO study ranks Uruguay first for soil quality out of 160 countries in the study. Ranking is based on a weighted overall score of seven different factors: (i) equivalent arable land, (ii) deserts and drylands, (iii) steeplands, (iv) land degradation severity, (v) actual arable land, (vi) land balance and (vii) population increase.
Uruguay’s soil resources are well preserved and according to the FAO, 87% of Uruguay’s land area has light or no human-induced degradation, compared with 37% for Argentina, 48% for Brazil and 40% for the U.S. According to the FAO, 70% of Uruguay’s total area is arable, compared with 26% for Argentina, 46% for Brazil and 28% for the U.S. However, only 9% of Uruguay’s arable land was used in 2008 according to the World Soil Resources Report. Consequently, there is substantial potential in Uruguay for increased usage of land and agriculture production.
Approximately 10 years ago, agricultural activity in Uruguay expanded to land that was previously considered not usable for agriculture. The expansion of agricultural activity on new land is still taking place in Uruguay and is related to the introduction of new farming technology, such as no-till farming, which does not disturb the soil through tillage. No-till farming practices allow Uruguay to increase its grain production by farming in new areas while maintaining high yields and preserving the soil.
Water
Uruguay has favorable water usage statistics and uses on average only 2.3% of its renewable water resources annually, according to the CIA World Factbook. The CIA World Factbook places Uruguay’s total annual water withdrawal at 3.15 cubic kilometers, or km3, per year, versus annual renewable water resources of 139 km3.
5
Table of Contents
The southern part of Uruguay lies on top of the Raigón aquifer, which is an important source of water for irrigation. As well, the dense network of rivers and creeks in Uruguay provides water for cattle and irrigation. With the proper permits, farmers in Uruguay can build dams on their land to store water for irrigation, or can pump water from rivers and lakes. The permit system ensures that a farmer will have access to water for farming.
Uruguay also sits atop the Guarani Aquifer, one of the largest reservoirs of groundwater in the world, which covers 1,190,000 square kilometers, or km², (45,000 km² in Uruguay), with a total volume of about 37,000 km³ and a natural recharge of 166 km³ per year, which may be accessed in the future as an alternative source of water.
Double Crop Growing Season
The ability to harvest multiple crops dramatically increases the yield of farmland given that fixed and capital costs typically remain the same regardless of the number of harvests. The suitability of a particular tract of farmland for double-cropping typically depends on favorable average temperature and precipitation conditions. Uruguay is well suited for a double-crop environment due to favorable average temperatures of between 52°F and 74°F (11°C to 23°C). In comparison, double-cropping would be difficult to achieve in the U.S. Midwest due to greatly varying temperatures of between 23°F and 76°F (-5°C to 23°C). Uruguay’s rainfall is both abundant, at approximately 49.7 inches (1,263 millimeters) per year, and roughly evenly distributed across the entire year. Combined, these two factors allow Uruguayan farmers to harvest two annual crops, whereas farmers can only have one harvest in most parts of North America and Europe.
Trade
Uruguay participates in several regional and international arrangements designed to promote cooperation in trade and investment. Uruguay has a flow of exports to a diversified list of countries, including China, the European Union, the U.S. and Canada, with no single country accounting for a majority of Uruguay’s exports. According to Uruguay XXI, from 2009 to 2010, exports from Uruguay increased 23% and in 2009, agro-industrial exports accounted for 77% of the Uruguay’s total exports.
As an agricultural export-driven economy, Uruguay actively promotes tax-free exports. Exporters in Uruguay also enjoy several other key benefits, including their ability to keep foreign currency proceeds from export sales. Goods and certain services exported from Uruguay are eligible for certain tax rebates.
Infrastructure and Location
Uruguay offers competitive advantages to investors, including a strategic geographical location, a network for the transportation of passengers and goods by sea, air and land, and a developed support infrastructure. The Global Competitiveness Report 2008-2009 (World Economic Forum) ranked Uruguay second in South America in terms of infrastructure development.
The road network in Uruguay is the most concentrated in Latin America, with 45 kilometers, or km, of paved roads per 1,000 km2 according to Uruguay XXI. Cargo is transported through Uruguay from the rest of the continent and the flow of international cargo is not restricted at Uruguayan border points according to Uruguay XXI.
According to Uruguay XXI, there are two important ports in Uruguay. The port of Montevideo is on the South American Atlantic coast. The port of Nueva Palmira is on the shore of the Uruguay River, and heads the most important inland waterway transport system in South America. In Uruguay, rice is primarily exported through the port of Montevideo and wheat and soybeans are primarily exported through the port of Nueva Palmira. According to Uruguay XXI, these two ports provide an important logistical advantage to the export of goods from Uruguay as a result of their proximity to most production areas in the country.
6
Table of Contents
Uruguay also has a developed telecommunications network, with 100% digital telecommunications and 98 cellular phone lines per 100 inhabitants as reported by Uruguay XXI.
Foreign Direct Investment
Uruguay has a legislative framework that ensures equal treatment of foreign and local investors and foreign access to all economic sectors. The legislative framework promotes and protects investments made by national and foreign investors as to be in the nation’s interest. As a result, Uruguay allows 100% foreign land ownership with no restrictions.
Uruguay is one of the most socially and politically stable countries in South America. Uruguay was recently ranked first in South America in the “Democracy Index (Economist Intelligence Unit)” study, second in South America in the “Low Corruption (Transparency International)” study, and second in South America in the “Economic Freedom Index (Heritage Foundation)” and the “Quality of Living (Mercer Eco-City Ranking)” studies.
Risks Related to Our Business and Industries
Investing in our securities involves substantial risk, and our business is subject to numerous risks and uncertainties. You should carefully consider all of the information set forth in this prospectus and, in particular, the information under the heading “Risk Factors” and “Forward-looking Statements,” prior to making an investment in our securities.
Our Corporate Information
We were incorporated as a company limited by shares under the laws of BVI on January 2, 2008. Our registered office is located at Vanterpool Plaza, 2nd floor, Wickhams Cay I, Road Town, Tortola, British Virgin Islands. Our principal executive office is at Plaza Independencia 737 – 11000, Montevideo, Uruguay, and our phone number is +598 2900-0000. We have appointed CT Corporation System as our agent for service of process in the United States, located at 111 Eighth Avenue, New York, NY 10011 and Cassels Brock & Blackwell LLP, located at Suite 2100, 40 King Street West, Toronto, Ontario M5H 3C2 as our agent for service of process in Canada.
7
Table of Contents
The following is a brief summary of the terms of this offering and should be read together with the more detailed information and financial data and statements contained elsewhere in this prospectus. For a more complete description of our common shares, see “Description of Share Capital” in this prospectus.
Issuer | Union Agriculture Group Corp |
Offering | We are offering 14,285,715 common shares. |
Offering Price | Between $13.00 and $15.00 per share. |
Over-Allotment Option | We have granted the underwriters the right to purchase up to an additional 2,142,857 common shares within 30 days from the date of this prospectus to cover over-allotments, if any. |
Use of Proceeds | We estimate that the net proceeds to us in this offering (based on the midpoint of the range set forth on the cover page of this prospectus), after deducting the underwriters’ discounts and commissions and estimated expenses incurred in connection with this offering, will be approximately $185.5 million. If the underwriters exercise their over-allotment option in full, we estimate that our net proceeds will be approximately $214.0 million, after deducting the underwriters’ discounts and commissions and estimated expenses incurred in connection with this offering. |
| We intend to use the proceeds of this offering to acquire additional farmland and the remainder, if any, for working capital and general corporate purposes. See “Use of Proceeds.” |
Share Capital Before and After Offering | Our issued and outstanding share capital consists of 36,881,684 common shares as of the date of this prospectus. Assuming an offering price of $14.00 per share (the midpoint of the range set forth on the cover page of this prospectus), immediately after the offering, we will have 51,167,399 common shares issued and outstanding, assuming no exercise of the underwriters’ over-allotment option. If the underwriters exercise their over-allotment option in full, we will have 53,310,256 common shares issued and outstanding. |
Voting Rights | Holders of our common shares are entitled to one vote per common share at any meeting of shareholders or on any resolution of shareholders. See “Description of Share Capital.” |
Dividends | We currently have no plans to pay dividends following the completion of this offering because we expect to retain our earnings for use in the development and expansion of our business. See “Dividend Policy.” |
Lock-up Agreements | We have generally agreed with the underwriters that, we will not, subject to certain exceptions, during the period commencing on the date of the underwriting agreement and ending 180 days after the date of the underwriting agreement, offer or sell any common shares or securities convertible into or exchangeable or exercisable for common |
8
Table of Contents
shares. We expect that our officers, directors and certain of our significant shareholders will each enter into similar lock-up restrictions. See “Underwriting.” |
Transfer Agents | American Stock Transfer & Trust Company, LLC and Equity Financial Trust Company |
Market for Shares | Prior to this offering, there has been no public market for our common shares. There can be no assurance that an active public market in the United States for the common shares will develop or that it will continue if one does develop. |
Listing | We have been authorized to list our common shares on the New York Stock Exchange under the symbol “UAGR.” |
Risk Factors | See “Risk Factors” beginning on page 12 and the other information included in this prospectus for a discussion of factors you should consider before deciding to invest in our common shares. |
Unless otherwise indicated, all information contained in this prospectus assumes no exercise of the over-allotment option granted to the underwriters.
Information in this prospectus does not reflect $5.0 million of common shares and $1.0 million of restricted shares that we have agreed to issue to certain of our executive officers as soon as practicable following completion of this offering at the initial public offering price. Based on the midpoint of the range on the cover page of this prospectus, we expect to issue 357,143 common shares and 71,429 restricted shares. The common shares will not be subject to vesting or forfeiture. The restricted shares are common shares that will be issued under our Equity Incentive Plan, which will vest at a rate of one-third per year and until vested will be subject to forfeiture in certain circumstances. See “Management—Compensation of Directors and Executive Officers—Union Agriculture Group Corp Equity Incentive Plan.”
9
Table of Contents
SUMMARY HISTORICAL FINANCIAL DATA
The following tables present our summary historical financial data as of and for the periods indicated below. We have derived the summary historical statement of comprehensive income, statement of cash flows and statement of financial position data as of and for the years ended June 30, 2010 and 2009, and as of June 30, 2008 and for the period from our inception on January 2, 2008 through June 30, 2008 from our Audited Consolidated Financial Statements included elsewhere in this prospectus. We have derived the summary historical statement of comprehensive income, statement of cash flows for the nine-month periods ended March 31, 2011 and 2010, and our summary statement of financial position data as of March 31, 2011, from our Audited Interim Consolidated Financial Statements included elsewhere in this prospectus. The historical results for any prior period presented are not necessarily indicative of our results to be expected for any future period.
Our Audited Consolidated Financial Statements are prepared in accordance with IFRS as issued by the IASB, and the interpretations of the IFRIC. All IFRS issued by the IASB effective at the time of preparing our Audited Consolidated Financial Statements have been applied. We applied IFRS for the first time for the fiscal year ended June 30, 2010 with a transition date of January 2, 2008. See note 3 to our Audited Consolidated Financial Statements for details regarding our transition to IFRS and application of IFRS 1 “First Time Adoption of IFRS”. Our Audited Interim Consolidated Financial Statements are prepared in accordance with IFRS as issued by the IASB, and the interpretations of the IFRIC, including IAS 34 “Interim Financial Reporting”.
You should read the information contained in these tables in conjunction with “Selected Consolidated Financial Data,” “Capitalization,” “Management’s Discussion and Analysis of Financial Condition and Results of Operations,” “Presentation of Financial and Other Information” and our Consolidated Financial Statements and the accompanying notes included elsewhere in this prospectus.
| Fiscal Year Ended June 30, | Nine Months Ended March 31, | |||||||||||||||||||
| 2010 | 2009 | 2008 | 2011 | 2010 | ||||||||||||||||
Statement of Comprehensive Income Data: | ||||||||||||||||||||
Sales of agricultural produce and biological assets and services rendered | $ | 1,580,880 | $ | 199,394 | $ | — | $ | 6,212,163 | $ | 147,016 | ||||||||||
Rental income | 54,133 | — | — | 529,312 | 30,933 | |||||||||||||||
Cost of agricultural produce and biological assets sold and services rendered | (1,573,883 | ) | (157,772 | ) | — | (5,926,605 | ) | (128,902 | ) | |||||||||||
Initial recognition and changes in fair value of biological assets and agricultural produce | 5,335,808 | 232,324 | 5,864 | 11,575,441 | 2,541,921 | |||||||||||||||
Cost of production | (3,437,732 | ) | (943,392 | ) | (5,864 | ) | (7,595,472 | ) | (2,708,184 | ) | ||||||||||
Margin Before Operating Expenses | 1,959,206 | (669,446 | ) | — | 4,794,839 | (117,216 | ) | |||||||||||||
General and administrative expenses | (3,582,205 | ) | (1,636,123 | ) | (104,408 | ) | (7,668,310 | ) | (2,158,190 | ) | ||||||||||
Selling expenses | (24,613 | ) | (3,911 | ) | — | (124,243 | ) | (2,762 | ) | |||||||||||
Other operating income, net | — | 1,618 | — | 36,544 | — | |||||||||||||||
Loss from Operations Before Financing and Taxation | (1,647,612 | ) | (2,307,862 | ) | (104,408 | ) | (2,961,170 | ) | (2,278,168 | ) | ||||||||||
Financial results, net | 1,370,817 | (212,127 | ) | (6,615 | ) | 1,110,148 | 1,401,127 | |||||||||||||
Loss Before Income Tax | (276,795 | ) | (2,519,989 | ) | (111,023 | ) | (1,851,022 | ) | (877,041 | ) | ||||||||||
10
Table of Contents
| Fiscal Year Ended June 30, | Nine Months Ended March 31, | |||||||||||||||||||
| 2010 | 2009 | 2008 | 2011 | 2010 | ||||||||||||||||
Income tax expense | (81,643 | ) | (157,614 | ) | (5,249 | ) | 249,951 | 131,173 | ||||||||||||
Loss for the Year/ Period | (358,438 | ) | (2,677,603 | ) | (116,272 | ) | (1,601,071 | ) | (745,868 | ) | ||||||||||
Total Comprehensive Loss for the Year/ Period | $ | (358,438 | ) | $ | (2,677,603 | ) | $ | (116,272 | ) | $ | (1,601,071 | ) | $ | (745,868 | ) | |||||
Loss / Total Comprehensive Loss Attributable to: | ||||||||||||||||||||
Equity holders of the parent | $ | (336,833 | ) | $ | (2,586,911 | ) | $ | (107,549 | ) | $ | (1,601,071 | ) | $ | (724,263 | ) | |||||
Non-controlling interest | (21,605 | ) | (90,692 | ) | (8,723 | ) | — | (21,605 | ) | |||||||||||
Losses per share for loss attributable to equity holders of the parent during the year/ period: | ||||||||||||||||||||
Basic and Diluted | $ | (0.021 | ) | $ | (0.305 | ) | $ | (0.374 | ) | $ | (0.055 | ) | $ | (0.055 | ) | |||||
Cash Flow Data: | ||||||||||||||||||||
Net cash used in operating activities | $ | (13,680,833 | ) | $ | (2,153,973 | ) | $ | (290,891 | ) | $ | (12,037,844 | ) | $ | (6,501,240 | ) | |||||
Net cash used in investing activities | (96,117,100 | ) | (14,488,838 | ) | (1,064,532 | ) | (108,171,514 | ) | (42,729,322 | ) | ||||||||||
Net cash generated from financing activities | 109,872,680 | 83,735,281 | 1,319,515 | 158,016,627 | 101,842,190 | |||||||||||||||
| As of June 30, | As of March 31, 2011 | |||||||||||||||
| 2010 | 2009 | 2008 | ||||||||||||||
Statement of Financial Position Data: | ||||||||||||||||
Cash and cash equivalents | $ | 67,125,638 | $ | 67,014,579 | $ | 43,148 | $ | 104,942,161 | ||||||||
Biological assets | 7,744,547 | 1,922,742 | 730,936 | 23,463,716 | ||||||||||||
Inventories | 1,824,832 | 33,389 | — | 1,684,450 | ||||||||||||
Property, plant and equipment, net | 4,488,147 | 958,580 | 525,299 | 9,227,249 | ||||||||||||
Land underpromesas(1) | 100,714,669 | 12,230,211 | 712,909 | 190,864,497 | ||||||||||||
Investment property underpromesas, net | 4,633,968 | — | — | 23,293,946 | ||||||||||||
Total assets | 196,827,646 | 85,948,053 | 2,736,125 | 364,809,769 | ||||||||||||
Total liabilities | 3,355,292 | 2,007,969 | 141,938 | 12,943,785 | ||||||||||||
Share capital | 193,373,922 | 84,266,985 | 2,513,059 | 348,881,666 | ||||||||||||
Equity attributable to equity holders of the parent | 193,472,354 | 83,897,850 | 2,461,261 | 351,865,984 | ||||||||||||
Non controlling interest | — | 42,234 | 132,926 | — | ||||||||||||
| (1) | See “Management’s Discussion and Analysis of Financial Condition and Results of Operations—Critical Accounting Policies and Estimates—Land Under Promesas” for more details. |
11
Table of Contents
Investing in our common shares involves a high degree of risk. Before making an investment decision, you should carefully consider the information contained in this prospectus, particularly the risks described below, as well as in our Consolidated Financial Statements and accompanying notes included in this prospectus. Our business activities, cash flow, financial condition and results of operations could be materially and adversely affected by any of these risks. In addition, the market price of our common shares may decrease due to any of these risks, and you may lose all or part of your investment. The risks described below are all known material risks that we currently believe may materially affect us.
Risks Related to Our Business and Industries
Unpredictable weather conditions, pest infestations and diseases may have an adverse impact on agricultural, livestock, dairy and apiculture production.
The occurrence of severe adverse weather conditions, especially droughts, hail, floods or frost, is unpredictable and may have a potentially devastating impact on agricultural, livestock, dairy and apiculture production, and may otherwise adversely affect the supply and price of the agricultural commodities that we sell and use in our business. Adverse weather conditions may be exacerbated by the effects of climate change. The effects of severe adverse weather conditions may reduce yields of our products or require us to increase our level of investment to maintain yields. Additionally, higher than average temperatures and rainfall can contribute to an increased presence of insects, which could negatively affect crop, rice and livestock yields. In 2008 and 2009, Uruguay suffered one of its worst droughts of the last 70 years. Future droughts could reduce the yield and quality of our agricultural, livestock and dairy production, which could materially and adversely affect our results of operations of our business.
Global climate changes have caused Uruguay’s climate to begin to shift from sub-tropical to tropical. As a result, average honey production per hive in Uruguay has stopped increasing in recent years. In addition, in the past few years, prolonged droughts followed by flooding, an increase in farmland planted in transgenic soybeans, and the growing use of pesticides and herbicides have posed a threat to beehives in Uruguay. Continuation of these factors could adversely affect our apiculture operations, which could adversely affect our business, financial condition and results of operations.
The occurrence and effects of disease and plagues can be unpredictable and devastating to agricultural, livestock, dairy and apiculture products, potentially rendering all or a substantial portion of the affected harvests unsuitable for sale. Our crops, rice and blueberries are also susceptible to fungus and bacteria that are associated with excessively moist conditions. Even when only a portion of the production is damaged, our results of operations could be adversely affected because all or a substantial portion of the production costs may have been incurred. Although some diseases are treatable, the cost of treatment is high, and such events could adversely affect our operating results and financial condition. Furthermore, if we fail to control a given plague or disease and our production is threatened, we may be unable to supply our customers, which could adversely affect our business, financial condition and results of operations.
Diseases among our cattle and sheep herds, such as brucellosis and foot-and-mouth disease, can have an adverse effect on dairy production and fattening, rendering cows and sheep unable to produce dairy or meat for human consumption. Outbreaks of cattle and sheep diseases may also result in the closure of certain important markets, such as the United States, to our cattle and sheep products. In May 2001, an outbreak of foot-and-mouth disease spread throughout Uruguay, affecting almost one million heads of cattle. The outbreak brought rural areas and the meat industry to a standstill and curtailed Uruguayan beef exports to North America. A future outbreak of diseases among our cattle and sheep herds could adversely affect our cattle, sheep and dairy sales, which could adversely affect our business, financial condition and results of operations.
12
Table of Contents
Fluctuation in market prices for our products could adversely affect our business, financial condition and results of operations.
Prices for agricultural products, like those of other commodities, have historically been cyclical and sensitive to domestic and international changes in supply and demand and can be expected to fluctuate significantly. In addition, some of the agricultural products we produce, such as soybeans and wheat, are traded on commodities and futures exchanges and thus are subject to speculative trading, which could adversely affect us. The prices that we are able to obtain for our agricultural products depend on many factors beyond our control including:
| • | prevailing world commodity prices, which historically have been subject to significant fluctuations over relatively short periods of time, depending on worldwide demand and supply; |
| • | changes in the agricultural subsidy levels of certain important producers (mainly the U.S. and the European Union, or EU), and the adoption of other government policies affecting industry market conditions and prices; |
| • | changes to trade barriers of certain important consumer markets (including China, India, the U.S. and the EU); |
| • | changes in government policies for biofuels; |
| • | world inventory levels (i.e., the supply of commodities carried over from year to year); |
| • | climatic conditions and natural disasters in areas where agricultural products are cultivated; |
| • | the production capacity of our competitors; and |
| • | demand for and supply of competing commodities and substitutes. |
We seek to optimize the use of our properties and make decisions regarding increasing or decreasing production of one agricultural product or another based, in part, on our expectations regarding market conditions and land use optimization. Such decisions could prove incorrect, which could adversely affect our results of operations. Further, there is a strong relationship between the value of our land holdings and market prices of the commodities we produce, which are affected by global economic conditions. A decline in the prices of rice, soybeans, wheat, cattle, sheep or blueberries below their current levels for a sustained period of time could significantly reduce the value of our land holdings and materially and adversely affect our financial condition.
Prices for agricultural land in Uruguay have rapidly escalated over the past decade and we have purchased our land at prices far in excess of historical averages. Any significant deterioration in the Uruguayan agricultural real estate market may materially adversely affect our business, financial condition and results of operations.
The real estate market in Uruguay is strong and over the past decade prices for agricultural land in Uruguay have increased dramatically. For example, according to the DIEA, the average price per hectare of agricultural land in Uruguay increased approximately 260% from 2005 to 2010 and approximately 540% from 2001 to 2010. Substantially all of our assets are Uruguayan farmlands that we have acquired since 2008 at prices far in excess of historical averages. While the price increases of the past decade may be driven in part by a strengthening Uruguayan economy combined with increased global demand for agricultural products, the rapid escalation of prices may exceed the economic factors underlying such growth. To the extent that such price increases exceed intrinsic value, the Uruguayan agricultural real estate market may be experiencing a bubble similar to that recently experienced in the residential real estate market in the United States and other parts of the world. In their late stages, real estate bubbles are typically characterized by rapid increases in the valuations of real property until unsustainable levels are reached relative to other economic indicators. This is typically followed by rapid decreases in prices set off by deterioration in the economic factors underlying growth. If the Uruguayan market for agricultural land is experiencing a bubble, any deterioration in the underlying economic factors, such as a
13
Table of Contents
decline in global demand for agricultural products, could burst such bubble, causing a rapid decline in the value of our land. Under IFRS, recoverable amount is defined as the higher of an asset’s fair value less costs to sell and its value in use. Accordingly, if the carrying value of our land, and our land underpromesas, could not be supported by either the resale value of the land or the cash flows from its value in use as an agricultural property, this may cause us to recognize significant impairment losses, which may have a material adverse effect on our business, financial condition and results of operations.
We have a limited operating history with a history of losses and we may not achieve or maintain profitability or generate sufficient cash flow.
We have a limited operating history and we have recorded negative cash flows and incurred operating losses in every fiscal year since our formation. From our formation to March 31, 2011, we have incurred cumulative losses of $4.6 million and we recorded negative operating cash flows of $12.0 million in the nine months ended March 31, 2011, $13.7 million in fiscal year 2010, $2.2 million in fiscal year 2009 and $0.3 million in fiscal year 2008, resulting primarily from the establishment of our business. The continued development of our business and the acquisition of additional farmland will require us to make significant capital expenditures. These expenditures, together with associated operating expenses, may result in continued negative cash flow and net losses in the foreseeable future. In addition, with our relatively limited operating history, the risk profile of our business may be higher than for those companies with more established records of operation. We may continue to record losses and negative cash flows in future periods, our losses may increase in the future, and in the event that we do have profits, we may be unable to sustain our operating cash flow.
Our limited operating history may not serve as an adequate basis on which to evaluate our current business and future prospects and results of operations.
We have a limited operating history upon which to evaluate the viability and sustainability of our current business and future prospects. Accordingly, you should consider our future prospects in light of the risks and uncertainties experienced by other early stage agricultural companies. If we are unsuccessful in addressing any of these risks and uncertainties, our business, financial condition, results of operations and future growth could be adversely affected.
We may depend on new capital to fund the development of our business. Our inability to obtain new capital could adversely affect our business, financial condition and results of operations.
We have financed our business with new equity because our cash flow from operations was insufficient to provide the necessary capital to fund our operations and expansion. We may need additional capital to fund our operations and acquisitions of farmland. If we are unable to raise equity or debt financing on favorable terms, we may not be able to fund our capital expenditures and we will be required to change our current business plan, which could have a material adverse effect on our business, financial condition and results of operations.
The expansion of our business through land acquisitions poses risks that may reduce the benefits we anticipate from these transactions.
We have grown primarily through land acquisitions and plan to continue growing by acquiring other farmland throughout Uruguay. However, our management is unable to predict whether or when any prospective land acquisitions will occur, or the likelihood of certain transactions being completed on favorable terms and conditions. Our ability to continue to expand our business successfully through land acquisitions depends on many factors, including our ability to identify land for acquisition or to access capital markets at a favorable cost and negotiate favorable transaction terms. Even if we are able to identify acquisition targets and obtain the necessary financing to carry out these acquisitions, we could financially overextend ourselves, especially if a land acquisition is followed by a period of lower than projected prices for our products.
14
Table of Contents
Acquiring land also exposes us to risks associated with activities on such land by prior owners. The due diligence we typically conduct in connection with an acquisition, and any contractual guarantees or indemnities that we may receive from the sellers of that land, may not be sufficient to protect us from, or compensate us for, actual liabilities. Any material liability associated with an acquisition could adversely affect our reputation and results of operations and reduce the benefits of the acquisition.
If we do not obtain governmental authorizations with respect to all of our lands, we could lose the rights to the use of such lands.
We execute purchase promise agreements, orpromesas de compraventa, instead of definitive purchases, orcompraventas definitivas,to acquire our rural land in Uruguay. In order for our subsidiaries to obtain legal title to and use the rural land acquired under apromesa, Uruguayan law requires that each such subsidiary obtain prior governmental authorization. We have received governmental authorization to obtain legal title to and use certain of our lands in the past, and we expect to obtain such authorizations in the future. If, however, the Uruguayan government denies our requests for authorization under the exemptions available to us, or it is determined that the required authorization has not been adequately obtained, we could lose our rights to the use of such land, and any of our subsidiaries that has not obtained such authorization would be required to dissolve and liquidate its assets to our parent company. Any such liquidation could be on unfavorable terms, and could deprive us of the benefits of the rights to the use of such lands underpromesas. Any liquidation of a substantial portion of our assets, or any loss of our rights to the use of such lands, could have a material adverse effect on our business, financial condition and results of operations. See “Business–Farmland Overview,” “Regulatory and Environmental Overview–Sale and Ownership of Real Estate” and “Regulatory and Environmental Overview–Rural Real Estate” for more details.
Our title to our farmland may have defects or may not be valid.
We have not conducted surveys of all our farmland and, consequently, the precise area and location of our titles may be in doubt. Title to our farmlands may be subject to clerical errors in the official certificates or plans or other undetected title defects. Any such clerical errors or defects in the chain of ownership could subject us to third party title claims as the last acquiror of the farmland. A claim contesting our title to a farmland may cause us to lose our right to farm the land and we may incur significant costs related to the defense of our title, which would adversely affect our business and financial condition.
Our leases with respect to some of our farmlands may not be renewed on terms and conditions favorable to us.
We currently lease farmland as a lessee and intend to increase the amount of farmland that we lease in the future. We began leasing farmland in September 2009, and our current leases are for short term periods of one to three years, and we expect future leases to be of a similar duration. We may be unable to secure new leases to expand our operations on terms that are favorable to us, which would limit our ability to optimize our operations as currently planned. We also may not be able to renew leases after their respective terms conclude. Even if we are able to renew these leases, such renewals may not be on terms and conditions that are favorable to us. Any failure to renew the leases or lease other lands that are suitable for our business needs in sufficient quantity and at reasonable prices to develop our activities could adversely affect our results of operations, increase our costs or force us to seek alternative properties, which may not be available or be available only at higher prices.
We face competition in the markets in which we operate and for the acquisition of farmland.
We operate in a market where there are other competitors. Competition within the agricultural, livestock, dairy and apiculture industry is based primarily on quality and price. If we are unable to compete effectively in these areas, we may lose existing customers or fail to acquire new customers, which would have a material adverse effect on our business, financial condition and results of operations. We rely on advanced technological and scientific methodologies to improve our operations. If we fail to adopt new technology or to continually upgrade our facilities and processes to reflect technological advances, such failure could negatively impact our competitive position, which could have a material adverse effect on our business, financial condition and results of operations.
15
Table of Contents
We also experience competition for farmland purchases. Certain of our competitors have greater financial and capital resources than us. We could face increased competition from newly formed or emerging entities, as well as from established entities that choose to focus (or increase their existing focus) on farmland in Uruguay. As a result, farmland properties may not be available to us on commercially favorable terms or at all.
A significant increase in the price of raw materials that we use in our operations, or the shortage of such raw materials, could adversely affect our business, financial condition and results of operations.
Our production process requires various raw materials, including fertilizer, feed, herbicide, agrochemicals and seeds, which we acquire from local and international suppliers. We do not have long-term supply contracts for most of these raw materials. For our fiscal year 2010 and the nine months ended March 31, 2011, consumable supplies, including but not limited to fertilizers, agrochemicals, herbicides, feed and seeds, represented 29.0% and 39.2% of our cost of production, respectively. Worldwide production of agricultural products has increased significantly in recent years, increasing the demand for agrochemicals and fertilizers. This has resulted, among other things, in increased prices for fertilizers and agrochemicals. Our agricultural business is seasonal, and our revenues may fluctuate significantly depending on the growing cycle of our crops. A significant increase in the cost of these raw materials, especially fertilizer, feed and agrochemicals, a shortage of raw materials or the unavailability of these raw materials entirely could reduce our profit margin, reduce our production and/or interrupt the production of some of our products, in all cases adversely affecting our business, financial condition and results of operations.
Our agricultural business is seasonal, and our revenues may fluctuate significantly depending on the growing cycle of our crops.
Our agricultural business is seasonal, based upon the planting, growing and harvesting cycles. The inherent seasonality of the industry could have a material adverse effect on our business. In addition, quarterly results can vary significantly from one year to the next due primarily to weather-related shifts in planting schedules, production yields, purchase patterns and costs. We incur substantial expenditures for fixed costs throughout the year and substantial expenditures for inventory in advance of the planting season.
Seasonality also relates to the limited windows of opportunity that we have to complete required tasks at each stage of crop cultivation. Should events such as adverse weather or transportation interruptions occur during these seasonal windows, we would face reduced revenue without the opportunity to recover until the following season. In addition, because of the seasonality of agriculture, we face the risk of significant inventory carrying costs should our customers’ activities be curtailed during their normal seasons.
Increased energy prices and frequent interruptions of energy supply could adversely affect our business.
We require substantial amounts of diesel and other resources for our harvest activities and transport of our agricultural products. For the fiscal year ended June 30, 2010 and the nine months ended March 31, 2011, fuel and lubricants represented 8.5% and 8.9% of our cost of production, respectively. We rely upon third parties for our supply of energy resources used in our operations. The prices for and availability of energy resources may be subject to change or curtailment, respectively, due to, among other things, new laws or regulations, imposition of new taxes or tariffs, interruptions in production by suppliers, imposition of restrictions on energy supply by government, worldwide price levels and market conditions. If energy supply is cut for an extended period of time and we are unable to find replacement sources at comparable prices, or at all, our business, financial condition and results of operations would be adversely affected.
We depend on international trade and economic and other conditions in key export markets for our products.
Our operating results depend largely on economic conditions and regulatory policies for our products in major export markets. The ability of our products to compete effectively in these export markets could be adversely affected by a number of factors that are beyond our control, including the deterioration of
16
Table of Contents
macroeconomic conditions, volatility of exchange rates, the imposition of greater tariffs or other trade barriers or other factors in those markets, such as regulations relating to chemical content of products and safety requirements. Due to the growing participation in the worldwide agricultural commodities markets by commodities produced in South America, South American growers, including us, are increasingly affected by the measures taken by importing countries in order to protect their local producers. Measures such as the limitation on imports adopted in a particular country or region may affect the sector’s export volume significantly and, consequently, our operating results.
The EU has a zero tolerance policy with respect to the import of genetically modified organisms, or GMOs. See “—Some of the agricultural commodities and food products that we produce contain genetically modified organisms, which could affect the marketability of our products or our ability to sell to certain markets.” While the recent drought in Europe has led to the relaxation of these restrictions for certain of our products, we may be unable to continue exporting our products with GMOs to the EU. If the sale of our products into a particular importing country is adversely affected by trade barriers or by any of the factors mentioned above, the relocation of our products to other consumers on terms equally favorable may not be possible, and our business, financial condition and operating results could be adversely affected.
We may be exposed to material losses due to volatile prices of agricultural products since we are not hedging our agricultural products price risk. We also may not be able to realize gains related to price appreciation for hedged positions.
We generally do not hold any hedge positions, although we have entered into certain hedge positions to cover against the risk of variations in the price of wheat and soybean during the first two quarters of fiscal year 2011. Because we do not generally hedge the price risk on our agricultural products, we are unable to have minimum price guarantees for all of our production and are, therefore, exposed to significant risks associated with the prices of agricultural products and their volatility. Fluctuations in prices of agricultural products could result in our receiving lower prices for our agricultural products than our production costs. Further, as a commodities producer, we naturally have a long position in agricultural products, which increases our risk of loss if prices of agricultural products decrease. If we enter into hedges in the future and if the prices of agricultural products in respect of such hedges increase beyond the prices specified in our various hedging agreements, we would lose some or all of the value of any such increase in prices. We may also be subject to exchange rate risks with respect to hedges we may enter into for wheat because our futures and options positions are valued in U.S. dollars while a portion of our production costs are in Uruguayan Pesos. In addition, if severe weather conditions or any other disaster causes lower production than that which we have already sold in the market, we may suffer material losses in the repurchase of sold contracts.
Substantially all of our assets are farmland. If we decided to sell such farmland, the prices we may realize could be adversely affected by the real estate market at the time of sale, which could be illiquid.
Our business is focused on acquiring and operating farmland for long-term use and thus our assets are intended to be relatively illiquid. We do not acquire farmland for resale or for speculative purposes. If we were required to liquidate farmland investments during periods when the market is illiquid and prices are declining, the proceeds we might receive from such sales could be significantly less than the aggregate carrying value of such property, which would have an adverse effect on our results of operations and financial position. In addition, if the market becomes illiquid, it may limit our ability to vary our portfolio promptly in response to changing economic or investment conditions.
Some of the agricultural commodities and food products that we produce contain genetically modified organisms, which could affect the marketability of our products or our ability to sell to certain markets.
Our soybean products contain genetically modified organisms, or GMOs, in varying proportions depending on the year and location of production. The use of GMOs in food has been met with varying degrees of acceptance in the markets in which we operate. The United States and Uruguay, for example, have approved the
17
Table of Contents
use of GMOs in food products, and GMO and non-GMO grain in those countries is produced and frequently commingled during the grain origination process. Elsewhere, adverse publicity about genetically modified food has led to governmental regulation limiting sales of GMO products in some of the markets in which our customers sell our products, including the EU. It is possible that new restrictions on GMO products will be imposed in major markets for some of our products or that our customers will decide to purchase fewer GMO products or not buy GMO products at all, which could have a material adverse effect on our business, financial condition or results of operations.
Additionally, our cattle and sheep may be fed with grains or grain by-products containing GMOs, such as soybeans or corn. Consequently, such products could be considered to contain GMOs by our customers or by governmental or regulatory authorities in our export markets, which could have a material adverse effect on our business, financial condition or results of operations.
If our products become contaminated, we may be subject to product liability claims, product recalls and restrictions on exports that would adversely affect our business.
The sale of food products for human consumption involves the risk of injury to consumers. These injuries may result from tampering by third parties, bioterrorism, product contamination or spoilage, including the presence of bacteria, pathogens, foreign objects, substances, chemicals, other agents, or residues introduced during the growing, storage, handling or transportation phases.
Consumption of our products could cause a health-related illness in the future and we could become subject to claims or lawsuits relating to such matters. Even if a product liability claim is unsuccessful or is not fully pursued, the negative publicity surrounding any assertion that our products caused illness or injury could adversely affect our reputation with existing and potential customers and our corporate and brand image, and we could also incur significant legal expenses. Moreover, claims or liabilities of this nature might not be covered by any rights of indemnity or contribution that we may have against others, which could have a material adverse effect on our business, financial condition or results of operations.
We are dependent on our management team, and our success may depend on our ability to retain or attract adequate managerial resources.
Our success depends, to a large extent, on the ability and judgment of our senior management to make appropriate decisions with respect to our operations. We will continue to retain the qualified personnel needed for our business. In the event that one or more current members of management cease to be employed by us and we cannot attract adequate replacements, our business, financial condition and results of operations could be adversely affected.
We may be subject to labor disputes from time to time that could adversely affect us.
Our operations are dependent on farm laborers. If we became subject to a labor dispute, or if our farm laborers unionize, we may not successfully conclude negotiations on favorable terms, which could result in a significant increase in the cost of labor or could result in work stoppages or labor disturbances that disrupt our operations. Cost increases, work stoppages or disturbances that result in substantial amounts of raw product not being processed could have a material and adverse effect on our business, financial condition and results of operations.
We are subject to numerous laws and regulations and any future changes could adversely affect us.
We are subject to numerous laws and regulations. We could be adversely affected by changes in regulatory requirements, customs, duties or other taxes. For example, the President of Uruguay recently stated that he wished to tax land holdings of more than 2,000 hectares with unknown rates from 2,000 to 10,000 hectares and
18
Table of Contents
more than 10,000 hectares at a rate of $16 per hectare. Although legislation regarding such a tax has not been introduced, it could come into effect in the future. If such a tax were to come into effect and we reached our objective of holding 160,000 hectares of land in Uruguay, such a tax would increase our total taxes by approximately $2.5 million per year, which would reduce our profitability or increase our loss by such amount. In addition, existing and future government laws, regulations and policies (including environmental laws, regulations and policies) may greatly influence how we operate our business, our business strategy and, ultimately, our financial viability. Further, Uruguayan governmental policies may directly or indirectly influence a number of factors affecting our business, such as the number of acres planted, the mix of crops planted, crop prices, inventory levels and the rules regarding ownership of land. Future regulatory changes could have an adverse effect on our business, financial condition and results of operations.
We are subject to environmental regulation, and concerns regarding climate change may subject us to even stricter environmental regulations.
Our activities are subject to laws and regulations relating to the protection of the environment. Under various Uruguayan laws, we could become liable for the costs of removal or remediation of certain hazardous or toxic substances released on, from or in one or more of our properties or disposed of at other locations. The failure to remove or remediate such substances, if any, may adversely affect our ability to sell such property or to borrow using the property as collateral, and could potentially also result in claims against us by private parties. In addition, global environmental legislation and policies have become increasingly stringent in recent years as a result of concerns regarding climate change and environmental regulation in the areas in which we operate may also become more stringent, which could have an adverse effect on our business, financial condition and results of operations.
Our current insurance coverage may not be sufficient to cover our potential losses.
Our production is, in general, subject to different risks and hazards, including adverse weather conditions, fires, diseases and pest infestations, other natural phenomena, industrial accidents, labor disputes, changes in the legal and regulatory framework applicable to us and environmental contingencies. Our insurance currently covers only part of the losses we may incur and does not cover losses on crops, wheat and blueberries due to drought or floods or similar risks, losses on blueberries due to hailstorms or any losses to our cattle, sheep and bees. Furthermore, certain types of risks may not be covered by the policies that we hold. Additionally, any claims to be paid by an insurer due to the occurrence of a casualty covered by our policies may not be sufficient to compensate us for all of the damages suffered. Moreover, we may not be able to maintain or obtain insurance of the type and amount desired at reasonable costs. If we were to incur significant liability for which we were not fully insured, it could have a materially adverse effect on our business, financial condition and results of operations.
We derive a significant portion of our revenue from a few key customers and the loss or non-performance of such customers could adversely affect us.
We derive a significant portion of revenue from the sale of our agricultural products to a small number of customers. For example, for the nine months ended March 31, 2011, we sold our entire rice production to S.A. Molinos Arroceros Nacionales, or SAMAN, the leading rice exporter in Uruguay, our entire wool production to the cooperative Central Lanera Uruguaya, or CLU, and our entire dairy production to Cooperativa Nacional de Productores de Leche, or CONAPROLE. Furthermore, 85.0% of our cattle sales were concentrated in two customers and 88.7% of our crops sales were concentrated in two customers. Although, our agricultural products are commodities for which there is a global market, the loss of any one of our significant customers would be disruptive to our operations and would require that management devote significant time to finding a suitable replacement customer, if at all possible. To the extent we are unable to find suitable replacement customers, our revenues would be adversely affected, which could, in turn, negatively affect our ability to achieve or sustain our expected levels of operating results. We are also exposed to risks of loss in the event of non-performance by such key customers. Some of our customers may be highly leveraged and subject to their own operating and
19
Table of Contents
regulatory risks. Notwithstanding our credit review and analysis mechanisms, we may experience financial loss in our dealings with other parties. Any non-payment or non-performance by our customers could adversely affect our results of operations and financial condition. Accordingly, unless and until we diversify and expand our customer base, our future success will largely depend upon the timing and size of any future purchases by, and creditworthiness of, a few key customers.
Risks Related to Uruguay
We operate our business in an emerging market. Our results of operations and financial condition are dependent upon economic conditions in Uruguay, and any decline in Uruguay’s economic conditions could harm our results of operations or financial condition.
Emerging market investment generally poses a greater degree of risk than investment in more mature market economies because the economies in the developing world are more susceptible to destabilization resulting from domestic and international developments.
All of our operations and development activities are in Uruguay. Uruguay has a history of economic instability or crises (such as inflation or recession), political instability, and changes in laws and regulations which could adversely affect our business, financial condition and results of operations.
In particular, fluctuations in the Uruguayan economy and actions adopted by the government of Uruguay have had and may continue to have a significant impact on companies operating in Uruguay, including us. Specifically, we may be affected by inflation, foreign currency fluctuations, regulatory policies, business and tax regulations and in general by the political, social and economic scenarios in Uruguay and in other countries that may affect Uruguay.
At the end of 2001 and into 2002, a banking crisis erupted in Uruguay as a result of the financial crisis in neighboring Argentina and the capital controls and deposit freezes imposed in response by the Argentine government. As a result of high levels of exposure to Argentina, banks in Uruguay began facing liquidity problems, causing large waves of deposit withdrawals from the Uruguayan banking sector, severely impacting solvency of banks, lending, liquidity and economic growth. Future banking crises, including those triggered by neighboring countries, could occur in Uruguay, which could adversely affect our financial condition and the results of our operations, or the market price of our common shares.
Global economic crises could negatively affect investor confidence in emerging markets or the economies of the principal countries in Latin America, including Uruguay. Such events could adversely affect our business, financial condition and results of operations.
Uruguay’s economy could be adversely affected by the deterioration of other global markets.
Financial and securities markets in Uruguay are influenced by the economic and market conditions in other countries, including other South American and emerging market countries and other global markets. Although economic conditions in these countries may differ significantly from economic conditions in Uruguay, investors’ reactions to developments in these other countries, such as the recent developments in the global financial markets, may substantially affect the capital flows into, and the market value of securities of issuers with operations in Uruguay.
A crisis in other emerging market countries could dampen investor enthusiasm for securities of issuers with South American operations, including our common shares. For example, in 2002, Uruguay went through its steepest economic and financial crisis in recent history, resulting mostly from external factors. Devaluation in neighboring Brazil in 1999 made Uruguayan goods less competitive. Starting in late 2001, an economic crisis in Argentina also undermined Uruguay’s economy. In mid-2002, Argentine withdrawals from Uruguayan banks
20
Table of Contents
started a bank run which was overcome only by massive borrowing from international financial institutions, leading in turn to serious debt sustainability problems. Financial conditions in Argentina, Brazil or other emerging market countries could negatively impact Uruguay’s economy in the future.
Uruguay’s economy remains highly linked to the U.S. dollar and therefore vulnerable to external shocks. In 2008, the global financial crisis had an adverse impact on global economic conditions. Even though by the end of 2009 and beginning of 2010 the world economies showed certain signs of recovery, it is yet uncertain how the current financial crisis will impact Uruguay, which could include a reduction in exports, a decline in tax revenues and a reduced ability to access international capital markets.
A significant deterioration in the economic growth of any of the main trading partners of Uruguay could have a material impact on the trade balance of the country and could adversely affect its economic growth. This could adversely affect the market price for our common shares, as well as make it difficult for us to access capital markets and obtain financing for our operations in the future, on favorable terms or under any conditions.
The Uruguayan government has a high degree of influence in the Uruguayan economy, which could adversely affect our results of operations or financial condition.
In the past, the Uruguayan government has intervened in its economy and made significant changes in monetary, credit, industry and other policies and regulations. The government may again take actions in the future to control inflation and implement other policies and regulations, including measures, price controls, currency devaluations, capital controls and limits on imports. We have no control over, and cannot predict, what measures or policies the government may take in the future. Our business, financial condition and results of operations could be adversely affected by changes in governmental policy or regulations that impact factors such as:
| • | labor laws; |
| • | utilities and fuel prices; |
| • | economic growth; |
| • | currency fluctuations; |
| • | inflation; |
| • | liquidity of domestic capital and lending markets; |
| • | liquidity and solvency of the financial system; |
| • | monetary policy; |
| • | developments in trade negotiations through the World Trade Organization or other international organizations; |
| • | tax laws, including royalties and the effect of tax laws on distributions from our subsidiaries; and |
| • | other political, social and economic developments, including political, social or economic instability, in or affecting Uruguay. |
Uncertainty over whether the government will implement changes in policy or regulation affecting these or other factors in the future may contribute to economic uncertainty and heightened volatility in the securities markets, which could have a material and adverse effect on our business, financial condition and results of operations.
Currency exchange rate fluctuations relative to the U.S. dollar could adversely impact our business, financial condition and results of operations.
We operate exclusively outside the United States. Our financial statements are prepared and presented in U.S. dollars. A portion of our expenses were transacted in Uruguayan Pesos. Consequently, our results from
21
Table of Contents
operations may be impacted by significant fluctuations in exchange rates. Our current exposure to currency exchange rate fluctuations results from the transaction exposure associated with incurring a portion of our expenses in a currency other than the U.S. dollar. The Uruguayan Peso and other currencies have fluctuated against the U.S. dollar in the past. Accordingly, fluctuations in exchange rates relative to the U.S. dollar could impair the comparability of our results from period to period and have a material adverse effect on our business, financial condition and results of operations.
On June 19, 2002, the BCU allowed the Peso to float, abandoning the “crawling peg” system. The Peso depreciated significantly, as the nominal exchange rate rose 94.0% at December 2002 compared to December 2001. The devaluation of the Peso in turn caused a deterioration in the quality of the foreign currency-denominated loan portfolio of several financial institutions and caused Uruguay’s foreign currency-denominated debt to GDP ratio to rise to 89.1% as of December 31, 2002, while the foreign currency-denominated debt service to exports ratio for 2002 was 33.6%. The gradual stabilization resulting in part from the successful debt re-profiling in 2003 and the economic growth since 2004 resulted in a significant real appreciation of the Uruguayan Peso versus the U.S. dollar through 2007. The global economic crisis again led to a devaluation of the Peso in 2008 as well as to increased foreign exchange volatility. Although the Peso rebounded during 2009, it has since depreciated against the U.S. dollar and returned to 2008 levels. The continued U.S. dollar denomination of many assets and liabilities of the Uruguayan economy, including most of the government’s financial debt, renders Uruguay vulnerable to any future real depreciation of the Peso.
Future fluctuations in the value of the Peso relative to the U.S. dollar in Uruguay may occur, and if such fluctuations were to occur, our business, financial condition and results of operations could be adversely affected.
Inflation in Uruguay, along with governmental measures to combat inflation, may have a significant negative effect on Uruguay’s economy and, as a result, on our business, financial condition and results of operations.
In the past, high levels of inflation have adversely affected Uruguay’s economy and financial markets, and the ability of its government to create conditions that stimulate or maintain economic growth. Moreover, governmental measures to curb inflation and speculation about possible future governmental measures have contributed to the negative economic impact of inflation and have created general economic uncertainty. Inflation in Uruguay has been as high as 112% in 1990 and has remained relatively high at 8.1% in 2008, 7.9% in 2009 and 7.1% in 2010. A portion of our operating costs are denominated in Uruguayan Pesos. Inflation in Uruguay, without a corresponding Peso devaluation could result in an increase in our operating costs without a commensurate increase in our revenues, which could adversely affect our financial condition and our ability to pay our foreign denominated obligations.
Uruguay may continue to experience relatively high levels of inflation in the future, which may impact domestic demand for our products. Inflationary pressures may also weaken investor confidence in Uruguay, curtail our ability to access foreign financial markets and lead to further government intervention in the economy, including interest rate increases, restrictions on tariff adjustments to offset inflation, intervention in foreign exchange markets and actions to adjust or fix currency values, which may trigger or exacerbate increases in inflation, and consequently have an adverse impact on us. In an inflationary environment, the value of uncollected accounts receivable, as well as of unpaid accounts payable, declines rapidly. If Uruguay experiences high levels of inflation in the future and price controls are imposed, we may not be able to adjust the rates we charge our customers to fully offset the impact of inflation on our cost structures, which could adversely affect our business, financial condition and results of operations.
Depreciations of the Peso relative to the U.S. dollar or the Euro may also create additional inflationary pressures in Uruguay that may negatively affect us. Depreciations generally curtail access to foreign financial markets and may prompt government intervention, including recessionary governmental policies. Depreciations also reduce the U.S. dollar or Euro value of dividends and other distributions on our common shares and the U.S. dollar or Euro equivalent of the market price of our common shares. Any of the foregoing might adversely affect our business, operating results, and cash flow, as well as the market price of our common shares.
22
Table of Contents
Conversely, in the short term, a significant increase in the value of the Peso against the U.S. dollar would adversely affect the Uruguayan government’s income from exports. This could have a negative effect on gross domestic product, or GDP, growth and employment and could also reduce the public sector’s revenues in the country by reducing tax collection in real terms, as a portion of public sector revenues are derived from the collection of export taxes.
Risks Related to this Offering and Ownership of our Common Shares
There is no existing market for our common shares, and we do not know whether one will develop to provide you with adequate liquidity. If the price of our common shares fluctuates after this offering, you could lose a significant part of your investment.
Prior to this offering, there has not been a public market for our common shares. If an active trading market does not develop, you may have difficulty selling any of our common shares that you buy. We cannot predict the extent to which investor interest in our company will lead to the development of an active trading market on the NYSE, or otherwise how liquid that market might become. The initial public offering price for the common shares sold in the offering will be determined by negotiations between us and the underwriters and may not be indicative of prices that will prevail in the open market following this offering. Consequently, you may not be able to sell your common shares at prices equal to or greater than the price paid by you in this offering. In addition to the risks described above, the market price of our common shares may be influenced by many factors, some of which are beyond our control, including:
| • | the failure of financial analysts to cover our common shares after this offering or changes in financial estimates by analysts; |
| • | actual or anticipated variations in our operating results; |
| • | changes in financial estimates by financial analysts, or any failure by us to meet or exceed any such estimates, or changes in the recommendations of any financial analysts that elect to follow our common shares or the common shares of our competitors; |
| • | announcements by us or our competitors of significant contracts or acquisitions; |
| • | future sales of our common shares; and |
| • | investor perceptions of us and the industries in which we operate. |
In addition, the stock market in general has experienced substantial price and volume fluctuations that have often been unrelated or disproportionate to the operating performance of particular companies affected. These broad market and industry factors may materially harm the market price of our common shares, regardless of our operating performance. In the past, following periods of volatility in the market price of certain companies’ securities, securities class action litigation has been instituted against these companies. Such litigation, if instituted against us, could be expensive to defend, lead to costly settlements or judgments and distract management, which would adversely affect our business, financial condition and results of operations.
The initial public offering price per common share is substantially higher than our net tangible book value per common share immediately after the offering, and you will incur immediate and substantial dilution.
The initial public offering price per common share is substantially higher than our net tangible book value per common share immediately after the offering. As a result, you may pay a price per share that substantially exceeds the tangible book value of our assets after subtracting our liabilities. Investors who purchase common shares in the offering will be diluted by $3.46 per share after giving effect to the sale of common shares in this offering. See “Dilution.” If we grant options in the future to our employees, and those options are exercised, or if other issuances of common shares are made, there will be further dilution.
23
Table of Contents
Sales of substantial amounts of our common shares in the public market, or the perception that these sales may occur, could cause the market price of our common shares to decline.
Sales of substantial amounts of our common shares in the public market, or the perception that these sales may occur, could cause the market price of our common shares to decline. This could also impair our ability to raise additional capital through the sale of our equity securities. Under our articles of incorporation, we are authorized to issue an unlimited number of common shares, of which 51,167,399 shares will be outstanding following this offering, assuming no exercise of the underwriters’ over-allotment option. Members of our board of directors, our executive officers and certain of our shareholders that in the aggregate hold 53.8% of our total shares outstanding will enter into lock-up agreements, pursuant to which they are expected to agree, subject to certain exceptions, not to sell or transfer, directly or indirectly, any shares for a period of 180 days from the date of this prospectus. The remaining 46.2% of shares are not subject to lock-up during such 180-day period. Any significant sales of our common shares during or after the 180-day period could place downward pressure on our share price. In addition, we cannot predict the size of future issuances of our common shares or the effect, if any, that future sales and issuances of common shares would have on the market price of our common shares.
Transformation into a public company may increase our costs and disrupt the regular operations of our business.
This offering will have a significant transformative effect on us. We have operated as a privately owned company, and we expect to incur significant additional legal, accounting, reporting and other expenses as a result of having publicly traded common shares. We will also incur costs which we have not incurred previously, including, but not limited to, increased cost related to auditor fees, legal fees, directors and officers insurance, investor relations and various other costs of a public company.
We also anticipate that we will incur costs associated with corporate governance requirements, including requirements under the Sarbanes-Oxley Act of 2002, as well as rules implemented by the U.S. Securities and Exchange Commission, or the SEC, and the NYSE. Compliance with these rules and regulations will increase our legal and financial compliance costs and make some management and corporate governance activities more time-consuming and costly. These rules and regulations may make it more difficult and more expensive for us to obtain director and officer liability insurance, and we may be required to accept reduced policy limits and coverage or incur substantially higher costs to obtain the same or similar coverage. This could have an adverse impact on our ability to recruit qualified independent directors. We do not know the amount of additional costs we may incur as a result of these requirements or the timing of such costs but they could be significant.
The additional demands associated with being a public company may disrupt regular operations of our business by diverting the attention of some of our senior management team away from revenue producing activities to management and administrative oversight, adversely affecting our ability to attract and complete business opportunities and increasing the difficulty in both retaining professionals and managing and growing our businesses. Any of these effects could harm our business, financial condition and results of operations.
As a foreign private issuer, we are permitted to, and we will, rely on exemptions from certain NYSE corporate governance standards applicable to U.S. issuers, including the requirement that a majority of an issuer’s directors consist of independent directors. This may afford less protection to holders of our common shares.
Section 303A of the NYSE Listing Rules requires listed companies to have, among other things, a majority of their board members be independent, and to have independent director oversight of executive compensation, nomination of directors and corporate governance matters. As a foreign private issuer, however, we are permitted to, and we intend to, follow home country practice in lieu of the above requirements. BVI law, the law of our home country, does not require that a majority of our board consist of independent directors or the implementation of a nominating and corporate governance committee, and we expect our board will include fewer independent directors than would be required if we complied with all of the NYSE’s corporate governance rules. Since a majority of our board of directors may not consist of independent directors as long as we rely on
24
Table of Contents
the foreign private issuer exemption to the NYSE’s rules, our board’s approach may, therefore, be different from that of a board with a majority of independent directors, and as a result, the board oversight of management may be more limited than if we complied with all of the NYSE’s corporate governance rules.
We may be classified as a passive foreign investment company for U.S. federal income tax purposes, which could result in adverse U.S. federal income tax consequences to U.S. holders of our common shares.
A foreign corporation will be classified as a passive foreign investment company for U.S. federal income tax purposes, or a PFIC, for any taxable year if either: (i) 75% or more of its gross income in a taxable year is passive income or (ii) 50% or more of the average value of its gross assets is attributable to assets that produce passive income or are held for the production of passive income. Based upon our current activities and the projected composition of our income and assets, we may be a PFIC for the current taxable year ending June 30, 2011. However, a determination of our PFIC status for any taxable year cannot be made until the close of such taxable year and will depend on, among other factors, our operating income, the market price of the common shares and by how, and how quickly, we spend the cash raised in this offering. Accordingly, we cannot provide a definitive determination with respect to our PFIC status for the current taxable year or any future taxable year. If we were to be a PFIC for any taxable year, a U.S. holder that holds common shares at any time during such taxable year would be subject to adverse tax consequences on certain distributions in respect of such common shares and gain realized on the sale or other disposition of such common shares, including taxation thereof as ordinary income and an interest charge on taxes treated as deferred. However, these adverse tax consequences can generally be mitigated if such U.S. holder makes a timely qualified electing fund election or a timely mark-to-market election. See“Taxation—Material U.S. Federal Income Tax Considerations.”
Our internal controls over financial reporting may not be effective and our independent registered public accounting firm may not be able to certify as to their effectiveness, which could have an adverse affect on our results of operations and financial position, our reputation, and the trading price of our common shares.
Since our formation, we have faced accounting and financial reporting issues, including ongoing controls remediation and systems re-engineering and development. In the course of preparing our financial statements for the fiscal years 2008, 2009 and 2010, we identified several deficiencies in our internal controls over financial reporting. For example, we have not maintained effective controls over our financial period-end closing and reporting process, to ensure that journal entries were prepared with sufficient support or documentation or reviewed and approved to ensure the accuracy and completeness of the entries recorded, over the accuracy and completeness of spreadsheets used in the period-end closing process and other spreadsheets supporting the company’s financial reporting, over the resolution of reconciling items on our bank account reconciliations or over the completeness, accuracy, and disclosure of our production, general and administrative expenses. In addition, we have not had adequate personnel resources to enable us to properly consider and apply IFRS for all of our transactions and we have not maintained a proper account and procedures manual.
These control deficiencies resulted in audit adjustments to our consolidated financial statements for the fiscal years 2008, 2009 and 2010. Additionally, certain of these control deficiencies amounted to a material weakness, and as a result they could cause material misstatements in our consolidated financial statements, which could cause investors to lose confidence in our reported financial information and could have a material adverse effect on our reputation and the trading price of our common shares.
Upon completion of this offering, we will be required to document and test our internal controls over financial reporting pursuant to Section 404 of the United States Sarbanes-Oxley Act of 2002, as amended, or SOX, so that our management can certify as to the effectiveness of our internal controls, and, commencing with our annual report for fiscal year 2012, so that our independent registered public accounting firm can render an opinion on management’s assessment and on the effectiveness of our internal controls over financial reporting. If we are unable to implement the requirements of Section 404 of SOX in a timely manner or adequately, our independent registered public accounting firm may not be able to certify as to the effectiveness of our internal
25
Table of Contents
controls over financial reporting and we may be required to incur costs in improving our internal controls, which could have a material adverse affect on our results of operations and financial position, our reputation and the trading price of our common shares.
Our board of directors may issue, without shareholder approval, additional common shares and preferred shares that have rights and preferences in priority to the common shares, which issuance may delay or prevent a change of control.
Pursuant to our memorandum and articles of association, our board of directors may issue an unlimited number of common shares and an unlimited number of preferred shares, without any vote or action by our shareholders. If we were to issue any common shares or any additional preferred shares, the percentage ownership of existing shareholders may be reduced and diluted. In addition, our board of directors may, subject to BVI law, determine the price, rights, preferences, privileges and restrictions, including voting, dividend and conversion rights, of each class of our preferred shares and determine to whom they shall be issued. The rights of the holders of any class of preferred shares that may be issued in the future may be senior to the rights of holders of our common shares, which could preclude holders of common shares from receiving dividends, proceeds of a liquidation or other benefits. The issuance of preferred shares could, among other things, have the effect of delaying, deferring or preventing a change in our control and may adversely affect the market price of the common shares and the voting and other rights of the holders of common shares.
Risks Related to Investment in a British Virgin Islands Company
Because we are incorporated under the laws of the British Virgin Islands, it may be more difficult for our shareholders to protect their rights than it would if they were shareholders of a corporation incorporated in another jurisdiction.
We are a company incorporated under the laws of BVI, and all of our assets are located outside the United States and Canada. Furthermore, all of our directors and officers reside outside the United States and Canada and a substantial portion of their assets are located outside the United States and Canada. As a result, investors may not be able to effect service of process within the United States or Canada upon our directors or officers or to enforce against them in United States courts judgments predicated upon the civil liability provisions of U.S. federal securities law or in Canadian courts judgments predicated on Canadian securities laws. Likewise, it may also be difficult for an investor to enforce in U.S. courts or Canadian courts judgments obtained against these persons in courts located in jurisdictions outside the U.S. and Canada.
Our corporate affairs are governed by our memorandum and articles of association, the BVI Business Companies Act, 2004, as amended from time to time, or the BVI Business Companies Act, and the common law of BVI. The rights of shareholders to take action against the directors, actions by minority shareholders and the fiduciary responsibilities of our directors to us under BVI law are to a large extent governed by the BVI Business Companies Act and the common law of BVI. The common law of BVI is derived from English common law, and the decisions of the English courts are of persuasive authority, but are not binding on a court in BVI. The rights of our shareholders and the fiduciary responsibilities of our directors under BVI law may not be as clearly established as they would be under statutes or judicial precedent in some jurisdictions in the United States and Canada. In particular, BVI has a less developed body of securities laws as compared to the United States and Canada, and some states, such as Delaware, have more fully developed and judicially interpreted bodies of corporate law.
In addition, the law of BVI permits our board of directors to refuse to permit a shareholder to review, copy or inspect certain documents (including the list of shareholders or directors or minutes and resolutions of shareholders) if our board believes it would be contrary to our interests to allow review, copy or inspection. This may make it more difficult for you to obtain the information needed to establish any facts necessary for a shareholder motion or to solicit proxies from other shareholders in connection with a proxy contest. Furthermore, while statutory provisions do exist in BVI law for derivative actions to be brought in certain circumstances,
26
Table of Contents
shareholders in BVI companies may not have standing to initiate a shareholder derivative action in a federal court of the United States or a Canadian court. The circumstances in which any such action may be brought, and the procedures and defenses that may be available in respect to any such action, may result in the rights of shareholders of a BVI company being more limited than those of shareholders of a company organized in the United States or Canada. Accordingly, shareholders may have fewer alternatives available to them if they believe that corporate wrongdoing has occurred.
As a result of all of the above, public shareholders may have more difficulty in protecting their interests in the face of actions taken by management, members of the board of directors or controlling shareholders than they would as public shareholders of a U.S. or Canadian company.
Because we are incorporated under the laws of BVI, it may be more difficult for our shareholders to enforce judgments against us than it would if they were shareholders of a corporation incorporated in another jurisdiction.
There is no statutory recognition in BVI of judgments obtained in the United States or Canada, although any final and conclusive monetary judgment for a definite sum obtained against our company in U.S. federal or state courts or in Canadian courts would be treated by the courts of BVI as a cause of action in itself and sued upon as a debt at common law so that no retrial of the issues would be necessary provided that:
| • | the U.S. or Canadian court issuing the judgment had jurisdiction in the matter and the company either submitted to such jurisdiction or was resident or carrying on business within such jurisdiction and was duly served with process; |
| • | the judgment given by the U.S. or Canadian court was not in respect of penalties, taxes, fines or similar fiscal or revenue obligations of the company; |
| • | in obtaining judgment there was no fraud on the part of the person in whose favor judgment was given or on the part of the court; |
| • | recognition or enforcement of the judgment in BVI would not be contrary to public policy; and |
| • | the proceedings pursuant to which judgment was obtained were not contrary to natural justice. |
BVI courts are also unlikely:
| • | to recognize or enforce against us judgments of courts of the United States or Canada based on certain civil liability provisions of U.S. and Canadian securities laws; and |
| • | to impose liabilities against us, in original actions brought in BVI, based on certain civil liability provisions of U.S. and Canadian securities laws that are penal in nature. |
There are grounds upon which a BVI court may not enforce the judgments of U.S. or Canadian courts and some remedies available under the laws of U.S. or Canadian jurisdictions, including some remedies available under U.S. federal or Canadian securities laws, may not be permitted under BVI courts as contrary to public policy in BVI. Furthermore, no claim may be brought in BVI by or against us or our directors and officers in the first instance for violation of U.S. federal or Canadian securities laws because these laws have no extraterritorial application under BVI law and do not have force of law in BVI, however, a BVI court may impose civil liability, including the possibility of monetary damages, on us or our directors and officers if the facts alleged in a complaint constitute or give rise to a cause of action under BVI law.
The rights of our shareholders are not as extensive as those rights of shareholders of U.S. or Canadian corporations.
The rights of our shareholders will be governed by our memorandum and articles of association, as interpreted in accordance with the laws of BVI. Where any provision of any contractual arrangement between a shareholder and us or any third party is inconsistent with the provisions of our memorandum and articles of
27
Table of Contents
association, the shareholder may be unable to claim certain remedies, including specific performance, for breach of such provision against us. As well, principles of BVI corporate law relating to such matters as the validity of a company’s procedures, the fiduciary duties of management and the rights of a company’s shareholders may differ from those that would apply if we were incorporated in a jurisdiction within the U.S. or Canada. Under U.S. law, majority and controlling shareholders generally have certain “fiduciary” responsibilities to the minority shareholders. A U.S. shareholder action must be taken in good faith. Also, actions by controlling shareholders in a U.S. jurisdiction and executive compensation which are obviously unreasonable may be declared null and void. In addition, in the U.S. and Canada, directors generally owe a fiduciary duty to the corporation and its shareholders, including a duty of care, pursuant to which directors must properly apprise themselves of all reasonably available information, and a duty of loyalty, pursuant to which they must protect the interests of the corporation and refrain from conduct that injures the corporation or its shareholders, that deprives the corporation or its shareholders of any profit or advantage or that allows them to take advantage of a corporate opportunity for their own benefit. Many U.S. jurisdictions have enacted various statutory provisions which permit the monetary liability of directors to be eliminated or limited. Under BVI law, liability of a director of a corporation to the corporation is primarily limited to cases of willful malfeasance in the performance of his duties or to cases where the director has not acted honestly and in good faith and in the best interests of the corporation.
Further, BVI law does not protect the interests of minority shareholders to the extent that the law in the U.S. and Canada protects minority shareholders in U.S. and Canadian corporations, respectively. Our shareholders may have difficulty in protecting their interests in the face of actions by our board of directors and may have more limited rights than they might have as shareholders of a company incorporated in many U.S. and Canadian jurisdictions.
28
Table of Contents
This prospectus includes forward-looking statements made by or on behalf of us. Statements that are predictive in nature, that depend upon or refer to future events or conditions or that include words such as “believe,” “can,” “may,” “should,” “would,” “will,” “is/are likely to,” “estimate,” “project,” “plan,” “continue,” “anticipate,” “believe,” “intends,” “expects” or their negative or variations or similar expressions can generally be identified as forward-looking statements. Although we believe that these forward-looking statements are based upon reasonable assumptions and reliable information, these statements are subject to many risks and uncertainties and are made in light of information currently available to us. Our forward-looking statements may be influenced by the following factors, among others:
| • | our ability to execute our business strategy and our business plan; |
| • | our ability to invest the proceeds from this offering efficiently; |
| • | unpredictable weather conditions, pest infestations and diseases; |
| • | changes in the domestic and international commodities markets and fluctuations in market prices for our products; |
| • | our ability to obtain profits and/or revenues from our operations; |
| • | our ability to obtain additional working capital; |
| • | our ability to expand our business through land acquisitions, and to identify and acquire agricultural properties; |
| • | defects in title and validity to title to our farmlands; |
| • | our ability to successfully compete in the markets in which we operate; |
| • | the prices of energy and raw materials used in our operations, and our availability of such energy supply and raw materials; |
| • | seasonality and volatility of the prices of our agricultural products; |
| • | international trade and economic and other conditions in key export markets for our products; |
| • | contamination in our agricultural products; |
| • | our ability to retain or attract adequate managerial resources; |
| • | labor disputes; |
| • | changes in current and future laws and regulations, including environmental laws and regulations and restrictions on genetically modified organisms; |
| • | sufficient insurance coverage; |
| • | adverse outcomes in future legal proceedings; |
| • | our ability to adopt new technological and scientific methodologies; |
| • | the economic, political and business situation in Uruguay; |
| • | the development of logistics and infrastructure for transportation of our products in Uruguay; |
| • | changes in global economic conditions; |
| • | inflation and exchange rate fluctuations; and |
| • | other factors discussed under “Risk Factors.” |
29
Table of Contents
These forward-looking statements are subject to many risks and uncertainties and are not assurances of future performance or results. In light of the risks and uncertainties described above, the forward-looking statements discussed in this prospectus may not occur and our future performance and results could differ substantially from those statements as a result of the factors mentioned above, among others. Given such limitations, you should not make any decision to invest in our common shares based on the forward-looking statements contained herein. We may not have correctly evaluated all of the factors affecting our business or the extent of their likely impact, the publicly available information with respect to these factors on which our analysis is based may not be complete or accurate, our analysis may be incorrect, or our strategy, which is based in part on this analysis, may not be successful. These forward-looking statements speak only as of the date they are made, and unless regarded by applicable law, we do not undertake any obligation to update publicly or to revise any forward-looking statement after the distribution of this prospectus whether as a result of new information, future events or otherwise.
The forward-looking statements contained in this prospectus are based on certain assumptions. Although we believe that these assumptions are reasonable, you should not place undue reliance on such forward-looking statements. In addition to the assumptions identified elsewhere in this prospectus, assumptions have been made regarding, among other things:
| • | the availability of arable land in Uruguay, and our ability to acquire such land at reasonable prices; |
| • | our relationships with our customers and suppliers; |
| • | our obtaining authorizations to acquire title to our land held underpromesas; |
| • | market conditions and demand for our products; |
| • | market prices for our products; |
| • | the impact of competition on our industry; |
| • | duties and tariffs affecting the export or import of our agricultural products |
| • | the absence of any natural or other catastrophe |
| • | our ability to obtain financing on acceptable terms; |
| • | our ability to manage cash flow, foreign exchange risk and working capital; |
| • | our ability to adapt to changing circumstances; and |
| • | our ability to manage growth. |
30
Table of Contents
We expect to receive net proceeds of $185.5 million from the sale of common shares by us in this offering, after deducting the underwriters’ discounts and commissions and the portion of the estimated offering expenses payable by us, based on an assumed offering price of $14.00 per common share, without par value, the mid-point of the range set forth on the cover page of this prospectus and assuming that the over-allotment option is not exercised. If the underwriters fully exercise their over-allotment option, we expect to receive $214.0 million of net proceeds. An increase (decrease) of $1.00 in the assumed price per share of $14.00 would increase (decrease) the net proceeds we receive in connection with this offering by $13.6 million (assuming the over-allotment option is not exercised).
We intend to use the proceeds of this offering (1) to repay borrowings, if any, outstanding under our subsidiary’s $10.0 million line of credit with Banco Itaú Uruguay S.A., or the line of credit, (2) to acquire additional farmland, consistent with our business strategy, and (3) the remainder, if any, for working capital and general corporate purposes. There are no particular acquisitions for which we currently intend to use such proceeds and we have not allocated the proceeds in any particular manner toward the three purposes listed above. However, we expect to use the proceeds primarily to acquire additional land in furtherance of our objective of increasing our landholdings in Uruguay to 160,000 hectares.
The line of credit bears a fixed interest rate of 4.50% per annum and matures on October 31, 2011. Under the terms of the line of credit, UAG S.A. has agreed not to pledge or sell any of its assets. Under the terms of the line of credit, UAG S.A. has also agreed that it and our other subsidiaries will not incur indebtedness for borrowed money in excess of $15.0 million, in each case without the lender’s consent. As of the date of this prospectus, we have no borrowings outstanding under the line of credit. See“Business—Material Agreements—Line of Credit.”
31
Table of Contents
The following table sets forth our capitalization as of March 31, 2011:
| • | on an actual basis; and |
| • | on an as adjusted basis to reflect our receipt of the estimated net proceeds from our sale of common shares at the assumed initial public offering price of $14.00 per share, which is the midpoint of the price range listed on the cover page of this prospectus, after deducting estimated underwriting discounts and commissions and the portion of the estimated offering expenses payable by us; and the application of net proceeds from this offering as described under “Use of Proceeds.” |
You should read the information in this table in conjunction with our Consolidated Financial Statements and the notes thereto, appearing elsewhere in this prospectus, “Selected Consolidated Financial Data” and “Management’s Discussion and Analysis of Financial Condition and Results of Operations.”
| As of March 31, 2011 | ||||||||
| Actual | As Adjusted | |||||||
Current borrowings | ||||||||
Finance lease liabilities | $ | 5,269 | $ | 5,269 | ||||
Total current borrowings | 5,269 | 5,269 | ||||||
Total borrowings(1) | 5,269 | 5,269 | ||||||
Equity attributable to equity holders of the parent | ||||||||
Share capital(2) | 348,881,666 | 534,355,723 | ||||||
Equity-settled compensation | 7,616,682 | 7,616,682 | ||||||
Accumulated deficit | (4,632,364 | ) | (4,632,364 | ) | ||||
Total equity attributable to equity holders of the parent | 351,865,984 | 537,340,041 | ||||||
Total capitalization(3) | $ | 351,871,253 | $ | 537,345,310 | ||||
(1) Does not include our line of credit, which as of the date of this prospectus is undrawn. See “Business—Material Agreements—Line of Credit.”
(2) Actual—unlimited common shares authorized, 36,648,406 common shares issued and outstanding and unlimited preferred shares authorized, no preferred shares issued and outstanding; as adjusted—unlimited common shares authorized, 50,934,121 common shares issued and outstanding and unlimited preferred shares authorized, no preferred shares issued and outstanding.
(3) Total capitalization includes total borrowings plus total equity attributable to equity holders of the parent.
32
Table of Contents
We have never declared or paid cash dividends on our common shares. We currently intend to retain any future earnings and do not expect to pay any dividends in the foreseeable future. Any decision to pay dividends after this offering will be at the discretion of our board of directors and will depend on our financial condition, operating results, capital requirements and other factors that our board of directors determines relevant.
33
Table of Contents
We have a net tangible book value of $9.59 per common share. Our net tangible book value represents the amount of our total assets, excluding our intangible assets, less our total liabilities and non-controlling interests, calculated as at March 31, 2011, divided by 36,648,406, the total number of our common shares outstanding as of March 31, 2011.
After giving effect to the sale of 14,285,715 common shares in this offering at an assumed initial public offering price of $14.00 per share, the mid-point of the range set forth on the cover page of this prospectus, assuming that the underwriters have not exercised their over-allotment option, and after deduction of the estimated discounts and commissions and estimated offering expenses payable by us, our net tangible book value estimated as of the date of this prospectus would have been approximately $536.9 million, or $10.54 per common share. This represents an immediate increase in net tangible book value of $0.95 per common share to our existing shareholders and an immediate dilution of $3.46 per common share to purchasers of common shares in this offering. Dilution for this purpose represents the difference between the price per common share paid by these purchasers and net tangible book value per common share immediately after the completion of this offering.
The following table illustrates this dilution to new investors purchasing common shares, on a per share basis:
Assumed initial public offering price per share | $ | 14.00 | ||||||
Net tangible book value per share as of March 31, 2011, before giving effect to this offering | $ | 9.59 | ||||||
Increase in net tangible book value per share attributable to investors purchasing shares in this offering | $ | 0.95 | ||||||
Net tangible book value per share after giving effect to this offering | $ | 10.54 | ||||||
Dilution in net tangible book value per share to investors in this offering | $ | 3.46 | ||||||
Percentage of dilution in net tangible book value per share to investors in this offering | 24.7 | % |
The following table summarizes as of March 31, 2011, the differences between the number of common shares purchased from us, the total cash consideration paid and the average price per share paid by our existing shareholders and new investors purchasing common shares in this offering at the assumed initial offering price of $14.00 per share, before deducting estimated underwriting discounts and commissions and estimated offering expenses payable by us, and assuming that the underwriters have not exercised their over-allotment option:
| Shares Purchased | Total Consideration | Average Price Per Share | ||||||||||||||||||
| Number | Percent | Amount | Percent | |||||||||||||||||
Existing shareholders | 36,648,406 | 72.0 | % | $ | 375,705,656 | 65.3 | % | $ | 10.25 | |||||||||||
New investors | 14,285,715 | 28.0 | % | $ | 200,000,010 | 34.7 | % | $ | 14.00 | |||||||||||
Total | 50,934,121 | 100.0 | % | $ | 575,705,666 | 100.0 | % | $ | 11.30 | |||||||||||
If the underwriters exercise their over-allotment option in full, our existing shareholders would own 69.0% and our new investors would own 31.0% of the total number of our common shares outstanding upon completion of this offering; and the total consideration paid by our existing shareholders would be $375.7 million, or 62.0%, and the total consideration paid by our new investors would be $230.0 million, or 38.0%.
34
Table of Contents
Each $1.00 increase (decrease) in the offering price per common share would increase (decrease) the total consideration paid by new investors, total consideration paid by all shareholders and average price per common share paid by all shareholders by $14.3 million, $14.3 million and $0.28, respectively, assuming that the underwriters have not exercised their over-allotment option.
Information in this section does not reflect $5.0 million of common shares and $1.0 million of restricted shares that we have agreed to issue to certain of our executive officers as soon as practicable following completion of this offering at the initial public offering price. Based on the midpoint of the range on the cover page of this prospectus, we expect to issue 357,143 common shares and 71,429 restricted shares. The common shares will not be subject to vesting or forfeiture. The restricted shares are common shares that will be issued under our Equity Incentive Plan, which will vest at a rate of one-third per year and until vested will be subject to forfeiture in certain circumstances. See “Management—Compensation of Directors and Executive Officers—Union Agriculture Group Corp Equity Incentive Plan.”
35
Table of Contents
SELECTED CONSOLIDATED FINANCIAL DATA
The following tables present our selected consolidated financial data as of and for the periods indicated below. We have derived the selected historical statement of comprehensive income, cash flow and balance sheet data as of and for the years ended June 30, 2010 and 2009, and as of June 30, 2008 and for the period from our inception on January 2, 2008 through June 30, 2008 from our Audited Consolidated Financial Statements included elsewhere in this prospectus. We have derived the selected historical statement of comprehensive income, statement of cash flows for the nine-month periods ended March 31, 2011 and 2010, and our selected statement of financial position data as of March 31, 2011, from our Audited Interim Consolidated Financial Statements included elsewhere in this prospectus. The historical results for any prior period presented are not necessarily indicative of our results to be expected for any future period.
Our Audited Consolidated Financial Statements are prepared in accordance with IFRS as issued by the IASB, and the interpretations of the IFRIC. All IFRS issued by the IASB effective at the time of preparing our Audited Consolidated Financial Statements have been applied. We applied IFRS for the first time for the fiscal year ended June 30, 2010 with a transition date of January 2, 2008. See note 3 to our Audited Consolidated Financial Statements for details regarding our transition to IFRS and application of IFRS 1 “First Time Adoption of IFRS.” Our Audited Interim Consolidated Financial Statements are prepared in accordance with IFRS as issued by the IASB, and the interpretations of the IFRIC, including IAS 34 “Interim Financial Reporting.”
You should read the information contained in these tables in conjunction with “Selected Consolidated Financial Data,” “Capitalization,” “Management’s Discussion and Analysis of Financial Condition and Results of Operations,” “Presentation of Financial and Other Information” and our Consolidated Financial Statements and the accompanying notes included elsewhere in this prospectus.
| Fiscal Year Ended June 30, | Nine Months Ended March 31, | |||||||||||||||||||
| 2010 | 2009 | 2008 | 2011 | 2010 | ||||||||||||||||
Statement of Comprehensive Income Data: | ||||||||||||||||||||
Sales of agricultural produce and biological assets and services rendered | $ | 1,580,880 | $ | 199,394 | $ | — | $ | 6,212,163 | $ | 147,016 | ||||||||||
Rental income | 54,133 | — | — | 529,312 | 30,933 | |||||||||||||||
Cost of agricultural produce and biological assets sold and services rendered | (1,573,883 | ) | (157,772 | ) | — | (5,926,605 | ) | (128,902 | ) | |||||||||||
Initial recognition and changes in fair value of biological assets and agricultural produce | 5,335,808 | 232,324 | 5,864 | 11,575,441 | 2,541,921 | |||||||||||||||
Cost of production | (3,437,732 | ) | (943,392 | ) | (5,864 | ) | (7,595,472 | ) | (2,708,184 | ) | ||||||||||
Margin Before Operating Expenses | 1,959,206 | (669,446 | ) | — | 4,794,839 | (117,216 | ) | |||||||||||||
General and administrative expenses | (3,582,205 | ) | (1,636,123 | ) | (104,408 | ) | (7,668,310 | ) | (2,158,190 | ) | ||||||||||
Selling expenses | (24,613 | ) | (3,911 | ) | — | (124,243 | ) | (2,762 | ) | |||||||||||
Other operating income, net | — | 1,618 | — | 36,544 | — | |||||||||||||||
Loss from Operations Before Financing and Taxation | (1,647,612 | ) | (2,307,862 | ) | (104,408 | ) | (2,961,170 | ) | (2,278,168 | ) | ||||||||||
Financial results, net | 1,370,817 | (212,127 | ) | (6,615 | ) | 1,110,148 | 1,401,127 | |||||||||||||
Loss Before Income Tax | (276,795 | ) | (2,519,989 | ) | (111,023 | ) | (1,851,022 | ) | (877,041 | ) | ||||||||||
36
Table of Contents
| Fiscal Year Ended June 30, | Nine Months Ended March 31, | |||||||||||||||||||
| 2010 | 2009 | 2008 | 2011 | 2010 | ||||||||||||||||
Income tax expense | (81,643 | ) | (157,614 | ) | (5,249 | ) | 249,951 | 131,173 | ||||||||||||
Loss for the Year/ Period | (358,438 | ) | (2,677,603 | ) | (116,272 | ) | (1,601,071 | ) | (745,868 | ) | ||||||||||
Total Comprehensive Loss for the Year/ Period | $ | (358,438 | ) | $ | (2,677,603 | ) | $ | (116,272 | ) | $ | (1,601,071 | ) | $ | (745,868 | ) | |||||
Loss / Total Comprehensive Loss Attributable to: | ||||||||||||||||||||
Equity holders of the parent | $ | (336,833 | ) | $ | (2,586,911 | ) | $ | (107,549 | ) | $ | (1,601,071 | ) | $ | (724,263 | ) | |||||
Non-controlling interest | (21,605 | ) | (90,692 | ) | (8,723 | ) | — | (21,605 | ) | |||||||||||
Losses per share for loss attributable to equity holders of the parent during the year/ period: | ||||||||||||||||||||
Basic and Diluted | $ | (0.021 | ) | $ | (0.305 | ) | $ | (0.374 | ) | $ | (0.055 | ) | $ | (0.055 | ) | |||||
Cash Flow Data: | ||||||||||||||||||||
Net cash used in operating activities | $ | (13,680,833 | ) | $ | (2,153,973 | ) | $ | (290,891 | ) | $ | (12,037,844 | ) | $ | (6,501,240 | ) | |||||
Net cash used in investing activities | (96,117,100 | ) | (14,488,838 | ) | (1,064,532 | ) | (108,171,514 | ) | (42,729,322 | ) | ||||||||||
Net cash generated from financing activities | 109,872,680 | 83,735,281 | 1,319,515 | 158,016,627 | 101,842,190 | |||||||||||||||
| As of June 30, | As of March 31, | |||||||||||||||
| 2010 | 2009 | 2008 | 2011 | |||||||||||||
Statement of Financial Position Data: | ||||||||||||||||
Cash and cash equivalents | $ | 67,125,638 | $ | 67,014,579 | $ | 43,148 | $ | 104,942,161 | ||||||||
Biological assets | 7,744,547 | 1,922,742 | 730,936 | 23,463,716 | ||||||||||||
Inventories | 1,824,832 | 33,389 | — | 1,684,450 | ||||||||||||
Property, plant and equipment, net | 4,488,147 | 958,580 | 525,299 | 9,227,249 | ||||||||||||
Land underpromesas(1) | 100,714,669 | 12,230,211 | 712,909 | 190,864,497 | ||||||||||||
Investment property underpromesas, net | 4,633,968 | — | — | 23,293,946 | ||||||||||||
Total assets | 196,827,646 | 85,948,053 | 2,736,125 | 364,809,769 | ||||||||||||
Total liabilities | 3,355,292 | 2,007,969 | 141,938 | 12,943,785 | ||||||||||||
Share capital | 193,373,922 | 84,266,985 | 2,513,059 | 348,881,666 | ||||||||||||
Equity attributable to equity holders of the parent | 193,472,354 | 83,897,850 | 2,461,261 | 351,865,984 | ||||||||||||
Non controlling interest | — | 42,234 | 132,926 | — | ||||||||||||
| (1) | See “Management’s Discussion and Analysis of Financial Condition and Results of Operations—Critical Accounting Policies and Estimates—Land Under Promesas” for more details. |
37
Table of Contents
MANAGEMENT’S DISCUSSION AND ANALYSIS OF FINANCIAL
CONDITION AND RESULTS OF OPERATIONS
The following management’s discussion and analysis of financial condition and results of operations should be read in conjunction with our Consolidated Financial Statements and the related notes included elsewhere in this prospectus, as well as the information presented under “Selected Consolidated Financial Data.” The following management’s discussion and analysis of financial condition and results of operations contains forward-looking statements; for more information regarding the risks, uncertainties and assumptions inherent in these forward-looking statements, see “Forward-looking Statements” and “Risk Factors.”
Overview
We are one of the largest corporate agricultural landholders and operators in Uruguay and a leading producer of agricultural products for export to the global market. We have acquired approximately 84,670 hectares of agricultural land in Uruguay for our operations. Our diversified agricultural operations include crops (soybeans and wheat), rice, dairy, cattle, sheep and other products (blueberries and honey).
Since our formation on January 2, 2008, we have been focused on acquiring farmland, advancing our organizational and business efforts and obtaining financing. We recorded net losses of $1.6 million and $0.4 million in the nine months ended March 31, 2011 and in our fiscal year ended June 30, 2010, respectively, and have recorded cumulative net losses of $4.6 million since our formation. Our losses to date have resulted principally from the establishment of our diversified business portfolio, including, but not limited to, the start-up of our crops, rice and dairy businesses, which affected efficiency during the nine months ended March 31, 2011.
Our commercial activities in fiscal years 2008 and 2009 were not significant. In fiscal year 2010, we began our crops, rice and dairy businesses. As a result, our sales in fiscal year 2010 increased by 692.8% to $1.6 million from $0.2 million in fiscal year 2009. Our sales in the nine months ended March 31, 2011 were $6.2 million. We expect that our growth in future periods will be dependent on a variety of factors, including competition, our ability to execute our business strategy and our business plan, our ability to expand our business through land acquisitions and general economic conditions.
Trends
We believe that global demand for agricultural products will continue growing over the coming years, driven by global population growth, increasing per capita income, and increasing demand for sources of renewable energy.
According to the United Nations, the world population is expected to increase from 6.9 billion in 2010 to approximately 8.3 billion in 2030. This projected 20% increase is expected to be largely driven by the expansion of less developed regions, whose share of the global population is expected to reach 85% by 2030, as compared to 78% in 1990. Accordingly, we believe that agriculture will assume an even greater role in supplying products to satisfy the demand of a growing population.
In addition to a projected increase in population, the global per capita income of developing countries is expected to increase from the current $4,800 per year to $11,000 per year in 2030, according to the World Bank. Moreover, the middle class in these countries, which includes families with an average of four people and a budget between $16,000 and $68,000 per year, is expected to increase from 400.0 million in 2005 to 1.2 billion people in 2030, representing approximately 15% of the total global population. As world per capita income increases, particularly in countries with low per capita income, we expect to see a trend toward increased food consumption, in particular for protein rich products such as meat.
Another trend that is expected to contribute to greater demand for agricultural products is the increasing demand for renewable energy (with bioenergy as one of the main sources), which demand has increased on a per
38
Table of Contents
capita basis in recent years. This development is driven by government policies and subsidies for, among other things, biofuel usage, which has resulted in an increasing demand for energy crops such as grains and oilseeds. Another factor that should influence the use of agricultural products for production of biofuels is the increase in oil prices over the last two years, especially due to the concentration of production in few countries.
As a result of growing demand for agricultural products, market prices for our agricultural products, such as wheat and soybeans, have risen this year. However, we expect the market price for rice to remain stable, as the growth in demand is expected to be offset by the increase in global production. Global production of rice reached a record level in 2010 according to USDA, and is projected to further increase this year.
Factors Affecting Our Results of Operations
Our results of operations have been influenced and will continue to be influenced by the following factors:
Effects of Fluctuations in Yield and Meat Per Hectare
The occurrence of severe adverse weather conditions, especially droughts, hail, floods or frost, is unpredictable and may have a potentially devastating impact on agricultural production, may otherwise affect the supply and prices of the agricultural commodities that we sell and use in our business, and may also, to a lesser extent, adversely affect the kilograms, or kgs, of cattle and sheep produced per hectare. The effects of severe adverse weather conditions may also reduce yields at our farms.
Effects of Fluctuations in Production Costs
Since our formation, we have experienced fluctuations in our production costs primarily due to fluctuation in the costs of fertilizers, herbicide, seeds, feed and diesel.
Effects of Fluctuations in Commodity Prices
Commodity prices have historically experienced substantial fluctuations. Commodity price fluctuations impact our statement of income as follows:
| • | Initial recognition and changes in the fair value of biological assets and agricultural produce in respect of unharvested biological assets undergoing biological transformation; and |
| • | Sales of agricultural produce and biological assets sold to third parties. |
Fiscal Year and Harvest Year
Our fiscal year begins on July 1 and ends on June 30 of the following year. However, our production is based on the harvest year for our crops, rice and blueberries. A harvest year varies by plant according to the climate in which it is grown. Due to the geographic diversity of our farms, the planting period for a given plant may start earlier on one farm than on another, causing differences in their respective harvesting periods. Our financial results are presented on a fiscal year basis.
Production area for cattle and sheep is presented on a harvest year basis, as land utilized for cattle and sheep operations is linked to our farming operations and use of farmland during a harvest year, while our financial results for dairy, cattle and sheep are presented on a fiscal year basis.
Effects of Fluctuations of the Production Area
Our results of operations also depend on the size of the production area. The size of our acquired and leased area devoted to cattle, sheep, crop, rice and blueberry production fluctuates from period to period in connection
39
Table of Contents
with the purchase and development of new farmland, the sale of developed farmland, the lease of new farmland and the termination of existing farmland lease agreements, as well as normal crop rotation. The length of our lease agreements is usually one to three years. The production area for crops and rice can be planted and harvested one or two times per year. As a result, the planted and harvested area can exceed the production area within a single year.
Effect of Land Acquisitions
The comparability of our results of operations is also affected by the completion of significant land acquisitions. Our results of operations for earlier periods that do not include recently completed land acquisitions may not be comparable to the results of a more recent period that reflects the results of such land acquisitions. We have acquired significant tracts of farmland since our formation in January 2, 2008, including a total of approximately 190 hectares in fiscal year 2008, 8,160 hectares in fiscal year 2009, 26,000 hectares in fiscal year 2010 and 34,830 hectares in the nine months ended March 31, 2011. These acquisitions affect the comparability of our results of operations due to the resulting increase in our production area.
Effects of Foreign Currency Fluctuations
Our functional currency is the U.S. dollar and our Consolidated Financial Statements are presented in U.S. dollars. The majority of our operations are transacted in U.S. dollars. We sell our production to third parties for export to international markets which generally trade in U.S. dollars and the majority of our significant costs are in U.S. dollars. However, salaries and related costs to management and personnel based in Uruguay are paid in Uruguayan Pesos. In addition, a portion of our cash and cash equivalents are denominated in Canadian dollars. Any transactions denominated in currencies other than the U.S. dollar could result in foreign currency exchange gains or losses which would affect our statement of income.
Seasonality
Our business activities are inherently seasonal. We generally harvest and sell our soybean and rice production between March and May, and our wheat production from December to January. Blueberries are generally harvested between October and November. Wool is generally sheared between July and August. Sales in our cattle and dairy business segment tend to be less seasonal. However, dairy production is generally higher during September to December, when the weather is more suitable for production. Our lamb meat and apicultural activities are not significantly affected by seasonality. See “Business—Seasonality” for more details.
As a result of the above factors, there may be significant variations in our financial results from one quarter to another. In addition, our quarterly results may vary as a result of the effect of fluctuations in commodities prices, production yields and the fair value of biological assets. See “—Critical Accounting Policies and Estimates—Biological Assets and Agricultural Produce.”
Capital Expenditures
Our capital expenditures during the last three fiscal years and the nine months ended March 31, 2011 consisted primarily of expenses related to payments for acquisitions of land underpromesas. Our capital expenditures incurred in connection with such activities were $1.1 million for the fiscal year 2008, $12.0 million for the fiscal year 2009, $96.9 million for the fiscal year 2010 and $110.2 million for the nine months ended March 31, 2011.
Taxation
We believe that Uruguay benefits from low taxation compared to other countries in South America. However, we note that the President of Uruguay recently stated that he wished to tax land holdings of more than
40
Table of Contents
2,000 hectares with unknown rates from 2,000 to 10,000 hectares and more than 10,000 hectares at a rate of $16.00 per hectare. Although legislation regarding such a tax has not been introduced, it could come into effect in the future. If such a tax were to come into effect and we reached our objective of holding 160,000 hectares of land in Uruguay, such a tax would increase our total taxes by approximately $2.5 million per year, which would reduce our profitability or increase any loss by such amount.
Operating Segments
IFRS 8 “Operating Segments” requires an entity to report financial and descriptive information about its reportable segments, which are operating segments or aggregations of operating segments that meet specified criteria. Operating segments are components of an entity about which separate financial information is available that is evaluated regularly by the chief operating decision maker in deciding how to allocate resources and in assessing performance. The chief operating decision maker evaluates the business based on the differences in the nature of its products, operations and risks. The amount reported for each segment item is the measure reported to the chief operating decision maker for these purposes.
Operating segments identified are disclosed as reportable segments if they meet any of the following quantitative thresholds:
| • | the operating segment’s reported revenue, including both sales to external customers and inter-segment sales or transfers, represents 10% or more of the combined revenue, internal and external, of all operating segments; |
| • | the absolute amount of its reported profit or loss represents 10% or more of the greater, in absolute amount, of: |
| • | the combined reported profit of all operating segments that do not report a loss, and |
| • | the combined reported loss of all operating segments that report a loss; or |
| • | assets represent 10% or more of the combined assets of all operating segments. |
If, after determining reportable segments in accordance with the preceding quantitative thresholds, the total external revenue attributable to those segments amounts to less than 75% of the total consolidated external revenue, additional segments are identified as reportable segments, even if they do not meet the thresholds described above, until at least 75% of the consolidated external revenue is included in reportable segments. Once the 75% of the consolidated external revenue is included in reportable segments, the remaining operating segments are aggregated into “All other segments.”
As of March 31, 2011, our principal businesses are crops, rice, cattle, sheep and dairy businesses, and to a lesser extent our blueberry plantations and apiculture. Based on our managerial business structure, we operate in the following reportable segments as of March 31, 2011. Reportable segments for prior periods have been reported based on the current managerial structure:
| • | Our cattle segment consists of breeding, purchasing and/or fattening of beef cattle for sale to meat processors and local livestock auction markets. |
| • | Our sheep segment consists of breeding, purchasing and/or fattening of sheep for sale of meat and/or wool to meat processors, wool product manufacturers and wool cooperatives. |
| • | Our crops segment consists of planting, harvesting and sale of wheat and soybeans, which do not represent separate operating segments on an individual basis. We seek to maximize the use of our farmland through crop rotation and the type and amount of crops cultivated may vary from harvest year to harvest year. We are focused on the long-term performance of productive land, and to that extent, performance is assessed considering the aggregate combination, if any, of crops planted on the land. A single manager is responsible for the management of operating activity of all crops, rather than for each individual crop. |
41
Table of Contents
| • | Our rice segment consists of planting, harvesting and sale of rice locally to third parties for export. |
| • | Our dairy segment consists of breeding and purchasing dairy cattle for the production of raw milk for sale to local milk and milk-related products producers. |
| • | For purposes of our Consolidated Financial Statements and this prospectus, we have aggregated our remaining operating segments into “All Other Segments,” which consists of blueberry plantations and apiculture. These segments do not meet the quantitative thresholds for separate disclosure in accordance with IFRS 8. |
We do not export our products directly, but sell our products to third parties for export. The measurement principles for our segment reporting structure are based on the IFRS principles adopted in our Consolidated Financial Statements. Revenue generated and goods and services exchanged between segments are calculated on the basis of market prices on an individual basis.
Key Performance Indicators
Key performance indicators that we use to manage our business and evaluate our financial results and operating performance include yield and cost of production.
Yield is evaluated by segment, and is based on production per hectare of land. For our crops, rice and blueberry segments, we measure our harvest yield per hectare of land. For our cattle and sheep segments, we measure the kilograms of meat produced per hectare of land. We evaluate our yield performance by comparing the results to management forecasts and prior period performance.
We evaluate cost of production by each segment, and compare the results to management forecasts, prior period performance and the market price during the relevant period of the raw materials and consumables we use in our production.
Sources of Revenues and Expenses
The following describes our sources of revenues and expenses.
Revenues
We generate our revenues principally from the sale of agricultural products to third parties for export, and we do not export our products directly. Revenue is measured at the fair value of the consideration received or receivable, provided that it is probable that the economic benefits will flow to us and that the revenue and costs, if applicable, can be measured reliably, revenue is recognized as a profit or loss. We recognize revenue on product sales when the produce or biological assets are delivered and the customers take ownership and assume risk of loss. When the products are received by the customer at its facility or a designated location or collected directly by the customer from our farms, collection of the relevant receivable is probable and the selling price is fixed or determinable. Net sales of products represent the invoiced value of goods, net of trade discounts and allowances, if any. We also provide certain ancillary agricultural related services to third parties. In addition, we lease a mill and other warehousing space to third parties. Revenue from services is recognized as services are rendered. Lease income is recognized as services are provided. When the lease agreement provides for variable amounts based on a price per ton of product milled, contingent rent is recognized monthly based on the actual amounts involved.
Changes in Fair Value of Biological Assets and Agricultural Produce at the Point of Harvest
We measure our biological assets at initial recognition and at each applicable reporting date at fair value less costs to sell. Additionally, we measure agricultural produce at the point of harvest at fair value less costs to sell.
42
Table of Contents
Gains and losses that arise from measuring biological assets and agricultural produce at the point of harvest at fair value less costs to sell are recognized in the statement of income in the period in which they arise as “initial recognition and changes in fair value of biological assets and agricultural produce.” See “Critical Accounting Policies—Biological Assets and Agricultural Produce” below.
Cost of Revenues
Cost of revenues is comprised of cost of production and cost of agricultural produce and biological assets sold and services rendered. Cost of production includes expenses relating to the agricultural activity such as planting, harvesting, weeding, seedlings, irrigation, agrochemicals, fertilizers, veterinary and others, and is expensed when incurred. Cost of agricultural produce and biological assets sold and services rendered represents the recognition as an expense of agricultural produce held in inventory valued at cost (which reflects the fair value less costs to sell of agricultural produce at the point of harvest) or biological assets valued at fair value less costs to sell when the products are sold, and the costs of providing agricultural services. As a result, cost of production represents the costs expensed during the time the biological assets are growing and cost of agricultural produce and biological assets sold and services rendered represents the expensing of items from inventory and/or biological assets when sold.
General and Administrative Expenses and Sales Expenses
General and administrative expenses and sales expenses consist primarily of salaries and related expenses, administrative and finance functions, legal and professional fees, insurance, equity-settled share-based compensation, net worth tax and other corporate and overhead expenses.
Comparability of Periods
We have significantly increased our acquisitions of land every fiscal year since our formation in 2008, which includes land underpromesas. We have also commenced production in new business segments every fiscal year since our formation, beginning with blueberries in fiscal year 2008, cattle, sheep and apiculture in fiscal year 2009 and crops, rice and dairy in fiscal year 2010. Furthermore, we have a limited operating history and have not yet reached full operational capacity. Consequently, we believe that period-over-period comparisons of our operating results are not necessarily meaningful and should not be relied upon as being a good indicator of our future performance. See “—Factors Affecting Our Results of Operations—Effect of Land Acquisitions” above for additional details.
In addition, the results of operations for fiscal year 2008 only comprise of the period from our formation on January 2, 2008 to June 30, 2008, which is not a full twelve-month period. As a result, we believe that the comparability of fiscal year 2008 operating results to other fiscal years is limited.
43
Table of Contents
Results of Operations—Nine months ended March 31, 2011 compared to Nine months ended March 31, 2010
The following table sets forth certain financial information with respect to our consolidated results of operations for the periods indicated.
| Nine Months Ended March 31, | ||||||||
| 2011 | 2010 | |||||||
Statement of Comprehensive Income Data: | ||||||||
Sales of agricultural produce and biological assets and services rendered | $ | 6,212,163 | $ | 147,016 | ||||
Rental income | 529,312 | 30,933 | ||||||
Cost of agricultural produce and biological assets sold and services rendered | (5,926,605 | ) | (128,902 | ) | ||||
Initial recognition and changes in fair value of biological assets and agricultural produce | 11,575,441 | 2,541,921 | ||||||
Cost of production | (7,595,472 | ) | (2,708,184 | ) | ||||
Margin Before Operating Expenses | 4,794,839 | (117,216 | ) | |||||
General and administrative expenses | (7,668,310 | ) | (2,158,190 | ) | ||||
Selling expenses | (124,243 | ) | (2,762 | ) | ||||
Other operating income, net | 36,544 | — | ||||||
Loss from Operations Before Financing and Taxation | (2,961,170 | ) | (2,278,168 | ) | ||||
Financial results, net | 1,110,148 | 1,401,127 | ||||||
Loss Before Income Tax | (1,851,022 | ) | (877,041 | ) | ||||
Income tax expense | 249,951 | 131,173 | ||||||
Loss for the Year/ Period | (1,601,071 | ) | (745,868 | ) | ||||
Total Comprehensive Loss for the Year/ Period | $ | (1,601,071 | ) | $ | (745,868 | ) | ||
Sales and Cost of Agricultural Produce and Biological Assets and Services Rendered
The following table sets forth the sales of agricultural produce and biological assets by segment for the periods indicated:
Nine months ended March 31, | Cattle | Sheep | Crops | Rice | Dairy | All Other Segments | Total | |||||||||||||||||||||
2011 | $ | 2,688,768 | $ | 296,216 | $ | 2,143,597 | $ | 866,763 | $ | 116,203 | $ | 100,616 | $ | 6,212,163 | ||||||||||||||
2010 | 125,591 | — | 9,617 | — | — | 11,808 | 147,016 | |||||||||||||||||||||
In fiscal year 2010, we commenced production in our crops, rice and dairy segments. However, we did not harvest agricultural produce in those segments during the nine months ended March 31, 2010, and therefore we did not have sales of crops, rice or dairy produce during that period. Sales of agricultural produce and biological assets increased from $0.1 million in the nine months ended March 31, 2010 to $6.2 million in the nine months ended March 31, 2011, primarily as a result of:
| • | a $2.6 million increase in our cattle segment, primarily as a result of an increase in the number of heads of cattle sold, from 242 in the nine months ended March 31, 2010 to 4,304 in the nine months ended March 31, 2011; and to a lesser extent, an increase in average market prices of beef cattle, from $1.57/kg in the nine months ended March 31, 2010 to $1.89/kg in the nine months ended March 31, 2011; |
44
Table of Contents
| • | a $2.1 million increase in our crops segment resulting from the sale of 6,257 tons of wheat at an average price of $260/ton and 1,588 tons of soybean at an average price of $326/ton harvested in the nine months ended March 31, 2011 as compared to nil sales in the nine months ended March 31, 2010; partially offset by harvesting services rendered for $9,617 during the nine months ended March 31,2010; |
| • | a $0.9 million increase in our rice segment resulting from the sale of 3,528 tons of rice harvested in the nine months ended March 31, 2011 as compared to nil sales in the nine months ended March 31, 2010; |
| • | a $0.3 million increase in our sheep segment due to the sale of 2,996 heads of sheep at a market price of $65.60 per sheep, and the sale of 15,802 kg of wool at a price of $6.30/kg in the nine months ended March 31, 2011as compared to nil sales in the nine months ended March 31, 2010; |
| • | a $0.1 million increase in our dairy segment resulting from the sale of 316,819 liters of milk at an average price of $0.36/liter in the nine months ended March 31, 2011 as compared to nil sales in the nine months ended March 31, 2010; and |
| • | a $0.1 million increase in our all other segments resulting primarily from the sale of 27,451 kg of blueberries at a price of $3.00/kg in the nine months ended March 31, 2011, as compared to 3.936 kg at a price of $3.07/kg in the nine months ended March 31, 2010. |
Rental Income
During the nine months ended March 31, 2011, we entered into short-term operating leases of Arroyo Blanco and Merín farmlands. Additionally, we continued the operating lease with SAMAN for general rice warehousing space. As a result, rental income increased from $0.03 million in the nine months ended March 31, 2010 to $0.5 million in the nine months ended March 31, 2011. As of March 31, 2011, land leased to third parties represented approximately 8.7% of our total land. The lease related to the Arroyo Blanco farmlands was terminated in May 2011, and the lease related to the Merín farmlands was terminated in June 2011.
Initial Recognition and Changes in Fair Value of Biological Assets and Agricultural Produce
The following table sets forth the initial recognition and changes in fair value of biological assets and agricultural produce by segment for the periods indicated:
Nine months ended March 31, | Cattle | Sheep | Crops | Rice | Dairy | All Other Segments | Total | |||||||||||||||||||||
2011 | $ | 4,850,735 | $ | 302,641 | $ | 2,886,043 | $ | 3,070,067 | $ | 237,871 | $ | 228,084 | $ | 11,575,441 | ||||||||||||||
2010 | 1,070,666 | 14,682 | 405,100 | 699,466 | 19,400 | 332,607 | 2,541,921 | |||||||||||||||||||||
Initial recognition and changes in fair value of biological assets and agricultural produce increased from $2.5 million in the nine months ended March 31, 2010 to $11.6 million in the nine months ended March 31, 2011, primarily due to:
| • | a $3.8 million increase in our cattle segment, primarily due to (i) an increase in average market prices of cattle from $1.39/kg in the nine months ended March 31, 2010 to $1.89/kg in the nine months ended March 31, 2011, and an increase in the number of cattle from 6,866 head of cattle in the nine months ended March 31, 2010 to 32,027 head of cattle in the nine months ended March 31, 2011, and (ii) an increase related to cattle births from 1,251 head of cattle in the nine months ended March 31, 2010 to 6,686 head of cattle in the nine months ended March 31, 2011; |
| • | a $2.5 million increase in our crops segment primarily due to (i) a $1.7 million increase in the fair value of our crops as of period-end, primarily due to an increase in the number of hectares planted from 1,163 in the nine months ended March 31, 2010 to 2,670 hectares in the nine months ended March 31, 2011, an increase in estimated crop prices (mainly soybeans, the price of which increased from $325/ton to $480/ton), and an increase in estimated yields; and (ii) a $0.9 million increase due to the gain arising from the initial recognition of agricultural produce at the point of harvest of 6,345 tons of |
45
Table of Contents
wheat in the nine months ended March 31, 2011, as compared to nil during the nine months ended March 31, 2010; |
| • | a $2.4 million increase in our rice segment primarily due to (i) a $1.9 million increase in the fair value of our rice plantations as of period-end, primarily due to an increase in the number of hectares planted from 481 in the nine months ended March 31, 2010 to 1,739 hectares in the nine months ended March 31, 2011; and (ii) a $ 0.4 million increase due to the gain arising from the initial recognition of agricultural produce at the point of harvest of 3,528 tons of rice harvested in the nine months ended March 31, 2011, as compared to nil during the nine months ended March 31, 2010; |
| • | a $0.3 million increase in our sheep segment, primarily due to (i) an increase in average market prices of sheep from $1.34/kg in the nine months ended March 31, 2010 to $1.94/kg in the nine months ended March 31, 2011, and an increase in the number of sheep from 5,688 head of sheep in the nine months ended March 31, 2010 to 14,503 head of sheep in nine months ended March 31, 2011, and (ii) an increase related to sheep births from 1,519 head of sheep in the nine months ended March 31, 2010 to 2,767 head of sheep in the nine months ended March 31, 2011; and |
| • | a $0.2 million increase in our dairy segment primarily due to (i) an increase in average market prices of dairy cattle and an increase in the number of dairy cattle from 597 head of dairy cattle in the nine months ended March 31, 2010 to 966 head of dairy cattle in the nine months ended March 31, 2011, and (ii) a $0.1 million increase due to the gain arising from the initial recognition of agricultural produce at the point of harvest of 316,819 liters of milk during the nine months ended March 31, 2011, as compared to nil in the nine months ended March 31, 2010. |
Of the $11.6 million of initial recognition and changes in fair value of biological assets and agricultural produce for the nine months ended March 31, 2011, $8.1 million represents the unrealized portion, as compared to the $2.4 million unrealized portion of the $2.5 million of initial recognition and changes in fair value of biological assets and agricultural produce in the nine months ended March 31, 2010.
Cost of Production
The following table sets forth the cost of production by segment for the periods indicated:
Nine months ended March 31, | Cattle | Sheep | Crops | Rice | Dairy | All Other Segments | Total | |||||||||||||||||||||
2011 | $ | 1,434,768 | $ | 222,406 | $ | 2,864,242 | $ | 2,345,297 | $ | 325,727 | $ | 403,032 | $ | 7,595,472 | ||||||||||||||
2010 | 584,510 | 134,856 | 825,146 | 721,735 | 55,498 | 386,439 | 2,708,184 | |||||||||||||||||||||
Cost of production increased 180.5%, from $2.7 million in the nine months ended March 31, 2010 to $7.6 million in the nine months ended March 31, 2011, primarily due to:
| • | a $2.0 million increase in our crops segment primarily due to (i) a $1.3 million increase in consumable supplies (primarily seeds, fertilizers and agrochemicals), (ii) a $0.3 million increase in salaries and social security expenses, and (iii) a $0.4 million increase in agricultural services provided by third parties. These increases in our costs were related to the expansion of our crop production activities during the nine months ended March 31, 2011; |
| • | a $1.6 million increase in our rice segment due primarily to (i) a $0.6 million increase in consumables supplies (primarily seeds, fertilizers and agrochemicals), (ii) $0.4 million increase in salaries and social security expenses, and (iii) a $0.2 million increase in agricultural services provided by third parties; |
| • | a $0.9 million increase in our cattle segment primarily due to (i) a $0.3 million increase in consumables supplies due to an increase in the number of head of cattle from 6,866 in the nine months ended March 31, 2010 to 32,027 head of cattle in the nine months ended March 31, 2011, (ii) a $0.1 million increase in salaries and social security expenses primarily due to an increase in the number of employees involved in breeding and fattening cattle and (iii) a $0.2 million increase in agricultural services provided by third parties; |
46
Table of Contents
| • | a $0.3 million increase in our dairy segment primarily due to an increase in the number of dairy cattle from 597 head of dairy cattle in the nine months ended March 31, 2010 to 966 head of dairy cattle in the nine months ended March 31, 2011; and |
| • | a $0.1 million increase in our sheep segment primarily due to an increase in the number of sheep from 5,688 head of sheep in the nine months ended March 31, 2010 to 14,503 head of sheep in the nine months ended March 31, 2011. |
General and Administrative Expenses
Our general and administrative expenses increased by 255.3%, from $2.2 million in the nine months ended March 31, 2010 to $7.7 million in the nine months ended March 31, 2011, primarily due to:
| • | a $2.6 million increase in our corporate expenses primarily due to (i) a $1.8 million increase in salaries and social security expenses primarily as a result of a higher stock option compensation charge during the nine months ended March 31, 2011, and (ii) a $0.4 million increase in professional fees paid to third parties; |
| • | a $1.4 million increase in our cattle segment primarily due to an increase in the net worth tax accrual generated by a higher tax base during the nine months ended March 31, 2011; and |
| • | a $0.9 million increase in our crops segment due to an increase in the net worth tax accrual generated by a higher tax base during the nine months ended March 31, 2011. |
Selling Expenses
Selling expenses were not significant to our operations in the nine months ended March 31, 2010 or the nine months ended March 31, 2011. Our sales are made directly to our customers and no related commissions or selling expenses are incurred. As well, transportation expenses are generally borne by our customers. We did not perform any advertising or marketing activities in the nine months ended March 31, 2010 or the nine months ended March 31, 2011.
Selling expenses increased from $2,762 in the nine months ended March 31, 2010 to $124,243 in the nine months ended March 31, 2011, primarily due to an increase in payroll costs as a result of an increase in the volume of sales in the nine months ended March 31, 2011.
Other Operating Income, Net
No profit or loss was recognized within other operating income in the nine months ended March 31, 2010. During the nine months ended March 31, 2011, other operating income amounted to $36,544 due to a $50,885 gain resulting from derivative financial instruments, partially offset by a loss of $14,341 resulting from the disposal of fixed assets.
Loss From Operations Before Financing and Taxation
As a result of the foregoing, our loss from operations before financing and taxation for the nine months ended March 31, 2011 increased 30.0%, from $2.3 million in the nine months ended March 31, 2010 to $3.0 million in the nine months ended March 31, 2011.
Financial Results, Net
Financial results, net decreased by $0.3 million, from a profit of $1.4 million in the nine months ended March 31, 2010 to a profit of $1.1 million in the nine months ended March 31, 2011, primarily due to a $0.9 million decrease in foreign exchange gains, net in the nine months ended March 31, 2011, primarily as a
47
Table of Contents
result of an appreciation of the Uruguayan Peso and the Canadian dollar against the U.S. dollar in the nine months ended March 31, 2010, partially offset by a $0.6 million increase in the gain from changes in fair value of financial assets at fair value through profit or loss during the nine months ended March 31, 2011 due to an increase in market prices of our investment in equity securities.
Income Tax Expense
Our consolidated income tax expense decreased from a total gain of $0.1 million in the nine months ended March 31, 2010 to $0.2 million in the nine months ended March 31, 2011. This decrease primarily relates to the temporary differences that arise from the valuation of our biological assets, our property, plant and equipment and our equity-settled share-based compensation. Our effective tax rate on a consolidated basis was 13.5% for the nine months ended March 31, 2011, as compared to 15.0% for the nine months ended March 31, 2010. The increase is a consequence of higher non-taxable items and other charges in the nine months ended March 31, 2011, as compared to the nine months ended March 31, 2010, partially offset by an increase in inflation adjustment for tax purposes and a decrease in tax loss carry forwards not recognized in the nine months ended March 31, 2011.
Loss for the Period
As a result of the foregoing, our loss for the period increased 114.7%, from $0.7 million in the nine months ended March 31, 2010 to $1.6 million in the nine months ended March 31, 2011.
Results of Operations—Fiscal Year 2010 compared to Fiscal Year 2009
The following table sets forth certain financial information with respect to our consolidated results of operations for the periods indicated.
| June 30, 2010 | June 30, 2009 | |||||||
Sales of agricultural produce and biological assets and services rendered | $ | 1,580,880 | $ | 199,394 | ||||
Rental income | 54,133 | — | ||||||
Cost of agricultural produce and biological assets sold and services rendered | (1,573,883 | ) | (157,772 | ) | ||||
Initial recognition and changes in fair value of biological assets and agricultural produce | 5,335,808 | 232,324 | ||||||
Cost of production | (3,437,732 | ) | (943,392 | ) | ||||
Margin Before Operating Expenses | 1,959,206 | (669,446 | ) | |||||
General and administrative expenses | (3,582,205 | ) | (1,636,123 | ) | ||||
Selling expenses | (24,613 | ) | (3,911 | ) | ||||
Other operating income, net | — | 1,618 | ||||||
Loss from Operations Before Financing and Taxation | (1,647,612 | ) | (2,307,862 | ) | ||||
Finance income | 1,371,337 | 653,411 | ||||||
Finance costs | (520 | ) | (865,538 | ) | ||||
Financial results, net | 1,370,817 | (212,127 | ) | |||||
Loss Before Income Tax | (276,795 | ) | (2,519,989 | ) | ||||
Income tax expense | (81,643 | ) | (157,614 | ) | ||||
Loss for the Year | (358,438 | ) | (2,677,603 | ) | ||||
Total Comprehensive Loss for the Year | (358,438 | ) | (2,677,603 | ) | ||||
48
Table of Contents
Sales and Cost of Agricultural Produce and Biological Assets and Services Rendered
The following table sets forth the sales of agricultural produce and biological assets by segment for the periods indicated:
| Fiscal Year | Cattle | Sheep | Crops | Rice | Dairy | All Other Segments | Total | |||||||||||||||||||||
2010 | $ | 352,208 | $ | 83,864 | $ | 9,617 | $ | 1,123,383 | — | $ | 11,808 | $ | 1,580,880 | |||||||||||||||
2009 | 148,687 | 23,338 | — | — | — | 27,369 | 199,394 | |||||||||||||||||||||
In fiscal year 2010, we commenced production in our crops, rice and dairy segments, and continued production in our cattle and sheep segments. Sales of agricultural produce and biological assets increased 692.8%, from $0.2 million in fiscal year 2009 to $1.6 million in fiscal year 2010, primarily as a result of:
| • | a $1.1 million increase in our rice segment resulting from the sale of 4,567 tons of rice harvested from our first harvest; |
| • | a $0.2 million increase in our cattle segment, primarily as a result of a 141.5% increase in the average market price of beef cattle, from $0.94/kg in fiscal year 2009 to $2.27/kg in fiscal year 2010, partially offset by a reduction in the number of heads of cattle sold, from 690 in fiscal year 2009 to 680 in fiscal year 2010. The increase in market price was primarily due to a rebound from the depressed market price in fiscal year 2009 as a result of a drought in Uruguay during fiscal year 2009 which adversely affected the quality of the beef cattle head and market price; and |
| • | a $0.1 million increase in our sheep segment due to the sale of 20,213 kg of wool at a price of $4.20/kg in fiscal year 2010 as compared to nil sales of wool in fiscal year 2009; partially offset by nil sales of sheep in fiscal year 2010 as compared to the sale of 3,500 heads of sheep at a market price of $6.70 per sheep in fiscal year 2009. |
Rental Income
In fiscal year 2010, we entered into an operating lease agreement with SAMAN pursuant to which we lease general warehousing space to SAMAN. The agreement calls for an annual fixed payment of $40,000 during the first year and $75,000 for the second and third years plus a variable payment of $5 for every ton of rice milled. The fixed payment is increased 12.5% at the inception of every subsequent three-year period. Rental income under this lease was $54,133 in fiscal year 2010. There were no lease agreements in fiscal years 2009 and 2008.
Initial Recognition and Changes in Fair Value of Biological Assets and Agricultural Produce
The following table sets forth the initial recognition and changes in fair value of biological assets and agricultural produce by segment for the periods indicated:
| Fiscal Year | Cattle | Sheep | Crops | Rice | Dairy | All Other Segments | Total | |||||||||||||||||||||
2010 | $ | 1,956,574 | $ | 478,648 | $ | 1,018,501 | $ | 1,268,874 | $ | 92,195 | $ | 521,016 | $ | 5,335,808 | ||||||||||||||
2009 | 553,778 | 47,778 | — | — | — | (369,232 | ) | 232,324 | ||||||||||||||||||||
Initial recognition and changes in fair value of biological assets and agricultural produce increased from $0.2 million in fiscal year 2009 to $5.3 million in fiscal year 2010, primarily due to:
| • | a $1.4 million increase in our cattle segment, from $0.6 million in fiscal year 2009 to $2.0 million in fiscal year 2010, primarily due to an increase in average market prices of cattle from $0.94/kg in fiscal year 2009 to $2.27/kg in fiscal year 2010, and an increase in the number of cattle from 4,952 heads of cattle in fiscal year 2009 to 12,071 heads of cattle in fiscal year 2010; |
49
Table of Contents
| • | a $1.3 million increase in our rice segment primarily due to the gain arising from the initial recognition at the point of harvest of 4,664 tons of rice during fiscal year 2010 (nil during fiscal year 2009); |
| • | a $1.0 million increase in our crops segment primarily due to the gain arising from the initial recognition at the point of harvest of 7,792 tons of wheat and soybeans during fiscal year 2010 (nil during fiscal year 2009); |
| • | a $0.4 million increase in our sheep segment, primarily due to an increase in average market prices of sheep from $1.7/kg in fiscal year 2009 to $4.1/kg in fiscal year 2010, and an increase in the number of sheep from 4,818 heads of sheep in fiscal year 2009 to 6,941 heads of sheep in fiscal year 2010; |
| • | a $0.1 million increase in our dairy segment primarily due to an increase in average market prices of dairy cattle; and |
| • | a $0.9 million increase in our all other segments primarily due to the recognition of a loss of $0.4 million in fiscal year 2009 due to the damage caused by a hailstorm in our blueberry bushes, as compared to a gain of $0.5 million in fiscal year 2010 due to improvements in our blueberry bushes that increased their fair value during that period. |
Of the $5.3 million of initial recognition and changes in fair value of biological assets and agricultural produce for fiscal year 2010, $4.0 million represents the unrealized portion, as compared to the $0.2 million unrealized portion of the $0.2 million of initial recognition and changes in fair value of biological assets and agricultural produce in fiscal year 2009.
Cost of Production
The following table sets forth the cost of production by segment for the periods indicated:
| Fiscal Year | Cattle | Sheep | Crops | Rice | Dairy | All Other Segments | Total | |||||||||||||||||||||
2010 | $ | 799,154 | $ | 233,437 | $ | 956,971 | $ | 868,612 | $ | 87,501 | $ | 492,057 | $ | 3,437,732 | ||||||||||||||
2009 | 409,957 | 34,143 | — | — | — | 499,292 | 943,392 | |||||||||||||||||||||
Cost of production increased 264.4%, from $0.9 million in fiscal year 2009 to $3.4 million in fiscal year 2010, primarily due to:
| • | a $1.0 million increase in our crops segment due to the commencement of our crop production activities during fiscal year 2010. Costs incurred in crop production consist primarily of (i) $0.5 million of consumables supplies (primarily seeds, fertilizers and agrochemicals), (ii) $0.1 million of salaries and social security expenses, and (iii) $0.1 million of agricultural services provided by third parties; |
| • | a $0.9 million increase in our rice segment due to the commencement of our rice production activities during fiscal year 2010. Costs incurred in rice production consist primarily of (i) $0.4 million of agricultural services provided by third parties, (ii) $0.2 million of consumables supplies (primarily seeds, fertilizers and agrochemicals), and (iii) $0.1 million of salaries and social security expenses. Cost of production incurred during fiscal year 2010 was approximately 40% higher than budgeted due to heavy rains that increase our planting costs; |
| • | a $0.4 million increase in our cattle segment primarily due to (i) a $0.2 million increase in salaries and social security expenses primarily due to an increase in the number of employees involved in breeding and fattening cattle, and (ii) a $0.2 million increase in cattle services provided by third parties primarily due to an increase in the number of cattle from 4,952 heads of cattle in fiscal year 2009 to 12,071 heads of cattle in fiscal year 2010; and |
| • | a $0.2 million increase in our sheep segment primarily due to an increase in the number of sheep from 4,818 heads of sheep in fiscal year 2009 to 6,941 heads of sheep in fiscal year 2010. |
50
Table of Contents
General and Administrative Expenses
Our general and administrative expenses increased by 118.9%, from $1.6 million in fiscal year 2009 to $3.6 million in 2010, primarily due to:
| • | a $0.8 million increase in our crops segment due to the commencement of our crops activities during fiscal year 2010, which increase primarily relates to the accrual of the net worth tax; |
| • | a $0.4 million increase in our corporate expenses primarily due to an increase in salaries and social security expenses primarily as a result of an increase in the number of employees from 10 employees in fiscal year 2009 to 18 employees in fiscal year 2010. As well, most of the employees hired during fiscal year 2009 were hired from January 2009 onwards; |
| • | a $0.4 million increase in our cattle segment primarily due to an increase in the net worth tax accrual generated by a higher tax base during fiscal year 2010; and |
| • | a $0.2 million increase in our rice segment due to the commencement of our rice activities during fiscal year 2010, which increase primarily relates to the accrual of the net worth tax. |
Selling Expenses
Selling expenses were not significant to our operations in fiscal year 2009 or fiscal year 2010. Our sales are made directly to our customers and no related commissions or selling expenses are incurred. As well, transportation expenses are generally borne by our customers. We did not perform any advertising or marketing activities in fiscal year 2009 or fiscal year 2010.
Selling expenses increased from $3,911 in fiscal year 2009 to $24,613 in fiscal year 2010, primarily due to an increase in payroll costs as a result of an increase in the volume of sales in our cattle, sheep and rice segments in fiscal year 2010.
Other Operating Income, Net
In fiscal year 2009, other operating income included gains from the sale of property, plant and equipment for an amount of $1,618. No profit or loss was recognized within other operating income in fiscal year 2010.
Loss From Operations Before Financing and Taxation
As a result of the foregoing, our loss from operations before financing and taxation for the fiscal year 2010 decreased 28.6%, from $2.3 million in fiscal year 2009 to $1.6 million in fiscal year 2010.
Financial Results, Net
Financial results, net increased by $1.6 million, from a loss of $0.2 million in fiscal year 2009 to a profit of $1.4 million in fiscal year 2010, primarily due to a $1.4 million increase in foreign exchange gains net from a loss of $0.9 million in fiscal year 2009 to a gain of $0.5 million in fiscal year 2010, primarily as a result of the appreciation of the Uruguayan Peso and the Canadian dollar against the U.S. dollar in fiscal year 2010, as compared to an appreciation of the U.S. dollar against the Canadian dollar in fiscal year 2009.
Income Tax Expense
Our consolidated income tax expense decreased from a total of $0.2 million in fiscal year 2009 to $0.1 million in fiscal year 2010. This decrease primarily relates to the temporary differences that arise from the valuation of our biological assets, our property, plant and equipment and our equity-settled share-based compensation. The effective tax rate on a consolidated basis was 29.5% for fiscal year 2010, as compared to
51
Table of Contents
6.3% for fiscal year 2009. The increase is a consequence of higher non-deductible items and other charges in fiscal year 2010 as compared to fiscal year 2009, partially offset by an increase in tax loss carry forwards not recognized in fiscal year 2010.
Loss for the Year
As a result of the foregoing, our loss for the year decreased 86.6%, from $2.7 million in fiscal year 2009 to $0.4 million in fiscal year 2010.
Results of Operations—Fiscal Year 2009 compared to Fiscal Year 2008
The following table sets forth certain financial information with respect to our consolidated results of operations for the periods indicated.
| June 30, 2009 | June 30, 2008 | |||||||
Sales of agricultural produce and biological assets and services rendered | $ | 199,394 | — | |||||
Cost of agricultural produce and biological assets sold and services rendered | (157,772 | ) | — | |||||
Initial recognition and changes in fair value of biological assets and agricultural produce | 232,324 | $ | 5,864 | |||||
Cost of production | (943,392 | ) | (5,864 | ) | ||||
Margin Before Operating Expenses | (669,446 | ) | — | |||||
General and administrative expenses | (1,636,123 | ) | (104,408 | ) | ||||
Selling expenses | (3,911 | ) | — | |||||
Other operating income, net | 1,618 | �� | ||||||
Loss from Operations Before Financing and Taxation | (2,307,862 | ) | (104,408 | ) | ||||
Finance income | 653,411 | — | ||||||
Finance costs | (865,538 | ) | (6,615 | ) | ||||
Financial results, net | (212,127 | ) | (6,615 | ) | ||||
Loss Before Income Tax | (2,519,989 | ) | (111,023 | ) | ||||
Income tax expense | (157,614 | ) | (5,249 | ) | ||||
Loss for the Year/ Period | (2,677,603 | ) | (116,272 | ) | ||||
Total Comprehensive Loss for the Year/ Period | (2,677,603 | ) | (116,272 | ) | ||||
Sales and Cost of Agricultural Produce and Biological Assets and Services Rendered
The following table sets forth the sales of agricultural produce and biological assets by segment for the periods indicated:
| Fiscal Year | Cattle | Sheep | Crops | Rice | Dairy | All Other Segments | Total | |||||||||||||||||||||
2009 | $ | 148,687 | $ | 23,338 | — | — | — | $ | 27,369 | $ | 199,394 | |||||||||||||||||
2008 | — | — | — | — | — | — | — | |||||||||||||||||||||
We commenced operations in April 2008, primarily operating our blueberry business on 40 hectares of immature blueberry plantations. Our commercial activity in fiscal year 2008 was minimal with no sales recorded.
52
Table of Contents
In fiscal year 2009, we commenced production in our cattle, sheep and apiculture segments. Sales of agricultural produce and biological assets increased from nil in fiscal year 2008 to $0.2 million in fiscal year 2009, primarily as a result of:
| • | a $148,687 increase in our cattle segment resulting from the sale of 690 heads of cattle at an average market price of $0.94/kg in fiscal year 2009. We did not sell any cattle in fiscal year 2008; |
| • | a $23,338 increase in our sheep segment resulting from the sale of 3,500 heads of sheep at an average market price of $6.70 per sheep in fiscal year 2009. We did not sell any sheep in fiscal year 2008; and |
| • | a $27,369 increase in our all other segments resulting from the sale of blueberries and honey. |
Initial Recognition and Changes in Fair Value of Biological Assets and Agricultural Produce
The following table sets forth the initial recognition and changes in fair value of biological assets and agricultural produce by segment for the periods indicated:
| Fiscal Year | Cattle | Sheep | Crops | Rice | Dairy | All Other Segments | Total | |||||||||||||||||||||
2009 | $ | 553,778 | $ | 47,778 | — | — | — | $ | (369,232 | ) | $ | 232,324 | ||||||||||||||||
2008 | — | — | — | — | — | 5,864 | 5,864 | |||||||||||||||||||||
Initial recognition and changes in fair value of biological assets and agricultural produce increased from $5,864 in fiscal year 2008 to $232,324 in fiscal year 2009, primarily due to:
| • | a $0.6 million increase in our cattle segment due to an increase of approximately 21% in average market prices of cattle from purchase to the end of fiscal year 2009 (we were not involved in cattle activities during fiscal year 2008), partially offset by: |
| • | a $0.4 million decrease in our all other segments primarily due to the recognition of a loss of $0.4 million in fiscal year 2009 as a result of damage caused by a hailstorm in our blueberry bushes, as compared to a gain of $5,864 in fiscal year 2008. |
Of the $0.2 million of initial recognition and changes in fair value of biological assets and agricultural produce for fiscal year 2009, $0.2 million represented the unrealized portion, as compared to the $5,864 unrealized portion of the $5,864 of initial recognition and changes in fair value of biological assets and agricultural produce in fiscal year 2008.
Cost of Production
The following table sets forth the cost of production by segment for the periods indicated:
| Fiscal Year | Cattle | Sheep | Crops | Rice | Dairy | All Other Segments | Total | |||||||||||||||||||||
2009 | $ | 409,957 | $ | 34,143 | — | — | — | $ | 499,292 | $ | 943,392 | |||||||||||||||||
2008 | — | — | — | — | — | 5,864 | 5,864 | |||||||||||||||||||||
Cost of production increased from $5,864 in fiscal year 2008 to $0.9 million in fiscal year 2009, primarily due to:
| • | a $0.5 million increase in our all other segments. We commenced operations in our blueberry segment in April 2008, and as a result, our production activities during fiscal year 2008 were minimal, with only $5,864 of costs incurred primarily in field maintenance and preparation. During fiscal year 2009, we continued growing our immature blueberry bushes. Costs of production incurred during fiscal year 2009 consisted primarily of (i) $0.3 million in salaries and social security contributions for personnel working on blueberry activities, (ii) $0.1 million of field maintenance and preparation, and (iii) $0.1 million of depreciation of property, plant and equipment (primarily vehicles and machinery). Costs incurred in our apiculture business were not significant in fiscal year 2009; and |
53
Table of Contents
| • | a $0.4 million increase in our cattle segment due to the commencement of our cattle breeding and fattening activities during fiscal year 2009. Costs incurred in these activities consisted primarily of (i) $0.2 million in agrochemicals, fertilizers and feeding and health expenses, and (ii) $0.1 million of salaries and social security contributions for personnel working on cattle activities. |
General and Administrative Expenses
Our general and administrative expenses increased from $0.1 million in fiscal year 2008 to $1.6 million in 2009, primarily due to:
| • | a $1.3 million increase in our corporate expenses primarily due to (i) a $0.5 million increase in management compensation, (ii) a $0.3 million increase in equity-settled based compensation, and (iii) a $0.2 million increase in professional fees incurred (primarily legal and accounting); |
| • | a $0.2 million increase in our cattle segment due to the commencement of our cattle activities during fiscal year 2009, which increase primarily relates to the accrual of the net worth tax; and |
| • | a $0.1 million increase in our sheep segment due to the commencement of our sheep activities during fiscal year 2009, which increase primarily relates to the accrual of the net worth tax. |
Selling Expenses
Selling expenses were not significant to our operations in fiscal year 2008 or fiscal year 2009. Our sales are made directly to our customers and no related commissions or selling expenses are incurred. As well, transportation expenses are generally borne by our customers. We did not perform any advertising or marketing activities in fiscal year 2008 or fiscal year 2009.
Selling expenses increased from nil in fiscal year 2008 to $3,911 in fiscal year 2009, primarily due to our sales of cattle, sheep and honey, which commenced in fiscal year 2009.
Other Operating Income, Net
No profit or loss was recognized as other operating income in fiscal year 2008. In fiscal year 2009, other operating income included the gain from the sale of fixed assets for an aggregate amount of $1,618.
Loss From Operations Before Financing and Taxation
As a result of the foregoing, our loss from operations before financing and taxation for the year increased from $104,408 in fiscal year 2008 to $2.3 million in fiscal year 2009.
Financial Results, Net
Financial results, net decreased by $0.2 million, from a loss of $6,615 in fiscal year 2008 to a loss of $212,127 in fiscal year 2009, primarily due to:
| • | a $0.9 million increase in foreign exchange losses, net due to the appreciation of the U.S. dollar against the Canadian dollar in fiscal year 2009, |
partially offset by:
| • | a $0.7 million increase in interest income primarily generated by investments in short-term bank deposits and loans granted to third parties. |
Income Tax Expense
Our consolidated income tax expense increased from a total of $0.01 million in fiscal year 2008 to a total of $0.2 million for fiscal year 2009. This increase primarily relates to the temporary differences that arise from the
54
Table of Contents
valuation of our biological assets and our property, plant and equipment. The effective tax rate on a consolidated basis was 6.3% for fiscal year 2009, as compared to 4.7% for fiscal year 2008. The increase is a consequence of higher non-deductible items and other charges in 2009 as compared to those amounts in 2008, partially offset by an increase in tax loss carry forwards not recognized in fiscal year 2009.
Loss for the Year/Period
As a result of the foregoing, our loss for the year increased from $0.1 million in fiscal year 2008 to $2.7 million in fiscal year 2009.
Liquidity and Capital Resources
Our liquidity and capital resources are and will be influenced by a variety of factors, including:
| • | our ability to generate cash flows from our operations; |
| • | our capital expenditure requirements, which consist primarily of acquisition of new farmland, our operations, and equipment and maintenance costs; and |
| • | our working capital requirements. |
We have a limited operating history and we have incurred operating losses since our formation. Our primary source of liquidity has consisted of proceeds from private placements of our common shares, from which we have raised aggregated net proceeds of $353.3 million from our formation through March 31, 2011. We expect our operating cash flow to be positive in fiscal year 2012 as we ramp up operations for our acquired farmlands. However, there can be no assurance that we will be able to generate positive operating cash flow. We do not have any borrowings outstanding.
Nine months ended March 31, 2011 and 2010
Operating Activities
We used cash for our operating activities in the nine months ended March 31, 2011 and 2010 due primarily to net losses reported in each period, non-cash charges to earnings and changes in operating assets and liabilities. Non-cash charges to earnings primarily included depreciation and amortization of our long-term assets, unrealized changes in the fair value of biological assets, employee stock options granted, changes in fair value of financial assets at fair value through profit and loss, foreign exchange gains or losses, interest income and income tax expense, among others. Our changes in operating assets and liabilities are primarily affected by changes in our biological assets, trade receivables and trade payables, financial assets at fair value through profit or loss and inventories.
Nine months ended March 31, 2011
Net cash used in operating activities was $12.0 million in the nine months ended March 31, 2011. During the nine months ended March 31, 2011, we generated a net loss of $1.6 million that included non-cash charges relating primarily to the unrealized portion of the “initial recognition and changes in fair value of biological assets and agricultural produce” of $8.1 million, depreciation and amortization of $0.4 million (reflecting the impact in depreciation of a higher asset base due to property items acquisitions during the period), interest income of $0.2 million (due to a decrease in loans granted to third parties), employee stock options granted of $1.3 million (due to an increase in the number of stock options granted to directors, management and key employees), changes in fair value of financial assets at fair value through profit or loss of $0.6 million (due to an increase in market prices of our investment in equity securities), income tax benefit of $0.2 million, and other non-cash charges.
For the nine months ended March 31, 2011, our results of operations continued to be significantly affected by the establishment and expansion of our diversified business portfolio, which affected our efficiency. Our net
55
Table of Contents
loss for the nine months ended March 31, 2011 was partially offset by changes in fair value of financial assets at fair value through profit or loss of $0.6 million due to an increase in market prices of our investment in equity securities and interest income of $0.5 million generated by loans granted to third parties.
In addition, during the nine months ended March 31, 2011, other changes in operating asset and liability balances resulted in a further net decrease in cash of $2.8 million primarily due to (i) an increase of $7.6 million in biological assets related to the expansion of our operating activities, and (ii) an increase of $2.0 million in trade and other receivables mainly related to higher sales and to advances made to third parties for the payments of land underpromesas. These effects were partially offset by (i) an increase of $4.3 million in trade and other payables reflecting our growing operations, and (ii) a decrease of $1.8 million in financial assets at fair value through profit or loss due to the sale of our investment in equity securities.
Nine months ended March 31, 2010
Net cash used in operating activities was $6.5 million in the nine months ended March 31, 2010. During the nine months ended March 31, 2010, we generated a net loss of $0.7 million that included non-cash charges relating primarily to the unrealized portion of the “initial recognition and changes in fair value of biological assets and agricultural produce” of $2.5 million, depreciation and amortization of $0.1 million, interest income of $0.4 million and foreign exchange gains of $0.4 million (due to the appreciation of the Uruguayan Peso and the Canadian dollar against the U.S. dollar), and other non-cash charges.
For the nine months ended March 31, 2010, our results of operations continued to be significantly affected by the establishment of our diversified business portfolio, including the start-up of our crops and rice businesses, which affected our efficiency. Our net loss for the nine months ended March 31, 2010 was partially offset by a significant foreign exchange gain of $0.9 million arising from the appreciation of the Uruguayan Peso and the Canadian dollar against the U.S. dollar, and interest income of $0.5 million generated by loans granted to third parties.
In addition, during the nine months ended March 31, 2010, other changes in operating asset and liability balances resulted in a further net decrease in cash of $2.4 million, primarily due to (i) an increase of $2.4 million in trade and other receivables mainly related to higher sales, to advances made to third parties for the payments of land underpromesas and to higher purchases of goods and services due to the expansion of our operating activities, which generate an increase in tax credits, and (ii) an increase of $0.6 million in inventories relating to the expansion of our operating activities. These effects were partially offset by an increase in trade and other payables of $1.0 million, reflecting our growing operations.
Investing Activities
Nine months ended March 31, 2011
Net cash used in investing activities was $108.2 million in the nine months ended March 31, 2011, primarily related to payments for land underpromesas(primarily farmlands for our crops, rice and cattle businesses) totaling $86.4 million, purchases of property, plant and equipment (primarily machinery) totaling $5.2 million, and payments for investment property underpromesas (primarily land) totaling $18.6 million. Net inflows from investing activities were primarily related to proceeds of $1.7 million from loans granted to third parties.
Nine-month ended March 31, 2010
Net cash used in investing activities was $42.7 million in the nine months ended March 31, 2010, primarily related to payments for land underpromesas(primarily farmlands for our crops, rice and cattle businesses) totaling $41.3 million, and purchases of property and plant and equipment (primarily machinery) totaling $2.3 million. Net inflows from investing activities were primarily related to proceeds of $1.0 million from loans granted to third parties and $1.9 million from investments in debt certificates.
56
Table of Contents
Financing Activities
Nine months ended March 31, 2011
Net cash provided by financing activities was $158.0 million in the nine months ended March 31, 2011, mainly derived from the net cash proceeds of capital contributions received from new and existing shareholders.
Nine months ended March 31, 2010
Net cash provided by financing activities was $101.8 million in the nine months ended March 31, 2010, mainly derived from the net cash proceeds of capital contributions received from new and existing shareholders.
Fiscal Years 2010, 2009 and 2008
Operating Activities
We used cash for our operating activities in fiscal years 2010, 2009 and 2008 due primarily to net losses reported in each fiscal year, non-cash charges to earnings and changes in operating assets and liabilities. Non-cash charges to earnings primarily included depreciation and amortization of our long-term assets, unrealized changes in the fair value of biological assets, foreign exchange gains or losses, interest income and income tax expense, among others. Our changes in operating assets and liabilities are primarily affected by changes in our biological assets, trade receivables and trade payables, financial assets at fair value through profit or loss and inventories.
Fiscal Year 2010
Net cash used in operating activities was $13.7 million in fiscal year 2010. During fiscal year 2010, we generated a net loss of $0.4 million that included non-cash charges relating primarily to the unrealized portion of the “initial recognition and changes in fair value of biological assets and agricultural produce” of $4.0 million, depreciation and amortization of $0.2 million (reflecting the impact in depreciation of a higher asset base due to property items acquisitions during the year), interest income of $0.7 million (due to an increase in loans granted to third parties), foreign exchange gains of $0.1 million (due to the appreciation of the Uruguayan Peso and the Canadian dollar against the U.S. dollar), gain from changes in fair value of financial assets at fair value through profit and loss of $0.2 million (due to increases in market prices of investments in equity securities), and other non-cash charges.
In fiscal year 2010, our results of operations continued to be significantly affected by the establishment of our diversified business portfolio including the start-up of our crops, rice and dairy businesses, which affected our efficiency. Our net loss for fiscal year 2010 was partially offset by a significant foreign exchange gain of $0.5 million arising from the appreciation of the Uruguayan Peso and the Canadian dollar against the U.S. dollar, and interest income of $0.7 million generated by loans granted to third parties.
In addition, during fiscal year 2010, other changes in operating asset and liability balances resulted in a further net decrease in cash of $8.7 million primarily due to (i) an increase of $5.0 million in trade and other receivables mainly related to higher sales, to advances made to third parties for the purchase of land, and to higher purchases of goods and services due to the expansion of our operating activities which generate an increase in tax credits, (ii) an increase of $1.8 million in biological assets relating to the expansion of our operating activities, and (iii) an increase of $1.8 million in inventories relating to the expansion of our operating activities. These effects were partially offset by an increase in trade payables of $0.9 million and social security liabilities of $0.1 million, reflecting our growing operations.
Fiscal Year 2009
Net cash used in operating activities was $2.2 million in fiscal year 2009. During such fiscal year, we generated a net loss of $2.7 million that included non-cash charges relating primarily to depreciation and
57
Table of Contents
amortization of $0.1 million (reflecting the impact in depreciation of a higher asset base due to property items acquisitions during the year), interest income of $0.3 million (due to investments in debt certificates), foreign exchange losses of $0.2 million (due to the appreciation of the U.S. dollar against the Canadian dollar), the unrealized portion of the “initial recognition and changes in fair value of biological assets and agricultural produce” of $0.2 million, stock options granted to employees for an amount of $0.3 million, and other non-cash charges.
In fiscal year 2009, our results of operations continued to be significantly affected by the establishment of our diversified business portfolio including the start-up of our cattle and sheep businesses which affected our efficiency. Our net loss for fiscal year 2009 was also affected by a significant foreign exchange loss of $0.9 million arising from the appreciation of the U.S. dollar against the Canadian dollar, which was partially offset by an interest income of $0.7 million generated by investments in debt certificates and short-term bank deposits.
Other changes in operating asset and liability balances resulted in a net increase in cash of $0.3 million during fiscal year 2009, primarily due to an increase of $1.5 million in trade and other payables mainly released to selling agents who assisted us in connection with our private capital raising during the fiscal year. This effect was partially offset by an increase in biological assets of $1.0 million and an increase in trade and other receivables of $0.3 million, reflecting our growing operations.
Fiscal Year 2008
Net cash used in operating activities was $0.3 million in fiscal year 2008. During such year, we generated a net loss of $0.1 million that included non-cash charges relating primarily to depreciation of $0.01 million, the unrealized portion of the “initial recognition and changes in fair value of biological assets and agricultural produce” of $0.01 million, and other non-cash charges.
In fiscal year 2008, our results of operations were affected by the start-up of our activities as we were organized on January 2, 2008. From our formation through June 30, 2008, we operated primarily with only a minor extension of hectares of blueberry plantations. Our commercial activity during fiscal year 2008 was minimal, with no sales recorded.
In addition, other changes in operating asset and liability balances affected our cash flow from operations, resulting in a further net decrease in cash of $0.2 million during fiscal year 2008 primarily due to an increase of $0.2 million in trade receivables due to purchases of goods and services which generated an increase in tax credits, partially offset by an increase in trade and other payables of $0.01 million.
Investing Activities
Fiscal Year 2010
Net cash used in investing activities was $96.1 million in fiscal year 2010, primarily related to payments for land underpromesas (primarily farmlands for our crops, rice and cattle businesses) totaling $89.2 million, purchases of property, plant and equipment (primarily machinery) totaling $3.0 million, and payments for investment property underpromesas(primarily land and certain facilities) totaling $4.7 million. Net inflows from investing activities were primarily related to proceeds of $2.4 million from loans granted to third parties and $1.9 million from investments in debt certificates.
Fiscal Year 2009
Net cash used in investing activities was $14.5 million in fiscal year 2009, primarily due to payments for land underpromesas (primarily farmlands for cattle activities) totaling $11.5 million, and purchases of investments in debt securities of $1.9 million.
58
Table of Contents
Fiscal Year 2008
Net cash used in investing activities was $1.1 million in fiscal year 2008, due to our acquisition of subsidiaries involved in the blueberry business.
Financing Activities
Fiscal Year 2010
Net cash provided by financing activities was $110.0 million in fiscal year 2010, mainly derived from net cash proceeds from capital contributions received from new and existing shareholders.
Fiscal Year 2009
Net cash provided by financing activities was $83.7 million in fiscal year 2009, mainly derived from net cash proceeds from capital contributions received from new and existing shareholders.
Fiscal Year 2008
Net cash provided by financing activities was $1.3 million in fiscal year 2008, derived from net cash proceeds from capital contributions received from new shareholders.
Cash and Cash Equivalents
Historically, since our cash flows from operations were insufficient to fund our working capital needs and investment plans we funded our operations with proceeds from capital contributions from existing and new private investors. As of March 31, 2011, our cash and cash equivalents amounted to $104.9 million. We believe that our current levels of cash and cash equivalents and cash flows from operations, combined with the net proceeds derived from this offering, will be sufficient to meet our anticipated cash needs for at least the next 12 months. However, we may need additional cash resources in the future to continue our investment plans. Also, we may need additional cash if we experience a change in business conditions or other developments. We also may need additional cash resources in the future if we find and wish to pursue opportunities for investment, acquisitions, strategic alliances or other similar investments. If we ever determine that our cash requirements exceed our cash and cash equivalents on hand, we may seek to issue debt or additional equity securities. Any issuance of equity securities could cause dilution for our shareholders. Any incurrence of indebtedness could result in debt service obligations and cause us to become subject to restrictive operating and financial covenants, and could require that we pledge collateral to secure those borrowings, if permitted to do so. It is possible that, if and when we need additional cash resources, financing will not be available to us in amounts or on terms that would be favorable to us or at all.
Projected Sources and Uses of Cash
We anticipate that we will generate cash from the following sources:
| • | proceeds from private or public placements; and |
| • | proceeds from this offering. |
We expect that our operations may use cash instead of generating cash in the near future, until full capacity is reached in each of our recently acquired farms. Based on current projections, we anticipate that we will generally achieve full capacity in our recently acquired farms in 12 to 18 months from the date of acquisition. Also, we may continue incurring more losses in the near future as we continue to implement our business plan.
We believe that the cash generated from the foregoing sources will be sufficient to meet our present requirements including short-term working capital and long-term capital expenditures. In addition, we have the
59
Table of Contents
ability to obtain indebtedness or issue additional equity securities, and we believe that the proceeds we will be able to raise from these two sources will be in excess of our short-term working capital and capital expenditure requirements. Our ability to fund projected capital expenditures may be constrained in the event external financing is not available, or on terms favorable to us, and accordingly we may have to postpone our capital expenditure plan. If we are not able to timely consummate our capital expenditure plan, our business, financial condition and results of operations may be materially and adversely affected.
We anticipate that we will use our cash:
| • | to acquire additional farmlands; and |
| • | for other working capital and general corporate purposes. |
From time to time, we may make short-term loans of our cash balances that are not otherwise immediately required for investment or working capital, if favorable rates are available. We loan these funds to an unrelated third-party Uruguayan firm that in turn makes smaller loans to local consumers. The loans are guaranteed by receivables and contain customary covenants. As of March 31, 2011, we had $821,377 of short-term loans receivable outstanding, which represented 0.23% of our total assets. The average interest rate on such loans was 16.5%, and the average maturity date was May 2011.
Capital Expenditures
Capital expenditures totaled $110.2 million and $43.8 million for the nine months ended March 31, 2011 and 2010, respectively. Capital expenditures totaled $96.9 million, $12.0 million and $1.1 million for the fiscal years 2010, 2009 and 2008, respectively. Our capital expenditures consisted of payments for land underpromesas,acquisitions of subsidiaries, payments for investment property underpromesas and payments for machinery, equipment, buildings and other property items.
We expect continuous capital expenditures for the foreseeable future as we continue making payments for land under promesas in Uruguay. We expect to finance our future capital expenditures with the net proceeds of this offering, with our operating cash flow as a supplemental source of funding.
Contractual Commitments
The following table summarizes our significant contractual obligations and commitments as of June 30, 2010:
Less Than One Year | One to Three Years | Three to Five Years | Thereafter | Total | ||||||||||||||||
Operating Leases | $ | 175,692 | $ | 361,633 | $ | 338,207 | $ | — | $ | 875,532 | ||||||||||
Finance Leases | 4,916 | 2,649 | — | — | 7,565 | |||||||||||||||
Total | $ | 180,608 | $ | 364,282 | $ | 338,207 | $ | — | $ | 883,097 | ||||||||||
Quantitative and Qualitative Disclosures About Market Risks
In the normal course of business, we are exposed to commodity price and interest rate risks, primarily related to our crop production activities and changes in exchange rates and interest rates. Our overall risk management program focuses on the unpredictability of financial markets and seeks to minimize our capital costs by using suitable means of financing and to manage and control our financial risks effectively. We may use financial instruments to hedge certain risk exposures when deemed appropriate based on our internal management risk policies. For further information on our market risks, see note 4 to our Audited Consolidated Financial Statements and note 3 to our Audited Interim Consolidated Financial Statements.
60
Table of Contents
Off-Balance Sheet Arrangements
For any of the periods presented, we did not have any off-balance sheet transactions, arrangements or obligations with unconsolidated entities or otherwise that are reasonably likely to have a material effect on our financial condition, results of operations or liquidity.
Critical Accounting Policies
We prepared our Audited Consolidated Financial Statements in accordance with IFRS as issued by the IASB and the interpretations of the IFRIC. We prepared our Audited Interim Consolidated Financial Statements in accordance with IFRS as issued by the IASB, and the interpretations of the IFRIC, including IAS 34 “Interim Financial Reporting.” We applied IFRS for the first time for the fiscal year ended June 30, 2010 with a transition date of January 2, 2008. See note 3 to our Audited Consolidated Financial Statements for details regarding our transition to IFRS and application of IFRS 1 “First Time Adoption of IFRS.” Critical accounting policies are policies important to the portrayal of a company’s financial condition and operating results, and which require management to make difficult and subjective judgments that are inherently uncertain. Based on this definition, we have identified the following significant accounting policies as critical to the understanding of our consolidated financial statements. The preparation of our Audited Consolidated Financial Statements and our Audited Interim Consolidated Financial Statements requires management to make estimates and assumptions that affect the reported amounts of assets and liabilities and disclosure of contingent assets and liabilities at the date of the financial statements and the reported amounts of expenses during the reporting periods. These estimates and judgments are subject to an inherent degree of uncertainty. We believe that the estimates and judgments upon which we rely are reasonable based upon information available to us at the time that these estimates and judgments are made. We continually evaluate our judgments, estimates and assumptions. To the extent there are material differences between these estimates and actual results, our Audited Consolidated Financial Statements or our Audited Interim Consolidated Financial Statements will be affected.
We believe the following to be our most significant critical accounting policies and estimates used in the preparation of the consolidated financial statements:
Land Under Promesas
General Provisions through June 30, 2011:
Generally, real estate transactions in Uruguay begin with the execution of a preliminary agreement with respect to the real estate, or a “Boleto de Reserva,” by which the seller “books” or “reserves” the real estate property to the buyer. The main intention of theBoleto de Reserva is to obtain, prior to definitive purchase; all required documentation before the national registries in order to duly confirm that the real estate to be transferred has no liens and has all of the required documentation. Once all of the documentation has been obtained, it is common business practice in the real estate market in Uruguay that the parties execute a purchase promise, or “Promesa de Compraventa” (hereinafter referred to as the “promesa”) for the real estate.
Thepromesais a contract regulated by Uruguayan Law No. 8,733. Under such law, apromesais a definitive contract and not a preliminary agreement. In order to be enforceable against third parties, thepromesais usually registered before the public registry (Registro de la Propiedad Inmobiliaria). Under Law 8,733, thepromesaprovides the buyer with certain rights such as the right to access and use the property, and sell, lease, assign or pledge the rights under thepromesa.Apromesais completed, and legal title is transferred, when a final purchase agreement, orescritura, is executed. The holder of apromesa has the ability to sell his rights in thepromesa,which would allow the buyer of suchpromesa the right to seek legal title to the land. Based on the opinion of our Uruguayan legal counsel, Bragard & Duran Abogados, any company regardless of its legal structure can enter into apromesa under Law No. 8,733.
In 2006, the Uruguayan government enacted Law No. 18,092 (as amended by Article 349 of Law No. 18,172). Generally, Law No. 18,092 prohibits persons other than individuals and companies having
61
Table of Contents
registered shares held by individuals to (1) be owners of farmland and/or (2) to use farmland in Uruguay. The consequence of non-compliance with Law No. 18,092 was that the non-complying company would be deemed automatically dissolved and its assets distributed to its shareholders. Under Law No. 18,092, companies that had bearer shares or whose shares were not owned by natural persons (“Non-Compliant Companies”) were provided a period of two years from enactment of Law No. 18,092 to modify their capital structure to comply with such law (the “Compliance Period”). During the Compliance Period, Non-Compliant Companies were permitted to continue using farmland. Subsequent to the enactment of Law No, 18,092, the Uruguayan government extended the Compliance Period for successive one-year periods through June 30, 2011. Consequently, Non-Compliant Companies were permitted to continue using farmland until that date.
In 2007 and 2008 the Executive Power of Uruguay issued Decrees Nos. 225/07 and 201/08 providing certain exceptions to Law No. 18,092 for Non-Compliant Companies. These exceptions are the following:
| (i) | an exception based on the specific features of a legal entity, including domestic or foreign corporations whose shares are traded in well-known local or foreign stock exchange markets, domestic or foreign pension funds (the “Public Company Exception”); and |
| (ii) | an exception granted to legal entities (including corporations, branches of foreign companies, trusts, investment funds) with bearer or registered shares not covered by (i) above, including legal entities that develop activities which constitute part of a project considered as a priority for the productive development of Uruguay (the “Productive Project Exception”). |
Applications for the Productive Project Exception are reviewed by theComisión de Aplicación de la Ley de Tierras (or the “Land Law Commission”) based on business plans furnished by the requesting company. In order for a project to qualify for the Productive Project Exception, the Land Law Commission considers factors such as creation of new employment opportunities within the rural sector; development of small family enterprises; eradication of poverty in rural sectors; incorporation of technology; promotion of territorial decentralization; and development of new productive circuits. The review of an application by the Land Law Commission generally takes 12 to 16 months for final determination. However, Decrees Nos. 225/07 and 201/08 also provide for an expedited process for authorization to own and/or use farmland for companies that have already obtained an exception to own and/or use farmland. In such cases, authorization to own and/or use additional land shall be automatically granted within 30 business days after an application for governmental authorization has been properly submitted, unless the Executive Power denies the application prior to such time (the “Expedited Process”). If the Executive Power denies the application under the Expedited Process, processing will continue in accordance with the standard authorization procedures as described above.
General Provisions subsequent to June 30, 2011:
The Compliance Period was not extended beyond June 30, 2011. However, in contemplation of the expiration of the Compliance Period, on June 23, 2011, the Executive Power issued Decree No. 218/11, which provided that Non-Compliant Companies that properly submitted an application on or prior to June 30, 2011 are permitted to continue using farmland subject to such applications pending final determination of such applications. However, Decree No. 218/11 does not itself grant automatic authorization.
Our situation as of the date of approval of the financial statements:
The common stock of our subsidiaries is currently represented by bearer shares not held by individuals as mandated by Law No. 18,092. Therefore, as of the date of our Audited Interim Consolidated Financial Statements, our subsidiaries are Non-Compliant Companies under by Law No. 18,092.
Our subsidiaries have executedpromesas as fully permitted by Law No. 8,733. As described above, by execution of thepromesas, these subsidiaries have acquired certain rights to, but not legal title to the land. Therefore, our subsidiaries are not legal owners of the land. Based on the opinion of our Uruguayan legal
62
Table of Contents
counsel, Bragard & Duran Abogados, such subsidiaries are therefore not currently violating Law No. 18,092 with respect to the ownership of the land. In order to maintain their current legal structure and be therefore able to own the land, these subsidiaries have requested authorization to own the land under the Productive Project Exceptions as further described below.
Furthermore, most of our subsidiaries that hold land underpromesas are not using the land themselves. Instead, until June 22, 2011, the land underlying suchpromesas was being used by UAG S.A., another of our wholly owned subsidiaries, pursuant to intercompany agreements under Uruguayan law known as “comodatos,” between each of our subsidiaries holding land underpromesas and UAG S.A. Thecomodatosare inter-company contracts pursuant to which each of our subsidiaries that holds land underpromesas has transferred the right to use the land underlying suchpromesas to UAG S.A. Acomodato allows the promissory buyer of land under apromesa (the “transferor”) to transfer the right to use such land to another person (the “transferee”) so that the transferee may use such land. Under Uruguayan law, neither the transfer of such land by the transferor to the transferee, nor the use of such land by the transferee, is considered to be use of the land by the transferor, even where the two parties are affiliated. We decided to transfer the right to use the land to UAG S.A. throughcomodatosin order to obtain benefits from centralized management of most of its businesses in one company.
Four of our subsidiaries (Boisy S.A., Vadolmar S.A., Madalux S.A. and Nogatir S.A.) applied for and received the Productive Project Exception to own and use 188 hectares in December 2009 or the “First Productive Project.” These four subsidiaries executedescrituras and own the 188 hectares of land.
In October 2009, three of our subsidiaries (Rafilur S.A., Aguacare S.A. and Canteras Doradas S.A.) applied for governmental authorization based on the Productive Project Exception to own 17,846 hectares of land or the “Second Productive Project.” Additionally, under the Second Productive Project, UAG S.A. applied for governmental authorization to use those 17,846 hectares of land. Such subsidiaries received the authorization to own and use such 17,846 hectares of land under the Second Productive Project exception in May 2011. These subsidiaries expect to execute the deeds of title in due course. See Note 26 to our Audited Interim Consolidated Financial Statements for details.
In March 2011, three of our subsidiaries (Alto Lucero S.A., Rafilur S.A. and Madalux S.A.) applied for governmental authorizations based on the Productive Project Exception to own an aggregate of 51,081 hectares of land underpromesas, or the “Third Productive Project.” On June 27, 2011, the number of hectares under the Third Productive Project was extended to 66,645 hectares. Additionally, under the Third Productive Project, our wholly-owned subsidiary Boisy S.A. applied for governmental authorizations to use such 66,645 hectares of land since Boisy S.A. had received the right to use such hectares of land pursuant tocomodatosas further described below. As of the date of our Audited Interim Consolidated Financial Statements, the authorization for the “Third Productive Project” is pending. We believe that our business project contributes to the productivity of Uruguay, the creation of jobs, production of exportable commodities, incorporation of technology and other beneficial aspects, which are all factors in the determination of the Third Productive Project Exception. Based on the opinion of our Uruguayan legal counsel, Bragard & Duran Abogados, and merits of the projects presented and approvals obtained to date, we expect that our subsidiaries will obtain the required exception to the Third Productive Project within 12 to 16 months of the date of the application. However, there can be no assurance as to the timing or final outcome of this authorization request. If the subsidiaries receive the authorization for the Third Productive Project, the subsidiaries will proceed with the execution of theescrituras (deed) to obtain legal title to the land.
On June 22, 2011,comodatosthat transfer the right to use approximately 64,000 hectares of land under the Third Productive Project to UAG S.A. were terminated, and newcomodatoswere entered into between each of our subsidiaries that holds land underpromesas and Boisy S.A. We entered into these newcomodatosas Boisy S.A. had already received authorization to use land in the past and, in accordance with Decrees Nos. 225/07 and 201/08, it would be allowed to apply for the Expedited Process as described above. Therefore, on June 22, 2011, Boisy S.A. applied for governmental authorization to use approximately 64,000 hectares of land, which were also
63
Table of Contents
included under the Third Productive Project. Boisy S.A. is currently using such land pursuantcomodatosas described above. We expect to obtain this authorization 30 business days after the date we made the application, although there can be no assurance that the government will not deny the application. In the event the government denies Boisy S.A.’s application under the Expedited Process, processing will continue with the standard authorization under the Third Productive Project. We did not apply for the Expedited Process prior to June 22, 2011 during the Compliance Period as described above, since we expected the government would extend the Compliance Period subsequent to June 30, 2011 and thus the Third Productive Project would be authorized in due course.
We are currently authorized to use all of our land held underpromesas, as the use of all of our land held underpromesas has either been authorized by the Uruguayan government or is subject to applications for authorization and, therefore, use of such land is permitted under Decree No. 218/11.
We are in the process of completing our initial public offering of our common shares. Upon the completion of the offering, our common shares will be listed on the New York Stock Exchange, and thereafter our subsidiaries will be able to apply for an authorization to own and use based on the Public Company Exception. This authorization process generally takes approximately 12 to 16 months after the Offering is complete. Once the authorization is obtained, our subsidiaries will proceed with the execution of theescrituras to obtain legal title to the land under the Third Productive Project.
Because of the prohibition on ownership of farmland by Non-Compliant Companies set forth in Law No. 18,092, legal title to the land has not been obtained as of the date of our Audited Interim Consolidated Financial Statements. Nevertheless, our Uruguayan legal counsel, Bragard & Duran Abogados, is of the opinion that thepromesasare legally valid under Law No. 8,733, and as a result of their validity and for the reasons cited below, we have recognized the payments for the full price of land underpromesas as assets under the line item “Land underpromesas” and “Investment Property underpromesas” in the statement of financial position, as applicable.
We have recognized payments forpromesasfor which title has not been obtained as assets on the statement of financial position because (1) we paid a full price for thepromesas and that price can be measured reliably and thepromesasare legally valid under Law No. 8,733; (2) it is probable that the future economic benefits associated with thepromesas will flow to us as we have the ability to sell our rights in thepromesas and the sales value less costs to sell such rights is in excess of the carrying value of the assets recorded, and because from the date thepromesaswere signed, we are obtaining benefits from using the land for our agricultural purposes as permitted by Law 8,733, Law 18,092 and related Decrees; (3) thepromesas entitle us to certain rights including but not limited to (i) the use of the underlying land (as permitted by Law 8,733) through June 30, 2011, and after that date, pending determination of our application for governmental authorization; (ii) the risks and benefits associated with thepromesas; (iii) the right to sell, assign, transfer, or lease thepromesas to a third party, in the case of a sale for an amount equal to the fair value of the land because a buyer would be expected to seek the deed; and/or (iv) pledge thepromesas; and (4) thepromesas we executed are definitive binding agreements between us and a seller and are legally registered under Uruguayan Law and enforceable against third parties. As of March 31, 2011, the fair value less costs to sell of the land underlying thepromesas exceeds the amounts paid for thepromesas such that there is no indication of impairment of the assets.
Once the authorizations to own and use the land are obtained and the deeds of title orescrituras are executed, the payments reported as land underpromesas will be reclassified to the land category within property, plant and equipment.
Upon completion of the offering, we intend to submit the application for approval under the Public Company Exception described above. We will be permitted to apply for such exemption once the offering is complete. We expect the process to obtain the Public Company Exception to take approximately 12 to 16 months after the application. In addition, as further described above, we are able to sell and/or transfer thepromesas at any point in time to a third purchaser who will seek execution of the deed of title.
64
Table of Contents
Biological Assets and Agricultural Produce
We measure biological assets, which include unharvested crops and rice, beef and dairy cattle, live sheep, blueberry bushes and colonies of bees (at initial recognition, when the biological asset has attained significant biological growth, and at each subsequent measurement reporting date) and agricultural produce, which include harvested crop, rough rice, wool, raw milk, blueberry fruit and honey (at the point of harvest) at fair value less costs to sell in accordance with IAS 41 “Biological Assets,” or IAS 41. The objective of the fair value model under IAS 41 is to recognize gains and losses arising from such measurements gradually over the asset’s life rather than only on sale or realization. IAS 41 prescribes, among other things, the accounting treatment for biological assets during the period of growth, degeneration, production and procreation, and for the initial measurement of agricultural produce at the point of harvest.
We measure biological assets that have not attained significant biological growth or when the impact of biological transformation on price is not expected to be material, at cost less any impairment losses, which approximates fair value.
The following table sets forth the period in which our biological assets generally attain significant biological growth and the corresponding agricultural produce obtained:
Biological Asset | Agricultural Produce | |||||
No Significant Biological Growth | Significant Biological | |||||
| Crops (including wheat and soybeans) | Crops, from planting through approximately 60 days | Approximately 60 days after planting up to the moment of harvest (total period of approximately 6 to 7 months) | Harvested crops | |||
| Rice | Rice plant, from planting through approximately 60 days | Approximately 60 days after planting up to the moment of harvest (total period of approximately 5 to 6 months) | Rough rice | |||
| Cattle | Significance is not relevant (beef cattle are measured at fair value less costs to sell since birth/or purchase) | N/A | ||||
| Sheep | Significance is not relevant (live sheep are measured at fair value less costs to sell since birth/or purchase) | Wool | ||||
| Dairy | Significance is not relevant (dairy cattle are measured at fair value less costs to sell since birth/or purchase) | Raw milk | ||||
| Blueberry Bushes | Blueberry plants, from planting through approximately 12 months | Approximately 12 months after planting until exhausted in 20 to 25 harvests (total period of approximately 21 years) | Blueberry fruit | |||
| Colonies of Bees | Significance is not relevant (colonies of bees are measured at cost as impact of biological transformation on price is not significant) | Honey | ||||
65
Table of Contents
Expenses relating to the agricultural activity include land preparation expenses and other direct production expenses incurred during the sowing period including costs of labor, fuel, seeds, agrochemicals and fertilizer, among others. Since IAS 41 does not provide guidance on the treatment of these costs, we generally expense all costs directly involved with the management of biological assets and include them within “cost of production” in the statement of income.
We account for agricultural produce after harvest as inventory, as further described below. Fair value less costs to sell of agricultural produce at the point of harvest becomes cost of inventories after harvest.
The following table sets forth the way in which we value our most significant biological assets and agricultural produce for each of our principal products:
Biological Asset | Agricultural Produce | |||||
No Significant Biological Growth | Significant Biological | |||||
| Crops (including wheat and soybeans) | Cost (which approximates fair value) less accumulated impairment losses, if any | Fair value less costs to sell (using discounted cash flow model) | Cost (fair value at the point of harvest) | |||
| Rice | Cost (which approximates fair value) less accumulated impairment losses, if any | Fair value less costs to sell (using discounted cash flow model) | Cost (fair value at the point of harvest) | |||
| Cattle | Since birth/or purchase, beef cattle are measured at fair value less costs to sell (determined based on quoted market prices) | N/A | ||||
| Sheep | Since birth/or purchase, live sheep are measured at fair value less costs to sell (determined based on quoted market prices) | Cost (fair value at the point of harvest) | ||||
| Dairy | Since birth/or purchase, dairy cattle are measured at fair value less costs to sell (determined based on quoted market prices) | Cost (fair value at the point of harvest) | ||||
| Blueberry Bushes | Cost (which approximates fair value) less accumulated impairment losses, if any | Fair value less costs to sell (using discounted cash flow model) | Cost (fair value at the point of harvest) | |||
| Colonies of Bees | Colonies of bees are measured at cost as impact of biological transformation on price is not significant | Cost (fair value at the point of harvest) | ||||
Our fiscal year begins on July 1 and ends on June 30 of the following year. However, our production is based on the harvest year for each of our crops, rice and blueberries. A harvest year varies according to the crop or rice plant and to the climate in which it is grown. The planting period for a given crop or rice may start earlier on one farm than on another, causing differences for their respective harvesting periods.
66
Table of Contents
The following table shows the production process for each of our main crops, reflecting the average periods at which each stage of production occurs:
| Planting | Harvesting | Selling | ||||
| Soybeans | Between end of October and November of each year | Between April and May of each year | From May through October of each year | |||
| Wheat | Between May and June of each year | During November and December of each year | From January through February of each year | |||
| Soybeans (second harvest) | Between November and December of each year | Between May and June of each year | From June through October of each year | |||
| Rice | Between October and November of each year | Between March and April of each year | From April through June of each year | |||
Due to the nature and opportunity of our planting and harvesting activities as described above, the valuation of our biological assets is more relevant at the end of our interim periods ended December 31 or March 31 of each year. Generally, soybeans and rice are fully harvested as of year-end. For our fiscal year 2010, our biological assets comprised only of recently planted wheat (which had attained no significant biological growth) and blueberry bushes. Therefore, as of June 30, 2010, our biological assets that were subject to a valuation model are limited to our blueberry bushes. These plantations are not material to our total operations and only represent approximately 40 hectares of our landholdings. As a result, we believe a reasonable shift in any assumption used in the valuation model may not have a significant impact in our results of operations.
We recognize gains and losses that arise from measuring biological assets at fair value less cost to sell and measuring agricultural produce at the point of harvest at fair value less costs to sell in the statement of income in the period in which they arise as “initial recognition and changes in fair value of biological assets and agricultural produce.”
Determination of Fair Value
When an active market exists for biological assets, we use the quoted market price in the most relevant market as a basis to determine the fair value of our biological assets, as in the case of cattle and sheep.
For all other biological assets where there is neither an active market nor market-determined prices during the growth cycle (primarily our crops, rice and blueberry plantations), we determine their fair value through the use of discounted cash flow, or DCF, valuation techniques. Therefore, we generally derive the fair value of our growing biological assets from the expected cash flows of the related agricultural produce. The DCF method requires the input of highly subjective assumptions, including observable and unobservable data. Generally, the estimation of the fair value of biological assets is based on models or inputs that are not observable in the market, and the use of unobservable inputs is significant to the overall valuation of the assets. Various factors influence the availability of observable inputs, including, but not limited to, the type of asset and its location, climatic changes and the technology used, among others.
Unobservable inputs are determined based on the best information available, for example, by reference to historical information regarding past practices and results, if available, statistical and agronomical information and other analytical techniques. Changes in the assumptions underlying such subjective inputs can materially affect the fair value estimate and impact our results of operations and financial condition from period to period.
The DCF method requires the following significant inputs to project revenues and costs:
| • | production cycles or number of harvests; |
| • | production area in hectares; |
67
Table of Contents
| • | estimated crop and rice yields; |
| • | estimated costs of harvesting and other costs to be incurred until the crops and rice reach maturity (primarily costs of fertilizers, pesticides, herbicides and spraying); |
| • | estimated transportation costs; |
| • | market prices; and |
| • | discount rates. |
In contrast to biological assets whose fair value is generally determined using the DCF method, we generally determine the fair value of our agricultural produce at the point of harvest using quoted market prices.
Market prices used in the DCF model are determined by reference to observable data in the relevant market (e.g., for crops and rice). Harvesting costs and other costs are estimated based on historical and statistical data. Yields are estimated by our agronomic engineers based on several factors, including the location of the farmland, soil type, environmental conditions, infrastructure and other restrictions and growth at the time of measurement. Yields are subject to a high degree of uncertainty and may be affected by several factors out of our control, including but not limited to extreme or unusual weather conditions, plagues and other diseases. Discount rates reflect current market assessments of the risks associated with the assets involved and the time value of money.
The estimates for prices, costs, yields and discount rates are the assumptions that most significantly affect the fair value determination of biological assets. These assumptions are highly sensitive. Reasonable shifts in assumptions, including but not limited to increases or decreases in prices and discount rates used would result in a significant increase or decrease of the fair value of biological assets and significantly impact our statement of income. In addition, cash flows are projected over the following year or a number of years (depending on the type of biological asset) and based on estimated production. Estimates of production in and of themselves depend on various assumptions, in addition to those described above, including but not limited to several factors such as location, environmental conditions and other restrictions. Changes in these estimates could materially impact estimated production and could, therefore, affect estimates of future cash flows used in the assessment of fair value.
However, due to the nature and opportunity of our planting and harvesting activities as described in the table above, as of June 30 of each year, we generally have only wheat planted with insignificant biological growth and thus the cost incurred approximates fair value. Soybeans and rice are generally harvested as of June 30 of each year, thus any estimation made during the year was adjusted as of year-end. Blueberry plantations are not significant to our overall operations as of June 30, 2010, with only 40 hectares. For all of these reasons we believe that a sensitivity analysis of changes in our assumptions as of year-end is not relevant.
At the point of harvest, we recognize the agricultural produce at fair value less costs to sell, which becomes the cost for inventory purposes in accordance with IAS 2 “Inventories.” When we sell our inventory, we sell it at the prevailing market price and we incur direct selling expenses. We consider gains and losses recorded in the line item of the statement of income “initial recognition and changes in fair value of biological assets and agricultural produce” to be “realized” only when the related produce is sold to third parties and, therefore, converted into cash or other financial assets.
The sale of agricultural produce is revenue as defined in IAS 18 “Revenue,” or IAS 18. However, IAS 41 does not provide guidance on the presentation of revenues and costs arising from the selling of biological assets and agricultural produce. Due to the lack of guidance in IAS 41 and based on IAS 1, “Presentation of financial statements,” we present, as a matter of accounting policy, our sales of biological assets and agricultural produce and their respective costs of sale separately in two line items in the statement of income. The line item “sales of agricultural produce and biological assets and services rendered” represents the consideration received or receivable for the sale to third parties based generally on the applicable quoted market prices of the respective produce or biological asset in the relevant markets at the point of sale.
68
Table of Contents
The line item “cost of agricultural produce sold and services rendered” represents the recognition as an expense of our agricultural produce held in inventory valued at cost (fair value less costs to sell at the point of harvest) or our biological assets value at fair value less costs to sell.
Based on the foregoing, the gross profit of our agricultural activities is a function of the “initial recognition and changes in fair value of biological assets and agricultural produce,” our revenues and cost of revenues and our costs of production.
Impairment Testing
We review the carrying amounts of our property, plant and equipment, land underpromesas, investment property underpromesas, and intangible assets of finite life at the date of each statement of financial position to determine whether there is any indication that such assets have suffered impairment. An impairment loss, if any exists, is recognized immediately in the statement of comprehensive income. We also review our goodwill for impairment annually, or more frequently if events or changes in circumstances indicate that the carrying amount of goodwill may be impaired.
Due to the characteristics of our investments in Uruguay, we tested all of our cash generating units, or CGUs, regardless of any goodwill allocated to it, based on a fair value less costs-to-sell model. See note 5(b) to our Audited Consolidated Financial Statements and note 4(b) to our Audited Interim Consolidated Financial Statements for details.
In using this model, we applied the “sales comparison approach” as the method of valuing most properties. This approach is based on the theory that the fair value of a property is directly related to the selling prices of similar properties. The fair value of farmland property is the amount of money we would realize if a willing seller sold it at arm’s length to a willing buyer. These values reflect, as necessary, factors such as location, size, soil type (including soil texture and quality, yields, topography, drainage, rain levels and others), productive capability (the ability of the land to produce crops and/or maintain livestock), climate, risk and other factors. See note 5(b) to our Audited Consolidated Financial Statements and note 4(b) to our Audited Interim Consolidated Financial Statements for a detailed description of amounts tested. Based on the testing performed, we determined that none of the CGUs, with or without allocated goodwill, were impaired as of June 30, 2010, 2009 and 2008 (for all CGUs tested, fair value less costs to sell was significantly higher than carrying amount). We may be assisted by external appraisers in determining the fair value less costs-to-sell of a property.
The sales comparison approach considers current market conditions of the agricultural real estate market in Uruguay, and the results of such approach were determined based on recent market transactions within the regions where each property is located, adjusted for the specific characteristics of such property being valued. The sales comparison approach assumes that recent market transactions are performed by willing buyers and sellers in arm’s length transactions after proper marketing, and that the parties acted knowingly, prudently and without compulsion. Therefore, the prices obtained from recent market transactions take into account the degree of liquidity in the market. The sales comparison approach analyzes each individual property on a property by property basis and assumes that the sale of any one of our properties could be accomplished in an orderly manner. The sales comparison approach does not take into account the need to sell multiple properties, or that any sale may need to be completed on an expedited basis.
Income Taxes
We are incorporated under the BVI Business Companies Act and are exempted from payment of BVI income taxes. Our operating subsidiaries in Uruguay are subject to income taxes. We do not prepare or file a consolidated income tax return. Each operating subsidiary prepares and files its respective income tax returns based on the Uruguayan tax legislation. There are many transactions and calculations for which the ultimate tax determination is uncertain. We record liabilities for anticipated tax audit issues based on estimates of whether
69
Table of Contents
additional taxes will be due. Where the final tax outcome of these matters is different from the amounts that were initially recorded, such differences will impact our current and deferred income tax assets and liabilities in the period in which such determination is made.
Income taxes of each subsidiary are accounted for under the asset and liability method according to IAS 12 “Income Taxes,” or IAS 12. According to IAS 12, it is inherent in the recognition of an asset or liability that the reporting entity expects to recover or settle the carrying amount of that asset or liability. If it is probable that recovery or settlement of that carrying amount will make future tax payments larger (or smaller) than they would be if such recovery or settlement were to have no tax consequences, IAS 12 requires the entity to recognise a deferred tax liability (or deferred tax asset), with limited exceptions.
Therefore, deferred tax assets and liabilities are recorded for future tax consequences and are attributable to differences between the carrying amounts of existing assets and liabilities in the financial statements and their respective tax bases, and also to operating losses and tax credit carry forwards. For example, when the carrying amount of the asset exceeds its tax base, the amount of taxable economic benefits will exceed the amount that will be allowed as a deduction for tax purposes. This difference is a taxable temporary difference and the obligation to pay the resulting income taxes in future periods is a deferred tax liability.
Deferred tax assets and liabilities are measured using enacted tax rates expected to apply to taxable income in years in which those temporary differences are expected to be recovered or settled. The effect of a change in tax rates on the deferred tax assets and liabilities is taken into account in the income for the period that includes the enactment date of such change.
Deferred income tax assets are recorded only to the extent that it is probable that future taxable profit will be available against which the temporary differences can be utilized. Deferred tax assets are reviewed each reporting date and reduced to the extent that it is no longer probable that sufficient taxable income will be available to allow all or part of the asset to be recovered. Deferred tax assets and liabilities are not discounted. Deferred income tax assets are recorded for tax loss carry-forwards to the extent that the realization of the related tax benefits through taxable profit is probable.
As of March 31, 2011, we had $10.6 million in tax loss carry forwards generated from 2008 through March 31, 2011, with expiration dates from 2013 through 2015. However, as of March 31, 2011, we did not record deferred tax assets relating to all of our tax loss carry forwards because, although we believe that we will become profitable in the foreseeable future, as a result of our history of recent losses, limited operating history and lack of verifiable and objective available evidence, we consider that there is insufficient certainty as to whether sufficient income will be generated to utilize the losses within a reasonable timeframe.
Internal Control Over Financial Reporting
Upon completion of this offering, we will be required to document and test our internal controls over financial reporting pursuant to Section 404 of SOX, so that our management can certify as to the effectiveness of our internal controls, and, commencing with our annual report for fiscal year 2012, so that our independent registered public accounting firm can render an opinion on management’s assessment and on the effectiveness of our internal controls over financial reporting.
Internal control over financial reporting includes those policies and procedures that (1) pertain to the maintenance of records that, in reasonable detail, accurately and fairly reflect the transactions and dispositions of the assets of our company; (2) provide reasonable assurance that transactions are recorded as necessary to permit preparation of financial statements in accordance with IFRS, and that receipts and expenditures of our company are being made only in accordance with authorizations of our management and directors; and (3) provide reasonable assurance regarding prevention or timely detection of unauthorized acquisition, use, or disposition of our assets that could have a material effect on our consolidated financial statements.
70
Table of Contents
A material weakness is a deficiency, or a combination of deficiencies, in internal control over financial reporting, such that there is a reasonable possibility that a material misstatement of our annual or interim consolidated financial statements will not be prevented or detected on a timely basis.
In the course of preparing our financial statements for the fiscal years 2008, 2009 and 2010, we identified several deficiencies in our internal controls over financial reporting. For example, we have not maintained effective controls over our financial close and reporting process, to ensure that journal entries were prepared with sufficient support or documentation or reviewed and approved to ensure the accuracy and completeness of the entries recorded, over the accuracy and completeness of spreadsheets used in the period-end closing process and other spreadsheets supporting the company’s financial reporting, over the resolution of reconciling items on our bank account reconciliations, or over the completeness, accuracy, and disclosure of our production, general and administrative expenses. We have not had adequate personnel resources to enable us to properly consider and apply IFRS for all of our transactions and we have not maintained a proper account and procedures manual. These deficiencies resulted in audit adjustments to our consolidated financial statements for the fiscal years 2008, 2009 and 2010. Additionally, certain of these control deficiencies amounted to a material weakness.
In response to the identified deficiencies described above, we have dedicated significant resources to improving our internal control environment. We believe that our actions taken during fiscal year 2011, along with other improvements not yet fully implemented, will address the deficiencies in our internal control over financial reporting described above. These remediation efforts are expected to continue throughout fiscal year 2011 and beyond. During fiscal year 2011, we have concentrated our remediation efforts on those areas that are transaction intensive, such as the recording of net operating revenues, accounts receivable, accounting for cash and expenditures and the accrual of liabilities. These areas required the implementation of primarily manual controls and we have devoted significant resources to documenting and training personnel in the use of such controls. However, there remains a risk that the transitional procedures on which we currently rely will fail to prevent or detect a material misstatement of our annual or interim consolidated financial statements.
In light of the deficiencies described above, additional analyses and other procedures were performed to ensure that our consolidated financial statements were prepared in accordance with IFRS. These measures included expanded year-end closing procedures, the dedication of significant internal resources to scrutinize account analyses and reconciliations, and management’s own internal reviews and efforts to remediate the material weaknesses in internal control over financial reporting. As a result of these measures, management concluded that the consolidated financial statements present fairly, in all material respects, our consolidated financial position, results of operations, and cash flows as of the dates, and for the periods, presented in conformity with IFRS.
We intend to continue to review and make changes to the overall design of our internal control environment, including the roles and responsibilities within the organization and reporting structure, as well as policies and procedures to improve the overall internal control over financial reporting.
As we continue our remediation activities, we may identify additional internal control deficiencies. As part of this remediation plan, we will begin a more comprehensive review of our internal control environment so as to be ready to comply with Section 404 of SOX for our annual report for fiscal year 2012. We expect this review to include an assessment of the design and effectiveness of our internal control environment under the Committee of Sponsoring Organizations of the Treadway Commission framework, an initiative to improve information technology general controls, and remedial actions needed to address any issues identified in the course of these reviews. This review is expected to continue throughout fiscal year 2011 and thereafter and contemplates the implementation of several planned system enhancements to our accounting, financial reporting and operational infrastructure. We believe that this process will provide consistency in evaluations and verification of the appropriateness and completeness of our remediation activities. We plan to regularly monitor and report on our remediation progress to senior management, our board of directors, and our external auditors and to the market, if additional material weaknesses are identified.
71
Table of Contents
Recent Accounting Pronouncements
In the preparation of our Consolidated Financial Statements under IFRS for fiscal years 2010, 2009 and 2008, we applied all IFRS standards, amendments and interpretations to existing standards issued by the IASB effective as at June 30, 2010.
During 2009 and 2010, the IASB published several standards and amendments that, though they were not yet effective for us, have been adopted early by us in our Audited Consolidated Financial Statements, as follows:
| • | IFRS 9 “Financial Instruments.”The standard incorporates the first part of a three-phase project to replace IAS 39 “Financial Instruments: Recognition and Measurement.” IFRS 9 prescribes the classification and measurement of financial assets and requires that financial assets are subsequently measured either “at amortized cost” or “at fair value,” depending on whether certain conditions are met. In addition, IFRS 9 permits an entity to designate an instrument, that would otherwise have been classified in the “at amortized cost” category, to be “at fair value” if that designation eliminates or significantly reduces measurement or recognition inconsistencies. The prescribed category for equity instruments is at fair value through profit or loss, however, an entity may irrevocably opt for presenting all fair value changes of equity instruments not held for trading in other comprehensive income. Only dividends received from these investments are reported in profit or loss. In October 2010, the IASB issued further additions to IFRS 9. These bring forth the guidance for derecognizing financial instruments and most of the requirements for the classification and measurement of financial liabilities currently included within IAS 39. The additions include amortized cost accounting for most financial liabilities, with bifurcation of embedded derivatives. The main change is that in cases where the fair value option is taken for financial liabilities, the part of a fair value change due to an entity’s own credit risk is recorded in other comprehensive income rather than the statement of income, unless this creates an accounting mismatch. The remaining phases of the project, dealing with impairment of financial instruments and hedge accounting, have not yet been finalized. IFRS 9, as well as its additions, shall be applied retrospectively for annual periods beginning on or after January 1, 2013. We have adopted IFRS 9 from June 30, 2010, as well as the related consequential amendments to other IFRSs, and we have restated all comparative figures. There was no difference between the previous carrying amounts (IAS 39) and the carrying amounts under IFRS 9 of the financial assets and liabilities as of July 1, 2009. |
| • | Amendment to IFRS 2 “Share-based Payment: Group Cash-settled Share-based Payment Transactions.”The amendment relates to the accounting for group-settled share-based payment transactions, stating that an entity that receives goods or services in a share-based payment arrangement must account for those goods or services irrespective of which entity within the group settles the transaction. The amendment to IFRS 2 also incorporates guidance previously included in IFRIC 8 “Scope of IFRS 2” and IFRIC 11 “Group and Treasury Share Transactions.” As a result, the IASB has withdrawn IFRIC 8 and IFRIC 11. The amendment to IFRS 2 is effective for annual periods beginning on or after January 1, 2010 and applies retrospectively. We have adopted the amendment to IFRS 2 from June 30, 2010. The amendment did not result in changes to our consolidated financial statements. |
In addition, during 2009 and 2010, the IASB and IFRIC published several standards, amendments and interpretations to existing standards, which were effective for our Audited Interim Consolidated Financial Statements, though none of them are expected to have a significant impact on our financial position, results of operations and cash flows. See Note 2 to our Audited Interim Consolidated Financial Statements for a detailed description of the requirements of each standard.
Furthermore, on May 12, 2011, the IASB issued IFRS 10 “Consolidated Financial Statements”, IFRS 11 “Joint Arrangements”, IFRS 12 “Disclosure of Interests in Other Entities” and IFRS 13 “Fair Value Measurement.” These standards are effective for annual periods beginning on or after January 1, 2013; however, earlier application is permitted. These standards will become effective for us for our fiscal year ended June 30, 2014. See Note 2 to our Audited Consolidated Financial Statements for a detailed description of the requirements of each standard.
72
Table of Contents
The Global Agricultural Market
Agribusiness can be defined as the economic sector that produces, distributes and sells food products obtained from agricultural operation. We believe that growth in the industry is driven by three main factors:
| • | population growth; |
| • | per capita income, which leads to changes in dietary patterns; and |
| • | demand for renewable fuels, which are mostly grain-based. |
Expected growth in the world population, combined with a projected improvement in per capita food consumption, especially in emerging markets, is expected to contribute directly to increased global food consumption.
According to the United Nations, the world population is expected to increase from 6.9 billion in 2010 to approximately 8.3 billion in 2030. This projected 20% increase is expected to be largely driven by the expansion of less developed regions, whose share of the global population is expected to reach 85% by 2030, as compared to 78% in 1990, according to the United Nations. Accordingly, we believe that agriculture will assume an even greater role in supplying products to satisfy the demand of a growing population.
In addition to a projected increase in population, the global per capita income of developing countries is expected to increase from the current $4,800 per year to $11,000 per year in 2030, according to the World Bank. Moreover, according to the World Bank, the middle class in these countries, which includes families with an average of four people and a budget between $16,000 and $68,000 per year, is expected to increase from 400.0 million in 2005 to 1.2 billion people in 2030, representing approximately 15% of the total global population. As world per capita income increases, particularly in countries with low per capita income, we expect to see a trend toward increased food consumption, in particular for protein rich products such as meat.
Another trend that is expected to contribute to greater demand for agricultural products is the increasing demand for renewable energy (with bioenergy as one of the main sources), which demand has increased on a per capita basis in recent years according to the IBISWorld Industry Reports. This development is driven by government policies and subsidies for, among other things, biofuel usage, which has resulted in an increasing demand for energy crops such as grains and oilseeds, according to the IBISWorld Industry Reports. According to the IBISWorld Industry Reports, another factor that should influence the use of agricultural products for production of biofuels is the increase in oil prices over the last two years, especially due to the concentration of production in few countries. Any price drop will likely result in a reduction of oil available in the market by the Organization of Petroleum Exporting Countries, which will try to maintain prices at high levels.
| Global Cereal and Meat Consumption | ||||||||||||||||||||||||
| Population (in millions) | Increase (%) | Cereal consumption (1) (in million tonnes) | Increase (%) | Meat consumption (2) (Kg per capita) | Increase (%) | |||||||||||||||||||
1999-2001 | 6,115 | — | 1,865 | — | 37.4 | — | ||||||||||||||||||
Expected – 2030 | 8,309 | 36 | % | 2,677 | 44 | % | 47.0 | 26 | % | |||||||||||||||
| (1) | Rice, wheat, corn, sorghum, barley, etc. |
| (2) | Kg per capita (carcass weight equivalent); includes bovine, ovine, pig meat, poultry meat. |
Sources: UN (2008) and FAO, World Agriculture: Towards 2030-2050 (2006).
Global Soybean Sector
Global oilseed trade consists of numerous commodities that are closely substitutable, and includes soybeans, rapeseed, sunflowerseed, and cottonseed. In addition to the seed, oil and meal obtained from crushing oilseeds
73
Table of Contents
are traded in certain countries. The import demand in a particular country is dependent on the difference between the country’s domestic oilseed output and its consumption. Divergent demand for protein meal and vegetable oil, as well as limits on domestic processing capacity, determines the ratio of oilseeds to oilseed products that a particular country imports. The volume and source of foreign imports depend on seasonal availability and relative prices, credit and delivery terms, local preferences, and quality. The policies of specific countries, such as tariffs and domestic subsidies, also can affect prices and the availability of competing products.
According to the USDA, the most valuable product obtained from processing soybeans is soybean meal, which accounts for 50% to 75% of the value obtained from processing soybeans, depending on relative prices of soybean meal and oil. Soybean meal is the most important protein feed in the world, accounting for more than two-thirds of world feed supplies. Livestock (including poultry) feeds account for 98% of soybean meal consumption, with the remainder used in human foods such as bakery ingredients and meat substitutes, according to the USDA.
Soybean oil generally has a smaller contribution to the value obtained from processing soybeans, as oil constitutes approximately 18% to 19% of a soybean’s weight, according to the USDA. However, soybean oil accounts for 55% to 65% of the total vegetable oil and animal fat consumed in the United States. It is mainly used in salad and cooking oil, bakery shortening and margarine, as well as in a number of industrial applications. According to the USDA, until 2005, soybean oil was the largest source of vegetable oil worldwide. From 2005 onwards, however, palm oil production has exceeded soybean oil production. According to the USDA, palm oil and rapeseed (canola) oil productions are expected to continue to grow over the next few years.
According to the USDA, global production of soybeans increased by a compound annual growth rate of 4.4% between the 2000-2001 and 2009-2010 seasons, reaching a record level of 260.0 million tonnes of production in the 2009-2010 season. During the same time period, global soybean exports (including processed soybean meal and oil) increased by a compound annual growth rate of 5.6%, reaching 157.5 million tonnes in the 2009-2010 season, according to the USDA. The USDA forecasts global production to moderately decline by 3.9 million tonnes from 2009-2010 to 2010-2011, to a production of approximately 256.1 million tonnes, along with an increase in global exports (including processed soybean oil and meal) to 167.7 million tonnes during the same period.
Global Wheat Sector
According to the USDA, the United States is the world’s leading wheat exporter. Historically, in most years the United States, Canada, Australia, the EU-27, the former Soviet Union (including three major wheat exporters: Russia, Ukraine and Kazakhstan), and Argentina together account for about 90% of world wheat exports, according to the USDA.
The diversity of exporting countries provides significant stability to world wheat trade and prices. Most of the world’s wheat production is grown as winter wheat in the Northern Hemisphere, but Canada, Kazakhstan, Russia, and the United States have large spring wheat production, which is planted much later. Moreover, in the Southern Hemisphere, Australia and Argentina plant after the Northern Hemisphere’s spring wheat. With wheat being planted and harvested at different times, countries can respond quickly to changing market conditions.
According to the USDA, global production of wheat increased by a compound annual growth rate of 1.8% between the 2000-2001 and 2009-2010 seasons, reaching 682.7 million tonnes in the 2009-2010 season (1.5 million tonnes below the record level reached in 2007-2008). During the same time period, global wheat exports increased by a compound annual growth rate of 3.3% to 135.6 million tonnes. The USDA forecasts global production to decline by 37.2 million tonnes from 2009-2010 to 2010-2011, to a production of approximately 645.4 million tonnes, with a corresponding decline in global exports to 125.3 million tonnes during the same period.
74
Table of Contents
Global Rice Sector
Rice is the primary staple crop for the majority of the world’s population, with Asia and Africa as the largest consuming regions. Consumers in developing countries depend on the versatility and high caloric value of rice. According to the USDA, rice is produced worldwide and is the world’s second- or third-largest staple crop, trailing corn (maize), and global rice production (calculated based on weight prior to milling) is approximately equal to global wheat production. Although rice is produced in many countries, rice fields are limited to certain areas due to the physical requirements for growing rice, such as available water and soil types. Economically viable production typically requires high average temperatures during the growing season, a plentiful supply of water applied in a timely fashion, a smooth land surface to facilitate uniform flooding and drainage, and a subsoil hardpan that inhibits the percolation of water.
According to the USDA, global production of rice (milled basis) increased by a compound annual growth rate of 1.1% between the 2000-2001 and 2009-2010 seasons, reaching 440.9 million tonnes in 2009-2010 (7.2 million tonnes below the record level reached in 2008-2009). During the same time period, global rice exports increased by a compound annual growth rate of 2.8% to 31.0 million tonnes. The USDA forecasts global production to increase by 10.7 million tonnes (milled basis) from 2009-2010 to 2010-2011, to a record production level of approximately 451.7 million tonnes, with a corresponding increase in global exports to 31.1 million tonnes during the same period.
Global Beef and Dairy Sector
Beef is a rich source of protein and is the third most consumed type of meat in the world, after pork and poultry. According to the USDA, the growth in world per capita meat consumption is expected to slow during the 2011-2020 projection period to less than 2/3% per year. A major part of this consumption is concentrated in Western countries due to the local food habits. Although the USDA forecast for 2011 regarding world beef consumption still indicates a slight 0.1% drop in relation to 2010, a return to growth in subsequent years is expected to be fueled by an increase in global population, economic development and an increase in per capita income (since the per capita consumption of beef is directly related to economic growth). Therefore, it is believed that countries such as China and Brazil will present the highest rates of growth in the consumption of beef, along with other countries in Latin America, the Middle East and Eastern Europe.
In addition, according to studies performed by the FAO, countries with a higher GDP per capita tend to consume more protein-based products. As a result, consumption of livestock products has increased rapidly in developing countries over the past decades, particularly from the 1980s onward. According to the OECD-FAO Agricultural Outlook for 2008-2017, global consumption of milk and other dairy products is expected to increase, primarily driven by population and income growth in developing countries. In addition, demand is expected to be stimulated by a range of new products, expansion of cold storage facilities, improved shelf life and product marketing, increasing presence of western retail chains and fast food catering. Consumption of dairy products in the area outside of OECD is expected to increase by approximately 20% to 40% over the next ten years, according to the OECD-FAO Agricultural Outlook for 2008-2017. Growth in consumption of livestock products per capita has markedly outpaced growth in consumption of other major food commodity groups. Since the early 1960s, consumption of milk per capita in developing countries has almost doubled. OECD expects that such growth will continue. The increase in meat consumption should also drive increased demand for grain due to the multiplier effect—production of one kilogram of beef requires at least seven kilograms of grain.
Price Dynamics
We believe that the supply of agricultural products will grow at a slower pace than demand, primarily as a result of declining arable land per capita, a growing and more affluent global population and an increasing expected demand for renewable fuels. Consequently, we believe that commodity prices over the medium term will average substantially above those that prevailed over the past 10 years. We expect this to reinforce incentives to increase production, and in countries affected by the strengthening of the U.S. dollar as compared to
75
Table of Contents
their domestic currencies, to further improve domestic price incentives. We believe that these factors should combine to sustain the growth of global agricultural production, although some of that impetus may be abated by the supply-reducing effect of high oil prices, which raises production costs. Supply-side factors, such as the globalization of supply chains for feed, genetic stock and other technology, are further transforming the structure of this sector. We believe that Latin America, together with other emerging regions, is well positioned to benefit from this growth relative to more developed regions.
Long-term price determinants
The agricultural markets are gradually growing more integrated and a change in long-term demand is thus driven by global demand changes. Currently, there are three major factors contributing to the overall increase in demand for grains and oilseeds:
| • | Human food consumption: Increases in the world population and changes in food preferences affect human food consumption. Populations of developing countries with rising GDP growth rates are anticipated to shift towards higher value food products. These consumption shifts are likely to increase demand. According to the United Nations, world population is expected to grow at an average rate of 0.9% over the next 20 years. |
| • | Animal feed consumption: The demand for animal feed is primarily driven by meat consumption, which is highly correlated with economic development. The sustained economic growth in certain developing and transition economies has resulted in growth in disposable income, allowing people to change their eating preferences from staple foods towards a mix of more expensive, protein rich foods, such as meat. |
| • | Renewable energy: An increasing demand for renewable energy has resulted in an increasing demand for energy crops, such as oilseeds. |
Uruguay’s Competitive Advantages
Latin America, as a net exporter of agricultural products, is expected to benefit from the growth in agricultural demand and we believe that Uruguay is particularly well-positioned to capitalize on this growth. Specifically, we believe that Uruguay’s competitive advantages and low cost of production provide us with favorable dynamics to grow our agriculture, livestock and dairy businesses.
Soil
Agricultural activities in Uruguay enjoy the advantage of high quality soil. A 2007 FAO study ranks Uruguay first for soil quality out of 160 countries in the study. Ranking is based on a weighted overall score of seven different factors: (i) equivalent arable land, (ii) deserts and drylands, (iii) steeplands, (iv) land degradation severity, (v) actual arable land, (vi) land balance and (vii) population increase.
Uruguay’s soil resources are well preserved and according to the FAO, 87% of Uruguay’s land area has light or no human-induced degradation, compared with 37% for Argentina, 48% for Brazil and 40% for the U.S.
Water
Uruguay has favorable water usage statistics and uses on average only 2.3% of its renewable water resources annually, according to the CIA World Factbook. The CIA World Factbook places Uruguay’s total annual water withdrawal at 3.15 km3 per year, versus annual renewable water resources of 139 km3.
The southern part of Uruguay lies on top of the Raigón aquifer which is an important source of water for irrigation. As well, the dense network of rivers and creeks in Uruguay provides water for cattle and irrigation. With the proper permits, farmers in Uruguay can build dams on their land to store water for irrigation, or can pump water from rivers and lakes. The permit system ensures that a farmer will have access to water for farming.
76
Table of Contents
Uruguay also sits atop the Guarani Aquifer, one of the largest reservoirs of groundwater in the world, which covers 1,190,000 km² (45,000 km² in Uruguay), with a total volume of about 37,000 km³ and a natural recharge of 166 km³ per year, which may be accessed in the future as an alternative source of water.
Double Crop Growing Season
The ability to harvest multiple crops dramatically increases the yield of farmland given that fixed and capital costs typically remain the same regardless of the number of harvests. The suitability of a particular tract of farmland for double-cropping typically depends on favorable average temperature and precipitation conditions. Uruguay is well suited for a double-crop environment due to favorable average temperatures of between 52°F and 74°F (11°C to 23°C). In comparison, double-cropping would be difficult to achieve in the U.S. Midwest due to greatly varying temperatures of between 23°F and 76°F (-5°C to 23°C). Uruguay’s rainfall is both abundant, at approximately 49.7 inches (1,263 millimeters) per year, and roughly evenly distributed across the entire year. Combined, these two factors allow Uruguayan farmers to harvest two annual crops, whereas farmers can only have one harvest in most parts of North America and Europe.
Attractive Land Price per Hectare
The table below indicates comparative average land prices per hectare in Argentina, Brazil and Uruguay and illustrates that average land price per hectare in Uruguay is lower than that in comparable regions. According to GeoNova, land in Uruguay is comparable to land in southern Brazil and the Humid Pampas region of Argentina, based on top-rated soil quality, abundant rainfall, freshwater resources and moderate temperatures relative to other regions in South America.
| Region | Average price per hectare (US$/ha) (1) | |||
Brazil(2) | ||||
North | $ | 902 | ||
North-east | $ | 1,619 | ||
Mid-west | $ | 2,739 | ||
South-east | $ | 5,023 | ||
South | $ | 7,112 | ||
Argentina(3) | ||||
North-east | $ | 1,492 | ||
North-west | $ | 2,027 | ||
Humid Pampas | $ | 7,664 | ||
Uruguay(3)(4) | $ | 5,363 | ||
| (1) | Sample size used to calculate average price per hectare may cover a comparatively small percentage of total land area for a particular region. |
| (2) | Source: Informa Economics FNP (March-April 2011), converted to U.S. dollars at an exchange rate of 1.62 Brazilian reais per U.S. dollar. |
| (3) | Source: Registration Statement on Form F-1 of Adecoagro S.A., filed in January 2011. Information presented as of September 2010, comprising 242,148 hectares in Argentina (0.088% of the total land area of 276,689,000 hectares in Argentina) and 8,263 hectares in Uruguay (0.047% of the total land area of 17,621,500 hectares in Uruguay). |
| (4) | UAG’s land prices are not included in the calculation. |
Trade
Uruguay participates in several regional and international arrangements designed to promote cooperation in trade and investment. Uruguay has a flow of exports to a diversified list of countries, including China, the
77
Table of Contents
European Union, the U.S. and Canada, with no single country accounting for a majority of Uruguay’s exports. According to Uruguay XXI, from 2009 to 2010, exports from Uruguay increased 23% and in 2009, agro-industrial exports accounted for 77% of the Uruguay’s total exports.
As an agricultural export-driven economy, Uruguay actively promotes tax-free exports. Exporters in Uruguay also enjoy several other key benefits, including their ability to keep foreign currency proceeds from export sales. Goods and certain services exported from Uruguay are eligible for certain tax rebates.
Infrastructure and Location
Uruguay offers competitive advantages to investors, including a strategic geographical location, a network for the transportation of passengers and goods by sea, air and land, and a developed support infrastructure. The Global Competitiveness Report 2008-2009 (World Economic Forum) ranked Uruguay second in South America in terms of infrastructure development.
According to Uruguay XXI, the road network in Uruguay is the most concentrated in Latin America, with 45 km of paved roads per 1,000 km2 according to Uruguay XXI. Cargo is transported through Uruguay from the rest of the continent and the flow of international cargo is not restricted at Uruguayan border points according to Uruguay XXI.
According to Uruguay XXI, there are two important ports in Uruguay. The port of Montevideo is on the South American Atlantic coast. The port of Nueva Palmira is on the shore of the Uruguay River, and heads the most important inland waterway transport system in South America. In Uruguay, rice is primarily exported through the port of Montevideo and wheat and soybeans are primarily exported through the port of Nueva Palmira. According to Uruguay XXI, these two ports provide an important logistical advantage to the export of goods from Uruguay as a result of their proximity to most production areas in the country.
Uruguay also has a developed telecommunications network, with 100% digital telecommunications and 98 cellular phone lines per 100 inhabitants as reported by Uruguay XXI.
Foreign Direct Investment
Uruguay has a legislative framework that ensures equal treatment of foreign and local investors and foreign access to all economic sectors. The legislative framework promotes and protects investments made by national and foreign investors as to be in the nation’s interest. As a result, Uruguay allows 100% foreign land ownership with no restrictions.
Uruguay is one of the most socially and politically stable countries in South America. Uruguay was recently ranked first in South America in the “Democracy Index (Economist Intelligence Unit)” study, second in South America in the “Low Corruption (Transparency International)” study, and second in South America in the “Economic Freedom Index (Heritage Foundation)” and the “Quality of Living (Mercer Eco-City Ranking)” studies.
The Uruguayan Agricultural Market
Uruguay’s territory consists primarily of plains, which, combined with its temperate climate, make the country well-suited for agriculture and livestock. According to the World Bank, this sector of the economy grew between 2005 and 2009 driven by cereal and oil production fueled by high international commodity prices, as well as by milk and cattle production.
Crop production in Uruguay has historically been less important than livestock raising. According to the Library of Congress, only about 8% of Uruguay’s productive land was dedicated to growing crops in the mid-1980s, compared with approximately 75% dedicated to raising livestock. The amount of land under
78
Table of Contents
cultivation has varied according to the world price of livestock products. When beef prices have declined, for example, ranchers have planted wheat or corn. Rising livestock prices in the 1980s resulted in a considerable decrease in the area dedicated to most crops. Because crop production had gradually become more efficient through mechanization, however, crop yields did not necessarily decline. The most common crops contributing to the Uruguay economy are rice, soybeans, and wheat.
The Uruguayan Soybean Sector
According to the DIEA, soybeans have surpassed rice as the most important crop in Uruguay, in terms of tonnes produced. Since the 2002-2003 season, soybean production has grown tenfold, reaching 1,817 tonnes in the 2009-2010 season, placing Uruguay as the 4th largest soybean producer in Latin America, according to the DIEA. A key driver of this rapid growth has been the introduction of new technologies, allowing the farming of land previously suitable only for cattle-grazing. In addition, many farmers from neighboring Argentina have begun to develop farmland in Uruguay as a result of the unfavorable political situation and high export duties in their home country. According to the DIEA, soybean plantations occupy approximately half of Uruguay’s farming land dedicated to grains (excluding rice), but this percentage continues to grow every year. Furthermore, attractive soil conditions, moderate temperatures and ample water availability allow for double-cropping.
The Uruguayan Wheat Sector
Similar to soybeans, wheat has become an increasingly important crop in Uruguay and has benefited from new technology that allows the conversion of land from cattle-grazing to grain-farming. According to the DIEA, since the 2002-2003 season, wheat production has grown at a compound annual growth rate of 36.8%. In addition, planted area dedicated to wheat farming has grown at a compound annual growth rate of 22.0%, according to the DIEA. Furthermore, attractive soil conditions, moderate temperatures and ample water availability allow for double-cropping.
The Uruguayan Rice Sector
Although now surpassed by soybeans and wheat as the most important crop in Uruguay, rice has historically been a staple of the Uruguayan agricultural industry according to the DIEA. Farming conditions in Uruguay meet the requirements for rice production, which include high average temperatures during the growing season, a plentiful supply of water applied in a timely fashion, a smooth land surface to facilitate uniform flooding and drainage, and a subsoil hardpan that inhibits the percolation of water. The favorable conditions in Uruguay allow for 100% irrigation according to the INIA and ACA. As a result, according to the DIEA, Uruguay is the largest rice exporter in Latin America and the seventh largest rice exporter in the world, as 95% of the country’s production is marketed for export.
The Uruguayan Beef and Sheep Sector
According to FAO, beef production and sheep rearing are the most important agricultural activities in Uruguay, using more than 83% of the country’s productive land. The FAO reports almost 12.0 million heads of livestock in Uruguay. Annual slaughter is greater than 2.0 million heads, according to the FAO, which represents an extraction rate of approximately 17%. Furthermore, Uruguay has one of the highest annual per capita consumptions of beef in the world, according to the USDA.
Uruguayan beef exports increased at a compound annual growth rate of 11.3% between 2001 and 2010, compared with 6.7% and 9.5% in Argentina and Brazil, respectively, according to the USDA. Several factors have enabled Uruguay to become a major player in the global beef trade, including access to key export markets, above-average sanitary conditions, and the ability to react quickly to consumer demand:
| • | Access to key export markets: Uruguay is currently the only South American beef producer allowed to export to the U.S. and with no restrictions imposed by EU countries. Beef exports grew during the |
79
Table of Contents
early to mid-2000s as a result of the devaluation of the Peso and access to new export markets, particularly the North American Free Trade Agreement area. |
| • | Above-average sanitary conditions:During the past decade, Uruguay has benefited from declining exports from neighboring Brazil and Argentina, countries which were negatively impacted by disease-related problems with cattle. Uruguay, on the other hand, has been free of such diseases during the same period, and currently is classified as low risk for bovine spongiform encephalopathy by the World Organization for Animal Health. |
| • | Ability to react quickly to consumer demand: All of the cattle in Uruguay are traceable through a mandatory national animal ID system, which links Uruguay’s beef supply chain from the source farm to processing. In addition to low production costs and modern technology, Uruguay is able to retain flexibility in order to react quickly to changing consumer demands, helping the country maintain a strong position in the global beef export trade. |
Sheep production is also an important economic activity within the agriculture business in Uruguay. There are approximately 8.7 million heads of sheep in Uruguay, mostly located in the northern and eastern part of the country, according to the DIEA.
The Uruguayan Dairy Sector
Dairy farming is an important and established agricultural activity in Uruguay. As estimated by the DIEA, Uruguay’s dairy industry supplied 1,694.0 million liters of milk in 2009, and has supplied on average approximately 1,528.6 million liters per year of milk during the last eight years, of which approximately 1,351.5 million liters are processed industrially. Total milk supply increased at a compound annual growth rate of approximately 4% over the past 8 years. UAG is a member of farmer cooperative CONAPROLE, which processes around two-thirds of all milk produced in Uruguay. CONAPROLE buys all milk produced by its members at an established price in accordance with the international market.
According to the DIEA, the value of Uruguay’s milk product exports grew at a compound annual rate of 16.2% from 2002 to 2009, rising from $126.2 million to $360.4 million. In 2009, 21.3% of Uruguayan dairy products were exported, primarily cheese and milk powder, which accounted for 79.6% of total dairy exports.
The Uruguayan Blueberry Sector
Over the past decade, there has been a steady increase in the number of hectares of land in Uruguay developed for the production of blueberries. According to UPEFRUY, Blueberries are the second-largest fruit export in Uruguay, next to citrus fruits, and in 2009 Uruguay exported 1,210 tonnes of blueberries. Exporters from the southern hemisphere export and sell blueberries using an off-season strategy, taking advantage not only of the climate but also of the fact that there are no such fruits available from October through April in the northern hemisphere. Countries such as Chile, Argentina, Uruguay, South Africa, New Zealand and Australia export blueberries to the northern hemisphere.
The Uruguayan Apiculture Industry
Uruguay’s apicultural products are recognized for their quality, the natural environment in which they are produced and the quality of its producers.
Land
Demand for agricultural land is directly related to demand for agricultural products. In addition, there is increasing demand for urban and suburban uses of farmland. The increased demand due to population growth and changing consumption patterns, coupled with the development of agricultural land for urban and industrial purposes, could result in significant upward pressure on farmland prices.
80
Table of Contents
Arable Land Per Capita Worldwide
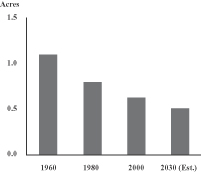
Source: Food and Agriculture Organization of the United Nations
Adding to the importance of the development of arable land is the current deceleration of crop yields relative to population growth. According to The Economist, between 1961 and 1990, wheat yields rose nearly 3% on average per year, compared to an average annual population growth rate of 1.8%. However, between 1990 and 2007, the growth in wheat yields slowed to an average of 0.5% per year while the global population grew at an average of 1.4% per year. Similarly, the growth in rice yields between the two periods decreased by approximately 50%, resulting in two of the most important crops experiencing nearly flat yield growth. Although it is expected that a significant portion of worldwide production will need to come from higher crop yields, the expansion of sown area in regions such as South America and Eastern Europe, where there are substantial available land reserves, is also expected to contribute to increased crop production.
Factors such as increasing demand for crops and decreasing areas of arable land globally are key long-term drivers for agricultural land prices. The supply side is limited since land is a finite resource. Although land is plentiful, fertile arable land that can produce crops profitably is less so. Four main factors contribute to permanent reduction of prime arable land:
| • | Abandonment of land: Prosperity and economic growth are more closely linked to rural areas in the developing world relative to the industrial world. As a result, many farmers give up agriculture, abandon their farms and migrate to cities. This phenomenon leads to degradation of agricultural land or development of land formerly used for farming, thus reducing the arable area. |
| • | Overexploitation: Population growth brings about overexploitation of land and, consequently, more arable land is becoming infertile and arid. This process also affects surrounding land, which in turn can lead to more volatile weather patterns, topsoil runoff and flooding. |
| • | Climate changes: Climate change due to changing weather patterns hastens soil erosion. The result is less arable land and less reliable crop harvests. |
| • | Water scarcity: Many developing countries suffer from water scarcity. As people migrate to cities, demand for water increases in urban areas. Farmers are thus subject to increased competition from urban areas for water supply. If the soil is not irrigated properly, it becomes arid and the topsoil erodes. |
Land usage
In addition to having the world’s highest quality soil FAO ranking, Uruguay offers a very attractive arable land profile with strong potential for growth. Uruguay’s soil resources are well preserved and according to the FAO, 87% of Uruguay’s land area has light or no human-induced degradation, compared with 37% for Argentina, 48% for Brazil and 40% for the U.S. According to the World Soil Resources Report, 70% of Uruguay’s total area is arable, compared with 26% for Argentina, 46% for Brazil and 28% for the U.S. However,
81
Table of Contents
only 9.8% of Uruguay’s arable land was used in 2008 based on arable land data from the FAO and the crops area sown data from the DIEA. Consequently, there is substantial potential in Uruguay for increased usage of land and agriculture production.
Approximately 10 years ago, agricultural activity in Uruguay expanded to lands that were previously considered not usable for agriculture. The expansion of agricultural activity on new land is still taking place in Uruguay and is related to the introduction of new farming technology, such as no-till farming, which does not disturb the soil through tillage. No-till farming practices allow Uruguay to increase its grain production by farming in new areas while maintaining high yields and preserving the soil.
Price development
Farmland prices are based on local markets and hence prices differ between countries due to specific country-related factors. Such specific factors may include the fertility of the land, the state of the land due to previous management, current yield levels, current and expected crop prices, availability and cost of financing, agricultural support, geographic proximity to infrastructure such as seaports and railroads, and climatic conditions.
According to the DIEA, the average price at which agricultural land of all sizes and uses, including lands used for the production of crops and cattle grazing, in Uruguay was bought and sold in 2010 was 13% higher than in 2009. This price was based on 2,093 transactions throughout the country for an aggregate size of 336 thousand hectares (average transaction size of 161 hectares). While Uruguay agricultural land prices have increased over the past several years due to, among other things, the expansion of agriculture and the perception of lower political risk, we believe they are still more attractive than those in other agricultural producers such as Argentina, Brazil and the U.S. See “Risk Factors—Risks Related to Our Business and Industries—Prices for agricultural land in Uruguay have rapidly escalated over the past decade and we have purchased our land at prices far in excess of historical averages. Any significant deterioration in the Uruguayan agricultural real estate market would materially adversely affect our business, financial condition and results of operations.”
The table below shows the average prices at which agricultural and cattle-grazing land in Uruguay was sold for the last ten years. The data below represents transactions completed in all departments of Uruguay for land with an area of over 10 hectares.
| Area sold | Value of area sold | |||||||||||||||||||
Year | Number of transactions | Average (ha) | Total (thousand ha) | Average (US$/ha) | Total (US$ million) | |||||||||||||||
2010 | 2,093 | 161 | 336 | 2,633 | 885 | |||||||||||||||
2009 | 1,847 | 175 | 323 | 2,329 | 753 | |||||||||||||||
2008 | 2,959 | 231 | 684 | 1,844 | 1,260 | |||||||||||||||
2007 | 3,277 | 206 | 676 | 1,432 | 968 | |||||||||||||||
2006 | 3,245 | 265 | 859 | 1,132 | 972 | |||||||||||||||
2005 | 2,872 | 295 | 846 | 725 | 613 | |||||||||||||||
2004 | 2,746 | 276 | 758 | 664 | 503 | |||||||||||||||
2003 | 2,156 | 344 | 741 | 420 | 311 | |||||||||||||||
2002 | 1,598 | 229 | 365 | 385 | 141 | |||||||||||||||
2001 | 1,966 | 270 | 530 | 413 | 219 | |||||||||||||||
Total | 24,759 | 247 | 6,118 | 1,083 | 6,625 | |||||||||||||||
Source: DIEA
82
Table of Contents
Our Company
We are one of the largest corporate agricultural landholders and operators in Uruguay and a leading producer of agricultural products for export to the global market. We have grown rapidly since our formation in 2008 and have fully paid for and acquired approximately 84,670 hectares of agricultural land in Uruguay for our operations. Substantially all of our land is held underpromesas, pursuant to which we expect to receive title at a later date. See “—Farmland Overview.” Our diversified agricultural operations include crops (soybeans and wheat), rice, dairy, cattle, sheep and other products (blueberries and honey). By combining our management’s experience and operational knowledge with state-of-the-art agricultural techniques, we have created a hard-to-replicate agricultural production platform in Uruguay.
We are focused on acquiring high-quality agricultural land that we believe is underutilized, developing such land for increased productivity and exploiting it in an efficient and sustainable manner. We have demonstrated our ability to identify attractive land acquisition opportunities by acquiring approximately 84,670 hectares since our formation in 2008, and signed contracts to purchase an additional 7,718 hectares of land, for a total average cost of approximately $3,213 per hectare. As of April 30, 2011, 70,901 hectares of our land, or 83.7% of our total land holdings, was valued at approximately $270.0 million by Deloitte S.C. We purchased this land for a total purchase price of $220.3 million. Based on Deloitte S.C.’s appraisal, as of April 30, 2011 the value of the properties appraised by Deloitte S.C. exceeded the purchase price by more than 20%. The price of agricultural land in Uruguay increased approximately 540% from 2001 to 2010. See “—Land—Price Development.” These land acquisitions have enabled us to rapidly expand our production scale, diversify our product and revenue mix and achieve significant negotiation power in the sale of our products.
After acquisition of new land, our focus is on rapidly optimizing its use, for example, by planting soybeans or rice on land previously only used for cattle grazing. We have an in-house group of agronomists and over 300 farmland employees to plan and execute our optimization process to increase productivity and returns on our acquired land. To further enhance our efficiency, we organize our operations by productive regions, with a dedicated manager and technical staff supervising nearby farmlands. Each regional manager is guided by a plan developed by management based on analyses of product performance metrics. This allows us to reduce our personnel and machinery expenses. By consolidating land in proximity, we reduce potential economies of scale for new entrants and increase barriers to entry for competitors. Finally, we impose tight controls on our costs of operations by managing all planning, hiring and purchasing activities centrally from our headquarters in Montevideo. To support these centralized operations, we rely on our ISO 9001-certified processes and our custom-built information management system. We believe our processes and system allow us to control our input costs and negotiate lower purchasing prices and higher selling prices.
We have financed our land acquisitions solely with funds from private placements of our common shares. Since our initial private placement in 2008 through March 31, 2011, we have raised aggregate net proceeds of $353.3 million. We believe that listing our shares in the public capital markets should allow us to access a larger pool of capital and enable us to accelerate our growth plan. We recorded net losses of $1.6 million and $0.4 million in the nine months ended March 31, 2011 and in our fiscal year ended June 30, 2010, respectively, and have recorded cumulative net losses of $4.6 million since our formation in 2008.
Our strategy is to continue to expand our operations by acquiring more high-quality land that we believe is underutilized in Uruguay at attractive prices, and to be a large low-cost producer of food for global export. We intend to continue integrating new land acquisitions into our operations in order to increase our operational efficiency, continue to gain economies of scale, and to enhance profitability. Finally, we plan to achieve higher returns by leveraging our existing investments in employees, equipment and infrastructure for use on leased farmland close to our lands, with minimum additional investment.
Under the laws of Uruguay, we are not permitted to obtain legal title to rural land without first obtaining governmental authorization. As a result, we acquire land in Uruguay under purchase promise agreements, or
83
Table of Contents
promesas. Under apromesa, the seller agrees to transfer legal title to us once the requisite governmental authorization has been obtained. We pay the full purchase price of the land at the time of execution of apromesa and have full rights to use such land, as well as the right to sell, transfer or assign thepromesa and the rights to the underlying land to a third-party purchaser. Approximately 99.8% of our land is held underpromesas. We recently obtained governmental authorization to obtain title to 17,846 hectares of land we hold underpromesas, or 21% of our total land holdings. We have applied for governmental authorization to obtain title with respect to 66,645 hectares of land we hold under promesas, or 78.7% of our total land holdings, and we currently expect to obtain such governmental authorization by June 2012. In addition, as of July 1, 2011, under the laws of Uruguay, we are not entitled to use rural land without first obtaining governmental authorization. Until June 30, 2011, we were permitted to use 64,505 hectares of our land we hold underpromesas, or 76.2% of our total land holdings, pursuant to an exemption under the law. On June 22, 2011, we applied for governmental authorization to continue using such land. On June 23, 2011, the executive branch of the Uruguayan government issued a decree confirming that companies that had properly applied to obtain authorization could continue to use the land pending government determination of their applications. We expect to obtain this authorization 30 business days after the date we made the application, although there can be no assurance that the government will not deny the application. A proper application to obtain governmental authorization under the Expedited Process is an application submitted to the Uruguayan Ministry of Fishing, Agriculture and Livestock, or the MFAL, by an entity that has obtained prior authorization to own or use land and has timely requested that such authorization be extended to own or use additional land. We have concluded that we properly applied for governmental authorization and therefore are permitted to continue using the 64,505 hectares of land because the application was submitted by our wholly-owned subsidiary, Boisy S.A., which had previously obtained governmental authorization to use land, and that such application was submitted on June 22, 2011, and therefore it was timely filed. The Uruguayan government will review the application based on three factors: whether the applicant had previously received governmental authorization to use land; whether the land that is the subject of the application can be used for the requested purposes; and whether the application was timely filed. We fully expect that we will be granted the authorization under the Expedited Process based on (1) a certificate issued to us by the MFAL on June 24, 2011, certifying that the Uruguayan government does not have any comments with respect to the application as of the date of such certificate and (2) direct discussions with officials of the MFAL, who have indicated that such authorization is expected to be granted upon the expiration of the 30 business day waiting period. There can be no assurance that the government will not deny the Expedited Process application. If our application for authorization to use the land is denied under the Expedited Process, processing of our application will continue under the standard process, which process generally takes 12 to 16 months from the date of application to complete. However, during such time, we would continue to be able to use the land that is the subject of the standard authorization process. We are currently authorized to use all of our land held underpromesas, as the use of all of our land held underpromesas has either been authorized by the Uruguayan government or is subject to applications for authorization. Upon the completion of this offering, we intend to submit an application for governmental authorization to obtain title to, and use of, our lands held underpromesas under a different provision of the applicable law, namely the Public Company Exception, which we would be permitted to apply for once this offering is completed and our common shares are traded on the NYSE. We fully expect that we will receive such authorizations under the Public Company Exception in due course following completion of this Offering. If, however, the Uruguayan government denies our requests for authorization under the exemptions available to us,or it is determined that the required authorization has not been adequately obtained, we could lose our rights to the use of such land, and any of our subsidiaries that has not obtained such authorization would be required to dissolve and liquidate its assets to our parent company. Although we do not intend to do so, we also have the right at any time to, and could, sell thepromesasto a third-party purchaser at market value. See “—Farmland Overview.”
We are engaged in five reportable business segments:
| • | Cattle: Our cattle segment consists of breeding, purchasing and/or fattening of beef cattle for sale to meat processors and Uruguay’s livestock auction markets. As of March 31, 2011, we owned 32,027 head of cattle. |
84
Table of Contents
| • | Sheep: Our sheep segment consists of breeding, purchasing and/or fattening of sheep for sale of meat and/or wool to meat processors, wool product manufacturers and wool cooperatives. As of March 31, 2011, we owned 14,503 head of sheep, which we use to produce wool and meat products. Over 80% of our sheep population is of the Australian Merino breed. |
| • | Crops: Our crops segment consists of planting, harvesting and sale of wheat and soybeans, which do not represent separate operating segments on an individual basis. We seek to maximize the use of our farmland through crop rotation and the type and amount of crops cultivated may vary from harvest year to harvest year. We are focused on the long-term performance of productive land, and to that extent, performance is assessed considering the aggregate combination, if any, of crops planted in the land. A single manager is responsible for the management of operating activity of all crops, rather than for each individual crop. As of March 31, 2011, we operated approximately 2,670 hectares of crops growing farmland. During the 2010 harvest year, we planted approximately 3,251 hectares of wheat and soybeans, producing 7,792 tonnes of wheat and soybeans. |
| • | Rice: Our rice segment consists of planting, harvesting and sale of rice to local third party exporters. As of March 31, 2011, we operated approximately 1,739 hectares of rice growing farmland. During the 2010 harvest year, we planted approximately 664 hectares of rice, producing 4,664 tonnes of rice grains. |
| • | Dairy: Our dairy segment consists of the breeding and purchasing of dairy cattle for the production of raw milk for sale to local milk and milk-related products’ producers. As of March 31, 2011, we owned 966 head of dairy cattle. |
We are also engaged in other non-reportable business segments that do not meet the quantitative thresholds for disclosure. We grow blueberries and engage in apiculture activities. As of March 31, 2011, we had four established blueberry plantations totaling approximately 40 hectares. Our apiculture business generates revenue from the sale of products such as honey, pollen and propolis, and from pollination services provided to third parties. Historically, our beehives were located within our blueberry farms; however, we have recently started to allocate beehives to our properties in the Province of Tacuarembó, which had been historically used for cattle and are currently also used for crop production.
Our Strengths
We believe the following are our competitive strengths:
| • | Unique farmland portfolio benefiting from the strategic advantages of Uruguay. We have acquired approximately 84,670 hectares of agricultural land in Uruguay on which we produce a diversified range of agricultural products for export to the global market. Our farmland portfolio makes us one of the largest corporate agricultural landholders in Uruguay and we believe this places us in a favorable competitive position that is very difficult to replicate by potential competitors. We believe Uruguay offers unique competitive advantages for agricultural exploitation and business development and has significant amounts of high-quality arable land that is currently underutilized. According to a 2007 FAO study, Uruguay has the world’s top rated soil quality. In addition, according to GeoNova, the country’s abundant rainfall, freshwater resources and moderate temperatures offer an ideal climate for agricultural production, allowing for two annual harvests by mixing certain crops such as planting soybeans and wheat in separate harvests in the same year. Furthermore, Uruguay’s trade relationships, infrastructure and close proximity to maritime transportation make it ideally suited for exporting agriculture production to the global market. Finally, we believe that Uruguay benefits from a stable political environment with limited land use regulation and low taxation compared to other countries in South America. |
| • | Proven track record of acquiring high-quality farmland. Our in-house farmland acquisition team has been able to quickly deploy our capital to acquire approximately 84,670 hectares of agricultural land in Uruguay since our formation in 2008. For example, we have already acquired approximately 36,000 hectares of land using approximately $130.0 million of the $155.0 million of net proceeds we received |
85
Table of Contents
from our last private placement in December 2010 and January 2011. We believe that the farmland we have acquired is high-quality based on Uruguay’s top-rated soil quality, abundant rainfall, freshwater resources and moderate climate allowing for two annual harvests. |
| • | Identified pipeline provides substantial growth opportunities. According to the FAO, Uruguay has 14.2 million hectares of arable land, of which only 1.7 million hectares were cultivated in 2008. Our management team has identified approximately 145,000 hectares of underutilized land for potential acquisitions in the short term. We believe that this pipeline will provide us with the ability to acquire additional land at attractive prices, as we have done in the past. For example, between January and March 2011, we acquired an additional 7,677 hectares of land at an aggregate cost of $31.7 million. |
| • | Ability to develop underutilized land with a diversified business model and operating efficiency.We have acquired land that we believe was underutilized, either because it was used for a single and less efficient purpose than our intended use or because of the previous owners’ investment restrictions. We seek to optimize our operations and cost structure through the deployment of state-of-the-art agricultural techniques, including crop rotation systems and double cropping, which we believe allow us to achieve increased efficiency, enhanced returns and higher margins relative to other local competitors. To further our operating expertise and mitigate risks, we have developed a diversified portfolio of agricultural products, including wheat, soybeans, rice, dairy, cattle, sheep, blueberries and honey. This business model allows us to reduce the risks associated with climatic conditions that may adversely affect a particular product and lessens our exposure to the volatility of prices for a specific commodity. Moreover, our crops are harvested at different points throughout the year, which enables us to better leverage capital allocated to harvesting machinery and reduces working capital needs. |
| • | Economies of scale provide us with negotiation power and lower our production costs. As a landholder of approximately 84,670 hectares of productive agricultural land, we have attained the size to achieve significant economies of scale in our agricultural operations. Currently, we have active operations on 75,414 hectares of land, or approximately 89.1% of our 84,670 hectares of land. With our size of operations, we are able to obtain higher selling prices for our products and better terms in the purchase of our primary supplies. We are also able to lower our costs of production by consolidating our personnel and machinery expenses. Our operations benefit from our ability to purchase state-of-the-art machinery and equipment that would not be economically viable for smaller enterprises. |
| • | Experienced local management with ownership stake.Our senior management team has an average of approximately 25 years of experience. Members of our management team have been active in the Latin American agricultural sector since the 1980s. Our founders, directors and management own approximately 5.8% of our company before giving effect to this offering, which we believe creates a strong alignment of incentives. |
Our Business Strategy
The key elements of our business strategy are:
| • | Acquire and develop underutilized farmland at attractive prices. Our objective is to increase our landholdings in Uruguay to 160,000 hectares, through acquisitions at attractive prices. To achieve our objective, we have identified more than 33 properties, for a total of approximately 145,000 hectares of underutilized agricultural land that could complement our existing landholdings. After acquisition of new land, we develop the land and optimize its use, for example, by planting soybeans or rice on land previously only used for cattle grazing. We have an in-house group of agronomists and over 300 farmland employees to plan and execute our optimization process to increase productivity and returns on our acquired land. |
| • | Continue to increase efficiency and achieve profitability of our farmland operations. We intend to operate our properties with high standards of efficiency, which we believe will make us a profitable and low-cost producer and enhance our position in the agricultural sector in South America. In |
86
Table of Contents
addition, we believe that our strong financial position, with total assets of $364.8 million and liabilities of only $12.9 million as of March 31, 2011, will allow us to continue to invest in state-of-the-art machinery and equipment to maximize yields. |
| • | Produce premium products with sustainable methods. To ensure that our products meet a high standard that distinguishes us in the international market, we intend to continue using sustainable farming practices that comply with applicable environmental regulations, ensure crop rotation throughout the year, maximize efficient water use and minimize soil degradation. We are guided by the belief that premium agricultural products can only be grown through sustainable farming practices. |
| • | Generate additional returns by operating leased farmland located near our properties. In addition to managing the farmland we acquired, we plan to augment our existing operations by opportunistically leasing farmland located in close proximity to our existing operations. We believe that selectively adding leased lands to our operations will allow us to achieve higher returns by leveraging our existing investments in our employees, equipment and infrastructure for use on leased farmland, with minimum additional investment. |
Operations and Principal Activities
Our business strategy consists of buying high-quality agricultural land that we believe is underutilized at attractive prices, and developing this land to produce primarily grains and meat in a rotational system, alternating different production in each plot in order to develop a sustainable and environmentally-friendly practice. A distinctive feature of Uruguay agricultural properties is that, in a relatively small tract of land, there are typically several types of soil suitable for different types of production, such as cattle or grain. This distinctive feature of Uruguayan soil allows us to diversify operational risks by avoiding focus on only one type of production.
Shallow soil that is not suitable for grain production is used to develop cattle breeding and sheep breeding for wool and meat production, which we refer to as “extensive cattle/sheep productions.” In land where the soil characteristics allow it, we improve the natural pastures on the land by sowing forage to increase the productivity of the pastures. In other land where we cannot sow forage, our cattle and sheep will graze on natural pastures.
We use deep and well-drained soil for soybeans and wheat production integrated in a rotation with cattle breeding on sown pastures, which we refer to as “intensive cattle/sheep productions.” A typical crop rotation would start with soybeans crop followed by wheat. We can harvest two different crops per year in the same plot, which boosts the profitability obtained from these lands. After three consecutive crops in the same plot, pastures are sown and are used for two years for beef production and for pasture seeds harvesting, before a new crop rotation starts over again with recovered soil.
We use deep soil with poor drainage for rice production, which requires soil to be flooded for three months in order for the rice to produce high yields. The typical rice rotation would include two consecutive years under rice production and then four years under beef production on high-quality sown pastures, which allows soil to recover its initial characteristics and permit us to cycle to rice production.
The following table sets forth, for the periods indicated, our sales by segment:
| Fiscal Year Ended June 30, | Nine Months Ended March 31, | |||||||||||||||||||
| 2010 | 2009 | 2008 | 2011 | 2010 | ||||||||||||||||
Segment | ||||||||||||||||||||
Cattle | $ | 352,208 | $ | 148,687 | $ | — | $ | 2,688,768 | $ | 125,591 | ||||||||||
Sheep | 83,864 | 23,338 | — | 296,216 | — | |||||||||||||||
Crops | 9,617 | — | — | 2,143,597 | 9,617 | |||||||||||||||
Rice | 1,123,383 | — | — | 866,763 | — | |||||||||||||||
Dairy | — | — | — | 116,203 | — | |||||||||||||||
All other segments | 11,808 | 27,369 | — | 100,616 | 11,808 | |||||||||||||||
Total | $ | 1,580,880 | $ | 199,394 | $ | — | $ | 6,212,163 | $ | 147,016 | ||||||||||
87
Table of Contents
Cattle
Since fiscal year 2009, we have been producing beef products from our cattle. Our first Braford calf, from embryos imported from Australia, was born at our Casco Patricio property in September 2010 and we have since bred our first generation of high genetic value Brafords. We are optimistic about the future of this enterprise, which is anticipated to provide UAG with elite bulls for its own cattle breeding operations, as well as a new product to sell. Cattle birth season also began in our general breeding herds of La Verónica and our recently acquired farm, Itacabó. This produces an increase in activity at those farms where pregnant cows are close to giving birth.
We acquired approximately 37,270 hectares of grazing land located in Tacuarembó, Salto, Paysandú and Maldonado. As of June 30, 2010 and March 31, 2011, respectively, we owned approximately 12,071 and 32,027 head of cattle — other than our cows used for the production of raw dairy — which we fattened for sale to meat processors and in local livestock auction markets and for calving.
Cattle products generated $0.1 million in sales, or 74.6% of our total sales, in fiscal year 2009, $0.4 million in sales, or 22.3% of our total sales, in fiscal year 2010 and $2.7 million in sales, or 43.3% of our total sales, in the nine months ended March 31, 2011. We did not derive any revenues from sales of cattle products in fiscal year 2008.
The following table indicates, as of the periods indicated, the number of cattle (other than dairy cows) we owned:
| As of June 30, 2009 | As of June 30, 2010 | As of March 31, 2011 | ||||||||||||||
Cows | 2,196 | Cows | 5,856 | Cows | 12,877 | |||||||||||
Steers | 17 | Steers (>3 years old) | 367 | Steers (>3 years old) | 2,166 | |||||||||||
Heifers (>2 years old) | 499 | Heifers (>2 years old) | 13 | Heifers (>2 years old) | 2,746 | |||||||||||
Heifers (1 to 2 years old) | 873 | Steers (<3 years old) | 1,504 | Steers (<3 years old) | 422 | |||||||||||
Calves | 1,291 | Heifers (1 to 2 years old) | 1,445 | Heifers (1 to 2 years old) | 4,889 | |||||||||||
Bulls | 76 | Calves | 2,677 | Calves | 8,596 | |||||||||||
| Bulls | 209 | Bulls | 331 | |||||||||||||
Total | 4,952 | Total | 12,071 | Total | 32,027 | |||||||||||
Our cattle meat products are currently exported by third parties to Russia, the EU, the United States, Mexico, Canada, Israel, Venezuela and China. Our live cattle products are currently exported by third parties to Turkey, Lebanon, Jordan, Egypt and Brazil.
In October 2010, we completed the implementation of a mandatory program of the Uruguayan Ministry of Agriculture, or the UMA, to individually identify cattle. This program requires the individual identification of all cattle by using tags with an electronic chip. This system will permit the tracing of every single head of cattle in Uruguay from the final product back to the animal’s birth through an Internet-based database. This traceability system is unique in South America and is expected to result in Uruguay becoming the first country in the world to have 100% of its cattle herd individually identified. We believe that this will be a key factor in differentiating Uruguayan beef in the international market and will allow Uruguayan beef to reach higher price levels.
Sheep
We began production of sheep products in fiscal year 2009. We have two main objectives in our sheep production:
| • | Wool production. Wool is commercialized according to its specific fineness. The majority of wool we produced is medium fineness wool, which is between 21.5 to 21.9 micras, and suitable for different textile |
88
Table of Contents
products. Medium fineness wool is exported as a high-quality wool because the animals used to produce it are purebred; and |
| • | Meat production.Lamb production over artificial pastures for export is a leading economic advantage of the sheep farms. |
Over 80% of our sheep population is of the Australian Merino breed. We have chosen to grow the Australian Merino because of its potential to produce fine wool and also because its wool is in high demand and higher value in the international market. We breed sheep not only for their fine wool but also for their extremely valuable meat in the international markets. Recently, Uruguay has obtained permission to access the United States market with its lamb meat.
Our main production segments for sheep are:
| • | weaned lambs that are designated for ovine meat production; |
| • | fine wool (Australian Merino) from general herds; and |
| • | herd replacement (female lambs). |
We have acquired approximately 7,737 hectares of grazing land located in Salto and Paysandú for our sheep. As of June 30, 2010 and March 31, 2011, respectively, we owned approximately 6,941 and 14,503 head of sheep.
The following table indicates, as of the periods indicated, the number of head of sheep we owned:
| As of June 30, | As of June 30, | As of March 31, | ||||||||||
| 2009 | 2010 | 2011 | ||||||||||
Rams | 132 | 148 | 240 | |||||||||
Sheep | 3,151 | 4,216 | 8,151 | |||||||||
Wethers | 286 | 337 | 2,505 | |||||||||
Lambs | 1,249 | 2,240 | 3,607 | |||||||||
Total | 4,818 | 6,941 | 14,503 | |||||||||
Sales of our live sheep generated $23,338, or 11.7% of our total sales, in fiscal year 2009. We did not derive any revenues from sales of live sheep products in fiscal year 2008 or fiscal year 2010. Sales of our live sheep generated $196,698, or 3.2% of our total sales, in the nine months ended March 31, 2011. Our live sheep products are currently exported by a third party to Egypt, Jordan, the United Arab Emirates and Brazil.
Sales of our wool products generated $83,864, or 5.3% of our total sales in fiscal year 2010, and generated $99,518, or 1.6% of our total sales in the nine months ended March 31, 2011. We did not derive any revenues from sales of wool products in fiscal year 2008 or fiscal year 2009. Our wool products are currently exported by a third party to China, Italy and Germany.
We did not derive any revenues from sales of lamb meat products in fiscal year 2008, fiscal year 2009, fiscal year 2010 or the nine months ended March 31, 2011.
Crops
Our crop production began in fiscal year 2010 and consists of soybeans and wheat, which we grow on a total area of approximately 4,511 hectares as of March 31, 2011. Uruguay has rich soil that is suitable for crop production. The crop produced depends on the soil selected. Climate in Uruguay is very mild and there are four defined seasons. Winter is sufficiently cold to ensure good wheat and barley production and summer crops can be developed without irrigation. One of the distinctive characteristics of farming in Uruguay is the ability to double-
89
Table of Contents
crop each year and crop rotation is very common. Crops involved in each rotation are variable and depend on seasonal behavior and relative prices. A common rotation involves wheat in winter and soybeans in summer.
Variable percentages of the total production of each crop are exported to different countries each year. Our crops are currently exported by third parties to Brazil, China, Peru, the United Kingdom and Holland.
Soybeans
The western part of Uruguay, located next to the Uruguay River, is the most important area for our soybean production. As of March 31, 2011, approximately 3.5% of our land was allocated to soybean production.
In the 2010 harvest year, we planted a total area of 1,163 hectares of soybeans, producing a total of 1,588 tonnes representing 20.2% of our total crop production.
Wheat
In the 2010 harvest year, we planted a total area of approximately 2,088 hectares of wheat, producing a total of 6,220 tonnes of wheat representing 79.8% of our total crop production.
We recognized $9,617 of sales in our crops segment, or 0.6% of our total sales, in fiscal year 2010 due solely to consideration we received in exchange for a crops harvest service rendered. We did not sell any crops in fiscal year 2008, fiscal year 2009 or fiscal year 2010. Crops generated $2,143,597 in sales, or 34.5% of our total sales, in the nine months ended March 31, 2011.
Rice
We began our rice production in fiscal year 2010. The eastern states of Uruguay bordering Brazil have deep soil with high clay concentration and abundant water for irrigation, and we have dedicated this area to rice production. The entirety of our rice production is under irrigation and more than 95% of the rice harvested in Uruguay is exported. Our rice is currently exported by third parties to Brazil, Iran, Peru, Iraq, the United States, Turkey and Spain. Rice sowing begins in mid-October when soil moisture and temperature reach the optimum conditions for machines to operate and for the seeds to germinate adequately.
In the 2010 harvest year, we planted a total area of 664 hectares of rice, producing a total of 4,664 tonnes of rice.
Rice generated $1,123,383 in sales, or 71.1% of our total sales in fiscal year 2010, and $866,763 in sales, or 14.0% of our total sales, in the nine months ended March 31, 2011. We did not derive any revenues from sales of rice in fiscal year 2008 or fiscal year 2009.
Dairy
We also produce dairy products from our cattle. In August 2010, UAG’s first dairy farm successfully started its dairy production after a new milking shed with a capacity of 500 cows was built at our Yaguarí property.
As of June 30, 2010, we owned a dairy herd of 568 head, and we started milking an average of 140 cows and heifers in August 2010. Our dairy operations consist of one dairy facility. In an increasingly competitive global market, we believe that factors such as grass-feeding and high quality control standards will increase demand for our dairy products.
90
Table of Contents
The following table sets forth, as of the dates indicated, the total number of our dairy cows and bulls:
| June 30, 2010 | March 31, 2011 | |||||||
Cows | 2 | 142 | ||||||
Heifers (1 to 2 years old) | 250 | 29 | ||||||
Heifers (>2 years old) | 259 | 500 | ||||||
Calves | 55 | 294 | ||||||
Bulls | 2 | 1 | ||||||
Total | 568 | 966 | ||||||
Dairy products generated $116,203 in sales, or 1.9% of our total sales, in the nine months ended March 31, 2011. We did not derive any revenues from sales of dairy products in fiscal year 2008, fiscal year 2009 or fiscal year 2010.
We began exporting our dairy products through third parties to Venezuela, Brazil and Mexico during fiscal year 2011.
Others
Blueberries
As of March 31, 2011, UAG had four established blueberry plantations totaling approximately 40 hectares. We allow the fruit to be well-ripened before being picked. The fruits are hand-harvested and placed in specialized containers, or wencos. The production process is labor intensive, with a preparatory phase in September followed by the harvest months given that a higher number of employees need to be in the fields during harvest. The wencos are weighed and immediately cooled and remain cooled until the product reaches the consumer and are put together in pallets which are sent to a packaging plant to be classified. Finally, they are exported and sold to the consumer.
UAG has entered into an agreement for a strategic alliance with blueberry exporter Tecnovital S.A. whose main shareholder is Vitalberry Marketing Chile. Through this strategic alliance, UAG seeks to optimize the quality, logistics and distribution aspects of the blueberry export process.
In the 2008 harvest year, we planted a total area of approximately 40 hectares of blueberries, producing a total of 20.7 tonnes of blueberries, which were harvested in October and November 2008. In the 2009 harvest year, we planted a total area of approximately 40 hectares of blueberries, but were unable to produce blueberries due to a significant winter storm that damaged our blueberry bushes. In the 2010 harvest year, we planted a total area of approximately 40 hectares of blueberries, producing a total of 37 tonnes of blueberries.
Blueberries generated $23,464, or 11.8% of our total sales in fiscal year 2009, which were derived from the production obtained during the 2008 harvest year, and generated $82,164, or 1.3% of our total sales in the nine months ended March 31, 2011. We did not derive any revenues from sales of blueberries in fiscal year 2008 or fiscal year 2010.
Our blueberries are currently exported by third parties to Germany, Holland, the United Kingdom, Hong Kong, the United States and Canada.
Apiculture
Apiculture generates revenue from the sale of honey. We strive to accomplish the highest quality standards in honey, propolis and pollen production.
91
Table of Contents
We provide nutritional supplementation to our beehives in order to boost their growth and pollination capacity. Historically, our beehives were located within our blueberry properties. We have started to allocate beehives to our properties in the Province of Tacuarembó. Beehives that have been installed at Villa Lucero and Yaguarí are undergoing their development process and we expect that they will continue to grow.
Our apiculture products generated $3,905 of sales, or 2.0% of our total sales, in fiscal year 2009, $11,808 of sales, or 0.7% of our total sales, in fiscal year 2010 and $8,514 of sales, or 0.1% of our total sales, in the nine months ended March 31, 2011. We did not derive any revenues from sales of apiculture products in fiscal year 2008.
Our apiculture products are currently exported by third parties to Germany, Holland, the United Kingdom and the United States.
Marketing, Sales and Distribution
We sell our agricultural products at the farms where the products are grown. Transportation of the products may be arranged either by our customers or by us; however, our customers bear the risk of loss during transportation.
Crops
In Uruguay, local prices are based on export parity pricing (or net proceeds per unit from export sales) during harvest, and import parity pricing (or the opportunity cost of a unit of an imported substitute good) for post-harvest sales, which, in each case, takes into account market prices and costs. Prices are quoted in relation to the month of delivery and the port to which the product will be delivered. Special conditions that affect pricing, such as the terms of storage and shipment, are negotiated with the end buyer. We negotiate sales with leading traders and industrial companies in our markets. Local prices are based on international prices and generally reflect a discount to the Chicago Mercantile Exchange price.
We store our soybeans and wheat in storage plants near the growing fields. Once harvested, the soybeans and wheat remain in storage until we believe that market conditions are appropriate for sale. We may also use brokers to purchase our production and enter into agreements with buyers. We typically contract to receive payment within one week after the sale.
Our soybeans and wheat are currently exported by third parties to international markets, including Brazil, China, Peru, Holland and the United Kingdom.
Rice
We have an agreement with SAMAN, the leading rice exporter in Uruguay, which is negotiated on an annual basis. Pursuant to that agreement, we sell our entire rice production to SAMAN at a stipulated price, which reflects a negotiated price between the industry and the local association of rice growers, Asociación Cultivadores de Arroz, taking into account the export price of rice from Uruguay to international markets as a primary reference.
Our rice products are currently exported by third parties to international markets, including Brazil, Iran, Peru, Iraq, the United Kingdom, Turkey and Spain. The most important destination for our rice exports is Brazil.
Dairy
We are a member of and sell our dairy products exclusively to CONAPROLE, the leading dairy cooperative, a major dairy exporter and a price reference company in Uruguay. Through our membership in the
92
Table of Contents
cooperative, we have the right to sell our milk production to CONAPROLE at an established price in accordance with the international market. In exchange for such right, we have the obligation to deliver all of our milk production to the cooperative and to pay the cooperative’s fee.
Cattle
We have two marketing channels for our cattle products.
We sell part of our cattle directly to local slaughterhouses. We have an agreement with Frigorífico Tacuarembó, one of the leading slaughterhouse companies in Uruguay, to buy our products with reference to the price provided by Instituto Nacional de Carnes, or INAC, which promotes and regulates the export of cattle and beef products in Uruguay, and is based on international prices. Our beef products are currently exported by third parties to Russia, the EU, the United States, Mexico, Canada, Israel, Venezuela and China.
We also sell live cattle for export by third parties to certain markets, including Brazil, Turkey, Lebanon, Jordan and Egypt. Generally, the live cattle we sell weigh less than the cattle destined for local slaughterhouses, but are sold at a higher price per measure of weight.
Sheep
We are a member of CLU, and sell all of the wool produced on our farms to CLU. We believe that our agreement provides us with better prices for the higher quality wool, particularly at the peak of the season. Through our membership in the cooperative, we have the right to sell all of our wool production to CLU at an average price based on international prices, which is different for each category of wool. We believe selling at average prices protects us against the high volatility of wool prices. In exchange for such right, we have the obligation to deliver all of our wool production to the cooperative and to pay the cooperative’s fee.
We typically sell heavy lamb for meat at the best available market price, either by entering into a sales program with CLU, or by selling to local slaughterhouses at the best available price.
Other
Blueberries: We sell fresh blueberries to brokers who in turn sell the product primarily to European markets. We negotiate terms and prices with individual fruit exporters. Our blueberry fields are GlobalG.A.P. certified, a prerequisite for exporting blueberry products. Typically, our last blueberry shipment takes place at the end of the year, and we generally receive payments for our products within 60 days of their shipment.
Apiculture:Honey is the only apiculture product that we sell. We negotiate prices with local exporters based on international import parity prices. Honey may be stored for relatively long periods of time, during which we seek to negotiate favorable pricing for the product.
93
Table of Contents
Farmland Overview
We have acquired approximately 84,670 hectares of agricultural land in Uruguay for our operations.
The following map shows the location of our farmland and other key information:
UAG’s acquired farmland as of July 13, 2011
($ in millions)
We have executed purchase promise agreements, orpromesas, instead of definitive purchases, orcompraventas definitivas,which grant legal title to the land, to acquire our rural land in Uruguay. We have fully paid for all of our farmlands acquired underpromesas. Apromesa is completed, and legal title is transferred, when we execute a final purchase agreement, orescritura, which is legally equivalent to acompraventa definitiva.
Under Uruguayan law, only individuals and companies having registered shares held by individuals can be owners of rural real estate and land operations in Uruguay. Because we acquire land through our subsidiaries whose shareholders are not individuals, we are prevented from executing anycompraventa definitivaor using the land without obtaining prior governmental authorization. See “Regulatory and Environmental Overview–Sale and Ownership of Real Estate” and “Regulatory and Environmental Overview–Rural Real Estate” for more details.
94
Table of Contents
We have requested several authorizations to obtain title based on the Productive Project Exception.
In 2008, we applied for governmental authorizations based on the Productive Project Exception to own the 188 hectares of land acquired by our subsidiaries Boisy S.A., Vadolmar S.A., Madalux S.A. and Nogatir S.A, or the First Productive Project. We obtained governmental authorizations in December 2009 and we have executedescriturasto own the land in the First Productive Project.
In October 2009, we applied for, and as of May 5, 2011 have received, governmental authorizations based on the Productive Project Exception to obtain title to the 17,846 hectares of land held underpromesas acquired by our subsidiaries Rafilur S.A., Aguacare S.A., Canteras Doradas S.A. and UAG S.A., or the Second Productive Project.
In March 2011, we applied for governmental authorizations to obtain title based on the Productive Project Exception with respect to 51,081 hectares of land acquired by our subsidiaries Alto Lucero S.A., UAG S.A., Madalux S.A. and Rafilur S.A., or the Third Productive Project. In May and June of 2011, we applied to increase the hectares under the Third Productive Project to 66,645 hectares. The authorization for the Third Productive Project is currently pending and there is no fixed timing for the government to grant such authorization. We expect the process to take approximately 12 to 16 months from initial application.
Most of our subsidiaries that hold land underpromesas are not using the land themselves. Instead, until June 22, 2011, the land underlying suchpromesas was being used by UAG S.A., another of our wholly-owned subsidiaries, pursuant to intercompany agreements under Uruguayan law known as “comodatos,” between each of our subsidiaries holding land underpromesas and UAG S.A. On June 22, 2011, thecomodatoswith UAG S.A. were terminated and newcomodatoswere entered into between each of our subsidiaries holding land underpromesas and Boisy S.A., another of our wholly-owned subsidiaries. See “—Material Agreements—Comodatos.” We entered into these newcomodatosbecause Boisy S.A. had already received authorization to use land in the past and, in accordance with Decrees Nos. 225/07 and 201/08, we believe it should be able to obtain governmental authorization to use such lands under the Expedited Process, as described below.
On June 22, 2011, Boisy S.A. applied for governmental authorization to continue using 64,505 hectares of our land held underpromesas. On June 23, 2011, the executive branch of the Uruguayan government issued a decree confirming that companies such as Boisy S.A. that had properly applied to obtain authorization could continue to use the land pending government determination of their applications. We expect to obtain this authorization 30 business days after the date we made the application, although there can be no assurance that the government will not deny the application. In the event the government denies Boisy S.A.’s application under the Expedited Process, processing will continue with the standard authorization under the Third Productive Project. We fully expect that Boisy S.A. will receive the authorization. See “Regulatory and Environmental Overview—Sale andOwnership of Real Estate” and “Regulatory and Environmental Overview—Rural Real Estate” for more details.
As a result of our intercompany transactions wherein our subsidiaries holding land underpromesashave granted the right to use such land to other of our wholly-owned subsidiaries, we are in compliance with all applicable law. Consequently, there are no limitations on our use of lands for which governmental authorizations have not yet been granted, and accordingly, we do not expect that any substantive economic benefits will accrue to us upon obtaining legal title to such lands.
We believe that our business project contributes to the productivity of Uruguay, the creation of jobs, production of exportable commodities, incorporation of technology and other beneficial aspects, which are all factors in the determination of a Productive Project Exception. We believe that because of past precedents and the merits of our projects, we will obtain a Productive Project Exception for the Third Productive Project. After we have received such authorization, we will proceed with the execution of theescriturato obtain title to such land.
95
Table of Contents
In some cases, anescritura can be executed immediately after receipt of governmental authorization. In other cases it can only be executed after obtaining a tax certificate. In some cases, we have the seller’s power of attorney to execute an escritura on the seller’s behalf. In other cases we require the seller to execute an escritura. If the seller does not execute the escritura when requested, the escritura will be executed judicially. The entire process should take no longer than seven months.
We are still in the process of acquiring additional rural land. Any rural land that we acquire in the future will require governmental authorization in order for us to execute acompraventa definitiva and to use such land. Any acquisitions of rural land by our subsidiaries that have already obtained governmental authorization will be able to apply for authorizations under the Expedited Process in case the acquired land is used for the purposes of the First Productive Project (blueberry plantations) or the Second Productive Project (crops, cattle, sheep, rice, dairy). The expiration of the Compliance Period on June 30, 2011 does not have an impact on our ability to acquire additional land underpromesas. Should we wish to, we will be able to continue acquiring land underpromesas. However, as a result of the expiration of the Compliance Period, we will be required to obtain authorization to use land held underpromesasbefore we may use such land. We expect that, in the future, prior to acquiring land under apromesaor under acompraventa definitiva, we will, as a condition to entering into any suchpromesaorcompraventadefinitiva, obtain governmental authorization under the expedited process to permit us to obtain title to, and use of, such land. In addition, because after the completion of this offering our common shares will be listed on the NYSE, we will be able to apply for authorization based on the Public Company Exception. Upon the completion of this offering, we intend to submit an application for governmental authorization to obtain title to, and use of, our lands held underpromesas under the Public Company Exception. We fully expect that we will receive such authorizations within 12 to 16 months following our application.
See “Risk Factors—Risks Related to Our Business and Industries—If we do not obtain governmental authorizations with respect to all of our lands, we could lose the rights to the use and the economic benefits of such lands” and “Risk Factors—Risks Related to Our Business and Industries—Our title to our farmland may have defects or may not be valid”for risks associated with our farmland.
Our farmland is not subject to any liens or other encumbrances, other than such encumbrances that arise in the ordinary course of business or by operation of law.
In April 2011, in order to assess the market value of rural properties in Uruguay, we retained Deloitte S.C., an independent real estate valuation firm knowledgeable about the agriculture industry and the local real estate market, to conduct an appraisal of our land portfolio. We have acquired 15,513 hectares of land since we retained Deloitte S.C., of which 13,539 were not subject to appraisal. As part of these appraisals, the value of approximately 85% of our properties was determined using the sales comparison approach and the income approach. The sales comparison approach analyzes the prices that buyers have recently paid for properties comparable to a subject property, adjusted for the differences between such comparable properties and the subject property, in order to arrive at an estimate of the value of the subject property. The income approach takes into account the net present value of estimated rental income that could be generated from each property.
The above mentioned appraisals assumed that we had the ability to sell or lease our rights to the subject properties free and clear of all liens and encumbrances. The appraisals do not take into account the impact of taxes. The appraisals are done on a property-by-property basis and assume that the sale or lease of any property could be accomplished in an orderly manner. Neither the sales comparison approach nor the income approach takes into account the need to sell or lease multiple properties, or that any sale or lease may need to be completed on an expedited basis, either of which circumstances could have an adverse impact on the prices that could be realized. The appraisals did not include site measurements and no surveys of the subject properties were undertaken. In addition, the valuations also assumed (a) responsible ownership and competent management of the subject properties, (b) that there were no hidden or unapparent conditions of the subject properties, subsoil or structures that would render the subject properties more or less valuable, (c) full compliance with all applicable zoning and environmental regulations and laws and (d) that all required licenses, certificates of occupancy and
96
Table of Contents
other governmental consents were or can be obtained and renewed for any use on which the value opinion contained in the appraisals is based. Unless otherwise stated in the appraisals, the existence of potentially hazardous or toxic materials that may have been used in the construction or maintenance of the improvements or may be located at or about the subject properties was not considered in arriving at the opinion of value. Such materials (such as formaldehyde foam insulation, asbestos insulation and other potentially hazardous materials) could adversely affect the value of the subject properties.
These appraisals were intended to provide an indicative approximation of the market value of our land holdings as of April 30, 2011. The information contained in the appraisals is subject to change based on a host of variables and market conditions. Therefore, the appraisals are provided solely to better enable an evaluation of the market value of our land portfolio and are not intended to provide an indication of the sale price of such properties. The table below sets forth, among other things, the result of the above mentioned appraisals:
| Name, Location | Hectares | Date Acquired | Purchase Price(1) | Appraised Value - Sales Comparison Approach (2) | Appraised Value - Income Approach (2) | Uses | Ownership Status | |||||||||||||||||||||
Casco Patricio, Maldonado | 787 | Nov 4, 2008 | $ | 2,846,859 | $ | 5,099,360 | $ | 1,318,800 | Cattle | P-1 | ||||||||||||||||||
Extension of Casco Patricio, Maldonado | 92 | Mar 23, 2010 | $ | 359,736 | P-2 | |||||||||||||||||||||||
La Verónica, Salto | 7,284 | Dec 3, 2008 | $ | 12,112,106 | $ | 21,133,435 | $ | 21,862,174 | Cattle and sheep | P-1/P-2 | (3) | |||||||||||||||||
San Francisco, Rivera | 3,601 | Oct 22, 2009 | $ | 11,164,846 | $ | 16,564,600 | $ | 17,644,900 | | Soybeans, wheat, rice and cattle | | P-1 | ||||||||||||||||
La Pipa, Cerro Largo | 2,666 | Oct 26, 2009 | $ | 4,700,000 | $ | 7,999,371 | $ | 8,799,308 | | Soybeans, rice and cattle | | P-1 | ||||||||||||||||
Yaguarí, Tacuarembó | 4,028 | Oct 26, 2009 | $ | 16,915,837 | $ | 18,462,497 | $ | 18,033,136 | | Soybeans, wheat, rice, cattle and dairy | | P-1 | ||||||||||||||||
Extension of Yaguarí, Tacuarembó | 265 | Feb18, 2011 | $ | 993,221 | P-2 | |||||||||||||||||||||||
El Tinto, Tacuarembó | 1,597 | Nov 9, 2009 | $ | 4,709,997 | $ | 6,868,065 | $ | 6,708,344 | | Soybeans, wheat, rice and cattle | | P-1 | ||||||||||||||||
Villa Lucero, Tacuarembó | 9,002 | Apr 15, 2010 | $ | 36,405,127 | $ | 36,912,240 | $ | 33,311,046 | | Soybeans, wheat, rice and cattle | | P-2 | ||||||||||||||||
Las Acacias, Tacuarembó | 2,144 | May 28, 2010 | $ | 4,503,313 | $ | 6,004,431 | $ | 5,789,987 | | Soybeans, wheat, rice and cattle | | P-2 | ||||||||||||||||
San Luis, Rivera | 2,897 | May 28, 2010 | $ | 11,500,161 | $ | 13,325,280 | $ | 16,511,760 | | Soybeans, wheat, rice and cattle | | P-2 | ||||||||||||||||
Arroyo Blanco, Rivera | 3,611 | July 26, 2010 | $ | 14,565,161 | $ | 14,805,100 | $ | 15,527,300 | | Soybeans, wheat and cattle | | P-2 | ||||||||||||||||
Itacabó, Paysandú | 7,065 | Sep 9, 2010 | $ | 13,600,036 | $ | 19,073,880 | $ | 18,367,440 | Cattle and sheep | P-2 | ||||||||||||||||||
El Rincon, Tacuarembó | 4,135 | Dec 2, 2010 | $ | 9,655,911 | $ | 16,127,370 | $ | 15,713,848 | | Soybeans, wheat, rice and cattle | | P-2 | ||||||||||||||||
97
Table of Contents
| Name, Location | Hectares | Date Acquired | Purchase Price (1) | Appraised Value - Sales Comparison Approach (2) | Appraised Value - Income Approach (2) | Uses | Ownership Status | |||||||||||||||||||||
Merín, Treinta y Tres | 12,134 | Dec 7, 2010 | $ | 38,333,039 | $ | 50,964,423 | $ | 48,537,546 | Rice and cattle | P-2 | ||||||||||||||||||
Melo, Cerro Largo | 207 | | Dec 08, 2010 | | $ | 888,838 | $ | 891,208 | $ | 891,208 | | Soybeans, wheat and cattle | | P-2 | ||||||||||||||
La Beba, Paysandú | 5,220 | Jan 19, 2011 | $ | 23,259,763 | $ | 23,489,962 | $ | 22,967,963 | | Soybeans, wheat and cattle | | P-2 | ||||||||||||||||
Sarmento, Rivera | 980 | Feb 17, 2011 | $ | 4,040,866 | $ | 4,413,532 | $ | 5,296,238 | | Soybeans, wheat and cattle | | P-2 | ||||||||||||||||
Colonia Palma, Artigas | 1,212 | Mar 4, 2011 | $ | 3,446,659 | $ | 4,052,084 | $ | 4,886,337 | Rice and cattle | P-2 | ||||||||||||||||||
El Castillo, Salto | 1,974 | Apr 6, 2011 | $ | 6,316,800 | $ | 6,911,308 | $ | 7,306,239 | Cattle | P-3 | ||||||||||||||||||
Total | 70,901 | $ | 220,318,276 | $ | 273,098,146 | $ | 269,473,573 | |||||||||||||||||||||
| (1) | Purchase price includes only land. |
| (2) | Values of land (excluding improvements) as of April 30, 2011 based on the Deloitte S.C. Appraisal of Real Estate Report, dated as of May 17, 2011. |
| (3) | Governmental authorization to obtain title received for 5,167 hectares (P-1). The application for governmental authorization to obtain title was submitted on March 31, 2011 for 2,117 hectares (P-2). |
| T – Title to land received. |
| P-1 – Land held underpromesa and governmental authorization to obtain title received. Title to land expected to be received by December 31, 2011. |
| P-2 – Land held underpromesa. Application for governmental authorization to obtain title made on March 31, 2011 and governmental authorization expected to be received within 12 to 16 months thereafter. Title to land expected to be received within seven months of receipt of governmental authorization. |
| P-3 – Land held underpromesa. Application for governmental authorization to obtain title expected to be made by September 2011, and governmental authorization expected to be received within 12 to 16 months thereafter. Title to land expected to be received within seven months of receipt of governmental authorization. |
The following properties were not included in the appraisal by Deloitte S.C.:
| Name, Location | Hectares | Date Acquired | Purchase Price(1) | Uses | Ownership Status | |||||||||||||||
Montekristo Blueberry, Canelones | 34 | Apr 14, 2008 | $ | 80,180 | Blueberries | T | ||||||||||||||
Vadomar, Canelones | 91 | Apr 14, 2008 | $ | 269,841 | Blueberries | T | ||||||||||||||
Arándanos del Fortín, Canelones | 22 | June 3, 2008 | $ | 112,798 | Blueberries | T | ||||||||||||||
Arándanos del 41, Canelones | 41 | June 3, 2008 | $ | 250,090 | Blueberries | T | ||||||||||||||
Paso de Arriera, Cerro Largo | 1,997 | Apr 28, 2011 | $ | 5,991,000 | Cattle | P-3 | ||||||||||||||
Aldea San Joaquin, Tacuarembó | 2,816 | May 2, 2011 | $ | 8,449,078 | Crops and cattle | P-3 | ||||||||||||||
La Victoria, Paysandú | 4,795 | May 12, 2011 | $ | 18,800,000 | Crops and cattle | P-3 | ||||||||||||||
El Pantanoso, Cerro Largo | 3,013 | May 16, 2011 | $ | 9,039,492 | Rice and cattle | P-3 | ||||||||||||||
La Quemada, Treinta y Tres | 918 | June 2, 2011 | $ | 2,755,065 | Cattle and sheep | P-3 | ||||||||||||||
Extension of Casco Patricio, Maldonado | 42 | June 17, 2011 | $ | 375,000 | Cattle | P-3 | ||||||||||||||
Total | 13,769 | $ | 46,122,544 | |||||||||||||||||
| (1) | Purchase price includes only land. |
98
Table of Contents
| T – Title to land received. |
| P-3 – Land held underpromesa. Application for governmental authorization to obtain title expected to be made by September 2011, and governmental authorization expected to be received within 12 to 16 months thereafter. Title to land expected to be received within seven months of receipt of governmental authorization. |
We decide the appropriate product mix for each of our fields by analyzing agricultural properties of the soil, weather conditions of the region and expected returns of each product, with a view to maximizing profitability.
Our farmland is operated by an experienced management team. We plan to continue improving returns of our business through efficient and profitable operations, leveraging important economies of scale. With the acquisition of further properties, we expect to achieve larger economies of scale in addition to more efficient administration of our operations. For this purpose, one of our priorities is to maintain our position as a top farmland holder in Uruguay.
The following sets forth land acquisitions for which we have signed contracts (boletos de reserva) to purchase and which we expect to complete with cash on hand.
| Name of Farmland, and | Hectares | Purchase Price | Uses | Expected Date | ||||||||||
| Location | (millions) | of Closing | ||||||||||||
La Pradera MSU, Rivera | 1,400 | $ | 6.4 | Soybeans, wheat and cattle | July 31, 2011 | |||||||||
San Francisco MSU, Rivera | 3,000 | $ | 13.6 | Soybeans, wheat and cattle | July 31, 2011 | |||||||||
Sanchez Varela, Treinta y Tres | 2,401 | $ | 10.0 | Rice and cattle | Dec 31, 2011 | |||||||||
La Quemada, Treinta y Tres | 918 | $ | 2.8 | Soybeans, wheat and cattle | July 31, 2011 | |||||||||
Total | 7,719 | $ | 32.8 | |||||||||||
In addition to managing farmland that we acquired, we plan to increase the returns of our business by operating leased farmland, located adjacent to our existing lands. We expect to achieve higher returns by leveraging from existing equipment and infrastructure, with minimum additional investments.
We plan to opportunistically lease farmland located in close proximity to our existing operations and plan to dedicate such farmland mainly to the production of soybeans and wheat, through a double cropping system.
Our leased farmlands represent less than 1% of the farmland that we operate.
For additional information regarding our property, plant and equipment and land underpromesas, see notes 5, 7 and 8 of our Audited Consolidated Financial Statements and notes 4, 6 and 7 to our Audited Interim Consolidated Financial Statements.
Corporate Structure
We were originally incorporated as Weitvil Holdings Inc. on January 2, 2008 in BVI under the BVI Business Companies Act as a company limited by shares. On June 9, 2008, we changed our name under the BVI Business Companies Act to Union Agriculture Group Corp. Our registered office is at Vanterpool Plaza, 2nd floor, Wickhams Cay I, Road Town, Tortola, British Virgin Islands. Our principal executive office is at Plaza Independencia 737 – 11000, Montevideo, Uruguay, +598 2900-0000.
Our main activity is acquiring and developing agricultural land in Uruguay and engaging in agricultural, livestock, dairy, blueberry and apiculture operations. We and our subsidiaries have the common objective of investing in and operating in the agriculture business. Our subsidiaries are composed of landholding entities and operational companies that effectively utilize our farmlands.
99
Table of Contents
As of March 31, 2011, UAG has the following subsidiaries, all of which are 100% directly owned by UAG:
| Subsidiary | Country of Incorporation | |
Nogatir S.A. | Uruguay | |
Madalux S.A. | Uruguay | |
Vadolmar S.A. | Uruguay | |
Boisy S.A. | Uruguay | |
Rafilur S.A. | Uruguay | |
Union Agriculture Group S.A. | Uruguay | |
Canteras Doradas S.A. | Uruguay | |
Aguacare S.A. | Uruguay | |
Alto Lucero S.A. | Uruguay |
History
We were formed in January 2008 to acquire and develop agricultural land in Uruguay. Through a series of corporate transactions, UAG held 188 hectares of land at the end of fiscal year 2008.
In fiscal year 2009, we acquired two additional properties totaling 8,163 hectares of farmland at a total purchase price of $15.3 million. These properties were suitable for cattle and sheep production.
In fiscal year 2010, we acquired an additional 25,935 hectares of farmland at a total purchase price of $89.9 million, giving us a total of 34,286 hectares of land acquired. The significant increase in the average price per hectare we paid for farmland purchased in fiscal year 2010 compared to fiscal year 2009 was primarily due to differences in the type of farmland we purchased. Substantially all of the farmland we purchased in fiscal year 2009 is suitable only for cattle grazing, whereas substantially all of the farmland we purchased in fiscal year 2010 is suitable for both crop production and cattle grazing. Farmland that is suitable for both crop production and cattle grazing generally sells at a substantial premium to farmland suitable only for cattle grazing. Consequently, the average price per hectare we paid in fiscal year 2010 was higher than the price paid in fiscal year 2009.
In the nine months ended March 31, 2011, we acquired an additional 34,829 hectares of farmland held underpromesas at a total purchase price of $108.8 million, giving us a total of 69,115 hectares of land acquired.
As of the date of this prospectus, we had acquired approximately 84,670 hectares of farmland since our formation 2008.
We have raised capital through four private placements. In July 2008, we issued 8,095,201 common shares, at Cdn$8.40 per share, for aggregate net proceeds of $63.2 million. Each of the common shares that were issued in July 2008 had a right attached entitling the holder to receive one-tenth of one common share for each common share held in the event that we did not complete an initial public offering or a reverse take-over transaction which resulted in our common shares being listed on the Toronto Stock Exchange or the TSX Venture Exchange before July 22, 2009. In June 2009, we issued 2,635,528 common shares, at $8.40 per share, for aggregate net proceeds of $20.5 million. In July 2009, we issued 809,519 common shares, for no additional consideration, pursuant to an automatic conversion of the rights issued in July 2008. In September 2009, we issued 3,653 common shares, at $8.40 per share, upon the exercise of pre-emptive rights, for aggregate net proceeds of $30,683. In March 2010, we issued 11,217,616 common shares, at $10.20 per share, for aggregate net proceeds of $107.9 million and 41,667 common shares upon the exercise of stock options having an exercise price of $6.00 per share for aggregate net proceeds of $0.3 million. In May 2010 we issued 98,040 common shares, at $10.20 per share, upon the exercise of pre-emptive rights, for aggregate net proceeds of $1.0 million. In July 2010, we issued 281,249 common shares upon the exercise of broker compensation options having an exercise price of $8.40 per share for aggregate net proceeds of $2.3 million. In December 2010 and January 2011, collectively, we issued 12,390,510 common shares, at $13.20 per share, for aggregate net proceeds of $155.0 million. In February 2011, we issued
100
Table of Contents
114,028 common shares, at $13.20 per share, upon the exercise of pre-emptive rights for aggregate net proceeds of $1.5 million. In addition, we granted broker compensation options to certain agents participating in these private placements. We issued 374,999 broker compensation options having an exercise price of Cdn$8.40 per share in July 2008, 131,777 broker compensation options having an exercise price of $8.40 in June 2009 and 560,792 broker compensation options having an exercise price of $10.20 per share in March 2010. Such options vested immediately on the grant date and are exercisable over a two-year period. In April 2011, we issued 117,317 common shares, at $8.40 per share, upon the exercise of stock options for an aggregate purchase price of $1.0 million, and we issued 18,693 common shares, at $8.40 per share, upon the exercise of broker compensation options for an aggregate purchase price of $0.2 million. In June 2011, we issued 93,136 common shares, at $8.40 per share, upon the exercise of broker compensation options for an aggregate purchase price of $0.8 million.
On June 12, 2011, we established the Union Agriculture Group Corp Equity Incentive Plan, which provides for the grant of incentive stock options, nonstatutory stock options, restricted stock, stock appreciation rights, restricted stock units, performance units and performance shares of our company. See “Management—Union Agriculture Group Corp Equity Incentive Plan.”
From our inception through June 30, 2008, our operations consisted primarily of less than 200 hectares of undeveloped blueberry plantations. Our commercial activity during that period was minimal with no sales recorded. During fiscal year 2009, we diversified our business to include cattle and sheep operations as well as added colonies of bees for the production of honey. During fiscal year 2010, we added crops and rice to our production, and purchased dairy cattle that commenced production in August 2010.
During the nine months ended March 31, 2011, we entered into short-term operating leases of Arroyo Blanco and Merín farmlands in connection with, and to facilitate, the sale of such lands to us. In each case, we granted a short-term lease to the selling party because such parties expressly required, as a condition of sale, the right to operate the land until such time as it could harvest crops that had already been cultivated. As of March 31, 2011, land leased to third parties represented approximately 8.7% of our total land. The lease with respect to Arroyo Blanco was terminated in May 2011 and the lease with respect to Merín was terminated in June 2011. As of March 31, 2011, farmlands under these leases were classified as “Investment property underPromesas” in the statement of financial position.
Customers
During the nine months ended March 31, 2011, our sales amounted to $6.2 million. Cattle sales to our largest cattle customer, Frigorífico Tacuarembó, represented 39.4% of our cattle sales and 17.1% of our sales in the nine months ended March 31, 2011. Sheep sales to our largest sheep products customer, CLU, represented 33.6% of our sheep sales and 1.6% of our sales in the nine months ended March 31, 2011. Crop sales to our largest crops customer represented 65.0% of our crop sales and 22.4% of our sales in the nine months ended March 31, 2011. Rice sales to our largest rice product customer, SAMAN, represented all of our net rice sales and 14.0% of our sales in the nine months ended March 31, 2011. Dairy products sales to our largest dairy customer, CONAPROLE, represented all of our dairy sales and 1.9% of our sales in the nine months ended March 31, 2011. Other sales to our largest customer in “All Other Segments” represented 81.7% of our “Other Products” sales and 1.3% of our sales in the nine months ended March 31, 2011. Sales to our six largest customers represented 58.3% of our sales in the nine months ended March 31, 2011. Of these customers, our largest customer represented 22.4% of our sales for the nine months ended March 31, 2011, and the remaining five customers, in the aggregate, represented 35.8% of our net sales in that period. See “Risk Factors—Risks Related to Our Business and Industries—We derive a significant portion of our revenue from a few key customers and the loss or non-performance of such customers could adversely affect us.”
Competition
Although we are one of Uruguay’s leading agricultural producers, due to the highly fragmented nature of the farming sector, our overall market share with respect to some of the products we produce is insubstantial. Our
101
Table of Contents
production volume, however, improves our ability to negotiate favorable terms with our customers. Although competition in agriculture varies considerably by product and sector, in general, there are a large number of producers, and each one of them controls only a small portion of the total production. Therefore individual producers often have little influence on the market and have a minimal effect on market prices as a result of their individual strategies, explaining why producers are price takers and not price makers. In many cases, the price is established in international market exchanges. Because the majority of agricultural products are commodities, which stifles product differentiation, the principal competition factors are cost of production and volume efficiency gains.
With respect to farmland, we are not aware of a significant number of companies that have been actively competing to acquire farmland in Uruguay on a large scale in the last 10 years. However, we believe that new companies, some of them international, may become active players in the acquisition of farmland and the leasing of sown land, which would add competitors to the market in coming years.
Supplies and Suppliers
Our total expenditures for consumable supplies, including but not limited to fertilizers, agrochemicals, herbicides, feed and seeds, and fuel and lubricants represented 37.6% of our total cost of production for the fiscal year 2010 and 48.1% of our total cost of production for the nine months ended March 31, 2011.
Our total expenditures for consumable supplies (including but not limited to fertilizers, agrochemicals, herbicides, feed and seeds), and fuel and lubricants represented the following percentages of our total cost of production for the periods indicated:
| Cattle | Sheep | Crops | Rice | Dairy | All other segments | |||||||||||||||||||
% of Total Cost of Production for | 15.1 | % | 11.5 | % | 66.9 | % | 41.3 | % | 0.1 | % | 29.4 | % | ||||||||||||
% of Total Cost of Production for | 32.9 | % | 25.6 | % | 62.8 | % | 47.0 | % | 34.3 | % | 26.7 | % | ||||||||||||
We have a network of suppliers for each of our business segments and for each required input within each segment, resulting in lower reliance on any particular supplier and availability of materials. Our ten largest suppliers accounted for 36.0% of our total expenditures for supplies in fiscal year 2010 and 77.4% of our total expenditures for supplies in the nine months ended March 31, 2011. While we value the relationships we have developed with each of our suppliers given the quality we have come to expect, we do not consider any single supplier to be key to our production.
Since our formation, we have experienced fluctuations in our production costs primarily due to price fluctuation of raw materials. A portion of our cost structure includes the cost of raw materials, primarily seeds, fertilizers and agrochemicals. The raw materials that we use in our business have been subject to supply shortages and price volatility in the past and we could experience supply shortages and price volatility in the future. The supply of herbicides has also experienced shortages in the past as a result of a global shortage of certain active ingredients, which has led to higher prices. Recently, the price of fertilizer has also increased due to a rise in agricultural production to meet the demands of a growing population. Prices of fertilizer and other agricultural inputs have also experienced upward pressures since they are used as inputs in the production of bioethanol and biodiesel. Furthermore, the price and supply of diesel has experienced volatility due to the increasing demand and political uncertainty in diesel-producing regions. For instance, prices of crude oil futures were sharply increasing in early 2011, due to the probable risk of diesel shortages stemming from the collapse of Libyan production.
We have been able to obtain lower prices particularly due to the volume that derives from our large-scale operations.
102
Table of Contents
Seasonality
Our business activities are inherently seasonal. We generally harvest and sell our soybean and rice production between March and May, and our wheat production from December to January. Blueberries are generally harvested between October and November. Wool is generally sheared between July and August. Sales in our cattle and dairy business segment tend to be less seasonal. However, dairy production is generally higher during September to December, when the weather is more suitable for production. Our lamb meat and apicultural products are not affected by seasonality.
As a result of the above factors, there may be significant variations in our financial results from one quarter to another. In addition, our quarterly results may vary as a result of the effect of fluctuations in commodities prices, production yields and costs on the determination of changes in the fair value of biological assets and agricultural produce.
The following table shows the production process for each of our main products, reflecting the periods in which each stage of production occurs:
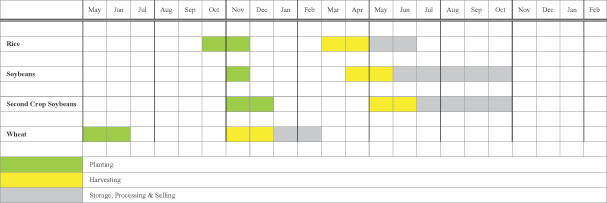
Material Agreements
Paso Manzagano Plant Agreement with SAMAN
Our subsidiary, Union Agriculture Group S.A., or UAG S.A., has an agreement with SAMAN, dated as of November 24, 2009, as subsequently amended, under which SAMAN will pay to UAG S.A. an annual fixed payment of $40,000 during the first year of the agreement and $75,000 for the second and third years plus a variable payment of $5 for every ton of rice milled, in exchange for the use of general rice warehousing facilities at our Paso Manzagano Plant. The fixed payment is adjusted 12.5% at the inception of every subsequent three-year period. Additionally, UAG S.A. agreed to sell all of its production of rice to SAMAN for the duration of the agreement. The agreement has a term of three years, which term is automatically renewable unless terminated. The agreement may be terminated by either party upon one year notice.
Pursuant to the agreement, SAMAN agreed to make investments to improve and expand the leased facilities. Both parties agreed that the SAMAN investments have an estimated useful life of 10 years and intend to maintain the lease agreement until the end of such period. If the agreement is terminated prior to the end of such period, UAG S.A. will be responsible for paying an amount equivalent to the unamortized amount of the SAMAN investments as of the date of termination. Investments made by SAMAN in storage silos pursuant to the agreement have been fully funded for a total of $866,086. Upon termination of the agreement at the tenth year (when the investments will reach the end of their useful lives), we will receive the investments made by SAMAN at no cost, and we will therefore not recognize such investments as assets in our consolidated financial statements.
103
Table of Contents
Rural Leasing Agreement with SAMAN
Effective from December 7, 2010, we had a lease agreement with SAMAN, under which SAMAN agreed to lease approximately 3,000 hectares of farmland from us and pay us an annual cash amount equivalent to 16 “bags” of rice (each bag being approximately 50 kg) for each hectare planted. The cash price for each “bag” was determined by reference to the prices published by the “Asociación de Cultivadores de Arroz” and the “Gremial de Molinos Arroceros.” We agreed to maintain the necessary irrigation equipment to support 2,500 hectares of rice and to pay half of the cost of the irrigation system. Under the lease agreement, SAMAN agreed to plant no less than 2,000 and no more than 3,000 hectares of the land annually, and to rotate crops as eventually agreed upon by both parties. The lease was required as a condition to the sale of the land by SAMAN to us, because SAMAN had already invested in cultivating crops on the land and wanted to maintain its right to use the land until such crops could be harvested. The lease provided that SAMAN would invest in improving the land during the term of such lease. Under the terms of the lease, if the lease were terminated before the expiration date, we would be required to pay the outstanding amortized balance of such improvements. The lease was terminated on June 15, 2011. As a result, we are required to pay $480,386 to SAMAN under the lease, which amount has not yet been paid.
Line of Credit
On June 14, 2011, our subsidiary, UAG S.A., entered into a $10.0 million line of credit with Banco Itaú Uruguay S.A., or the line of credit. The line of credit bears a fixed interest rate of 4.50% per annum and matures on October 31, 2011. Under the terms of the line of credit, UAG S.A. has agreed not to pledge or sell any of its assets, consisting of 19,038 hectares of land held under promesas (Merín, La Beba, Colonia Palma, Melo and part of Yaguarí), which had a book value of $66.9 million as of March 31, 2011. Under the terms of the line of credit, UAG S.A. has also agreed that it and our other subsidiaries will not incur indebtedness for borrowed money in excess of $15.0 million, in each case without the lender’s consent. We intend to use any borrowings under our line of credit for working capital, general corporate purposes and acquisitions.
Comodatos
In order to comply with Law No. 18,092, most of our subsidiaries that hold land underpromesas do not use the land themselves but have transferred the right to use the land to another of our wholly-owned subsidiaries. These transfers are effected pursuant to intercompany agreements under Uruguayan law known as “comodatos.” Acomodato allows the promissory buyer of land under apromesa (the “transferor”) to transfer the right to use such land to another person (the “transferee”) so that the transferee may use such land. Under Uruguayan law, neither the transfer of such land by the transferor to the transferee, nor the use of such land by the transferee, is considered to be use of the land by the transferor, even where the two parties are affiliated. The term of thecomodatos is generally for a set period, which period is automatically extended for successive 12 month periods unless one party notifies the other that it wishes to terminate the agreement; provided that the transferor always reserves the right to cancel thecomodato. Under thecomodato, the transferee is responsible for all obligations with respect to the land and must return the land to the transferor in its current condition and any improvements the transferee has made to the land are for the benefit of the transferor.
Employees
We had 229 full-time employees as at March 31, 2011, 148 full-time employees as at June 30, 2010, 100 full-time employees as at June 30, 2009 and 32 full-time employees as at June 30, 2008; and an average of 33 temporary employees for the nine months ended March 31, 2011. None of our employees are unionized. We are in material compliance with all applicable labor laws.
104
Table of Contents
The following table sets forth our number of employees as at March 31, 2011, by our business segments:
| Segment | Number of Employees | |||
Cattle and Sheep | 90 | |||
Dairy | 6 | |||
Crops and Rice | 63 | |||
All other segments | 38 | |||
Corporate | 32 | |||
Total | 229 | |||
Intellectual Property
We are in the process of registering two trademarks with Uruguay’s Dirección Nacional de Propiedad Industrial: “UAG” and “Union Agriculture Group.” Both trademarks are being registered along with their logos for the purposes of agriculture products and services. In addition, we own one livestock mark that is registered with Uruguay’s Dirección de Control de Semovientes, or DICOSE.
In Uruguay, we are required to renew our trademark registrations when they expire at the end of their respective terms. Under the Uruguay Trademark Act 17.011, the duration of term for a registered trademark is 10 years from its issue date, and a trademark may be indefinitely renewed for equal periods thereafter.
Insurance
We carry insurance policies with leading U.S., European, and local insurance companies, and we are currently insured against a variety of risks, including losses and damages relating to our plants, equipment and buildings. We believe our level of insurance coverage is customary and appropriate for a company of our size and with respect to our activities. Our insurance currently covers only part of the losses we may incur and does not cover losses on crops, wheat and blueberries due to drought or floods or similar risks, losses on blueberries due to hailstorms or any losses to our cattle, sheep and bees.
Legal and Administrative Proceedings
In the ordinary course of business, we are subject to certain contingent liabilities with respect to existing or potential claims, lawsuits and other proceedings, including those involving tax, social security, labor lawsuits and other matters. We accrue liabilities when it is probable that future costs will be incurred and such costs can be reasonably estimated. There are no material proceedings pending against us.
Social Programs
We contribute to a corporate social responsibility project, the “Fundación Unión,” which was founded by three of our directors in 2010. The objectives of this project are to transmit and foster our entrepreneurial spirit in every community in which we are present through our operations. The Fundación Unión aims at promoting individual development through collective work by the community, with an emphasis on organizational strengthening and collective capacities. The activities range from art displays, workshops, and cultural events, projects involving sports, recreation, environment protection, skill-based training and the support and defense of human rights. Our hope is that people in these communities will receive the tools necessary to craft their own social, personal and economic development through sustainable enterprises. With this venture we plan to promote environmental awareness, training in managing and operational techniques in promotion of micro and small enterprises, self-management and development of cultural projects through activities designed to develop social awareness, solidarity and ethics, which we believe to constitute key factors for achieving sustainable development. Our main objectives with this initiative are to:
| • | launch corporate social responsibility activities in the areas where our operations are or will be developed; |
105
Table of Contents
| • | establish soil and other natural resources conservation practices as our number one priority when cultivating land, through rotational crop systems and environmentally friendly techniques; |
| • | maintain human resource awareness within our business and the surrounding communities on issues relating to biodiversity and improving the environment; |
| • | help communities develop internationally acceptable standards of living, including health, housing, sports, and battling against drugs and crime; |
| • | provide ongoing training to develop the technical and operational skills needed to manage a company; |
| • | encourage the development of micro and small enterprises aimed at adding value to our production lifecycle; |
| • | work directly with local communities to foster public and private education; and |
| • | provide support through guidance of grassroots development of projects and groups, with the goal that these projects will be self-managed and self-organized by the community. |
106
Table of Contents
REGULATORY AND ENVIRONMENTAL OVERVIEW
Below follows a discussion of the principal regulatory framework governing our operations in Uruguay.
General Regulations
Uruguayan Antitrust Law 18,159, or the Uruguayan Antitrust Law, prohibits the abuse of a dominant position as well as all individual or concerted practices, conduct or recommendations with the effect or purpose of restricting, limiting, hindering, distorting or preventing current or future competition in the relevant market.
The Uruguayan Antitrust Law applies to all national and foreign public and private legal entities and individuals engaged in profit or non-profit economic activities in Uruguayan territory. The Uruguayan Antitrust Law also has extra-territorial application. It is binding upon those engaging in economic activities abroad insofar as such activities have total or partial effects in Uruguayan territory.
The Uruguayan Antitrust Law introduces a prior oversight system for mergers and acquisitions by companies having a certain market power. When the transaction results in a stake equal to or exceeding 50% of the relevant market, or when gross annual billings in Uruguay by the parties to the transaction exceeds approximately $80.0 million, notice to the enforcement agency is required. The parties’ obligations are limited to notification and the Uruguayan Antitrust Law does not empower the enforcement agency to object to the transaction. However, in extreme cases involving ade facto monopoly, authorization must be requested in advance, and the enforcement agency has the power to refuse a grant of authorization.
Crops and Livestock
Uruguayan law promotes the responsible use and conservation of rural land, which the Uruguayan government has established as a principle of national interest. Owners or tenants of rural land or rural exploitations are obligated to apply all of the techniques established by the MFAL, in order to reduce land erosion and degradation.
Law 16811 created the National Institute of Seeds (Instituto Nacional de Semillas), which is responsible for the national registration of crops, crops property and seeds producers. The National Institute of Seeds is also responsible for certifying the quality of seeds and crops produced in Uruguay, as well as regulating and controlling the elaboration, production, export and import of seeds and the development of new crops.
In relation to the regulation of livestock, the Uruguayan Rural Code (Código rural) establishes a system of signals and marks in order to duly identify the property ownership of groups of livestock. According to the Uruguayan Rural Code, marks and signals are considered to be a presumption of property. The marks are recognized nationally, and as a result, identical livestock marks will not exist within the national territory.
Livestock owners are required to mark and register all of the livestock they own. In addition, each year, livestock owners are required to present a sworn statement with respect to any changes in the information that was provided the registration.
Moreover, livestock owners are obligated to register any movement of livestock, even in the event that no property transfer has taken place. According to national regulation, the transportation or transfer of livestock requires the execution of DICOSE documentation that duly identifies the livestock that is being transported or transferred. Transportation of livestock without due registration is prohibited. Different DICOSE documentation exists for each type of livestock. The DICOSE documentation also includes a section that describes all vaccinations that have been applied on the livestock.
In addition to identification by groups, individual registration of livestock is being implemented by MFAL. Registration will consist of incorporating an external (visual) and an internal (electronic) identification device with respect to each animal. An electronic chip is incorporated into the ear of the animal for purposes of identification and movement tracking. Each electronic chip is unique to allow for individual identification.
107
Table of Contents
Apiculture
In Uruguay, apicultural activity is controlled by MFAL. Beehive owners are required to register with the National Registry of Beehive Owners (Registro Nacional de Propietarios de Colmenas). In addition, each year, beehive owners are required to present a sworn statement with respect to any changes in the information that was provided in the registration.
Furthermore, commercial honey in Uruguay has to be extracted in an authorized facility that is registered with MFAL. Renewal of registration for such facilities is conducted on a yearly basis and requires an inspection by the relevant authorities. The inspection includes an examination of the special infrastructure and required sanitation elements of the facility, as well as inspection of the staff involved in honey production and their work attires.
Sale and Ownership of Real Estate
It is common for foreign corporations to conduct real property transactions in Uruguay due to Uruguay’s legal system, which prevents expropriation without compensation, does not restrict the ownership of private property and does not discriminate against foreigners. Furthermore, property transactions in Uruguay are subject to a clear tax scenario, public registries and the participation of notaries public (professionals who are legally trained and regulated).
Restrictions are limited to those areas considered part of the National Security Domain and pursuant to certain Municipal Decrees regarding frontier and coastal areas.
Foreign investors desiring to acquire real property in Uruguay can either act as individuals or use any form of legal entity in order to carry out their acquisition (e.g., Uruguayan Stock Corporations, LLCs or even off-shore vehicles as commonly used as a BVI or Delaware LLC).
Relevance of Notaries
Real estate transactions in Uruguay require the participation of a notary public, as required by Law 1,421 and the Civil Code. Once appointed by the buyer, the notary public is responsible for ensuring that all documents and permits are correct and that the investor acquires a clean title (i.e., confirming that there are no liens or mortgages, valid building permits and that there are no problems with respect to the status of taxes and utilities on the land).
Generally, real estate transactions begin with the execution of a preliminary agreement with respect to the real estate, or aBoleto de Reserva, by which the seller “books” or “reserves” the real estate property to the buyer. The main intention of theBoleto de Reserva is to obtain, prior to definite purchase, all required documentation before the National Registries in order to duly confirm that the real estate to be transferred has no liens and has all of the required documentation.
Once the documentation has been obtained, the parties may either execute a purchase promise, orpromesa de compraventa, or a definitive purchase, orcompraventa definitiva, for the real estate. Thepromesa de compraventa provides the promissory buyer with rights over the land, including access to its use and the ability to sell, assign and pledge the rights derived from thepromesa. Thecompraventa definitiva provides the buyer with an owner’s rights and guarantees over the land. Both thepromesa de compraventa and thecompraventa definitiva are registered before the public registry (Registro de la Propiedad Inmobiliaria) in order to be enforceable against third parties.
Thepromesa of real estate is a contract regulated by Uruguayan law 8,733. Under such law, apromesaconstitutes a definitive contract and not a preliminary agreement. However, apromesa is completed, and legaltitle is transferred, when a final purchase agreement, orescritura, is executed. An executedescriturais legally
108
Table of Contents
equivalent to acompraventa definitiva. Because we acquire land through our subsidiaries whose shareholders are not individuals, we are prevented from executing anyescritura without obtaining prior governmental authorization.
The registration of thepromesa with the applicableRegistro de la Propiedad Inmobiliaria provides the promissory buyer under thepromesa with the following rights:
(i) a real right, or aderecho real, over the rural estate promised to be bought, which can be defended before third parties and protects the promissory buyer against future further sales or liens over the real estate; and
(ii) the right to force the promissory seller under thepromesato execute thecompraventa definitiva, or theescritura, upon:
| • | payment of the entire purchase price; |
| • | payment of 50% of the purchase price and grant of a mortgage over the real estate in favor of the promissory seller to guarantee the remainder of the purchase price; or |
| • | construction on the real estate for an amount equivalent to 40% of the purchase price and grant of a mortgage over the real estate in favour of the promissory seller to guarantee the remainder of the purchase price. |
In the event that the promissory seller fails to execute theescrituraafter the occurrence of one of the above conditions or upon the promissory seller’s death or bankruptcy, the promissory buyer has the right to judicially obtain anescritura. Notwithstanding whether anescriturahas been executed, a promissory buyer is able to sell or assign its rights in thepromesa to a third party. There are no time limitations on the rights that a promissory buyer acquires under apromesa in respect of the promissory seller. In order for thepromesa to also be effective against third parties, the law provides that apromesa be registered with the Public Registry (Registro de la Propiedad Inmueble). The initial registration of apromesa is effective for 30 years. The promissory buyer may also re-register thepromesa for an additional five year period any time after the expiration of the initial 30 year period. In addition to the above, after the expiration of the initial 30 year term, the promissory buyer will also have possessory rights against any third party. Therefore, the promissory buyer can protect its interest against third parties claims irrespective of the expiration of the registration of thepromesa.
Rural Real Estate
Law 18,092 (as amended by Article 349 of Law 18,172) provides as a general rule that only individuals and companies having registered shares held by individuals can be owners of rural real estate and land operations in Uruguay. A corporation or other business entity that held title to rural land prior to effectiveness of Law 18,092 and did not comply with such law, or that is denied authorization to use such land, is deemed to be dissolved and its assets distributed to its shareholders or members. Following effectiveness of Law 18,092, any acquisition of title to or use of rural real estate by a corporation or business entity that does not comply with Law 18,092 is void or voidable. However, this general rule has the following exceptions, which are expressly regulated by Decrees Nos. 225/07 and 201/08:
(i) the Public Company Exception, which is based on specific features of the legal entities, including domestic or foreign corporations whose shares are traded in well-known local or foreign stock exchange markets, domestic or foreign pension funds; and
(ii) exceptions granted to legal entities (including corporations, branches of foreign companies, trusts and investment funds) with bearer or registered shares not covered by (i) above, including legal entities that develop activities which constitute part of a project considered as a priority for the productive development of Uruguay, or the Productive Project Exception.
Qualification for the Productive Project Exception is determined by a special commission, theComisión de la Ley de Tierras, or the Commission, based on a business plan furnished by the company. In its determination,
109
Table of Contents
the Commission considers, among others, the following factors: creation of new employment opportunities within the rural sector; development of small family enterprises; eradication of poverty in rural sectors; incorporation of technology; promotion of territorial decentralization; and development of new productive circuits.
Generally, the process for obtaining governmental authorization takes approximately one year, but may vary on a case-by-case basis. We obtained the First Productive Project authorization in one year, and we obtained the Second Productive Project authorization approximately 19 months after submitting our application.
We have applied for governmental authorization with respect to 66,645 hectares of land we hold underpromesas, or 78.7% of our total land holdings, and we currently expect to obtain governmental authorization by June 2012. We are also in the process of preparing applications for governmental authorization with respect to our remaining land held underpromesas.
Most of our subsidiaries that hold land underpromesas are not using the land themselves. Instead, until June 22, 2011, the land underlying suchpromesas was being used by UAG S.A., another of our wholly-owned subsidiaries, pursuant to intercompany agreements under Uruguayan law known as “comodatos,” between each of our subsidiaries holding land underpromesas and UAG S.A. On June 22, 2011, thecomodatoswith UAG S.A. were terminated and newcomodatoswere entered into between each of our subsidiaries holding land underpromesas and Boisy S.A., another of our wholly-owned subsidiaries. See “Business—Material Agreements—Comodatos.” We entered into these newcomodatosbecause Boisy S.A. had already received authorization to use land in the past and, in accordance with Decrees Nos. 225/07 and 201/08, we believe it should be able to obtain governmental authorization to use such lands under the Expedited Process, as described below.
On June 22, 2011, Boisy S.A. applied for governmental authorization to continue using 64,505 hectares of our land held underpromesas. On June 23, 2011, the executive branch of the Uruguayan government issued a decree confirming that companies such as Boisy S.A. that had properly applied to obtain authorization could continue to use the land pending government determination of their applications. We expect to obtain this authorization 30 business days after the date we made the application, although there can be no assurance that the government will not deny the application. A proper application to obtain governmental authorization under the Expedited Process is an application submitted to the Uruguayan Ministry of Fishing, Agriculture and Livestock, or the MFAL, by an entity that has obtained prior authorization to own or use land and has timely requested that such authorization be extended to own or use additional land. We have concluded that we properly applied for governmental authorization and therefore are permitted to continue using the 64,505 hectares of land because the application was submitted by our wholly-owned subsidiary, Boisy S.A., which had previously obtained governmental authorization to use land, and that such application was submitted on June 22, 2011, and therefore it was timely filed. The Uruguayan government will review the application based on three factors: whether the applicant had previously received governmental authorization to use land; whether the land that is the subject of the application can be used for the requested purposes; and whether the application was timely filed. We fully expect that we will be granted the authorization under the Expedited Process based on (i) a certificate issued to us by the MFAL on June 24, 2011, certifying that the Uruguayan government does not have any comments with respect to the application as of the date of such certificate and (ii) direct discussions with officials of the MFAL, who have indicated that such authorization is expected to be granted upon the expiration of the 30 business day waiting period. There can be no assurance that the government will not deny the Expedited Process application. If our application for authorization to use the land is denied under the Expedited Process, processing of our application will continue under the standard process for the Third Productive Project, which process generally takes 12 to 16 months from the date of application to complete. However, during such time, we would continue to be able to use the land that is the subject of the standard authorization process. We are currently authorized to use all of our land held underpromesas, as the use of all of our land held underpromesas has either been authorized by the Uruguayan government or is subject to applications for authorization and, therefore, use of such land is permitted under Decree No. 218/11.
The expiration of the Compliance Period on June 30, 2011 does not have an impact on our ability to acquire additional land underpromesas. Should we wish to, we will be able to continue acquiring land underpromesas.
110
Table of Contents
However, as a result of the expiration of the Compliance Period, we will be required to obtain authorization to use land held underpromesasbefore we may use such land. We expect that, in the future, prior to acquiring land under apromesaor under acompraventa definitiva, we will, as a condition to entering into any suchpromesaorcompraventadefinitiva, obtain governmental authorization under the expedited process to permit us to obtain title to, and use of, such land.
Upon the completion of this offering, we intend to submit an application for governmental authorization to obtain title to, and use of, our lands held underpromesas under a different provision of the applicable law, namely the Public Company Exception, which we would be permitted to apply for once this offering is completed and our common shares are traded on the NYSE. Based on the opinion of our Uruguayan legal counsel, Bragard & Duran Abogados, we believe that we comply with applicable Uruguayan law and fully expect that we will receive governmental authorization to obtain title to, and use of, our land held underpromesas pursuant to the Productive Project Exception or the Public Company Exception. We do not believe that the Uruguayan government will refuse to grant such authorization, which refusal could force the liquidation of our land held underpromesas. Moreover, based on the opinion of Uruguayan legal counsel, Bragard & Duran Abogados, we would have the right to challenge such refusal in the courts of Uruguay. Although we do not intend to do so, we also have the right at any time to, and could, sell thepromesasto a third-party purchaser at market value. See “Risk Factors—Risks Related to Our Business and Industries—If we do not obtain governmental authorizations with respect to all of our lands, we could lose the rights to the use and the economic benefits of such lands.”
As a result of our intercompany transactions wherein our subsidiaries holding land underpromesas have granted the right to use such land to other of our wholly-owned subsidiaries, we are in compliance with all applicable law. Consequently, there are no limitations on our use of lands for which governmental authorizations have not yet been granted, and accordingly, we do not expect that any substantive economic benefits will accrue to us upon obtaining legal title to such lands.
Decrees Nos. 225/07 and 201/08 also provide for an expedited process for authorization, applicable to those legal entities which have already obtained an exception to own (or use) rural land. In such cases, authorization to own (or use) additional land shall be automatically granted within 30 business days after all of the necessary documentation and requests are filed. However, in the event that the request is overseen by the president of Uruguay or MFAL, processing will continue in accordance with standard authorization procedures as described above.
The purpose of the laws and decrees described above is to encourage the productivity of Uruguayan rural land, the creation of jobs in rural areas, the production of exportable commodities, the incorporation of technology in the process of production, the value added to products, the development of new production chains in the country and the promotion of territorial decentralization. In Uruguay, there are no restrictions on the ability of foreigners to own rural land either directly under their own name or indirectly as a shareholder of a corporation with registered shares, provided that such foreigners comply with the regulation discussed above.
Uruguayan law provides that farmlands with more than 500 hectares with a productivity land index (CONEAT) of 100, which includes most of our farmlands, must be offered to theInstituto Nacional deColonización, or the INC, which is an agency of the Uruguayan government, prior to their sale to a third-party. Accordingly, a seller of such farmland must first agree to the price and terms of a sale to a third-party buyer, and then is required to provide a right of first refusal to the INC, by offering such farmland to the INC at the same price and on the same terms as those agreed with the third-party buyer. The INC has 20 business days to exercise its right to purchase such farmland (or a portion thereof, as applicable). The INC rarely exercises this right, but may do so if it believes that the proposed sale is for a price significantly below market value or the INC has a special interest in such land, for example, if the farmland is located close to a populated area. If the INC does not exercise its right, the seller may proceed with the sale of such farmland to the third-party buyer pursuant to acompraventa definitivaor apromesa de compraventa.
111
Table of Contents
Law 18,308 prohibits the construction of buildings in rural properties that may require urban services or infrastructures that could establish activities of an urban nature which may deprive the rural property of its natural characteristics. A more recent Law 18,719 provides a list of certain activities and constructions that are allowed on rural properties and exempted from the prohibition under Law 18,308, including the construction of wind farms, cementries, waste disposal and treatments plants and other construction related to mining and agriculture activities.
Leases of Rural Real Estate
Rural land leases are registered with the real estate registry (Registro de la Propiedad Imnobiliaria) of the department on which the leased land is located. Registration enables the enforcement of agreements with third parties and entitles the parties to the agreement to act as lessor and lessee before public offices. After registration, any transfer in ownership of the land will also legally assign the lease agreement and the new owner of the land becomes the lessor. After registration, the lease agreement can be used to exercise rights vis-à-vis third-parties, even in the event that the prior owners have died or the property has been sold.
Leases are not subject to minimum terms by law, with the exception being a four year minimum for rural leases for the purposes of dairy production. However, leases are subject to a maximum term of 15 years by law, except rural leases for purposes of forestry, construction of dams, reservoirs, windfarms or for the generation of electric energy, which are subject to a maximum term of 30 years.
There are no restrictions on the price and price readjustments for rural land leases. Parties are also free to negotiate any types of guarantees.
At the end of lease, the land is to be restituted in the same condition it was first granted by the lessor. Generally, the lease agreement will provide for restrictions on improvements and any related incurrence and reimbursement of expenses. However, if the lease agreement was silent on such matters, improvements paid for by the lessor may not be removed but improvements paid for by the lessee may be removed from the land as long as removal does not affect the land. The lessor may retain the improvements on the land if it pays lessee for the improvements.
Under Uruguayan law, assignment of leases is trilateral and the owner of the land needs to consent to the assignment.
Environment
The General Environmental Protection Law (Ley General de Protección del Medio Ambiente) provides for the following principles:
| • | protection of the environment, air, water, soil and landscape quality; |
| • | conservation of biodiversity and coastal configuration and structure; |
| • | reduction and appropriate management of hazardous toxic substances and wastes of any kind; |
| • | prevention, elimination, mitigation of and compensation for negative environmental impacts; and |
| • | regional and international environmental cooperation and participation in solving global environmental problems. |
Environmental Responsibility
Generally, Uruguayan law does not provide for a specific environmental liability regime. Therefore, general provisions of the Uruguayan Civil Code (Código Civil de la República Oriental del Uruguay) apply, including those establishing the liability of any person that causes damage through willful misconduct or negligence.
112
Table of Contents
According to local law, any party causing environmental degradation, destruction or contamination must, if materially possible, remediate such damage. Pursuant to Article 4 of Law No. 16,466 “Prevention and Assessment of Environmental Impact,” in the case of irreversible damage, the party must take all necessary action to reduce or mitigate such damage, to the extent possible.
Uruguay has no criminal environmental penalties with a certain few exceptions, including penalties for introducing of hazardous wastes into Uruguayan territory and poisoning or adulterating water or food.
At the administrative level, the Ministry of Housing, Land Management and Environment (Ministerio de Vivienda, Ordenamiento Territorial y Medio Ambiente) determines whether public or private activities comply with environmental regulations. Administrative penalties in cases of non-compliance may result in fines, public disclosure of penalties, temporary or permanent cessation of business or the suspension or cessation of the activities that affect the environment.
Natural Areas and Native Forest Protection
Uruguayan regulations provide for certain activities that may be limited or prohibited (e.g., limitations on traditional production activities, hunting and fishing) in designated areas that are included in the National System of Natural Protected Areas (Sistema Nacional de Areas Protegidas, or SNAP). Uruguayan regulations also protect native forests. Prior authorization of the MFAL is required for logging and extraction of forest products in the native forest.
Genetically Modified Organisms
Uruguayan regulations on biosafety in respect of plants and the genetic modification of plant organisms were enacted in 2008. The regulations require prior governmental authorization for introduction, use and manipulation of plants and genetically modified plant organisms, creating a new institutional structure for such purposes.
Soil Usage
Pursuant to the ruling on responsible use and appropriate management of soil for farming production, land users must file a management plan with the Ministry of Fishing, Agriculture and Livestock. Such plan must show that the production system ensures a tolerable level of erosion taking into account the soil used, crop sequencing and management practices. In addition, the ruling expressly enumerates inappropriate practices in soil and water management, specifically in cases of direct sowing or plowing and in all general circumstances. In addition, the ruling establishes the obligation to adopt measures to recover eroded or degraded soil in all cases, regardless of the severity of such degradation or erosion. The obligation to recover eroded soil implies the joint and several liability of the landowner and the land user for applicable sanctions.
Exchange Regulation
There are no exchange controls presently in effect in Uruguay. Since September 1974, foreign exchange market operations have been completely free on the basis of fluctuating rates determined by supply and demand. The purchase and sale of foreign currency and payments made abroad in foreign currency are not restricted in any way.
Payment for imports may be made out of hard currency held either abroad or in the country, or by purchasing such currency within the country. Exporters may freely keep the foreign currency proceeds from their export sales.
There are no legal obstacles to commercial or financial agreements being drawn up in a foreign currency. Legal enforcement of contracts may be made either in local currency or in the foreign currency originally agreed upon by the parties.
113
Table of Contents
Anti-Money Laundering
Uruguayan Law 17,016 (as amended by other laws) was the first regulation that categorized money laundering as a crime. Subsequent laws and Central Bank regulations have complemented the anti-money laundering framework in Uruguay. In particular, Laws 17,835 and 18,494, enacted recently, have strengthened the anti-money laundering regime.
In 2000, the BCU created theUnidad de Información y Análisis Financiero, or the UIAF, an agency of the BCU responsible for analyzing and responding to reports of transactions suspected of being linked to money laundering. Money laundering involves the exchange, transfer, management, sale or any other use of monies or other assets that are the product of criminal activity by a person who did not participate in such crime, with the possible result that such monies or assets have the appearance of having been obtained through a lawful activity.
Uruguayan Law 17,835 and BCU regulations provide that all individuals or companies under BCU’s control must report (i) unusual transactions within their respective activities that do not have economic or legal justification or have unjustified complexity and (ii) financial transactions involving assets that are suspected to be illicit.
The anti-money laundering legal framework also provides a list of entities subject to information and control duties, such as casinos, real estate agents and investment advisors, among others.
Taxes
The following is a summary of the material Uruguayan tax considerations relating to our operations in Uruguay and is based upon laws, regulations, decrees, rulings, administrative practice and judicial decisions in effect as of the date of this prospectus. Legislative, judicial or administrative changes or interpretations may, however, be forthcoming. Any such changes or interpretations could affect the tax consequences to Uruguayan taxpayers, possibly on retroactive bases, and could alter or modify the statements and conclusions set forth herein. This summary does not purport to be a legal opinion or to address all tax aspects that may be relevant to a taxpayer in Uruguay.
Income Tax. Uruguayan source income obtained by legal entities domiciled in Uruguay and by permanent establishments of foreign entities is subject to the Corporate Income Tax, or the IRAE, at the rate of 25%.
Taxable income is determined according to IRAE regulations. Expenses can be deducted only if they constitute income for the other party (resident or non-resident) subject to corporate or individual income tax, and only in proportion to the ratio of the rate applicable to the income of the other party to the 25% IRAE rate.
Losses incurred during any fiscal year may be carried forward and set off against taxable income obtained during the following five fiscal years.
Non-Resident Income Tax. Uruguayan source income obtained by non-resident individuals or entities is subject to the Non-Resident Income Tax, or the IRNR, at the rate of 12%.
Payments from Uruguayan entities to foreign residents (i.e. fees, interest, etc.) are subject to IRNR withholding. Under certain circumstances, technical services rendered outside of Uruguay for the benefit of IRAE taxpayers are deemed to be rendered in Uruguay and, therefore, subject to IRNR.
The sale, exchange or other disposition of registered shares of Uruguayan corporations by non-residents is subject to IRNR. The taxable income is determined on a notional basis as 20% of the sale price.Sales of bearer shares are exempt from this tax.
Net Worth Tax. Net Worth Tax, or the IP, is levied at the rate of 1.5% on the net worth of Uruguayan entities located in Uruguay, including all assets located, placed or used economically in Uruguayan territory minus a short list of liabilities stipulated by law, which includes loans from local banks, certain debts with goods and services providers and import balances.
114
Table of Contents
Uruguayan entities must withhold IP at a rate of 1.5% on debts outstanding with individuals or legal entities that reside outside of Uruguay on December 31 of a particular fiscal year, with the exception of deposits, loans and import debts.
Value Added Tax. VAT is levied on the domestic circulation and importation of goods and on the provision of services within the Uruguayan territory at the general rate of 22%. However, for a limited number of basic needs products and services, a lower rate of 10% applies.
The sale of certain farming products is zero rated, which means that VAT is not charged on the sale of such products. In addition, there is a refund of the VAT that is included in the purchase of goods and services that directly or indirectly form part of the cost of production of farming products. The export of goods and of certain services is also zero rated.
Tax on dividends. Dividends paid on shares of Uruguayan corporations to non-resident entities are subject to a withholding tax of 7%. The withholding tax is not applied to the actual amount of dividends distributed, but to an amount equivalent to the taxable income for IRAE. This tax is not applicable if dividends are paid in shares unless such shares are redeemed within two years after such share dividend. For capital redemptions, the amount by which the redemption price exceeds the nominal price of the corresponding shares is also treated as a dividend.
Tax on the Alienation of Farming Products. Tax on the Alienation of Farming Products, or the IMEBA, is levied on the first conveyance of farm products, under any title, made by producers to IRAE taxpayers, government and municipal agencies and on the export of farm goods. The tax rate for the sale of cereal and oil seeds is 0.1%, while the tax rate for the sale of bovine and ovine cattle is 2.0%.
There are two additional taxes: (1) theImpuesto Adicional MEVIR, levied at a rate of 0.2% on the first conveyance of farm products to IRAE taxpayers, municipality offices and other government organisms, as well as to exports of (i) wool, cowhide, ovine fur; (ii) sheep and cattle livestock; and (iii) cereals and oil products, and (2) the Impuesto Adicional INIA, levied at a rate of 0.4% on the first conveyance executed by farm producers to IRAE taxpayers, municipality offices and other government organisms, as well as to exports of: (a) wool, cowhide, ovine fur; (b) sheep and cattle livestock; (c) cereals and oil products; (d) pig livestock; (e) milk; (f) poultry products; (g) apiculture products; (h) forestry products; and (i) seeds and fruits in natural state. In contrast to IMEBA payments, these two additional taxes cannot be accredited to IRAE payments.
In addition, the President of Uruguay recently stated that he wished to tax land holdings of more than 2,000 hectares with unknown rates from 2,000 to 10,000 hectares and more than 10,000 hectares at a rate of $16 per hectare. Although legislation regarding such a tax has not been introduced, it could come into effect in the future. If such a tax were to come into effect and we reached our objective of holding 160,000 hectares of land in Uruguay, such a tax would increase our total taxes by approximately $2.5 million per year, which would reduce our profitability or increase our loss by such amount.
Labor Matters
Hiring and Termination of Employment
Uruguayan law does not place any restrictions on the hiring of employees and foreign individuals may be hired freely, provided that such foreign individuals must obtain the proper immigration status. To that end, such foreign individuals must apply for the Temporary Identification Card (Hoja Provisoria) or legal permanent residency, if they remain in Uruguay for a period greater than or less than 180 days, respectively. Under the framework of equal rights and treatment for foreign employees, Law 18,250 specifies that foreign employees must receive the same treatment and working conditions as Uruguayan employees. A company may hire staff for an indefinite period or provide that the contract is for a certain period according to its operational needs (e.g., probationary contract, contract for harvest, etc.).
115
Table of Contents
Under Uruguayan labor laws, an employer may terminate employment without cause and without notice, but the terminated employee is entitled to receive an amount specified by law as severance compensation. Workers’ compensation is calculated on the basis of seniority and salary of the employee in question, up to a maximum of six months of salaries (in the case of employees paid monthly) or 150 days of wages (in the case of a laborer). A company is not obligated to pay compensation if the company has evidence that the employee has committed an act of “gross misconduct,” or if the termination resulted from the expiration of a labor agreement between the parties.
However, if the dismissal was grounded on discrimination by reason of birth, race, sex, religion, belief or any other personal or social reasons, the dismissal could be deemed as a special dismissal and the employer may be sanctioned to pay double or triple severance, depending on the circumstances. Severance pay for a special dismissal aims to compensate the pain and suffering of the terminated worker.
Generally, a terminated employee does not have a right to reinstatement; compensation for special damages is made by monetary payment in the form of abusive or special severance pay. The only exception to this general principle is for dismissals that are based on union status.
In most cases, a terminated employee would not be entitled to moral damages. However, under exceptional circumstances, the courts have ordered an additional payment of moral damages. For example, moral damages may be given in cases of contemptible treatment where the relationship between the employer and the employee is akin to slavery.
The law provides for other special protections with respect to the dismissal of employees who have suffered a workplace accident, injury or an occupational illness, pregnant employees or those that have recently given birth. In each of these cases, Uruguayan law sets forth a protective period and special compensation if the employee is dismissed during that period.
Salaries
In Uruguay, theConsejo de Salarios,or the Board of Salaries, fix the minimum wages that must be paid by an employer. The Board of Salaries is tripartite and is composed of representatives of the government, the employer’s chambers and labor unions. The main function of the Board of Salaries is to fix minimum wages and labor benefits for private workers according to the type of activity performed by the employer. As of January 1, 2010, the Board of Salaries has fixed the minimum nominal wages of our lowest operating positions in the range of $250 to $450 per month.
Working Hours and Overtime
Under Uruguayan labor legislation, employees devoted to agriculture activities may work up to eight hours per day and six days per week, for a total maximum of 48 weekly hours. Employees in the administrative and commercial sector may work up to eight hours per day from Monday to Friday, and four hours on Saturdays, for a total maximum of 44 weekly hours. Any time worked exceeding the fixed limit is considered overtime and the employee is entitled to 200% of their regular hourly wage. When an employee works during a holiday or days that are not business days, such an employee is entitled to 150% of their hourly wage.
Certain categories of employees are excluded from the protection of such provisions, whereby they are not entitled to overtime payment. These categories include senior staff, college educated employees, and qualified employees that are highly skilled in order to fulfill their duties.
Vacation
Law 12,590 provides that an employee accumulates 20 vacation days for every full year of employment. Vacation leave is accrued during the calendar year, and must be taken within the following year. An employee
116
Table of Contents
who has not worked during a full calendar year is still entitled to benefit from their vacation in the following year to the extent they have accrued it in the period ending on December 31 of the prior year.
As a general rule, vacation days shall be taken in only one period, but upon agreement between the company and its employees, it may be taken in periods of not less than 10 days each. An employee with five years of work experience is entitled to an additional vacation day. Subsequently, an additional vacation day is added for every additional four years of work experience.
Pursuant to Law 16,101, private sector employees shall be paid an amount equal to 100% of their daily net wages for their period of vacation, which amount must be paid prior to the beginning of their vacation. The net wage is calculated based on all salary items and benefits, both in cash or in kind, that are received by the employee, including compensation, overtime pay, additional incentives and bonuses.
Annual Bonus
Companies are legally obligated to pay an annual bonus equal to one-twelfth of all compensation paid in cash by the employer between December 1st and November 30th of the following year. The benefit is paid in two installments: the first, before June 30th, and the second, before December 20th.
Social Security Contributions
Uruguayan legislation provides that social security must be financed from contributions made by employees and employers. As a result, most benefits received by employees derived from employment, including salaries and paid vacation, are subject to Social Security Contributions, or SSCs. Pursuant to Law 16.713, the following contributions are levied by SSCs:
Employee Contributions: Employee SSCs are deducted from the nominal salary paid to the employee. The employer is responsible for retaining SSCs from the employee’s salary and for remitting it to theBanco de Previsión Social, or BPS, which is Uruguay’s social security authority.
Employer Contributions: Employers must pay a contribution equal to 12.625% of the employee’s nominal salary to the BPS.
Individual Income Tax
Uruguayan resident workers are subject to an annual income tax on their salaries. It is the responsibility of the employer to withholding income tax and remit it to theDirección General Impositiva, which is Uruguay’s taxing authority.
Accidental and Health Insurance
According to Law 5,032 and Law 16,074, employers must provide occupational accidental and occupational health insurance from theBanco de Seguros del Estado,or the State Insurance Bank.
Time Limits for Claims
Pursuant to Law 18.091, an employee has one year from the date of last employment to bring a labor claim to court. An employee may extend such term for an additional year by presentation before the Ministry of Labor and Social Security. Damages are limited to losses suffered by an employee during the five years prior to termination.
117
Table of Contents
Directors and Executive Officers
The following table sets forth information for our directors and executive officers as of the date of this prospectus. The business address for each of our directors and executive officers is Plaza Independencia 737 –11000, Montevideo, Uruguay.
Name | Age | Position | ||||
| Juan Sartori | 30 | Executive Chairman & Director | ||||
| Oscar Baltasar Costa Martínez | 58 | Chief Executive Officer & Director | ||||
| Oscar León Bentancor | 52 | Chief Financial Officer | ||||
| Silvio de Souza Rocha | 57 | Chief Operating Officer | ||||
| Walter Cardozo Vázquez | 59 | Chief Agronomist | ||||
| Edgardo Luis Cardozo Vázquez | 61 | Director | ||||
| Jérôme Tordo | 39 | Director | ||||
| Jean Jacques Bragard | 43 | Director | ||||
| Julio De Brun Mascheroni | 49 | Director | ||||
| Roberto Vazquez Platero | 63 | Director | ||||
Juan Sartori. Mr. Sartori is the co-founder and Executive Chairman of UAG and has served in this capacity since our formation in 2008. Since 2005, Mr. Sartori has also served as the Managing Director and President of Union Capital Group, a financial services firm managing in excess of a billion dollars in capital. In 2002, Mr. Sartori founded Sagio Investments, which was the predecessor to Union Capital Group. Mr. Sartori holds a Bachelors Degree in Business and Economics from HEC (Hautes Etudes Commerciales) in Lausannes, which included two semesters as a non-degree visiting student at Harvard University. Mr. Sartori is a resident of Valletta, Malta.
Oscar Baltasar Costa Martínez.Mr. Costa is the co-founder of and Chief Executive Officer of UAG and has served in this capacity since our formation. Prior to founding UAG, since 1996, Mr. Costa was the Chief Executive Officer of Agrogestión, a land management company. He was also the vice president of the Uruguayan Forestry Association. Mr. Costa was the founder and director of SYS (Servicios y Sistemas) and Simple S.A. (Oracle Partner), and Mr. Costa served as manager of IBM Uruguay Outsourcing Services and director of Uruguayan Association of Enterprises for Total Quality Excellence (AUECE). Mr. Costa was the founding partner and president of the following societies: Segral LTD (Forestry Services) and Acción Forestal & Agrogestion, and was the president of the Uruguayan Forestry Producers Society (SPF). Mr. Costa holds a B.A Eng. in Computer Science, EST & M.B.A. from ORT University. Mr. Costa is a resident of Montevideo, Uruguay.
Oscar León Bentancor. Mr. León is our Chief Financial Officer and has served in this capacity since our formation. Mr. León was self-employed as an accountant from January 1999 until joining us. Mr. León has approximately 25 years of practical experience as a public accountant and seventeen years of experience as the Chief Financial Officer, financial controller or chief accountant for various Uruguayan, Canadian and American companies. Mr. León is a Certified Public Accountant in Accounting and Finance from the Universidad de la República Oriental del Uruguay in Montevideo, Uruguay. Mr. León is a resident of Montevideo, Uruguay.
Silvio de Souza Rocha. Mr. de Souza is our Chief Operating Officer and has served in this capacity since our formation. Prior to joining UAG, Mr. de Souza served as a colonel in the Armed Forces of Uruguay (Fuerzas armadas del Uruguay). Mr. de Souza has 35 years of experience in the management and administration of human resources, planning and training operations, and has overseen the operation and human resources of various agricultural projects. Mr. de Souza is also a former military ambassador to Argentina. Mr. de Souza holds a B.A. in International Business from Catholic University of Montevideo in Uruguay. Mr. de Souza is a resident of Montevideo, Uruguay.
118
Table of Contents
Walter Cardozo Vázquez. Mr. Cardozo is our Chief Agronomist and has served in this capacity since January 2011. Prior to that, Mr. Cardozo had been an independent technical consultant for 20 years. Mr. Cardozo has been an agronomist for over 30 years and completed postgraduate coursework at the School of Agronomy in Rennes, France in 1982 and postgraduate coursework in seeds at the University of Pelotas, Brazil in 1999. Mr. Cardozo has served as an associate professor of Beef Cattle at the Universidad de la República Oriental del Uruguay in Montevideo, Uruguay. Mr. Cardozo is a resident of Salto, Uruguay.
Edgardo Luis Cardozo Vázquez. Mr. Cardozo has served as a director of our company since our formation. Until January 2010, Mr. Cardozo also served as the Chief Technology Officer of UAG since our formation. Mr. Cardozo also served as a professor at the Universidad de la República Uruguay. Since March 2005, Mr. Cardozo has acted as a private consultant to various dairy and beef producers. From July 2003 to February 2005, Mr. Cardozo was the Vice Minister of Agriculture of Uruguay. He has also been acting as the general manager of the Forestry Society since 2000. Mr. Cardozo holds a B. Eng. Agronomy from Agriculture College, and a Ph.D. in Animal Science from Michigan State University in Michigan. Mr. Cardozo is a resident of Montevideo, Uruguay.
Jérôme Tordo. Mr. Tordo has served as a director of our company since December 2009. Mr. Tordo currently serves as president of Cypanga SAS and director of Financière SAM 2, a position he has held since December 2009 and 2007, respectively. Mr. Tordo is also a co-founder of Sycomore Asset Management. Mr. Tordo holds a Diplôme de L’École Supérieur de Commerce de Lyon from EM Lyon Business School. Mr. Tordo is a resident of Paris, France.
Jean Jacques Bragard. Mr. Bragard has served as a director of our company since December 2010. Mr. Bragard is a lawyer and partner at Bragard & Duran Abogados, which he founded in June 2011, prior to which he had been a partner at Sanguinetti, Fodere & Bragard Abogados since 2004. Mr. Bragard is a member of the Uruguayan Bar Association and holds a Doctor in Law and Social Sciences from the Universidad de la República Uruguay and has completed the Program on Negotiation (formerly the Program of Instruction for Lawyers) from Harvard Law School. Mr. Bragard is a resident of Montevideo, Uruguay.
Julio De Brun Mascheroni. Mr. De Brun has been the Executive Director of the Uruguayan Private Banks Association since 2005. He is a former Governor of the Central Bank of Uruguay and since 1996, he has been an economics professor at the Universidad ORT Uruguay. Mr. De Brun has degrees in accounting and economics from the Universidad de la República Uruguay. Mr. De Brun is a resident of Montevideo, Uruguay.
Roberto Vazquez Platero. Mr. Vazquez was appointed as a director of our company in June 2011. Mr. Vazquez is the former Uruguayan Minister of Agriculture and Fisheries. He currently serves as Chairman of the Board of Silvicultura Americana S.A., and has worked extensively as an advisor, guest lecturer and consultant for governmental and international institutions, private businesses and academic institutions since 2006. From 2000 to 2005, Mr. Vazquez was Chairman of the Board and Chief Executive Officer of Uruguay’s National Meat Institute, and Mr. Vazquez served as audit committee chair of the International Food Policy Research Institute in Washington D.C. from 2003 to 2006. Mr. Vazquez received his undergraduate degree in agronomy from the Universidad de la República Uruguay, and received his Masters of Science from the University of Idaho and his Ph.D. from Texas A&M University, in each case in Agricultural Economics. Mr. Vazquez is a resident of Montevideo, Uruguay.
Management Structure
Our management committee evaluates our operations based on the performance of each of our products and services. The members of our management committee are Juan Sartori, Oscar Baltasar Costa Martínez, Oscar León Bentancor, Silvio de Souza Rocha and Walter Cardozo Vázquez. Based on this decision-making process, we organize our operations by productive regions that share technical resources, machinery and equipment, with each region managed by a dedicated manager who is responsible for the products and services within his or her region. This allows each region to work independently while at the same time benefiting from synergies with
119
Table of Contents
other regions. Each regional manager reports information about the products and services within that region to Mr. de Souza, our Chief Operating Officer, Mr. Cardozo, our Head Agronomist and Chief Technology Officer, and Mr. León, our Chief Financial Officer, who in turn report company-wide information on products and services to our management committee. We also have an agronomist responsible for managing our supplies department and an agronomist responsible for managing our business development department.
Board of Directors
The board of directors is empowered to manage our business and affairs. Pursuant to our memorandum and articles of association, our board of directors must be composed of between one and twelve members. The directors are appointed by a shareholders’ resolution, including a majority of votes cast at the annual meeting of shareholders (except in case of a vacancy in the office of a director, a majority of the remaining directors may fill such vacancy to hold office under the next annual meeting of shareholders).
Currently, the board of directors has seven members: Juan Sartori, Oscar Baltasar Costa Martínez, Edgardo Luis Cardozo Vázquez, Jérôme Tordo, Jean Jacques Bragard, Julio De Brun Mascheroni and Roberto Vazquez Platero.
There are no agreements with majority shareholders, customers, suppliers or others governing the selection of any of the directors or members of senior management. None of our non-executive directors has a service contract with us that provides for benefits upon termination of directorship.
Each of Jérôme Tordo, Julio De Brun Mascheroni and Roberto Vazquez Platero is considered “independent” as defined under the NYSE rules and for purposes of Canadian securities laws. Under the NYSE rules, an independent director means a person other than an executive officer or employee of the company or any other individual having a relationship which, in the opinion of the company’s board of directors, would interfere with the exercise of independent judgment in carrying out the responsibilities of a director. A director is considered to be independent for the purposes of Canadian securities laws if the director has no direct or indirect material relationship to the company. A material relationship is a relationship that could, in the view of the board, be reasonably expected to interfere with the exercise of a director’s independent judgment. Certain individuals, such as employees and executive officers of the company, are deemed by Canadian securities laws to have material relationships with the company. Following the completion of this offering, we intend to appoint two additional members to our board of directors who will also be considered “independent” as defined under the NYSE rules and for purpose of Canadian securities laws.
Our non-independent company directors are Juan Sartori and Oscar Baltasar Costa Martínez. They are deemed to be non-independent because they are executive officers of the company.
Board Mandate
The mandate of our board of directors will be to oversee corporate performance and to provide quality, depth and continuity of management so that we can meet our strategic objectives.
Position Descriptions
Our board intends to develop and implement a written position description for each of the executive chairman and the chief executive officer.
Orientation and Continuing Education
Newly elected directors will be provided with orientation on our business and operations. This includes familiarization with our reporting structure, strategic plans, significant financial, accounting and risk issues and management and the external auditor.
120
Table of Contents
Ethical Business Conduct
The board intends to establish a Code of Business Conduct, or Code, to govern the conduct of our board of directors, executives, employees, contractors and agents.
Audit Committee
Our board intends to establish an audit committee in compliance with Rule 10A-3 under the Securities Exchange Act of 1934, as amended, or the Exchange Act, and the requirements of the NYSE prior to the completion of this offering. Upon completion of the offering, our audit committee will be comprised of Julio De Brun Mascheroni and Roberto Vazquez Platero. The board has determined that each of Messrs. De Brun and Vazquez is an appropriate person to serve on the audit committee, and is financially literate based on his educational background and significant work experience, including Mr. De Brun’s service as the Governor of the Central Bank of Uruguay and Mr. Vazquez’s service as audit committee chair of the International Food Policy Research Institute.
The principal duties and responsibilities of our audit committee will be to assist our board of directors in discharging its oversight of:
| • | the integrity of our financial statements and accounting and financial process and the audits of our financial statements; |
| • | our compliance with legal and regulatory requirements; |
| • | our external auditor’s qualifications and independence; |
| • | the work and performance of our financial management, internal auditor and external auditor; and |
| • | our system of disclosure controls and procedures and system of internal controls regarding finance, accounting, legal compliance, risk management and ethics established by management and our board. |
Our audit committee will have access to all books, records, facilities and personnel and may request any information about our company as it may deem appropriate.
Our audit committee will review and approve related party transactions and prepares reports for the board of directors on such related party transactions.
All members of the audit committee will have experience reviewing financial statements and dealing with related accounting and auditing issues. For additional information regarding each of Messrs. De Brun’s and Vazquez’s education and experience relevant to the performance of his duties as a member of the audit committee see “Management–Directors and Executive Officers”.
Pre-approval Policies and Procedures. From time to time, management will recommend to and request approval from the audit committee for audit and non-audit services to be provided by our auditors. The audit committee will consider such requests on an annual basis and, if acceptable, pre-approve such audit and non-audit services. During such deliberations, the audit committee will assess, among other factors, whether the services requested would be considered “prohibited services” as contemplated by the SEC, and whether the services requested and the fees related to such services could impair the independence of the auditors.
121
Table of Contents
External Auditor’s Fees. PricewaterhouseCoopers Ltda., Montevideo, Uruguay, an independent registered public accounting firm, is our auditor. Fees billed by PricewaterhouseCoopers Ltda. to UAG in fiscal years ending June 30, 2009 and 2010 were approximately $58,000 and $68,000, respectively, as detailed below.
| Fiscal Year 2009 | Fiscal Year 2010 | |||||||
| (in thousands) | (in thousands) | |||||||
Audit fees(1) | $ | 58 | $ | 56 | ||||
Tax fees(2) | — | 12 | ||||||
Total | $ | 58 | $ | 68 | ||||
| (1) | Audit fees billed by PricewaterhouseCoopers Ltda. relate to professional services rendered for the audit and review of UAG’s consolidated financial statements and, as required, certain of its subsidiaries. Does not include any fees related to this offering. |
| (2) | Tax fees billed by PricewaterhouseCoopers Ltda. relate to assistance with tax compliance, expatriate tax return preparation, tax planning and various advisory services. |
Nomination of Directors
Our board is responsible for identifying eligible candidates for membership on the board of directors and for recommending such candidates for election at annual general meetings. Our board is also be responsible for developing and recommending the adoption of corporate governance standards by the board, as well as assessing the effectiveness of the board and the audit committee in implementing such governance standards. Our board will periodically review the size and composition of the board and make changes to the composition of the board based on the risk, opportunities and strategic direction of UAG.
Assessments
Our board, the audit committee and our individual directors will be assessed on an annual basis. Each assessment will be conducted with reference to position descriptions, policies and guidelines established by UAG to provide our directors, officers and employees with guidance.
Compensation of Directors and Executive Officers
The compensation of our company’s directors and executive officers is approved at least annually at a meeting of the board of directors. To ensure an objective process for determining compensation, our board will consider a variety of pre-determined, objective criteria and consults with independent third party advisers. The aggregate compensation earned by our directors and executive officers during fiscal year 2010 amounted to $0.6 million. In addition, in fiscal year 2010, taking into account the option conversion described below, options to purchase 73,334 common shares were granted to our officers and directors, with an exercise price per share of $8.40 and expiry date of August 18, 2014. These grants were made under the Stock Option Plan described below.
We do not pay or set aside any amounts for pension, retirement or other similar benefits for our directors and executive officers.
On June 30, 2011, our board of directors agreed to issue $5.0 million of common shares and $1.0 million of restricted shares to certain of our executive officers as soon as practicable following completion of this offering at the initial public offering price. Based on the midpoint of the range on the cover page of this prospectus, we expect to issue 357,143 common shares and 71,429 restricted shares. The common shares will not be subject to vesting or forfeiture. The restricted shares are common shares that will be issued under our Equity Incentive Plan, which will vest at a rate of one-third per year and until vested will be subject to forfeiture in certain circumstances. See “—Union Agriculture Group Corp Equity Incentive Plan.”
122
Table of Contents
Union Agriculture Group Corp Stock Option Plan
We maintain the Union Agriculture Group Corp Stock Option Plan, or the Stock Option Plan. The Stock Option Plan provides for the grant of options to purchase common shares of our company.
The maximum number of common shares reserved for issuance under the Stock Option Plan, and any of our other security-based compensation arrangements, is equal to 10% of the number of outstanding common shares, subject to certain adjustments. Based on the total number of our common shares outstanding of 36,881,684 as of the date of this prospectus, 3,688,168 common shares are reserved for issuance of which 2,874,401 options to purchase common shares have been granted under our Stock Option Plan. Any common shares subject to options which have been cancelled or terminated will again be available for issuance under the Stock Option Plan.
Administration and Eligibility
The Stock Option Plan is administered by our board of directors, or a committee of our board of directors appointed by our board of directors. Our board of directors, or the appointed committee, has authority to generally: (i) grant options to eligible individuals, (ii) to determine the terms of the options grants, including any restrictions or conditions and the exercise date (subject to certain limitations) and exercise price of the option (subject to certain limitations on the price), (iii) to interpret the Stock Option Plan and to adopt, amend and rescind any administrative guidelines or rules relating to the Stock Option Plan, and (iv) to make any determinations or to take any actions in connection with the implementation and administration of the Stock Option Plan as it may deem necessary or advisable.
Individuals eligible to receive options under the Stock Option Plan include employees, officers, directors, consultants or investor relations personnel of UAG.
Amendment
Our board of directors (or the appointed committee) may amend or discontinue the Stock Options Plan, except participant consent will be needed if a participant’s rights are adversely affected.
Acceleration of Vesting
All outstanding options under the Stock Option Plan will become immediately exercisable upon certain change of control events, and the expiry date of such options shall remain the same, as described more fully in the Stock Option Plan. In addition, if our board of directors (or the appointed committee) declares it advisable in connection with a proposal sale or conveyance of all or substantially all of the property and assets of our company or a merger, consolidation, amalgamation or offer to acquire all of the outstanding common shares of our company, we may give written notice to all participants in the Stock Option Plan, after which time all of the options under the Stock Option Plan must be exercised within 30 days of the notice or the options will be terminated, as long as the proposed transaction is completed within 180 days of the notice.
Granted Options
Under the Stock Option Plan, as of the date of this prospectus, options to purchase 2,874,401 common shares have been granted and the weighted average exercise price of all granted options is $10.62.
Outstanding options under the Stock Option Plan either vest: (i) immediately at the date of grant, (ii) over a two-year period from the date they are granted at 25% every six months or (iii) over a four-year period from the date they are granted at 25% every year. Options are exercisable over a five-year period. The exercise price of the options may not be less than 100% of the fair market value of the underlying common shares at the date of grant.
No additional options will be granted under the Stock Option Plan.
123
Table of Contents
Union Agriculture Group Corp Equity Incentive Plan
We maintain the Equity Incentive Plan, or the Equity Incentive Plan, which provides for the grant of incentive stock options, nonstatutory stock options, restricted stock, stock appreciation rights, restricted stock units, performance units and performance shares, or awards.
The maximum number of common shares that may be issued pursuant to the Equity Incentive Plan is 3,678,855 plus an annual increase on the first day of each fiscal year beginning in 2012 equal to the lesser of (i) 10% of the outstanding shares on the first day of the fiscal year or (ii) such lesser amount as determined by the board of directors. Upon the payment of common shares pursuant to the exercise of an award under the Equity Incentive Plan, the number of common shares available for issuance under the Equity Incentive Plan shall be reduced only by the number of common shares actually issued in such payment. If a holder of awards pays the exercise price (or purchase price, if applicable) of an award through the tender of common shares, or if common shares are tendered or withheld to satisfy any company withholding obligations, the number of common shares so tendered or withheld shall again be available for issuance pursuant to future awards under the Equity Incentive Plan.
If outstanding awards expire or are terminated or canceled without having been exercised or settled in full, or if common shares are acquired pursuant to an award forfeited or repurchased by us, the common shares allocable to the terminated portion of such award or such forfeited or repurchased common shares shall again be available for grant under the Equity Incentive Plan.
Administration
The Equity Incentive Plan is administered by our board of directors, or a committee of our board of directors appointed by our board of directors. Our board of directors, or the appointed committee, has authority to: (i) determine the fair market value of the award; (ii) select the service providers (which may be an employee, director or consultant) to whom awards may be granted; (iii) determine the number of common shares to be covered by each award; (iv) approve forms of agreement for use under the Equity Incentive Plan; (v) determine the terms and conditions, not inconsistent with the terms of the Equity Incentive Plan, of any award; (vi) construe and interpret the terms of the Equity Incentive Plan and awards granted pursuant to the Equity Incentive Plan; (vii) prescribe, amend and rescind rules and regulations relating to the Equity Incentive Plan, including rules and regulations relating to sub-plans established for the purpose of satisfying applicable foreign laws and/or qualifying for preferred tax treatment under applicable foreign tax laws; (viii) modify or amend each award (subject to obtaining shareholder approval when required by applicable law), including the discretionary authority to extend the post-termination exercisability period of awards longer than is otherwise provided for in the Equity Incentive Plan; (ix) allow holders of awards to satisfy withholding tax obligations by electing to have the company withhold from the common shares or cash to be issued upon exercise or vesting of an award the number of common shares or cash having a fair market value equal to the minimum amount required to be withheld; (x) authorize any person to execute on behalf of the company any instrument required to effect the grant of an award previously granted; (xi) allow a holder of awards to defer the receipt of the payment of cash or the delivery of common shares that would otherwise be due to such holder under an award; (xii) determine whether awards will be settled in common shares, cash or any combination thereof; (xiii) determine whether awards will be adjusted for credit, at the discretion of the board of directors, at an amount equal to the value of dividends paid on common shares represented by such awards; (xiv) establish a program whereby service providers designated by the board of directors can reduce compensation otherwise payable in cash in exchange for awards under the Equity Incentive Plan; (xv) impose any restrictions, conditions or limitations as it determines appropriate as to the timing and manner of any resales by any holder of awards or other subsequent transfers by any holder of awards of any common shares issued as a result of or under an award; and (xvi) make any other determinations deemed necessary or desirable for the administration of the Equity Incentive Plan.
Options
The board of directors, or the appointed committee, may grant stock options under the Equity Incentive Plan to service providers. The term of each stock option granted under the Equity Incentive Plan will be no more than
124
Table of Contents
10 years from the date of grant, unless the recipient of the award holds more than 10% of the outstanding common shares of the company in which case the term of the stock options will not exceed five years. The exercise price will be determined by the board of directors, or the appointed committee, but will not be less than 100% of the fair market value of the common shares on the date of grant, unless the recipient of the award holds more than 10% of the outstanding common shares of the company in which case the exercise price will not be less than 110% of the fair market value of the common shares on the date of grant. The exercise price of stock options granted under the Equity Incentive Plan may be satisfied by way of cash, promissory note, a reduction in any debt owed by the holder to the company or a combination of these. Cashless exercise is also permitted.
Restricted Stock
The board of directors, or the appointed committee, may grant non-transferrable restricted shares under the Equity Incentive Plan to service providers. The restricted shares will be held by the company as escrow agent until the restrictions on such common shares have lapsed. Holders of restricted shares that have been granted under the Equity Incentive Plan will have voting rights and will be entitled to receive dividends unless otherwise provided in the agreement evidencing the award.
Stock Appreciation Rights
The board of directors, or the appointed committee, may grant stock appreciation rights under the Equity Incentive Plan to service providers. The board of directors, or the appointed committee, has the discretion to determine the terms and conditions attached to grants of stock appreciation rights provided, however, that the exercise price may not be less than 100% of the fair market value of the common shares on the date of grant.
On the exercise of a stock appreciation right, the holder will be entitled to receive an amount determined by multiplying the difference between the fair market value of a common share on the date of exercise over the exercise price times the number of shares with respect to which the stock appreciation right is exercised.
Performance Units and Performance Shares
The board of directors, or the appointed committee, may grant performance units and/or performance shares under the Equity Incentive Plan to service providers. The initial value of performance units will be established by the board of directors, or the appointed committee, on the date of grant. The performance shares will have an initial value equal to the fair market value of the common shares on the date of grant. The board of directors, or the appointed committee, will set performance objectives based upon the achievement of company-wide, divisional or individual goals and having a duration of at least 12 months, to determine the number of performance units or performance shares to be awarded.
Restricted Stock Units
The board of directors, or the appointed committee, may grant restricted stock units, which may be paid out in installments or on a deferred basis, under the Equity Incentive Plan to service providers
Non-Transferability
Unless determined otherwise by the board of directors, or the appointed committee, awards may not be sold, pledged, assigned, hypothecated, transferred, or disposed of in any manner.
Adjustments
In the event that any dividend or other distribution, recapitalization, stock split, reverse stock split, reorganization, merger, consolidation, split-up, spin-off, combination, repurchase, or exchange of common shares or other securities of the company, or other change in the corporate structure of the company affecting the
125
Table of Contents
common shares occurs such that an adjustment is determined by the board of directors, or the appointed committee, to be appropriate, then the board of directors, or the appointed committee, shall adjust the number and class of common shares which may be delivered under the Equity Incentive Plan.
Change of Control
In the event of a change in control, each outstanding award granted under the Equity Incentive Plan shall be assumed or an equivalent security substituted by the successor corporation or a parent or subsidiary of the successor corporation. In the event that the successor corporation refuses to assume or substitute for the award, the award shall fully vest.
Amendments and Termination
The board of directors, or the appointed committee, may amend or discontinue the Equity Incentive Plan, except that consent from the holder of the award is required for any material amendments.
Options to Purchase Securities
The following table sets forth the total number of common shares to be issued upon exercise of the options under the Stock Option Plan, the exercise price of the options awarded, the date of grant and the date of expiration, as of the date of this prospectus:
Date Granted | Option Expiry Date | Option Exercise Price ($) | Executive Officers(1) | Directors(2) | Employees(3) | Consultants(4) | ||||||||||||||
July 22, 2008 | July 22, 2013 | CDN$8.40 | 704,585 | — | — | — | ||||||||||||||
August 18, 2009 | August 18, 2014 | US$8.40 | 56,667 | — | — | — | ||||||||||||||
May 7, 2010 | May 7, 2015 | US$10.20 | 333,334 | — | — | — | ||||||||||||||
July 16, 2010 | July 16, 2015 | US$10.20 | 250,000 | — | 8,334 | 83,334 | ||||||||||||||
August 11, 2010 | August 11, 2015 | US$10.20 | 100,000 | — | — | 308,334 | ||||||||||||||
January 7, 2011 | January 7, 2016 | US$13.20 | 508,334 | 16,667 | 12,500 | 333,334 | ||||||||||||||
Total | 1,952,920 | 16,667 | 20,834 | 725,002 | ||||||||||||||||
| (1) | Includes all of our executive officers and past executives (5 individuals in total). |
| (2) | Includes all of our directors who are not also executive officers (5 individuals in total). |
| (3) | Includes all of our other employees or past employees (2 individuals in total). |
| (4) | Includes all of our consultants or past consultants (2 in total). |
126
Table of Contents
The following table sets forth information with respect to the beneficial ownership of our common shares as of the date of this offering, as adjusted to reflect the sale of the common shares offered in this offering by:
| • | our directors and executive officers individually and as a group; and |
| • | each person known to us to own beneficially more than 5% of our common shares. |
Beneficial ownership is determined in accordance with SEC rules, which generally attribute beneficial ownership of securities to each person or entity who possesses, either solely or shared with others, the power to vote or dispose of those securities. These rules also treat as outstanding all shares that a person would receive upon exercise of stock options or warrants, or upon conversion of convertible securities held by that person that are exercisable or convertible within 60 days of the determination date. Shares issuable pursuant to exercisable or convertible securities are deemed to be outstanding for computing the percentage ownership of the person holding such securities, but are not deemed outstanding for computing the percentage ownership of any other person. The percentage of beneficial ownership for the following table is based on 36,881,684 common shares outstanding as of the date of this prospectus, and 51,167,399 common shares outstanding immediately after the completion of this offering. To our knowledge, except as indicated in the footnotes to this table and pursuant to applicable community property laws, the persons named in the table have sole voting and investment power with respect to all common shares shown as beneficially owned by them.
The table below does not reflect the exercise of the underwriters’ option to purchase up to an additional common shares, which would be sold by us.
| Shares Beneficially Owned Prior to the Offering | Shares Beneficially Owned After the Offering | |||||||||||||||
| Name and Address of Beneficial Owner(1) | Number | % | Number | % | ||||||||||||
Five Percent Shareholders: | ||||||||||||||||
Wellington Management Company, LLP(2) | 6,511,699 | 17.7 | 6,511,699 | 12.7 | ||||||||||||
Columbia Wanger Asset Management, LP(3) | 4,393,940 | 11.9 | 4,393,940 | 8.6 | ||||||||||||
Sprott Resource Corp.(4) | 3,385,000 | 9.2 | 3,385,000 | 6.6 | ||||||||||||
Agrivent(5) | 2,430,156 | 6.6 | 2,430,156 | 4.7 | ||||||||||||
FCPR Ice Opportunity(6) | 2,200,491 | 6.0 | 2,200,491 | 4.3 | ||||||||||||
Executive Officers and Directors: | ||||||||||||||||
Juan Sartori | 1,881,387 | 5.1 | 1,881,387 | 3.7 | ||||||||||||
Oscar Baltasar Costa Martinez | * | * | * | * | ||||||||||||
Oscar León Bentancor | * | * | * | * | ||||||||||||
Walter Cardozo Vázquez | — | — | — | — | ||||||||||||
Edgardo Luis Cardozo Vázquez | * | * | * | * | ||||||||||||
Silvio de Souza Rocha | * | * | * | * | ||||||||||||
Jérôme Tordo(7) | * | * | * | * | ||||||||||||
Jean Jacques Bragard | — | — | — | — | ||||||||||||
Julio De Brun Mascheroni | — | — | — | — | ||||||||||||
Roberto Vazquez Platero | — | — | — | — | ||||||||||||
All directors and executive officers as a group (10 persons)(7) | 2,120,624 | 5.8 | 2,120,624 | 4.1 | ||||||||||||
| * | Owns less than 1% based on the total number of outstanding common shares of 36,881,684 as of the date of this prospectus. |
| (1) | Except as otherwise indicated, the address for each beneficial owner is c/o Union Agriculture Group Corp, Plaza Independencia 737 – 11000, Montevideo, Uruguay. |
| (2) | The address of Wellington Management Company, LLP is 280 Congress Street, Boston, Massachusetts 02210. |
127
Table of Contents
| (3) | The address of Columbia Wanger Asset Management, LP is 227 West Monroe, Suite 3000, Chicago, Illinois 60606. |
| (4) | The address of Sprott Resource Corp. is Royal Bank Plaza, South Tower, 200 Bay Street, Suite 2750, Toronto, Ontario M5J 2J2. |
| (5) | Cypanga, a French holding company, is the acting President of Agrivent. Cypanga is wholly-owned by Jérôme Tordo, and Mr. Tordo has discretionary voting and investment power over the UAG common shares owned by Agrivent. Mr. Tordo disclaims any beneficial interest in such common shares. The address of Agrivent is 23 Rue de Turenne 75004, Paris, France. |
| (6) | FCPR Ice Opportunity (FCPR) is managed by OFI Asset Management in its capacity as a regulated investment manager authorized by the French Market Authority (Autorité des Marchés Financiers). Jérôme Delmas, Hervé Aubert and Jean-Philippe Richaud of OFI Asset Management share voting and investment power with respect to the UAG common shares owned by FCPR. The address of FCPR is 1 Rue Vernier 75017, Paris, France. |
| (7) | Does not include common shares owned by Agrivent, as described in note (5) above. |
As of the date of this prospectus, 1,052,835 common shares representing 2.9% of our outstanding common shares are held by United States record holders.
Our principal shareholders have the same voting rights as our other shareholders.
128
Table of Contents
Service Fees with Union Capital Holding S.A. and Union Capital Management Ltd.
We paid Union Capital Holding S.A. service fees in connection with the private placements of our common shares in an aggregate amount of $254,085 in stock options in the nine months ended March 31, 2011, $42,836 in stock options in the nine months ended March 31, 2010, $42,836 in stock options in fiscal year 2010, $229,954 in stock options in fiscal year 2009 and $13,938 in stock options in fiscal year 2008. We also paid Union Capital Management Ltd., a wholly-owned subsidiary of Union Capital Holding S.A., service fees in connection with the private placements of our common shares in an aggregate amount of $2,664,938 in cash and $325,658 in stock options in the nine months ended March 31, 2011, $3,619,292 in cash and $107,242 in stock options in the nine months ended March 31, 2010, $3,619,292 in cash and $107,242 in stock options in fiscal year 2010, and $811,997 in cash in fiscal year 2009. Our Executive Chairman, Juan Sartori, is a shareholder of, and controls, Union Capital Holding S.A.
Service Fees with Vi Capital Investment
We paid Vi Capital Investment service fees in connection with the private placements of our common shares in an aggregate amount of $1,913,528 in the nine months ended March 31, 2011, $131,295 in stock options in the nine months ended March 31, 2010, $131,295 in stock options in fiscal year 2010 and $66,249 in stock options in fiscal year 2009. Mr. Sartori is a shareholder of, and controls, Vi Capital Investment.
Corporate Headquarters Lease
We lease our corporate headquarters in Montevideo, Uruguay from Woodport Limited, a British Virgin Islands based real estate entity. Our corporate headquarters is an office encompassing approximately 8,600 square feet, and is our main administrative and development center. We entered into the lease agreement on November 3, 2009, and such agreement became effective in May 2010 when we began using the property. The lease expires in May 2015 and contains customary market terms and conditions. We paid a fixed monthly fee for the first two years of the lease with a 5% increase starting the third year of the lease. We incurred rent expenses for the leased premises of $143,256 and $29,282 in the nine months ended March 31, 2011 and in fiscal year 2010, respectively. Mr. Sartori is a shareholder of, and controls, Woodport Limited.
Legal Fees
We paid fees to Sanguinetti, Fodere & Bragard Abogados, a Uruguayan-based law firm who we retained for local legal services, of $804,375 for the nine months ended March 31, 2011. During such time Jean Jacques Bragard, who has been on our board of directors since December 2010, was a partner of Sanguinetti, Fodere & Bragard Abogados.
129
Table of Contents
The following is a brief description of our share capital and the provisions of our memorandum and articles of association.
As of the date of this prospectus an aggregate of 36,881,684 common shares were issued and outstanding.
To our knowledge, as of the date of this prospectus, there are no shareholders’ arrangements or agreements the implementation or performance of which could, at a later date, result in a change in the control of Union Agriculture Group Corp in favor of a third person.
Our shares are governed by the laws of BVI, and our memorandum and articles of association. More information concerning shareholders’ rights can be found in the BVI Business Companies Act, and our memorandum and articles of association.
The following is a summary of the rights of the holders of our shares that are material to an investment in our common shares. These rights are set out in our memorandum and articles of association or are provided by applicable BVI law, and may differ from those typically provided to shareholders of U.S. companies under the corporation laws of some states of the United States. This summary does not contain all information that may be important to you. For more complete information, you should read our memorandum and articles of association, which we have filed with the SEC. For information on how to obtain a copy of our memorandum and articles of association, see “Where You Can Find More Information.”
General
Union Agriculture Group Corp was incorporated pursuant to the laws of BVI and is a company limited by shares. The company’s legal name is “Union Agriculture Group Corp.” Union Agriculture Group Corp was incorporated on January 2, 2008 and is incorporated for an indefinite period.
Our registered office is Vanterpool Plaza, 2nd floor, Wickhams Cay I, Road Town, Tortola, British Virgin Islands.
Union Agriculture Group Corp, as stated in Section 5 of our memorandum of association (Capacity and Powers), has full capacity to carry on or undertake any business or activity, do any act or enter into any transaction and, for such purposes, full rights, powers and privileges. Union Agriculture Group Corp may not carry on banking or trust company business, carry on business as an insurance or reinsurance company, insurance agent or insurance broker, carry on the business of company management or carry on business of providing the registered office or registered agent for companies incorporated in BVI.
Issuance of Shares
We are authorized to issue an unlimited number of common shares without par value and an unlimited number of preferred shares without par value.
Our articles of association authorize our board of directors to issue and grant options over or otherwise dispose of the shares to such persons, at such times, for such consideration and on such terms and conditions as the board of directors may determine.
Shares may not be issued until the consideration for the share is fully paid in money or in property or past services for such amount of consideration as our directors may from time to time by resolution determine, which amount shall be in the sole discretion of our directors without reference to any trading price of our shares. Our BVI counsel, Harney Westwood & Riegels, has advised us that under BVI law, our shares are non-assessable and shareholders are not liable to us or our creditors.
130
Table of Contents
Common Shares
The powers, preferences, rights, qualifications, limitations or restrictions thereof in respect to the common shares are as follows:
| (i) | the common shares will be junior to any preferred shares, once the preferred shares have been authorized, and are subject to all the powers, rights privileges, preferences and priorities of any preferred shares as set out in the memorandum and articles of association or in any resolution or resolutions adopted by the board pursuant to authority vested in it; |
| (ii) | the common shares have voting rights for the election of directors and for all other purposes, each holder of common shares being entitled to one vote for each share thereof held by such holder, except as otherwise required by law. Cumulative voting is not permitted; |
| (iii) | subject to the rights of the holders of any class of preferred shares, once the preferred shares have been authorized, holders of common shares shall be entitled to receive such dividends and distributions (whether payable in cash or otherwise) as may be declared on the common shares by the Board from time to time out of assets or funds of the company legally available therefor; and |
| (iv) | subject to the rights of the holders of any class of preferred shares, once the preferred shares have been authorized, in the event of any liquidation, dissolution or winding-up of the company, the assets of the company available for distribution to shareholders will be distributed pro rata among the holders of common shares. |
Our common shares have no conversion rights and there are no redemption or sinking fund provisions applicable to our common shares.
Preferred Shares
Our board of directors is authorized to issue, from time to time, one or more classes of preferred shares and, with respect to each such class, to fix by resolution the voting powers, full or limited, if any, of the shares of such class and the preferences and relative, participating, optional or other special rights and the qualifications, limitations or restrictions thereof. The authority of our board of directors with respect to the establishment of the preferences and the relative, participating, optional or other special rights and the qualifications, limitations or restrictions of each class include, but is not limited to, the determination or fixing of the following:
| (i) | the dividend rate of such class, the conditions and dates upon which such dividends will be payable, the relation which such dividends shall bear to the dividends payable on any other class or classes of the shares, and whether such dividends shall be cumulative or non-cumulative; |
| (ii) | whether the shares of such class shall be subject to redemption for cash, property or rights, including securities of the company or of any other corporation, by the company at the option of either the company or the holder or both or upon the happening of a specified event, and, if made subject to any such redemption, the times or events, prices and other terms and conditions of such redemption; |
| (iii) | the terms and amount of any sinking fund provided for the purchase or redemption of the shares of such class; |
| (iv) | whether or not the class of preferred shares shall be convertible into, or exchangeable for, at the option of either the holder or the company or upon the happening of a specified event, shares of any other class or classes or of any other class or classes of the company’s shares, and, if provision be made for conversion or exchange, the times or events, prices, rates, adjustments and other terms and conditions of such conversions or exchanges; |
| (v) | the restrictions, if any, on the issue or reissue of any additional preferred shares; |
| (vi) | the provisions as to voting (which may be one or more votes per share or a fraction of a vote per share), and the number of votes of the shares of such class of preferred shares relative to the common shares |
131
Table of Contents
| and any other class of preferred shares), optional and/or other special rights and preferences, if any, and whether the shares of such class of preferred shares shall vote separately from other classes of shares of the company; and |
| (vii) | the rights of the holders of the shares of such class upon the voluntary or involuntary liquidation, dissolution or winding-up of the company. |
Form and Transfer of Shares
Our shares are issued in registered form only and are freely transferable. BVI law does not impose any limitations on the rights of BVI or non-BVI residents to hold or vote our shares.
Our shares are deemed to be issued when the name of the shareholder is entered in the register of shareholders. A register of shareholders must be kept by the company and must contain the name and address of the person who holds shares, the number of each class of shares held by each shareholder, the date on which the name of each shareholder was entered in the register of shareholders and the date on which any person ceased to be a shareholder.
Pursuant to our articles of association, shares may be transferred by a written instrument of transfer signed by the transferor and containing the name and address of the transferee and, in the case of the transfer of a share that imposes a liability to the company on the transferee, the instrument of transfer must also be signed by the transferee. We are not required to treat a transferee of a share as a shareholder until the transferee’s name has been entered in the register of shareholders. Subject to the articles of association, we will, on receipt of a duly executed instrument of transfer, enter in the register of shareholders the name of the transferee of the shares.
We have appointed Icaza, Gonzalez-Ruiz & Aleman (BVI) Trust Limited as our registered agent and American Stock Transfer & Trust Company, LLC and Equity Financial Trust Company as our co-transfer agents and co-registrars.
Pre-emptive Rights
In connection with the private placements of our common shares that took place in July 2008, June 2009, March 2010 and December 2010 and January 2011, pre-emptive rights were granted to each purchaser which entitled such purchaser to subscribe for additional common shares to maintain itspro rata interest in our company. The pre-emptive rights granted in the June 2009 and March 2010 private placements will become void as a result of this offering, upon the receipt being issued for a prospectus by a securities commission in a jurisdiction in Canada. The pre-emptive rights granted in the December 2010 and January 2011 private placement will also become void as a result of this offering. The pre-emptive rights granted in each of these offerings are void upon a transfer of the shares to which the pre-emptive rights are attached.
As the pre-emptive rights granted in the July 2008 private placement that were not voided as a result of a transfer would remain in effect after the completion of this offering, we have obtained waivers of the pre-emptive rights from all but one of our shareholders that purchased its shares in the July 2008 private placement. Pursuant to the terms of the waivers, the pre-emptive rights will be terminated upon the listing of our common shares on the NYSE. The shareholder that did not provide a waiver holds less than 0.1% of our outstanding common shares and will continue to have the benefit of its pre-emptive rights. This means that such shareholder will have the right to participate on a pro rata basis in this offering and any future offerings of our common shares, unless and until we list our common shares on the Toronto Stock Exchange.
Liquidity Rights
Investors who purchased our common shares in the private placement of our common shares in December 2010 and January 2011, or upon the exercise of pre-emptive rights following the December 2010 and January 2011 private placement, were granted certain liquidity rights with respect to the common shares purchased.
132
Table of Contents
Pursuant to such liquidity rights, as soon as practicable following the private placement, we agreed to use our best efforts to cause one of the following liquidity transactions to occur: (i) complete an underwritten initial public offering of our common shares through the filing of a registration statement with the SEC, and the listing of our common shares on the NYSE; (ii) complete a transaction which results in such shareholders receiving our common shares listed on the NYSE; or (iii) complete a transaction pursuant to which an all-cash offer is made by a third party to our shareholders to acquire all of the common shares held by such shareholders, which transaction is accepted by shareholders resulting in a sale of more than 50% of the issued and outstanding common shares. In the event that none of the liquidity transactions described in the last sentence has occurred prior to (i) September 30, 2011, the holders of such common shares will receive, for no additional consideration, one-tenth of one common share and, if such transactions have not occurred prior to (ii) December 31, 2011, the holders of such common shares will receive, for no additional consideration, an additional one-twentieth of one common share, in each case, unless waived by holders holding at least 60% of such common shares.
Mortgages and Charges of Shares
Pursuant to the articles of association, shareholders may mortgage or charge their shares and upon satisfactory evidence thereof the company will give effect to the terms of any valid mortgage or charge except insofar as it may conflict with the articles of association for consent to the transfer of shares.
Where particulars of a mortgage or charge are registered, such particulars shall only be cancelled with the consent of the named mortgagee or charge or anyone authorized to act on his behalf, or upon evidence satisfactory to the board of directors of the discharge of the liability secured by the mortgage or charge and the issue of such indemnities as the board of directors shall consider necessary or desirable.
While particulars of a mortgage or charge are registered, no transfer of any share comprised therein shall be effected without the written consent of the named mortgagee or chargee or anyone authorized to act on his behalf.
Repurchase of Shares
Pursuant to our memorandum and articles of association, we may purchase, redeem or otherwise acquire and hold our own shares, subject to applicable securities laws and subject to the following conditions:
| • | we may not purchase, redeem or otherwise acquire our own shares without the consent of shareholders whose shares are to be purchased, redeemed or otherwise acquired; |
| • | we may only offer to acquire shares if at the relevant time the directors determine by resolution of directors that immediately after the acquisition the value of our assets will exceed our liabilities and we will be able to pay our debts as they fall due; |
| • | shares that we purchase, redeem or otherwise acquire may be cancelled or held as treasury shares except to the extent that such shares are not in excess of 50% of the issued shares in which case they will be cancelled; |
| • | all rights and obligations attaching to a repurchased share are suspended and shall not be exercised by us while we hold the share; |
| • | shares that have been repurchased by us may be disposed of by us on such terms and conditions (not otherwise inconsistent with the articles of association) as we may, by resolution of directors, determine; and |
| • | where shares are held by another corporative body of which we hold directly or indirectly, shares having more than 50% of the votes in the election of directors of the other body corporate, all rights and obligations attaching to the shares held by the other body corporate are suspended and shall not be exercised by the other body corporate. |
133
Table of Contents
Meetings of Shareholders
In accordance with BVI law and our articles of association, our directors may convene meetings of the shareholders at such times and in such manner and places within or outside BVI as the directors consider necessary or desirable. The directors are required to convene a meeting of the shareholders at least once in each calendar year at which the election of directors and the appointment or re-appointment of the auditors, shall be put to a resolution of shareholders and the financial statements for the previous fiscal year shall be presented.
A resolution of shareholders is a resolution (a) approved at a duly convened and constituted meeting of the shareholders by the affirmative vote of (i) a majority of the votes of the common shares that were present at the meeting and entitled to vote thereon and were voted and did not abstain if there is one class of shares at the time of the meeting; or (ii) a majority of the votes of each class of shares which were present at the meeting and entitled to vote thereon as a class and were voted and not abstained if there is more than one class of shares at the time of the meeting; or (b) consented to in writing by (i) all of the votes of common shares entitled to vote thereon and were voted and did not abstain if there is more than one class of shares at the time of the resolution; or (ii) all of the votes of each class of shares entitled to vote thereon as a class and were voted and not abstained if there is more than one class of shares at the time of the resolution.
Special meetings of shareholders for any purpose may be called by the board of directors pursuant to a resolution adopted by a majority of the board of directors, to be held at such place, date and time as designated in the notice.
Each of our shares entitles the holder thereof to attend our annual meeting of shareholders, either in person or by proxy, to address the annual meeting of shareholders, and to exercise voting rights, subject to the provisions of our articles of association. A meeting of shareholders is properly constituted, for all purposes, if at the commencement of the meeting, there are present in person or by proxy shareholders entitled to exercise at least thirty per cent of the voting rights of the shares of each class of shares.
A shareholder may act at any meeting of shareholders by appointing another person as his proxy, which proxy shall be in writing substantially in the form set out in the articles of association in order to enable shareholders to exercise their right to vote. The instrument appointing a proxy shall be produced at the place appointed for the meeting before the time for holding the meeting at which the person named in such instrument proposes to vote.
Our directors may fix the date notice is given of a meeting of shareholders, or such other date as may be specified in the notice, and give notice to those persons whose names on the record date appear as shareholders in the register of shareholders of the company and are to vote at the meeting, to the other directors and auditors of the company. We are required to give not less than 21 days notice of meetings of shareholders.
No business may be transacted at an annual meeting of shareholders, other than business that is either (a) specified in the notice of meeting (or any supplement thereto) given by or at the direction of our directors (or any duly authorized committee thereof), (b) otherwise properly brought before the annual meeting by or at thedirection of our directors (or any duly authorized committee thereof) or (c) otherwise properly brought before the annual meeting by any of our shareholders who (i) is a shareholder of record on both (x) the date of the giving of the notice of the shareholder meeting and (y) the record date for the determination of shareholders entitled to vote at such annual meeting and (ii) complies with the notice procedures set forth in the articles of association. For business to be properly brought before an annual meeting by a shareholder, such shareholder must have given timely notice thereof in proper written form to our Secretary in accordance with the specific provisions set out in our articles and memorandum of association.
No action may be taken by shareholders except an annual or special meeting of shareholders called in accordance with the articles of association and no action may be taken by the shareholders by written consent without a meeting.
134
Table of Contents
Amendment to the Articles of Association
We may amend the memorandum of association or articles of association by a resolution of shareholders or by resolution of directors, except that no amendment may be made by resolution of directors with respect to the following matters:
| • | to restrict the rights or powers of the shareholders to amend the memorandum of association or the articles of association; |
| • | to change the percentage of shareholders required to pass a resolution of shareholders to amend the memorandum of association or the articles of association; or |
| • | in circumstances where the memorandum of association or the articles of association cannot be amended by the shareholders. |
No Appraisal Rights
Neither BVI law nor our articles of association provide for any appraisal rights of dissenting shareholders.
Distributions
We may, from time to time, by a resolution of directors authorize a distribution at a time, and of an amount, and to any shareholders we think fit if the directors are satisfied, on reasonable grounds, that immediately after the distribution: (i) the value of our assets will exceed our liabilities and (ii) we will be able to pay our debts as they become due.
Distributions may be paid in money, shares or other property. Notice of any distribution that may have been authorized is to be given to each shareholder and all distributions unclaimed for three years after having been declared may be forfeited by resolution of directors. No distribution shall bear interest and no distribution shall be authorized or made on shares that we have repurchased and hold at the time of the distribution.
Board of Directors
The management of Union Agriculture Group Corp is vested in a board of directors. Our articles of association provide that the board must comprise at least one member and no more than twelve members. Currently our board has 8 members (see “Management”). The board meets as often as required by our interests.
Subject to any rights of the holders of any class of preferred shares, to elect additional directors under specified circumstances, the directors are appointed for a period of three years; provided however the directors shall be elected on a staggered basis, with one-third of the directors being elected each year and provided further that such three year term may be exceeded by a period up to the annual meeting held following the third anniversary of the appointment. Directors are not required to own shares of the company.
A director may resign at any time by delivering his written resignation to the board, such resignation to specify whether it will be effective at a particular time, upon receipt by or at the pleasure of the board. The Chairman shall be Juan Sartori until his resignation. When one or more directors resigns from the board, effective at a future date, a majority of the directors then in office, including those who have so resigned, have power to fill such vacancy or vacancies and each director so chosen shall hold office for the unexpired portion of the term of the director whose place was vacated and until his successor has been duly elected.
Subject to any rights of the holders of any class of preferred shares then outstanding, once preferred shares have been authorized, (a) any director, or the entire board of directors, other than the Chairman, may be removed from office at any time, but only for cause, by the affirmative vote of the holders of record of outstanding shares representing at least 80% of the voting power of all the shares then entitled to vote generally in the election of directors, voting together as a single class and (b) any director, other than the Chairman, may be removed from office at any time, but only for cause, by a resolution of directors.
135
Table of Contents
We are required to keep a register of directors containing (a) the names and addresses of the persons who are directors, (b) the date on which each person whose name is entered in the register of directors was appointed as a director, (c) the date on which each person named as a director ceased to be a director and (d) such other information as may be required to be kept by the BVI Business Companies Act or regulations issued in accordance with the BVI Business Companies Act.
The directors have the power to appoint officers and agents of our company. Currently our board of directors has appointed the officers listed under “Management—Executive Officers.” Every officer or agent has such powers and authority of the directors as are set forth in the articles of association or in the resolution of directors appointing the officer or agent, except that no officer or agent has any power or authority with respect to matters requiring a resolution of directors under the BVI Business Companies Act or the articles of association.
The directors may exercise all the powers of the company to borrow money and to mortgage or change its undertakings and property or any part thereof, to issue debentures, debenture stock and other securities whenever money is borrowed or as security for any debt, liability or obligation of the company or of any third party. The directors may, at any time, by power of attorney, appoint any company, firm or person or body of persons, to be the attorney or attorneys of the company for such purposes and with such powers, authorities and discretions and for such period and subject to such conditions as they may think fit and may also authorize any such attorney or attorneys to delegate all or any powers, authorities and discretions vested in them.
The directors or any board committee may meet at such times and in such manner and places within or outside BVI as the directors may determine to be necessary or desirable. A meeting of directors is duly constituted for all purposes if, at the commencement of the meeting, there are present in person not less than one-half of the total number of directors.
The directors keep (a) minutes of all meetings of directors, shareholders, committees of directors, committees of officers and committees of shareholders and (b) copies of all resolutions consented to by directors, shareholders, committees of directors, committees of officers and committees of shareholders.
Committees
Our board of directors may (but shall not be obliged to unless required by law) establish one or more committees and for which it shall, if one or more of such committees are set up, appoint the members (who may be but do not need to be board members), determine the purpose, powers and authorities as well as the procedures and such other rules as may be applicable thereto (subject as to the audit committee as set forth therein).
Each committee of directors has such powers, and authorities of the directors, as are set forth in the resolution of directors establishing the committee, except that no committee has any power or authority: (a) to amend the memorandum of association or the articles of association; (b) to designate committees of the directors; (c) to delegate powers to a committee of directors; (d) to appoint directors; (e) to appoint agents; (f) to approve a plan of merger, consolidation or arrangement; (g) to make a declaration of solvency or approve a liquidation plan; (h) to submit to the shareholders any question or matter requiring the approval of shareholders; (i) to fill a vacancy in the office of auditor; (j) to issue securities except as authorized by the directors; (k) to declare dividends; (l) to purchase, redeem or otherwise acquire shares issued by the company; or (m) to approve any financial statements.
We expect that our board will set up an audit committee prior to the completion of this offering.
Officers
Officers of the company shall perform such duties as shall be prescribed at the time of their appointment subject to any modification in such duties as may be prescribed thereafter by resolution of directors.
136
Table of Contents
The officers of the company shall hold office until their successors are duly elected and qualified, but any officer elected or appointed by the directors may be removed at any time, with or without cause, by resolution of directors. Any vacancy occurring in any office of the company may be filled by resolution of directors.
Conflict of Interest
Upon becoming aware of the fact that a director is interested in a transaction entered into or to be entered into by us, the director of officer must disclose the interest to all of our directors.
A transaction entered into by us is not voidable by us if:
| • | the material facts of the interest of the director in the transaction are known by our directors and the transaction is approved or ratified by a resolution of directors; or |
| • | we received fair value for the transaction, and such determination of fair value is made on the basis of the information known to us and the interested director at the time that the transaction was entered into. |
A director or officer who is interested in a transaction entered into or to be entered into by us may not:
| • | if such person is a director, vote on a matter relating to the transaction; |
| • | attend a meeting of directors (as a director or as an invitee) at which the matter relating to the transaction arises and be included among the directors present at the meeting for the purpose of a quorum; and |
| • | sign a document on behalf of us, or do any other thing in the capacity of a director or officer, that relates to the transaction. |
Indemnification
Directors and other officers, past and present, are entitled to indemnification from us to the fullest extent permitted by law against liability and all expenses reasonably incurred by such director in connection with any claim, action, suit or proceeding in which he is involved by virtue of his being or having been a director. We may purchase and maintain for any director or other officer insurance against any such liability.
The indemnification from us only applies if such person acted honestly and in good faith with a view to the best interests of Union Agriculture Group Corp and, in the case of criminal proceedings, the person had no reasonable cause to believe that his conduct was unlawful.
Business Combinations with Interested Shareholders
We are not permitted to engage in any business combination with any “interested shareholder” (as defined in our memorandum and articles of association) for a period of three years following the time that such shareholder became an interested shareholder, unless:
| (a) | prior to such time, the board approved either the business combination or the transaction which resulted in the shareholder becoming an interested shareholder; |
| (b) | upon consummation of the transaction which resulted in the shareholder becoming an interested shareholder, the interested shareholder owned at least 85% of the voting shares outstanding at the time the transaction commenced, excluding for purposes of determining the voting shares outstanding (but not the outstanding voting shares owned by the interested shareholder) those shares owned (i) by persons who are directors and also officers and (ii) employee share plans in which employee participants do not have the right to determine confidentially whether shares held subject to the plan will be tendered in a tender or exchange offer; or |
| (c) | at or subsequent to such time the business combination is approved by the board and authorized at an annual or special meeting of shareholders, and not by written consent, by the affirmative vote of at least 66 2/3% of the outstanding voting shares which is not owned by the interested shareholders. |
137
Table of Contents
Liquidation
In the event of the liquidation, dissolution or winding-up of Union Agriculture Group Corp, the assets remaining after allowing for the payment of all liabilities will be paid out to the shareholders pro rata to their respective shareholdings. The plan of liquidation must be approved by special resolution of shareholders.
A special resolution is a resolution (a) approved at a duly convened and constituted meeting of the shareholders by the affirmative vote of (i) not less than 66 2/3% of the votes of the common shares that were present at the meeting and entitled to vote thereon and were voted and did not abstain if there is one class of shares at the time of the meeting or (ii) if any class of preferred shares is entitled to vote as a separate class, not less than 66 2/3% of the votes of such preferred shares entitled to vote thereon as a class and were voted and not abstained.
Voluntary Winding Up and Dissolution
We may appoint a voluntary liquidator by a resolution of shareholders or, subject to the BVI Business Companies Act, by a resolution of directors. In the event of liquidation, the plan of liquidation is required to be approved by a special resolution of shareholders.
Transfer Agent and Registrar
We have appointed Icaza, Gonzalez-Ruiz & Aleman (BVI) Trust Limited as our registered agent. The co-transfer agents and co-registrars for our common shares are American Stock Transfer & Trust Company, LLC and Equity Financial Trust Company.
Continuation
We may by special resolution of shareholders continue as a company incorporated under the laws of a jurisdiction outside BVI in the manner provided under those laws.
Canadian Securities Laws
Upon obtaining a final receipt for our Canadian prospectus from the securities regulatory authorities in each of the provinces of Canada except Québec, UAG will become a reporting issuer in these provinces. UAG will also be subject to Canadian take-over bid rules and minority shareholder protection rules under applicable Canadian securities laws.
Takeover Bids
Under Canadian securities laws, if any person offers to acquire or acquires one or more voting shares of a class of a corporation and, after giving effect to such acquisition, such person would beneficially own or owns greater than 20% or more of the outstanding shares of the class, the person must, subject to certain exceptions, make the offer to all holders of the shares of the class for identical consideration. The offeror commencing the bid is required to send to each holder of the securities in Canada a takeover bid circular in prescribed form and allow the securities to be deposited under the bid for at least 35 days before taking up such securities. Once a takeover bid has been commenced, the directors of the offeree issuer are required to prepare and send a circular in a prescribed form to each holder of the securities resident in Canada evaluating the bid and advising the shareholders whether to accept or reject the bid.
Minority Shareholder Protection
Under Multilateral Instrument 61-101—Protection of Minority Security Holders in Special Transactions, or MI 61-101, there are restrictions on an issuer’s ability to carry out a “related party transaction” or a “business
138
Table of Contents
combination.” A related party transaction means, generally, any transaction by which an issuer, directly or indirectly consummates one or more specified transactions with a related party, including purchasing or disposing of an asset, issuing securities and assuming liabilities. Related parties include directors and senior officers of an issuer and holders of voting securities carrying more than 10% of the voting rights attaching to all issued and outstanding voting securities or of a sufficient number of securities of the issuer to materially affect control of the issuer. A business combination includes arrangements, amalgamations and other corporate transactions involving a related party where the interest of a holder of equity securities in the issuer can be terminated without the holder’s consent. Where a business combination or related party transaction is proposed to be completed, subject to certain exceptions, MI 61-101 requires, among other things: (i) detailed disclosure in the proxy material sent to shareholders in connection with the transaction; (ii) the preparation of a formal valuation with respect to the subject matter of the transaction, and the inclusion of a summary of the valuation in the proxy materials; and (iii) approval of the transaction by a majority of the votes cast by disinterested shareholders of the issuer.
After completion of this offering we will be considered an “SEC foreign issuer” in Canada under National Instrument 71-102 –Continuous Disclosure and Other Exemptions Relating to Foreign Issuers. As a result, the requirements of MI 61-101 relating to related party transactions and business combinations will not apply to us if the total number of our equity securities owned directly or indirectly by residents of Canada does not exceed 20% on a diluted basis, of our total equity securities. There can be no assurance following completion of this offering that greater than 20% of our equity securities will be owned directly or indirectly by residents of Canada.
139
Table of Contents
COMMON SHARES ELIGIBLE FOR FUTURE SALE
Upon completion of this offering we will have 51,167,399 common shares issued and outstanding (assuming no exercise of the underwriters’ over-allotment option).
Lock-up Agreements
In connection with this offering, we have generally agreed that, without the prior written consent of Credit Suisse Securities (USA) LLC and J.P. Morgan Securities LLC, on behalf of the underwriters, we will not, subject to certain exceptions, during the period commencing on the date of the underwriting agreement and ending 180 days after the date of the underwriting agreement, offer or sell any common shares or securities convertible into or exchangeable or exercisable for common shares. However, in the event that either (1) during the last 17 days of the 180-day “lock-up” period, we release earnings results or material news or a material event relating to us occurs or (2) prior to the expiration of the 180-day “lock-up” period, we announce that we will release earnings results during the 16-day period beginning on the last day of the 180-day “lock-up” period, then in either case the expiration of the “lock-up” period will be extended until the expiration of the 18-day period beginning on the date of the release of the earnings results or the occurrence of the material news or event, as applicable, unless Credit Suisse Securities (USA) LLC and J.P. Morgan Securities LLC, on behalf of the underwriters waive, in writing, such extension.
In connection with this offering, we expect that our officers, directors and certain significant shareholders will each enter into a lock-up agreement under which they have generally agreed, subject to certain exceptions, not to offer or sell any common shares or securities convertible into or exchangeable or exercisable for common shares, without the prior written consent of Credit Suisse Securities (USA) LLC and J.P. Morgan Securities LLC, on behalf of the underwriters, for a period of 180 days after the date of the underwriting agreement. However, in the event that either (1) during the last 17 days of the 180-day “lock-up” period, we release earnings results or material news or a material event relating to us occurs or (2) prior to the expiration of the 180-day “lock-up” period, we announce that we will release earnings results during the 16-day period beginning on the last day of the 180-day “lock-up” period, then in either case the expiration of the “lock-up” period will be extended until the expiration of the 18-day period beginning on the date of the release of the earnings results or the occurrence of the material news or event, as applicable, unless Credit Suisse Securities (USA) LLC and J.P. Morgan Securities LLC, on behalf of the underwriters waive, in writing, such extension. See “Underwriting.”
Other than this offering, we are not aware of any plans by any significant shareholders to dispose of significant numbers of our common shares. However, one or more existing shareholders may dispose of significant numbers of our common shares. We cannot predict what effect, if any, future sales of our common shares, or the availability of common shares for future sale, will have on the market price of our common shares from time to time.
Rule 144
In general, under Rule 144 as currently in effect under the Securities Act of 1933, as amended, once we have been subject to public company reporting requirements for at least 90 days, a person who is not deemed to have been one of our “affiliates” for purposes of the Securities Act of 1933, as amended, at any time during 90 days preceding a sale and who has beneficially owned the common shares proposed to be sold for at least six months, including the holding period of any prior owner other than our “affiliates,” is entitled to sell those common shares without complying with the manner of sale, volume limitation or notice provisions of Rule 144, subject to compliance with the public information requirements of Rule 144. If such a person has beneficially owned the common shares proposed to be sold for at least one year, including the holding period of any prior owner other than our “affiliates,” then such person is entitled to sell such common shares without complying with any of the requirements of Rule 144. In general, under Rule 144, as currently in effect, our “affiliates” or persons
140
Table of Contents
selling shares on behalf of our “affiliates” are entitled to sell upon expiration of the lock-up agreements described above, within any three month period beginning 90 days after the date of this prospectus, a number of common shares that does not exceed the greater of:
| • | 1% of the then outstanding common shares, which will equal approximately 511,674 common shares after this offering; and |
| • | the average weekly trading volume of our common shares during the four calendar weeks preceding the filing of a notice on Form 144 with respect to that sale. |
Sales under Rule 144 by our “affiliates” or persons selling common shares on behalf of our affiliates are also subject to provisions relating to notice, manner of sale, volume limitations and the availability of current public information about us.
Canadian Resale Restrictions
Under Canadian securities laws, a person who owns our common shares or a security convertible into our common shares (including options granted to our directors, officers and employees) prior to this offering, will generally be able to sell those shares, or the shares issued upon the conversion of that convertible security, in Canada without complying with the prospectus delivery requirement following the issuance of a receipt from the Canadian securities regulators for the final Canadian prospectus. Any sales of our common shares in Canada will be subject to the terms of the lock-up agreements described above. There are restrictions on the ability of “control persons” who hold our common shares to dispose of the shares they hold. A control person is any person, company or combination of persons or companies holding a sufficient number of our voting shares to affect materially the control of us, and any person, company or combination holding more than 20% of the voting rights attached to our common shares, will, in the absence of evidence to the contrary, be deemed to affect materially the control of us. Such persons may only sell in compliance with the prospectus delivery requirements under Canadian securities legislation or in accordance with an exemption from such requirements. If common shares or convertible securities are distributed by us on a prospectus-exempt basis following the issuance of a receipt for the final Canadian prospectus, those securities, or the shares issued upon the conversion of those convertible securities, may not be resold, except under a prospectus or an exemption from the prospectus requirement, until four months have passed since the issuance of the receipt for the final Canadian prospectus (and in certain cases, until four months have passed since the date on which we distributed those securities), at which time such a person will generally be able to freely sell those shares in Canada.
141
Table of Contents
Material U.S. Federal Income Tax Considerations
The following is a discussion of the material U.S. federal income tax considerations to a U.S. Holder (as defined below) associated with the acquisition, ownership and disposition of the common shares, and to the extent it discusses matters of law and legal conclusions, constitutes the opinion of Paul, Weiss, Rifkind, Wharton & Garrison LLP, our U.S. counsel. This discussion does not consider all aspects of U.S. federal income taxation that may be relevant to U.S. Holders in light of their particular circumstances or that may be relevant to certain types of U.S. Holders subject to special tax rules, including banks, financial institutions or other financial services entities, broker-dealers, dealers in securities or currencies, insurance companies, tax-exempt organizations, regulated investment companies, real estate investment trusts, retirement plans, individual retirement accounts or other tax-deferred accounts, persons who use or are required to use mark-to-market accounting, persons that hold common shares as part of a “straddle,” a “hedge” or a “conversion transaction,” persons with a functional currency other than the U.S. dollar, persons who directly or by attribution own at least 10% of our company’s voting power, certain former citizens or residents of the United States, and persons subject to the alternative minimum tax. This discussion also does not address any foreign, state or local tax considerations, nor does it address any U.S. federal tax considerations other than U.S. federal income tax considerations. This discussion assumes that U.S. Holders hold their common shares as “capital assets” within the meaning of Section 1221 of the U.S. Internal Revenue Code of 1986, as amended, or the Code. This discussion is based on the Code and applicable U.S. Treasury regulations, rulings, administrative pronouncements and decisions as of the date hereof, all of which are subject to change or differing interpretations at any time with possible retroactive effect. Any views expressed within this discussion are not binding on the U.S. Internal Revenue Service, or the IRS, or the courts. No assurance can be given that the IRS or the courts will agree with the tax consequences described herein.
For purposes of this discussion, a “U.S. Holder” is a beneficial owner of common shares that is: (i) an individual citizen or resident of the United States for U.S. federal income tax purposes; (ii) a corporation (or other entity treated as a corporation for U.S. federal income tax purposes) created or organized in or under the laws of the United States, any state thereof, or the District of Columbia; (iii) an estate the income of which is subject to U.S. federal income taxation regardless of its source; or (iv) a trust if a court within the United States is able to exercise primary supervision over its administration and one or more U.S. persons have authority to control all substantial decisions of the trust or if the trust has a valid election in effect under applicable U.S. Treasury regulations to be treated as a U.S. person.
If a partnership (or other entity treated as a partnership for U.S. federal income tax purposes) holds common shares, the tax treatment of a partner in the partnership will depend upon the status of the partner and the activities of the partnership. Partners of partnerships holding common shares are encouraged to consult their own tax advisors.
EACH HOLDER IS ENCOURAGED TO CONSULT ITS TAX ADVISOR REGARDING THE SPECIFIC U.S. FEDERAL, STATE, LOCAL, FOREIGN AND OTHER TAX CONSIDERATIONS OF THE ACQUISITION, OWNERSHIP AND DISPOSITION OF COMMON SHARES.
Passive Foreign Investment Company Considerations
A foreign corporation will be classified as a PFIC for U.S. federal income tax purposes for any taxable year if either: (i) 75% or more of its gross income in a taxable year is passive income, or the income test, or (ii) 50% or more of the average value of its gross assets is attributable to assets that produce passive income or are held for the production of passive income, or the asset test. Passive income for this purpose generally includes dividends, interest, royalties, rents, certain gains from commodities and securities transactions and the excess of gains over losses from the disposition of assets which produce passive income. A foreign corporation that owns, directly or indirectly, at least 25% by value of the stock of another corporation will be treated, for the purposes of
142
Table of Contents
the PFIC tests described above, as if it directly held its proportionate share of the assets of such other corporation, and directly earned its proportionate share of the income of such other corporation. If a corporation were to be treated as a PFIC with respect to a U.S. Holder, and subsidiaries of the corporation were also PFICs, the U.S. Holder would be deemed to own its proportionate share of such subsidiary PFICs, and may be subject to the PFIC rules described herein with respect to the shares of such subsidiary PFICs that the U.S. Holder would be deemed to own.
Based upon our current activities and the projected composition of our income and assets, we may be a PFIC for the current taxable year ending June 30, 2011. A determination of our PFIC status for any taxable year cannot be made until the close of such taxable year and, accordingly, we cannot provide a definitive determination with respect to our PFIC status for the current taxable year or any future taxable year. We expect that we will not be treated as a PFIC once we generate sufficient income from our agricultural operations in a taxable year such that we do not satisfy the income test described above. In addition, for the purposes of the asset test described above, our PFIC status may be affected by the market price of the common shares, which is likely to fluctuate after the offering, and will also be affected by how, and how quickly, we spend the cash raised in this offering.
As discussed below, a U.S. Holder can generally mitigate the adverse U.S. federal income tax consequences described below under “—Excess Distributions” that would result if we were to be a PFIC by making a qualified electing fund election, or QEF election, with respect to our common shares and stock of any of our subsidiary PFICs that such U.S. Holder would be deemed to own in the first taxable year of the U.S. Holder’s holding period for the common shares. If we were to be a PFIC, a U.S. Holder that made a QEF election, or a QEF Electing U.S. Holder, would be taxed currently on its proportionate share of our ordinary earnings and net capital gain in any year in which we were a PFIC. If we generate a material amount of income from our agricultural operations such that we would no longer satisfy the PFIC tests described above, we would cease to be a PFIC and the QEF election would no longer require an income inclusion.
If we were to be a PFIC at any time during a U.S. Holder’s holding period for the common shares then, unless the U.S. Holder makes a timely QEF election or a timely mark-to-market election (as discussed below, and subject to the limitations discussed below), any subsequent distribution by us to the U.S. Holder, or disposition of common shares by the U.S. Holder, would be subject to the adverse consequences of owning stock in a PFIC (discussed below under “—Excess Distributions”), regardless of whether we are a PFIC in the year of the distribution or disposition.
QEF Election and Mark-to-Market Election for Common Shares
A QEF Electing U.S. Holder would be required to include currently in gross income such QEF Electing U.S. Holder’spro rata share of our annual ordinary earnings and net capital gain (but may not include any net loss) in any year in which we are a PFIC. If a QEF Electing U.S. Holder demonstrates to the satisfaction of the IRS that any amounts actually distributed on the common shares have been paid from earnings and profits that were previously included in the income of the QEF Electing U.S. Holder pursuant to a timely QEF election, then such distributions will not be taxable. A QEF Electing U.S. Holder’s tax basis in the common shares will be increased by any amounts currently included in income under the QEF rules and will be decreased by any subsequent distributions from us that are treated as non-taxable distributions. Any gain or loss recognized by a QEF Electing U.S. Holder on the sale or other taxable disposition of common shares would be a capital gain or loss. Such capital gain or loss would be long-term if the QEF Electing U.S. Holder had held the common shares for more than one year at the time of the sale or other taxable disposition. Under current law, long-term capital gain of non-corporate QEF Electing U.S. Holders, including individuals, is eligible for reduced rates of taxation. The deductibility of capital losses is subject to limitations.
We expect to provide the PFIC Annual Information Statement required so that a QEF election can be made with respect to the common shares of the Company and any stock of our subsidiary PFICs that a U.S. Holder
143
Table of Contents
would be deemed to own. The company expects to make such information available on its website, and you may also request such information in writing by contacting us at Plaza Independencia 737-11000, Montevideo, Uruguay, Attention: Evelin Alonzo, Communications, or by email at info@unionagrogroup.com. A QEF election must be made by a U.S. Holder on IRS Form 8621 before the due date (including extensions) for such U.S. Holder’s U.S. federal income tax return for the taxable year for which the QEF election is made and, once made, will be effective for all subsequent taxable years of such U.S. Holder, unless revoked with the consent of the IRS. To enjoy the full benefits of the QEF election, a QEF election should be made for the first taxable year in which a U.S. Holder holds common shares and in which we are a PFIC.
Alternatively, a U.S. shareholder of a PFIC may make a mark-to-market election with respect to its stock if the stock is “regularly traded” on a “qualified exchange.” Stock is “regularly traded” if it is traded in other thande minimis quantities on at least 15 days during each calendar quarter on a qualified exchange. A qualified exchange is an exchange or other market that the IRS determines has trading, listing, financial disclosure, and other rules adequate to carry out the purposes of the mark-to-market election. The NYSE, on which the common shares are expected to be traded following the offering, should constitute a qualified exchange for this purpose. Provided that the shares are regularly traded on the NYSE, a U.S. Holder should be able to make a mark-to-market election with respect to the common shares. A U.S. Holder that made a valid mark-to-market election for its common shares would, for each taxable year in which we are a PFIC, include as ordinary income or loss the difference between the fair market value of the common shares at the end of the taxable year and the adjusted tax basis of the common shares (but loss could only be included to the extent of the net amount of previously included income as a result of the mark-to-market election). Under these rules, the U.S. Holder’s tax basis in the common shares would be adjusted to reflect any such income or loss amounts. Any gain recognized on the sale or other disposition of common shares would be treated as ordinary income. A mark-to-market election should be made by filing IRS Form 8621 in the first taxable year during which the U.S. Holder held the common shares and in which we are a PFIC. A mark-to-market election would not be available with respect to a subsidiary PFIC of ours that a U.S. Holder is deemed to own for the purposes of the PFIC rules; accordingly, a U.S. Holder would not be able to mitigate certain of the adverse U.S. federal income tax consequences (discussed below under “—Excess Distributions”) of its deemed ownership of stock in our subsidiary PFICs by making a mark-to-market election.
Excess Distributions
If we were to be a PFIC and a U.S. Holder does not make a timely QEF election or mark-to-market election with respect to the common shares, any “excess distribution” (generally a distribution in respect of common shares in excess of 125% of the average distributions during the preceding three taxable years or shorter holding period for the common shares) and any gain realized on the sale or other disposition of the common shares would be treated as ordinary income and would be subject to tax as if: (i) the excess distribution or gain had been realized ratably over the U.S. Holder’s holding period for the common shares; (ii) the amount deemed realized in each year had been subject to tax in each such year at the highest marginal rate for such year (other than income allocated to the taxable period of the disposition and any taxable period before we became a PFIC, which would be subject to tax at the U.S. Holder’s regular ordinary income rate and would not be subject to the interest charge discussed in (iii)); and (iii) the interest charge applicable to underpayments of tax had been imposed on the taxes deemed to have been payable in those years.
PFIC Reporting Requirements
If we were to be a PFIC, each U.S. Holder must file IRS Form 8621 to report any elections described above, any distributions received with respect to common shares and any gains realized with respect to common shares, and must also file such other information as the U.S. Treasury Department may require in subsequent guidance. Prospective purchasers are encouraged to consult their own tax advisors regarding the PFIC reporting requirements that would apply to them if we were to be a PFIC, as well as regarding the application of the PFIC rules to us and the availability and advisability of making a QEF election or a mark-to-market election.
144
Table of Contents
Distributions on the Common Shares
Subject to the discussion above under “—Passive Foreign Investment Company Considerations,” the gross amount of distributions made with respect to our common shares will be taxed as ordinary dividend income at the time of receipt by a U.S. Holder.
Subject to certain limitations, dividends paid to non-corporate U.S. Holders, including individuals, may be eligible for reduced rates of taxation if we are a “qualified foreign corporation” for U.S. federal income tax purposes and if certain holding period requirements are satisfied. A foreign corporation may be treated as a qualified foreign corporation for this purpose if its stock is readily tradable on an established securities market in the United States. Our common shares are expected to be tradable on the NYSE after this offering. However, even if the common shares are readily tradable on an established securities market in the United States, we will not be treated as a qualified foreign corporation if we are a PFIC for the taxable year in which we pay a dividend or were a PFIC for the preceding taxable year. Dividends on the common shares will not be eligible for the dividends-received deduction allowed to U.S. corporations in respect of certain dividends received from other U.S. corporations.
Dividends will constitute foreign source income for U.S. foreign tax credit limitation purposes, and will generally constitute “passive category income” but could, in the case of certain U.S. Holders, constitute “general category income.” The rules governing the U.S. foreign tax credit are complex and involve the application of rules that depend on your particular circumstances. U.S. Holders are encouraged to consult their tax advisors regarding the availability of the U.S. foreign tax credit in their particular circumstances.
Sale, Exchange, or Other Disposition of Common Shares
Subject to the discussion above under “—Passive Foreign Investment Company Considerations,” upon the sale, exchange, or other disposition of a common share, a U.S. Holder will recognize gain or loss with respect to the common share in an amount equal to the difference between (i) the amount realized upon the sale, exchange, or other disposition and (ii) the U.S. Holder’s tax basis in such common share. Capital gains of non-corporate U.S. Holders, including individuals, with respect to common shares held for more than one year are eligible for reduced rates of taxation. The deductibility of capital losses is subject to limitations. Gain or loss will generally be U.S. source income or loss for U.S. foreign tax credit limitation purposes. U.S. Holders are encouraged to consult their tax advisors regarding the availability of the U.S. foreign tax credit in their particular circumstances.
Information Reporting and Backup Withholding
Information reporting will apply to distributions on the common shares and the proceeds of the sale, exchange or other disposition of the common shares unless a U.S. Holder is an exempt recipient. Backup withholding will apply if a U.S. Holder fails to provide a taxpayer identification number or fails to comply with certification procedures or otherwise fails to establish an exemption from backup withholding. Any amount withheld under the backup withholding rules may be allowed as a refund or credit against a U.S. Holder’s U.S. federal income tax liability, provided that the required information is furnished to the IRS in a timely manner.
Material British Virgin Islands Tax Considerations
The following is a discussion of material BVI tax considerations to a U.S. Holder (as defined below) associated with the acquisition, ownership and disposition of the common shares. Subject to the limitations herein, this discussion constitutes the opinion of Harney Westwood & Riegels, our BVI counsel.
British Virgin Islands Taxation
BVI law imposes no income tax on dividends or other amounts we pay to holders of common shares who are non-residents of BVI. In addition, there is no capital gains tax, estate duty or inheritance tax applicable to any
145
Table of Contents
common shares held by non-residents of BVI. Further, no stamp duty or similar duty is applicable on the issuance, transfer or redemption of the common shares.
Certain Canadian Federal Income Tax Considerations for Canadian Holders
The following is a discussion of the principal Canadian federal income tax considerations generally applicable to a purchaser who acquires, as beneficial owner, common shares pursuant to this offering and who, at all relevant times, for purposes of theIncome Tax Act (Canada) and theIncome Tax Regulations, collectively, the Tax Act, (i) is, or is deemed to be, resident in Canada, (ii) deals with us at arm’s length, (iii) is not affiliated with us, and (iv) holds common shares as capital property (a “Canadian Holder”). Generally, common shares will be capital property to a Canadian Holder provided the Canadian Holder does not acquire or hold such common shares in the course of carrying on a business or as part of an adventure or concern in the nature of trade. Subject to the limitations herein, this discussion constitutes the opinion of Cassels Brock & Blackwell LLP, our Canadian counsel.
This discussion is not applicable to a Canadian Holder (i) that is a “specified financial institution,” (ii) an interest in which is a “tax shelter investment,” (iii) that is a “financial institution” for purposes of the mark-to-market rules, (iv) in relation to which we are a “foreign affiliate” or (v) that reports its “Canadian tax results” in a currency other than Canadian currency, each as defined in the Tax Act. In addition, this discussion does not address the application of alternative minimum tax to Canadian Holders who are individuals.
This discussion is based on the current provisions of the Tax Act, and an understanding of the current administrative policies and assessing practices of the Canada Revenue Agency, or the CRA, published in writing prior to the date hereof. This discussion takes into account all specific proposals to amend the Tax Act publicly announced by or on behalf of the Minister of Finance (Canada) prior to the date hereof (the “Proposed Amendments”), and assumes that all Proposed Amendments will be enacted in the form proposed. However, no assurances can be given that the Proposed Amendments will be enacted as proposed, or at all. This discussion does not otherwise take into account or anticipate any changes in law or administrative policy or assessing practice whether by legislative, administrative or judicial action nor does it take into account tax legislation or considerations of any province, territory or foreign jurisdiction, which may differ from those discussed herein.
This discussion is of a general nature only and is not, and is not intended to be, legal or tax advice to any particular Canadian Holder, and no representations with respect to the Canadian federal income tax consequences to any particular Canadian Holder are made. In addition, this discussion is not exhaustive of all Canadian federal income tax considerations. Accordingly, prospective purchasers of common shares are encouraged to consult their own tax advisors having regard to their own particular circumstances.
Currency Conversion
Generally, for purposes of the Tax Act, all amounts relating to the acquisition, holding or disposition of common shares, including dividends, adjusted cost base and proceeds of disposition, must be expressed in Canadian dollars using the rate of exchange quoted by the Bank of Canada at noon on the date such amounts first arose, or such other rate of exchange as is acceptable to the CRA.
Dividends
The full amount of dividends received or deemed to be received by a Canadian Holder on the common shares, including amounts deducted for foreign withholding tax, if any, will be included in computing the Canadian Holder’s income. For an individual (including a trust) the gross-up and dividend tax credit rules in the Tax Act will not be applicable. A Canadian Holder that is a corporation will not be entitled to deduct the amount of such dividends in computing its taxable income.
146
Table of Contents
A Canadian Holder that is throughout the relevant taxation year a “Canadian-controlled private corporation” (as defined in the Tax Act) may be liable to pay an additional refundable tax of 6 2/3% on its “aggregate investment income” for the year, which will include such dividends.
Dispositions
Generally, on a disposition or deemed disposition of a common share, a Canadian Holder will realize a capital gain (or capital loss) equal to the amount, if any, by which the proceeds of disposition, net of any reasonable costs of disposition, exceed (or are less than) the adjusted cost base to the Canadian Holder of the common share immediately before the disposition or deemed disposition. The adjusted cost base to the Canadian Holder of a common share acquired pursuant to this offering will be determined by averaging the cost of such share with the adjusted cost base of all other common shares, if any, owned by the Canadian Holder as capital property at the time of such acquisition.
Generally, a Canadian Holder is required to include in computing its income for a taxation year one-half of the amount of any capital gain, or a taxable capital gain, realized in the year. Subject to and in accordance with the provisions of the Tax Act, a Canadian Holder is required to deduct one-half of the amount of any capital loss, or an allowable capital loss, realized in a taxation year from taxable capital gains realized by the Canadian Holder in the year and allowable capital losses in excess of taxable capital gains for the year may be carried back and deducted in any of the three preceding taxation years or carried forward and deducted in any subsequent taxation year against net taxable capital gains realized in such years.
A Canadian Holder that is throughout the relevant taxation year a “Canadian-controlled private corporation” (as defined in the Tax Act) may be liable to pay an additional refundable tax of 6 2/3% on its “aggregate investment income” for the year, which will include taxable capital gains.
Foreign Tax Credits
Subject to the requirements and limitations in the Tax Act, a Canadian Holder may be entitled to claim a full or partial credit or a deduction in computing such Canadian Holder’s income tax liability for any withholding or other BVI income tax paid by the Canadian Holder in respect of dividends received on a common share, or any gain realized on a disposition (or deemed disposition) of a common share.
Foreign Investment Entity Rules
In the Canadian federal budget tabled on March 4, 2010, the Minister of Finance (Canada) announced that certain prior Proposed Amendments relating to the taxation of Canadian residents investing in certain non-resident entities, or the FIE Proposals, will not be implemented. The Minister of Finance also proposed to replace the FIE Proposals with a revised version of the current offshore investment fund property rules, which Proposed Amendments were released on August 27, 2010. The offshore investment fund property rules (as they are proposed to be amended) may, in certain circumstances, require a Canadian Holder to include an amount in income in each taxation year in respect of the acquisition and holding of common shares if the value of such common shares may reasonably be considered to be derived, directly or indirectly, primarily from portfolio investments in: (i) shares of the capital stock of one or more corporations, (ii) indebtedness or annuities, (iii) interests in one or more corporations, trusts, partnerships, organizations, funds or entities, (iv) commodities, (v) real estate, (vi) Canadian or foreign resource properties, (vii) currency of a country other than Canada, (viii) rights or options to acquire or dispose of any of the foregoing, or (ix) any combination of the foregoing. Furthermore, in order for these rules to apply to a Canadian Holder in respect of common shares, it must be reasonable to conclude that, having regard to all the circumstances (including those specified in the offshore investment fund property rules), one of the main reasons for the Canadian Holder acquiring or holding common shares was to derive a benefit from portfolio investments in assets described in (i) to (ix) above in such a manner that the taxes, if any, on the income, profits and gains from such assets for any particular year are significantly less than the tax that would have been applicable under Part I of the Tax Act if the income, profits and gains had been earned directly by the Canadian Holder.
147
Table of Contents
These rules are complex and their application depends, in part, on the reasons for a Canadian Holder acquiring or holding our common shares. Canadian Holders are encouraged to consult their own tax advisors regarding the application and consequences of these rules in their own particular circumstances.
Foreign Property Information Reporting
In general, a Canadian Holder that is a “specified Canadian entity” for a taxation year or fiscal period and whose total “cost amount” of “specified foreign property” (as such terms are defined in the Tax Act), including common shares, at any time in the taxation year or fiscal period exceeds Cdn$100,000 will be required to file an information return for the taxation year or fiscal period disclosing prescribed information.
The reporting rules in the Tax Act are complex and this discussion does not purport to explain all circumstances in which reporting may be required. Canadian Holders are encouraged to consult their own tax advisors regarding whether they must comply with these reporting requirements.
Eligibility for Investment
On the date of issue, provided that the common shares are listed at that time on a designated stock exchange (which currently includes the New York Stock Exchange), the common shares will be qualified investments under the Tax Act for trusts governed by registered retirement savings plans (“RRSPs”), registered retirement income funds (“RRIFs”), registered education savings plans, deferred profit sharing plans, registered disability savings plans and tax-free savings accounts (“TFSAs”). Notwithstanding that the common shares may be a qualified investment for a trust governed by a TFSA, the holder of a TFSA will be subject to a penalty tax on the common shares held in the TFSA if such common shares are a “prohibited investment” for the TFSA. In the 2011 federal Budget, the Minister of Finance proposed amendments to the Tax Act to extend the “prohibited investment” rules to RRSPs and RRIFs (the “RRSP/RRIF Proposals”). Provided the holder of a TFSA (or, under the RRSP/RRIF Proposals, the annuitant under the RRSP or RRIF, as applicable) deals at arm’s length with us for the purposes of the Tax Act and does not have a “significant interest” (within the meaning of the Tax Act) in us or a corporation, partnership or trust that does not deal at arm’s length with us for the purposes of the Tax Act, common shares will not generally be a prohibited investment under the Tax Act.
148
Table of Contents
Under the terms and subject to the conditions contained in an underwriting agreement dated , 2011, we have agreed to sell to the underwriters named below, for whom Credit Suisse Securities (USA) LLC and J.P. Morgan Securities LLC are acting as representatives, the following respective numbers of common shares:
| Underwriter | Number of Shares | |||
Credit Suisse Securities (USA) LLC | ||||
J.P. Morgan Securities LLC | ||||
Itau BBA USA Securities Inc. | ||||
Wellington West Capital Markets (USA) Inc. | ||||
Total | 14,285,715 | |||
Subject to the terms and conditions of the underwriting agreement, each of the underwriters has severally agreed to purchase from us the number of shares listed next to its name in the table above. The underwriting agreement provides that the obligation of the underwriters to purchase all the common shares in the offering if any are purchased by investors, other than those shares covered by the over-allotment option described below, is subject to, among other conditions, the absence of any material adverse change in our business, the delivery of certain legal opinions by our and their legal counsel in Uruguay and in the United States and certain procedures by our independent auditors. The underwriting agreement also provides that if an underwriter defaults, the purchase commitments of non-defaulting underwriters may be increased or the offering may be terminated. The obligations of the underwriters under the underwriting agreement may be terminated at their discretion on the basis of their assessment of the state of the financial markets and may also be terminated upon the occurrence of certain stated events.
All sales of the common shares in the United States will be made by U.S. registered broker/dealers. The common shares will also be offered for sale in Canada in each of the provinces of Canada except Québec through the Canadian broker-dealer affiliates of certain of the underwriters who are registered in such provinces. Itau BBA USA Securities Inc. will not participate in the Canadian offering.
We have granted to the underwriters a 30-day option to purchase on apro rata basis up to additional common shares from us at the initial public offering price less the underwriting discounts and commissions. The option may be exercised only to cover any over-allotments of common shares.
The underwriters propose to offer the common shares initially at the public offering price on the cover page of this prospectus and to selling group members at that price less a selling concession of $ per share. The underwriters and selling group members may allow a discount of $ per share on sales to other broker/dealers. If all of the offered common shares have not been sold at the initial offering price after the underwriters have made reasonable efforts to sell the common shares at the initial offering price, the representatives may change the public offering price and concession and discount to broker/dealers. The compensation realized by the underwriters will be decreased by the amount that the aggregate price paid by purchasers for common shares is less than the gross proceeds paid by the underwriters to UAG.
Sales of common shares in Canada may be made by Canadian broker-dealer affiliates of certain of the underwriters. In the event that such sales are effected, each of Credit Suisse Securities (Canada), Inc., J.P. Morgan Securities Canada, Inc. and Wellington West Capital Markets Inc. will purchase such common shares from its respective affiliate, concurrently with and conditional upon, the closing of the purchase of the common shares by the underwriters, at the public offering price set forth on the cover page of this prospectus less an amount to be mutually agreed upon between each of Credit Suisse Securities (Canada), Inc., J.P. Morgan Securities Canada, Inc. and Wellington West Capital Markets Inc. and its respective affiliate underwriter, which amount shall not exceed $ . Itau BBA USA Securities Inc. will not participate in the Canadian offering.
149
Table of Contents
The following table summarizes the compensation and estimated expenses we will pay:
| Per Share | Total | |||||||||||||||
| Without Over- Allotment | With Over- Allotment | Without Over- Allotment | With Over- Allotment | |||||||||||||
Underwriting discounts and commissions paid by us | $ | $ | $ | $ | ||||||||||||
Expenses payable by us | $ | $ | $ | $ | ||||||||||||
The representatives have informed us that the underwriters do not expect sales to accounts over which the underwriters have discretionary authority to exceed 5% of the common shares being offered.
In connection with this offering, we have generally agreed that, without the prior written consent of Credit Suisse Securities (USA) LLC and J.P. Morgan Securities LLC, on behalf of the underwriters, we will not, subject to certain exceptions, during the period commencing on the date of the underwriting agreement and ending 180 days after the date of the underwriting agreement, offer or sell any common shares or securities convertible into or exchangeable or exercisable for common shares. However, in the event that either (1) during the last 17 days of the 180-day “lock-up” period, we release earnings results or material news or a material event relating to us occurs or (2) prior to the expiration of the 180-day “lock-up” period, we announce that we will release earnings results during the 16-day period beginning on the last day of the 180-day “lock-up” period, then in either case the expiration of the “lock-up” period will be extended until the expiration of the 18-day period beginning on the date of the release of the earnings results or the occurrence of the material news or event, as applicable, unless Credit Suisse Securities (USA) LLC and J.P. Morgan Securities LLC, on behalf of the underwriters waive, in writing, such extension.
In connection with this offering, we expect that our officers, directors and certain of our significant shareholders will each enter into a lock-up agreement under which they have generally agreed, subject to certain exceptions, not to offer or sell any common shares or securities convertible into or exchangeable or exercisable for common shares, without the prior written consent of Credit Suisse Securities (USA) LLC and J.P. Morgan Securities LLC, on behalf of the underwriters, for a period of 180 days after the date of the underwriting agreement. However, in the event that either (1) during the last 17 days of the 180-day “lock-up” period, we release earnings results or material news or a material event relating to us occurs or (2) prior to the expiration of the 180-day “lock-up” period, we announce that we will release earnings results during the 16-day period beginning on the last day of the 180-day “lock-up” period, then in either case the expiration of the “lock-up” period will be extended until the expiration of the 18-day period beginning on the date of the release of the earnings results or the occurrence of the material news or event, as applicable, unless Credit Suisse Securities (USA) LLC and J.P. Morgan Securities LLC, on behalf of the underwriters waive, in writing, such extension.
We have agreed to indemnify the underwriters against liabilities under the Securities Act of 1933 and applicable Canadian securities laws, or contribute to payments that the underwriters may be required to make in that respect.
We have been authorized to list the common shares on the NYSE under the symbol “UAGR.” The listing of the common shares will be subject to UAG fulfilling all of the listing requirements of the NYSE.
In connection with the listing of the common shares on the NYSE, the underwriters will undertake to sell round lots of 100 shares or more to a minimum of 400 beneficial owners.
The underwriters and/or their respective affiliates have provided, currently provide or may provide in the future various investment banking, commercial banking, financial advisory and/or similar services to us on a regular basis, and maintain normal business relationships with us in their capacity as credit institutions or as lenders under credit facilities, for which they have received and may continue to receive customary fees and commissions.
150
Table of Contents
An affiliate of Itau BBA USA Securities Inc., one of the underwriters in this offering, serves as lender under our line of credit.See“Business—Material Agreements—Line of Credit.”
Pursuant to applicable rules of Canadian securities regulators and the Investment Industry Regulatory Organization of Canada, or IIROC, the Canadian broker-dealer affiliates of the underwriters that will offer common shares for sale in Canada may not in Canada, throughout the period of distribution, bid for or purchase the common shares, except in accordance with certain permitted transactions, including market stabilization as described below and passive market making activities, and on the condition that the bid or purchase not be engaged in for the purpose of creating actual or apparent active trading in, or raising the price of, the common shares.
Subject to the foregoing and applicable laws, in connection with the offering, the underwriters and their Canadian broker-dealer affiliates may engage in stabilizing transactions, over-allotment transactions, syndicate covering transactions and penalty bids in accordance with Regulation M under the Exchange Act and IIROC’s Universal Market Integrity Rules for Canadian Marketplaces.
| • | Stabilizing transactions permit bids to purchase the underlying security so long as the stabilizing bids do not exceed a specified maximum price. |
| • | Over-allotment involves sales by the underwriters of shares in excess of the number of shares the underwriters are obligated to purchase, which creates a syndicate short position. The short position may be either a covered short position or a naked short position. In a covered short position, the number of shares over-allotted by the underwriters is not greater than the number of shares that they may purchase in the over-allotment option. In a naked short position, the number of shares involved is greater than the number of shares in the over-allotment option. The underwriters may close out any covered short position by either exercising their over-allotment option and/or purchasing shares in the open market. |
| • | Syndicate covering transactions involve purchases of the common shares in the open market after the distribution has been completed in order to cover syndicate short positions. In determining the source of shares to close out the short position, the underwriters will consider, among other things, the price of shares available for purchase in the open market as compared to the price at which they may purchase shares through the over-allotment option. If the underwriters sell more shares than could be covered by the over-allotment option, a naked short position, the position can only be closed out by buying shares in the open market. A naked short position is more likely to be created if the underwriters are concerned that there could be downward pressure on the price of the shares in the open market after pricing that could adversely affect investors who purchase in the offering. |
| • | Penalty bids permit the representatives to reclaim a selling concession from a syndicate member when the common shares originally sold by the syndicate member is purchased in a stabilizing or syndicate covering transaction to cover syndicate short positions. |
These stabilizing transactions, syndicate covering transactions and penalty bids may have the effect of raising or maintaining the market price of our common shares or preventing or retarding a decline in the market price of the common shares. As a result the price of our common shares may be higher than the price that might otherwise exist in the open market. These transactions may be effected on the NYSE or otherwise and, if commenced, may be discontinued at any time.
A prospectus in electronic format may be made available on the web sites maintained by one or more of the underwriters, or selling group members, if any, participating in this offering and one or more of the underwriters participating in this offering may distribute prospectuses electronically. The representatives may agree to allocate a number of common shares to underwriters and selling group members for sale to their online brokerage account holders. Internet distributions will be allocated by the underwriters and selling group members that will make Internet distributions on the same basis as other allocations.
151
Table of Contents
Selling Restrictions
Uruguay
This offering of common shares is not authorized for public offering in Uruguay and may not be sold publicly under Uruguayan Securities Law 18,627 unless registered according to the terms and conditions established therein. The common shares are being offered privately and may only be offered directly to natural persons or determined legal entities and shall not be offered on the Uruguayan Stock Exchange (Bolsa Electrónica de Valores del Uruguay S.A.) nor be advertised by any means.
Argentina
The common shares are not authorized for public offering in Argentina and they may not be sold publicly under the Argentine Securities Law No. 17,811, as amended. Therefore, any such transaction must be made privately.
Brazil
For purposes of Brazilian law, this offer of securities is addressed to you personally, upon your request and for your sole benefit, and is not to be transmitted to anyone else, to be relied upon elsewhere or for any other purpose either quoted or referred to in any other public or private document or to be filed with anyone without our prior, express and written consent.
Therefore, as this prospectus does not constitute or form part of any public offering to sell or solicitation of a public offering to buy any shares or assets, the offering and THE COMMON SHARES OFFERED HEREBY HAVE NOT BEEN, AND WILL NOT BE, AND MAY NOT BE OFFERED FOR SALE OR SOLD IN BRAZIL EXCEPT IN CIRCUMSTANCES WHICH DO NOT CONSTITUTE A PUBLIC OFFERING OR DISTRIBUTION UNDER BRAZILIAN LAWS AND REGULATIONS. DOCUMENTS RELATING TO THE COMMON SHARES, AS WELL AS THE INFORMATION CONTAINED THEREIN, MAY NOT BE SUPPLIED TO THE PUBLIC, AS A PUBLIC OFFERING IN BRAZIL OR BE USED IN CONNECTION WITH ANY OFFER FOR SUBSCRIPTION OR SALE OF THE COMMON SHARES TO THE PUBLIC IN BRAZIL.
Chile
The common shares are not registered in the Securities Registry (Registro de Valores) or subject to the control of the Chilean Securities and Exchange Commission (Superintendencia de Valores y Seguros de Chile). This prospectus and other offering materials relating to the offer of the common shares do not constitute a public offer of, or an invitation to subscribe for or purchase, the common shares in the Republic of Chile, other than to individually identified purchasers pursuant to a private offering within the meaning of Article 4 of the Chilean Securities Market Act (Ley de Mercado de Valores) (an offer that is not “addressed to the public at large or to a certain sector or specific group of the public”).
European Economic Area
In relation to each Member State of the European Economic Area which has implemented the Prospectus Directive, each underwriter has represented and agreed that with effect from and including the date on which the Prospectus Directive is implemented in that Member State it has not made and will not make an offer of common shares to the public in that Member State, except that it may, with effect from and including such date, make an offer of common shares to the public in that Member State at any time:
(a) to legal entities which are authorized or regulated to operate in the financial markets or, if not so authorized or regulated, whose corporate purpose is solely to invest in securities;
(b) to any legal entity which has two or more of (1) an average of at least 250 employees during the last financial year; (2) a total balance sheet of more than €43,000,000 and (3) an annual net turnover of more than €50,000,000, as shown in its last annual or consolidated accounts; or
152
Table of Contents
(c) to fewer than 100 natural or legal persons (other than qualified investors as defined in the Prospectus Directive) subject to obtaining the prior consent of the representatives for any such offer;
(d) in any other circumstances which do not require the publication by us of a prospectus pursuant to Article 3 of the Prospectus Directive.
For the purposes of the above, the expression an “offer of shares to the public” in relation to any shares in any Member State means the communication in any form and by any means of sufficient information on the terms of the offer and the shares to be offered so as to enable an investor to decide to purchase or subscribe the shares, as the same may be varied in that Member State by any measure implementing the Prospectus Directive in that Member State and the expression Prospectus Directive means Directive 2003/71/EC and includes any relevant implementing measure in that Member State.
France
This offering document has not been prepared in the context of a public offering of securities in France (offre au public) within the meaning of Article L.411-1 of the French Code monétaire et financier and Articles 211-1 and seq. of theAutorité des marchés financiers(AMF) regulations and has therefore not been submitted to the AMF for prior approval or otherwise.
The securities have not been offered or sold and will not be offered or sold, directly or indirectly, to the public in France and neither this offering document nor any other offering material relating to the securities has been distributed or caused to be distributed or will be distributed or caused to be distributed to the public in France, except only to persons licensed to provide the investment service of portfolio management for the account of third parties and/or to “qualified investors” (as defined in Article L.411-2, D.411-1 and D.411-2 of the French Codemonétaire et financier) and/or to a limited circle of investors (as defined in Article L.411-2, D.411-4 of the French Code monétaire et financier) on the condition that no such offering document nor any other offering material relating to the securities shall be delivered by them to any person nor reproduced (in whole or in part). Such “qualified investors” are notified that they must act in that connection for their own account in accordance with the terms set out by Article L.411-2 of the FrenchCode monétaire et financierand by Article 211-4 of the AMF Regulations and may not re-transfer, directly or indirectly, the securities in France, other than in compliance with applicable laws and regulations and in particular those relating to a public offering (which are, in particular, embodied in Articles L.411-1, L.412-1 and L.621-8 and seq. of theFrench Code monétaire et financier).
You are hereby notified that in connection with the purchase of these securities, you must act for your own account in accordance with the terms set out by Article L.411-2 of the FrenchCode monétaire et financierand by Article 211-4 of the AMF Regulations and may not re-transfer, directly or indirectly, the securities in France, other than in compliance with applicable laws and regulations and in particular those relating to a public offering (which are, in particular, embodied in Articles L.411-1, L.411-2, L.412-1 and L.621-8 and seq. of the FrenchCode monétaire et financier).
Germany
Any offer or solicitation of common shares within Germany must be in full compliance with the German Securities Prospectus Act (Wertpapierprospektgesetz — WpPG). The offer and solicitation of securities to the public in Germany requires the approval of the prospectus by the German Federal Financial Services Supervisory Authority (Bundesanstalt für Finanzdienstleistungsaufsicht — BaFin). This prospectus has not been and will not be submitted for approval to the BaFin. This prospectus does not constitute a public offer under the WpPG. This prospectus and any other document relating to the common shares, as well as any information contained therein, must not be supplied to the public in Germany or used in connection with any offer for subscription of the common shares to the public in Germany, any public marketing of the common shares or any public solicitation
153
Table of Contents
for offers to subscribe for or otherwise acquire the common shares in Germany. The prospectus and other offering materials relating to the offer of common shares are strictly confidential and may not be distributed to any person or entity other than the designated recipients hereof.
Hong Kong
The common shares have not been offered or sold and will not be offered or sold in Hong Kong, by means of any document, other than (a) to “professional investors” as defined in the Securities and Futures Ordinance (Cap. 571) of Hong Kong and any rules made under that Ordinance; or (b) in other circumstances which do not result in the document being a “prospectus” as defined in the Companies Ordinance (Cap. 32) of Hong Kong or which do not constitute an offer to the public within the meaning of that Ordinance.
No advertisement, invitation or document, whether in Hong Kong or elsewhere, which is directed at, or the contents of which are likely to be accessed or read by, the public of Hong Kong (except if permitted to do so under the securities laws of Hong Kong) has been issued or will be issued in Hong Kong or elsewhere other than with respect to the common shares which are or are intended to be disposed of only to persons outside Hong Kong or only to “professional investors” within the meaning of the Securities and Futures Ordinance and any rules made under that Ordinance.
WARNING
The contents of this document have not been reviewed by any regulatory authority in Hong Kong. You are advised to exercise caution in relation to the offer. If you are in any doubt about any of the contents of this document, you should obtain independent professional advice.
Italy
The offering of the common shares has not been registered with theCommissione Nazionale per le Società e la Borsa(CONSOB), in accordance with Italian securities legislation. Accordingly, the common shares may not be offered or sold, and copies of this offering document or any other document relating to the common shares may not be distributed in Italy except to Qualified Investors, as defined in Article 34-ter, subsection 1, paragraph b) of CONSOB Regulation no. 11971 of May 14, 1999, as amended (the Issuers’ Regulation), or in any other circumstance where an express exemption to comply with public offering restrictions provided by Legislative Decree no. 58 of February 24, 1998 (the Consolidated Financial Act) or Issuers’ Regulation applies, including those provided for under Article 100 of the Finance Law and Article 34-terof the Issuers’ Regulation, and provided, however, that any such offer or sale of the common shares or distribution of copies of this offering document or any other document relating to the common shares in Italy must (i) be made in accordance with all applicable Italian laws and regulations, (ii) be conducted in accordance with any relevant limitations or procedural requirements that CONSOB may impose upon the offer or sale of the common shares, and (iii) be made only by (a) banks, investment firms or financial companies enrolled in the special register provided for in Article 107 of Legislative Decree no. 385 of September 1, 1993, to the extent duly authorized to engage in the placement and/or underwriting of financial instruments in Italy in accordance with the Consolidated Financial Act and the relevant implementing regulations; or (b) foreign banks or financial institutions (the controlling shareholding of which is owned by one or more banks located in the same EU Member State) authorized to place and distribute securities in the Republic of Italy pursuant to Articles 15, 16 and 18 of the Banking Act, in each case acting in compliance with all applicable laws and regulations.
Kuwait
The common shares have not been licensed for offering in Kuwait by the Ministry of Commerce and Industry or the Central Bank of Kuwait or any other relevant Kuwaiti government agency. The offering of the common shares in Kuwait on the basis of a private placement or public offering is, therefore, restricted in
154
Table of Contents
accordance with Decree Law No. 31 of 1990, as amended, and Ministerial Order No. 113 of 1992, as amended. No private or public offering of the common shares is being made in Kuwait, and no agreement relating to the sale of the common shares will be concluded in Kuwait. No marketing or solicitation or inducement activities are being used to offer or market the common shares in Kuwait.
Mexico
The securities have not been registered with the National Securities’ Registry (Registro Nacional de Valores) maintained by the National Banking and Securities Commission (Comisión Nacional Bancaria y de Valores or CNBV), and may not be offered or sold publicly in Mexico.
This document is not intended to be publicly distributed to an undetermined person through mass media, nor to serve as an application for the registration of the securities in Mexico, nor as a prospectus for their public offering in said jurisdiction.
This document is addressed to you under a private offering exception contained in article 8 of the Securities Market Law (Ley del Mercado de Valores or LMV), for which you must comply with any of the following requirements:
(a) you are either an institutional or qualified investor for purposes of Mexican law;
(b) you are a member of a group of less than 100 individually identified people to whom the common shares are being offered directly and personally; or
(c) you are an employee of the issuer and a beneficiary of an employees’ benefit plan of said issuer.
The LMV and CNBV regulations (along with other laws applicable in Mexico) define institutional investors as Mexican and foreign banks, broker-dealers, insurance and bond companies, bonded warehouses, financial leasing companies, factoring companies and investment funds, private pension and annuities funds and foreign pension and investment funds. Such regulations also define qualified investors as individuals and corporations which maintain during the previous year investments in securities for an amount equal or similar to 1.5 million MexicanUnidades de Inversión or UDIS(approximately $330,000 dollars) or that have obtained during the previous two years a gross income of at least 500,000UDIS(approximately $110,000) per year.
Netherlands
The common shares may not, directly or indirectly, be offered or acquired in the Netherlands and this offering memorandum may not be circulated in the Netherlands, as part of an initial distribution or any time thereafter, other than to individuals or (legal) entities who or which qualify as qualified investors within the meaning of Article 1:1 of the Financial Supervision Act (Wet op het financieel toezicht) as amended from time to time.
Qatar
This offering of common shares does not constitute a public offer of common shares in the State of Qatar under Law No. 5 of 2002. The common shares are only being offered to a limited number of investors who are willing and able to conduct an independent investigation of the risks involved in an investment in such common shares, or have sufficient knowledge of the risks involved in an investment in such common shares or are benefiting from preferential terms under a directed share program for directors, officers and employees. No transaction will be concluded in the jurisdiction of the State of Qatar.
Saudi Arabia
This document may not be distributed in the Kingdom except to such persons as are permitted under the Offers of Securities Regulations issued by the Capital Market Authority.
155
Table of Contents
The Capital Market Authority does not make any representation as to the accuracy or completeness of this document, and expressly disclaims any liability whatsoever for any loss arising from, or incurred in reliance upon, any part of this document. Prospective purchasers of the securities offered hereby should conduct their own due diligence on the accuracy of the information relating to the securities. If you do not understand the contents of this document you should consult an authorized financial adviser.
Singapore
The offer or invitation which is the subject of this document is only allowed to be made to the persons set out herein. Moreover, this document is not a prospectus as defined in the Securities and Futures Act (Chapter 289) of Singapore (SFA) and accordingly, statutory liability under the SFA in relation to the content of the document will not apply.
As this document has not been and will not be lodged with or registered as a document by the Monetary Authority of Singapore, this document and any other document or material in connection with the offer or sale, or invitation for subscription or purchase, of the common shares may not be circulated or distributed, nor may the common shares be offered or sold, or be made the subject of an invitation for subscription or purchase, whether directly or indirectly, to persons in Singapore other than: (i) to an institutional investor under Section 274 of the SFA; (ii) to a relevant person, or any person pursuant to Section 275(1A) of the SFA, and in accordance with the conditions specified in Section 275 of the SFA; or (iii) otherwise pursuant to, and in accordance with the conditions of, any other applicable provision of the SFA.
Where the common shares are subscribed or purchased under Section 275 of the SFA by a relevant person who is:
(a) a corporation (which is not an accredited investor) the sole business of which is to hold investments and the entire share capital of which is owned by one or more individuals, each of whom is an accredited investor; or
(b) a trust (where the trustee is not an accredited investor) whose sole purpose is to hold investments and each beneficiary is an accredited investor, shares, debentures and units of shares and debentures of that corporation or the beneficiaries’ rights and interest in that trust shall not be transferable for six months after that corporation or that trust has acquired the common shares under Section 275 of the SFA except:
(1) to an institutional investor under Section 274 of the SFA or to a relevant person defined in Section 275(2) of the SFA, or to any person pursuant to an offer that is made on terms that such shares, debentures and units of shares and debentures of that corporation or such rights and interest in that trust are acquired at a consideration of not less than S$200,000 (or its equivalent foreign currency) for each transaction, whether such amount is to be paid for in cash or by exchange of securities or other assets;
(2) where no consideration is given for the transfer; or
(3) by operation of law.
By accepting this document, the recipient hereof represents and warrants that he is entitled to receive such report in accordance with the restrictions set forth above and agrees to be bound by the limitations contained herein. Any failure to comply with these limitations may constitute a violation of law.
Spain
This offer of common shares of Union Agriculture Group Corp has not been and will not be registered with the Spanish National Securities Market Commission (Comisión Nacional del Mercado de Valores orCNMV) and, therefore, no common shares of Union Agriculture Group Corp may be offered, sold or distributed in any manner, nor may any resale of the common shares be carried out in Spain except in circumstances which do not constitute a public offer of securities in Spain or are exempted from the obligation to publish a prospectus, as set
156
Table of Contents
forth in Spanish Securities Market Act (Ley 24/1988, de 28 de julio, del Mercado de Valores) and Royal Decree 1310/2005, of 4 November, and other applicable regulations, as amended from time to time, or otherwise without complying with all legal and regulatory requirements in relation thereto. Neither the prospectus nor any offering or advertising materials relating to the common shares of Union Agriculture Group Corp have been or will be registered with the CNMV and therefore they are not intended for the public offer of the common shares of Union Agriculture Group Corp in Spain.
Switzerland
This document does not constitute a prospectus within the meaning of Article 652a of the Swiss Code of Obligations. The common shares of Union Agriculture Group Corp may not be sold directly or indirectly in or into Switzerland except in a manner which will not result in a public offering within the meaning of the Swiss Code of Obligations. Neither this document nor any other offering materials relating to the common shares may be distributed, published or otherwise made available in Switzerland except in a manner which will not constitute a public offer of the common shares of Union Agriculture Group Corp in Switzerland.
United Kingdom
Each underwriter has represented and agreed that it has only communicated or caused to be communicated and will only communicate or cause to be communicated an invitation or inducement to engage in investment activity (within the meaning of Section 21 of the Financial Services and Markets Act 2000) in connection with the issue or sale of the common shares in circumstances in which Section 21(1) of such Act does not apply to us and it has complied and will comply with all applicable provisions of such Act with respect to anything done by it in relation to any common shares in, from or otherwise involving the United Kingdom.
Addresses of Global Coordinators
The addresses of the global coordinators are as follows:
Credit Suisse Securities (USA) LLC
Eleven Madison Avenue,
New York, NY 10010
USA
J.P. Morgan Securities LLC
383 Madison Avenue
New York, NY 10179
USA
157
Table of Contents
We are being represented by Paul, Weiss, Rifkind, Wharton & Garrison LLP with respect to United States legal matters and by Cassels Brock & Blackwell LLP with respect to Canadian legal matters. The validity of the common shares offered in this offering and certain legal matters as to BVI law will be passed upon for us by Harney Westwood & Riegels. The underwriters are being represented by Cleary Gottlieb Steen & Hamilton LLP with respect to United States legal matters and by Davies Ward Phillips & Vineberg LLP with respect to Canadian legal matters.
158
Table of Contents
The consolidated financial statements of UAG as of June 30, 2010, 2009 and 2008 and January 2, 2008 (date of inception), and for the years ended June 30, 2010 and 2009 and for the period from January 2, 2008 through June 30, 2008, and as of March 31, 2011 and June 30, 2010, and for the nine months ended March 31, 2011 and 2010, included in this prospectus, have been so included in reliance on the reports (which contain an explanatory paragraph relating to the fact that UAG is in the process of obtaining governmental authorizations to continue using 66,645 hectares of land held underpromesas) of PricewaterhouseCoopers Ltda. (“PwC”), Montevideo, Uruguay, an independent registered public accounting firm, given on the authority of said firm as experts in auditing and accounting.
The Deloitte S.C. Appraisal of Real Estate Report dated May 17, 2011, was prepared for us by Deloitte S.C., Montevideo, Uruguay. Information relating to the value of our properties in “Prospectus Summary” and “Business” is derived from the Deloitte S.C. Appraisal of Real Estate Report dated May 17, 2011, and is included in reliance on Deloitte S.C.’s authority as experts on such matters.
159
Table of Contents
EXPENSES RELATED TO THIS OFFERING
The following table sets forth the main expenses related to this offering, other than the underwriting discounts and commissions, which we will be required to pay or already have paid:
| Amount to be Paid | ||||
SEC Registration Fee | $ | 26,703.00 | ||
FINRA Filing Fee | 29,250.00 | |||
Canadian Securities Regulators Filing Fees | 20,000.00 | |||
NYSE Listing Fee | 125,000.00 | |||
Legal Fees and Expenses | 2,250,000.00 | |||
Accounting Fees and Expenses | 1,250,000.00 | |||
Printing and Engraving Expenses | 200,000.00 | |||
Transfer Agent and Registrar Fees | 25,000.00 | |||
Director and Officer Insurance Expense | 350,000.00 | |||
Miscellaneous Expenses | 250,000.00 | |||
Total | $ | 4,525,953.00 | ||
Each of the amounts set forth above, other than the SEC registration fee, the FINRA filing fee and the NYSE listing fee, is an estimate. These expenses will be borne by us.
160
Table of Contents
WHERE YOU CAN FIND MORE INFORMATION
We have filed with the SEC a registration statement on Form F-1 under the Securities Act with respect to the common shares offered hereby. For the purposes of this section, the term registration statement means the original registration statement and any and all amendments including the schedules and exhibits to the original registration statement or any amendment. This prospectus does not contain all of the information set forth in the registration statement we filed. For further information regarding us and the common shares offered in this prospectus, you may review the full registration statement, including the exhibits. The registration statement, including its exhibits and schedules, may be inspected and copied at the public reference facilities maintained by the SEC at 100 F Street, NE, Room 1580, Washington, D.C. 20549. You may obtain information on the operation of the public reference room by calling 1-202-551-8909, and you may obtain copies at prescribed rates from the Public Reference Section of the SEC at its principal office in Washington, D.C. 20549. The SEC maintains a website (http://www.sec.gov) that contains reports, proxy and information statements and other information regarding registrants that file electronically with the SEC.
Upon completion of this offering, we will be required and we intend to file periodic reports and other information with the SEC pursuant to the Exchange Act. We will also be subject to the full informational requirements of the securities commissions in each of the provinces and territories of Canada. You are invited to read and copy any reports, statements or other information, other than confidential filings, that we intend to file with the Canadian provincial securities commissions. These filings are electronically available from the Canadian System for Electronic Document Analysis and Retrieval (SEDAR) at www.sedar.com, the Canadian equivalent of the SEC electronic document gathering and retrieval system.
161
Table of Contents
| F-3 | ||||
| F-4 | ||||
Consolidated Statements of Financial Position as of June 30, 2010, 2009 and 2008 and January 2, 2008 | F-5 | |||
| F-6 | ||||
| F-7 | ||||
| F-8 | ||||
| F-10 | ||||
| F-90 | ||||
| F-91 | ||||
Consolidated Interim Statements of Financial Position as of March 31, 2011 and June 30, 2010 | F-92 | |||
| F-93 | ||||
| F-94 | ||||
| F-95 | ||||
| F-97 | ||||
F-1
Table of Contents
Union Agriculture Group Corp.
Consolidated Financial Statements as of June 30, 2010, 2009 and 2008 and January 2, 2008 (date of inception) and for the years ended June 30, 2010 and 2009 and for the period from January 2, 2008 through June 30, 2008
Table of Contents

Report of Independent Registered Public Accounting Firm
To the Board of Directors and Shareholders
of Union Agriculture Group Corp.
We have audited the accompanying consolidated statements of financial position of Union Agriculture Group Corp. and its subsidiaries as of June 30, 2010, 2009 and 2008 and January 2, 2008 (date of inception), and the related consolidated statements of comprehensive income, of changes in shareholders’ equity and of cash flows for the years ended June 30, 2010 and 2009 and for the period from January 2, 2008 through June 30, 2008. These consolidated financial statements are the responsibility of the Company’s management. Our responsibility is to express an opinion on these financial statements based on our audits.
We conducted our audits in accordance with the standards of the Public Company Accounting Oversight Board (United States). Those standards require that we plan and perform the audit to obtain reasonable assurance about whether the financial statements are free of material misstatement. An audit includes examining, on a test basis, evidence supporting the amounts and disclosures in the financial statements. An audit also includes assessing the accounting principles used and significant estimates made by management, as well as evaluating the overall financial statement presentation. We believe that our audits provide a reasonable basis for our opinion.
In our opinion, the consolidated financial statements referred to above present fairly, in all material respects, the financial position of Union Agriculture Group Corp. and its subsidiaries at June 30, 2010, 2009 and 2008 and January 2, 2008 (date of inception) and the results of their operations and their cash flows for the years ended in June 30, 2010 and 2009 and for the period from January 2, 2008 through June 30, 2008 in conformity with International Financial Reporting Standards as issued by the International Accounting Standards Board.
We draw attention to Note 5(a) to the financial statements. The Group is in process to obtain governmental authorizations to continue using 66,645 hectares of land held underPromesas. The ultimate outcome of this process cannot presently be determined.
Montevideo, Uruguay
July 14, 2011
PricewaterhouseCoopers Ltda.
| by | /s/ Omar Cabral (Partner) | |
| Omar Cabral |
PricewaterhouseCoopers Ltda., Cerrito 461 1st floor, T: +598 29160463, F: +598 29160605
11.000 Montevideo, Uruguay, www.pwc.com/uy
©2011 PricewaterhouseCoopers Ltda., PricewaterhouseCoopers, PricewaterhouseCoopers Professional Services Ltda., PricewaterhouseCoopers, Shaw, Faget & Asociados, and PricewaterhouseCoopers Software Ltda. All rights reserved. In this document “PricewaterhouseCoopers” and/or “PwC” refers to PricewaterhouseCoopers Ltda., PricewaterhouseCoopers, PricewaterhouseCoopers Professional Services Ltda., PricewaterhouseCoopers, Shaw, Faget & Asociados, and PricewaterhouseCoopers Software Ltda., which are member firms of PricewaterhouseCoopers International Limited (PwC IL), each member firm is a separate legal entity.
Table of Contents
Denomination:Union Agriculture Group Corp.
Legal address:
Registered office: Vanterpool Plaza, 2nd Floor, Wickhams Cay I, Road Town, Tortola,
British Virgin Islands.
Principal executive office: Plaza Independencia 737 – 11000, Montevideo, Uruguay.
Company activity:Agricultural
Date of registration:January 2, 2008
Expiration of company charter:No term defined
Number of register:1454555
Capital stock:142,969,831 shares
F-4
Table of Contents
Consolidated Statements of Financial Position
as of June 30, 2010, 2009 and 2008 and January 2, 2008
(All amounts in US$, except shares and per share data and as otherwise indicated)
| Note | June 30, 2010 | June 30, 2009 | June 30, 2008 | January 2, 2008 | ||||||||||||||
ASSETS | ||||||||||||||||||
Non-Current Assets | ||||||||||||||||||
Property, plant and equipment, net | 7 | 4,488,147 | 958,580 | 525,299 | — | |||||||||||||
Land underPromesas | 8/2.7 | 100,714,669 | 12,230,211 | 712,909 | ||||||||||||||
Investment property underPromesas, net | 9/2.9 | 4,663,968 | — | — | — | |||||||||||||
Intangible assets, net | 10 | 405,304 | 380,068 | 380,068 | — | |||||||||||||
Biological assets | 11 | 5,878,081 | 1,698,064 | 730,936 | — | |||||||||||||
Deferred income tax assets | 18 | 340,502 | 11,096 | — | — | |||||||||||||
Trade and other receivables, net | 12,13 | — | 97,295 | — | — | |||||||||||||
Total Non-Current Assets | 116,490,671 | 15,375,314 | 2,349,212 | — | ||||||||||||||
Current Assets | ||||||||||||||||||
Biological assets | 11 | 1,866,466 | 224,678 | — | — | |||||||||||||
Inventories | 14 | 1,824,832 | 33,389 | — | — | |||||||||||||
Trade and other receivables, net | 12,13 | 8,329,062 | 1,387,595 | 343,765 | — | |||||||||||||
Financial assets at fair value through profit or loss | 12 | 1,190,977 | — | — | — | |||||||||||||
Investments in debt certificates | 12 | — | 1,912,498 | — | — | |||||||||||||
Cash and cash equivalents | 12 | 67,125,638 | 67,014,579 | 43,148 | 50,000 | |||||||||||||
Total Current Assets | 80,336,975 | 70,572,739 | 386,913 | 50,000 | ||||||||||||||
TOTAL ASSETS | 196,827,646 | 85,948,053 | 2,736,125 | 50,000 | ||||||||||||||
SHAREHOLDERS EQUITY | ||||||||||||||||||
Capital and reserves attributable to equity holders of the parent | ||||||||||||||||||
Share capital | 193,373,922 | 84,266,985 | 2,513,059 | 50,000 | ||||||||||||||
Equity-settled compensation | 3,129,725 | 2,325,325 | 55,751 | — | ||||||||||||||
Accumulated deficit | (3,031,293 | ) | (2,694,460 | ) | (107,549 | ) | — | |||||||||||
Equity attributable to equity holders of the parent | 193,472,354 | 83,897,850 | 2,461,261 | 50,000 | ||||||||||||||
Non controlling interest | — | 42,234 | 132,926 | — | ||||||||||||||
TOTAL SHAREHOLDERS EQUITY | 193,472,354 | 83,940,084 | 2,594,187 | 50,000 | ||||||||||||||
LIABILITIES | ||||||||||||||||||
Non-Current Liabilities | ||||||||||||||||||
Finance lease liabilities | 12,24 | 2,368 | 7,893 | — | — | |||||||||||||
Deferred income tax liabilities | 18 | 590,453 | 179,404 | 10,694 | — | |||||||||||||
Total Non-Current Liabilities | 592,821 | 187,297 | 10,694 | — | ||||||||||||||
Current Liabilities | ||||||||||||||||||
Trade and other payables | 12,17 | 2,535,048 | 1,726,164 | 127,128 | — | |||||||||||||
Payroll and social security liabilities | 222,861 | 90,452 | 4,116 | — | ||||||||||||||
Finance lease liabilities | 12,24 | 4,562 | 4,056 | — | — | |||||||||||||
Total Current Liabilities | 2,762,471 | 1,820,672 | 131,244 | — | ||||||||||||||
TOTAL LIABILITIES | 3,355,292 | 2,007,969 | 141,938 | — | ||||||||||||||
TOTAL SHAREHOLDERS EQUITY AND LIABILITIES | 196,827,646 | 85,948,053 | 2,736,125 | 50,000 | ||||||||||||||
The accompanying notes are an integral part of these consolidated financial statements.
F-5
Table of Contents
Consolidated Statements of Comprehensive Income
for the years ended June 30, 2010 and 2009 and for the period from inception
on January 2, 2008 to June 30, 2008
(All amounts in US$, except shares and per share data and as otherwise indicated)
| Note | June 30, 2010 | June 30, 2009 | From inception to June 30, 2008 | |||||||||||||
Sales of agricultural produce and biological assets and services rendered | 19 | 1,580,880 | 199,394 | — | ||||||||||||
Rental income | 24 | 54,133 | — | — | ||||||||||||
Cost of agricultural produce and biological assets sold and services rendered | 20 | (1,573,883 | ) | (157,772 | ) | — | ||||||||||
Initial recognition and changes in fair value of biological assets and agricultural produce | 5,335,808 | 232,324 | 5,864 | |||||||||||||
Cost of production | 20 | (3,437,732 | ) | (943,392 | ) | (5,864 | ) | |||||||||
Margin Before Operating Expenses | 1,959,206 | (669,446 | ) | — | ||||||||||||
General and administrative expenses | 20 | (3,582,205 | ) | (1,636,123 | ) | (104,408 | ) | |||||||||
Selling expenses | 20 | (24,613 | ) | (3,911 | ) | — | ||||||||||
Other operating income, net | — | 1,618 | — | |||||||||||||
Loss from Operations Before Financing and Taxation | (1,647,612 | ) | (2,307,862 | ) | (104,408 | ) | ||||||||||
Finance income | 22 | 1,371,337 | 653,411 | — | ||||||||||||
Finance costs | 22 | (520 | ) | (865,538 | ) | (6,615 | ) | |||||||||
Financial results, net | 22 | 1,370,817 | (212,127 | ) | (6,615 | ) | ||||||||||
Loss Before Income Tax | (276,795 | ) | (2,519,989 | ) | (111,023 | ) | ||||||||||
Income tax expense | 18 | (81,643 | ) | (157,614 | ) | (5,249 | ) | |||||||||
Loss for the Year/ Period | (358,438 | ) | (2,677,603 | ) | (116,272 | ) | ||||||||||
Total Comprehensive Loss for the Year/ Period | (358,438 | ) | (2,677,603 | ) | (116,272 | ) | ||||||||||
Loss / Total Comprehensive Loss Attributable to: | ||||||||||||||||
Equity holders of the parent | (336,833 | ) | (2,586,911 | ) | (107,549 | ) | ||||||||||
Non controlling interest | (21,605 | ) | (90,692 | ) | (8,723 | ) | ||||||||||
Losses per share for loss attributable to equity holders of the parent during the year/ period: | ||||||||||||||||
Basic and Diluted | 23 | (0.021 | ) | (0.305 | ) | (0.374 | ) | |||||||||
The accompanying notes are an integral part of these consolidated financial statements.
F-6
Table of Contents
Consolidated Statements of Changes in Shareholders’ Equity
for the years ended June 30, 2010 and 2009 and for the period from inception
on January 2, 2008 to June 30, 2008
(All amounts in US$, except shares and per share data and as otherwise indicated)
| Attributable to equity holders of the parent | ||||||||||||||||||||||||||||
| Number of shares | Share Capital | Equity-settled Compensation | Accumulated Deficit | Subtotal | Non Controlling Interest | Total Shareholders’ Equity | ||||||||||||||||||||||
Capital contribution at inception on January 2, 2008 | 50,000 | 50,000 | — | — | 50,000 | — | 50,000 | |||||||||||||||||||||
Capital contributions | 4,950,004 | 2,463,059 | — | — | 2,463,059 | — | 2,463,059 | |||||||||||||||||||||
Non controlling interest in subsidiaries acquired | — | — | — | — | — | 141,649 | 141,649 | |||||||||||||||||||||
Share options granted | — | — | 55,751 | — | 55,751 | — | 55,751 | |||||||||||||||||||||
Total comprehensive loss for the period | — | — | — | (107,549 | ) | (107,549 | ) | (8,723 | ) | (116,272 | ) | |||||||||||||||||
Balance at June 30, 2008 | 5,000,004 | 2,513,059 | 55,751 | (107,549 | ) | 2,461,261 | 132,926 | 2,594,187 | ||||||||||||||||||||
Capital contributions | 64,384,370 | 81,753,926 | — | — | 81,753,926 | — | 81,753,926 | |||||||||||||||||||||
Share options granted | — | — | 2,269,574 | — | 2,269,574 | — | 2,269,574 | |||||||||||||||||||||
Total comprehensive loss for the year | — | — | — | (2,586,911 | ) | (2,586,911 | ) | (90,692 | ) | (2,677,603 | ) | |||||||||||||||||
Balance at June 30, 2009 | 69,384,374 | 84,266,985 | 2,325,325 | (2,694,460 | ) | 83,897,850 | 42,234 | 83,940,084 | ||||||||||||||||||||
Capital contributions | 72,772,960 | 107,989,945 | — | — | 107,989,945 | — | 107,989,945 | |||||||||||||||||||||
Share options granted | — | — | 977,078 | — | 977,078 | — | 977,078 | |||||||||||||||||||||
Share options exercised | 812,497 | 1,187,683 | (172,678 | ) | — | 1,015,005 | — | 1,015,005 | ||||||||||||||||||||
Total comprehensive loss for the year | — | — | — | (336,833 | ) | (336,833 | ) | (21,605 | ) | (358,438 | ) | |||||||||||||||||
Acquisition of non controlling interest | — | (70,691 | ) | — | — | (70,691 | ) | (20,629 | ) | (91,320 | ) | |||||||||||||||||
Balance at June 30, 2010 | 142,969,831 | 193,373,922 | 3,129,725 | (3,031,293 | ) | 193,472,354 | — | 193,472,354 | ||||||||||||||||||||
On June 23, 2011, the Board of Directors approved the consolidation of the Common Shares to be effected at a ratio of one post-consolidation common share for every six pre-consolidation common shares (the “Reverse Stock Split”). Please see Note 28 for further details.
The accompanying notes are an integral part of these consolidated financial statements.
F-7
Table of Contents
Consolidated Statements of Cash Flows
for the years ended June 30, 2010 and 2009 and for the period from inception
on January 2, 2008 to June 30, 2008
(All amounts in US$, except shares and per share data and as otherwise indicated)
| Note | June 30, 2010 | June 30, 2009 | From inception to June 30, 2008 | |||||||||||||
Cash flows from operating activities: | ||||||||||||||||
Loss for the year/ period | (358,438 | ) | (2,677,603 | ) | (116,272 | ) | ||||||||||
Adjustments for: | ||||||||||||||||
Income tax expense | 18 | 81,643 | 157,614 | 5,249 | ||||||||||||
Depreciation | 7,9 | 227,248 | 69,518 | 12,647 | ||||||||||||
Amortization | 10 | 1,622 | — | — | ||||||||||||
Gain from the disposal of property items | 28 | — | (1,618 | ) | — | |||||||||||
Employee share options granted | 15 | 12,966 | 285,594 | — | ||||||||||||
Changes in fair value of financial assets at fair value through profit or loss | 22 | (178,495 | ) | — | — | |||||||||||
Interest income | 22 | (664,137 | ) | (260,433 | ) | — | ||||||||||
Interest expense | 22 | 520 | 896 | — | ||||||||||||
Unrealized initial recognition and changes in fair value of biological assets and agricultural produce | (3,975,846 | ) | (206,500 | ) | (5,864 | ) | ||||||||||
Unrealized foreign exchange (gains)/ losses, net | 22 | (144,144 | ) | 197,123 | — | |||||||||||
Changes in operating assets and liabilities: | ||||||||||||||||
Increase in trade and other receivables, net | (5,027,101 | ) | (287,652 | ) | (181,402 | ) | ||||||||||
Increase in inventories | (1,791,443 | ) | (33,389 | ) | — | |||||||||||
Increase in biological assets | (1,845,959 | ) | (985,306 | ) | — | |||||||||||
Increase in financial assets at fair value through profit or loss | (1,012,482 | ) | — | — | ||||||||||||
Increase/ (decrease) in trade and other payables | 861,281 | 1,502,268 | (5,078 | ) | ||||||||||||
Increase/ (decrease) in payroll and social security liabilities | 132,409 | 86,336 | (171 | ) | ||||||||||||
Net cash used in operating activities before interest paid | (13,680,356 | ) | (2,153,152 | ) | (290,891 | ) | ||||||||||
Interest paid | (477 | ) | (821 | ) | — | |||||||||||
Net cash used in operating activities | (13,680,833 | ) | (2,153,973 | ) | (290,891 | ) | ||||||||||
The accompanying notes are an integral part of these consolidated financial statements.
F-8
Table of Contents
Union Agriculture Group Corp.
Consolidated Statements of Cash Flows (Continued)
for the years ended June 30, 2010 and 2009 and for the period from inception
on January 2, 2008 to June 30, 2008
(All amounts in US$, except shares and per share data and as otherwise indicated)
| Note | June 30, 2010 | June 30, 2009 | From inception to June 30, 2008 | |||||||||||||
Cash flows from investing activities: | ||||||||||||||||
Acquisition of subsidiaries, net of cash acquired | 25 | — | — | (1,064,532 | ) | |||||||||||
Payments for investment property underPromesas | 9 | (4,667,247 | ) | — | — | |||||||||||
Payments for land underPromesas | 8 | (89,197,367 | ) | (11,517,302 | ) | — | ||||||||||
Purchases of property, plant and equipment | 7 | (3,040,627 | ) | (513,254 | ) | — | ||||||||||
Proceeds from sale of property, plant and equipment | 7 | — | 12,073 | — | ||||||||||||
Purchases of intangible assets | 10 | (26,858 | ) | — | — | |||||||||||
Purchases of investments in debt certificates | — | (1,912,498 | ) | — | ||||||||||||
Proceeds from investments in debt certificates | 1,912,498 | — | — | |||||||||||||
Loans granted | (4,129,100 | ) | (800,000 | ) | — | |||||||||||
Proceeds from loans granted | 2,404,098 | — | — | |||||||||||||
Interest received | 22 | 627,503 | 242,143 | — | ||||||||||||
Net cash used in investing activities | (96,117,100 | ) | (14,488,838 | ) | (1,064,532 | ) | ||||||||||
Cash flows from financing activities: | ||||||||||||||||
Proceeds from issuance of ordinary shares | 109,969,062 | 83,737,906 | 1,319,515 | |||||||||||||
Acquisition of non controlling interest in subsidiaries | (91,320 | ) | — | — | ||||||||||||
Payment of finance lease liabilities | (5,062 | ) | (2,625 | ) | — | |||||||||||
Net cash generated from financing activities | 109,872,680 | 83,735,281 | 1,319,515 | |||||||||||||
Net increase/ (decrease) in cash and cash equivalents | 74,747 | 67,092,470 | (35,908 | ) | ||||||||||||
Cash and cash equivalents at beginning of year/ period | 67,014,579 | 43,148 | — | |||||||||||||
Increase in cash and cash equivalents due to the formation of the Group | 25 | — | — | 79,056 | ||||||||||||
Foreign exchange gains / (losses) on cash and cash equivalents | 36,312 | (121,039 | ) | — | ||||||||||||
Cash and cash equivalents at end of year/ period | 67,125,638 | 67,014,579 | 43,148 | |||||||||||||
The accompanying notes are an integral part of these consolidated financial statements.
F-9
Table of Contents
The accompanying notes are an integral part of these consolidated financial statements.
Notes to the Consolidated Financial Statements
(All amounts in US$, except shares and per share data and as otherwise indicated)
| 1. | Formation of the Group and general information |
Union Agriculture Group Corp. (the “Company” or “UAG”) was incorporated in the British Virgin Islands on January 2, 2008 (Inception) as Weitvil Holdings Inc. Since inception, the Company has been engaged in acquiring farmland, paying for land underPromesas, organizational and business efforts and obtaining initial financing. The Company was formed as a vehicle to pursue a business combination through the acquisition of two pre-existing blueberry businesses, and subsequently, to acquire farmland to diversify its agricultural portfolio. See Note 25 for a detailed description of the formation of the Group.
The Company is today a holding company primarily engaged through its operating subsidiaries in agricultural and agricultural-related activities in Uruguay in several lines of business, including crops, rice, cattle, sheep, dairy, blueberries and others. In addition, the Company is currently leasing three agricultural properties from which it derives rental income. The Company and its operating subsidiaries are collectively referred to hereinafter as the “Group”. See also Note 6 for a description of the Group’s segments.
The Company is the ultimate parent company and is a corporation incorporated and domiciled in the British Virgin Islands. The address of its registered office is Vanterpool Plaza, 2nd floor, Wickhams Cay I, Road Town, Tortola, British Virgin Islands.
These consolidated financial statements have been approved for issue by the Board of Directors on July 14, 2011.
| 2. | Summary of significant accounting policies |
The principal accounting policies applied in the preparation of these consolidated financial statements are set out below. These policies have been consistently applied to all the periods presented, unless otherwise stated.
| 2.1. | Basis of preparation |
The consolidated financial statements of the Group have been prepared in accordance with International Financial Reporting Standards (IFRS) of the International Accounting Standards Board (IASB) and the Interpretations of the International Financial Reporting Interpretations Committee (IFRIC). All IFRS issued by the IASB, effective at the time of preparing these consolidated financial statements have been applied. In addition, certain IFRS which are not effective as of June 30, 2010 but that permit earlier adoption have been applied. The Group has applied IFRS for the first time for the year ended June 30, 2010 with a transition date of January 2, 2008. Note 3 to these consolidated financial statements contains the details of the Group’s transition to IFRS and application of IFRS 1 “First Time Adoption of IFRS”.
Presentation in the statement of financial position differentiates between current and non-current assets and liabilities. Assets and liabilities are regarded as current if they mature within one year or within the normal business cycle of the Group, or are held for sale. The consolidated financial statements are presented in United States Dollars. The fiscal year begins on July 1 and ends on June 30 of the following year. However, the production is based on the harvest year for crops, rice and blueberries. A harvest year varies by plant according to the climate in which it is grown. Due to the geographic diversity of the farms, the planting period for a given plant may start earlier on one farm than on another, causing differences in their respective harvesting periods. The financial results are presented on a fiscal year basis.
F-10
Table of Contents
Union Agriculture Group Corp.
Notes to the Consolidated Financial Statements (Continued)
(All amounts in US$, except shares and per share data and as otherwise indicated)
| 2.1. | Basis of preparation (continued) |
The consolidated financial statements have been prepared under the historical cost convention as modified by financial assets at fair value through profit or loss and biological assets and agricultural produce at the point of harvest measured at fair value.
The preparation of financial statements in conformity with IFRS requires the use of certain critical accounting estimates. It also requires management to exercise its judgment in the process of applying the Group’s accounting policies. The areas involving a higher degree of judgment or complexity, or areas where assumptions and estimates are significant to the consolidated financial statements are disclosed in Note 5.
| 2.2. | Going concern |
The Group was organized on January 2, 2008. From inception through June 30, 2008, the Group operated primarily with only a minor extension of hectares of blueberry plantations. The commercial activity of the Group during that period was minimal with no sales recorded. During the year ended June 30, 2009, the Group executedPromesas for several hectares of land (See Note 5(a) for details) and entered into the cattle and sheep businesses. The commercial activity of the Group was also not significant during this period. During the year ended June 30, 2010, the Group continued executingPromesasand began its crops, rice and dairy businesses.
Consequently, to date the Group has only a limited operating history and limited revenues. Activities have been limited to acquiring farmland, executingPromesas, organizational and business efforts and obtaining initial financing. Since inception through June 30, 2010, the Group has incurred cumulative losses of US$ 3.0 million and has never generated enough funds through operations to support its business.
The Group’s working capital position is positive as of June 30, 2010 and the Group does not have debt with external parties. The Group’s current cash and cash equivalents balance amounts to US$ 67.1 million as of June 30, 2010. The Group has raised capital through private placements aggregating US$ 351.5 million to date, which were primarily used to pay for land underPromesas. For the foreseeable future, the Group expects to rely principally upon the proceeds obtained through private placements and the proceeds of an initial public offering.
The Group expects that its operations may use cash rather than providing it for the near future until full capacity is reached in the land used underPromesas. Also, the Group may incur more losses in the near future as it continues to develop its business plan. The Group’s forecasts and projections, taking account of reasonably possible changes in trading performance, show that the Group should be able to operate within the level of its current financing. The Group is of the opinion that it has adequate resources to continue in operational existence for the foreseeable future. The Group therefore adopts the going concern basis in preparing its consolidated financial statements.
The accompanying notes are an integral part of these consolidated financial statements.
F-11
Table of Contents
Union Agriculture Group Corp.
Notes to the Consolidated Financial Statements (Continued)
(All amounts in US$, except shares and per share data and as otherwise indicated)
| 2.3. | New accounting standards |
The following standards, amendments and interpretations have been issued by the IASB and IFRIC and although they are not effective they have been adopted early by the Group in these consolidated financial statements:
IFRS 9 “Financial Instruments”
In November 2009, the IASB issued IFRS 9 “Financial Instruments”. The standard incorporates the first part of a three-phase project to replace IAS 39 “Financial Instruments: Recognition and Measurement”. IFRS 9 prescribes the classification and measurement of financial assets. IFRS 9 requires that financial assets are subsequently measured either “at amortized cost” or “at fair value”, depending on whether certain conditions are met. In addition, IFRS 9 permits an entity to designate an instrument, that would otherwise have been classified in the “at amortized cost” category, to be “at fair value” if that designation eliminates or significantly reduces measurement or recognition inconsistencies.
The prescribed category for equity instruments is at fair value through profit or loss, however, an entity may irrevocably opt for presenting all fair value changes of equity instruments not held for trading in Other Comprehensive Income. Only dividends received from these investments are reported in profit or loss.
In October 2010, the IASB issued further additions to IFRS 9. These bring forth the guidance for derecognizing financial instruments and most of the requirements for the classification and measurement of financial liabilities currently included within IAS 39. The additions include amortized cost accounting for most financial liabilities, with bifurcation of embedded derivatives. The main change is that in cases where the fair value option is taken for financial liabilities, the part of a fair value change due to an entity’s own credit risk is recorded in other comprehensive income rather than the statement of income, unless this creates an accounting mismatch. The remaining phases of the project, dealing with impairment of financial instruments and hedge accounting, have not yet been finalized. The IASB expects to completely replace IAS 39 by the end of 2010.
IFRS 9, as well as its additions, shall be applied retrospectively for annual periods beginning on or after January 1, 2013. Earlier adoption is permitted. The Group has adopted IFRS 9 from June 30, 2010, as well as the related consequential amendments to other IFRSs, because this new accounting policy provides reliable and more relevant information for users to assess the amounts, timing and uncertainty of future cash flows. The Group has restated all comparative figures. The Group’s management has assessed the financial assets held by the Group at the date of initial application (June 30, 2010). Financial assets previously classified as loans and receivables under IAS 39 as of July 1, 2009, meet the criteria to be classified as at amortized cost in accordance with IFRS 9. Other financial assets previously classified as at fair value through profit or loss as of July 1, 2009 continue to be classified as such in accordance with IFRS 9. Therefore, there was no difference between the previous carrying amounts (IAS 39) and the carrying amounts under IFRS 9 of the financial assets as of July 1, 2009.
Amendment to IFRS 2 “Share-based Payment: Group Cash-settled Share-based Payment Transactions”
The IASB issued an amendment to IFRS 2 in June 2009. The amendment relates to the accounting for group-settled share-based payment transactions, stating that an entity that receives goods or services in a share-based payment arrangement must account for those goods or services irrespective of which entity within the
The accompanying notes are an integral part of these consolidated financial statements.
F-12
Table of Contents
Union Agriculture Group Corp.
Notes to the Consolidated Financial Statements (Continued)
(All amounts in US$, except shares and per share data and as otherwise indicated)
| 2.3. | New accounting standards (continued) |
group settles the transaction. The amendment to IFRS 2 also incorporates guidance previously included in IFRIC 8 “Scope of IFRS 2” and IFRIC 11 “Group and Treasury Share Transactions”. As a result, the IASB has withdrawn IFRIC 8 and IFRIC 11. The amendment to IFRS 2 is effective for annual periods beginning on or after January 1, 2010 and applies retrospectively. The Group has adopted the amendment to IFRS 2 from June 30, 2010. The amendment did not result in changes to the Group’s financial statements.
The following standards, amendments and interpretations have been issued by the IASB and IFRIC, but they are not effective and have not been adopted early by the Group in these consolidated financial statements:
2009 Improvements to IFRSs
On April 16, 2009, the IASB issued Improvements to IFRSs – a collection of amendments to twelve International Financial Reporting Standards – as part of its program of annual improvements to its standards. With the exception of four amendments effective for annual periods beginning on or after July 1, 2009, the remaining amendments are effective for annual periods beginning on or after January 1, 2010 (thus effective for the Group’s fiscal year ended June 30, 2011), although entities are permitted to adopt them earlier. These amendments include IAS 1 “Presentation of Financial Statements”, IFRS 5 “Measurement of Non-Current Assets (or disposal groups) Classified as Held-for-Sale”, IAS 7 “Statement of Cash Flows”, IAS 17 “Leases”, IAS 36 “Impairment of Assets” and IAS 39 “Financial Instruments: Recognition and Measurement”. None of these amendments are expected to have a significant impact on to the Group’s financial statements.
2010 Improvements to IFRSs
On 6 May 2010, the IASB issued Improvements to IFRSs – a collection of amendments to seven IFRSs – as part of its program of annual improvements to its standards. Most of the amendments are effective for annual periods beginning on or after 1 January 2011 (thus effective for the Group’s fiscal year ended June 30, 2012), although entities are generally permitted to adopt them earlier. These amendments relate to IFRS 1 “First Time Adoption of IFRS”, IFRS 3 “Business Combinations”, IFRS 7 “Financial Instruments: Disclosures”, IAS 1 “Presentation of Financial Statements”, IAS 27 “Consolidated and Separate Financial Statements”, IAS 34 “Interim Financial Reporting” and IFRIC 13 “Customer Loyalty Programmes”. The Group is in the process of analyzing these amendments although it expects they will not have a material impact on the Group’s results of operations, financial position and cash flows.
IAS 24 (revised) “Related Party Disclosures”
The IASB issued IAS 24 (revised) in November 2009. The revisions provide a partial exemption from the disclosure requirements for government-related entities and simplify the definition of a related party. The revisions are applicable for accounting periods beginning on or after 1 January 2011 (effective for the Group’s year ended June 30, 2012) and are not expected to have a material impact on the Group’s financial statements.
Amendment to IAS 32 “Financial Instruments: Presentation”
An amendment to IAS 32 (Financial Instruments: Presentation) was issued in October 2009. The amendment clarifies that rights issues, options and warrants denominated in a currency other than the issuer’s
The accompanying notes are an integral part of these consolidated financial statements.
F-13
Table of Contents
Union Agriculture Group Corp.
Notes to the Consolidated Financial Statements (Continued)
(All amounts in US$, except shares and per share data and as otherwise indicated)
| 2.3. | New accounting standards (continued) |
functional currency and offered on a pro-rata basis to all owners of the same class of equity must be classified as equity. Such rights issues have so far been accounted for as liabilities. The change relates only to issues of a fixed number of shares at a fixed foreign-currency exercise price. The amendment is to be applied for annual periods beginning on or after February 1, 2010. Earlier application is permitted. The amendment will be effective for the Group’s fiscal year ended June 30, 2011 and it will not have a material impact on the presentation of the Group’s financial position, results of operations or earnings per share.
IFRIC 19 “Extinguishing Financial Liabilities with Equity Instruments”
IFRIC 19 “Extinguishing Financial Liabilities with Equity Instruments” was issued in November 2009. The interpretation addresses the accounting treatment in cases where a company settles all or part of a financial liability by issuing equity instruments to the creditor. It is to be applied for annual periods beginning on or after July 1, 2010. Earlier application is permitted. The Group will apply this interpretation for its year ended June 30, 2011. Its impact on the presentation of the Group’s financial position and results of operations will depend on the extent to which financial liabilities are settled with equity instruments in the future.
Amendment to IFRIC 14 “IAS 19 – The Limit on a Defined Benefit Asset, Minimum Funding Requirements and their Interaction, an Interpretation of IAS 19 (Employee Benefits)”
In November 2009 amendments were issued to IFRIC 14 “IAS 19 – The Limit on a Defined Benefit Asset, Minimum Funding Requirements and their Interaction”, an interpretation of IAS 19 (Employee Benefits). The amendments apply when a company is subject to minimum pension plan funding requirements. They enable prepayments of the respective contributions to be recognized as an asset. The amendments are to be applied for annual periods beginning on or after January 1, 2011. Earlier application is permitted. These amendments will not have a material impact on the presentation of the Group’s financial position or results of operations.
Amendment to IFRS 7 “Financial Instruments: Disclosures”
In October 2010, the IASB issued an amendment to IFRS 7 “Financial Instruments: Disclosures”. The amendment requires additional disclosures in respect of risk exposures arising from transferred financial assets. The amendment includes a requirement to disclose by class of asset the nature, carrying amount and a description of the risks and rewards of financial assets that have been transferred to another party yet remain on the entity’s statement of financial position. Disclosures are also required to enable a user to understand the amount of any associated liabilities, and the relationship between the financial assets and associated liabilities. The amendment to IFRS 7 shall be applied for annual periods beginning on or after 1 July 2011, with earlier application permitted. Therefore it will be effective for the Group’s fiscal year ended June 30, 2012. The amendment is not expected to have a material impact on the presentation of the Group’s results of operations, financial position or cash flows.
Amendments to IFRS 1 “First-Time Adoption of IFRS”
The IASB has issued two amendments to IFRS 1, “First-time adoption of International Financial Reporting Standards”, to create an additional exemption when an entity resumes presenting financial statements in
The accompanying notes are an integral part of these consolidated financial statements.
F-14
Table of Contents
Union Agriculture Group Corp.
Notes to the Consolidated Financial Statements (Continued)
(All amounts in US$, except shares and per share data and as otherwise indicated)
| 2.3. | New accounting standards (continued) |
accordance with IFRSs after being subject to severe hyperinflation and to eliminate references to fixed dates for one exception and one exemption, both dealing with financial assets and liabilities. These amendments are not applicable to the Group.
Amendment to IAS 12 “Income Taxes”
The IASB has amended IAS 12, “Income taxes”, to introduce an exception to the existing principle for the measurement of deferred tax assets or liabilities arising on investment property measured at fair value. The IASB has added another exception to the principles in IAS 12: the rebuttable presumption that investment property measured at fair value is recovered entirely by sale. This presumption is rebutted if the investment property is depreciable (for example, buildings and land held under a lease) and is held within a business model whose objective is to consume substantially all of the economic benefits embodied in the investment property over time, rather than through sale before the end of its economic life. The presumption cannot be rebutted for freehold land that is an investment property, because land can only be recovered through sale. The amendments are effective for annual periods beginning on or after 1 January 2012. The amendment will not result in a change to the Group’s results to the extent it will not have investment properties measured at fair value.
IFRS 10 “Consolidated Financial Statements”
On 12 May 2011 the IASB issued IFRS 10 “Consolidated Financial Statements” which establishes principles for the presentation and preparation of consolidated financial statements when an entity controls one or more other entities. IFRS 10 replaces the consolidation requirements in SIC-12 Consolidation—Special Purpose Entities and IAS 27 Consolidated and Separate Financial Statements and is effective for annual periods beginning on or after 1 January 2013. IFRS 1o will be effective for the Group for its fiscal year ended June 30, 2014. Earlier application is permitted. IFRS 10 builds on existing principles by identifying the concept of control as the determining factor in whether an entity should be included within the consolidated financial statements of the parent company. The standard provides additional guidance to assist in the determination of control where this is difficult to assess.
IFRS 11 “Joint Arrangements”
On 12 May 2011 the IASB issued IFRS 11 “Joint Arrangements” which provides for a more realistic reflection of joint arrangements by focusing on the rights and obligations of the arrangement, rather than its legal form (as is currently the case). The standard addresses inconsistencies in the reporting of joint arrangements by requiring a single method to account for interests in jointly controlled entities. IFRS 11 is effective for annual periods beginning on or after 1 January 2013. Earlier application is permitted. IFRS 11 will be effective for the Group for its fiscal year ended June 30, 2014.
IFRS 12 “Disclosure of Interests in Other Entities”
On 12 May 2011 the IASB issued IFRS 12 “Disclosure of Interests in Other Entities”. IFRS 12 is a new and comprehensive standard on disclosure requirements for all forms of interests in other entities, including subsidiaries, joint arrangements, associates and unconsolidated structured entities. IFRS 12 is effective for annual
The accompanying notes are an integral part of these consolidated financial statements.
F-15
Table of Contents
Union Agriculture Group Corp.
Notes to the Consolidated Financial Statements (Continued)
(All amounts in US$, except shares and per share data and as otherwise indicated)
| 2.3. | New accounting standards (continued) |
periods beginning on or after 1 January 2013. Earlier application is permitted. IFRS 12 will be effective for the Group for its fiscal year ended June 30, 2014.
IFRS 13 “Fair Value Measurement”
On May 12, 2011, the IASB issued IFRS 13 “Fair Value Measurement” which replaces the fair value measurement guidance currently dispersed across different IFRS standards with a single definition of fair value and extensive application guidance. IFRS 13 provides guidance on how to measure fair value and does not introduce new requirements for when fair value is required or permitted. It also establishes disclosure requirements to provide users of financial statements with more information about fair value measurements.
IFRS 13 was developed in a joint project with the US Financial Accounting Standards Board (FASB) and the guidance in IFRS 13 is largely converged with FASB’s ASC Topic 820 Fair Value Measurement and Disclosures. IFRS 13 is effective for annual periods beginning on or after 1 January 2013. Earlier application is permitted. IFRS 13 will be effective for the Group for its fiscal year ended June 30, 2014.
| 2.4. | Scope of consolidation |
The consolidated financial statements include the results of the Company and all of its subsidiaries from the date that control commences to the date that control ceases.
(a) Subsidiaries
Subsidiaries are all entities (including special purpose entities) over which the Group has the power to govern the financial and operating policies generally accompanying a shareholding of more than one half of the voting rights. The existence and effect of potential voting rights that are currently exercisable or convertible are considered when assessing whether the Group controls another entity. Subsidiaries are fully consolidated from the date on which control is transferred to the Group. They are de-consolidated from the date that control ceases.
From inception through June 30, 2010, the Group accounts for acquisitions using the purchase method of accounting as prescribed by IFRS 3R. Consideration is measured as the fair value of the assets given, equity instruments issued and liabilities incurred or assumed at the date of exchange. Identifiable assets acquired and liabilities and contingent liabilities assumed in a business combination are measured initially at their fair values at the acquisition date, irrespective of the extent of any non controlling interest. The excess of consideration over the fair value of the Group’s share of the identifiable net assets acquired is recorded as goodwill. If the consideration is less than the fair value of the net assets of the subsidiary acquired, the difference is recognized directly in the statement of comprehensive income. The Group has not completed any business combinations for the years ended June 30, 2010 and 2009.
Inter-company transactions, balances and unrealized gains on transactions between Group companies are eliminated. Unrealized losses are also eliminated but considered an impairment indicator of the asset transferred. Accounting policies of subsidiaries have been changed where necessary to ensure consistency with the policies adopted by the Group.
The accompanying notes are an integral part of these consolidated financial statements.
F-16
Table of Contents
Union Agriculture Group Corp.
Notes to the Consolidated Financial Statements (Continued)
(All amounts in US$, except shares and per share data and as otherwise indicated)
| 2.4. | Scope of consolidation (continued) |
(b) Transactions with non controlling interest
Non controlling interest is shown as a component of equity in the statement of financial position and the share of profit or loss attributable to non controlling interest is shown as a component of profit or loss for the year in the consolidated statement of comprehensive income.
The Group treats transactions with non controlling interests as transactions with equity owners of the Group. For purchases of non controlling interests, the difference between any consideration paid and the relevant share acquired of the carrying value of net assets of the subsidiary is recorded in equity. Gains or losses on disposals to non controlling interests are also recorded in equity.
| 2.5. | Segment reporting |
According to IFRS 8, operating segments are identified based on the ‘management approach’. This approach stipulates external segment reporting based on the Group’s internal organizational and management structure and on internal financial reporting to the chief operating decision maker. The Management Committee of the Group is responsible for measuring and steering the business success of the segments and is considered the chief operating decision maker within the meaning of IFRS 8.
| 2.6. | Foreign currency translation |
(a) Functional and presentation currency
IAS 21 “The effects of changes in foreign exchange rates” describes functional currency as ‘the currency of the primary economic environment in which entity operates’. At present, the majority of the Group’s operations are conducted in US dollars. The Group sells most of its production to third parties who in turn export to international markets where commodities are generally traded in US dollars. The Group has been expanding since inception through investing inPromesas for real estate. Real estate transactions in Uruguay are influenced by the price of international commodities traded in US dollars. Since inception the Group has financed its operations through private placements generating US dollar proceeds for the Group. With the exception of salaries and related costs to management and personnel based in Uruguay, who are paid in local currency, the majority of the other significant costs are transacted in US dollars. Based on these factors, the Group’s Board of Directors determined that the functional currency of its principal operating entities is the US Dollar. The presentation currency of the Group is also the US Dollar.
(b) Transactions and balances
Foreign currency transactions are translated into the functional currency using the exchange rates prevailing at the dates of the transactions or valuation where items are remeasured. The majority of the non-monetary items (i.e.Promesas for land, land, investment property underPromesas and other property, plant and equipment) are measured at historical cost in the functional currency at the time of the transactions. An immaterial amount of non-monetary items are measured at historical cost in a currency other than the functional currency.
Foreign exchange gains and losses resulting from the settlement of such transactions and from the translation at year-end exchange rates of monetary assets and liabilities denominated in foreign currencies are
The accompanying notes are an integral part of these consolidated financial statements.
F-17
Table of Contents
Union Agriculture Group Corp.
Notes to the Consolidated Financial Statements (Continued)
(All amounts in US$, except shares and per share data and as otherwise indicated)
| 2.6. | Foreign currency translation (continued) |
recognized in the statement of comprehensive income. Foreign exchange gains and losses are presented in the statement of comprehensive income within “Finance income” or “Finance costs”, as appropriate.
| 2.7. | Land underPromesas |
Land underPromesasrepresents payments to the sellers, of the full price of the land in arms-length transactions, consummated by the execution ofPromesas de Compraventa under Uruguayan Law 8,733 (see Note 5(a) for a description of real estate transactions in Uruguay and nature of these agreements as per Uruguayan law). As of the date of these consolidated financial statements, the Group has received authorizations from the Uruguayan government to proceed with the execution of theescrituras (deeds of title) for 17,846 hectares of land. An additional 188 hectares were previously approved andescrituras were already executed and consequently are classified as land within the property, plant and equipment line item on the statement of financial position. The Group has recognized payments forPromesasfor whichtitle has not been obtained as assets on the statement of financial position because (1) the Group paid full price for the land underPromesasand that price can be measured reliably and thePromesasare legally valid under Law No. 8,733 (see Note 5(a)); (2) at the time thePromesa was signed it was probable that the future economic benefits associated with thePromesas would flow to the Group as it has the ability to sell its rights in thePromesas and the sales value less costs to sell such rights is in excess of the carrying value of the assets recorded, and because from the date thePromesasare signed, the Group is obtaining benefits from using the land for its agricultural purposes as permitted by Law 8,733, Law 18,092 and related Decrees (see Note 5(a)); (3) thePromesas entitle the Group to certain rights including but not limited to (i) the use of theunderlying land (as permitted by Law 8,733) through June 30, 2011, and after that date, pending determination of the Group’s application for government authorizations (see Note 5(a)); (ii) the risks and benefits associated with thePromesas,excluding the right to sell the land since it is not owned; (iii) the right to sell, assign, transfer, or lease thePromesas to a third party, in the case of a sale for an amount equal to the fair value of the land since the buyer would be expected to seek the deed; and/or (iv) the right to pledge thePromesas; and (4) thePromesas are definitive binding agreements between the Group and the seller and are legally registered as per Uruguayan Law and enforceable against third parties. As of the date of these consolidated financial statements, the fair value of the land underlying thePromesas exceeds the sum of the amounts paid for thePromesas and any costs to sell such that there is no indication of impairment of the assets. Once the authorizations from the Uruguayan government are obtained for our continued use and ownership of the land and the deeds of title are executed, the payments reported as land underPromesas will be reclassified to the land category within property, plant and equipment (see Note 2.8).
The payments for land underPromesasare recorded at cost less impairment losses, if any. Historical cost comprises the price paid and any costs directly attributable to the transaction. Land underPromesas is not depreciated.
If the Group does not obtain governmental approval to proceed with the execution of theescrituras, the Group would resubmit the application for approval under a different exemption, i.e. the “Public Company Exception” (see Note 5(a) for details) as set forth in Section 2(a) of Uruguayan Decree No. 225/07. The Group would be permitted to apply for such exemption once the Offering is complete. The Group expects the process to obtain the Public Company Exception to take approximately 12 to 16 months after the Offering is complete. In addition, as further described above, the Group is able to sell and/or transfer thePromesas at any point in time to a third purchaser who will seek execution of the deed of title.
The accompanying notes are an integral part of these consolidated financial statements.
F-18
Table of Contents
Union Agriculture Group Corp.
Notes to the Consolidated Financial Statements (Continued)
(All amounts in US$, except shares and per share data and as otherwise indicated)
The accompanying notes are an integral part of these consolidated financial statements.
| 2.8. | Property, plant and equipment |
Property, plant and equipment is recorded at cost, less accumulated depreciation and impairment losses, if any. Historical cost comprises the purchase price and any costs directly attributable to the acquisition.
Where individual components of an item of property, plant and equipment have different useful lives, they are accounted for as separate items, which are depreciated separately.
Subsequent costs are included in the asset’s carrying amount or recognized as a separate asset, as appropriate, only when it is probable that future economic benefits associated with the item will flow to the Group and the cost of the item can be measured reliably. These costs may include the cost of replacing parts that are eligible for capitalization when the costs of replacing the parts are incurred. The carrying amount of the replaced part is derecognized. All other repairs and maintenance are charged to the statement of comprehensive income during the period in which they are incurred.
Land for which the deed of title has been signed is included in property, plant and equipment and is not depreciated. Depreciation on other assets is calculated using the straight-line method, to allocate their cost to their residual values over their estimated useful lives, as follows:
Buildings and facilities | 50 years | |||
Machinery | 10 years | |||
Furniture and equipment | 10 years | |||
Fixtures | 10 years | |||
Vehicles | 5 years |
The assets’ residual values and useful lives are reviewed, and adjusted if appropriate, at each statement of financial position date. An asset’s carrying amount is written down immediately to its recoverable amount if the asset’s carrying amount is greater than its estimated recoverable amount (See Note 2.12).
Gains and losses on disposals are determined by comparing the proceeds with the carrying amount and are recognized within “Other operating income, net” in the statement of comprehensive income.
| 2.9. | Investment property underPromesas |
Investment property underPromesas consists of farmland and buildings held to earn rentals or for capital appreciation and not used in production or for administrative purposes. Investment property underPromesas is measured at cost, less accumulated depreciation and impairment losses, if any. Farmland is not depreciated. Depreciation on buildings is calculated using the straight-line method to allocate their cost to their residual values over their estimated useful lives of 30 years.
Rental income from investment property underPromesas is recorded in the statement of comprehensive income (see Notes 9 and 24).
F-19
Table of Contents
Union Agriculture Group Corp.
Notes to the Consolidated Financial Statements (Continued)
(All amounts in US$, except shares and per share data and as otherwise indicated)
| 2.10. | Leases |
The Group is the lessee in certain operating and finance lease agreements. The Group is also a lessor in certain operating lease agreements. The Group classifies its leases at the inception as finance or operating leases.
Leases of property, plant and equipment where the Group has substantially all the risks and rewards of ownership are classified as finance leases. Finance leases are capitalized at the lease’s inception at the lower of the fair value of the leased property and the present value of the minimum lease payments.
Each lease payment is allocated between the liability and finance charges so as to achieve a constant rate on the finance balance outstanding. The corresponding rental obligations, net of finance charges, are included as “Finance lease liabilities” in the statement of financial position.
The interest element of the finance cost is charged to the statement of comprehensive income over the lease period so as to produce a constant periodic rate of interest on the remaining balance of the liability for each period. The property, plant and equipment acquired under finance leases is depreciated over the shorter of the asset’s useful life and the lease term.
Leases where the lessor retains substantially all the risks and rewards of ownership are classified as operating leases. Payments made under operating leases (net of any incentives received from the lessor) are charged to the statement of comprehensive income on a straight-line basis over the period of the lease.
Certain operating lease agreements where the Group acts as a lessor contain contingent rent provisions. Rental income is recognized once the contingency is resolved.
| 2.11. | Intangible assets |
Goodwill represents future economic benefits arising from assets that are not capable of being individually identified and separately recognized by the Group on an acquisition. Goodwill is computed as the excess of the consideration paid over the fair value of the Group’s share of net assets of the acquired subsidiary undertaking at the acquisition date and is allocated to those cash generating units expected to benefit from the acquisition for the purpose of impairment testing. Following initial recognition, goodwill is measured at cost less any accumulated impairment losses. Goodwill arising on the acquisition of subsidiaries is included within “Intangible assets, net” on the statement of financial position.
Goodwill is not amortized but tested for impairment on an annual basis, or more frequently if there is an indication of impairment. The impairment review requires management to make certain judgments, including estimating the recoverable value of the CGU to which the goodwill relates, based on either fair value less costs-to-sell or the value-in-use, as appropriate, in order to reach a conclusion on whether it deems the goodwill is impaired. . Gains and losses on the disposal of a Group entity include any goodwill relating to the entity sold.
Other intangible assets that are acquired by the Group, which have finite useful lives, are measured at cost less accumulated amortization and impairment losses. These intangible assets comprise computer software and are amortized in the statement of comprehensive income on a straight-line basis over their estimated useful lives estimated to be ten years.
| 2.12. | Impairment of assets |
Goodwill
For the purpose of impairment testing, assets are grouped at the lowest levels for which there are separately identifiable cash flows, known as cash-generating units. If the recoverable amount of the cash-generating unit is
The accompanying notes are an integral part of these consolidated financial statements.
F-20
Table of Contents
Union Agriculture Group Corp.
Notes to the Consolidated Financial Statements (Continued)
(All amounts in US$, except shares and per share data and as otherwise indicated)
2.12. Impairment of assets (continued)
less than the carrying amount of the unit, the impairment loss is allocated first to reduce the carrying amount of any goodwill allocated to the unit and then to the other assets of the unit pro-rata on the basis of the carrying amount of each asset in the unit. Impairment losses recognized for goodwill are not reversed in a subsequent period. Recoverable amount is the higher of fair value less costs to sell and value in use.
In assessing value in use, the estimated future cash flows are discounted to their present value using a pre-tax discount rate that reflects current market assessments of the time value of money and the risks specific to the asset for which the estimates of future cash flows have not been adjusted.
The fair value less costs-to-sell is determined by reference to recent transactions adjusted as necessary for factors such as location, size, profitability and risk among others.
Property, plant and equipment, land underPromesas, investment property underPromesas and finite-life intangible assets
At each statement of financial position date, the Group reviews the carrying amounts of its property, plant and equipment, land underPromesas,investment property underPromesasand finite-life intangible assets to determine whether there is any indication that those assets have suffered an impairment loss. If any such indication exists, the recoverable amount of the asset is estimated in order to determine the extent, if any, of the impairment loss. Where the asset does not generate cash flows that are independent from other assets, the Group estimates the recoverable amount of the cash-generating unit to which the asset belongs.
Where an impairment loss subsequently reverses, the carrying amount of the asset or cash-generating unit is increased to the revised estimate of its recoverable amount, not to exceed the carrying amount that would have been determined had no impairment loss been recognized for the asset or cash-generating unit in prior years. A reversal of an impairment loss is recognized immediately in the statement of comprehensive income.
| 2.13. | Biological assets and agriculture produce |
Biological assets are living plants or animals managed by the Group for sale, into agricultural produce, or into additional biological assets. Biological assets include livestock (breeding cattle, growing herd and cattle for sale), crops (mainly wheat, soybeans and rice), which are to be harvested as agricultural produce, and blueberry, which are self-regenerating for sustaining regular harvests of agricultural produce.
The Group distinguishes between consumable and bearer biological assets, and between mature and immature biological assets. “Consumable” biological assets are those assets that may be harvested as agricultural produce or sold as biological assets, for example livestock intended for the production of meat and/or livestock held for sale. “Bearer” biological assets are those assets capable of producing more than one harvest, for example blueberry plantations or livestock from which raw milk is produced. “Mature” biological assets are those that have attained harvestable specifications (for consumable biological assets) or are able to sustain regular harvests (for bearer biological assets). “Immature” biological assets are those assets other than mature biological assets. Consumable biological assets (such as crops, rice and cattle and sheep held for sale as living animals) are classified as current or non-current depending on the period of maturity. Bearer biological assets (such as blueberry bushes, dairy cattle and breeding cattle and sheep) are generally classified as non-current, except for breeding cattle and sheep which are classified as current if they are expected to be sold within one year.
The accompanying notes are an integral part of these consolidated financial statements.
F-21
Table of Contents
Union Agriculture Group Corp.
Notes to the Consolidated Financial Statements (Continued)
(All amounts in US$, except shares and per share data and as otherwise indicated)
| 2.13. | Biological assets and agriculture produce (continued) |
Expenses relating to the agricultural activity include planting, harvesting, weeding, seedlings, irrigation, agrochemicals, fertilizers, veterinary and others. The Group elected to expense all such costs when incurred and include them within “Cost of production” in the statement of comprehensive income. The line item “Cost of agricultural produce and biological assets sold and services rendered” represents the recognition as an expense of agricultural produce held in inventory valued at cost or biological assets valued at fair value less costs to sell, and the costs of providing agricultural services. Therefore, “Cost of production” represents the costs expensed whilst the biological assets are growing and “Cost of agricultural produce and biological assets sold and services rendered” is the expensing of items from inventory and/ or biological assets when sold.
Biological assets are measured at fair value less costs to sell on initial recognition and at each statement of financial position date, except where fair value cannot be reliably measured. Cost approximates fair value when little or no biological transformation has taken place since the costs were originally incurred or the impact of biological transformation on price is not expected to be material. Costs to sell include all incremental costs directly attributable to the sale of the biological assets, excluding finance costs and income taxes. The fair value of a biological asset in its present location and condition is determined based on either the present value of expected net cash flows from the biological asset discounted at a current market-determined pre-tax rate or the current quoted market price in the most relevant market with reference to the species, growing condition and other characteristics.
In determining the fair value of a biological asset based on the expected net discounted cash flows, the following factors have been taken into account:
(i) The productive life of the asset;
(ii) The period over which the asset will mature;
(iii) The expected future sales price;
(iv) The cost expected to arise throughout the life of the asset; and
(v) A pre-tax nominal discount rate.
Expected future sale prices for all biological assets are determined by reference to observable data in the relevant market. Costs expected to arise throughout the life of the biological assets are estimated based on historical and statistical data.
The gain or loss arising from initial recognition of a biological asset at fair value less costs to sell and from a change in fair value less costs to sell of a biological asset is recognized in profit or loss in the period in which they are incurred.
Agricultural produce harvested from the Group’s biological assets is initially measured at its fair value less costs to sell at the point of harvest. The fair value of agricultural produce is determined based on market prices in the local market. The gain or loss arising from initial recognition of agricultural produce as a result of harvesting is recognized in profit or loss in the period in which it arises. The fair value less costs to sell at the point of harvest is the deemed cost of the agricultural produce included in inventories for subsequent sale in the local market.
The accompanying notes are an integral part of these consolidated financial statements.
F-22
Table of Contents
Union Agriculture Group Corp.
Notes to the Consolidated Financial Statements (Continued)
(All amounts in US$, except shares and per share data and as otherwise indicated)
| 2.14. | Inventories |
Inventories comprise consumable supplies, harvested agricultural produce and others. Consumable supplies comprise fertilizers, agrochemicals, vaccines, feed for livestock and other items necessarily used in the Group’s farming activities.
Harvested agricultural produce is measured at fair value less costs to sell at the point of harvest, which is the cost at the date it is transferred to inventories. Subsequently, inventories are valued at the lower of cost or net realizable value.
All others inventories are measured at the lower of cost and net realizable value. Cost is determined using the first-in, first-out (FIFO) method.
| 2.15. | Financial assets |
The Group early adopted IFRS 9 as from June 30, 2010 and applied it retrospectively for all periods presented. IFRS 9 includes a single model that has only two classification categories: amortized cost and fair value. To qualify for amortized cost accounting, the instrument must meet two criteria as further described below. All other instruments are mandatorily measured at fair value. Classification under IFRS 9 is determined at inception based on the two criteria previously described. IFRS 9 requires all equity investments to be measured at fair value. However, an entity may make an irrevocable election at initial recognition to present all fair value changes for non-trading equity investments in other comprehensive income.
Therefore, as of July 1, 2009, the Group classified its financial assets in the following categories: those to be measured subsequently at fair value and those to be measured at amortized cost. This classification depends on whether the financial asset is a debt or an equity investment.
(a) Financial assets at fair value through profit or loss
Financial assets measured at fair value through profit or loss are financial assets held for trading. A financial asset is classified in this category if acquired principally for the purpose of selling in the short-term. Financial assets are classified as current if realization within 12 months is expected. Otherwise, they are classified as non-current. For all periods presented, the Group’s financial assets at fair value through profit or loss comprise equity investments held for trading in New Zealand Farming System Uruguay Ltd., a New Zealand based company with dairy farm operations in Uruguay.
(b) Financial assets at amortized cost
Financial assets measured at amortized cost are debt investments that meet the following criteria: the objective of the Group’s business model is to hold the asset to collect the contractual cash flows; and the contractual terms give rise on specified dates to cash flows that are solely payments of principal and interest on the principal outstanding. They are included in current assets, except for maturities greater than 12 months after the date of the statement of financial position. The Group’s financial assets at amortized cost comprise “trade and other receivables, net”, “investments in debt certificates” and “cash and cash equivalents” in the statement of financial position.
The accompanying notes are an integral part of these consolidated financial statements.
F-23
Table of Contents
Union Agriculture Group Corp.
Notes to the Consolidated Financial Statements (Continued)
(All amounts in US$, except shares and per share data and as otherwise indicated)
| 2.15. | Financial assets (continued) |
(c) Recognition and measurement
Regular purchases and sales of financial assets are recognized on the trade-date – the date on which the Group commits to purchase or sell the asset. Financial assets not carried at fair value through profit or loss are initially recognized at fair value plus transaction costs. Financial assets carried at fair value through profit or loss are initially recognized at fair value and transaction costs are expensed in the statement of comprehensive income. Financial assets are derecognized when the rights to receive cash flows from the investments have expired or have been transferred and the Group has transferred substantially all risks and rewards of ownership.
A gain or loss on a debt instrument that is subsequently measured at fair value and is not part of a hedging relationship is recognized in profit or loss and presented in the statement of comprehensive income within “financial results, net” in the period in which they arise.
A gain or loss on a debt instrument that is subsequently measured at amortized cost and is not part of a hedging relationship is recognized in profit or loss when the financial asset is derecognized or impaired and through the amortization process using the effective interest method.
The Group subsequently measures all equity investments at fair value. The fair values of quoted investments are based on current bid prices. Where the Group’s management has elected to present unrealized and realized fair value gains and losses on equity investments in other comprehensive income, there is no subsequently recycling of fair value gains and losses to profit or loss; there is therefore no impairment. Dividends from such investments continue to be recognized in profit or loss as long as they represent a return on investment.
The Group is required to reclassify all affected debt investments when and only when its business model for managing those assets changes.
The Group assesses at the end of each reporting period whether there is objective evidence that a financial asset carried at amortized cost is impaired. A financial asset or a group of financial assets is impaired and impairment losses are incurred only if there is objective evidence of impairment as a result of one or more events that occurred after the initial recognition of the asset (a “loss event”) and that loss event (or events) has an impact on the estimated future cash flows of the financial asset or group of financial assets that can be reliably estimated.
(d) Offsetting financial instruments
Financial assets and liabilities are offset and the net amount reported in the statement of financial position when there is a legally enforceable right to offset the recognized amounts and there is an intention to settle on a net basis, or realize the asset and settle the liability simultaneously.
| 2.16. | Trade receivables |
Trade receivables are recognized initially at fair value and subsequently measured at amortized cost using the effective interest method, less allowance for trade receivables if any. An allowance for trade receivables is established when there is objective evidence that the Group will not be able to collect all amounts due according to the original terms of the receivables. Significant financial difficulties of the debtor, probability that the debtor
The accompanying notes are an integral part of these consolidated financial statements.
F-24
Table of Contents
Union Agriculture Group Corp.
Notes to the Consolidated Financial Statements (Continued)
(All amounts in US$, except shares and per share data and as otherwise indicated)
| 2.16. | Trade receivables (continued) |
will enter bankruptcy or financial reorganization, and default or delinquency in payments are considered indicators that the trade receivable is impaired. Generally, trade receivables, which are more than 180 days past due are fully provided for. However, certain receivables 180+ days overdue may not be provided for based on a case-by-case analysis of credit quality. On the other hand, receivables, which are not 180+ days overdue, may be provided for if specific analysis indicates a potential impairment. The amount of the provision is the difference between the asset’s carrying amount and the present value of estimated future cash flows, discounted at the original effective interest rate. The carrying amount of the asset is reduced through the use of an allowance account, and the amount of the loss is recognized in the statement of comprehensive income within selling expenses. When a trade receivable is uncollectible, it is written off against the allowance account for trade receivables. Subsequent recoveries of amounts previously written off are credited against selling expenses in the statement of comprehensive income.
| 2.17. | Investments in debt certificates |
For the year ended June 30, 2009, investments in debt certificates included debt certificates representing undivided interests in third party securitized receivables trusts. The Group collected all contractual cash flows in the year ended June 30, 2010. See also Note 2.15 (b).
| 2.18. | Cash and cash equivalents |
Cash and cash equivalents includes cash in hand, deposits with banks and other short-term highly liquid investments with original maturities of three months or less.
| 2.19. | Trade payables |
Trade payables are initially recognized at fair value and subsequently measured at amortized cost using the effective interest method.
| 2.20. | Provisions |
Provisions are recognized when (i) the Group has a present legal or constructive obligation as a result of past events; (ii) it is probable that an outflow of resources will be required to settle the obligation; and (iii) a reliable estimate of the amount of the obligation can be made. The Group bases its accruals on up-to-date developments, estimates of the outcomes of the matters and legal counsel experience in contesting, litigating and settling matters. As the scope of the liabilities becomes better defined or more information is available, the Group may be required to change its estimates of future costs, which could have a material effect on its results of operations and financial condition or liquidity.
Provisions are measured at the present value of the expenditures expected to be required to settle the obligation using a pre-tax rate that reflects current market assessments of the time value of money and the risks specific to the obligation.
The accompanying notes are an integral part of these consolidated financial statements.
F-25
Table of Contents
Union Agriculture Group Corp.
Notes to the Consolidated Financial Statements (Continued)
(All amounts in US$, except shares and per share data and as otherwise indicated)
| 2.21. | Current and deferred income tax |
The Company is incorporated under the International Business Companies Act of the British Virgin Islands and accordingly, is exempted from payment of British Virgin Island’s income taxes. Accordingly, the Group’s tax expense comprises the charge for tax currently payable or deferred attributable to the Group’s subsidiaries in Uruguay. Tax is recognized in the statement of comprehensive income, except to the extent that it relates to items recognized directly in equity, in which case, it is also recognized in equity. In addition, dividend remittances from Group’s subsidiaries in Uruguay are subject to a 7% withholding tax levied by Uruguayan tax authorities.
The current income tax charge is calculated on the basis of the tax laws enacted or substantively enacted at the date of the statement of financial position in Uruguay where the Group’s subsidiaries currently operate and generate taxable income. Management periodically evaluates positions taken in tax returns with respect to situations in which applicable tax regulation is subject to interpretation. It establishes provisions where appropriate on the basis of amounts expected to be paid to the tax authorities.
Deferred income tax is recognized, using the liability method, on temporary differences arising between the tax bases of assets and liabilities and their carrying amounts in the consolidated financial statements. However, the deferred income tax is not accounted for if it arises from initial recognition of an asset or liability in a transaction other than a business combination that at the time of the transaction affects neither accounting nor taxable profit or loss. Deferred income tax is determined using tax rates (and laws) that have been enacted or substantively enacted by the date of the statement of financial position and are expected to apply when the related deferred income tax asset is realized or the deferred income tax liability is settled.
Deferred income tax assets are recognized only to the extent that it is probable that future taxable profit will be available against which the temporary differences can be utilized.
Deferred income tax is provided on temporary differences arising on investments in subsidiaries, except where the timing of the reversal of the temporary difference is controlled by the Group and it is probable that the temporary difference will not reverse in the foreseeable future.
The Group is able to control the timing of dividends from its subsidiaries and hence does not expect to remit overseas earnings in the foreseeable future in a way that would result in a charge to taxable profit. Hence deferred tax is recognized in respect of the retained earnings of overseas subsidiaries only to the extent that, at the date of the statement of financial position, dividends have been accrued as receivable or a binding agreement to distribute past earnings in future has been entered into by the subsidiary.
| 2.22. | Revenue recognition |
The Group is engaged in agricultural activities in several business segments. Revenue is measured at the fair value of the consideration received or receivable. Provided it is probable that the economic benefits will flow to the Group and the revenue and costs, if applicable, can be measured reliably, revenue is recognized in profit or loss. The Group recognizes revenue on product sales when the produce or biological assets are delivered and the customers take ownership and assume risk of loss, which is when the products are received by the customer at its or a designated location or collected directly by the customer from the cultivation bases, collection of the relevant receivable is probable and the selling price is fixed or determinable. Net sales of products represent the invoiced value of goods, net of trade discounts and allowances, if any. The Group also provides certain ancillary
The accompanying notes are an integral part of these consolidated financial statements.
F-26
Table of Contents
Union Agriculture Group Corp.
Notes to the Consolidated Financial Statements (Continued)
(All amounts in US$, except shares and per share data and as otherwise indicated)
| 2.22. | Revenue recognition (continued) |
agricultural related services to third parties. The Group also leases a mill and other warehousing space to third parties. Revenue from services is recognized as services are rendered. Lease income is recognized as services are provided. When lease agreements provide for contingent rents, rental income is recognized when the contingency is resolved.
| 2.23. | Earnings per share |
Basic loss per share is calculated by dividing the net loss for the period attributable to equity holders of the parent by the weighted average number of common shares outstanding during the year. Diluted net loss per share is computed by dividing the net loss for the period by the weighted average number of common shares outstanding, and when dilutive, adjusted for the effect of all potentially dilutive shares, including share options, on an as-if converted basis. For all periods presented, there were no differences in the weighted-average number of common shares used for basic and diluted net loss per share as the effect of all potentially dilutive shares outstanding was anti-dilutive. For all periods presented, the weighted-average number of common shares was restated to give effect to the consolidation of the common shares of the Group on the basis of a ratio of one post-consolidation common share for every six pre-consolidation common shares (see Note 28 for details).
| 2.24. | Dividend distribution |
Cash dividend distribution to the Group’s shareholders is recognized as a liability in the Group’s financial statements in the period in which the dividends are approved.
| 2.25. | Equity-settled share-based payments |
The Group issues equity settled share-based payments to certain directors and executive officers as part of their remuneration package. In addition, the Group issues equity settled share-based payments to selling agents (including directors acting as selling agents) who assisted the Group in connection with its capital raisings through private placements. Equity settled awards are measured at fair value at the date of grant. The Group measures the fair value using the valuation technique that they consider to be the most appropriate to value each class of award. Methods used may include Black-Scholes calculations or other models as appropriate. The valuations take into account factors such as non-transferability, exercise restrictions and behavioral considerations.
For equity settled share-based payments granted to directors and executive officers as part of their remuneration package, an expense is recognized in the income statement to spread the fair value of each award over the vesting period on a straight-line basis, after allowing for an estimate of the awards that will eventually vest. Certain awards granted to directors vest immediately upon granting.
The estimate of the level of vesting is reviewed at least annually, with any impact on the cumulative charge being recognized immediately. For equity settled share-based payments granted to selling agents (including directors acting as selling agents), the charge is deducted from equity as part of the transaction costs directly attributable to the capital issuance.
When the options are exercised, the Group issues new shares. The proceeds received net of any directly attributable transaction costs are credited to share capital when the options are exercised.
The accompanying notes are an integral part of these consolidated financial statements.
F-27
Table of Contents
Union Agriculture Group Corp.
Notes to the Consolidated Financial Statements (Continued)
(All amounts in US$, except shares and per share data and as otherwise indicated)
| 2.26. | Termination benefits |
Termination benefits are payable when employment is terminated by the Group before the normal retirement date, or whenever an employee accepts voluntary redundancy in exchange for these benefits. The Group recognizes termination benefits when it is demonstrably committed to either: terminating the employment of current employees according to a detailed formal plan without possibility of withdrawal; or providing termination benefits as a result of an offer made to encourage voluntary redundancy. Benefits falling due more than 12 months after the statement of financial position date are discounted to their present value.
| 3. | Explanation of transition to IFRS |
| 3.1 | Application of IFRS 1 |
The Group prepared its consolidated financial statements under IFRS for the first time for its financial year ended June 30, 2010, which included comparative financial information for the year ended June 30, 2009 and for the period from January 2, 2008 (date of inception) through June 30, 2008. The opening IFRS statement of financial position was prepared as of January 2, 2008 (date of transition to IFRS in accordance with IFRS 1 Revised “First Time Adoption of IFRS”). The Company adopted IFRS as issued by the IASB. Prior to the adoption of IFRS, the Group prepared its consolidated financial statements in compliance with some, but not all IFRS (“previous GAAP”).
The application of IFRS 1 R required that the Group adopted accounting policies based on the standards and related interpretations effective at the reporting date of its first annual IFRS financial statements. These accounting policies were applied as of the date of transition to IFRS and throughout all periods presented in the first IFRS financial statements. In preparing these financial statements in accordance with IFRS 1 R, all mandatory exceptions and optional exemptions from retrospective application were not applicable for the Group on transition to IFRS as that is the date of the inception of the Group.
| 3.2 | Reconciliations between IFRS and previous GAAP |
The following reconciliations provide a quantification of the effect of the transition to IFRS. The first reconciliation provides an overview of the impact on equity of the transition at January 2, 2008 and June 30, 2010 (Note 3.2.1). The following four reconciliations provide details of the impact of the transition on:
| • | shareholders’ equity at January 2, 2008 (Note 3.2.2) |
| • | shareholders’ equity at June 30, 2010 (Note 3.2.3) |
| • | total comprehensive loss for the year ended June 30, 2010 (Note 3.2.4) |
| • | cash flows for the year ended June 30, 2010 (Note 3.2.5) |
The accompanying notes are an integral part of these consolidated financial statements.
F-28
Table of Contents
Union Agriculture Group Corp.
Notes to the Consolidated Financial Statements (Continued)
(All amounts in US$, except shares and per share data and as otherwise indicated)
| 3.2 | Reconciliations between IFRS and previous GAAP (continued) |
| 3.2.1. | Summary of equity |
| January 2, 2008 | June 30, 2010 | |||||||
Total shareholders’ equity under previous GAAP | 50,000 | 196,940,155 | ||||||
Adjustment due to application of IFRS 3 R for business combinations (i) | — | (97,703 | ) | |||||
Derecognition of deferred income tax assets (ii) | — | (3,440,286 | ) | |||||
Effect of deferred income tax on equity-settled compensation (iii) | — | 70,188 | ||||||
Total shareholders’ equity under IFRS | 50,000 | 193,472,354 | ||||||
| (i) | Under previous GAAP, the Group accounted for business combinations using the purchase method of accounting. The excess of consideration over the fair value of the Group’s share of the identifiable net assets acquired was recorded as goodwill. However, certain assets had not been fair valued under previous GAAP on materiality grounds. Under IFRS, all of the assets were fair valued resulting in a reduction to goodwill of US$ 97,703 (See Note 3.2.3 (d)). |
| (ii) | Under previous GAAP, the Group considered the ultimate realization of deferred tax assets to be more likely than not based on current projections and their maximum legal expiration periods. As such, the Group recognized these amounts as non-current deferred income tax assets in the statement of financial position. IFRS establishes more specific and strict procedures to assess whether a deferred tax asset should be recognized. All available evidence, both positive and negative, is considered to determine whether, based on the weight of that evidence, a deferred tax asset should be recognized. Judgment must be used in considering the relative impact of negative and positive evidence. The weight given to the potential effect of negative and positive evidence should be commensurate with the extent to which it can be objectively verified. The more negative evidence that exists (a) the more positive evidence is necessary and (b) the more difficult it is to support a conclusion that a deferred tax asset can be recognized. Although management believes that it will become profitable in the foreseeable future, as a result of the history of recent losses incurred during the development phase of the different Group’s business operations and the lack of verifiable and objective evidence due to the limited operating history of the Group itself, the Board of Directors has determined that there is sufficient uncertainty as to the generation of sufficient income to utilize the losses within a reasonable timeframe, therefore, no deferred tax asset is recognized in relation to these losses. See Note 18 for details. |
| (iii) | Under previous GAAP, stock option compensation was measured using the intrinsic value method. Under IFRS, the Group measured stock option compensation at fair value. This resulted in an effect on deferred income tax on equity-settled compensation adjustments on IFRS of US$70,188. |
| 3.2.2. | Reconciliation of equity at January 2, 2008 |
The transition from previous GAAP to IFRS has had no effect on the shareholders’ equity at January 2, 2008. The reconciling items between the previous GAAP presentation and the IFRS presentation have no net impact on the shareholders’ equity as of that date.
The accompanying notes are an integral part of these consolidated financial statements.
F-29
Table of Contents
Union Agriculture Group Corp.
Notes to the Consolidated Financial Statements (Continued)
(All amounts in US$, except shares and per share data and as otherwise indicated)
| 3.2 | Reconciliations between IFRS and previous GAAP (continued) |
| 3.2.3. | Reconciliation of equity at June 30, 2010 |
| Note | Previous GAAP | Effect of transition to IFRS | IFRS | |||||||||||||
ASSETS | ||||||||||||||||
Non-Current Assets | ||||||||||||||||
Property, plant and equipment, net | (a | ) | 109,947,866 | (105,459,719 | ) | 4,488,147 | ||||||||||
Land underPromesas | (b | ) | — | 100,714,669 | 100,714,669 | |||||||||||
Investment property underPromesas, net | (c | ) | — | 4,663,968 | 4,663,968 | |||||||||||
Intangible assets, net | (d | ) | 477,771 | (72,467 | ) | 405,304 | ||||||||||
Biological assets | (e | ) | 5,822,235 | 55,846 | 5,878,081 | |||||||||||
Deferred income tax assets | (f | ) | 3,120,147 | (2,779,645 | ) | 340,502 | ||||||||||
Total Non-Current Assets | 119,368,019 | (2,877,348 | ) | 116,490,671 | ||||||||||||
Current Assets | ||||||||||||||||
Biological assets | 1,866,466 | — | 1,866,466 | |||||||||||||
Inventories | 1,824,832 | — | 1,824,832 | |||||||||||||
Trade and other receivables, net | 8,329,062 | — | 8,329,062 | |||||||||||||
Financial assets at fair value through profit or loss | 1,190,977 | — | 1,190,977 | |||||||||||||
Cash and cash equivalents | 67,125,638 | — | 67,125,638 | |||||||||||||
Total Current Assets | 80,336,975 | — | 80,336,975 | |||||||||||||
TOTAL ASSETS | 199,704,994 | — | 196,827,646 | |||||||||||||
SHAREHOLDERS EQUITY | ||||||||||||||||
Capital and reserves attributable to equity holders of the parent | ||||||||||||||||
Share capital | (g | ) | 196,642,018 | (3,268,096 | ) | 193,373,922 | ||||||||||
Equity-settled compensation | (h | ) | 2,460,877 | 668,848 | 3,129,725 | |||||||||||
Accumulated deficit | (i | ) | (2,162,740 | ) | (868,553 | ) | (3,031,293 | ) | ||||||||
Equity attributable to equity holders of the parent | 196,940,155 | (3,467,801 | ) | 193,472,354 | ||||||||||||
Non controlling interest | — | — | — | |||||||||||||
TOTAL SHAREHOLDERS EQUITY | 196,940,155 | (3,467,801 | ) | 193,472,354 | ||||||||||||
LIABILITIES | ||||||||||||||||
Non-Current Liabilities | ||||||||||||||||
Finance lease liabilities | (j | ) | — | 2,368 | 2,368 | |||||||||||
Deferred income tax liabilities | (f | ) | — | 590,453 | 590,453 | |||||||||||
Total Non-Current Liabilities | — | 592,821 | 592,821 | |||||||||||||
Current Liabilities | ||||||||||||||||
Trade and other payables | (l | ) | 2,764,839 | (229,791 | ) | 2,535,048 | ||||||||||
Payroll and social security liabilities | (m | ) | — | 222,861 | 222,861 | |||||||||||
Finance lease liabilities | (j | ) | — | 4,562 | 4,562 | |||||||||||
Total Current Liabilities | 2,764,839 | (2,368 | ) | 2,762,471 | ||||||||||||
TOTAL LIABILITIES | 2,764,839 | 590,453 | 3,355,292 | |||||||||||||
TOTAL SHAREHOLDERS EQUITY AND LIABILITIES | 199,704,994 | (2,877,348 | ) | 196,827,646 | ||||||||||||
The accompanying notes are an integral part of these consolidated financial statements.
F-30
Table of Contents
Union Agriculture Group Corp.
Notes to the Consolidated Financial Statements (Continued)
(All amounts in US$, except shares and per share data and as otherwise indicated)
| 3.2 | Reconciliations between IFRS and previous GAAP (continued) |
Explanation of the effect of the transition to IFRS
(a) Property, plant and equipment, net
Under previous GAAP, the Group did not present separately land underPromesas, investment property underPromesasand software costs. Based on the IFRS requirements, land underPromesas,investment property underPromesasand software costs are presented separately from property, plant and equipment in the statement of financial position. Accordingly, the corresponding amounts were reclassified out of property, plant and equipment as described below. In addition, under previous GAAP, the Group included the value of colonies of bees within property, plant and equipment. Under IFRS, these amounts were reclassified to biological assets.
Reclassification to land underPromesas | (100,714,669 | ) | ||
Reclassification to investment property underPromesas | (4,663,968 | ) | ||
Reclassification to intangible assets | (25,236 | ) | ||
Reclassification to biological assets | (55,846 | ) | ||
Decrease in property, plant and equipment | (105,459,719 | ) | ||
(b) Land under Promesas
Reclassification of property, plant and equipment to land underPromesas amounting to US$ 100,714,669 (See Note 3.2.3 (a)).
(c) Investment property under Promesas, net
Reclassification of property, plant and equipment to investment property underPromesas amounting to US$ 4,663,968 (See Note 3.2.3 (a)).
(d) Intangible assets, net
As discussed in Note 3.2.3 (a) above, under previous GAAP an amount of US$ 25,236 was included as property, plant and equipment. Under IFRS, this amount was included as intangible assets. In addition, as further discussed in Note 3.2.1 (i) above, certain adjustments to business combinations resulted in a decrease of US$97,703 to goodwill (See Note 3.2.1 (i)).
Reclassification of property, plant and equipment to intangible assets | 25,236 | |||
Adjustment to goodwill due to the application of IFRS 3 R for business combinations | (97,703 | ) | ||
Decrease in intangible assets | (72,467 | ) | ||
(e) Biological assets
Reclassification of property, plant and equipment to biological assets amounting to US$ 55,846 (See Note 3.2.3 (a)).
The accompanying notes are an integral part of these consolidated financial statements.
F-31
Table of Contents
Union Agriculture Group Corp.
Notes to the Consolidated Financial Statements (Continued)
(All amounts in US$, except shares and per share data and as otherwise indicated)
| 3.2 | Reconciliations between IFRS and previous GAAP (continued) |
(f) Deferred income tax assets
Derecognition of deferred income tax assets (i) | (3,440,286 | ) | ||
Reclassification of deferred income tax liability | 590,453 | |||
Effect of deferred income tax on equity-settled compensation (ii) | 70,188 | |||
Decrease in deferred income tax assets | (2,779,645 | ) | ||
| (i) | See Note 3.2.1 (ii) for details. |
| (ii) | See Note 3.2.1 (iii) for details. |
(g)Share capital
Equity-settled compensation deducted as transaction costs from issuance (i) | (3,003,843 | ) | ||
Reclassification of the result generated from acquisition of non controlling interest (ii) | (70,691 | ) | ||
Impact on exercise of share options due to IFRS 2 adjustments (iii) | (193,562 | ) | ||
Decrease in share capital | (3,268,096 | ) | ||
| (i) | Under previous GAAP, equity-settled compensation issued to selling agents that participated in the Group’s private placements was recognized in the statement of comprehensive income. Under IFRS, share options granted to selling agents were treated as transaction costs directly attributable to capital issuance and deducted from share capital. |
| (ii) | Under previous GAAP, the difference between the consideration paid and the net book value of the non controlling interest acquired was recognized in the statement of comprehensive income. Under IFRS, such difference was recognized in equity under share capital. |
| (iii) | Under previous GAAP, the Group valued the stock options under the intrinsic value method. Under IFRS, the Group valued such options under the fair value method. This adjustment represents the impact of the application of the fair value method on exercised stock options during the period. |
(h) Equity-settled compensation
Under previous GAAP, the Group valued the stock options using the intrinsic value method. Under IFRS, the Group valued the stock options under the fair value method as prescribed by IFRS 2 (See Note 15 for details).
(i) Accumulated deficit
Other than reclassifications, the cumulative effect of all the adjustments described has resulted in an increase in accumulated deficit of US$ 868,553 at June 30, 2010.
(j) Finance lease liabilities
Reclassification of other payables to non current and current finance lease liabilities for a total amount of US$ 2,368 and US$ 4,562, respectively.
The accompanying notes are an integral part of these consolidated financial statements.
F-32
Table of Contents
Union Agriculture Group Corp.
Notes to the Consolidated Financial Statements (Continued)
(All amounts in US$, except shares and per share data and as otherwise indicated)
| 3.2 | Reconciliations between IFRS and previous GAAP (continued) |
(k) Trade and other payables
Reclassification of other payables to non current finance lease liabilities | (2,368 | ) | ||
Reclassification of other payables to current finance lease liabilities | (4,562 | ) | ||
Reclassification of other payables to payroll and social security liabilities | (222,861 | ) | ||
Decrease in trade and other payables | (229,791 | ) | ||
(l) Payroll and social security liabilities
Reclassification of other payables to payroll and social security liabilities for a total amount of US$ 222,861.
| 3.2.4. | Reconciliation of total comprehensive loss for the year ended June 30, 2010 |
| Note | Previous GAAP | Effect of transition to IFRS | IFRS | |||||||||||||
Sales of agricultural produce and biological assets and services rendered | (a | ) | 1,635,013 | (54,133 | ) | 1,580,880 | ||||||||||
Rental income | (a | ) | — | 54,133 | 54,133 | |||||||||||
Cost of agricultural produce and biological assets sold and services rendered | (1,573,883 | ) | — | (1,573,883 | ) | |||||||||||
Initial recognition and changes in fair value of biological assets and agricultural produce | (b | ) | 4,720,370 | 615,438 | 5,335,808 | |||||||||||
Cost of production | (b | ) | (2,822,294 | ) | (615,438 | ) | (3,437,732 | ) | ||||||||
Margin Before Operating Expenses | 1,959,206 | — | 1,959,206 | |||||||||||||
General and administrative expenses | (c | ) | (3,989,076 | ) | 406,871 | (3,582,205 | ) | |||||||||
Selling expenses | (24,613 | ) | — | (24,613 | ) | |||||||||||
Other operating income, net | (d | ) | 178,495 | (178,495 | ) | — | ||||||||||
Loss from Operations Before Financing and Taxation | (1,875,988 | ) | 228,376 | (1,647,612 | ) | |||||||||||
Finance income | (d | ) | 1,192,842 | 178,495 | 1,371,337 | |||||||||||
Finance costs | (e | ) | (2,456,886 | ) | 2,456,366 | (520 | ) | |||||||||
Financial results, net | (1,264,044 | ) | 2,634,861 | 1,370,817 | ||||||||||||
Loss Before Income Tax | (3,140,032 | ) | 2,863,237 | (276,795 | ) | |||||||||||
Income tax expense | (f | ) | 2,727,745 | (2,809,388 | ) | (81,643 | ) | |||||||||
Loss for the Year/ Period | (412,287 | ) | 53,849 | (358,438 | ) | |||||||||||
Total Comprehensive Loss for the Year/ Period | (412,287 | ) | 53,849 | (358,438 | ) | |||||||||||
Loss / Total Comprehensive Loss Attributable to: | ||||||||||||||||
Equity holders of the parent | (g | ) | — | (336,833 | ) | (336,833 | ) | |||||||||
Non controlling interest | (g | ) | — | (21,605 | ) | (21,605 | ) | |||||||||
The accompanying notes are an integral part of these consolidated financial statements.
F-33
Table of Contents
Union Agriculture Group Corp.
Notes to the Consolidated Financial Statements (Continued)
(All amounts in US$, except shares and per share data and as otherwise indicated)
| 3.2 | Reconciliations between IFRS and previous GAAP (continued) |
Explanation of the effect of the transition to IFRS
(a) Under previous GAAP, the Group recognized rental income within sales of agricultural produce and biological assets and services rendered. On transition to IFRS, these results are disclosed in a separate line in the statement of comprehensive income.
(b) Under previous GAAP, the Group elected to capitalize subsequent expenditures related to biological assets such as planting, harvesting, seedlings and others. On transition to IFRS, based on the fact that IAS 41 is silent on the subject, the Group elected to expense all such costs when incurred and included them in cost of production in the statement of comprehensive income. Accordingly, an amount of US$ 615,438 was reclassified from “Initial recognition and changes in fair value of biological assets and agricultural produce” to “Cost of production”.
(c) General and administrative expenses was impacted by:
Reclassification of the result generated from acquisition of non controlling interest to share capital (i) | 70,691 | |||
Adjustment to share options due to the application of IFRS 2 (ii) | 336,180 | |||
Decrease in general and administrative expenses | 406,871 | |||
| (i) | See Note 3.2.3 (g) (ii). |
| (ii) | Under previous GAAP, the Group valued the stock options using the intrinsic value method. Under IFRS, the Group valued the stock options under the fair value method as prescribed by IFRS 2 (See Note 15 for details). Accordingly, under IFRS, the impact on the application of the fair value method was a decrease to general and administrative expenses of US$ 336,180. |
(d) Under previous GAAP, the Group recognized the results generated from financial assets at fair value through profit or loss within other operating income, net. On transition to IFRS, the Group adopted the accounting policy of including these results within financial results. Accordingly, an amount of US$ 178, 495 was reclassified to finance income.
(e) Finance costs was impacted by the reclassification to share capital of equity-settled compensation granted to selling agents that participated in the Group’s private placements amounting to US$ 2,456,366.
(f) Income tax expense was impacted by deferred tax adjustments on the adjustments necessary to transition to IFRS.
(g) Disclosure of loss/ total comprehensive loss attributable to equity holders of the parent and to non controlling interest for an amount of US$ 336,833 and US$ 21,605, respectively.
The accompanying notes are an integral part of these consolidated financial statements.
F-34
Table of Contents
Union Agriculture Group Corp.
Notes to the Consolidated Financial Statements (Continued)
(All amounts in US$, except shares and per share data and as otherwise indicated)
| 3.2 | Reconciliations between IFRS and previous GAAP (continued) |
| 3.2.5. | Reconciliation of cash flows for the year ended June 30, 2010 |
Based on the IAS 7 requirements, the Group has made various reclassifications between operating, investing and financing activities in the cash flow statements presented under previous GAAP and the cash flows statements under IFRS as further detailed below:
(a) Operating activities
Cash used in operating activities under previous GAAP | (14,781,516 | ) | ||
Reclassification of purchases of biological assets to operating activities | (14,652 | ) | ||
Reclassification of interest received to investing activities | (627,503 | ) | ||
Reclassification of proceeds received from loans granted to investing activities | (2,404,098 | ) | ||
Reclassification of loans granted to investing activities | 4,129,100 | |||
Reclassification of acquisition of non controlling interest to financing activities | 49,086 | |||
Reclassification of payments for financial leases to financing activities | 5,062 | |||
Foreign exchange gains on cash and cash equivalents | (36,312 | ) | ||
Cash used in operating activities under IFRS | (13,680,833 | ) | ||
(b) Investing activities
Cash used in investing activities under previous GAAP | (96,988,985 | ) | ||
Reclassification of purchases of biological assets to operating activities | 14,652 | |||
Reclassification of interest received to investing activities | 627,503 | |||
Reclassification of proceeds received from loans granted to investing activities | 2,404,098 | |||
Reclassification of loans granted to investing activities | (4,129,100 | ) | ||
Reclassification of proceeds from investments in debt certificates to investing activities (considered cash equivalents under previous GAAP) | 1,912,498 | |||
Reclassification of acquisition of non controlling interest to financing activities | 42,234 | |||
Cash used in investing activities under IFRS | (96,117,100 | ) | ||
(c) Financing activities
Cash generated from financing activities under previous GAAP | 109,969,062 | |||
Reclassification of acquisition of non controlling interest to financing activities | (42,234 | ) | ||
Reclassification of acquisition of non controlling interest to financing activities | (49,086 | ) | ||
Reclassification of payments for financial leases to financing activities | (5,062 | ) | ||
Cash generated from financing activities under IFRS | 109,872,680 | |||
(d) Net (decrease)/increase in cash and cash equivalents
Net decrease in cash and cash equivalents under previous GAAP | (1,801,439 | ) | ||
Reclassification of proceeds from investments in debt certificates to investing activities (considered cash equivalents under previous GAAP) | 1,912,498 | |||
Foreign exchange gains on cash and cash equivalents | (36,312 | ) | ||
Net increase in cash and cash equivalents under IFRS | 74,747 | |||
The accompanying notes are an integral part of these consolidated financial statements.
F-35
Table of Contents
Union Agriculture Group Corp.
Notes to the Consolidated Financial Statements (Continued)
(All amounts in US$, except shares and per share data and as otherwise indicated)
| 4. | Financial risk management |
Risk management principles and processes
The Group’s activities are exposed to a variety of financial risks in the normal course of the Group’s business. The Group’s overall risk management program focuses on the unpredictability of financial markets and seeks to minimize the Group’s capital costs by using suitable means of financing and to manage and control the Group’s financial risks effectively. The Group may use financial instruments to hedge certain risk exposures when deemed appropriate based on its internal management risk policies. The Group has not entered in any hedging financial instrument since inception through June 30, 2010.
The Group’s approach to the identification, assessment and mitigation of risk is carried out by the Board of Directors, which focuses on timely and appropriate management of risk. The Board of Directors has overall accountability for the identification and management of risk across the Group. The Board maintains a formal set of delegated authorities (including policies for credit and treasury) that clearly define the responsibilities delegated to management and those retained by the Board. The Board approves these delegated authorities and reviews them annually.
The principal financial risks arising from financial instruments are agricultural activities price risk, equity securities price risk, currency risk, liquidity risk and credit risk. The Group does not have and has not had any significant exposure to interest rate risk since inception and through June 30, 2010. This section provides a description of the principal risks and uncertainties that could have a material adverse effect on the Group’s strategy, performance, results of operations and financial condition. The principal risks and uncertainties facing the business, set out below, do not appear in any particular order of potential materiality or probability of occurrence.
| • | Currency risk |
The Group’s statement of cash flows, statement of comprehensive income and statement of financial position are presented in US dollars and may be affected by fluctuations in exchange rates. Currency risks as defined by IFRS 7 arise on account of monetary assets and liabilities being denominated in a currency that is not the functional currency.
Forecasted commercial transactions and recognized assets and liabilities are substantially denominated in the Group’s functional currency. Transactions denominated in currencies other than the functional currency were limited to Uruguayan Pesos and to a lesser extent foreign currencies such as Canadian Dollars and Euros. Therefore, the Group is not significantly exposed to currency risk. The Group’s net financial position exposure to the US Dollar is managed on a case-by-case basis. To date, the Group has not entered into any foreign exchange derivative contracts or other financial instruments to hedge currency risk.
The accompanying notes are an integral part of these consolidated financial statements.
F-36
Table of Contents
Union Agriculture Group Corp.
Notes to the Consolidated Financial Statements (Continued)
(All amounts in US$, except shares and per share data and as otherwise indicated)
| 4. | Financial risk management (continued) |
The following tables detail the Group’s exposure at the statement of financial position date to currency risk arising from recognized assets or liabilities denominated in a currency other than the functional currency of the Group. For presentation purposes, the amounts are shown in US Dollars, translated using the spot rate at the year-end.
| US Dollar | ||||||||||||
Net monetary position Asset / (Liability) | June 30, 2010 | June 30, 2009 | June 30, 2008 | |||||||||
Uruguayan Peso | 2,612,845 | 1,854,320 | (6,355 | ) | ||||||||
Euros | 22,955 | — | — | |||||||||
Canadian dollar | 415,654 | 4,356,552 | — | |||||||||
Total | 3,051,454 | 6,210,872 | (6,355 | ) | ||||||||
Therefore, the Group’s analysis is carried out based on the exposure of each foreign currency against the US dollar. The Group estimates that, other factors being constant, a 10% devaluation (revaluation) of the respective foreign currencies against the US dollar at year-end would (increase) or decreaseLoss Before Income Tax for the years ended June 30, 2010 and 2009 and for the period from inception through June 30, 2008, as described in the table below:
| US Dollar | ||||||||||||
Net monetary position | June 30, 2010 | June 30, 2009 | June 30, 2008 | |||||||||
Uruguayan Peso | (261,284 | ) | (185,432 | ) | 636 | |||||||
Euros | (2,296 | ) | — | — | ||||||||
Canadian dollar | (41,565 | ) | (435,655 | ) | — | |||||||
(Increase) or decrease in Loss Before Income tax | (305,145 | ) | (621,087 | ) | 636 | |||||||
| �� | ||||||||||||
As of January 2, 2008, the Group did not recognized assets or liabilities denominated in a currency other than the functional currency of the Group
| • | Agricultural activities price risk |
Inflation in raw materials costs and in the costs of goods and services from industry suppliers and manufacturers presents risks to project economics. A portion of the Group’s cost structure includes the cost of raw materials primarily seeds, fertilizers and agrochemicals, among others. Prices for these raw materials may vary significantly.
The Group estimates that, for the years ended June 30, 2010 and 2009 and for the period from inception through June 30, 2008, other factors being constant, a 5% increase or decrease in prices of raw materials would increase or decreaseLoss Before Income Tax by approximately US$ 49,920, US$ 13,593 and US$ 339, respectively.
Crops, rice, beef and milk prices have shown and are expected to continue to show considerable volatility as supply and demand globally and in Uruguay fluctuate in response to financial, climate, sentiment and other
The accompanying notes are an integral part of these consolidated financial statements.
F-37
Table of Contents
Union Agriculture Group Corp.
Notes to the Consolidated Financial Statements (Continued)
(All amounts in US$, except shares and per share data and as otherwise indicated)
| 4. | Financial risk management (continued) |
factors. As a result, movements in market prices would have a significant impact on the Group’s earnings. The Group’s objective is to achieve steady state production at levels that will ensure a relatively low cost base and this is expected to protect the Group’s profitability. Sales activities have been limited to date and concentrated on the cattle, sheep and rice segments. The Group did not sell any crops or milk during the year ended June 30, 2010. The Group has established strategies with the intent of minimizing market price risk, such as selling rice immediately after harvest. For the foreseeable future, the commercial team may combine different actions such as selling crops pre and post harvest periods and hedging if economically viable and feasible. Although efforts are made to implement strategies, there can be no assurance that the Group will be fully shielded from downsides in market prices.
The Group sells its entire rice production to S.A. Molinos Arroceros Nacionales, or SAMAN, the leading rice producer and exporter in Uruguay under an agreement negotiated on an annual basis. Under the agreement, the Group sells the entire rice production to SAMAN at stipulated prices reflecting a negotiated price between the local associations of rice growers and rice manufacturing industry considering the international price of rice with the United States market as a primary reference. Although there are other buyers in the Uruguayan market, the Group believes selling to SAMAN at this stage represents the more sensible alternative based on price, quantity, quality and collection of receivables.
Cattle products are currently sold primarily to Frigorífico Tacuarembó, a slaughter company in Uruguay, an affiliate of the Marfrig Group of Brazil. The Group has an agreement with Frigorífico Tacuarembó to buy products at prices based on referenced prices provided by Instituto Nacional de Carnes or INAC (which controls and regulates the prices and export of cattle and beef products and dictates pricing for meat processing plants in Uruguay).
Wool products, although less significant, are currently being sold to Central Lanera Uruguaya, or CLU. The Group has an agreement with CLU to sell all the wool production. The Group receives average market prices depending on the category of wool sold.
The Group will initiate its milk production in the fiscal year ended June 30, 2011. The Group expects to sell its entire milk production to CONAPROLE, a dairy exporter in Uruguay. As milk is a perishable product there is no ability for the Group to mitigate pricing risk through inventory management. However, dairy prices have historically tended to have reasonable correlation with prices of agricultural inputs such as feed and fertilizer, and the Group will monitor these relationships in order to adapt its tactics to suit.
The Group estimates that, for the years ended June 30, 2010 and 2009 and for the period from inception through June 30, 2008, other factors being constant, and a 10% increase or decrease in prices of the Group’s products would decrease or increaseLoss Before Income Tax by approximately US$ 475,692, US$ 24,798 and US$ 586, respectively.
| • | Equity securities price risk |
As of June 30, 2010, the Group invested certain excess cash in shares of New Zealand Farming System Uruguay Ltd., a New Zealand based company with dairy farm operations in Uruguay. As such, the Group was exposed to equity securities price risk related to this investment only. The Group sold the investment in October
The accompanying notes are an integral part of these consolidated financial statements.
F-38
Table of Contents
Union Agriculture Group Corp.
Notes to the Consolidated Financial Statements (Continued)
(All amounts in US$, except shares and per share data and as otherwise indicated)
| 4. | Financial risk management (continued) |
2010. Currently, the Group’s investment policy is very limited; however, it may purchase investments in the future depending on its actual cash requirements. The Group’s policy is to maximize returns while limit counterparty risk exposure. To date, the Group has not entered into any derivative contract or financial instrument to hedge this risk.
| • | Liquidity risk |
The Group is exposed to liquidity risk, including the risk that financial assets cannot readily be converted to cash without loss of value. Failure to manage financing risks could have a material impact on the Group’s cash flow and statement of financial position.
The Group’s policy is to regularly monitor current and expected liquidity requirements to ensure that it maintains sufficient reserves of cash to meet its liquidity requirements in the short and longer term. To date, the Group does not maintain borrowings with external third parties, and has been financed principally through capital contributions from existing and new shareholders.
The table below analyses the Group’s non-derivative financial liabilities into relevant maturity groupings based on the remaining period at the statement of financial position date to the contractual maturity date. The amounts disclosed in the table are the contractual undiscounted cash flows (except for short-term payables when discounting is not applied) of non-derivative financial liabilities only, and as a result, they do not reconcile to the amounts disclosed on the statement of financial position.
| At 30 June 2010 | Less than 1 year | Between 1 and 2 years | Total | |||||||||
Trade and other payables | 690,342 | — | 690,342 | |||||||||
Finance leases | 4,916 | 2,649 | 7,565 | |||||||||
Total | 695,258 | 2,649 | 697,907 | |||||||||
| At 30 June 2009 | Less than 1 year | Between 1 and 2 years | Between 2 and 3 years | Total | ||||||||||||
Trade and other payables | 1,467,416 | — | — | 1,467,416 | ||||||||||||
Finance leases | 4,371 | 6,343 | 3,172 | 13,886 | ||||||||||||
Total | 1,471,787 | 6,343 | 3,172 | 1,481,302 | ||||||||||||
| At 30 June 2008 | Less than 1 year | Total | ||||||
Trade and other payables | 122,224 | 122,224 | ||||||
Total | 122,224 | 122,224 | ||||||
As of January 2, 2008, the Group did not recognize non-derivative financial liabilities.
The accompanying notes are an integral part of these consolidated financial statements.
F-39
Table of Contents
Union Agriculture Group Corp.
Notes to the Consolidated Financial Statements (Continued)
(All amounts in US$, except shares and per share data and as otherwise indicated)
| 4. | Financial risk management (continued) |
| • | Credit risk |
The Group’s exposure to credit risk takes the form of a loss that would be recognized if counterparties failed to, or were unable to, meet their payment obligations. These risks may arise in certain agreements in relation to amounts owed for physical product sales and the investment of surplus cash balances. The Group is also exposed to political and economic risk events, which may cause non-payment of foreign currency obligations to the Group.
The Group is subject to credit risk arising from outstanding receivables, cash and cash equivalents and deposits with banks and financial institutions. The Group’s policy is to manage credit exposure to trading counterparties within defined trading limits. All of the Group’s significant counterparties are assigned internal credit limits. As of June 30, 2010 and 2009, the Group had more than 90% of its deposits of cash and cash equivalents in one Zurich-based bank where the cash proceeds from the private placements was received. This bank has an A external credit rating. As the operations of the Group are increased in the future, it may deposit cash and cash equivalents with more financial institutions of similar quality and rating. The maximum exposure to credit risk is represented by the carrying amount of cash and cash equivalents in the statement of financial position. The Group’s exposure of credit risk arising from trade receivables is set out in Note 13. The Group’s exposure of credit risk arising from cash and cash equivalents is set out in the table below.
The principal assets with credit risk as of June 30, 2010, 2009 and 2008 and January 2, 2008 are as follows:
| Credit rating | June 30, 2010 | June 30, 2009 | June 30, 2008 | January 2, 2008 | ||||||||||||||
Cash at banks | ||||||||||||||||||
Local banks | AA | 202,155 | 28,971 | — | — | |||||||||||||
Foreign banks | A | 66,906,111 | 66,985,608 | 39,168 | 50,000 | |||||||||||||
Total cash at banks(i) | 67,108,266 | 67,014,579 | 39,168 | 50,000 | ||||||||||||||
Investments in debt certificates | ||||||||||||||||||
Debt certificates in securitization trust | AA | — | 1,912,498 | — | — | |||||||||||||
Total Investments in debt certificates | — | 1,912,498 | — | — | ||||||||||||||
Trade and other receivables | ||||||||||||||||||
Loans | AA | 2,579,927 | 818,291 | — | — | |||||||||||||
| 2,579,927 | 818,291 | — | — | |||||||||||||||
| (i) | Does not include cash on hand amounting to US$ 17,372 as of June 30, 2010 (June 30, 2009: nil; June 30, 2008: US$ 3,980; January 2, 2008: nil). |
The Company has a very limited operating history to date. The most significant sales were related to cattle and rice products, and to a lesser extent other produce and services. Sales were significantly concentrated in all periods presented. Sales of rice began in fiscal year 2010 and were concentrated in only one customer. More than 78% of the Group’s cattle sales were concentrated with one external customer for the year ended June 30, 2010. Sales of sheep were concentrated in only one customer for all the periods presented. Other sales and services were not material for all the periods presented. Although all of this represents a concentration of credit risk, the
The accompanying notes are an integral part of these consolidated financial statements.
F-40
Table of Contents
Union Agriculture Group Corp.
Notes to the Consolidated Financial Statements (Continued)
(All amounts in US$, except shares and per share data and as otherwise indicated)
| 4. | Financial risk management (continued) |
Board views the risk as mitigated due to counterparty’s size and historic reliability of payments. See “Agricultural activities price risk” for additional details.
No credit limits were exceeded during the reporting periods and management does not expect any losses from non-performance by these counterparties. If any of the Group’s customers are independently rated, these ratings are used. Otherwise, if there is no independent rating, the Group assesses the credit quality of the customer taking into account its financial position, past experience and other factors. The Group may seek cash collateral, letter of credit or parent company guarantees, as considered appropriate. Sales to customers are primarily made by credit with customary payment terms. The maximum exposure to credit risk is represented by the carrying amount of each financial asset in the statement of financial position after deducting any impairment allowance. The Group’s exposure of credit risk arising from trade receivables is set out in Note 13.
| • | Capital risk management |
The Group’s objectives when managing capital are to safeguard the Group’s ability to continue as a going concern in order to provide returns for shareholders and to maintain an optimal capital structure to reduce the cost of capital. In order to maintain or adjust the capital structure, the Group may adjust the amount of dividends paid to shareholders, return capital to shareholders, issue new shares or sell assets.
The Group analyzes its capital structure using the gearing ratio. The gearing ratio is calculated as total financial debt divided by total equity as shown on the statement of financial position. The Group has been mostly dependant on equity financing. Financial debt form a very insignificant portion of the Group’s total financing for all the years presented (US$ 6,930 and US$ 11,949 relating to finance lease liabilities only). Thus, the Group is a very low-geared company. The Group has maintained a constant almost nil gearing ratio since inception through June 30, 2010 showing that the Group has heavily relied on equity capital as a source of finance.
| • | Other non-financial risks: nature risk |
The Group’s revenue depends significantly on the ability to manage biological assets and agricultural produce. The ability to manage biological assets and agricultural produce may be affected by unfavorable local weather conditions and natural disasters. Weather conditions such as floods, droughts and windstorms and natural disasters such as fire, disease, insect infestation and pests are examples of such events. The occurrence of severe weather conditions or natural disasters may affect the growth of our biological assets, which in turn may have a material adverse effect on the Group’s ability to harvest agricultural produce in sufficient quantities and in a timely manner.
| 5. | Critical accounting policies, estimates and judgments |
Critical accounting policies are those that are most important to the portrayal of the Group’s financial condition, results of operations and cash flows, and require management to make difficult, subjective or complex judgments and estimates about matters that are inherently uncertain. Management bases its estimates on historical experience and other assumptions that it believes are reasonable. The Group’s critical accounting policies are discussed below. Actual results could differ from estimates used in employing the critical accounting policies and these could have a material impact on the Group’s results of operations.
The accompanying notes are an integral part of these consolidated financial statements.
F-41
Table of Contents
Union Agriculture Group Corp.
Notes to the Consolidated Financial Statements (Continued)
(All amounts in US$, except shares and per share data and as otherwise indicated)
| 5. | Critical accounting policies, estimates and judgments (continued) |
(a) Land under Promesas
General Provisions of law in effect through June 30, 2011:
Generally, real estate transactions in Uruguay begin with the execution of a preliminary agreement with respect to the real estate, or a “Boleto de Reserva”, by which the seller “books” or “reserves” the real estate property to the buyer. The main intention of theBoleto de Reserva is to obtain, prior to definitive purchase; all required documentation before the National Registries in order to duly confirm that the real estate to be transferred has no liens and has all of the required documentation. Once all of the documentation has been obtained, it is common business practice in the real estate market in Uruguay that the parties execute a purchase promise, or “Promesa de Compraventa” (hereinafter referred to as the “Promesa”) for the real estate.
ThePromesais a contract regulated by Uruguayan Law No. 8,733. Under such law, aPromesais a definitive contract and not a preliminary agreement. In order to be enforceable against third parties, thePromesais usually registered before the public registry (Registro de la Propiedad Inmobiliaria). Under Law 8,733, thePromesa provides the buyer with certain rights such as the right to access and use the property, and sell, lease, assign or pledge the rights under thePromesa.APromesais completed, and legal title is transferred, when a final purchase agreement, orescritura, is executed. The holder of aPromesa has the ability to sell his rights in thePromesa,which would allow the buyer of suchPromesa the right to seek legal title to the land. Based on the opinion of the Group’s legal counsel, any company regardless of its legal structure can enter into aPromesaunder Law No. 8,733.
In 2006, the Uruguayan government enacted Law No. 18,092 (as amended by Article 349 of Law No. 18,172). Generally, Law No. 18,092 prohibits persons other than individuals and companies having registered shares held by individuals to (1) be owners of farmland and/or (2) to use farmland in Uruguay. The consequence of non-compliance with Law No. 18,092 was that the non-complying company would be deemed automatically dissolved and its assets distributed to its shareholders. Under Law No. 18,092, companies that had bearer shares or whose shares were not owned by natural persons (“Non-Compliant Companies”) were provided a period of two years from enactment of Law No. 18,092 to modify their capital structure to comply with such law (the “Compliance Period”). During the Compliance Period, Non-Compliant Companies were permitted to continue using farmland. Subsequent to the enactment of Law No, 18,092, the Uruguayan government extended the Compliance Period for successive one-year periods through June 30, 2011. Consequently, Non-Compliant Companies were permitted to continue using farmland until that date.
In 2007 and 2008 the Executive Power of Uruguay issued Decrees Nos. 225/07 and 201/08 providing certain exceptions to Law No. 18,092 for Non-Compliant Companies. These exceptions are the following:
| (i) | An exception based on the specific features of a legal entity, including domestic or foreign corporations whose shares are traded in well-known local or foreign stock exchange markets, domestic or foreign pension funds (the “Public Company Exception”), and |
| (ii) | An exception granted to legal entities (including corporations, branches of foreign companies, trusts, investment funds) with bearer or registered shares not covered by (i) above, including legal entities that develop activities which constitute part of a project considered as a priority for the productive development of Uruguay (the “Productive Project Exception”). |
The accompanying notes are an integral part of these consolidated financial statements.
F-42
Table of Contents
Union Agriculture Group Corp.
Notes to the Consolidated Financial Statements (Continued)
(All amounts in US$, except shares and per share data and as otherwise indicated)
| 5. | Critical accounting policies, estimates and judgments (continued) |
Appications for the Productive Project Exception are reviewed by theComisión de Aplicación de la Ley de Tierras (or the “Land Law Commission”) based on business plans furnished by the requesting company. In order for a project to qualify for the Productive Project Exception, the Land Law Commission considers factors such as creation of new employment opportunities within the rural sector; development of small family enterprises; eradication of poverty in rural sectors; incorporation of technology; promotion of territorial decentralization; and development of new productive circuits. The review of an application by the Land Law Commission generally takes 12 to 16 months for final determination. However, Decrees Nos. 225/07 and 201/08 also provide for an expedited proceeding for authorization to own and/or use farmland for companies that have already obtained an exception to own and/or use farmland. In such cases, authorization to own and/or use additional land shall be automatically granted within 30 business days after an application for government authorization has been properly submitted, unless the Executive Power denies the application prior to such time (the “Expedited Process”). If the Executive Power denies the application under the Expedited Process, processing will continue in accordance with the standard authorization procedures as described above.
General Provisions of law in effect subsequent to June 30, 2011:
The Compliance Period was not extended beyond June 30, 2011. However, in contemplation of the expiration of the Compliance Period, on June 23, 2011, the Executive Power issued Decree No. 218/11, which provided that Non-Compliant Companies that properly submitted an application on or prior to June 30, 2011 are permitted to continue using farmland subject to such applications pending final determination of such applications. However, Decree No. 218/11 does not itself grant automatic authorization.
The Group’s situation as of the date of approval of the financial statements:
The common stock of the Group’s subsidiaries is currently represented by bearer shares not held by individuals as mandated by Law No. 18,092. Therefore, as of the date of these financial statements, the subsidiaries of the Group are Non-Compliant Companies under by Law No. 18,092.
The subsidiaries of the Group have executedPromesas as fully permitted by Law No. 8,733. As described above, by execution of thePromesas, these subsidiaries have acquired certain rights to, but not legal title to the land. Therefore, the subsidiaries of the Group are not legal owners of the land. Based on the opinion of the Group´s legal counsel, these subsidiaries of the Group are therefore not currently violating Law No. 18,092 with respect to the ownership of the land. In order to maintain their current legal structure and be therefore able to own the land, these subsidiaries have requested authorization to own the land under the Productive Project Exceptions as further described below.
Furthermore, most of the subsidiaries of the Group that hold land underPromesas are not using the land themselves. Instead, until June 22, 2011, the land underlying suchPromesas was being used by UAG S.A., another wholly owned subsidiary of the Group, pursuant to intercompany agreements under Uruguayan law known as “Comodatos”, between each of the subsidiaries holding land underPromesas and UAG S.A. TheComodatos are inter-company contracts pursuant to which each of the subsidiaries of the Group that holds land underPromesas has transferred the right to use the land underlying suchPromesas to UAG S.A., another wholly-owned subsidiary of the Group. AComodato allows the promissory buyer of land under aPromesa (the “transferor”) to transfer the right to use such land to another person (the “transferee”) so that the transferee may use such land. Under Uruguayan law, neither the transfer of such land by the transferor to the transferee, nor the use of such land by the transferee, is considered to be use of the land by the transferor, even where the
The accompanying notes are an integral part of these consolidated financial statements.
F-43
Table of Contents
Union Agriculture Group Corp.
Notes to the Consolidated Financial Statements (Continued)
(All amounts in US$, except shares and per share data and as otherwise indicated)
| 5. | Critical accounting policies, estimates and judgments (continued) |
two parties are affiliated. The Group decided to transfer the right to use the land to UAG S.A. throughComodatos in order to obtain benefits from centralized management of most of its businesses in one company.
Four subsidiaries of the Group (Boisy S.A., Vadolmar S.A., Madalux S.A. and Nogatir S.A.) applied for and received the Productive Project Exception to own and use 188 hectares in December 2009 or the “First Productive Project”. These four subsidiaries executedescriturasand own the 188 hectares of land.
In October 2009, Rafilur S.A., Aguacare S.A. and Canteras Doradas S.A. applied for government authorization based on the Productive Project Exception to own 17,846 hectares of land or the “Second Productive Project”. Additionally, under the Second Productive Project, UAG S.A. applied for government authorization to use those 17,846 hectares of land. Such subsidiaries received the authorization to own and use such 17,846 hectares of land under the Second Productive Project exception in May 2011. These subsidiaries expect to execute the deeds of title in due course. See Note 28 for details.
In March 2011, Alto Lucero S.A., Rafilur S.A. and Madalux S.A. applied for government authorizations based on the Productive Project Exception to own an aggregate of 51,081 hectares of land underPromesas, or the “Third Productive Project”. On June 27, 2011, the number of hectares under the Third Productive Project was extended to 66,645 hectares. Additionally, under the Third Productive Project, Boisy S.A. applied for government authorizations to use such 66,645 hectares of land since Boisy S.A. had received the right to use such hectares of land pursuant toComodatosas further described below. As of the date of these financial statements, the authorization for the “Third Productive Project” is pending. The Group believes that its business project contributes to the productivity of Uruguay, the creation of jobs, production of exportable commodities, incorporation of technology and other beneficial aspects, which are all factors in the determination of the Third Productive Project Exception. Based on the opinion of legal counsel, and merits of the projects presented and approvals obtained to date, the Group expects that its subsidiaries will obtain the required exception to the Third Productive Project within 12 to 16 months. However, there can be no assurance as to the timing or final outcome of this authorization request. If the subsidiaries receive the authorization for the Third Productive Project, the subsidiaries will proceed with the execution of theescrituras(deed) to obtain legal title on the land.
Furthermore, on June 22, 2011,Comodatosthat transfer the right to use approximately 64,000 hectares of land under the Third Productive Project to UAG S.A. were terminated, and newComodatoswere entered into between each of the subsidiaries of the Group that holds land underPromesas and Boisy S.A., another wholly owned subsidiary of the Group. The Group entered into these newComodatosas Boisy S.A. had already received authorization to use land in the past and, in accordance with Decrees Nos. 225/07 and 201/08, it would be allowed to apply for the Expedited Process as described above. Therefore, on June 22, 2011, Boisy S.A. applied for government authorization to use approximately 64,000 hectares of land, which were also included under the Third Productive Project. Boisy S.A. is currently using such land pursuantComodatosas described above. The Group expects to obtain this authorization in 30 business days after its application, although there can be no assurance that the government will not deny the application. In the event the government denies Boisy S.A.’s application under the Expedited Process, processing will continue with the standard authorization under the Third Productive Project as further described above. The Group did not apply for the Expedited Process prior to June 22, 2011 during the Compliance Period as described above, since the Group expected the government would extend the Compliance Period subsequent to June 30, 2011 and thus the Third Productive Project would be authorized in due course.
The accompanying notes are an integral part of these consolidated financial statements.
F-44
Table of Contents
Union Agriculture Group Corp.
Notes to the Consolidated Financial Statements (Continued)
(All amounts in US$, except shares and per share data and as otherwise indicated)
| 5. | Critical accounting policies, estimates and judgments (continued) |
The Group is currently authorized to use all of its land held underPromesas, as the use of all of its land held underPromesas has either been authorized by the Uruguayan government or is subject to applications for authorization and, therefore, use of such land is permitted under Decree No. 218/11.
The Group is in the process of completing an initial public offering of its shares in an international market although timing cannot be predicted with certainty. Upon the completion of the offering, the Group’s common shares will be listed on the New York Stock Exchange, and thereafter the subsidiaries will be able to apply for an authorization to own and use based on the Public Company Exception. This authorization process generally takes approximately 12 to 16 months after the Offering is complete. Once the authorization is obtained, the subsidiaries will proceed with the execution of theescrituras to obtain legal title to the land under the Third Productive Project.
Because of the prohibition on ownership of farmland by Non-Compliant Companies set forth in Law No. 18,092, legal title to the land has not been obtained as of the date of these financial statements. Nevertheless, legal counsel of the Group has opined that thePromesasare legally valid under Law No. 8,733, and as a result of their validity and for the reasons cited below, the Group has recognized the payments for the full price of land underPromesasas assets (under the line item “Land underPromesas” and “Investment Property underPromesas”in the statement of financial position, as applicable.
The Group has recognized payments forPromesas for which title has not been obtained as assets on the statement of financial position because (1) the Group paid a full price for thePromesasand that price can be measured reliably and thePromesas are legally valid under Law No. 8,733; (2) it is probable that the future economic benefits associated with thePromesas will flow to the Group as the Group has the ability to sell its rights in thePromesas and the sales value less costs to sell such rights is in excess of the carrying value of the assets recorded, and because from the date thePromesas were signed, the Group is obtaining benefits from using the land for its agricultural purposes as permitted by Law 8,733, Law 18,092 and related Decrees; (3) thePromesas entitle the Group to certain rights including but not limited to (i) the use of theunderlying land (as permitted by Law 8,733) through June 30, 2011, and after that date, pending determination of the Group’s application for government authorization; (ii) the risks and benefits associated with thePromesas; (iii) the right to sell, assign, transfer, or lease thePromesas to a third party, in the case of a sale for an amount equal to the fair value of the land because a buyer would be expected to seek the deed; and/or (iv) pledge thePromesas; and (4) thePromesas we executed are definitive binding agreements between the Group and a seller and are legally registered per Uruguayan Law and enforceable against third parties. As of the date of these financial statements, the fair value less costs to sell of the land underlying the Promesas exceeds the amounts paid for thePromesas such that there is no indication of impairment of the assets.
Once the authorizations to own and use the land are obtained and the deeds of title orescrituras are executed, the payments reported as land underPromesas will be reclassified to the land category within property, plant and equipment.
Upon completion of the Offering, the Group intends to submit the application for approval under the Public Company Exception described above. The Group would be permitted to apply for such exemption once the Offering is complete. The Group expects the process to obtain the Public Company Exception to take approximately 12 to 16 months after the application. In addition, as further described above, the Group is able to sell and/or transfer thePromesas at any point in time to a third purchaser who will seek execution of the deed of title.
The accompanying notes are an integral part of these consolidated financial statements.
F-45
Table of Contents
Union Agriculture Group Corp.
Notes to the Consolidated Financial Statements (Continued)
(All amounts in US$, except shares and per share data and as otherwise indicated)
| 5. | Critical accounting policies, estimates and judgments (continued) |
(b) Impairment testing
At the date of each statement of financial position, the Group reviews the carrying amounts of its property, plant and equipment, land underPromesas, investment property underPromesasand finite-life intangible assets carried at cost to determine whether there is any indication that those assets have suffered an impairment loss. If any such indication exists, the recoverable amount of the asset is estimated in order to determine the extent, if any, of the impairment loss. Where the asset does not generate cash flows that are independent from other assets, the Group estimates the recoverable amount of the cash-generating unit to which the asset belongs. Each of the individual items within the Group’s property, plant and equipment and land underPromesasdoes not generally generate independent cash flows.
Goodwill on acquisition is initially measured at cost being the excess of the cost of the business combination over the Group’s interest in the net fair value of the identifiable assets, liabilities and contingent liabilities. As of the acquisition date, any goodwill acquired is allocated to the cash-generating unit (‘CGU’) expected to benefit from the business combination.
Following initial recognition, goodwill is measured at cost less any accumulated impairment losses. Goodwill is tested for impairment annually, or more frequently if events or changes in circumstances indicate that the carrying amount may be impaired. The impairment review requires management to undertake certain judgments, including estimating the recoverable value of the CGU to which the goodwill relates, based on either fair value less costs-to-sell or the value-in-use, as appropriate, in order to reach a conclusion on whether it deems the goodwill is impaired or not.
For purposes of the impairment testing, each CGU represents the smallest identifiable group of assets that generate cash inflows that are largely independent of the cash inflows from other assets or group of assets. Farmland may be used for different activities that may generate independent cash flows. When farmland is used for single activities (i.e. crops), it is considered as one CGU. Generally, each separate farmland is treated as a single CGU. Otherwise, when farmlands are used for more than one activity (i.e. crops and cattle), the farmland is further subdivided into two or more CGUs, as appropriate, for purposes of impairment testing.
Based on these criteria, management identified a total amount of 32, 6 and 4 CGUs as of June 30, 2010, 2009 and 2008, respectively.
As of the end of each year ended June 30, the Group tested for impairment all CGUs regardless of which CGU has allocated any goodwill. The Group tested all CGUs based on a fair value less costs to sell model and determined that no impairment was necessary for any of the years presented.
The following table shows the amounts of goodwill and property, plant and equipment items of the two CGUs where goodwill was allocated at the date of acquisition for each of the years ended June 30, 2010, 2009 and 2008:
CGU / Operating segment | June 30, 2010 | June 30, 2009 | June 30, 2008 | |||||||||
Arandanos del Fortin / All other segments | 284,406 | 284,406 | 284,406 | |||||||||
Arandanos del 41 / All other segments | 95,662 | 95,662 | 95,662 | |||||||||
Closing net book amount of goodwill allocated to CGUs (Note 10) | 380,068 | 380,068 | 380,068 | |||||||||
Closing net book amount of land underPromesas, PPE items and other assets | 585,212 | 614,666 | 482,723 | |||||||||
Total assets allocated to 2 CGUs | 965,280 | 994,734 | 862,791 | |||||||||
The accompanying notes are an integral part of these consolidated financial statements.
F-46
Table of Contents
Union Agriculture Group Corp.
Notes to the Consolidated Financial Statements (Continued)
(All amounts in US$, except shares and per share data and as otherwise indicated)
| 5. | Critical accounting policies, estimates and judgments (continued) |
The remaining CGUs without any allocated goodwill are not detailed here for simplicity purposes. Property, plant and equipment, land underPromesas, and finite-life intangible assets allocated to these CGUs, and investment property underPromesas have an aggregated net book value of US$ 109,306,808; US$ 12,574,125 and US$ 755,485 as of June 30, 2010, 2009 and 2008, respectively.
The Group estimates the fair value less costs-to-sell based on the best information available and refers to the amount at which the CGU could be bought or sold in a current transaction between willing parties. In calculating the fair value less costs-to-sell of its CGUs, management may be assisted by the work of external advisors. When using this model, the Group applies the “sales comparison approach” as its method of valuing most properties. This approach is based on the theory that the fair value of a property is directly related to the selling prices of similar properties. The “sales comparison approach” considers current market conditions of the market involved, and is determined based on current recent market transactions within the regions where each farmland is located. This approach assumes that current recent market transactions are performed by willing buyers and sellers in an arm’s length transaction after proper marketing wherein the parties had each acted knowledgeably, prudently, and without compulsion. Furthermore, the “sales comparison approach” does not take into account the need to sell multiple properties, or that any sale may need to be completed on an expedited basis.
The Group with the assistance of external appraisers determines fair values by extensive analysis. Generally, a farmland value is based on the land’s productive capability (its ability to produce crops and/or to maintain livestock) and other factors such as climate, topography and location. A farmland may be rated considering such factors as soil texture and quality, yields, topography, drainage and rain levels. Based on these factors, each farm is assigned different soil classifications for the purposes of establishing a value. Soil classifications quantify the factors that contribute to the agricultural capability of the soil. Soil classifications range from the most productive to the least productive.
The first step to establishing an assessment for a farm is a sales investigation that identifies the valid farm sales in the area where the farm is located.
A price per hectare is assigned for each soil class within each farm. This price per hectare is determined based on the quantitative and qualitative analysis described above considering parameters such as:
| • | Current soil productivity and yields; |
| • | Potential soil productivity based on market participant best use of soil property; |
| • | Projected gross margin derived from soil use; |
| • | Rental value obtained for soil use, if applicable; |
| • | Similar comparable farmland property within the topographic area. |
The results are then tested against actual sales, if any, and current market conditions to ensure the values produced are accurate, consistent and fair.
(c) Biological assets
When there is no active market or market-determined prices are not available, the Group determines the fair value of a biological asset in its present location and condition based on the present value of expected net cash
The accompanying notes are an integral part of these consolidated financial statements.
F-47
Table of Contents
Union Agriculture Group Corp.
Notes to the Consolidated Financial Statements (Continued)
(All amounts in US$, except shares and per share data and as otherwise indicated)
| 5. | Critical accounting policies, estimates and judgments (continued) |
flows from the biological asset discounted at a current market-determined pre-tax rate. The discounted cash flow model requires the input of highly subjective assumptions including observable and unobservable data. Generally the estimation of the fair value of biological assets is based on models or inputs that are not observable in the market and the use of unobservable inputs is significant to the overall valuation of the assets. Unobservable inputs are determined based on the best information available, for example by reference to historical information of past practices and results, statistical and agronomical information, and other analytical techniques. Key assumptions include future market prices, estimated yields at the point of harvest, estimated production cycle, future cash flows, future costs of harvesting and other costs, and estimated discount rate.
Market prices are generally determined by reference to observable data in the principal market for the agricultural produce. Harvesting costs and other costs are estimated based on historical and statistical data. Yields are estimated based on several factors including the location of the farmland and soil type, environmental conditions, infrastructure and other restrictions and growth at the time of measurement. Yields are subject to a high degree of uncertainty and may be affected by several factors out of the Group’s control including but not limited to extreme or unusual weather conditions, plagues and other crop diseases.
The key assumptions discussed above are highly sensitive. Reasonable shifts in assumptions including but not limited to increases or decreases in prices, costs and discount factors used may result in a significant increase or decrease to the fair value of biological assets recognized at any given time. Cash flows are projected based on estimated production. Estimates of production in themselves are dependent on various assumptions, in addition to those described above, including but not limited to several factors such as location, environmental conditions and other restrictions. Changes in these estimates could materially impact on estimated production, and could therefore affect estimates of future cash flows used in the assessment of fair value. The valuation models and their assumptions are reviewed annually, or quarterly if warranted, and, if necessary, adjusted.
As of the Group’s year-end on June 30 of each year, the Group’s biological assets with no available market-determined prices comprise only of recently planted wheat (which have attained no significant biological growth) and blueberry bushes. The wheat is valued at cost incurred as of June 30 of each year approximating fair value. Soybean and rice are generally harvested as of June 30 of each year and are kept in inventory or sold, thus any estimation performed on these biological assets during the interim periods is trued up and the actual gains or losses incurred charged to the income statement. Therefore, as of June 30, 2010, the Group’s biological assets subject to a valuation model are limited to the blueberries plantations. These plantations are immaterial to the Group’s operations and therefore any reasonable shift in the assumptions used in the valuation model may not have a significant impact in the Group’s results.
(d) Income taxes
Significant judgment is required in determining the provision for income taxes. There are many transactions and calculations for which the ultimate tax determination is uncertain. The Group recognizes liabilities for anticipated tax audit issues based on estimates of whether additional taxes will be due. Where the final tax outcome of these matters is different from the amounts that were initially recorded, such differences will impact the current and deferred income tax assets and liabilities in the period in which such determination is made.
Deferred tax assets are reviewed at each reporting date and reduced to the extent that it is no longer probable that sufficient taxable income will be available to allow all or part of the asset to be recovered. Deferred tax
The accompanying notes are an integral part of these consolidated financial statements.
F-48
Table of Contents
Union Agriculture Group Corp.
Notes to the Consolidated Financial Statements (Continued)
(All amounts in US$, except shares and per share data and as otherwise indicated)
| 5. | Critical accounting policies, estimates and judgments (continued) |
assets and liabilities are not discounted. In assessing the realizability of deferred tax assets, management considers whether it is probable that some portion or all of the deferred tax assets will not be realized. The ultimate realization of deferred tax assets is dependent upon the generation of future taxable income during the periods in which those temporary differences become deductible. Management considers the scheduled reversal of deferred tax liabilities, projected future taxable income and tax planning strategies in making this assessment. (See Note 18 for details).
(e) Business combinations – purchase price allocation
Accounting for business combinations requires the allocation of the Group’s purchase price to the various assets and liabilities of the acquired business at their respective fair values. The Group uses all available information to make these fair value determinations, and for major acquisitions, may hire an independent appraisal firm to assist in making fair value estimates. In some instances, assumptions with respect to the timing and amount of future revenues and expenses associated with an asset might have to be used in determining its fair value. Actual timing and amount of net cash flows from revenues and expenses related to that asset over time may differ materially from those initial estimates, and if the timing is delayed significantly or if the net cash flows decline significantly, the asset could become impaired.
| 6. | Segment information |
IFRS 8 “Operating Segments” requires an entity to report financial and descriptive information about its reportable segments, which are operating segments or aggregations of operating segments that meet specified criteria. Operating segments are components of an entity about which separate financial information is available that is evaluated regularly by the chief operating decision maker (“CODM”) in deciding how to allocate resources and in assessing performance. The CODM evaluates the business based on the differences in the nature of its products, operations and risks. The amount reported for each segment item is the measure reported to the chief operating decision maker for these purposes.
Operating segments identified are disclosed as reportable segments if they meet any of the following quantitative thresholds:
| • | The operating segment’s reported revenue, including both sales to external customers and inter-segment sales or transfers, is ten per cent or more of the combined revenue, internal and external, of all operating segments; |
| • | The absolute amount of its reported profit or loss is ten per cent or more of the greater, in absolute amount, of: |
| • | the combined reported profit of all operating segments that do not report a loss; and |
| • | the combined reported loss of all operating segments that report a loss. |
| • | Its assets are ten per cent or more of the combined assets of all operating segments. |
If, after determining reportable segments in accordance with the preceding quantitative thresholds, the total external revenue attributable to those segments amounts to less than 75 per cent of the total Group’s consolidated
The accompanying notes are an integral part of these consolidated financial statements.
F-49
Table of Contents
Union Agriculture Group Corp.
Notes to the Consolidated Financial Statements (Continued)
(All amounts in US$, except shares and per share data and as otherwise indicated)
| 6. | Segment information (continued) |
external revenue, additional segments are identified as reportable segments, even if they do not meet the thresholds described above, until at least 75 per cent of the Group’s consolidated external revenue is included in reportable segments. Once the 75 per cent of the Group’s consolidated external revenue is included in reportable segments, the remaining operating segments are aggregated in the ‘All other segments’ column.
From inception through June 30, 2008, the Group operated primarily in the blueberry business with less than 200 hectares of immature blueberry plantations. The commercial activity of the Group during that period was minimal with no sales recorded. During the year ended June 30, 2009, the Group diversified the businesses including cattle and sheep operations and to a lesser extent some colonies of bees for the production of honey. The commercial activity of the Group was also not significant during this period. During the year ended June 30, 2010, the Group paid for land underPromesasto continue diversification of its businesses and incorporating crops and rice to its portfolio. As of June 30, 2010, the Group’s principal businesses are crops, rice, cattle, sheep and dairy businesses, and to a lesser extent its blueberry plantations and apiculture. Based on the Group’s managerial business structure, the Group operates in the following reportable segments as of June 30, 2010. Reportable segments for prior periods have been reported based on the current managerial structure:
| • | The‘Cattle’ Segment consists of breeding, purchasing and/ or fattening of beef cattle for sale to meat processors and local livestock auction markets. |
| • | The‘Sheep’Segment consists of breeding, purchasing and/or fattening of sheep for sale of meat and/or wool to meat processors, wool product manufacturers and wool cooperatives. |
| • | The‘Crops’ Segment consists of planting, harvesting and sale of wheat and soybeans, which do not represent separate operating segments on an individual basis. Management seeks to maximize the use of the land through crop rotation and the type and amount of crops cultivated may vary from harvest year to harvest year. Management is focused on the long-term performance of the productive land, and to that extent, the performance is assessed considering the aggregated combination, if any, of crops planted in the land. A single manager is responsible for the management of operating activity of all crops rather than for each individual crop. |
| • | The‘Rice’Segment consists of planting, harvesting and sale of rice locally to third parties for export. |
| • | The ‘Dairy’ Segment consists of breeding and/ or purchasing dairy cows for the production of raw milk for sale to local milk and milk-related products producers. |
| • | The‘All Other Segments’ column consists of the aggregation of the remaining operating segments, which do not meet the quantitative thresholds for disclosure, namely, blueberry plantations and apiculture. |
The Group does not export their products directly. However, due to the size of the Uruguayan market, most of its products are exported through the third parties with whom it conducts business. The measurement principles for the Group’s segment reporting structure are based on the IFRS principles adopted in the consolidated financial statements. Revenue generated and goods and services exchanged between segments are calculated on the basis of market prices.
The accompanying notes are an integral part of these consolidated financial statements.
F-50
Table of Contents
Union Agriculture Group Corp.
Notes to the Consolidated Financial Statements (Continued)
(All amounts in US$, except shares and per share data and as otherwise indicated)
| 6. | Segment information (continued) |
The following table presents information with respect to the Group’s reportable segments. Certain other activities of a holding function nature not allocable to the segments are disclosed in the column ‘Corporate’.
Segment analysis for the year ended June 30, 2010 is as follows (i):
| Cattle | Sheep | Crops | Rice | Dairy | Corporate | All other segments | Total | |||||||||||||||||||||||||
Sales of agricultural produce and biological assets and services rendered | 352,208 | 83,864 | 9,617 | 1,123,383 | — | — | 11,808 | 1,580,880 | ||||||||||||||||||||||||
Rental income | — | — | — | 54,133 | — | — | — | 54,133 | ||||||||||||||||||||||||
Cost of agricultural produce and biological assets sold and services rendered | (332,853 | ) | (78,645 | ) | (7,213 | ) | (1,143,717 | ) | — | — | (11,455 | ) | (1,573,883 | ) | ||||||||||||||||||
Initial recognition and changes in fair value of biological assets and agricultural produce | 1,956,574 | 478,648 | 1,018,501 | 1,268,874 | 92,195 | — | 521,016 | 5,335,808 | ||||||||||||||||||||||||
Cost of production | (799,154 | ) | (233,437 | ) | (956,971 | ) | (868,612 | ) | (87,501 | ) | — | (492,057 | ) | (3,437,732 | ) | |||||||||||||||||
Margin Before Operating Expenses | 1,176,775 | 250,430 | 63,934 | 434,061 | 4,694 | — | 29,312 | 1,959,206 | ||||||||||||||||||||||||
General and administrative expenses | (665,882 | ) | (86,260 | ) | (831,040 | ) | (199,703 | ) | (77,371 | ) | (1,728,095 | ) | 6,146 | (3,582,205 | ) | |||||||||||||||||
Selling expenses | (13,648 | ) | (764 | ) | — | (9,950 | ) | — | — | (251 | ) | (24,613 | ) | |||||||||||||||||||
Profit/ (Loss) from Operations Before Financing and Taxation | 497,245 | 163,406 | (767,106 | ) | 224,408 | (72,677 | ) | (1,728,095 | ) | 35,207 | (1,647,612 | ) | ||||||||||||||||||||
Depreciation and amortization | 25,602 | 24,752 | 60,878 | 12,896 | 8,228 | 34,174 | 62,340 | 228,870 | ||||||||||||||||||||||||
Property, plant and equipment, net | 262,717 | 203,137 | 1,074,942 | 463,386 | 138,821 | 581,760 | 1,763,384 | 4,488,147 | ||||||||||||||||||||||||
Land underPromesas | 35,695,466 | 3,437,937 | 46,553,446 | 10,559,882 | 4,467,938 | — | — | 100,714,669 | ||||||||||||||||||||||||
Investment property underPromesas, net | 415,354 | 238,733 | 3,206,678 | 803,203 | — | — | — | 4,663,968 | ||||||||||||||||||||||||
Goodwill | — | — | — | — | — | — | 380,068 | 380,068 | ||||||||||||||||||||||||
Biological assets | 5,111,654 | 804,007 | 420,713 | 194,726 | 255,571 | — | 957,876 | 7,744,547 | ||||||||||||||||||||||||
Inventories | 216,089 | 100,824 | 985,453 | 383,383 | 2,654 | — | 136,429 | 1,824,832 | ||||||||||||||||||||||||
Total segment assets | 41,701,280 | 4,784,638 | 52,241,232 | 12,404,580 | 4,864,984 | 581,760 | 3,237,757 | 119,816,231 | ||||||||||||||||||||||||
| (i) | The ‘All other segments’ column comprises blueberry plantations and honey for the period indicated. |
The accompanying notes are an integral part of these consolidated financial statements.
F-51
Table of Contents
Union Agriculture Group Corp.
Notes to the Consolidated Financial Statements (Continued)
(All amounts in US$, except shares and per share data and as otherwise indicated)
| 6. | Segment information (continued) |
Segment analysis for the year ended June 30, 2009 is as follows (i):
| Cattle | Sheep | Corporate | All other segments | Total | ||||||||||||||||
Sales of agricultural produce and biological assets and services rendered | 148,687 | 23,338 | — | 27,369 | 199,394 | |||||||||||||||
Cost of agricultural produce and biological assets sold and services rendered | (123,370 | ) | (22,684 | ) | — | (11,718 | ) | (157,772 | ) | |||||||||||
Initial recognition and changes in fair value of biological assets and agricultural produce | 553,778 | 47,778 | — | (369,232 | ) | 232,324 | ||||||||||||||
Cost of production | (409,957 | ) | (34,143 | ) | — | (499,292 | ) | (943,392 | ) | |||||||||||
Margin Before Operating Expenses | 169,138 | 14,289 | (852,873 | ) | (669,446 | ) | ||||||||||||||
General and administrative expenses | (216,941 | ) | (65,883 | ) | (1,305,287 | ) | (48,012 | ) | (1,636,123 | ) | ||||||||||
Selling expenses | (2,786 | ) | (654 | ) | — | (471 | ) | (3,911 | ) | |||||||||||
Other operating income, net | — | — | — | 1,618 | 1,618 | |||||||||||||||
Loss from Operations Before Financing and Taxation | (50,589 | ) | (52,248 | ) | (1,305,287 | ) | (899,738 | ) | (2,307,862 | ) | ||||||||||
Depreciation and amortization | 5,291 | 1,162 | 12,846 | 50,219 | 69,518 | |||||||||||||||
Property, plant and equipment, net | 79,052 | 25,799 | 57,900 | 795,829 | 958,580 | |||||||||||||||
Land underPromesas | 9,798,905 | 1,718,397 | — | 712,909 | 12,230,211 | |||||||||||||||
Goodwill | — | — | — | 380,068 | 380,068 | |||||||||||||||
Biological assets | 1,191,168 | 273,527 | — | 458,047 | 1,922,742 | |||||||||||||||
Inventories | 26,711 | 6,678 | — | — | 33,389 | |||||||||||||||
Total segment assets | 11,095,836 | 2,024,401 | 57,900 | 2,346,853 | 15,524,990 | |||||||||||||||
| (i) | Reportable segments not shown do not exist as of and for the period indicated. The ‘All other segments’ column comprises blueberry plantations and honey only. |
The accompanying notes are an integral part of these consolidated financial statements.
F-52
Table of Contents
Union Agriculture Group Corp.
Notes to the Consolidated Financial Statements (Continued)
(All amounts in US$, except shares and per share data and as otherwise indicated)
| 6. | Segment information (continued) |
Segment analysis for the period from inception on January 2, 2008 to June 30, 2008 is as follows (i):
| Corporate | All other segments | Total | ||||||||||
Initial recognition and changes in fair value of biological assets and agricultural produce | — | 5,864 | 5,864 | |||||||||
Cost of production | — | (5,864 | ) | (5,864 | ) | |||||||
Margin Before Operating Expenses | — | — | — | |||||||||
General and administrative expenses | (10,545 | ) | (93,863 | ) | (104,408 | ) | ||||||
Loss from Operations Before Financing and Taxation | (10,545 | ) | (93,863 | ) | (104,408 | ) | ||||||
Depreciation and amortization | — | 12,647 | 12,647 | |||||||||
Property, plant and equipment, net | — | 525,299 | 525,299 | |||||||||
Land underPromesas | — | 712,909 | 712,909 | |||||||||
Goodwill | — | 380,068 | 380,068 | |||||||||
Biological assets | — | 730,936 | 730,936 | |||||||||
Total segment assets | — | 2,349,212 | 2,349,212 | |||||||||
| (i) | Reportable segments not shown do not exist as of and for the period indicated. The ‘All other segments’ column comprises blueberry plantations for the period indicated. |
The accompanying notes are an integral part of these consolidated financial statements.
F-53
Table of Contents
Union Agriculture Group Corp.
Notes to the Consolidated Financial Statements (Continued)
(All amounts in US$, except shares and per share data and as otherwise indicated)
| 6. | Segment information (continued) |
Total segment assets are measured in a manner consistent with that of the consolidated financial statements. These assets are allocated based on the operations of the segment and the physical location of the asset.
Total reportable segments’ assets are reconciled to total assets as per the statement of financial position as follows:
| June 30, 2010 | June 30, 2009 | June 30, 2008 | ||||||||||
Total reportable assets as per Segment Information | 119,816,231 | 15,524,990 | 2,349,212 | |||||||||
Intangible assets, net (excluding goodwill) | 25,236 | — | — | |||||||||
Deferred income tax assets | 340,502 | 11,096 | — | |||||||||
Trade and other receivables, net | 8,329,062 | 1,484,890 | 343,765 | |||||||||
Financial assets at fair value through profit or loss | 1,190,977 | — | — | |||||||||
Investments in debt certificates | — | 1,912,498 | — | |||||||||
Cash and cash equivalents | 67,125,638 | 67,014,579 | 43,148 | |||||||||
Total assets as per the Statement of Financial Position | 196,827,646 | 85,948,053 | 2,736,125 | |||||||||
Since inception the Group has only operated in Uruguay. All of the Group’s property, plant and equipment, land underPromesas, investment property underPromesas and biological assets are located in Uruguay.
Revenues of US$ 276,193 (2009: nil; 2008: nil) are derived from Frigorífico Tacuarembó S.A. These revenues are attributable to the Cattle segment.
Revenues of US$ 1,177,516 (2009: nil; 2008: nil) are derived from SAMAN. These revenues are attributable to the Rice segment.
The accompanying notes are an integral part of these consolidated financial statements.
F-54
Table of Contents
Union Agriculture Group Corp.
Notes to the Consolidated Financial Statements (Continued)
(All amounts in US$, except shares and per share data and as otherwise indicated)
| 7. | Property, plant and equipment, net |
Changes in the Group’s property, plant and equipment for the years ended June 30, 2010 and 2009 and for the period from inception through June 30, 2008 were as follows:
| Land | Buildings and facilities | Machinery | Furniture and equipment | Fixtures | Vehicles | Total | ||||||||||||||||||||||
Period ended June 30, 2008 | ||||||||||||||||||||||||||||
Formation of the Group (Note 25) | — | 294,781 | 29,098 | 2,795 | 12,371 | 66,418 | 405,463 | |||||||||||||||||||||
Acquisition of subsidiary (Note 25) | — | 74,596 | 20,399 | 8,593 | 3,184 | 25,711 | 132,483 | |||||||||||||||||||||
Depreciation charge (Note 20) | — | (3,184 | ) | (1,333 | ) | (652 | ) | — | (7,478 | ) | (12,647 | ) | ||||||||||||||||
Closing net book amount | — | 366,193 | 48,164 | 10,736 | 15,555 | 84,651 | 525,299 | |||||||||||||||||||||
At June 30, 2008 | ||||||||||||||||||||||||||||
Cost | — | 376,441 | 52,748 | 11,923 | 16,425 | 96,587 | 554,124 | |||||||||||||||||||||
Accumulated depreciation | — | (10,248 | ) | (4,584 | ) | (1,187 | ) | (870 | ) | (11,936 | ) | (28,825 | ) | |||||||||||||||
Net book amount | — | 366,193 | 48,164 | 10,736 | 15,555 | 84,651 | 525,299 | |||||||||||||||||||||
Year ended June 30, 2009 | ||||||||||||||||||||||||||||
Opening net book amount | — | 366,193 | 48,164 | 10,736 | 15,555 | 84,651 | 525,299 | |||||||||||||||||||||
Additions | — | 116,224 | 135,660 | 33,682 | 4,623 | 223,065 | 513,254 | |||||||||||||||||||||
Disposals | — | — | — | — | — | (10,455 | ) | (10,455 | ) | |||||||||||||||||||
Depreciation charge (Note 20) | — | (6,588 | ) | (15,625 | ) | (3,552 | ) | (1,977 | ) | (41,776 | ) | (69,518 | ) | |||||||||||||||
Closing net book amount | — | 475,829 | 168,199 | 40,866 | 18,201 | 255,485 | 958,580 | |||||||||||||||||||||
At June 30, 2009 | ||||||||||||||||||||||||||||
Cost | — | 492,665 | 188,408 | 45,605 | 21,048 | 309,197 | 1,056,923 | |||||||||||||||||||||
Accumulated depreciation | — | (16,836 | ) | (20,209 | ) | (4,739 | ) | (2,847 | ) | (53,712 | ) | (98,343 | ) | |||||||||||||||
Net book amount | — | 475,829 | 168,199 | 40,866 | 18,201 | 255,485 | 958,580 | |||||||||||||||||||||
Year ended June 30, 2010 | ||||||||||||||||||||||||||||
Opening net book amount | — | 475,829 | 168,199 | 40,866 | 18,201 | 255,485 | 958,580 | |||||||||||||||||||||
Additions | — | 974,006 | 1,846,454 | 49,479 | 54,606 | 116,082 | 3,040,627 | |||||||||||||||||||||
Reclassifications from land under Promesas (i) | 712,909 | — | — | — | — | — | 712,909 | |||||||||||||||||||||
Depreciation charge (Note 20) | — | (24,624 | ) | (116,504 | ) | (7,258 | ) | (3,804 | ) | (71,779 | ) | (223,969 | ) | |||||||||||||||
Closing net book amount | 712,909 | 1,425,211 | 1,898,149 | 83,087 | 69,003 | 299,788 | 4,488,147 | |||||||||||||||||||||
At June 30, 2010 | ||||||||||||||||||||||||||||
Cost | 712,909 | 1,466,671 | 2,034,862 | 95,084 | 75,654 | 425,279 | 4,810,459 | |||||||||||||||||||||
Accumulated depreciation | — | (41,460 | ) | (136,713 | ) | (11,997 | ) | (6,651 | ) | (125,491 | ) | (322,312 | ) | |||||||||||||||
Net book amount | 712,909 | 1,425,211 | 1,898,149 | 83,087 | 69,003 | 299,788 | 4,488,147 | |||||||||||||||||||||
The accompanying notes are an integral part of these consolidated financial statements.
F-55
Table of Contents
Union Agriculture Group Corp.
Notes to the Consolidated Financial Statements (Continued)
(All amounts in US$, except shares and per share data and as otherwise indicated)
| 7. | Property, plant and equipment, net (continued) |
| (i) | The Group received authorization from the government to own the 188 hectares of land in December 2009. The Group executed the title on the land as of June 30, 2010 and accordingly reclassified the amount to property, plant and equipment. |
Amounts of US$ 181,798, US$ 56,309 and nil of depreciation charges are included in “Cost of production” for the years ended June 30, 2010, 2009 and the period from inception through June 30, 2008, respectively. Amounts of US$ 42,171; US$ 13,209 and US$ 12,647 of depreciation charges are included in “General and administrative expenses” for the years ended June 30, 2010, 2009 and the period from inception through June 30, 2008, respectively.
Where assets are financed by leasing agreements and substantially all the risks and rewards of ownership are substantially transferred to the Group (“finance leases”) the assets are treated as if they had been purchased outright and the corresponding liability to the leasing company is included as an obligation under finance leases. Depreciation on assets held under finance leases is charged to the statement of comprehensive income on the same basis as owned assets. Leasing payments are treated as consisting of capital and interest elements and the interest is charged to the statement of comprehensive income as a financing charge. Assets under finance leases comprise vehicles, machinery and equipment. All other leases are treated as operating leases and the relevant annual rentals are charged to the statement of comprehensive income as incurred. (See Note 24).
The accompanying notes are an integral part of these consolidated financial statements.
F-56
Table of Contents
Union Agriculture Group Corp.
Notes to the Consolidated Financial Statements (Continued)
(All amounts in US$, except shares and per share data and as otherwise indicated)
| 8. | Land underPromesas |
Changes in the Group’s land underPromesasfor the years ended June 30, 2010 and 2009 and for the period from inception through June 30, 2008 were as follows:
| Land under Promesas | ||||
Period ended June 30, 2008 | ||||
Formation of the Group (Note 25) | 350,022 | |||
Acquisition of subsidiary (Note 25) | 362,887 | |||
Closing net book amount | 712,909 | |||
At June 30, 2008 | ||||
Cost | 712,909 | |||
Net book amount | 712,909 | |||
Year ended June 30, 2009 | ||||
Opening net book amount | 712,909 | |||
Additions | 11,517,302 | |||
Closing net book amount | 12,230,211 | |||
At June 30, 2009 | ||||
Cost | 12,230,211 | |||
Net book amount | 12,230,211 | |||
Year ended June 30, 2010 | ||||
Opening net book amount | 12,230,211 | |||
Additions | 89,197,367 | |||
Reclassifications to property, plant and equipment (i) | (712,909 | ) | ||
Closing net book amount | 100,714,669 | |||
At June 30, 2010 | ||||
Cost | 100,714,669 | |||
Net book amount | 100,714,669 | |||
| (i) | The Group received authorization from the government to own the 188 hectares of land in December 2009. The Group executed the title on the land as of June 30, 2010 and accordingly reclassified the amount to property, plant and equipment. |
| 9. | Investment property underPromesas, net |
Investment property underPromesascomprises primarily Las Acacias farmland underPromesas, and to a lesser extent a rice mill and other warehousing space leased out to SAMAN (See Note 24 for details).
The accompanying notes are an integral part of these consolidated financial statements.
F-57
Table of Contents
Union Agriculture Group Corp.
Notes to the Consolidated Financial Statements (Continued)
(All amounts in US$, except shares and per share data and as otherwise indicated)
| 9. | Investment property underPromesas, net (continued) |
There was no investment property underPromesas for the years ended June 30, 2009 and 2008. Changes in the Group’s investment property underPromesasfor the year ended June 30, 2010 were as follows:
| June 30, 2010 | ||||
At beginning of year/ period | — | |||
Additions | 4,667,247 | |||
Depreciation charge (i) (Note 20) | (3,279 | ) | ||
At end of year/ period (ii) | 4,663,968 | |||
| (i) | Included within “General and administrative expenses” in the statement of comprehensive income. |
| (ii) | Includes US$ 0.2 million relating to the rice mill and warehousing spaces. |
The following amounts have been recognized in the statement of comprehensive income:
| June 30, 2010 | ||||
Rental income | 54,133 | |||
Direct operating expenses | (4,733 | ) | ||
As of June 30, 2010, the fair value of this investment property underPromesasamounts to US$ 5.5 million.
The accompanying notes are an integral part of these consolidated financial statements.
F-58
Table of Contents
Union Agriculture Group Corp.
Notes to the Consolidated Financial Statements (Continued)
(All amounts in US$, except shares and per share data and as otherwise indicated)
| 10. | Intangible assets, net |
Changes in the Group’s intangible assets for the years ended June 30, 2010 and 2009 and for the period from inception through June 30, 2008 were as follows:
| Goodwill | Software | Total | ||||||||||
Period ended June 30, 2008 | ||||||||||||
Inception at January 2, 2008 | — | — | — | |||||||||
Acquisition of subsidiary (Note 25) | 380,068 | — | 380,068 | |||||||||
Closing net book amount | 380,068 | — | 380,068 | |||||||||
At June 30, 2008 | ||||||||||||
Cost | 380,068 | — | 380,068 | |||||||||
Net book amount | 380,068 | — | 380,068 | |||||||||
Year ended June 30, 2009 | ||||||||||||
Opening net book amount | 380,068 | — | 380,068 | |||||||||
Closing net book amount | 380,068 | — | 380,068 | |||||||||
At June 30, 2009 | ||||||||||||
Cost | 380,068 | — | 380,068 | |||||||||
Net book amount | 380,068 | — | 380,068 | |||||||||
Year ended June 30, 2010 | ||||||||||||
Opening net book amount | 380,068 | — | 380,068 | |||||||||
Additions | — | 26,858 | 26,858 | |||||||||
Amortization charge (i) (Note 20) | — | (1,622 | ) | (1,622 | ) | |||||||
Closing net book amount | 380,068 | 25,236 | 405,304 | |||||||||
At June 30, 2010 | ||||||||||||
Cost | 380,068 | 26,858 | 406,926 | |||||||||
Accumulated amortization | — | (1,622 | ) | (1,622 | ) | |||||||
Net book amount | 380,068 | 25,236 | 405,304 | |||||||||
| (i) | Included within “General and administrative expenses” in the statement of comprehensive income. |
The Group did not recognize any impairment losses for any of the periods presented (See Note 5 for details).
The accompanying notes are an integral part of these consolidated financial statements.
F-59
Table of Contents
Union Agriculture Group Corp.
Notes to the Consolidated Financial Statements (Continued)
(All amounts in US$, except shares and per share data and as otherwise indicated)
| 11. | Biological assets |
Changes in the Group’s biological assets for the years ended June 30, 2010 and 2009 and for the period from inception through June 30, 2008 were as follows:
| June 30, 2010 | June 30, 2009 | June 30, 2008 | ||||||||||
Beginning of the year/ period | 1,922,742 | 730,936 | — | |||||||||
Formation of the Group (Note 25) | — | — | 391,538 | |||||||||
Acquisition of subsidiaries (Note 25) | — | — | 333,534 | |||||||||
Increase due to purchases | 2,580,886 | 1,105,536 | — | |||||||||
Initial recognition and changes in fair value of biological assets | 5,245,708 | 232,324 | 5,864 | |||||||||
Decrease due to harvest | (1,671,936 | ) | — | — | ||||||||
Decrease due to sales | (332,853 | ) | (146,054 | ) | — | |||||||
End of the year/ period year | 7,744,547 | 1,922,742 | 730,936 | |||||||||
Biological assets with a production cycle of more than one year (that is, blueberry plantations, cattle and sheep) generated ‘Initial recognition and changes in fair value of biological assets’ amounting to US$ 2,958,333 for the year ended June 30, 2010 (2009: US$ 232,324; 2008: US$ 5,864). In 2010, an amount of US$ 1,554,759 (2009: US$ 172,528; 2008: nil) was attributable to price changes, and an amount of US$ 1,403,574 (2009: US$ 59,796; 2008: US$ 5,864) was attributable to physical changes.
Biological assets as of June 30, 2010, 2009 and 2008 were as follows:
| June 30, 2010 | June 30, 2009 | June 30, 2008 | ||||||||||
Non-current | ||||||||||||
Cattle for dairy production | 255,571 | — | — | |||||||||
Breeding cattle | 3,349,598 | 940,408 | — | |||||||||
Cattle for sale | 709,966 | 109,650 | — | |||||||||
Blueberry plantations | 902,030 | 416,854 | 730,936 | |||||||||
Sheep | 605,071 | 189,959 | — | |||||||||
Others | 55,845 | 41,193 | — | |||||||||
| 5,878,081 | 1,698,064 | 730,936 | ||||||||||
Current | ||||||||||||
Breeding cattle | 524,240 | 135,235 | — | |||||||||
Cattle for sale | 527,850 | 5,875 | — | |||||||||
Sheep | 198,937 | 83,568 | — | |||||||||
Crops | 420,713 | — | — | |||||||||
Rice | 194,726 | — | — | |||||||||
| 1,866,466 | 224,678 | — | ||||||||||
Total biological assets | 7,744,547 | 1,922,742 | 730,936 | |||||||||
The accompanying notes are an integral part of these consolidated financial statements.
F-60
Table of Contents
Union Agriculture Group Corp.
Notes to the Consolidated Financial Statements (Continued)
(All amounts in US$, except shares and per share data and as otherwise indicated)
| 11. | Biological assets (continued) |
The following tables present the classification of the Group’s total biological assets between bearer and consumable assets and mature and immature assets as of each of June 30, 2010 and 2009:
| June 30, 2010 | June 30, 2009 | |||||||||||||||||||||||
| Bearer | Consumable | Total | Bearer | Consumable | Total | |||||||||||||||||||
Non-current | ||||||||||||||||||||||||
Cattle for dairy production | 255,571 | — | 255,571 | — | — | — | ||||||||||||||||||
Breeding cattle | 3,349,598 | — | 3,349,598 | 940,408 | — | 940,408 | ||||||||||||||||||
Cattle for sale | — | 709,966 | 709,966 | — | 109,650 | 109,650 | ||||||||||||||||||
Blueberry plantations | 902,030 | — | 902,030 | 416,854 | — | 416,854 | ||||||||||||||||||
Sheep | 605,071 | — | 605,071 | 189,959 | — | 189,959 | ||||||||||||||||||
Others | 55,845 | — | 55,845 | 41,193 | — | 41,193 | ||||||||||||||||||
| 5,168,115 | 709,966 | 5,878,081 | 1,588,414 | 109,650 | 1,698,064 | |||||||||||||||||||
Current | ||||||||||||||||||||||||
Breeding cattle | 524,240 | — | 524,240 | 135,235 | — | 135,235 | ||||||||||||||||||
Cattle for sale | — | 527,850 | 527,850 | — | 5,875 | 5,875 | ||||||||||||||||||
Sheep | 109,785 | 89,152 | 198,937 | 31,258 | 52,310 | 83,568 | ||||||||||||||||||
Crops | — | 420,713 | 420,713 | — | — | — | ||||||||||||||||||
Rice | — | 194,726 | 194,726 | — | — | — | ||||||||||||||||||
| 634,025 | 1,232,441 | 1,866,466 | 166,493 | 58,185 | 224,678 | |||||||||||||||||||
Total biological assets | 5,802,140 | 1,942,407 | 7,744,547 | 1,754,907 | 167,835 | 1,922,742 | ||||||||||||||||||
| June 30, 2010 | June 30, 2009 | |||||||||||||||||||||||
| Mature | Immature | Total | Mature | Immature | Total | |||||||||||||||||||
Non-current | ||||||||||||||||||||||||
Cattle for dairy production | 255,571 | — | 255,571 | — | — | — | ||||||||||||||||||
Breeding cattle | 2,503,945 | 845,653 | 3,349,598 | 608,558 | 331,850 | 940,408 | ||||||||||||||||||
Cattle for sale | — | 709,966 | 709,966 | — | 109,650 | 109,650 | ||||||||||||||||||
Blueberry plantations | — | 902,030 | 902,030 | — | 416,854 | 416,854 | ||||||||||||||||||
Sheep | 468,739 | 136,332 | 605,071 | 151,432 | 38,527 | 189,959 | ||||||||||||||||||
Others | — | 55,845 | 55,845 | — | 41,193 | 41,193 | ||||||||||||||||||
| 3,228,255 | 2,649,826 | 5,878,081 | 759,990 | 938,074 | 1,698,064 | |||||||||||||||||||
Current | ||||||||||||||||||||||||
Breeding cattle | 524,240 | — | 524,240 | 135,235 | — | 135,235 | ||||||||||||||||||
Cattle for sale | 527,850 | — | 527,850 | 5,875 | — | 5,875 | ||||||||||||||||||
Sheep | 198,937 | — | 198,937 | 83,568 | — | — | ||||||||||||||||||
Crops | — | 420,713 | 420,713 | — | — | 83,568 | ||||||||||||||||||
Rice | — | 194,726 | 194,726 | — | — | — | ||||||||||||||||||
| 1,251,027 | 615,439 | 1,866,466 | 224,678 | — | 224,678 | |||||||||||||||||||
Total biological assets | 4,479,282 | 3,265,265 | 7,744,547 | 984,668 | 938,074 | 1,922,742 | ||||||||||||||||||
The accompanying notes are an integral part of these consolidated financial statements.
F-61
Table of Contents
Union Agriculture Group Corp.
Notes to the Consolidated Financial Statements (Continued)
(All amounts in US$, except shares and per share data and as otherwise indicated)
| 11. | Biological assets (continued) |
As of June 30, 2008, all biological assets are classified as bearer and immature. As of January 2, 2008, the Group did not have biological assets.
The fair value less estimated point of sale costs of agricultural produce at the point of harvest amounted to US$ 1,683,390 for the year ended June 30, 2010 (2009: US$ 11,717; 2008: nil).
| 12. | Financial instruments by category |
The following table shows the carrying amounts of financial assets and financial liabilities by category of financial instrument and a reconciliation to the corresponding line item in the statements of financial position, as appropriate. Since the line items “Trade and other receivables, net” and “Trade and other payables” contain both financial instruments and non-financial assets or liabilities (such as other tax receivables or advance payments for services to be received in the future), the reconciliation is shown in the columns headed “Non-financial assets” and “Non-financial liabilities.”
| Financial assets at amortized cost | Financial assets at fair value through profit or loss | Subtotal financial assets | Non- financial assets | Total | ||||||||||||||||
June 30, 2010 | ||||||||||||||||||||
Assets as per statement of financial position | ||||||||||||||||||||
Trade and other receivables, net (i) | 4,103,188 | — | 4,103,188 | 4,225,874 | 8,329,062 | |||||||||||||||
Financial assets at fair value through profit or loss (ii) | — | 1,190,977 | 1,190,977 | — | 1,190,977 | |||||||||||||||
Cash and cash equivalents (iii) | 67,125,638 | — | 67,125,638 | — | 67,125,638 | |||||||||||||||
Total | 71,228,826 | 1,190,977 | 72,419,803 | 4,225,874 | 76,645,677 | |||||||||||||||
| Financial liabilities at amortized cost | Non- financial liabilities | Total | ||||||||||
Liabilities as per statement of financial position | ||||||||||||
Trade and other payables (v) | 690,342 | 1,844,706 | 2,535,048 | |||||||||
Finance lease liabilities (vi) | 6,930 | — | 6,930 | |||||||||
Total | 697,272 | 1,844,706 | 2,541,978 | |||||||||
The accompanying notes are an integral part of these consolidated financial statements.
F-62
Table of Contents
Union Agriculture Group Corp.
Notes to the Consolidated Financial Statements (Continued)
(All amounts in US$, except shares and per share data and as otherwise indicated)
| 12. | Financial instruments by category (continued) |
| Financial assets at amortized cost | Non-financial assets | Total | ||||||||||
June 30, 2009 | ||||||||||||
Assets as per statement of financial position | ||||||||||||
Trade and other receivables, net (i) | 1,102,595 | 382,295 | 1,484,890 | |||||||||
Investments in debt certificates (iv) | 1,912,498 | — | 1,912,498 | |||||||||
Cash and cash equivalents (iii) | 67,014,579 | — | 67,014,579 | |||||||||
Total | 70,029,672 | 382,295 | 70,411,967 | |||||||||
| Financial liabilities at amortized cost | Non-financial liabilities | Total | ||||||||||
Liabilities as per statement of financial position | ||||||||||||
Trade and other payables (v) | 1,467,416 | 258,748 | 1,726,164 | |||||||||
Finance lease liabilities (vi) | 11,949 | — | 11,949 | |||||||||
Total | 1,479,365 | 258,748 | 1,738,113 | |||||||||
| Financial assets at amortized cost | Non-financial assets | Total | ||||||||||
June 30, 2008 | ||||||||||||
Assets as per statement of financial position | ||||||||||||
Trade and other receivables, net (i) | 188,095 | 155,670 | 343,765 | |||||||||
Cash and cash equivalents (iii) | 43,148 | — | 43,148 | |||||||||
Total | 231,243 | 155,670 | 386,913 | |||||||||
| Financial liabilities at amortized cost | Non-financial liabilities | Total | ||||||||||
Liabilities as per statement of financial position | ||||||||||||
Trade and other payables (v) | 122,224 | 4,904 | 127,128 | |||||||||
Total | 122,224 | 4,904 | 127,128 | |||||||||
The accompanying notes are an integral part of these consolidated financial statements.
F-63
Table of Contents
Union Agriculture Group Corp.
Notes to the Consolidated Financial Statements (Continued)
(All amounts in US$, except shares and per share data and as otherwise indicated)
| 12. | Financial instruments by category (continued) |
| Financial assets at amortized cost | Total | |||||||
January 2, 2008 | ||||||||
Assets as per statement of financial position | ||||||||
Cash and cash equivalents (iii) | 50,000 | 50,000 | ||||||
Total | 50,000 | 50,000 | ||||||
| (i) | See Note 13 for details. |
| (ii) | Corresponds to shares of New Zealand Farming System Uruguay sold in October 2010. |
| (iii) | As of June 30, 2010, 2009 and 2008 and January 2, 2008, cash and cash equivalents mainly comprise cash in banks and short-term bank deposits. The Group only works with banks rated “A” or higher. As of June 30, 2010, 2009 and 2008, more than 90% of the total cash is deposited with one bank, while the remaining amount is cash on hand and cash in other banks. As of January 2, 2008, total cash is deposited in one bank. |
| (iv) | Relates to debt certificates representing undivided interests in third party securitized receivables trusts. The Group collected all contractual cash flows in the year ended June 30, 2010. |
| (v) | See Note 17 for details. |
| (vi) | See Note 24 for details. |
Liabilities carried at amortized cost also included liabilities under finance leases where the Group is the lessee and which therefore have to be measured in accordance with IAS 17. The categories disclosed are determined by reference to IFRS 9. Finance leases are excluded from the scope of IFRS 7. Therefore, finance leases have been shown separately.
Because of the short maturities of most trade accounts receivable and payable, other receivables and liabilities, and cash and cash equivalents, their carrying amounts at the closing date do not differ significantly from their respective fair values.
The accompanying notes are an integral part of these consolidated financial statements.
F-64
Table of Contents
Union Agriculture Group Corp.
Notes to the Consolidated Financial Statements (Continued)
(All amounts in US$, except shares and per share data and as otherwise indicated)
| 12. | Financial instruments by category (continued) |
Income, expense, gains and losses on financial instruments included in “Financial results, net” in the statement of comprehensive income can be assigned to the following categories:
| Financial assets at amortized cost | Financial assets at fair value through profit or loss | Financial liabilities at amortized cost | Total | |||||||||||||
June 30, 2010 | ||||||||||||||||
Interest income (i) | 664,137 | — | — | 664,137 | ||||||||||||
Interest expense | — | — | (520 | ) | (520 | ) | ||||||||||
Foreign exchange gains/ (losses) (ii) | 573,335 | — | (149 | ) | 573,186 | |||||||||||
Fair value gains on financial assets at fair value through profit or loss (iii) | — | 178,495 | — | 178,495 | ||||||||||||
Net result | 1,237,472 | 178,495 | (669 | ) | 1,415,298 | |||||||||||
| Financial assets at amortized cost | Financial liabilities at amortized cost | Total | ||||||||||
June 30, 2009 | ||||||||||||
Interest income (i) | 653,411 | — | 653,411 | |||||||||
Interest expense | — | (896 | ) | (896 | ) | |||||||
Foreign exchange (losses)/gains (ii) | (863,374 | ) | 2,586 | (860,788 | ) | |||||||
Net result | (209,963 | ) | 1,690 | (208,273 | ) | |||||||
| Financial liabilities at amortized cost | Total | |||||||
June 30, 2008 | ||||||||
Foreign exchange gains | 404 | 404 | ||||||
Net result | 404 | 404 | ||||||
| (i) | Mainly relates to interest on loans granted to third parties. |
| (ii) | Mainly relates to foreign currency effect on Canadian dollars deposits. |
| (iii) | Relates to fair value gain on shares of New Zealand Farming System Uruguay. |
Determining fair values
IFRS 9 defines the fair value of a financial instrument as the amount for which a financial asset could be exchanged, or a financial liability settled, between knowledgeable, willing parties in an arm’s length transaction. All financial instruments recognized at fair value are allocated to one of the valuation hierarchy levels of IFRS 7. This valuation hierarchy provides for three levels. The initial basis for the allocation is the “economic investment class”. Only if this does not result in an appropriate allocation the Group deviates from such an approach in individual cases. The allocation reflects which of the fair values derive from transactions in the market and where valuation is based on models because market transactions are lacking. The disclosures have not been provided on a comparative basis as permitted by IFRS 7.
The accompanying notes are an integral part of these consolidated financial statements.
F-65
Table of Contents
Union Agriculture Group Corp.
Notes to the Consolidated Financial Statements (Continued)
(All amounts in US$, except shares and per share data and as otherwise indicated)
| 12. | Financial instruments by category (continued) |
As of and for the year ended June 30, 2010, the financial instruments recognized at fair value on the statement of financial position comprise only equity investments held for trading.
In the case of Level 1, valuation is based on unadjusted quoted prices in active markets for identical financial assets that the Group can refer to at the date of the statement of financial position. A market is deemed active if transactions take place with sufficient frequency and in sufficient quantity for price information to be available on an ongoing basis. Since a quoted price in an active market is the most reliable indicator of fair value, this should always be used if available. The financial instruments the Group has allocated to this level comprise equity investments held for trading, for which quoted prices in active markets are available.
In the case of Level 2, financial instruments are valued using models based on observable market data. In the case of Level 3, the Group uses valuation techniques not based on inputs observable in the market. This is only permissible insofar as no observable market data are available. The inputs used reflect the Group’s assumptions regarding the factors which market players would consider in their pricing. The Group uses the best available information for this, including internal company data. The Group does not have financial instruments allocated to either level 2 or 3 for any of the periods presented.
| 13. | Trade and other receivables, net |
| June 30, 2010 | June 30, 2009 | June 30, 2008 | ||||||||||
Non current | ||||||||||||
Advances to suppliers | — | 97,295 | — | |||||||||
Non current portion | — | 97,295 | — | |||||||||
Current | ||||||||||||
Trade receivables | 1,398,927 | — | — | |||||||||
Loans (i) | 2,579,927 | 818,291 | — | |||||||||
Advances for the payments of land underPromesas (ii) | 2,926,910 | — | 40,303 | |||||||||
Value added tax credits | 1,298,964 | 285,000 | 115,367 | |||||||||
Receivables with shareholders (iii) | — | 266,999 | — | |||||||||
Other receivables | 124,334 | 17,305 | 188,095 | |||||||||
Current portion | 8,329,062 | 1,387,595 | 343,765 | |||||||||
Total trade and other receivables, net | 8,329,062 | 1,484,890 | 343,765 | |||||||||
| (i) | As of June 30, 2010, the balance relates to the outstanding amounts under three Uruguayan-peso (UR$) denominated loans granted to Socur S.A., an unrelated third party engaged in consumer loan origination activities, as follows: (i) US$ 0.4 million (principal plus accrued interest) related to a loan dated July 2009 for UR$ 39.7 million (equivalent to US$ 1.7 million) bearing interest at a fixed rate of 27% per annum and due July 2010 (this loan was collected in full at maturity); (ii) US$ 0.4 million (principal plus accrued interest) related to a loan dated February 2010 for UR$ 8.6 million (equivalent to US$ 0.5 million) bearing interest at a fixed rate of 20% per annum and due February 2011 (this loan was collected in full at maturity); |
The accompanying notes are an integral part of these consolidated financial statements.
F-66
Table of Contents
Union Agriculture Group Corp.
Notes to the Consolidated Financial Statements (Continued)
(All amounts in US$, except shares and per share data and as otherwise indicated)
| 13. | Trade and other receivables, net (continued) |
| and (iii) a US$ 1.9 million (principal plus accrued interest) related to a loan dated May 2010 for UR$ 38.6 million (equivalent to US$ 2.0 million) bearing interest at a fixed rate of 16.5% per annum and due May 2011. As of June 30, 2009, the balance relates to one US dollar denominated loan to Socur S.A. dated April 2009. This loan accrued interest at a fixed rate of 13.5% per annum and was collected in full in April 2010. The loans are collateralized by certain receivables of Socur S.A. and include customary covenants. The Group granted these loans as part of its treasury activity in order to profit from surplus funds at attractive interest rates. |
| (ii) | As of June 30, 2010, the balance relates to advanced payments for land underPromesastotaling approximately 10,700 hectares. These payments were held in escrow with a notary public until due diligence and other customary procedures were finalized. Once completed, the notary public releases the funds to the sellers. The payments for land underPromesaswere completed in July and September 2010. See Note 28 for additional details. |
| (iii) | Relates to issuance of shares for which contributions were received in July 2009. |
As of January 2, 2008, the Group did not have trade and other receivables.
The fair values of current trade and other receivables approximate their respective carrying amounts due to their short-term nature. The fair values of non-current other receivables approximate their carrying amount, as the impact of discounting is not significant.
The carrying amounts of the Group’s trade and other receivables are denominated in the following currencies (expressed in US dollars):
| June 30, 2010 | June 30, 2009 | June 30, 2008 | ||||||||||
Currency | ||||||||||||
US Dollar | 4,447,637 | 1,199,890 | 228,398 | |||||||||
Uruguayan Peso | 3,881,425 | 285,000 | 115,367 | |||||||||
| 8,329,062 | 1,484,890 | 343,765 | ||||||||||
As of June 30, 2010, 2009 and 2008, no classes within trade and other receivables were either past due or impaired.
The Group recognizes an allowance for trade receivables when there is objective evidence that the Group will not be able to collect all amounts due according to the original terms of the receivables. Delinquency in payments is an indicator that a receivable may be impaired. However, management considers all available evidence in determining when a receivable is impaired. Generally, trade receivables, which are more than 180 days past due are fully provided for. However, certain receivables 180+ days overdue may not be provided for based on a case-by-case analysis of credit quality. On the other hand, receivables, which are not 180+ days overdue, may be provided for if specific analysis indicates a potential impairment.
The maximum exposure to credit risk at the reporting date is the carrying value of each class of receivable mentioned above. The Group does not hold any collateral as security.
The accompanying notes are an integral part of these consolidated financial statements.
F-67
Table of Contents
Union Agriculture Group Corp.
Notes to the Consolidated Financial Statements (Continued)
(All amounts in US$, except shares and per share data and as otherwise indicated)
| 13. | Trade and other receivables, net (continued) |
As of June 30, 2010, none of the outstanding trade receivables are past due or impaired. The Group has a very limited operating history to date and its sales have been concentrated into a reduced group of external customers, especially for its cattle, sheep and rice businesses (See Note 4 for additional details). These customers were generally well-known companies in Uruguay.
As of June 30, 2010, approximately 87% of the outstanding unimpaired trade receivables (neither past due nor impaired) relate to sales to 2 well-known multinational companies with good credit quality standing. These entities or their parent companies are externally credit-rated. The Group reviews these external ratings from credit agencies. The remaining percentage as of June 30, 2010 of the outstanding unimpaired trade receivables relate to sales to customers for which external credit ratings may not be available. However, the total base of customers without an external credit rating is relatively stable. New customers with less than six months of history with the Group are closely monitored. The Group has not experienced credit problems with these new customers to date.
The Group expects to expand its customer base in the foreseeable future, especially upon selling crop and dairy products. The Group expects to sell its crop production to well-known multinational companies with external good credit ratings. However, some of the new customers may not be externally credit-rated. As part of its credit risk strategy, the Group will evaluate the credit standing of these customers and monitor them closely.
The following is the detail of the outstanding balance of trade receivables as of June 30, 2010 together with its aging analysis:
| June 30, 2010 | ||||
1 to 3 months | 1,173,151 | |||
3 to 6 months | 224,976 | |||
| 1,398,927 | ||||
| 14. | Inventories |
| June 30, 2010 | June 30, 2009 | June 30, 2008 | ||||||||||
Consumable supplies | 957,686 | 33,389 | — | |||||||||
Crops. | 779,834 | — | — | |||||||||
Others | 87,312 | — | — | |||||||||
| 1,824,832 | 33,389 | — | ||||||||||
As of January 2, 2008, the Group did not have inventories.
The cost of inventories recognized as expense and included in “Cost of agricultural produce and biological assets sold and services rendered” amounted to US$ 1,155,172 for the year ended June 30, 2010 (2009: US$ 11,718; 2008: nil).
The accompanying notes are an integral part of these consolidated financial statements.
F-68
Table of Contents
Union Agriculture Group Corp.
Notes to the Consolidated Financial Statements (Continued)
(All amounts in US$, except shares and per share data and as otherwise indicated)
| 15. | Equity-settled share-based payments |
The Group has a “2008 Stock Option Plan”, under which the Group grants equity-settled options to senior managers and selected employees of the Group’s subsidiaries.
In addition, the Group has granted equity-settled options to selling agents who assisted the Group in connection with its capital raising activities through private placements. Options granted to selling agents during 2008 and 2009 are collectively referred to as the “2008/2009 Broker Compensation Options” and options granted to selling agents during 2010 are collectively referred to as the “2010 Broker Compensation Options”. The 2008/2009 Broker Compensation Options, the 2010 Broker Compensation Options and the 2008 Stock Option Plan are collectively referred hereinafter as the “Option Schemes”.
The Group incurred a charge of US$ 1.0 million for 2010 (2009: US$ 2.3 million; 2008: US$ 0.1 million) related to the options granted under the Option Schemes. For the year ended June 30, 2010, an amount of US$ 0.01 million was recognized as an expense in the income statement (2009: US$ 0.3 million; 2008: nil), and an amount of US$ 1.0 million was deducted from equity as transaction costs directly attributable to the capital issuances (2009: US$ 2.0 million; 2008: US$ 0.1 million).
The fair value of the Option Schemes was measured at the date of grant using the Black-Scholes valuation technique. This valuation model takes into account factors such as non transferability, expected volatility, exercise restrictions and behavioral considerations among others.
Key grant-date fair value and other assumptions under the Option Schemes are detailed below:
| Grant Date | June 2008 | July 2008 | July 2008 | June 2009 | August 2009 | August 2009 | March 2010 | March 2010 | ||||||||||||||||||||||||
Expected volatility | 31 | % | 31 | % | 34 | % | 64 | % | 48 | % | 44 | % | 35 | % | 32 | % | ||||||||||||||||
Expected life | 2.50 | 2.50 | 1.00 | 1.00 | 2.50 | 3.13 | 1.00 | 1.00 | ||||||||||||||||||||||||
Risk free rate | 2.80 | % | 2.82 | % | 2.30 | % | 0.47 | % | 1.34 | % | 1.61 | % | 0.39 | % | 0.44 | % | ||||||||||||||||
Expected dividend yield | 0 | % | 0 | % | 0 | % | 0 | % | 0 | % | 0 | % | 0 | % | 0 | % | ||||||||||||||||
Fair value per option | $ | 0.22 | $ | 0.31 | $ | 0.21 | $ | 0.36 | $ | 0.43 | $ | 0.45 | 0.24 | 0.22 | ||||||||||||||||||
Possibility of ceasing employment before vesting | 0 | % | 0 | % | 0 | % | 0 | % | 0 | % | 0 | % | 0 | % | 0 | % | ||||||||||||||||
Exercise price | $ | 1 | $ | 1.4 | $ | 1.4 | $ | 1.4 | $ | 1.4 | $ | 1.4 | $ | 1.7 | $ | 1.7 | ||||||||||||||||
Since the Group’s shares are not publicly traded expected volatility was determined by calculating the historical volatility of share prices of comparable entities in representative stock markets. The expected life used in the model has been adjusted, based on management’s best estimate, for the effects of non-transferability, exercise restrictions and behavioral considerations.
Details of each plan or agreement are as follows:
The 2008 Stock Option Plan
This plan was effectively established in the fiscal year ended June 30, 2008 and is administered by the Board of Directors of the Group. Options under the 2008 Stock Option Plan vest immediately at the grant date, or
The accompanying notes are an integral part of these consolidated financial statements.
F-69
Table of Contents
Union Agriculture Group Corp.
Notes to the Consolidated Financial Statements (Continued)
(All amounts in US$, except shares and per share data and as otherwise indicated)
| 15. | Equity-settled share-based payments (continued) |
over a two-year period from the date of grant at 25% every six months. Options are exercisable over a five-year period. The exercise price of the options is determined by the Board of Directors but under no circumstances may the price be less than 100% of the fair market value of the shares at the date of grant. For this plan, there are no performance requirements for the exercising of options, except that a participant’s employment with the Group must not have been terminated prior to the date of exercise of the relevant option. If the participant ceases to be an employee for any cause, options held by the participant will cease to be exercisable within a period of 30 days after ceasing employment. In addition, if the participant ceases to be an employee for reason of death, any portion of the share option held by he or she that has vested on that date may be exercised by his or her legal representative for a period determined by the Board of Directors in each case.
Movements in the number of equity-settled options outstanding and their related weighted average exercise prices under the 2008 Stock Option Plan are as follows:
| June 30, 2010 | June 30, 2009 | June 30, 2008 | ||||||||||||||||||||||
| Average exercise price per share | Options | Average exercise price per share | Options | Average exercise price per share | Options | |||||||||||||||||||
At beginning of period | 1.38 | 5,081,406 | 1.00 | 250,000 | — | — | ||||||||||||||||||
Granted | 1.40 | 440,000 | 1.40 | 4,831,406 | 1.00 | 250,000 | ||||||||||||||||||
Forfeited | — | — | — | — | — | — | ||||||||||||||||||
Exercised | 1.00 | (250,000 | ) | — | — | — | — | |||||||||||||||||
Expired | — | — | — | — | — | — | ||||||||||||||||||
At period end | 1.40 | 5,271,406 | 1.38 | 5,081,406 | 1.00 | 250,000 | ||||||||||||||||||
Options outstanding at year end under the 2008 Stock Option Plan have the following expiry date and exercise prices:
| Exercise price per share | Shares | |||||||||||||||
| 2010 | 2009 | 2008 | ||||||||||||||
Expiry date: | ||||||||||||||||
June 9, 2013 | 1.00 | — | 250,000 | 250,000 | ||||||||||||
July 7, 2013 | 1.40 | 4,831,406 | 4,831,406 | — | ||||||||||||
August 18, 2014 | 1.40 | 440,000 | — | — | ||||||||||||
2008/2009 Broker Compensation Options
These options were granted to selling agents who assisted the Group in connection with its private placements during 2008 and 2009. These options vested immediately at the date of grant and are exercisable over a two-year period.
The exercise price of the options was determined by the Board of Directors but under no circumstances the price was less than 100% of the fair market value of the shares at the date of grant. No performance requirements for the exercising of options were required.
The accompanying notes are an integral part of these consolidated financial statements.
F-70
Table of Contents
Union Agriculture Group Corp.
Notes to the Consolidated Financial Statements (Continued)
(All amounts in US$, except shares and per share data and as otherwise indicated)
| 15. | Equity-settled share-based payments (continued) |
Movements in the number of equity-settled options outstanding and their related weighted average exercise prices under the 2008/2009 Broker Compensation Options are as follows:
| June 30, 2010 | June 30, 2009 | |||||||||||||||
| Average exercise price per share | Options | Average exercise price per share | Options | |||||||||||||
At beginning of year | 1.40 | 3,040,647 | — | — | ||||||||||||
Granted | — | — | 1.40 | 3,040,647 | ||||||||||||
Forfeited | — | — | — | — | ||||||||||||
Exercised | 1.40 | (562,497 | ) | — | — | |||||||||||
Expired | — | — | — | — | ||||||||||||
At year end | 1.40 | 2,478,150 | 1.40 | 3,040,647 | ||||||||||||
Options outstanding at year end under the 2008/2009 Broker Compensation Options have the following expiry date and exercise prices:
| Exercise price per share | Shares | |||||||||||
| 2010 | 2009 | |||||||||||
Expiry date: | ||||||||||||
July 22, 2010 | 1.40 | 1,687,491 | 2,249,988 | |||||||||
June 25, 2011 | 1.40 | 790,659 | 790,659 | |||||||||
2010 Broker Compensation Options
These options were granted to selling agents who assisted the Group in connection with its private placements during 2010. These options vested immediately at the date of grant and are exercisable over a two-year period. The exercise price of the options was determined by the Board of Directors but under no circumstances the price was less than 100% of the fair market value of the shares at the date of grant. No performance requirements for the exercising of options were required.
Movements in the number of equity-settled options outstanding and their related weighted average exercise prices under the 2010 Broker Compensation Options are as follows:
| June 30, 2010 | ||||||||
| Average exercise price per share | Options | |||||||
At beginning of year | — | — | ||||||
Granted | 1.70 | 3,364,748 | ||||||
Forfeited | — | — | ||||||
Exercised | — | — | ||||||
Expired | — | — | ||||||
At year end | 1.70 | 3,364,748 | ||||||
The accompanying notes are an integral part of these consolidated financial statements.
F-71
Table of Contents
Union Agriculture Group Corp.
Notes to the Consolidated Financial Statements (Continued)
(All amounts in US$, except shares and per share data and as otherwise indicated)
| 15. | Equity-settled share-based payments (continued) |
Options outstanding at year-end under the 2010 Broker Compensation Options have the following expiry date and exercise prices:
| Exercise price per share | Shares | |||||||
| 2010 | ||||||||
Expiry date: | ||||||||
March 8, 2012 | 1.70 | 3,143,328 | ||||||
March 30, 2012 | 1.70 | 221,420 | ||||||
The following table shows the exercisable shares at year-end under the Option Schemes:
| Exercisable shares | ||||
2010 | 11,084,304 | |||
2009 | 8,122,053 | |||
2008 | 250,000 | |||
| 16. | Legal and other reserves |
According to the laws of Uruguay, 5% of the profit of the year is separated to constitute legal reserves until they reach legal capped amounts (20% of total capital). These legal reserves are not available for dividend distribution and can only be released to absorb losses.
In addition, from time to time, the subsidiaries of the Group may separate portions of their profits of the year to constitute voluntary reserves according to company law and practice. These voluntary reserves may be released for dividend distribution.
As of June 30, 2010, 2009 and 2008 and January 2, 2008, the Group did not constitute legal or other reserves.
| 17. | Trade and other payables |
| June 30, 2010 | June 30, 2009 | June 30, 2008 | ||||||||||
Current | ||||||||||||
Trade payables | 610,210 | 117,161 | 18,246 | |||||||||
Amounts due to related parties (Note 27) | — | 811,997 | — | |||||||||
Taxes payable (i) | 1,844,706 | 258,748 | 4,904 | |||||||||
Amounts due to private investors | — | 464,548 | — | |||||||||
Other payables | 80,132 | 73,710 | 103,978 | |||||||||
Total trade and other payables | 2,535,048 | 1,726,164 | 127,128 | |||||||||
| (i) | Mainly comprise Net Worth Tax payable as of year-end. See note 20 for details. |
The accompanying notes are an integral part of these consolidated financial statements.
F-72
Table of Contents
Union Agriculture Group Corp.
Notes to the Consolidated Financial Statements (Continued)
(All amounts in US$, except shares and per share data and as otherwise indicated)
| 17. | Trade and other payables (continued) |
As of January 2, 2008, the Group did not have trade and other payables.
The fair values of current trade and other payables approximate their respective carrying amounts due to their short-term nature.
| 18. | Taxation |
The Company is incorporated under the International Business Companies Act of the British Virgin Islands and accordingly, is exempted from payment of British Virgin Island’s income taxes. Accordingly, the Group’s tax expense comprises the charge for tax currently payable or deferred attributable to the Group’s subsidiaries in their taxable jurisdiction, which is limited to Uruguay as of the date of these financial statements. Tax is recognized in the statement of comprehensive income, except to the extent that it relates to items recognized directly in equity, in which case, it is also recognized in equity.
The operating subsidiaries in Uruguay are required to calculate and file their income tax returns on a separate basis rather than preparing a consolidated tax return. Therefore, operating subsidiaries are not allowed to offset income from one subsidiary with losses from another subsidiary.
The details of the provision for the Group’s income tax are as follows:
| June 30, 2010 | June 30, 2009 | June 30, 2008 | ||||||||||
Current income tax | — | — | — | |||||||||
Deferred income tax | (81,643 | ) | (157,614 | ) | (5,249 | ) | ||||||
Income tax expense | (81,643 | ) | (157,614 | ) | (5,249 | ) | ||||||
The statutory income tax rate in Uruguay for all of the years presented has been 25%.
Deferred tax assets and liabilities of the Group as of June 30, 2010, 2009 and 2008 will be recovered as follows:
| June 30, 2010 | June 30, 2009 | June 30, 2008 | ||||||||||
Deferred income tax asset to be recovered after more than 12 months | 340,502 | 11,096 | — | |||||||||
Deferred income tax asset to be recovered within 12 months | — | — | — | |||||||||
Deferred income tax assets | 340,502 | 11,096 | — | |||||||||
| June 30, 2010 | June 30, 2009 | June 30, 2008 | ||||||||||
Deferred income tax liabilities to be recovered after more than 12 months | — | — | 10,694 | |||||||||
Deferred income tax liabilities to be recovered within 12 months | 590,453 | 179,404 | — | |||||||||
Deferred income tax liabilities | 590,453 | 179,404 | 10,694 | |||||||||
The accompanying notes are an integral part of these consolidated financial statements.
F-73
Table of Contents
Union Agriculture Group Corp.
Notes to the Consolidated Financial Statements (Continued)
(All amounts in US$, except shares and per share data and as otherwise indicated)
| 18. | Taxation (continued) |
The gross movement on the deferred income tax account is as follows:
| June 30, 2010 | June 30, 2009 | June 30, 2008 | ||||||||||
Beginning of year/ period | (168,308 | ) | (10,694 | ) | — | |||||||
Formation of the Group (Note 25) | — | — | (2,178 | ) | ||||||||
Acquisition of subsidiaries (Note 25) | — | — | (3,267 | ) | ||||||||
Income tax expense | (81,643 | ) | (157,614 | ) | (5,249 | ) | ||||||
End of year/ period | (249,951 | ) | (168,308 | ) | (10,694 | ) | ||||||
The movement in the deferred income tax assets and liabilities during the year, without taking into consideration the offsetting of balances within the same tax jurisdiction, is as follows:
Deferred income tax assets | Property, plant and equipment | Equity- settled share- based compensation | Total | |||||||||
At January 2, 2008 | — | — | — | |||||||||
Credited to the statement of comprehensive income | — | — | — | |||||||||
At June 30, 2008 | — | — | — | |||||||||
Credited to the statement of comprehensive income | 11,096 | — | 11,096 | |||||||||
At June 30, 2009 | 11,096 | — | 11,096 | |||||||||
Credited to the statement of comprehensive income | 259,218 | 70,188 | 329,406 | |||||||||
At June 30, 2010 | 270,314 | 70,188 | 340,502 | |||||||||
Deferred income tax liabilities | Property, plant and equipment | Biological assets | Total | |||||||||
At January 2, 2008 | — | — | — | |||||||||
Formation of the Group | 2,178 | — | 2,178 | |||||||||
Acquisition of subsidiaries | 3,267 | — | 3,267 | |||||||||
Charged to the statement of comprehensive income | 5,249 | — | 5,249 | |||||||||
At June 30, 2008 | 10,694 | — | 10,694 | |||||||||
Charged to the statement of comprehensive income | 76,113 | 92,597 | 168,710 | |||||||||
At June 30, 2009 | 86,807 | 92,597 | 179,404 | |||||||||
(Credited)/ charged to the statement of comprehensive income | (86,807 | ) | 497,856 | 411,049 | ||||||||
At June 30, 2010 | — | 590,453 | 590,453 | |||||||||
The accompanying notes are an integral part of these consolidated financial statements.
F-74
Table of Contents
Union Agriculture Group Corp.
Notes to the Consolidated Financial Statements (Continued)
(All amounts in US$, except shares and per share data and as otherwise indicated)
| 18. | Taxation (continued) |
Deferred income tax assets are recognized for tax loss carry-forwards to the extent that the realization of the related tax benefits through future taxable profits is probable. As of June 30, 2010, the tax loss carry-forwards of the Group amount to US$ 9.7 million. The expiration date of these tax loss carry-forwards is as follows:
Tax loss carry-forwards | Date of generation | Date of expiration | ||||||
103,125 | 2008 | 2013 | ||||||
1,893,737 | 2009 | 2014 | ||||||
7,676,319 | 2010 | 2015 | ||||||
The Group will have to generate future taxable income in Uruguay to fully realize the deferred tax assets related to the tax operating losses. The Group did not recognize deferred tax assets relating to any carry forward losses of US$ 9.7 million (2009: US$ 2.0 million). Although management believes that it will become profitable in the foreseeable future, as a result of the history of recent losses incurred during the development phase of the different Group’s business operations and the lack of verifiable and objective evidence due to the limited operating history of the Group itself, the Board of Directors has determined that there is sufficient uncertainty as to the generation of sufficient income to utilize the losses within a reasonable timeframe, therefore, no deferred tax asset is recognized in relation to these losses.
The tax on the Group’s profit before tax differs from the theoretical amount that would arise using the weighted average tax rate applicable to profits of the consolidated entities as follows:
| June 30, 2010 | June 30, 2009 | June 30, 2008 | ||||||||||
Loss before income tax | (276,795 | ) | (2,519,989 | ) | (111,023 | ) | ||||||
Statutory income tax rate in Uruguay | 25 | % | 25 | % | 25 | % | ||||||
Tax calculated at the statutory income tax rate in Uruguay | (69,199 | ) | (629,997 | ) | (27,756 | ) | ||||||
Tax effects of: | ||||||||||||
Non-deductible items | 2,943,542 | 1,096,614 | 32,911 | |||||||||
Non-taxable items | (747,860 | ) | (71,315 | ) | — | |||||||
Inflation adjustment for tax purposes | 440,401 | 164,356 | 25,875 | |||||||||
Equity settlement share-based compensation | (66,946 | ) | 71,398 | — | ||||||||
Unrecognized tax losses | (2,418,295 | ) | (473,442 | ) | (25,781 | ) | ||||||
Income tax expense | 81,643 | 157,614 | 5,249 | |||||||||
The accompanying notes are an integral part of these consolidated financial statements.
F-75
Table of Contents
Union Agriculture Group Corp.
Notes to the Consolidated Financial Statements (Continued)
(All amounts in US$, except shares and per share data and as otherwise indicated)
| 19. | Sales of agricultural produce and biological assets and services rendered |
| June 30, 2010 | June 30, 2009 | |||||||
Rice | 1,123,383 | — | ||||||
Cattle | 352,208 | 148,687 | ||||||
Wool | 83,864 | — | ||||||
Honey | 11,808 | 3,905 | ||||||
Services | 9,617 | — | ||||||
Blueberries (1) | — | 23,464 | ||||||
Live sheep | — | 23,338 | ||||||
Total sales | 1,580,880 | 199,394 | ||||||
| (1) | Blueberries sold during the year ended June 30, 2009, were harvested during November and December of 2008. |
The Group had no sales during the period ended June 30, 2008.
| 20. | Expenses by nature |
The Group presented the statement of comprehensive income under the function of expense method. Under this method, expenses are classified according to their function as part of the line items “cost of production”, “cost of agricultural produce and biological assets sold and services rendered”, “general and administrative expenses” and “selling expenses”.
The accompanying notes are an integral part of these consolidated financial statements.
F-76
Table of Contents
Union Agriculture Group Corp.
Notes to the Consolidated Financial Statements (Continued)
(All amounts in US$, except shares and per share data and as otherwise indicated)
| 20. | Expenses by nature (continued) |
The following table provides the additional disclosure required on the nature of expenses and their relationship to the function within the Group:
| June 30, 2010 | June 30, 2009 | June 30, 2008 | ||||||||||
Salaries and social security expenses | 1,672,350 | 1,177,435 | 33,899 | |||||||||
Net worth tax (*) | 1,691,062 | 228,071 | 1,282 | |||||||||
Changes in biological assets and agricultural produce | 1,566,670 | 157,772 | — | |||||||||
Consumable supplies | 998,405 | 271,858 | 6,788 | |||||||||
Contracted services | 708,211 | — | 25,374 | |||||||||
Maintenance and repairs | 339,136 | 108,684 | 10,436 | |||||||||
Fuel and lubricants | 292,636 | 77,239 | 4,254 | |||||||||
Depreciation and amortization | 228,870 | 69,518 | 12,647 | |||||||||
Other taxes | 208,657 | 156,611 | 135 | |||||||||
Fees for services | 197,385 | 201,147 | 7,571 | |||||||||
Freights | 176,142 | 84,554 | 93 | |||||||||
Travel expenses | 147,435 | 71,133 | 4,765 | |||||||||
Insurance | 86,688 | 42,256 | 164 | |||||||||
Stationery and office supplies | 83,994 | 38,897 | 1,041 | |||||||||
Lease expense | 62,275 | 24,240 | — | |||||||||
Communications | 21,005 | 15,908 | 1,425 | |||||||||
Cost of services rendered | 7,213 | — | — | |||||||||
Others | 130,299 | 15,875 | 398 | |||||||||
Total expenses by nature | 8,618,433 | 2,741,198 | 110,272 | |||||||||
| (*) | All companies in Uruguay are subject to a Net Worth Tax, or theImpuesto al Patrimonio (IP) at a rate of 1.5% on the net worth of Uruguayan entities located in Uruguay. The IP is based on all the assets located or used economically in Uruguayan territory minus a short list of liabilities as established by law, including loans from local banks, certain debts with goods and service providers and import balances. |
| 21. | Salaries and social security expenses |
| June 30, 2010 | June 30, 2009 | June 30, 2008 | ||||||||||
Wages and salaries | 1,635,912 | 886,481 | 31,467 | |||||||||
Social security costs | 23,472 | 5,360 | 2,432 | |||||||||
Equity-settled share-based compensation | 12,966 | 285,594 | — | |||||||||
| 1,672,350 | 1,177,435 | 33,899 | ||||||||||
Number of employees | 148 | 100 | 32 | |||||||||
The accompanying notes are an integral part of these consolidated financial statements.
F-77
Table of Contents
Union Agriculture Group Corp.
Notes to the Consolidated Financial Statements (Continued)
(All amounts in US$, except shares and per share data and as otherwise indicated)
| 22. | Financial results, net |
| June 30, 2010 | June 30, 2009 | June 30, 2008 | ||||||||||
Finance income: | ||||||||||||
- Interest income | 664,137 | 653,411 | — | |||||||||
-Changes in fair value of financial assets at fair value through profit or loss | 178,495 | — | — | |||||||||
- Foreign exchange gains, net | 528,705 | — | — | |||||||||
Finance income | 1,371,337 | 653,411 | — | |||||||||
Finance costs: | ||||||||||||
- Interest expense | (520 | ) | (896 | ) | — | |||||||
- Foreign exchange losses, net | — | (864,642 | ) | (6,615 | ) | |||||||
Finance costs | (520 | ) | (865,538 | ) | (6,615 | ) | ||||||
Total financial results, net | 1,370,817 | (212,127 | ) | (6,615 | ) | |||||||
| 23. | Earnings per share |
Basic and diluted loss per share is calculated by dividing the loss attributable to equity holders of the Group by the weighted average number of shares in issue during the year.
| June 30, 2010 | June 30, 2009 | June 30, 2008 | ||||||||||
Loss attributable to equity holders of the Group | (336,833 | ) | (2,586,911 | ) | (107,549 | ) | ||||||
Weighted average number of shares in issue (*) | 15,816,989 | 8,476,708 | 287,917 | |||||||||
Basic and diluted losses per share | (0.021 | ) | (0.305 | ) | (0.374 | ) | ||||||
| (*) | For all periods presented, the weighted-average number of shares in issue was restated to give effect to the consolidation of the common shares of the Group on the basis of a ratio of one post-consolidation common share for every six pre-consolidation common shares (see Note 28 for details). |
Diluted net loss per share is computed by dividing the net loss for the period by the weighted average number of common shares outstanding, and when dilutive, adjusted for the effect of all potentially dilutive shares, including share options, on an as-if converted basis. For all periods presented, there were no differences in the weighted-average number of common shares used for basic and diluted net loss per share as the effect of all potentially dilutive shares outstanding was anti-dilutive. As of June 30, 2010, there were 11.1 million (2009: 13.0 million and 2008: 0.3 million) share options outstanding that could potentially have a dilutive impact in the future but were antidilutive in all periods presented.
The accompanying notes are an integral part of these consolidated financial statements.
F-78
Table of Contents
Union Agriculture Group Corp.
Notes to the Consolidated Financial Statements (Continued)
(All amounts in US$, except shares and per share data and as otherwise indicated)
| 24. | Disclosure of leases |
The Group as lessee
Operating leases:
In November 2009, the Group entered into an agreement to lease its corporate headquarters under a cancellable operating lease with Woodport Limited, a company related to Juan Sartori, Executive Chairman, Director and shareholder of the Group. The agreement was effective as from the date the Group began using the property, which occurred in May 2010. The lease calls for fixed monthly payments for the first two years plus a 5% increase through its expiration in May 2015. Rental expense under this lease was US$ 29,282 for the year ended June 30, 2010. Prior to May 2010, the Group leased its corporate offices under a cancellable operating lease from an unrelated party, which was terminated upon relocating to the new premises. Rental expense under this lease for the year ended June 30, 2009 was US$ 24,000 and for the ten-month period from July 1, 2009 through April 30, 2010 was US$ 20,000. As of June 30, 2010, the future minimum lease payments under this cancellable operating lease are as follows: US$ 175,692 in 2011; US$ 177,156 in 2012; US$ 184,477 in 2013; US$ 184,477 in 2014; and US$ 153,731 in 2015.
As from September 2009, the Group leases land for crop cultivation. The leases have an average term of a crop year. Under the lease agreements, rent accrues generally at the time of harvest and is payable at the end of the crop year. The Group makes payments based on the market value of soybean and rice multiplied by a fixed amount of tons per hectare leased. Rental expense was US$ 12,993 for the year ended June 30, 2010.
Finance leases:
The Group leases certain ancillary farming assets and vehicles under various finance leases maturing between July 2011 and January 2012. The net book value of these assets under finance leases amounts to US$ 20,760 and US$ 26,296 as of June 30, 2010 and 2009. The Group did not enter into finance leases during the period ended June 30, 2008.
At the commencement of the lease term, the Group recognizes a lease liability equal to the carrying amount of the leased asset. In subsequent periods, the liability decreases by the amount of lease payments made to the lessors using the effective interest method. The interest component of the lease payments is recognized in the statement of comprehensive income.
Gross finance lease liabilities—minimum lease payments:
| June 30, 2010 | June 30, 2009 | |||||||
Non-current | ||||||||
Not later than one year | 4,916 | 4,371 | ||||||
Later than one year and not later than five years | 2,649 | 9,515 | ||||||
| 7,565 | 13,886 | |||||||
Future finance charges on finance leases | (635 | ) | (1,937 | ) | ||||
Present value of finance lease liabilities | 6,930 | 11,949 | ||||||
The accompanying notes are an integral part of these consolidated financial statements.
F-79
Table of Contents
Union Agriculture Group Corp.
Notes to the Consolidated Financial Statements (Continued)
(All amounts in US$, except shares and per share data and as otherwise indicated)
| 24. | Disclosure of leases (continued) |
The present value of finance lease liabilities is as follows:
| June 30, 2010 | June 30, 2009 | |||||||
Not later than one year | 4,562 | 4,056 | ||||||
Later than one year and not later than five years | 2,368 | 7,893 | ||||||
| 6,930 | 11,949 | |||||||
The Group as lessor
Operating leases:
On November 24, 2009, the Group entered into a non-cancelable operating lease agreement with SAMAN (the “Paso Manzagano Plant Agreement”) pursuant to which the Group leases a rice mill, storage facilities and warehousing spaces to SAMAN. The Paso Manzagano Plant Agreement has an initial term of three years, which term is automatically renewable for 3-year periods unless terminated by either party with one year prior notice. Under the Paso Manzagano Plant Agreement, the Group will receive an annual fixed payment of US$ 40,000 during the first year of the agreement and US$ 75,000 for the second and third year plus a variable payment of US$5 for every ton of rice milled. The fixed payment is adjusted 12.5% at the inception of every three-year period. Under the Paso Manzagano Plant Agreement, SAMAN agreed to invest in order to improve and expand the leased facilities. The Group is not obliged to reimburse any of the SAMAN investments. Both parties agreed that the SAMAN investments have an estimated useful life of 10 years and intend to maintain the Paso Manzagano Plant Agreement until the end of such period. In case the lease is terminated before the 10-year period, the Group will receive the SAMAN investments for which it will have to pay an amount equivalent to the carrying amount of the SAMAN investments as of the date of termination. The SAMAN investments have been completed at a total cost of US$ 866,086 and are not recognized in the Group´s consolidated financial statements. Upon termination of the Paso Manzagano Plant Agreement at the tenth year (when the investments will reach the end of their useful lives), the Group will receive the SAMAN investments at no cost. Thus, the Group will not recognize any assets based on the definition of cost in IFRS. Additionally, pursuant to the Paso Manzagano Plant Agreement, the Group agreed to exclusively sell its entire rice production to SAMAN for the duration of the agreement. The exclusivity ceases upon termination of the agreement. Rental income under the Paso Manzagano Plant Agreement amounted to US$ 54,133 for the year ended June 30, 2010. Considering a lease term of 10 years, future minimum lease payments receivable under the Paso Manzagano Plant Agreement (excluding the variable portion) are as follows:
| June 30, 2010 | ||||
Not later than one year | 75,000 | |||
Later than one year and not later than five years | 328,125 | |||
Thereafter | 391,553 | |||
| 794,678 | ||||
The accompanying notes are an integral part of these consolidated financial statements.
F-80
Table of Contents
Union Agriculture Group Corp.
Notes to the Consolidated Financial Statements (Continued)
(All amounts in US$, except shares and per share data and as otherwise indicated)
| 24. | Disclosure of leases (continued) |
Finance leases:
The Group does not act as a lessor in connection with finance leases.
| 25. | Business combinations |
The Company was incorporated in the British Virgin Islands on January 2, 2008 (date of inception) as a vehicle to pursue a business combination through the acquisition of two pre-existing blueberry businesses, namely Boisy S.A. (“Boisy”) and Vadolmar S.A. (“Vadolmar”) in April 2008. The shareholders of Boisy (the “B shareholders”) and Vadolmar (the “V shareholders”) agreed to join forces to benefit from sharing harvesting techniques and lower costs and other synergies and consolidation of two adjacent properties in Southern Uruguay into one single company. Moreover, the ultimate objective was also to attract new capital to continue investing in the agricultural sector.
The business combination of Boisy and Vadolmar was carried out by setting up a new entity (incorporated as Weitvil Holdings Inc. at the time of formation and its name subsequently changed to Union Agriculture Group Corp.). The Company issued 439,680 shares to the B shareholders and 740,285 shares to the V shareholders in exchange for the transfer of their respective shares in Boisy and Vadolmar (representing 100% ownership interest in both companies). The number of shares reflected the relative fair values of the entities before the combination.
Given that the Company has no economic substance, Vadolmar has been identified as the acquirer for accounting purposes following the guidance in IFRS 3 R. The business combination has been accounted for as a reorganization of Vadolmar with the Company and therefore using Vadolmar’s net book values at the time of the combination. On the other hand, Boisy has been accounted for using the acquisition method being Vadolmar the acquirer, and therefore recognizing Boisy’s (accounting acquiree) identifiable assets acquired and liabilities assumed at their fair value at the time of the acquisition.
Vadolmar’s net book value amounted to US$ 783,537 at the date of the combination.
The details of the net assets acquired of Boisy are as follows:
Purchase consideration: | ||||
Equity instruments issued ( 439,680 common shares) | 465,758 | |||
Total purchase consideration | 465,758 | |||
Fair value of net assets acquired | 465,758 | |||
Goodwill | — | |||
As a published price at the date of exchange did not exist for the common shares issued by the Company, the fair value of those equity instruments was estimated by reference to the proportional interest in the fair value of Boisy obtained.
The accompanying notes are an integral part of these consolidated financial statements.
F-81
Table of Contents
Union Agriculture Group Corp.
Notes to the Consolidated Financial Statements (Continued)
(All amounts in US$, except shares and per share data and as otherwise indicated)
| 25. | Business combinations (continued) |
The aggregate assets and liabilities of these Boisy and Vadolmar as of the date of the combination are as follows:
| Fair value Boisy | Book value Vadolmar | Total | ||||||||||
Cash and cash equivalents | 27,864 | 51,192 | 79,056 | |||||||||
Biological assets | 159,839 | 231,699 | 391,538 | |||||||||
Land underPromesas | 80,181 | 269,841 | 350,022 | |||||||||
Property, plant and equipment | 184,342 | 221,121 | 405,463 | |||||||||
Deferred tax liability | (899 | ) | (1,279 | ) | (2,178 | ) | ||||||
Working capital excluding current portion of biological assets | 14,431 | 10,963 | 25,394 | |||||||||
Net assets acquired | 465,758 | 783,537 | 1,249,295 | |||||||||
Vadolmar maintained their book records under standards other than IFRS prior to the acquisition by the Group. The carrying amounts of the net assets acquired in the “book value” column above were adjusted to IFRS by the Group prior to fair value adjustments.
In April 2008, the Company issued additional common shares to other unrelated shareholders who injected more capital into the Company. In order to expand its operation in the blueberry business in Uruguay, the Company used a portion of those proceeds to complete the acquisition of a 91% interest in Nogatir S.A. (“Nogatir”) and a 70% interest in Madalux S.A. (“Madalux”). These two entities were also engaged in the blueberry business.
The Nogatir and Madalux acquisitions represented an aggregate consideration of US$ 1.1 million (excluding transaction costs) payable in cash. The Group accounted for these two acquisitions using the purchase method under IFRS 3 R.
The details of the net assets acquired and goodwill of the Nogatir and Madalux acquisitions are as follows:
Purchase consideration: | ||||
Cash paid | 1,127,000 | |||
Total purchase consideration | 1,127,000 | |||
Fair value of net assets acquired | 746,932 | |||
Goodwill | 380,068 | |||
Goodwill generated on the acquisitions was mainly attributed to the Group’s expected benefits from diversification and expansion into high-yield potential farmland properties. None of the goodwill recognized is expected to be deductible for income tax purposes.
The accompanying notes are an integral part of these consolidated financial statements.
F-82
Table of Contents
Union Agriculture Group Corp.
Notes to the Consolidated Financial Statements (Continued)
(All amounts in US$, except shares and per share data and as otherwise indicated)
| 25. | Business combinations (continued) |
The aggregate assets and liabilities of these acquisitions as of their respective dates of acquisition are as follows:
| Fair value (Nogatir and Madalux) | Book value (Nogatir and Madalux) | |||||||
Cash and cash equivalents | 62,468 | 62,468 | ||||||
Biological assets | 333,534 | 333,534 | ||||||
Land underpromesas | 362,887 | 271,875 | ||||||
Property, plant and equipment | 132,483 | 99,256 | ||||||
Deferred tax liability | (3,267 | ) | (1,864 | ) | ||||
Working capital excluding current portion of biological assets | 476 | 476 | ||||||
Net assets | 888,581 | 765,745 | ||||||
Non controlling interest | (141,649 | ) | (132,619 | ) | ||||
Net assets acquired | 746,932 | 633,126 | ||||||
The acquired entities maintained their book records under standards other than IFRS prior to the acquisition by the Group. The carrying amounts of the net assets acquired in the “book value” column above were adjusted to IFRS by the Group prior to fair value adjustments.
All of these businesses described above (the Boisy and Vadolmar combination and the acquisitions of Nogatir and Madalux) generated no revenues for the period from acquisition through June 30, 2008. These businesses contributed net losses of US$ 0.1 million to the Group’s consolidated results for the period from inception through June 30, 2008. If these businesses had been acquired or combined on January 2, 2008, revenues would have remained unchanged and the loss before income tax would have been US$ 0.5 million for the period from inception through June 30, 2008. These amounts have been calculated using the Group’s accounting policies and by adjusting the results of the subsidiaries to reflect additional depreciation and amortization, as appropriate, that would have been charged assuming the fair value adjustments to net assets acquired had been applied as from January 2, 2008 together with any consequential tax effects.
In December 2009, the Group acquired the remaining non controlling interests in Madalux (30%) and Nogatir (9%) for an aggregate consideration of US$ 55,500 and US$ 35,820, respectively; becoming wholly-owned subsidiaries as of that date. The acquisitions of these non-controlling interests were treated as transactions with equity owners of the Group. Therefore, the difference of US$ 70,691 between the consideration paid and the share acquired of the carrying value of net assets of these subsidiaries was recorded in equity (share capital).
The Group did not complete any business combinations during the years ended June 30, 2009 and 2010. The Group completed payments for land underPromesasof large extensions during the years ended June 30, 2009 and 2010.
The accompanying notes are an integral part of these consolidated financial statements.
F-83
Table of Contents
Union Agriculture Group Corp.
Notes to the Consolidated Financial Statements (Continued)
(All amounts in US$, except shares and per share data and as otherwise indicated)
| 26. | Group companies |
The following table details the companies making up the Group as of each of June 30, 2010, 2009 and 2008. All companies are operating subsidiaries. All operating subsidiaries engage into agricultural and agricultural-related activities. All operating companies are incorporated in Uruguay where they operate. The Group does not have any associates or joint ventures in any of the periods indicated. The capital of all operating subsidiaries is represented by common shares only.
| 2010 | 2009 | 2008 | ||||||||||||
| Activity | Ownership percentage | Ownership percentage | Ownership percentage | |||||||||||
Operating companies (unless otherwise stated): | ||||||||||||||
Nogatir S.A. (i) | Farm owner | 100 | % | 91 | % | 91 | % | |||||||
Madalux S.A. (i) | Farm owner | 100 | % | 70 | % | 70 | % | |||||||
Vadolmar S.A. | Farm owner | 100 | % | 100 | % | 100 | % | |||||||
Boisy S.A. | Farm owner | 100 | % | 100 | % | 100 | % | |||||||
Rafilur S.A. | Farm owner | 100 | % | 100 | % | — | ||||||||
Union Agriculture Group S.A. (ii) | Farm management | 100 | % | 100 | % | — | ||||||||
Canteras Doradas S.A. | Farm owner | 100 | % | — | — | |||||||||
Aguacare S.A. | Farm owner | 100 | % | — | — | |||||||||
Alto Lucero S.A. | Farm owner | 100 | % | — | — | |||||||||
| (i) | Non controlling interest acquired in December 2009. |
| (ii) | Formerly Hermosísima S.A. |
The accompanying notes are an integral part of these consolidated financial statements.
F-84
Table of Contents
Union Agriculture Group Corp.
Notes to the Consolidated Financial Statements (Continued)
(All amounts in US$, except shares and per share data and as otherwise indicated)
| 27. | Related-party transactions |
The following is a summary of the balances and transactions with related parties:
Related party | Relationship | Description of transaction | Amount of transaction | Balance receivable (payable) | ||||||||||||||||||||||||
| June 30, 2010 | June 30, 2009 | June 30, 2008 | June 30, 2010 | June 30, 2009 | June 30, 2008 | |||||||||||||||||||||||
| Union Capital Management Ltd. | (ii) | Payables (Note 17) | — | — | — | — | (811,997 | ) | — | |||||||||||||||||||
| Equity placement fees (*) | (3,619,292 | ) | (811,997 | ) | — | — | — | — | ||||||||||||||||||||
| Stock options compensation (*) | (107,242 | ) | — | — | — | — | — | |||||||||||||||||||||
| Union Capital Holding S.A. | (i) | Stock options compensation (*) | (42,836 | ) | (229,954 | ) | (13,938 | ) | — | — | — | |||||||||||||||||
| Vi Capital Investment | (iii) | Stock options compensation (*) | (131,295 | ) | (66,249 | ) | — | — | — | — | ||||||||||||||||||
| Woodport Limited | (iv) | Operating lease (**) | (29,282 | ) | — | — | — | — | — | |||||||||||||||||||
| Management and selected employees | Employment | Wages and salaries (**) | (585,993 | ) | (319,709 | ) | (23,354 | ) | (78,701 | ) | (32,425 | ) | (2,836 | ) | ||||||||||||||
| Stock options compensation (***) | (141,473 | ) | (1,331,005 | ) | (41,813 | ) | — | — | — | |||||||||||||||||||
| (i) | Union Capital Holding S.A., a Luxembourg-based company, or UCH, is a company controlled by the Company´s Chairman, director and shareholder, Juan Sartori. |
| (ii) | Union Capital Management Ltd. is a wholly-owned subsidiary of UCH. |
| (iii) | Vi Capital Investment is a company controlled by the Company’s Chairman, director and shareholder, Juan Sartori. |
| (iv) | A BVI-based real estate entity controlled by the Company´s Chairman, director and shareholder, Juan Sartori. |
| (*) | Amount deducted from share capital. |
| (**) | Income/ (loss) included in the statement of comprehensive income. |
| (***) | For the year ended June 30, 2010, an amount of US$ 128,508 was deducted from share capital (2009: US$ 1,045,412; 2008: US$ 41,813) and an amount of US$ 12,965 was charged to the statement of comprehensive income (2009: US$ 285,593; 2008: nil). |
| 28. | Events after the date of the statement of financial position |
Private placement
On February 25, 2011, the Company completed a private placement by issuing an aggregate of 75,027,227 shares of common stock at a price of US$ 2.20 per share, for gross proceeds to the Company of US$ 165,059,899.
In connection with the closing of the private placement, the Company paid finders’ fees in an amount of US$ 8,564,788, representing 5 % of the gross proceeds raised in the private placement.
The accompanying notes are an integral part of these consolidated financial statements.
F-85
Table of Contents
Union Agriculture Group Corp.
Notes to the Consolidated Financial Statements (Continued)
(All amounts in US$, except shares and per share data and as otherwise indicated)
| 28. | Events after the date of the statement of financial position (continued) |
The proceeds from the private placement will be used for payments of land underPromesas in Uruguay. As a result of the closing of the private placement, there are 219,890,431 common shares of the Company issued and outstanding as of the date of these financial statements.
Payments for land underPromesas
Between July 2010 and June 2011, the Group entered into severalPromesas for land totalling approximately 50,384 hectares. The land underPromesaswill primarily be used for cattle, sheep and crops activities. The Group paid an aggregate US$ 160.5 million for thesePromesas. The Group used existing cash and a portion of the proceeds from the private placement completed in February 2011 to pay for them.
Equity-settled share-based payments
Between July and August 2010, the Group granted 6,500,000 equity-settled options under the 2008 Stock Option Plan. These options vest immediately at the grant date, or over a four-year period from the date of grant at 25% every year. Options are exercisable over a five-year period at an exercise price per share of US$ 1.70.
In addition, in January 2011 the Group granted 5,225,000 equity-settled options under the 2008 Stock Option Plan. These options vest immediately at the grant date, or over a four-year period from the date of grant at 25% every year. Options are exercisable over a five-year period at an exercise price per share of US$ 2.20.
Finally, between April 2011 and May 2011, 703,900 and 112,153 equity-settled options were exercised under the2008 Stock Option Plan and the2008/2009 Broker Compensation Options, respectively. The Group issued 816,053 common shares and received proceeds from the issuance for a total amount of approximately US$ 1.1 million. In June 2011, the Group issued 558,789 common shares, upon the exercise of equity-settled options under the2008/2009 Broker Compensation Options, for a total amount of approximately US$ 0.8 million.
Productive Project Exceptions
In March 2011, Alto Lucero S.A., Rafilur S.A. Madalux S.A. and Union Agriculture Group S.A., wholly-owned subsidiaries of the Group, applied for governmental authorizations based on the Productive Project Exception to own 51,081 hectares of land acquired underPromesas, or the Third Productive Project. The authorization for the Third Productive Project is currently being reviewed and there is no fixed timing for the government to grant such authorization. The Group expects the process to take approximately 12 to 16 months.
On May 5, 2011, the Uruguayan government granted the Group authorization to own 17,846 hectares of land under the Second Productive Project. The Group will therefore execute the corresponding deeds of title according to standard administrative procedures under Uruguayan law. The Group expects to execute deeds of title no later than December 31, 2011. Once these deeds are executed, the Promesas will be reclassified to the land category within property, plant and equipment.
On June 27, 2011, the Group applied for an extension of the number of hectares under the Third Productive Project from 51,081 hectares to 66,645 hectares.
The accompanying notes are an integral part of these consolidated financial statements.
F-86
Table of Contents
Union Agriculture Group Corp.
Notes to the Consolidated Financial Statements (Continued)
(All amounts in US$, except shares and per share data and as otherwise indicated)
| 28. | Events after the date of the statement of financial position (continued) |
Amendment to the Articles of Association
On June 7, 2011, the Shareholders’ Meeting approved the amendment of the Articles of Association of the Company to authorize to issue an unlimited number of preferred shares, without par value, the rights and preferences of which may be established by the Board of Directors.
2011 Equity Incentive Plan
On June 12, 2011, the Group established the “2011 Equity Incentive Plan”, under which the Group may grant awards to employees, directors or consultants (the “Service Providers”). The awards may include incentive stock options, nonstatutory stock options, restricted stock, stock appreciation rights, restricted stock units, performance units and performance shares, among others. The plan is administered by the Board of Directors of the Group, or a committee appointed by the Board of Directors.
Line of credit
On June 14, 2011, UAG S.A., a subsidiary of the Group, entered into a US$ 10.0 million line of credit with Banco Itaú Uruguay S.A. (the “Line of credit”). The Line of credit bears a fixed interest rate of 4.5 % per annum and matures on October 31, 2011. The Line of credit contains certain restrictions, including the prohibition to sell or pledge assets of UAG S.A. without the lender’s consent, and the requirement that the Group’s borrowings do not exceed US$ 15.0 million. As of the date of these financial statements, no funds have been withdrawn under the Line of credit.
Reverse stock split
On June 7, 2011, a special Shareholders’ Meeting approved the consolidation of the outstanding common shares of the Group (the “Common Shares”) on the basis of a ratio to be selected and implemented by the Board of Directors at any time prior to the earlier of the Offering and December 31, 2011.
On June 23, 2011, the Board of Directors approved the consolidation of the Common Shares to be effected at a ratio of one post-consolidation common share for every six pre-consolidation common shares (the “Reverse Stock Split”). On a pro forma basis, after giving effect to the Reverse Stock Split, the number of outstanding common shares would decrease as of June 30, 2010 from 142,969,831 shares to 23,828,306 shares (June 30, 2009: from 69,384,374 shares to 11,564,063 shares; June 30, 2008: from 5,000,004 shares to 833,334 shares; January 2, 2008: from 50,000 shares to 8,334 shares).
The weighted-average number of shares in issue used in the earnings per share calculation was restated for all periods presented to give effect to the Reverse Stock Split in accordance with IAS 33 “Earnings per share”. All other share data presented in these financial statements was not retrospectively adjusted, as the Reverse Stock Split is a non-adjusting event in accordance with IAS 10 “Events after the reporting period”.
Land under Promesas
As fully described in Note 5(a), the Government of Uruguay did not extend the Compliance Provision of Law No. 18,092 beyond June 30, 2011. However, on June 23, 2011, the Executive Power issued Decree No. 218/11 establishing that Non-Compliant Companies that had properly applied for government authorization to own and/or use farmland on or prior to June 30, 2011, would be permitted to continue to use the farmland subject
The accompanying notes are an integral part of these consolidated financial statements.
F-87
Table of Contents
Union Agriculture Group Corp.
Notes to the Consolidated Financial Statements (Continued)
(All amounts in US$, except shares and per share data and as otherwise indicated)
| 28. | Events after the date of the statement of financial position (continued) |
to such applications pending government determination of such applications. In order to make use of the Expedited Process, on June 22, 2011, Boisy S.A. applied for authorization to use approximately 64,000 hectares of land, which were also included in the Third Productive Project. The Group expects to obtain this authorization 30 business days after its application, although there can be no assurance that the government will not deny the application. In the event the government denies Boisy S.A.’s application under the Expedited Process, processing will continue with the standard authorization under the Third Productive Project as fully described in Note 5(a).
The accompanying notes are an integral part of these consolidated financial statements.
F-88
Table of Contents
Union Agriculture Group Corp.
Consolidated Interim Financial Statements as of March 31, 2011 and for the nine-month periods ended March 31, 2011 and 2010
Table of Contents
Report of Independent Registered Public Accounting Firm
To the Board of Directors and Shareholders
of Union Agriculture Group Corp.
We have audited the accompanying consolidated statements of financial position of Union Agriculture Group Corp. and its subsidiaries as of March 31, 2011 and June 30, 2010, and the related consolidated statements of comprehensive income, of changes in shareholders’ equity and of cash flows for the nine-month periods ended March 31, 2011 and 2010. These consolidated financial statements are the responsibility of the Company’s management. Our responsibility is to express an opinion on these financial statements based on our audits.
We conducted our audits in accordance with the standards of the Public Company Accounting Oversight Board (United States). Those standards require that we plan and perform the audit to obtain reasonable assurance about whether the financial statements are free of material misstatement. An audit includes examining, on a test basis, evidence supporting the amounts and disclosures in the financial statements. An audit also includes assessing the accounting principles used and significant estimates made by management, as well as evaluating the overall financial statement presentation. We believe that our audits provide a reasonable basis for our opinion.
In our opinion, the consolidated financial statements referred to above present fairly, in all material respects, the financial position of Union Agriculture Group Corp. and its subsidiaries at March 31, 2011 and June 30, 2010 and the results of their operations and their cash flows for the nine-month periods ended in March 31, 2011 and 2010 in conformity with International Financial Reporting Standards as issued by the International Accounting Standards Board.
We draw attention to Note 4(a) to the financial statements. The Group is in process to obtain governmental authorizations to continue using 66,645 hectares of land held underPromesas. The ultimate outcome of this process cannot presently be determined.
Montevideo, Uruguay
July 14, 2011
PricewaterhouseCoopers Ltda.
| by | /s/ Omar Cabral (Partner) | |
| Omar Cabral |
PricewaterhouseCoopers Ltda., Cerrito 461 1st floor, T: +598 29160463, F: +598 29160605
11.000 Montevideo, Uruguay, www.pwc.com/uy
©2011 PricewaterhouseCoopers Ltda., PricewaterhouseCoopers, PricewaterhouseCoopers Professional Services Ltda., PricewaterhouseCoopers, Shaw, Faget & Asociados, and PricewaterhouseCoopers Software Ltda. All rights reserved. In this document “PricewaterhouseCoopers” and/or “PwC” refers to PricewaterhouseCoopers Ltda., PricewaterhouseCoopers, PricewaterhouseCoopers Professional Services Ltda., PricewaterhouseCoopers, Shaw, Faget & Asociados, and PricewaterhouseCoopers Software Ltda., which are member firms of PricewaterhouseCoopers International Limited (PwC IL), each member firm is a separate legal entity.
Table of Contents
Denomination:Union Agriculture Group Corp.
Legal address:
Registered office: Vanterpool Plaza, 2nd Floor, Wickhams Cay I, Road Town, Tortola, British Virgin Islands.
Principal executive office: Plaza Independencia 737 – 11000, Montevideo, Uruguay.
Company activity:Agricultural
Date of registration:January 2, 2008
Expiration of company charter:No term defined
Number of register:1454555
Capital stock:219,890,431 shares
F-91
Table of Contents
Consolidated Interim Statements of Financial Position
as of March 31, 2011 and June 30, 2010
(All amounts in US$, except shares and per share data and as otherwise indicated)
| Note | March 31, 2011 | June 30, 2010 | ||||||||
ASSETS | ||||||||||
Non-Current Assets | ||||||||||
Property, plant and equipment, net | 6 | 9,227,249 | 4,488,147 | |||||||
Land underPromesas | 7 | 190,864,497 | 100,714,669 | |||||||
Investment property underPromesas, net | 8 | 23,293,946 | 4,663,968 | |||||||
Intangible assets, net | 9 | 407,151 | 405,304 | |||||||
Biological assets | 10 | 15,864,174 | 5,878,081 | |||||||
Deferred income tax assets | 17 | 78,664 | 340,502 | |||||||
Total Non-Current Assets | 239,735,681 | 116,490,671 | ||||||||
Current Assets | ||||||||||
Biological assets | 10 | 7,599,542 | 1,866,466 | |||||||
Inventories | 13 | 1,684,450 | 1,824,832 | |||||||
Trade and other receivables, net | 11, 12 | 10,840,685 | 8,329,062 | |||||||
Financial assets at fair value through profit or loss | 11 | — | 1,190,977 | |||||||
Derivative financial instruments | 11 | 7,250 | — | |||||||
Cash and cash equivalents | 11 | 104,942,161 | 67,125,638 | |||||||
Total Current Assets | 125,074,088 | 80,336,975 | ||||||||
TOTAL ASSETS | 364,809,769 | 196,827,646 | ||||||||
SHAREHOLDERS EQUITY | ||||||||||
Capital and reserves attributable to equity holders of the parent | ||||||||||
Share capital | 348,881,666 | 193,373,922 | ||||||||
Equity-settled compensation | 7,616,682 | 3,129,725 | ||||||||
Accumulated deficit | (4,632,364 | ) | (3,031,293 | ) | ||||||
Equity attributable to equity holders of the parent | 351,865,984 | 193,472,354 | ||||||||
TOTAL SHAREHOLDERS EQUITY | 351,865,984 | 193,472,354 | ||||||||
LIABILITIES | ||||||||||
Non-Current Liabilities | ||||||||||
Finance lease liabilities | 11, 23 | — | 2,368 | |||||||
Deferred income tax liabilities | 17 | 78,664 | 590,453 | |||||||
Total Non-Current Liabilities | 78,664 | 592,821 | ||||||||
Current Liabilities | ||||||||||
Trade and other payables | 11, 16 | 12,210,664 | 2,535,048 | |||||||
Payroll and social security liabilities | 649,188 | 222,861 | ||||||||
Finance lease liabilities | 11, 23 | 5,269 | 4,562 | |||||||
Total Current Liabilities | 12,865,121 | 2,762,471 | ||||||||
TOTAL LIABILITIES | 12,943,785 | 3,355,292 | ||||||||
TOTAL SHAREHOLDERS EQUITY AND LIABILITIES | 364,809,769 | 196,827,646 | ||||||||
The accompanying notes are an integral part of these consolidated interim financial statements.
F-92
Table of Contents
Consolidated Interim Statements of Comprehensive Income
for the nine-month periods ended March 31, 2011 and 2010
(All amounts in US$, except shares and per share data and as otherwise indicated)
| Note | March 31, 2011 | March 31, 2010 | ||||||||||
Sales of agricultural produce and biological assets and services rendered | 18 | 6,212,163 | 147,016 | |||||||||
Rental income | 23 | 529,312 | 30,933 | |||||||||
Cost of agricultural produce and biological assets sold and services rendered | 19 | (5,926,605 | ) | (128,902 | ) | |||||||
Initial recognition and changes in fair value of biological assets and agricultural produce | 11,575,441 | 2,541,921 | ||||||||||
Cost of production | 19 | (7,595,472 | ) | (2,708,184 | ) | |||||||
Margin Before Operating Expenses | 4,794,839 | (117,216 | ) | |||||||||
General and administrative expenses | 19 | (7,668,310 | ) | (2,158,190 | ) | |||||||
Selling expenses | 19 | (124,243 | ) | (2,762 | ) | |||||||
Other operating income, net | 36,544 | — | ||||||||||
Loss from Operations Before Financing and Taxation | (2,961,170 | ) | (2,278,168 | ) | ||||||||
Finance income | 21 | 1,110,280 | 1,401,410 | |||||||||
Finance costs | 21 | (132 | ) | (283 | ) | |||||||
Financial results, net | 21 | 1,110,148 | 1,401,127 | |||||||||
Loss Before Income Tax | (1,851,022 | ) | (877,041 | ) | ||||||||
Income tax benefit | 17 | 249,951 | 131,173 | |||||||||
Loss for the Period | (1,601,071 | ) | (745,868 | ) | ||||||||
Total Comprehensive Loss for the Period | (1,601,071 | ) | (745,868 | ) | ||||||||
Loss / Total Comprehensive Loss Attributable to: | ||||||||||||
Equity holders of the parent | (1,601,071 | ) | (724,263 | ) | ||||||||
Non controlling interest | — | (21,605 | ) | |||||||||
Losses per share for loss attributable to equity holders of the parent during the period: | ||||||||||||
Basic and Diluted | 22 | (0.055 | ) | (0.055 | ) | |||||||
The accompanying notes are an integral part of these consolidated interim financial statements.
F-93
Table of Contents
Consolidated Interim Statements of Changes in Shareholders’ Equity
for the nine-month periods ended March 31, 2011 and 2010
(All amounts in US$, except shares and per share data and as otherwise indicated)
| Attributable to equity holders of the parent | ||||||||||||||||||||||||||||
| Number of shares | Share Capital | Equity-settled Compensation | Accumulated Deficit | Subtotal | Non Controlling Interest | Total Shareholders’ Equity | ||||||||||||||||||||||
Balance at June 30, 2009 | 69,384,374 | 84,266,985 | 2,325,325 | (2,694,460 | ) | 83,897,850 | 42,234 | 83,940,084 | ||||||||||||||||||||
Capital contributions | 72,184,725 | 106,990,005 | — | — | 106,990,005 | — | 106,990,005 | |||||||||||||||||||||
Share options granted | — | — | 974,643 | — | 974,643 | — | 974,643 | |||||||||||||||||||||
Share options exercised | 250,000 | 305,751 | (55,751 | ) | — | 250,000 | — | 250,000 | ||||||||||||||||||||
Total comprehensive loss for the period | — | — | — | (724,263 | ) | (724,263 | ) | (21,605 | ) | (745,868 | ) | |||||||||||||||||
Acquisition of non controlling interest | — | (70,691 | ) | — | — | (70,691 | ) | (20,629 | ) | (91,320 | ) | |||||||||||||||||
Balance at March 31, 2010 | 141,819,099 | 191,492,050 | 3,244,217 | (3,418,723 | ) | 191,317,544 | — | 191,317,544 | ||||||||||||||||||||
Balance at June 30, 2010 | 142,969,831 | 193,373,922 | 3,129,725 | (3,031,293 | ) | 193,472,354 | — | 193,472,354 | ||||||||||||||||||||
Capital contributions | 75,233,109 | 152,905,417 | — | — | 152,905,417 | — | 152,905,417 | |||||||||||||||||||||
Share options granted | — | — | 4,837,738 | — | 4,837,738 | — | 4,837,738 | |||||||||||||||||||||
Share options exercised | 1,687,491 | 2,602,327 | (350,781 | ) | — | 2,251,546 | — | 2,251,546 | ||||||||||||||||||||
Total comprehensive loss for the period | — | — | — | (1,601,071 | ) | (1,601,071 | ) | — | (1,601,071 | ) | ||||||||||||||||||
Balance at March 31, 2011 | 219,890,431 | 348,881,666 | 7,616,682 | (4,632,364 | ) | 351,865,984 | — | 351,865,984 | ||||||||||||||||||||
On February 25, 2011, the Company completed a private placement by issuing an aggregate of 75,233,109 shares of common stock at a price of US$ 2.20 per share, for gross proceeds to the Company of US$ 165,059,899. The Company paid finders’ fees in cash for an amount of US$ 8,578,577 representing around 5 % of the gross proceeds raised in the private placement, and granted equity-settled options for an amount of US$ 3,575,905 (see Note 14 for details).
On June 23, 2011, the Board of Directors approved the consolidation of the Common Shares to be effected at a ratio of one post-consolidation common share for every six pre-consolidation common shares (the “Reverse Stock Split”). Please see Note 26 for further details.
The accompanying notes are an integral part of these consolidated interim financial statements.
F-94
Table of Contents
Consolidated Interim Statements of Cash Flows
for the nine-month periods ended March 31, 2011 and 2010
(All amounts in US$, except shares and per share data and as otherwise indicated)
| Note | March 31, 2011 | March 31, 2010 | ||||||||||
Cash flows from operating activities: | ||||||||||||
Loss for the period | (1,601,071 | ) | (745,868 | ) | ||||||||
Adjustments for: | ||||||||||||
Income tax benefit | 17 | (249,951 | ) | (131,173 | ) | |||||||
Depreciation | 6,8 | 389,474 | 119,338 | |||||||||
Amortization | 9 | 2,088 | 1,014 | |||||||||
Loss from the disposal of property items | 14,341 | — | ||||||||||
Employee share options granted | 14 | 1,261,833 | 10,531 | |||||||||
Changes in fair value of financial assets at fair value through profit or loss | 21 | (616,888 | ) | 178 | ||||||||
Interest income | 21 | (207,767 | ) | (405,090 | ) | |||||||
Interest expense | 21 | 132 | 105 | |||||||||
Unrealized initial recognition and changes in fair value of biological assets and agricultural produce | (8,131,039 | ) | (2,489,928 | ) | ||||||||
Gain from derivative financial instruments | (50,885 | ) | — | |||||||||
Unrealized foreign exchange gains, net | 21 | (1,480 | ) | (427,780 | ) | |||||||
Changes in operating assets and liabilities: | ||||||||||||
Increase in trade and other receivables, net | (2,002,570 | ) | (2,437,805 | ) | ||||||||
Decrease / (increase) in inventories | 140,382 | (556,537 | ) | |||||||||
Increase in biological assets | (7,588,130 | ) | (333,392 | ) | ||||||||
Decrease / (increase) in financial assets at fair value through profit or loss | 1,807,865 | (280,278 | ) | |||||||||
Decrease in derivative financial instruments | 43,635 | — | ||||||||||
Increase in trade and other payables | 4,325,977 | 1,026,903 | ||||||||||
Increase in payroll and social security liabilities | 426,327 | 148,638 | ||||||||||
Net cash (used in) operating activities before interest paid | (12,037,727 | ) | (6,501,144 | ) | ||||||||
Interest paid | (117 | ) | (96 | ) | ||||||||
Net cash (used in) operating activities | (12,037,844 | ) | (6,501,240 | ) | ||||||||
The accompanying notes are an integral part of these consolidated interim financial statements.
F-95
Table of Contents
Union Agriculture Group Corp.
Consolidated Interim Statements of Cash Flows (Continued)
for the nine-month periods ended March 31, 2011 and 2010
(All amounts in US$, except shares and per share data and as otherwise indicated)
| Note | March 31, 2011 | March 31, 2010 | ||||||||||
Cash flows from investing activities: | ||||||||||||
Payments for investment property underPromesas | 8 | (18,633,666 | ) | (163,935 | ) | |||||||
Payments for land underPromesas | 7 | (86,361,642 | ) | (41,321,670 | ) | |||||||
Purchases of property, plant and equipment | 6 | (5,208,375 | ) | (2,346,651 | ) | |||||||
Proceeds from sale of property, plant and equipment | 6 | 69,146 | — | |||||||||
Purchases of intangible assets | 9 | (3,935 | ) | (19,258 | ) | |||||||
Proceeds from investments in debt certificates | — | 1,912,498 | ||||||||||
Loans granted | — | (2,150,000 | ) | |||||||||
Repayments of loans granted | 1,720,585 | 956,461 | ||||||||||
Interest received | 21 | 246,373 | 403,233 | |||||||||
Net cash (used in) investing activities | (108,171,514 | ) | (42,729,322 | ) | ||||||||
Cash flows from financing activities: | ||||||||||||
Proceeds from issuance of ordinary shares | 158,319,928 | 101,935,434 | ||||||||||
Deferred offering costs paid | (301,625 | ) | — | |||||||||
Acquisition of non controlling interest in subsidiaries | — | (91,320 | ) | |||||||||
Payment of finance lease liabilities | (1,676 | ) | (1,924 | ) | ||||||||
Net cash generated from financing activities | 158,016,627 | 101,842,190 | ||||||||||
Net increase in cash and cash equivalents | 37,807,269 | 52,611,628 | ||||||||||
Cash and cash equivalents at beginning of period | 67,125,638 | 67,014,579 | ||||||||||
Foreign exchange gains on cash and cash equivalents | 9,254 | 76,717 | ||||||||||
Cash and cash equivalents at end of period | 104,942,161 | 119,702,924 | ||||||||||
The accompanying notes are an integral part of these consolidated interim financial statements.
F-96
Table of Contents
Notes to the Consolidated Interim Financial Statements
(All amounts in US$, except shares and per share data and as otherwise indicated)
| 1. | General information |
Union Agriculture Group Corp. (the “Company” or “UAG”) was incorporated in the British Virgin Islands on January 2, 2008 (inception) as Weitvil Holdings Inc. Since inception, the Company has been engaged in acquiring farmland, paying for land underPromesas, organizational and business efforts and obtaining initial financing. The Company was formed as a vehicle to pursue a business combination through the acquisition of two pre-existing blueberry businesses, and subsequently, to acquire farmland to diversify its agricultural portfolio.
The Company is today a holding company primarily engaged through its operating subsidiaries in agricultural and agricultural-related activities in Uruguay in several lines of business, including crops, rice, cattle, sheep, dairy, blueberries and others. In addition, the Company is currently leasing three agricultural properties from which it derives rental income. The Company and its operating subsidiaries are collectively referred to hereinafter as the “Group”. There have been no changes in the composition of the Group since June 30, 2010. See also Note 5 for a description of the Group’s segments.
The Company is the ultimate parent company and is a corporation incorporated and domiciled in the British Virgin Islands. The address of its registered office is Vanterpool Plaza, 2nd floor, Wickhams Cay I, Road Town, Tortola, British Virgin Islands.
These consolidated interim financial statements have been approved for issue by the Board of Directors on July 14, 2011.
| 2. | Summary of significant accounting policies |
The principal accounting policies applied in the preparation of these consolidated interim financial statements are set out below. These policies have been consistently applied to all the periods presented, unless otherwise stated.
| 2.1. | Basis of preparation |
The consolidated interim financial statements of the Group have been prepared in accordance with International Financial Reporting Standards (IFRS) of the International Accounting Standards Board (IASB) and the Interpretations of the International Financial Reporting Interpretations Committee (IFRIC), including IAS 34, ‘Interim financial reporting’. All IFRS issued by the IASB, effective at the time of preparing these consolidated interim financial statements have been applied.
Presentation in the statement of financial position differentiates between current and non-current assets and liabilities. Assets and liabilities are regarded as current if they mature within one year or within the normal business cycle of the Group, or are held for sale. The consolidated interim financial statements are presented in United States Dollars. The fiscal year begins on July 1 and ends on June 30 of the following year. However, the production is based on the harvest year for crops, rice and blueberries. A harvest year varies by plant according to the climate in which it is grown. Due to the geographic diversity of the farms, the planting period for a given plant may start earlier on one farm than on another, causing differences in their respective harvesting periods. The financial results are presented on a fiscal year basis.
The accompanying notes are an integral part of these consolidated interim financial statements.
F-97
Table of Contents
Union Agriculture Group Corp.
Notes to the Consolidated Interim Financial Statements (Continued)
(All amounts in US$, except shares and per share data and as otherwise indicated)
| 2.1. | Basis of preparation (continued) |
The consolidated interim financial statements have been prepared under the historical cost convention as modified by derivative financial instruments, financial assets at fair value through profit or loss and biological assets and agricultural produce at the point of harvest measured at fair value.
The preparation of financial statements in conformity with IFRS requires the use of certain critical accounting estimates. It also requires management to exercise its judgment in the process of applying the Group’s accounting policies. The areas involving a higher degree of judgment or complexity, or areas where assumptions and estimates are significant to the consolidated interim financial statements are disclosed in Note 4.
| 2.2. | Going concern |
During the nine-month period ended March 31, 2011, the Group converted certainPromesas for land and began its dairy production. The Group focused on consolidation of its other business segments and expanding its revenue base. Activities focused on executing further hectares of land underPromesas and obtaining further financing under private placements.
The Group incurred losses during the nine-month period ended March 31, 2011 amounting to US$ 1.6 million. Cumulative losses from inception through March 31, 2011 were US$ 4.6 million. The Group did not generate funds through operations during the nine-month period ended March 31, 2011.
The Group’s working capital position is positive as of March 31, 2011 and the Group does not have debt with external parties. The Group’s current cash and cash equivalents balance amounts to US$ 104.9 million as of March 31, 2011. In February 2011, the Group raised additional capital through a private placement aggregating US$ 165.1 million, which was primarily used to pay for land underPromesas. For the foreseeable future, the Group expects to rely principally upon the proceeds obtained through private placements and the proceeds of an initial public offering (the “Offering”).
The Group expects that its operations may use cash rather than providing it for the near future until full capacity is reached in the land used underPromesas. Also, the Group may incur more losses in the near future as it continues to develop its business plan. The Group’s forecasts and projections, taking account of reasonably possible changes in trading performance, show that the Group should be able to operate within the level of its current financing. The Group is of the opinion that it has adequate resources to continue in operational existence for the foreseeable future. The Group therefore adopts the going concern basis in preparing these consolidated interim financial statements.
| 2.3. | New accounting standards |
The impact of new accounting standards, amendments and interpretations on the Group’s financial statements for the nine-month period ended March 31, 2011 is set out below:
2009 Improvements to IFRSs
On April 16, 2009, the IASB issued Improvements to IFRSs – a collection of amendments to twelve International Financial Reporting Standards – as part of its program of annual improvements to its standards.
The accompanying notes are an integral part of these consolidated interim financial statements.
F-98
Table of Contents
Union Agriculture Group Corp.
Notes to the Consolidated Interim Financial Statements (Continued)
(All amounts in US$, except shares and per share data and as otherwise indicated)
| 2.3. | New accounting standards (continued) |
With the exception of four amendments effective for annual periods beginning on or after July 1, 2009, the remaining amendments are effective for annual periods beginning on or after January 1, 2010 (thus effective for the Group’s fiscal year ended June 30, 2011), although entities are permitted to adopt them earlier. These amendments include IAS 1 “Presentation of Financial Statements”, IFRS 5 “Measurement of Non-Current Assets (or disposal groups) Classified as Held-for-Sale”, IFRS 8 “Operating Segments”, IAS 7 “Statement of Cash Flows”, IAS 17 “Leases”, IAS 18 “Revenue”, IAS 36 “Impairment of Assets” and IAS 39 “Financial Instruments: Recognition and Measurement”. None of these amendments are expected to have a significant impact on the Group’s financial statements.
Amendment to IAS 32 “Financial Instruments: Presentation”
An amendment to IAS 32 (Financial Instruments: Presentation) was issued in October 2009. The amendment clarifies that rights issues, options and warrants denominated in a currency other than the issuer’s functional currency and offered on a pro-rata basis to all owners of the same class of equity must be classified as equity. Such rights issues have so far been accounted for as liabilities. The change relates only to issues of a fixed number of shares at a fixed foreign-currency exercise price. The amendment is to be applied for periods beginning on or after February 1, 2010. Earlier application is permitted. The amendment was effective for the Group’s nine-month period ended March 31, 2011, and did not have a material impact on the presentation of the Group’s financial position, results of operations or earnings per share.
IFRIC 19 “Extinguishing Financial Liabilities with Equity Instruments”
IFRIC 19 “Extinguishing Financial Liabilities with Equity Instruments” was issued in November 2009. The interpretation addresses the accounting treatment in cases where a company settles all or part of a financial liability by issuing equity instruments to the creditor. It is to be applied for annual periods beginning on or after July 1, 2010. Earlier application is permitted. The amendment was effective for the Group’s nine-month period ended March 31, 2011, and did not have a material impact on the presentation of the Group’s financial position, results of operations or earnings per share.
2010 Improvements to IFRSs
On 6 May 2010, the IASB issued Improvements to IFRSs – a collection of amendments to seven IFRSs – as part of its program of annual improvements to its standards. Two out of the seven amendments are effective for annual periods beginning on or after July 1, 2010, thus they were effective for the Group’s nine-month period ended March 31, 2011, including IFRS 3 “Business Combinations” and IAS 27 “Consolidated and Separate Financial Statements”. The amendments did not have a material impact on the presentation of the Group’s financial position, results of operations or earnings per share.
The accompanying notes are an integral part of these consolidated interim financial statements.
F-99
Table of Contents
Union Agriculture Group Corp.
Notes to the Consolidated Interim Financial Statements (Continued)
(All amounts in US$, except shares and per share data and as otherwise indicated)
| 2.3. | New accounting standards (continued) |
The following standards, amendments and interpretations have been issued by the IASB but they are not yet effective for the Group:
IFRS 10 “Consolidated Financial Statements”
On 12 May 2011 the IASB issued IFRS 10 “Consolidated Financial Statements” which establishes principles for the presentation and preparation of consolidated financial statements when an entity controls one or more other entities. IFRS 10 replaces the consolidation requirements in SIC-12 Consolidation—Special Purpose Entities and IAS 27 Consolidated and Separate Financial Statements and is effective for annual periods beginning on or after 1 January 2013. IFRS 1o will be effective for the Group for its fiscal year ended June 30, 2014. Earlier application is permitted. IFRS 10 builds on existing principles by identifying the concept of control as the determining factor in whether an entity should be included within the consolidated financial statements of the parent company. The standard provides additional guidance to assist in the determination of control where this is difficult to assess.
IFRS 11 “Joint Arrangements”
On 12 May 2011 the IASB issued IFRS 11 “Joint Arrangements” which provides for a more realistic reflection of joint arrangements by focusing on the rights and obligations of the arrangement, rather than its legal form (as is currently the case). The standard addresses inconsistencies in the reporting of joint arrangements by requiring a single method to account for interests in jointly controlled entities. IFRS 11 is effective for annual periods beginning on or after 1 January 2013. Earlier application is permitted. IFRS 11 will be effective for the Group for its fiscal year ended June 30, 2014.
IFRS 12 “Disclosure of Interests in Other Entities”
On 12 May 2011 the IASB issued IFRS 12 “Disclosure of Interests in Other Entities”. IFRS 12 is a new and comprehensive standard on disclosure requirements for all forms of interests in other entities, including subsidiaries, joint arrangements, associates and unconsolidated structured entities. IFRS 12 is effective for annual periods beginning on or after 1 January 2013. Earlier application is permitted. IFRS 12 will be effective for the Group for its fiscal year ended June 30, 2014.
IFRS 13 “Fair Value Measurement”
On May 12, 2011, the IASB issued IFRS 13 “Fair Value Measurement” which replaces the fair value measurement guidance currently dispersed across different IFRS standards with a single definition of fair value and extensive application guidance. IFRS 13 provides guidance on how to measure fair value and does not introduce new requirements for when fair value is required or permitted. It also establishes disclosure requirements to provide users of financial statements with more information about fair value measurements.
IFRS 13 was developed in a joint project with the US Financial Accounting Standards Board (FASB) and the guidance in IFRS 13 is largely converged with FASB’s ASC Topic 820 Fair Value Measurement and Disclosures. IFRS 13 is effective for annual periods beginning on or after 1 January 2013. Earlier application is permitted. IFRS 13 will be effective for the Group for its fiscal year ended June 30, 2014.
The accompanying notes are an integral part of these consolidated interim financial statements.
F-100
Table of Contents
Union Agriculture Group Corp.
Notes to the Consolidated Interim Financial Statements (Continued)
(All amounts in US$, except shares and per share data and as otherwise indicated)
| 2.4. | Seasonality of operations |
The Group’s business activities are inherently seasonal. The Group generally harvests and sells grains (soybean and rice) between March and October, with the exception of wheat, which is harvested and sold between November and February. Sales in other business segments, such as in the Cattle, Sheep and Dairy business segments, tend to be more stable. However, the raising of cattle and sale of milk is generally higher during the fourth quarter, when the weather is warmer and pasture conditions are more favourable. As a result of the above factors, there may be significant variations in the results of operations from one quarter to another, as planting activities may be more concentrated in one quarter whereas harvesting activities may be more concentrated in another quarter. In addition, the quarterly results may vary as a result of the effects of fluctuations in commodities prices, production yields and costs on the determination of initial recognition and changes in fair value of biological assets and agricultural produce.
| 2.5. | Scope of consolidation |
The consolidated interim financial statements include the results of the Company and all of its subsidiaries from the date that control commences to the date that control ceases.
(a) Subsidiaries
Subsidiaries are all entities (including special purpose entities) over which the Group has the power to govern the financial and operating policies generally accompanying a shareholding of more than one half of the voting rights. The existence and effect of potential voting rights that are currently exercisable or convertible are considered when assessing whether the Group controls another entity. Subsidiaries are fully consolidated from the date on which control is transferred to the Group. They are de-consolidated from the date that control ceases.
The Group accounts for acquisitions using the purchase method of accounting as prescribed by IFRS 3R. Consideration is measured as the fair value of the assets given, equity instruments issued and liabilities incurred or assumed at the date of exchange. Identifiable assets acquired and liabilities and contingent liabilities assumed in a business combination are measured initially at their fair values at the acquisition date, irrespective of the extent of any non controlling interest. The excess of consideration over the fair value of the Group’s share of the identifiable net assets acquired is recorded as goodwill. If the consideration is less than the fair value of the net assets of the subsidiary acquired, the difference is recognized directly in the statement of comprehensive income. The Group has not completed any business combinations for the nine-month periods ended March 31, 2011 and 2010.
Inter-company transactions, balances and unrealized gains on transactions between Group companies are eliminated. Unrealized losses are also eliminated but considered an impairment indicator of the asset transferred. Accounting policies of subsidiaries have been changed where necessary to ensure consistency with the policies adopted by the Group.
(b) Transactions with non controlling interest
Non controlling interest is shown as a component of equity in the statement of financial position and the share of profit or loss attributable to non controlling interest is shown as a component of profit or loss for the year in the consolidated statement of comprehensive income.
The accompanying notes are an integral part of these consolidated interim financial statements.
F-101
Table of Contents
Union Agriculture Group Corp.
Notes to the Consolidated Interim Financial Statements (Continued)
(All amounts in US$, except shares and per share data and as otherwise indicated)
| 2.5. | Scope of consolidation (continued) |
The Group treats transactions with non controlling interests as transactions with equity owners of the Group. For purchases of non controlling interests, the difference between any consideration paid and the relevant share acquired of the carrying value of net assets of the subsidiary is recorded in equity. Gains or losses on disposals to non controlling interests are also recorded in equity.
| 2.6. | Segment reporting |
According to IFRS 8, operating segments are identified based on the ‘management approach’. This approach stipulates external segment reporting based on the Group’s internal organizational and management structure and on internal financial reporting to the chief operating decision maker. The Management Committee of the Group is responsible for measuring and steering the business success of the segments and is considered the chief operating decision maker within the meaning of IFRS 8.
| 2.7. | Foreign currency translation |
(a) Functional and presentation currency
IAS 21 “The effects of changes in foreign exchange rates” describes functional currency as ‘the currency of the primary economic environment in which entity operates’. At present, the majority of the Group’s operations are conducted in US dollars. The Group sells most of its production to third parties who in turn export to international markets where commodities are generally traded in US dollars. The Group has been expanding since inception through investing inPromesas for real estate. Real estate transactions in Uruguay are influenced by the price of international commodities traded in US dollars. Since inception the Group has financed its operations through private placements generating US dollar proceeds for the Group. With the exception of salaries and related costs to management and personnel based in Uruguay, who are paid in local currency, the majority of the other significant costs are transacted in US dollars. Based on these factors, the Group’s Board of Directors determined that the functional currency of its principal operating entities is the US Dollar. The presentation currency of the Group is also the US Dollar.
(b) Transactions and balances
Foreign currency transactions are translated into the functional currency using the exchange rates prevailing at the dates of the transactions or valuation where items are remeasured. The majority of the non-monetary items (i.e.Promesas for land, land, investment property underPromesas and other property, plant and equipment) are measured at historical cost in the functional currency at the time of the transactions. An immaterial amount of non-monetary items are measured at historical cost in a currency other than the functional currency.
Foreign exchange gains and losses resulting from the settlement of such transactions and from the translation at period-end exchange rates of monetary assets and liabilities denominated in foreign currencies are recognized in the statement of comprehensive income. Foreign exchange gains and losses are presented in the statement of comprehensive income within “Finance income” or “Finance costs”, as appropriate.
| 2.8. | Land underPromesas |
Land underPromesas represents payments to the sellers, of the full price of the land in arms-length transactions, consummated by the execution ofPromesas de Compraventa under Uruguayan Law 8,733 (see
The accompanying notes are an integral part of these consolidated interim financial statements.
F-102
Table of Contents
Union Agriculture Group Corp.
Notes to the Consolidated Interim Financial Statements (Continued)
(All amounts in US$, except shares and per share data and as otherwise indicated)
| 2.8. | Land underPromesas (continued) |
Note 4(a) for a description of real estate transactions in Uruguay and nature of these agreements as per Uruguayan law). As of the date of these consolidated interim financial statements, the Group has received authorizations from the Uruguayan government to proceed with the execution of theescrituras (deeds of title) for 17,846 hectares of land. An additional 188 hectares were previously approved andescrituras were already executed and consequently are classified as land within the property, plant and equipment line item on the statement of financial position. The Group has recognized payments forPromesasfor which title has not been obtained as assets on the statement of financial position because (1) the Group paid full price for the land underPromesasand that price can be measured reliably and thePromesasare legally valid under Law No. 8,733 (see Note 4(a)); (2) at the time thePromesa was signed it was probable that the future economic benefits associated with thePromesas would flow to the Group as it has the ability to sell its rights in thePromesas and the sales value less costs to sell such rights is in excess of the carrying value of the assets recorded, and because from the date thePromesasare signed, the Group is obtaining benefits from using the land for its agricultural purposes as permitted by Law 8,733, Law 18,092 and related Decrees (see Note 4(a)); (3) thePromesas entitle the Group to certain rights including but not limited to (i) the use of the underlying land (as permitted by Law 8,733) through June 30, 2011, and after that date, pending determination of the Group’s application for government authorizations (see Note 4(a)); (ii) the risks and benefits associated with thePromesas,excluding the right to sell the land since it is not owned; (iii) the right to sell, assign, transfer, or lease thePromesas to a third party, in the case of a sale for an amount equal to the fair value of the land since the buyer would be expected to seek the deed; and/or (iv) the right to pledge thePromesas; and (4) thePromesas are definitive binding agreements between the Group and the seller and are legally registered as per Uruguayan Law and enforceable against third parties. As of the date of these consolidated interim financial statements, the fair value of the land underlying thePromesas exceeds the sum of the amounts paid for thePromesas and any costs to sell such that there is no indication of impairment of the assets. Once the authorizations from the Uruguayan government are obtained for our continued use and ownership of the land and the deeds of title are executed, the payments reported as land underPromesas will be reclassified to the land category within property, plant and equipment (see Note 2.9).
The payments for land underPromesasare recorded at cost less impairment losses, if any. Historical cost comprises the price paid and any costs directly attributable to the transaction. Land underPromesas is not depreciated.
If the Group does not obtain governmental approval to proceed with the execution of theescrituras, the Group would resubmit the application for approval under a different exemption, i.e. the “Public Company Exception” (see Note 4(a) for details) as set forth in Section 2(a) of Uruguayan Decree No. 225/07. The Group would be permitted to apply for such exemption once the Offering is complete. The Group expects the process to obtain the Public Company Exception to take approximately 12 to 16 months after the Offering is complete. In addition, as further described above, the Group is able to sell and/or transfer thePromesas at any point in time to a third purchaser who will seek execution of the deed of title.
| 2.9. | Property, plant and equipment |
Property, plant and equipment is recorded at cost, less accumulated depreciation and impairment losses, if any. Historical cost comprises the purchase price and any costs directly attributable to the acquisition.
Where individual components of an item of property, plant and equipment have different useful lives, they are accounted for as separate items, which are depreciated separately.
The accompanying notes are an integral part of these consolidated interim financial statements.
F-103
Table of Contents
Union Agriculture Group Corp.
Notes to the Consolidated Interim Financial Statements (Continued)
(All amounts in US$, except shares and per share data and as otherwise indicated)
| 2.9. | Property, plant and equipment (continued) |
Subsequent costs are included in the asset’s carrying amount or recognized as a separate asset, as appropriate, only when it is probable that future economic benefits associated with the item will flow to the Group and the cost of the item can be measured reliably. These costs may include the cost of replacing parts that are eligible for capitalization when the costs of replacing the parts are incurred. The carrying amount of the replaced part is derecognized. All other repairs and maintenance are charged to the statement of comprehensive income during the period in which they are incurred.
Land for which the deed of title has been signed is included in property, plant and equipment and is not depreciated. Depreciation on other assets is calculated using the straight-line method, to allocate their cost to their residual values over their estimated useful lives, as follows:
Buildings and facilities | 50 years | |||
Machinery | 10 years | |||
Furniture and equipment | 10 years | |||
Fixtures | 10 years | |||
Vehicles | 5 years |
The assets’ residual values and useful lives are reviewed, and adjusted if appropriate, at each statement of financial position date. An asset’s carrying amount is written down immediately to its recoverable amount if the asset’s carrying amount is greater than its estimated recoverable amount (See Note 2.13).
Gains and losses on disposals are determined by comparing the proceeds with the carrying amount and are recognized within “Other operating income, net” in the statement of comprehensive income.
| 2.10. | Investment property under Promesas |
Investment property underPromesas consists of farmland and buildings held to earn rentals or for capital appreciation and not used in production or for administrative purposes. Investment property underPromesas is measured at cost, less accumulated depreciation and impairment losses, if any. Farmland is not depreciated. Depreciation on buildings is calculated using the straight-line method to allocate their cost to their residual values over their estimated useful lives of 30 years.
Rental income from investment property underPromesas is recorded in the statement of comprehensive income (see Notes 8 and 23).
| 2.11. | Leases |
The Group is the lessee in certain operating and finance lease agreements. The Group is also a lessor in certain operating lease agreements. The Group classifies its leases at the inception as finance or operating leases.
Leases of property, plant and equipment where the Group has substantially all the risks and rewards of ownership are classified as finance leases. Finance leases are capitalized at the lease’s inception at the lower of the fair value of the leased property and the present value of the minimum lease payments.
The accompanying notes are an integral part of these consolidated interim financial statements.
F-104
Table of Contents
Union Agriculture Group Corp.
Notes to the Consolidated Interim Financial Statements (Continued)
(All amounts in US$, except shares and per share data and as otherwise indicated)
| 2.11. | Leases (continued) |
Each lease payment is allocated between the liability and finance charges so as to achieve a constant rate on the finance balance outstanding. The corresponding rental obligations, net of finance charges, are included as “Finance lease liabilities” in the statement of financial position.
The interest element of the finance cost is charged to the statement of comprehensive income over the lease period so as to produce a constant periodic rate of interest on the remaining balance of the liability for each period. The property, plant and equipment acquired under finance leases is depreciated over the shorter of the asset’s useful life and the lease term.
Leases where the lessor retains substantially all the risks and rewards of ownership are classified as operating leases. Payments made under operating leases (net of any incentives received from the lessor) are charged to the statement of comprehensive income on a straight-line basis over the period of the lease.
Certain operating lease agreements where the Group acts as a lessor contain contingent rent provisions. Rental income is recognized once the contingency is resolved.
| 2.12. | Intangible assets |
Goodwill represents future economic benefits arising from assets that are not capable of being individually identified and separately recognized by the Group on an acquisition. Goodwill is computed as the excess of the consideration paid over the fair value of the Group’s share of net assets of the acquired subsidiary undertaking at the acquisition date and is allocated to those cash generating units expected to benefit from the acquisition for the purpose of impairment testing. Following initial recognition, goodwill is measured at cost less any accumulated impairment losses. Goodwill arising on the acquisition of subsidiaries is included within “Intangible assets, net” on the statement of financial position.
Goodwill is not amortized but tested for impairment on an annual basis, or more frequently if there is an indication of impairment. The impairment review requires management to make certain judgments, including estimating the recoverable value of the CGU to which the goodwill relates, based on either fair value less costs-to-sell or the value-in-use, as appropriate, in order to reach a conclusion on whether it deems the goodwill is impaired. Gains and losses on the disposal of a Group entity include any goodwill relating to the entity sold.
Other intangible assets that are acquired by the Group, which have finite useful lives, are measured at cost less accumulated amortization and impairment losses. These intangible assets comprise computer software and are amortized in the statement of comprehensive income on a straight-line basis over their estimated useful lives estimated to be ten years.
| 2.13. | Impairment of assets |
Goodwill
For the purpose of impairment testing, assets are grouped at the lowest levels for which there are separately identifiable cash flows, known as cash-generating units. If the recoverable amount of the cash-generating unit is less than the carrying amount of the unit, the impairment loss is allocated first to reduce the carrying amount of
The accompanying notes are an integral part of these consolidated interim financial statements.
F-105
Table of Contents
Union Agriculture Group Corp.
Notes to the Consolidated Interim Financial Statements (Continued)
(All amounts in US$, except shares and per share data and as otherwise indicated)
| 2.13. | Impairment of assets (continued) |
any goodwill allocated to the unit and then to the other assets of the unit pro-rata on the basis of the carrying amount of each asset in the unit. Impairment losses recognized for goodwill are not reversed in a subsequent period. Recoverable amount is the higher of fair value less costs to sell and value in use.
In assessing value in use, the estimated future cash flows are discounted to their present value using a pre-tax discount rate that reflects current market assessments of the time value of money and the risks specific to the asset for which the estimates of future cash flows have not been adjusted.
The fair value less costs-to-sell is determined by reference to recent transactions adjusted as necessary for factors such as location, size, profitability and risk among others.
Property, plant and equipment, land underPromesas, investment property underPromesas and finite-life intangible assets
At each statement of financial position date, the Group reviews the carrying amounts of its property, plant and equipment, land underPromesas,investment property underPromesas and finite-life intangible assets to determine whether there is any indication that those assets have suffered an impairment loss. If any such indication exists, the recoverable amount of the asset is estimated in order to determine the extent, if any, of the impairment loss. Where the asset does not generate cash flows that are independent from other assets, the Group estimates the recoverable amount of the cash-generating unit to which the asset belongs.
Where an impairment loss subsequently reverses, the carrying amount of the asset or cash-generating unit is increased to the revised estimate of its recoverable amount, not to exceed the carrying amount that would have been determined had no impairment loss been recognized for the asset or cash-generating unit in prior years. A reversal of an impairment loss is recognized immediately in the statement of comprehensive income.
| 2.14. | Biological assets and agriculture produce |
Biological assets are living plants or animals managed by the Group for sale, into agricultural produce, or into additional biological assets. Biological assets include livestock (breeding cattle, growing herd and cattle for sale), crops (mainly wheat, soybeans and rice), which are to be harvested as agricultural produce, and blueberry, which are self-regenerating for sustaining regular harvests of agricultural produce.
The Group distinguishes between consumable and bearer biological assets, and between mature and immature biological assets. “Consumable” biological assets are those assets that may be harvested as agricultural produce or sold as biological assets, for example livestock intended for the production of meat and/or livestock held for sale. “Bearer” biological assets are those assets capable of producing more than one harvest, for example blueberry plantations or livestock from which raw milk is produced. “Mature” biological assets are those that have attained harvestable specifications (for consumable biological assets) or are able to sustain regular harvests (for bearer biological assets). “Immature” biological assets are those assets other than mature biological assets. Consumable biological assets (such as crops, rice and cattle and sheep held for sale as living animals) are classified as current or non-current depending on the period of maturity. Bearer biological assets (such as blueberry bushes, dairy cattle and breeding cattle and sheep) are generally classified as non-current, except for breeding cattle and sheep which are classified as current if they are expected to be sold within one year.
The accompanying notes are an integral part of these consolidated interim financial statements.
F-106
Table of Contents
Union Agriculture Group Corp.
Notes to the Consolidated Interim Financial Statements (Continued)
(All amounts in US$, except shares and per share data and as otherwise indicated)
| 2.14. | Biological assets and agriculture produce (continued) |
Expenses relating to the agricultural activity include planting, harvesting, weeding, seedlings, irrigation, agrochemicals, fertilizers, veterinary and others. The Group elected to expense all such costs when incurred and include them within “Cost of production” in the statement of comprehensive income. The line item “Cost of agricultural produce and biological assets sold and services rendered” represents the recognition as an expense of agricultural produce held in inventory valued at cost or biological assets valued at fair value less costs to sell, and the costs of providing agricultural services. Therefore, “Cost of production” represents the costs expensed whilst the biological assets are growing and “Cost of agricultural produce and biological assets sold and services rendered” is the expensing of items from inventory and/ or biological assets when sold.
Biological assets are measured at fair value less costs to sell on initial recognition and at each statement of financial position date, except where fair value cannot be reliably measured. Cost approximates fair value when little or no biological transformation has taken place since the costs were originally incurred or the impact of biological transformation on price is not expected to be material. Costs to sell include all incremental costs directly attributable to the sale of the biological assets, excluding finance costs and income taxes. The fair value of a biological asset in its present location and condition is determined based on either the present value of expected net cash flows from the biological asset discounted at a current market-determined pre-tax rate or the current quoted market price in the most relevant market with reference to the species, growing condition and other characteristics.
In determining the fair value of a biological asset based on the expected net discounted cash flows, the following factors have been taken into account:
| (i) | The productive life of the asset; |
| (ii) | The period over which the asset will mature; |
| (iii) | The expected future sales price; |
| (iv) | The cost expected to arise throughout the life of the asset; and |
| (v) | A pre-tax nominal discount rate. |
Expected future sale prices for all biological assets are determined by reference to observable data in the relevant market. Costs expected to arise throughout the life of the biological assets are estimated based on historical and statistical data.
The gain or loss arising from initial recognition of a biological asset at fair value less costs to sell and from a change in fair value less costs to sell of a biological asset is recognized in profit or loss in the period in which they are incurred.
Agricultural produce harvested from the Group’s biological assets is initially measured at its fair value less costs to sell at the point of harvest. The fair value of agricultural produce is determined based on market prices in the local market. The gain or loss arising from initial recognition of agricultural produce as a result of harvesting is recognized in profit or loss in the period in which it arises. The fair value less costs to sell at the point of harvest is the deemed cost of the agricultural produce included in inventories for subsequent sale in the local market.
The accompanying notes are an integral part of these consolidated interim financial statements.
F-107
Table of Contents
Union Agriculture Group Corp.
Notes to the Consolidated Interim Financial Statements (Continued)
(All amounts in US$, except shares and per share data and as otherwise indicated)
| 2.15. | Inventories |
Inventories comprise consumable supplies, harvested agricultural produce and others. Consumable supplies comprise fertilizers, agrochemicals, vaccines, feed for livestock and other items necessarily used in the Group’s farming activities.
Harvested agricultural produce is measured at fair value less costs to sell at the point of harvest, which is the cost at the date it is transferred to inventories. Subsequently, inventories are valued at the lower of cost or net realizable value.
All other inventories are measured at the lower of cost and net realizable value. Cost is determined using the first-in, first-out (FIFO) method.
| 2.16. | Financial assets |
The Group early adopted IFRS 9 in its fiscal year-end, i.e. June 30, 2010; and applied it retrospectively for all periods presented. IFRS 9 includes a single model that has only two classification categories: amortized cost and fair value. To qualify for amortized cost accounting, the instrument must meet two criteria as further described below. All other instruments are mandatorily measured at fair value. Classification under IFRS 9 is determined at inception based on the two criteria previously described. IFRS 9 requires all equity investments to be measured at fair value. However, an entity may make an irrevocable election at initial recognition to present all fair value changes for non-trading equity investments in other comprehensive income.
Accordingly, the Group classified its financial assets in the following categories: those to be measured subsequently at fair value and those to be measured at amortized cost. This classification depends on whether the financial asset is a debt or an equity investment.
(a) Financial assets at fair value through profit or loss
Financial assets measured at fair value through profit or loss are financial assets held for trading. A financial asset is classified in this category if acquired principally for the purpose of selling in the short-term. Financial assets are classified as current if realization within 12 months is expected. Otherwise, they are classified as non-current. As of March 31, 2011, the Group’s financial assets at fair value through profit or loss comprise only derivative financial instruments. As of March 31, 2010, the Group held an equity investment in New Zealand Farming System Uruguay Ltd., a New Zealand based company with dairy farm operations in Uruguay. The Group sold this investment in October 2010.
(b) Financial assets at amortized cost
Financial assets measured at amortized cost are debt investments that meet the following criteria: the objective of the Group’s business model is to hold the asset to collect the contractual cash flows; and the contractual terms give rise on specified dates to cash flows that are solely payments of principal and interest on the principal outstanding. They are included in current assets, except for maturities greater than 12 months after the date of the statement of financial position. The Group’s financial assets at amortized cost comprise “trade and other receivables, net” and “cash and cash equivalents” in the statement of financial position.
The accompanying notes are an integral part of these consolidated interim financial statements.
F-108
Table of Contents
Union Agriculture Group Corp.
Notes to the Consolidated Interim Financial Statements (Continued)
(All amounts in US$, except shares and per share data and as otherwise indicated)
| 2.16. | Financial assets (continued) |
(c) Recognition and measurement
Regular purchases and sales of financial assets are recognized on the trade-date – the date on which the Group commits to purchase or sell the asset. Financial assets not carried at fair value through profit or loss are initially recognized at fair value plus transaction costs. Financial assets carried at fair value through profit or loss are initially recognized at fair value and transaction costs are expensed in the statement of comprehensive income. Financial assets are derecognized when the rights to receive cash flows from the investments have expired or have been transferred and the Group has transferred substantially all risks and rewards of ownership.
A gain or loss on a debt instrument that is subsequently measured at fair value and is not part of a hedging relationship is recognized in profit or loss and presented in the statement of comprehensive income within “Financial results, net” in the period in which they arise.
A gain or loss on a debt instrument that is subsequently measured at amortized cost and is not part of a hedging relationship is recognized in profit or loss when the financial asset is derecognized or impaired and through the amortization process using the effective interest method.
The Group subsequently measures all equity investments at fair value. The fair values of quoted investments are based on current bid prices. Where the Group’s management has elected to present unrealized and realized fair value gains and losses on equity investments in other comprehensive income, there is no subsequently recycling of fair value gains and losses to profit or loss; there is therefore no impairment. Dividends from such investments continue to be recognized in profit or loss as long as they represent a return on investment.
The Group is required to reclassify all affected debt investments when and only when its business model for managing those assets changes.
The Group assesses at the end of each reporting period whether there is objective evidence that a financial asset carried at amortized cost is impaired. A financial asset or a group of financial assets is impaired and impairment losses are incurred only if there is objective evidence of impairment as a result of one or more events that occurred after the initial recognition of the asset (a “loss event”) and that loss event (or events) has an impact on the estimated future cash flows of the financial asset or group of financial assets that can be reliably estimated.
(d) Offsetting financial instruments
Financial assets and liabilities are offset and the net amount reported in the statement of financial position when there is a legally enforceable right to offset the recognized amounts and there is an intention to settle on a net basis, or realize the asset and settle the liability simultaneously.
| 2.17. | Trade receivables |
Trade receivables are recognized initially at fair value and subsequently measured at amortized cost using the effective interest method, less allowance for trade receivables if any. An allowance for trade receivables is established when there is objective evidence that the Group will not be able to collect all amounts due according to the original terms of the receivables. Significant financial difficulties of the debtor, probability that the debtor
The accompanying notes are an integral part of these consolidated interim financial statements.
F-109
Table of Contents
Union Agriculture Group Corp.
Notes to the Consolidated Interim Financial Statements (Continued)
(All amounts in US$, except shares and per share data and as otherwise indicated)
| 2.17. | Trade receivables (continued) |
will enter bankruptcy or financial reorganization, and default or delinquency in payments are considered indicators that the trade receivable is impaired. Generally, trade receivables, which are more than 180 days past due are fully provided for. However, certain receivables 180+ days overdue may not be provided for based on a case-by-case analysis of credit quality. On the other hand, receivables, which are not 180+ days overdue, may be provided for if specific analysis indicates a potential impairment. The amount of the provision is the difference between the asset’s carrying amount and the present value of estimated future cash flows, discounted at the original effective interest rate. The carrying amount of the asset is reduced through the use of an allowance account, and the amount of the loss is recognized in the statement of comprehensive income within selling expenses. When a trade receivable is uncollectible, it is written off against the allowance account for trade receivables. Subsequent recoveries of amounts previously written off are credited against selling expenses in the statement of comprehensive income.
| 2.18. | Derivative financial instruments and hedging activities |
Derivatives are initially recognized at fair value on the date a derivative contract is entered into and are subsequently remeasured at their fair value. Commodity future contract fair values are computed with reference to quoted market prices on future exchanges. Gains and losses on commodity derivatives are classified within “Other operating income, net” in the statement of comprehensive income.
The Group manages exposures to commodity risks using hedging instruments that provide the appropriate economic outcome. The principal hedging instruments used include commodity future contracts. The Group does not use derivative financial instruments for speculative purposes. Any derivatives that the Group holds to hedge these exposures are classified as “held for trading” and are shown in a separate line on the face of the statement of financial position.
| 2.19. | Cash and cash equivalents |
Cash and cash equivalents includes cash in hand, deposits with banks and other short-term highly liquid investments with original maturities of three months or less.
| 2.20. | Trade payables |
Trade payables are initially recognized at fair value and subsequently measured at amortized cost using the effective interest method.
| 2.21. | Provisions |
Provisions are recognized when (i) the Group has a present legal or constructive obligation as a result of past events; (ii) it is probable that an outflow of resources will be required to settle the obligation; and (iii) a reliable estimate of the amount of the obligation can be made. The Group bases its accruals on up-to-date developments, estimates of the outcomes of the matters and legal counsel experience in contesting, litigating and settling matters. As the scope of the liabilities becomes better defined or more information is available, the Group may be required to change its estimates of future costs, which could have a material effect on its results of operations and financial condition or liquidity.
The accompanying notes are an integral part of these consolidated interim financial statements.
F-110
Table of Contents
Union Agriculture Group Corp.
Notes to the Consolidated Interim Financial Statements (Continued)
(All amounts in US$, except shares and per share data and as otherwise indicated)
| 2.21. | Provisions (continued) |
Provisions are measured at the present value of the expenditures expected to be required to settle the obligation using a pre-tax rate that reflects current market assessments of the time value of money and the risks specific to the obligation.
| 2.22. | Current and deferred income tax |
The Company is incorporated under the International Business Companies Act of the British Virgin Islands and accordingly, is exempted from payment of British Virgin Island’s income taxes. Accordingly, the Group’s tax expense comprises the charge for tax currently payable or deferred attributable to the Group’s subsidiaries in Uruguay. Tax is recognized in the statement of comprehensive income, except to the extent that it relates to items recognized directly in equity, in which case, it is also recognized in equity. In addition, dividend remittances from Group’s subsidiaries in Uruguay are subject to a 7% withholding tax levied by Uruguayan tax authorities.
The current income tax charge is calculated on the basis of the tax laws enacted or substantively enacted at the date of the statement of financial position in Uruguay where the Group’s subsidiaries currently operate and generate taxable income. Management periodically evaluates positions taken in tax returns with respect to situations in which applicable tax regulation is subject to interpretation. It establishes provisions where appropriate on the basis of amounts expected to be paid to the tax authorities.
Deferred income tax is recognized, using the liability method, on temporary differences arising between the tax bases of assets and liabilities and their carrying amounts in the consolidated financial statements. However, the deferred income tax is not accounted for if it arises from initial recognition of an asset or liability in a transaction other than a business combination that at the time of the transaction affects neither accounting nor taxable profit or loss. Deferred income tax is determined using tax rates (and laws) that have been enacted or substantively enacted by the date of the statement of financial position and are expected to apply when the related deferred income tax asset is realized or the deferred income tax liability is settled.
Deferred income tax assets are recognized only to the extent that it is probable that future taxable profit will be available against which the temporary differences can be utilized.
Deferred income tax is provided on temporary differences arising on investments in subsidiaries, except where the timing of the reversal of the temporary difference is controlled by the Group and it is probable that the temporary difference will not reverse in the foreseeable future.
The Group is able to control the timing of dividends from its subsidiaries and hence does not expect to remit overseas earnings in the foreseeable future in a way that would result in a charge to taxable profit. Hence deferred tax is recognized in respect of the retained earnings of overseas subsidiaries only to the extent that, at the date of the statement of financial position, dividends have been accrued as receivable or a binding agreement to distribute past earnings in future has been entered into by the subsidiary.
| 2.23. | Revenue recognition |
The Group is engaged in agricultural activities in several business segments. Revenue is measured at the fair value of the consideration received or receivable. Provided it is probable that the economic benefits will flow to
The accompanying notes are an integral part of these consolidated interim financial statements.
F-111
Table of Contents
Union Agriculture Group Corp.
Notes to the Consolidated Interim Financial Statements (Continued)
(All amounts in US$, except shares and per share data and as otherwise indicated)
| 2.23. | Revenue recognition (continued) |
the Group and the revenue and costs, if applicable, can be measured reliably, revenue is recognized in profit or loss. The Group recognizes revenue on product sales when the produce or biological assets are delivered and the customers take ownership and assume risk of loss, which is when the products are received by the customer at its or a designated location or collected directly by the customer from the cultivation bases, collection of the relevant receivable is probable and the selling price is fixed or determinable. Net sales of products represent the invoiced value of goods, net of trade discounts and allowances, if any. The Group also provides certain ancillary agricultural related services to third parties. The Group also leases a mill and other warehousing space to third parties. Revenue from services is recognized as services are rendered. Lease income is recognized as services are provided. When lease agreements provide for contingent rents, rental income is recognized when the contingency is resolved.
| 2.24. | Earnings per share |
Basic loss per share is calculated by dividing the net loss for the period attributable to equity holders of the parent by the weighted average number of common shares outstanding during the period. Diluted net loss per share is computed by dividing the net loss for the period by the weighted average number of common shares outstanding, and when dilutive, adjusted for the effect of all potentially dilutive shares, including share options, on an as-if converted basis. For all periods presented, there were no differences in the weighted-average number of common shares used for basic and diluted net loss per share as the effect of all potentially dilutive shares outstanding was anti-dilutive. For all periods presented, the weighted-average number of common shares was restated to give effect to the consolidation of the common shares of the Group on the basis of a ratio of one post-consolidation common share for every six pre-consolidation common shares (see Note 26 for details).
| 2.25. | Dividend distribution |
Cash dividend distribution to the Group’s shareholders is recognized as a liability in the Group’s financial statements in the period in which the dividends are approved.
| 2.26. | Equity-settled share-based payments |
The Group issues equity settled share-based payments to certain directors and executive officers as part of their remuneration package. In addition, the Group issues equity settled share-based payments to selling agents (including directors acting as selling agents) who assisted the Group in connection with its capital raisings through private placements. Equity settled awards are measured at fair value at the date of grant. The Group measures the fair value using the valuation technique that they consider to be the most appropriate to value each class of award. Methods used may include Black-Scholes calculations or other models as appropriate. The valuations take into account factors such as non-transferability, exercise restrictions and behavioral considerations.
For equity settled share-based payments granted to directors and executive officers as part of their remuneration package, an expense is recognized in the statement of comprehensive income to spread the fair value of each award over the vesting period on a straight-line basis, after allowing for an estimate of the awards that will eventually vest. Certain awards granted to directors vest immediately upon granting.
The accompanying notes are an integral part of these consolidated interim financial statements.
F-112
Table of Contents
Union Agriculture Group Corp.
Notes to the Consolidated Interim Financial Statements (Continued)
(All amounts in US$, except shares and per share data and as otherwise indicated)
| 2.26. | Equity-settled share-based payments (continued) |
The estimate of the level of vesting is reviewed at least annually, with any impact on the cumulative charge being recognized immediately. For equity settled share-based payments granted to selling agents (including directors acting as selling agents), the charge is deducted from equity as part of the transaction costs directly attributable to the capital issuance.
When the options are exercised, the Group issues new shares. The proceeds received net of any directly attributable transaction costs are credited to share capital when the options are exercised.
| 2.27. | Termination benefits |
Termination benefits are payable when employment is terminated by the Group before the normal retirement date, or whenever an employee accepts voluntary redundancy in exchange for these benefits. The Group recognizes termination benefits when it is demonstrably committed to either: terminating the employment of current employees according to a detailed formal plan without possibility of withdrawal; or providing termination benefits as a result of an offer made to encourage voluntary redundancy. Benefits falling due more than 12 months after the statement of financial position date are discounted to their present value.
| 2.28. | Deferred offering costs |
Deferred offering costs are transaction costs that are incremental and directly attributable to the issuance of shares. Deferred offering costs include legal, accounting and filing fees relating to the offering and are capitalized within “Trade and other receivables, net”. The deferred offering costs will be offset against offering proceeds in the event the offering is successful. In the event the offering is unsuccessful or is abandoned, the deferred offering costs will be expensed.
| 3. | Financial risk management |
The Group’s activities are exposed to a variety of financial risks in the normal course of the Group’s business. The Group’s overall risk management program focuses on the unpredictability of financial markets and seeks to minimize the Group’s capital costs by using suitable means of financing and to manage and control the Group’s financial risks effectively. The Group may use financial instruments to hedge certain risk exposures when deemed appropriate based on its internal management risk policies. The Group has not hedged any financial instruments since inception through June 30, 2010. However, during the nine-month period ended March 31, 2011, the Group began using a limited number of derivative financial instruments to hedge exposure to price risk.
The Group’s approach to the identification, assessment and mitigation of risk is carried out by the Board of Directors, which focuses on timely and appropriate management of risk. The Board of Directors has overall accountability for the identification and management of risk across the Group. The Board maintains a formal set of delegated authorities (including policies for credit and treasury) that clearly define the responsibilities delegated to management and those retained by the Board. The Board approves these delegated authorities and reviews them annually.
The principal financial risks arising from financial instruments are agricultural activities price risk, currency risk, liquidity risk and credit risk. The Group was exposed to equity securities price risk during a limited period
The accompanying notes are an integral part of these consolidated interim financial statements.
F-113
Table of Contents
Union Agriculture Group Corp.
Notes to the Consolidated Interim Financial Statements (Continued)
(All amounts in US$, except shares and per share data and as otherwise indicated)
| 3. | Financial risk management (continued) |
of time as further discussed below. The Group does not have and has not had any significant exposure to interest rate risk since inception and through March 31, 2011. This section provides a description of the principal risks and uncertainties that could have a material adverse effect on the Group’s strategy, performance, results of operations and financial condition.
Following is a description of the Group´s exposure from the principal financial risks as well as sensitivity analysis for the nine-month periods ended March 31, 2011 and 2010. These disclosures do not appear in any particular order of potential materiality or probability of occurrence:
| • | Currency risk |
The Group’s statement of cash flows, statement of comprehensive income and statement of financial position are presented in US dollars and may be affected by fluctuations in exchange rates. Currency risks as defined by IFRS 7 arise on account of monetary assets and liabilities being denominated in a currency that is not the functional currency.
During the nine-month periods ended March 31, 2011 and 2010, the Group´s forecasted commercial transactions and recognized assets and liabilities were substantially denominated in the Group’s functional currency. Transactions denominated in currencies other than the functional currency were limited to Uruguayan Pesos and to a lesser extent foreign currencies such as Canadian Dollars and Euros. Therefore, the Group is not significantly exposed to currency risk. The Group’s net financial position exposure to the US Dollar is managed on a case-by-case basis. During the nine-month periods ended March 31, 2011 and 2010, the Group has not entered into any foreign exchange derivative contracts or other financial instruments to hedge currency risk.
The following table details the Group’s exposure at March 31, 2011 and 2010 to currency risk arising from recognized assets or liabilities denominated in a currency other than the functional currency of the Group. For presentation purposes, the amounts are shown in US Dollars, translated using the spot rate at the period-end.
| US Dollar | ||||||||
Net monetary position Asset / (Liability) | March 31, 2011 | March 31, 2010 | ||||||
Uruguayan Peso | 823,818 | 1,462,794 | ||||||
Euros | 30,054 | 28,602 | ||||||
Canadian dollar | 54,801 | 415,609 | ||||||
Total | 908,673 | 1,907,005 | ||||||
The accompanying notes are an integral part of these consolidated interim financial statements.
F-114
Table of Contents
Union Agriculture Group Corp.
Notes to the Consolidated Interim Financial Statements (Continued)
(All amounts in US$, except shares and per share data and as otherwise indicated)
| 3. | Financial risk management (continued) |
Therefore, the Group’s analysis is carried out based on the exposure of each foreign currency against the US dollar. The Group estimates that, other factors being constant, a 10% devaluation (revaluation) of the respective foreign currencies against the US dollar at March 31, 2011 and 2010 would (increase) or decreaseLoss Before Income Tax for the nine-month periods ended March 31, 2011 and 2010, as follows:
| US Dollar | ||||||||
Net monetary position | March 31, 2011 | March 31, 2010 | ||||||
Uruguayan Peso | (82,382 | ) | (146,279 | ) | ||||
Euros | (3,005 | ) | (2,860 | ) | ||||
Canadian dollar | (5,480 | ) | (41,561 | ) | ||||
Increase in Loss Before Income Tax | (90,867 | ) | (190,700 | ) | ||||
| • | Agricultural activities price risk |
Inflation in raw materials costs and in the costs of goods and services from industry suppliers and manufacturers presents risks to project economics. A portion of the Group’s cost structure includes the cost of raw materials primarily seeds, fertilizers and agrochemicals, among others. Prices for these raw materials may vary significantly.
The Group estimates that, for the nine-month period ended March 31, 2011, other factors being constant, a 5% increase or decrease in prices of raw materials (primarily seeds, fertilizers and agrochemicals) would increase or decreaseLoss Before Income Tax by approximately US$ 148,986 respectively. The Group estimates that, for the nine-month period ended March 31, 2010, other factors being constant, a 5% increase or decrease in prices of raw materials (primarily seeds, fertilizers and agrochemicals) would increase or decreaseLoss Before Income Tax by approximately US$ 33,127 respectively.
Crops, rice, beef and milk prices have shown and are expected to continue to show considerable volatility as supply and demand globally and in Uruguay fluctuate in response to financial, climate, sentiment and other factors. As a result, movements in market prices would have a significant impact on the Group’s earnings. The Group’s objective is to achieve steady state production at levels that will ensure a relatively low cost base and this is expected to protect the Group’s profitability. The Group has established strategies with the intent of minimizing market price risk, such as selling rice immediately after harvest. During the nine-month period ended March 31, 2011, the Group began using a limited amount of commodity-based future contracts to hedge price risk volatility. See further below for details. Although efforts are made to implement strategies, there can be no assurance that the Group will be fully shielded from downsides in market prices.
The Group sells its entire rice production to S.A. Molinos Arroceros Nacionales, or SAMAN, the leading rice producer and exporter in Uruguay under an agreement negotiated on an annual basis. Under the agreement, the Group sells the entire rice production to SAMAN at stipulated prices reflecting a negotiated price between the local associations of rice growers and rice manufacturing industry considering the international price of rice with the United States market as a primary reference. Although there are other buyers in the Uruguayan market, the Group believes selling to SAMAN at this stage represents the more sensible alternative based on price, quantity, quality and collection of receivables.
The accompanying notes are an integral part of these consolidated interim financial statements.
F-115
Table of Contents
Union Agriculture Group Corp.
Notes to the Consolidated Interim Financial Statements (Continued)
(All amounts in US$, except shares and per share data and as otherwise indicated)
| 3. | Financial risk management (continued) |
A significant portion of cattle products is currently sold to Frigorífico Tacuarembó, a slaughter company in Uruguay, an affiliate of the Marfrig Group of Brazil. The Group has an agreement with Frigorífico Tacuarembó to buy products at prices based on referenced prices provided by Instituto Nacional de Carnes or INAC.
Wool products, although less significant, are currently being sold to Central Lanera Uruguaya, or CLU. The Group has an agreement with CLU to sell its entire wool production. The Group receives average market prices depending on the category of wool sold. Live sheep are currently sold to several customers.
The Group initiated its milk production in August 2010. The Group sells its entire milk production to CONAPROLE, a dairy exporter in Uruguay. As milk is a perishable product there is no ability for the Group to mitigate pricing risk through inventory management. However, dairy prices have historically tended to have reasonable correlation with prices of agricultural inputs such as feed and fertilizer, and the Group will monitor these relationships in order to adapt its tactics to suit.
The Group estimates that, for the nine-month period ended March 31, 2011, other factors being constant, a 10% increase or decrease in the prices of the Group’s products would decrease or increaseLoss Before Income Tax by approximately US$ 604,781 respectively. The Group estimates that for the nine-month period ended March 31, 2010, other factors being constant, a 10% increase or decrease in the prices of the Group’s products would decrease or increaseLoss Before Income Tax by approximately US$ 147,315 respectively.
| • | Equity securities price risk |
The Group sold its only investment in equity securities bought between March and August 2010 (New Zealand Farming System Uruguay Ltd.) in October 2010. As such, it only exposed the Group to equity securities price risk for a limited period of time and that exposure was immaterial. There are no equity securities held as of March 31, 2011. Currently, the Group’s investment policy is very limited; however, the Group may purchase investments in the future depending on its actual cash requirements. The Group’s policy is to maximize returns while limit counterparty risk exposure. For all periods presented, the Group did not enter into any derivative contract or financial instrument to hedge this risk.
| • | Liquidity risk |
The Group is exposed to liquidity risk, including the risk that financial assets cannot readily be converted to cash without loss of value. Failure to manage financing risks could have a material impact on the Group’s cash flow and statement of financial position.
The Group’s policy is to regularly monitor current and expected liquidity requirements to ensure that it maintains sufficient reserves of cash to meet its liquidity requirements in the short and longer term. The Group does not maintain borrowings with external third parties and is financed principally through capital contributions from existing and new shareholders.
The accompanying notes are an integral part of these consolidated interim financial statements.
F-116
Table of Contents
Union Agriculture Group Corp.
Notes to the Consolidated Interim Financial Statements (Continued)
(All amounts in US$, except shares and per share data and as otherwise indicated)
| 3. | Financial risk management (continued) |
The table below analyses the Group’s non-derivative financial liabilities into relevant maturity groupings based on the remaining period at the statement of financial position date to the contractual maturity date. The amounts disclosed in the table are the contractual undiscounted cash flows (except for short-term payables when discounting is not applied) of non-derivative financial liabilities only, and as a result, they do not reconcile to the amounts disclosed on the statement of financial position.
| At 31 March 2011 | Less than 1 year | Total | ||||||||||
Trade and other payables | 8,065,666 | 8,065,666 | ||||||||||
Finance leases | 5,476 | 5,476 | ||||||||||
Total | 8,071,142 | 8,071,142 | ||||||||||
| At 30 June 2010 | Less than 1 year | Between 1 and 2 years | Total | |||||||||
Trade and other payables | 690,342 | — | 690,342 | |||||||||
Finance leases | 4,916 | 2,649 | 7,565 | |||||||||
Total | 695,258 | 2,649 | 697,907 | |||||||||
| • | Credit risk |
The Group’s exposure to credit risk takes the form of a loss that would be recognized if counterparties failed to, or were unable to, meet their payment obligations. These risks may arise in certain agreements in relation to amounts owed for physical product sales and the investment of surplus cash balances. The Group is also exposed to political and economic risk events, which may cause non-payment of foreign currency obligations to the Group.
The Group is subject to credit risk arising from outstanding receivables, cash and cash equivalents and deposits with banks and financial institutions. The Group’s policy is to manage credit exposure to trading counterparties within defined trading limits. All of the Group’s significant counterparties are assigned internal credit limits. As of March 31, 2011 and June 30, 2010, the Group had more than 85% of its deposits of cash and cash equivalents in one Zurich-based bank where the cash proceeds from the private placements was received. This bank has an A external credit rating. As the operations of the Group are increased in the future, it may deposit cash and cash equivalents with more financial institutions of similar quality and rating. The maximum exposure to credit risk is represented by the carrying amount of cash and cash equivalents in the statement of financial position. The Group’s exposure of credit risk arising from trade receivables is set out in Note 12. The Group’s exposure of credit risk arising from cash and cash equivalents is set out in the table below.
The accompanying notes are an integral part of these consolidated interim financial statements.
F-117
Table of Contents
Union Agriculture Group Corp.
Notes to the Consolidated Interim Financial Statements (Continued)
(All amounts in US$, except shares and per share data and as otherwise indicated)
| 3. | Financial risk management (continued) |
The principal assets with credit risk as of March 31, 2011 and June 30, 2010 are as follows:
| Credit rating | March 31, 2011 | June 30, 2010 | ||||||||
Cash at banks | ||||||||||
Local banks | AA | 6,108,253 | 202,155 | |||||||
Foreign banks | A | 98,779,126 | 66,906,111 | |||||||
Total cash at banks(i) | 104,887,379 | 67,108,266 | ||||||||
Trade and other receivables | ||||||||||
Loans | AA | 821,377 | 2,579,927 | |||||||
| 821,377 | 2,579,927 | |||||||||
| (i) | Does not include cash on hand amounting to US$ 54,782 as of March 31, 2011 (June 30, 2010: US$ 17,372). |
For all periods presented, sales were significantly concentrated in a few customers. Sales of rice were concentrated in only one customer during the nine-month period ended March 31, 2011. For the nine-month period ended March 31, 2011, more than 85% of the cattle sales were concentrated in two external customers. For the nine-month period ended March 31, 2010, more than 83% of the cattle sales were concentrated in only one customer. More than 87% of the crops sales were concentrated in two customers during the nine-month period ended March 31, 2011 and while were concentrated in one customer during the nine-month period ended March 31, 2010. Sales of dairy began in August 2010 and were concentrated in only one customer. During the nine-month period ended March 31, 2011, sales of sheep were well dispersed, but sales of wool were concentrated in one customer. There were no sales of sheep and/or wool during the nine-month period ended March 31, 2010. Other sales and services were not material for all the periods presented. Although all of this represents a concentration of credit risk, the Board views the risk as mitigated due to counterparty’s size and historic reliability of payments. See “Agricultural activities price risk” for additional details.
No credit limits were exceeded during the reporting periods and management does not expect any losses from non-performance by these counterparties. If any of the Group’s customers are independently rated, these ratings are used. Otherwise, if there is no independent rating, the Group assesses the credit quality of the customer taking into account its financial position, past experience and other factors. The Group may seek cash collateral, letter of credit or parent company guarantees, as considered appropriate. Sales to customers are primarily made by credit with customary payment terms. The maximum exposure to credit risk is represented by the carrying amount of each financial asset in the statement of financial position after deducting any impairment allowance. The Group’s exposure of credit risk arising from trade receivables is set out in Note 12.
The Group’s primary objective for holding derivative financial instruments is to manage commodity price risk. The Group generally enters into derivative transactions with high-credit-quality counterparties and, by policy, limit the amount of credit exposure to any one counterparty based on an analysis of that counterparty’s relative credit standing. The amounts subject to credit risk related to derivative instruments are generally limited to the amounts, if any, by which a counterparty’s obligations exceed the obligations with that counterparty. See below for details.
The accompanying notes are an integral part of these consolidated interim financial statements.
F-118
Table of Contents
Union Agriculture Group Corp.
Notes to the Consolidated Interim Financial Statements (Continued)
(All amounts in US$, except shares and per share data and as otherwise indicated)
| 3. | Financial risk management (continued) |
| • | Capital risk management |
The Group’s objectives when managing capital are to safeguard the Group’s ability to continue as a going concern in order to provide returns for shareholders and to maintain an optimal capital structure to reduce the cost of capital. In order to maintain or adjust the capital structure, the Group may adjust the amount of dividends paid to shareholders, return capital to shareholders, issue new shares or sell assets.
The Group analyzes its capital structure using the gearing ratio. The gearing ratio is calculated as total financial debt divided by total equity as shown on the statement of financial position. The Group has been mostly dependant on equity financing. Financial debt form a very insignificant portion of the Group’s total financing for all the periods presented (US$ 5,269 and US$ 6,930 relating to finance lease liabilities only). Thus, the Group is a very low-geared company. The Group has maintained an almost nil gearing ratio since inception through March 31, 2011 showing that the Group has heavily relied on equity capital as a source of finance.
| • | Derivative financial instruments |
As part of its business operations, the Group uses certain derivative financial instruments to manage its exposure to price risks as discussed above. As part of this strategy, the Group entered into a limited number of crop future contracts to manage its exposure to price volatility. The Group’s policy is not to use derivatives for speculative purposes.
Derivative financial instruments involve, to a varying degree, elements of market and credit risk not recognized in the financial statements. The market risk associated with these instruments resulting from price movements is expected to offset the market risk of the underlying transactions, assets and liabilities, being hedged. The counterparties to the agreements relating to the Group’s contracts generally are large institutions with credit ratings equal to or higher than the Group’s. The Group continually monitors the credit rating of such counterparties and seeks to limit its financial exposure to any one financial institution. While the contract or notional amounts of derivative financial instruments provide one measure of the volume of these transactions, they do not represent the amount of the Group’s exposure to credit risk. The amounts potentially subject to credit risk (arising from the possible inability of counterparties to meet the terms of their contracts) are generally limited to the amounts, if any, by which the counterparties’ obligations under the contracts exceed the Group’s obligations to the counterparties.
Non-hedging derivatives are classified as current when realization within 12 months is expected. Otherwise they are classified as non-current, although any portion that is expected to be realized within 12 months of the date of the statement of financial position is presented as current.
The accompanying notes are an integral part of these consolidated interim financial statements.
F-119
Table of Contents
Union Agriculture Group Corp.
Notes to the Consolidated Interim Financial Statements (Continued)
(All amounts in US$, except shares and per share data and as otherwise indicated)
| 3. | Financial risk management (continued) |
During the nine-month period ended March 31, 2011, the Group closed one position on wheat future contracts for a total notional amount of US$ 367,500. This closed position generated a gain of US$ 43,635 included within “Other operating income, net” in the statement of comprehensive income. As of March 31, 2011, the Group maintains only one open position as described below:
| March 31, 2011 | ||||||||||||||||
Type of derivative contract | Tons | Notional amount | Market Value Asset | Gain | ||||||||||||
Futures: | ||||||||||||||||
Sale | ||||||||||||||||
Soybean | 1,361 | 712,500 | 7,250 | 7,250 | ||||||||||||
Commodity future contract fair values are computed with reference to quoted market prices on future exchanges.
| • | Other non-financial risks: nature risk |
The Group’s revenue depends significantly on the ability to manage biological assets and agricultural produce. The ability to manage biological assets and agricultural produce may be affected by unfavorable local weather conditions and natural disasters. Weather conditions such as floods, droughts and windstorms and natural disasters such as fire, disease, insect infestation and pests are examples of such events. The occurrence of severe weather conditions or natural disasters may affect the growth of our biological assets, which in turn may have a material adverse effect on the Group’s ability to harvest agricultural produce in sufficient quantities and in a timely manner.
| 4. | Critical accounting policies, estimates and judgments |
Critical accounting policies are those that are most important to the portrayal of the Group’s financial condition, results of operations and cash flows, and require management to make difficult, subjective or complex judgments and estimates about matters that are inherently uncertain. Management bases its estimates on historical experience and other assumptions that it believes are reasonable. The Group’s critical accounting policies are discussed below. Actual results could differ from estimates used in employing the critical accounting policies and these could have a material impact on the Group’s results of operations.
(a) Land under Promesas
General Provisions of law in effect through June 30, 2011:
Generally, real estate transactions in Uruguay begin with the execution of a preliminary agreement with respect to the real estate, or a “Boleto de Reserva”, by which the seller “books” or “reserves” the real estate property to the buyer. The main intention of theBoleto de Reserva is to obtain, prior to definitive purchase; all required documentation before the National Registries in order to duly confirm that the real estate to be transferred has no liens and has all of the required documentation. Once all of the documentation has been obtained, it is common business practice in the real estate market in Uruguay that the parties execute a purchase promise, or “Promesa de Compraventa” (hereinafter referred to as the “Promesa”) for the real estate.
The accompanying notes are an integral part of these consolidated interim financial statements.
F-120
Table of Contents
Union Agriculture Group Corp.
Notes to the Consolidated Interim Financial Statements (Continued)
(All amounts in US$, except shares and per share data and as otherwise indicated)
| 4. | Critical accounting policies, estimates and judgments (continued) |
ThePromesais a contract regulated by Uruguayan Law No. 8,733. Under such law, aPromesais a definitive contract and not a preliminary agreement. In order to be enforceable against third parties, thePromesais usually registered before the public registry (Registro de la Propiedad Inmobiliaria). Under Law 8,733, thePromesaprovides the buyer with certain rights such as the right to access and use the property, and sell, lease, assign or pledge the rights under thePromesa.APromesais completed, and legal title is transferred, when a final purchase agreement, orescritura, is executed. The holder of aPromesa has the ability to sell his rights in thePromesa,which would allow the buyer of suchPromesa the right to seek legal title to the land. Based on the opinion of the Group’s legal counsel, any company regardless of its legal structure can enter into aPromesa under Law No. 8,733.
In 2006, the Uruguayan government enacted Law No. 18,092 (as amended by Article 349 of Law No. 18,172). Generally, Law No. 18,092 prohibits persons other than individuals and companies having registered shares held by individuals to (1) be owners of farmland and/or (2) to use farmland in Uruguay. The consequence of non-compliance with Law No. 18,092 was that the non-complying company would be deemed automatically dissolved and its assets distributed to its shareholders. Under Law No. 18,092, companies that had bearer shares or whose shares were not owned by natural persons (“Non-Compliant Companies”) were provided a period of two years from enactment of Law No. 18,092 to modify their capital structure to comply with such law (the “Compliance Period”). During the Compliance Period, Non-Compliant Companies were permitted to continue using farmland. Subsequent to the enactment of Law No. 18,092, the Uruguayan government extended the Compliance Period for successive one-year periods through June 30, 2011. Consequently, Non-Compliant Companies were permitted to continue using farmland until that date.
In 2007 and 2008 the Executive Power of Uruguay issued Decrees Nos. 225/07 and 201/08 providing certain exceptions to Law No. 18,092 for Non-Compliant Companies. These exceptions are the following:
| (i) | An exception based on the specific features of a legal entity, including domestic or foreign corporations whose shares are traded in well-known local or foreign stock exchange markets, domestic or foreign pension funds (the “Public Company Exception”), and |
| (ii) | An exception granted to legal entities (including corporations, branches of foreign companies, trusts, investment funds) with bearer or registered shares not covered by (i) above, including legal entities that develop activities which constitute part of a project considered as a priority for the productive development of Uruguay (“the Productive Project Exception”). |
Applications for the Productive Project Exception are reviewed by theComisión de Aplicación de la Ley de Tierras (or the “Land Law Commission”) based on business plans furnished by the requesting company. In order for a project to qualify for the Productive Project Exception, the Land Law Commission considers factors such as creation of new employment opportunities within the rural sector; development of small family enterprises; eradication of poverty in rural sectors; incorporation of technology; promotion of territorial decentralization; and development of new productive circuits. The review of an application by the Land Law Commission generally takes 12 to 16 months for final determination. However, Decrees Nos. 225/07 and 201/08 also provide for an expedited proceeding for authorization to own and/or use farmland for companies that have already obtained an exception to own and/or use farmland. In such cases, authorization to own and/or use additional land shall be automatically granted within 30 business days after an application for government authorization has been properly submitted, unless the Executive Power denies the application prior to such time (the “Expedited
The accompanying notes are an integral part of these consolidated interim financial statements.
F-121
Table of Contents
Union Agriculture Group Corp.
Notes to the Consolidated Interim Financial Statements (Continued)
(All amounts in US$, except shares and per share data and as otherwise indicated)
| 4. | Critical accounting policies, estimates and judgments (continued) |
Process”). If the Executive Power denies the application under the Expedited Process, processing will continue in accordance with the standard authorization procedures as described above.
General Provisions of law in effect subsequent to June 30, 2011:
The Compliance Period was not extended beyond June 30, 2011. However, in contemplation of the expiration of the Compliance Period, on June 23, 2011, the Executive Power issued Decree No. 218/11, which provided that Non-Compliant Companies that properly submitted an application on or prior to June 30, 2011 are permitted to continue using farmland subject to such applications pending final determination of such applications. However, Decree No. 218/11 does not itself grant automatic authorization.
The Group’s situation as of the date of approval of the financial statements:
The common stock of the Group’s subsidiaries is currently represented by bearer shares not held by individuals as mandated by Law No. 18,092. Therefore, as of the date of these financial statements, the subsidiaries of the Group are Non-Compliant Companies under by Law No. 18,092.
The subsidiaries of the Group have executedPromesas as fully permitted by Law No. 8,733. As described above, by execution of thePromesas, these subsidiaries have acquired certain rights to, but not legal title to the land. Therefore, the subsidiaries of the Group are not legal owners of the land. Based on the opinion of the Group’s legal counsel, these subsidiaries of the Group are therefore not currently violating Law No. 18,092 with respect to the ownership of the land. In order to maintain their current legal structure and be therefore able to own the land, these subsidiaries have requested authorization to own the land under the Productive Project Exceptions as further described below.
Furthermore, most of the subsidiaries of the Group that hold land underPromesas are not using the land themselves. Instead, until June 22, 2011, the land underlying suchPromesas was being used by UAG S.A., another wholly owned subsidiary of the Group, pursuant to intercompany agreements under Uruguayan law known as “Comodatos”, between each of the subsidiaries holding land underPromesas and UAG S.A. TheComodatosare inter-company contracts pursuant to which each of the subsidiaries of the Group that holds land underPromesas has transferred the right to use the land underlying suchPromesas to UAG S.A., another wholly-owned subsidiary of the Group. AComodato allows the promissory buyer of land under aPromesa (the “transferor”) to transfer the right to use such land to another person (the “transferee”) so that the transferee may use such land. Under Uruguayan law, neither the transfer of such land by the transferor to the transferee, nor the use of such land by the transferee, is considered to be use of the land by the transferor, even where the two parties are affiliated. The Group decided to transfer the right to use the land to UAG S.A. throughComodatosin order to obtain benefits from a centralized management of most of its businesses in one company.
Four subsidiaries of the Group (Boisy S.A., Vadolmar S.A., Madalux S.A. and Nogatir S.A.) applied for and received the Productive Project Exception to own and use 188 hectares in December 2009 or the “First Productive Project”. These four subsidiaries executedescriturasand own the 188 hectares of land.
In October 2009, Rafilur S.A., Aguacare S.A. and Canteras Doradas S.A. applied for government authorization based on the Productive Project Exception to own 17,846 hectares of land or the “Second Productive Project”. Additionally, under the Second Productive Project, UAG S.A. applied for government authorization to use those 17,846 hectares of land. Such subsidiaries received the authorization to own and use
The accompanying notes are an integral part of these consolidated interim financial statements.
F-122
Table of Contents
Union Agriculture Group Corp.
Notes to the Consolidated Interim Financial Statements (Continued)
(All amounts in US$, except shares and per share data and as otherwise indicated)
| 4. | Critical accounting policies, estimates and judgments (continued) |
such 17,846 hectares of land under the Second Productive Project exception in May 2011. These subsidiaries expect to execute the deeds of title in due course. See Note 26 for details.
In March 2011, Alto Lucero S.A., Rafilur S.A. and Madalux S.A. applied for governmental authorizations based on the Productive Project Exception to own an aggregate of 51,081 hectares of land underPromesas, or the “Third Productive Project”. On June 27, 2011, the number of hectares under the Third Productive Project was extended to 66,645 hectares. Additionally, under the Third Productive Project, Boisy S.A. applied for government authorizations to use such 66,645 hectares of land since Boisy S.A. had received the right to use such hectares of land pursuant toComodatosas further described below. As of the date of these financial statements, the authorization for the “Third Productive Project” is pending. The Group believes that its business project contributes to the productivity of Uruguay, the creation of jobs, production of exportable commodities, incorporation of technology and other beneficial aspects, which are all factors in the determination of the Third Productive Project Exception. Based on the opinion of legal counsel, and merits of the projects presented and approvals obtained to date, the Group expects that its subsidiaries will obtain the required exception to the Third Productive Project within 12 to 16 months. However, there can be no assurance as to the timing or final outcome of this authorization request. If the subsidiaries receive the authorization for the Third Productive Project, the subsidiaries will proceed with the execution of theescrituras(deed) to obtain legal title on the land.
Furthermore, on June 22, 2011,Comodatosthat transfer the right to use approximately 64,000 hectares of land under the Third Productive Project to UAG S.A. were terminated, and newComodatoswere entered into between each of the subsidiaries of the Group that holds land underPromesas and Boisy S.A., another wholly owned subsidiary of the Group. The Group entered into these newComodatosas Boisy S.A. had already received authorization to use land in the past and, in accordance with Decrees Nos. 225/07 and 201/08, it would be allowed to apply for the Expedited Process as described above. Therefore, on June 22, 2011, Boisy S.A. applied for government authorization to use approximately 64,000 hectares of land, which were also included under the Third Productive Project. Boisy S.A. is currently using such land pursuantComodatosas described above. The Group expects to obtain this authorization in 30 business days after its application, although there can be no assurance that the government will not deny the application. In the event the government denies Boisy S.A.’s application under the Expedited Process, processing will continue with the standard authorization under the Third Productive Project as further described above. The Group did not apply for the Expedited Process prior to June 22, 2011 during the Compliance Period as described above, since the Group expected the government would extend the Compliance Period subsequent to June 30, 2011 and thus the Third Productive Project would be authorized in due course.
The Group is currently authorized to use all of its land held underPromesas, as the use of all of its land held underPromesas has either been authorized by the Uruguayan government or is subject to applications for authorization and, therefore, use of such land is permitted under Decree No. 218/11.
The Group is in the process of completing an initial public offering of its shares in an international market although timing cannot be predicted with certainty. Upon the completion of the offering, the Group’s common shares will be listed on the New York Stock Exchange, and thereafter the subsidiaries will be able to apply for an authorization to own and use based on the Public Company Exception. This authorization process generally takes approximately 12 to 16 months after the Offering is complete. Once the authorization is obtained, the subsidiaries will proceed with the execution of theescrituras to obtain legal title to the land under the Third Productive Project.
The accompanying notes are an integral part of these consolidated interim financial statements.
F-123
Table of Contents
Union Agriculture Group Corp.
Notes to the Consolidated Interim Financial Statements (Continued)
(All amounts in US$, except shares and per share data and as otherwise indicated)
| 4. | Critical accounting policies, estimates and judgments (continued) |
Because of the prohibition on ownership of farmland by Non-Compliant Companies set forth in Law No. 18,092, legal title to the land has not been obtained as of the date of these financial statements. Nevertheless, legal counsel of the Group has opined that thePromesasare legally valid under Law No. 8,733, and as a result of their validity and for the reasons cited below, the Group has recognized the payments for the full price of land underPromesasas assets under the line item “Land underPromesas” and “Investment Property underPromesas”in the statement of financial position, as applicable.
The Group has recognized payments forPromesasfor whichtitle has not been obtained as assets on the statement of financial position because (1) the Group paid a full price for thePromesas and that price can be measured reliably and thePromesasare legally valid under Law No. 8,733; (2) it is probable that the future economic benefits associated with thePromesas will flow to the Group as the Group has the ability to sell its rights in thePromesas and the sales value less costs to sell such rights is in excess of the carrying value of the assets recorded, and because from the date thePromesaswere signed, the Group is obtaining benefits from using the land for its agricultural purposes as permitted by Law 8,733, Law 18,092 and related Decrees; (3) thePromesas entitle the Group to certain rights including but not limited to (i) the use of the underlying land (as permitted by Law 8,733) through June 30, 2011, and after that date, pending determination of the Group’s application for government authorization; (ii) the risks and benefits associated with thePromesas; (iii) the right to sell, assign, transfer, or lease thePromesas to a third party, in the case of a sale for an amount equal to the fair value of the land because a buyer would be expected to seek the deed; and/or (iv) pledge thePromesas; and (4) thePromesaswe executed are definitive binding agreements between the Group and a seller and are legally registered per Uruguayan Law and enforceable against third parties. As of the date of these financial statements, the fair value less costs to sell of the land underlying thePromesas exceeds the amounts paid for thePromesas such that there is no indication of impairment of the assets.
Once the authorizations to own and use the land are obtained and the deeds of title orescrituras are executed, the payments reported as land underPromesas will be reclassified to the land category within property, plant and equipment.
Upon completion of the Offering, the Group intends to submit the application for approval under the Public Company Exception described above. The Group would be permitted to apply for such exemption once the Offering is complete. The Group expects the process to obtain the Public Company Exception to take approximately 12 to 16 months after the application. In addition, as further described above, the Group is able to sell and/or transfer thePromesas at any point in time to a third purchaser who will seek execution of the deed of title.
(b) Impairment testing
At the date of each statement of financial position, the Group reviews the carrying amounts of its property, plant and equipment, land underPromesas, investment property underPromesas and finite-life intangible assets carried at cost to determine whether there is any indication that those assets have suffered an impairment loss. If any such indication exists, the recoverable amount of the asset is estimated in order to determine the extent, if any, of the impairment loss. Where the asset does not generate cash flows that are independent from other assets, the Group estimates the recoverable amount of the cash-generating unit to which the asset belongs. Each of the individual items within the Group’s property, plant and equipment and land underPromesasdoes not generally generate independent cash flows.
Goodwill on acquisition is initially measured at cost being the excess of the cost of the business
The accompanying notes are an integral part of these consolidated interim financial statements.
F-124
Table of Contents
Union Agriculture Group Corp.
Notes to the Consolidated Interim Financial Statements (Continued)
(All amounts in US$, except shares and per share data and as otherwise indicated)
| 4. | Critical accounting policies, estimates and judgments (continued) |
combination over the Group’s interest in the net fair value of the identifiable assets, liabilities and contingent liabilities. As of the acquisition date, any goodwill acquired is allocated to the cash-generating unit (‘CGU’) expected to benefit from the business combination.
Following initial recognition, goodwill is measured at cost less any accumulated impairment losses. Goodwill is tested for impairment annually, or more frequently if events or changes in circumstances indicate that the carrying amount may be impaired. The impairment review requires management to undertake certain judgments, including estimating the recoverable value of the CGU to which the goodwill relates, based on either fair value less costs-to-sell or the value-in-use, as appropriate, in order to reach a conclusion on whether it deems the goodwill is impaired or not.
For purposes of the impairment testing, each CGU represents the smallest identifiable group of assets that generate cash inflows that are largely independent of the cash inflows from other assets or group of assets. Farmland may be used for different activities that may generate independent cash flows. When farmland is used for single activities (i.e. crops), it is considered as one CGU. Generally, each separate farmland is treated as a single CGU. Otherwise, when farmlands are used for more than one activity (i.e. crops and cattle), the farmland is further subdivided into two or more CGUs, as appropriate, for purposes of impairment testing.
Based on these criteria, management identified a total amount of 57 CGUs as of March 31, 2011.
As of March 31, 2011, the Group tested for impairment all CGUs regardless of which CGU has allocated any goodwill. The Group tested all CGUs based on a fair value less costs to sell model and determined that no impairment was necessary.
The following table shows the amounts of goodwill and property, plant and equipment items of the two CGUs where goodwill was allocated at the date of acquisition for March 31, 2011:
CGU / Operating segment | March 31, 2011 | |||
Arandanos del Fortin / All other segments | 284,406 | |||
Arandanos del 41 / All other segments | 95,662 | |||
Closing net book amount of goodwill allocated to CGUs (Note 9) | 380,068 | |||
Closing net book amount of PPE items and other assets | 574,941 | |||
Total assets allocated to 2 CGUs | 955,009 | |||
The remaining CGUs without any allocated goodwill are not detailed here for simplicity purposes. Property, plant and equipment, land underPromesas and finitelife intangible assets allocated to these CGUs, and investment property underPromesas have an aggregated net book value of US$ 222,837,834 as of March 31, 2011.
The Group estimates the fair value less costs to sell based on the best information available and refers to the amount at which the CGU could be bought or sold in a current transaction between willing parties. In calculating the fair value less costs to sell of its CGUs, management may be assisted by the work of external advisors. When using this model, the Group applies the “sales comparison approach” as its method of valuing most properties.
The accompanying notes are an integral part of these consolidated interim financial statements.
F-125
Table of Contents
Union Agriculture Group Corp.
Notes to the Consolidated Interim Financial Statements (Continued)
(All amounts in US$, except shares and per share data and as otherwise indicated)
| 4. | Critical accounting policies, estimates and judgments (continued) |
This approach is based on the theory that the fair value of a property is directly related to the selling prices of similar properties. The “sales comparison approach” considers current market conditions of the market involved, and is determined based on current recent market transactions within the regions where each farmland is located. This approach assumes that current recent market transactions are performed by willing buyers and sellers in an arm’s length transaction after proper marketing wherein the parties had each acted knowledgeably, prudently, and without compulsion. Furthermore, the “sales comparison approach” does not take into account the need to sell multiple properties, or that any sale may need to be completed on an expedited basis.
The Group with the assistance of external appraisers determines fair values by extensive analysis. Generally, a farmland value is based on the land’s productive capability (its ability to produce crops and/or to maintain livestock) and other factors such as climate, topography and location. A farmland may be rated considering such factors as soil texture and quality, yields, topography, drainage and rain levels. Based on these factors, each farm is assigned different soil classifications for the purposes of establishing a value. Soil classifications quantify the factors that contribute to the agricultural capability of the soil. Soil classifications range from the most productive to the least productive.
The first step to establishing an assessment for a farm is a sales investigation that identifies the valid farm sales in the area where the farm is located. A price per hectare is assigned for each soil class within each farm. This price per hectare is determined based on the quantitative and qualitative analysis described above considering parameters such as:
| • | Current soil productivity and yields; |
| • | Potential soil productivity based on market participant best use of soil property; |
| • | Projected gross margin derived from soil use; |
| • | Rental value obtained for soil use, if applicable; |
| • | Similar comparable farmland property within the topographic area. |
The results are then tested against actual sales, if any, and current market conditions to ensure the values produced are accurate, consistent and fair.
(c) Biological assets
When there is no active market or market-determined prices are not available, the Group determines the fair value of a biological asset in its present location and condition based on the present value of expected net cash flows from the biological asset discounted at a current market-determined pre-tax rate. The discounted cash flow model requires the input of highly subjective assumptions including observable and unobservable data. Generally the estimation of the fair value of biological assets is based on models or inputs that are not observable in the market and the use of unobservable inputs is significant to the overall valuation of the assets. Unobservable inputs are determined based on the best information available, for example by reference to historical information of past practices and results, statistical and agronomical information, and other analytical techniques. Key assumptions include future market prices, estimated yields at the point of harvest, estimated production cycle, future cash flows, future costs of harvesting and other costs, and estimated discount rate.
Market prices are generally determined by reference to observable data in the principal market for the agricultural produce. Harvesting costs and other costs are estimated based on historical and statistical data. Yields are estimated based on several factors including the location of the farmland and soil type, environmental
The accompanying notes are an integral part of these consolidated interim financial statements.
F-126
Table of Contents
Union Agriculture Group Corp.
Notes to the Consolidated Interim Financial Statements (Continued)
(All amounts in US$, except shares and per share data and as otherwise indicated)
| 4. | Critical accounting policies, estimates and judgments (continued) |
conditions, infrastructure and other restrictions and growth at the time of measurement. Yields are subject to a high degree of uncertainty and may be affected by several factors out of the Group’s control including but not limited to extreme or unusual weather conditions, plagues and other crop diseases.
The key assumptions discussed above are highly sensitive. Reasonable shifts in assumptions including but not limited to increases or decreases in prices, costs and discount factors used may result in a significant increase or decrease to the fair value of biological assets recognized at any given time. Cash flows are projected based on estimated production. Estimates of production in themselves are dependent on various assumptions, in addition to those described above, including but not limited to several factors such as location, environmental conditions and other restrictions. Changes in these estimates could materially impact on estimated production, and could therefore affect estimates of future cash flows used in the assessment of fair value. The valuation models and their assumptions are reviewed annually, or quarterly if warranted, and, if necessary, adjusted.
The Group´s fiscal year begins on July 1 and ends on June 30 of the following year. However, the production is based on the harvest year for each of the crops, rice and blueberries. A harvest year varies according to the crop or rice plant and to the climate in which it is grown. The planting period for a given crop or rice may start earlier on one farm than on another, causing differences for their respective harvesting periods. Soybeans are generally planted between the end of October and November of each year and harvested between April and May of each year. Wheat is generally planted between May and June of each year and harvested between November and December of each year. Rice is generally planted between October and November of each year and harvested between March and April of each year. Wheat is fully harvested as of March as of each year. As of March 31, 2011, the Group´s biological assets subject to a valuation model include soybeans, rice, sorghum and blueberries.
The estimates for prices, costs, yields and discount rates are the assumptions that most significantly affect the fair value determination of biological assets. As of March 31, 2011, the impact of a reasonable 10% increase (decrease) in estimated market prices, with all other variables held constant, would result in an increase (decrease) in the fair value less cost to sell of US$ 0.2 million for crops and US$ 0.3 million for rice. As of March 31, 2011, the impact of a reasonable 10% increase (decrease) in estimated costs, with all other variables held constant, would result in a increase (decrease) in the fair value less cost to sell of US$ 0.03 million for crops and US$ 0.05 million for rice. As of March 31, 2011, the impact of a reasonable 10% increase (decrease) in estimated yields, with all other variables held constant, would result in an increase (decrease) in the fair value less cost to sell of US$ 0.2 million for crops and US$ 0.3 million for rice. As of March 31, 2011, the impact of a reasonable 100 basis point increase (decrease) in discount rates, with all other variables held constant, would result in an increase (decrease) in the fair value less cost to sell of US$ 0.01 million for crops and US$ 0.01 million for rice. The blueberry plantations are immaterial to the Group´s operations and therefore any reasonable shift in the assumptions used in the valuation model may not have a significant impact in the Group´s results for the nine-month period ended March 31, 2011.
(d) Income taxes
Significant judgment is required in determining the provision for income taxes. There are many transactions and calculations for which the ultimate tax determination is uncertain. The Group recognizes liabilities for anticipated tax audit issues based on estimates of whether additional taxes will be due. Where the final tax outcome of these matters is different from the amounts that were initially recorded, such differences will impact the current and deferred income tax assets and liabilities in the period in which such determination is made.
The accompanying notes are an integral part of these consolidated interim financial statements.
F-127
Table of Contents
Union Agriculture Group Corp.
Notes to the Consolidated Interim Financial Statements (Continued)
(All amounts in US$, except shares and per share data and as otherwise indicated)
| 4. | Critical accounting policies, estimates and judgments (continued) |
Deferred tax assets are reviewed at each reporting date and reduced to the extent that it is no longer probable that sufficient taxable income will be available to allow all or part of the asset to be recovered. Deferred tax assets and liabilities are not discounted. In assessing the realizability of deferred tax assets, management considers whether it is probable that some portion or all of the deferred tax assets will not be realized. The ultimate realization of deferred tax assets is dependent upon the generation of future taxable income during the periods in which those temporary differences become deductible. Management considers the scheduled reversal of deferred tax liabilities, projected future taxable income and tax planning strategies in making this assessment. (See Note 17 for details).
| 5. | Segment information |
IFRS 8 “Operating Segments” requires an entity to report financial and descriptive information about its reportable segments, which are operating segments or aggregations of operating segments that meet specified criteria. Operating segments are components of an entity about which separate financial information is available that is evaluated regularly by the chief operating decision maker (“CODM”) in deciding how to allocate resources and in assessing performance. The CODM evaluates the business based on the differences in the nature of its products, operations and risks. The amount reported for each segment item is the measure reported to the chief operating decision maker for these purposes.
Operating segments identified are disclosed as reportable segments if they meet any of the following quantitative thresholds:
| • | The operating segment’s reported revenue, including both sales to external customers and inter-segment sales or transfers, is ten per cent or more of the combined revenue, internal and external, of all operating segments; |
| • | The absolute amount of its reported profit or loss is ten per cent or more of the greater, in absolute amount, of: |
| • | the combined reported profit of all operating segments that do not report a loss; and |
| • | the combined reported loss of all operating segments that report a loss. |
| • | Its assets are ten per cent or more of the combined assets of all operating segments. |
If, after determining reportable segments in accordance with the preceding quantitative thresholds, the total external revenue attributable to those segments amounts to less than 75 per cent of the total Group’s consolidated external revenue, additional segments are identified as reportable segments, even if they do not meet the thresholds described above, until at least 75 per cent of the Group’s consolidated external revenue is included in reportable segments. Once the 75 per cent of the Group’s consolidated external revenue is included in reportable segments, the remaining operating segments are aggregated in the ‘All other segments’ column.
As of March 31, 2011, the Group’s principal businesses are crops, rice, cattle, sheep and dairy businesses, and to a lesser extent its blueberry plantations and apiculture businesses. Based on the Group’s managerial business structure, the Group operates in the following reportable segments as of March 31, 2011 and 2010:
| • | The‘Cattle’ Segment consists of breeding, purchasing and/ or fattening of beef cattle for sale to meat processors and local livestock auction markets. |
| • | The‘Sheep’Segment consists of breeding, purchasing and/or fattening of sheep for sale of meat and/or wool to meat processors, wool product manufacturers and wool cooperatives. |
The accompanying notes are an integral part of these consolidated interim financial statements.
F-128
Table of Contents
Union Agriculture Group Corp.
Notes to the Consolidated Interim Financial Statements (Continued)
(All amounts in US$, except shares and per share data and as otherwise indicated)
| 5. | Segment information (continued) |
| • | The‘Crops’ Segment consists of planting, harvesting and sale of wheat, soybeans and to a lesser extent sorghum, which do not represent separate operating segments on an individual basis. Management seeks to maximize the use of the land through crop rotation and the type and amount of crops cultivated may vary from harvest year to harvest year. Management is focused on the long-term performance of the productive land, and to that extent, the performance is assessed considering the aggregated combination, if any, of crops planted in the land. A single manager is responsible for the management of operating activity of all crops rather than for each individual crop. |
| • | The‘Rice’Segment consists of planting, harvesting and sale of rice locally to third parties for export. |
| • | The‘Dairy’ Segment consists of breeding and/ or purchasing dairy cows for the production of raw milk for sale to local milk and milk-related products producers. |
| • | The‘All Other Segments’ column consists of the aggregation of the remaining operating segments, which do not meet the quantitative thresholds for disclosure, namely, blueberry plantations and apiculture. |
The Group does not export their products directly. However, due to the size of the Uruguayan market, most of its products are exported through the third parties with whom it conducts business. The measurement principles for the Group’s segment reporting structure are based on the IFRS principles adopted in the consolidated interim financial statements. Revenue generated and goods and services exchanged between segments are calculated on the basis of market prices.
The accompanying notes are an integral part of these consolidated interim financial statements.
F-129
Table of Contents
Union Agriculture Group Corp.
Notes to the Consolidated Interim Financial Statements (Continued)
(All amounts in US$, except shares and per share data and as otherwise indicated)
| 5. | Segment information (continued) |
The following table presents information with respect to the Group’s reportable segments. Certain other activities of a holding function nature not allocable to the segments are disclosed in the column ‘Corporate’.
Segment analysis for the nine-month period ended March 31, 2011 is as follows:
| Cattle | Sheep | Crops | Rice | Dairy | Corporate | All other segments | Total | |||||||||||||||||||||||||
Sales of agricultural produce and biological assets and services rendered | 2,688,768 | 296,216 | 2,143,597 | 866,763 | 116,203 | — | 100,616 | 6,212,163 | ||||||||||||||||||||||||
Rental income | — | — | 458,411 | 70,901 | — | — | — | 529,312 | ||||||||||||||||||||||||
Cost of agricultural produce and biological assets sold and services rendered | (2,513,999 | ) | (287,596 | ) | (2,075,138 | ) | (849,427 | ) | (107,028 | ) | — | (93,417 | ) | (5,926,605 | ) | |||||||||||||||||
Initial recognition and changes in fair value of biological assets and agricultural produce | 4,850,735 | 302,641 | 2,886,043 | 3,070,067 | 237,871 | — | 228,084 | 11,575,441 | ||||||||||||||||||||||||
Cost of production | (1,434,768 | ) | (222,406 | ) | (2,864,242 | ) | (2,345,297 | ) | (325,727 | ) | — | (403,032 | ) | (7,595,472 | ) | |||||||||||||||||
Margin Before Operating Expenses | 3,590,736 | 88,855 | 548,671 | 813,007 | (78,681 | ) | — | (167,749 | ) | 4,794,839 | ||||||||||||||||||||||
General and administrative expenses | (1,887,021 | ) | (410,667 | ) | (1,318,620 | ) | (314,047 | ) | (88,744 | ) | (3,597,267 | ) | (51,944 | ) | (7,668,310 | ) | ||||||||||||||||
Selling expenses | (53,776 | ) | (5,924 | ) | (42,872 | ) | (17,335 | ) | (2,324 | ) | — | (2,012 | ) | (124,243 | ) | |||||||||||||||||
Other operating income, net | — | — | 47,484 | (8,600 | ) | — | (2,340 | ) | — | 36,544 | ||||||||||||||||||||||
Profit/ (Loss) from Operations Before Financing and Taxation | 1,649,939 | (327,736 | ) | (765,337 | ) | 473,025 | (169,749 | ) | (3,599,607 | ) | (221,705 | ) | (2,961,170 | ) | ||||||||||||||||||
Depreciation and amortization | (26,847 | ) | (20,758 | ) | (109,847 | ) | (51,042 | ) | (14,186 | ) | (61,537 | ) | (107,345 | ) | (391,562 | ) | ||||||||||||||||
Property, plant and equipment, net | 845,007 | 434,641 | 3,256,037 | 2,081,573 | 243,665 | 611,139 | 1,755,187 | 9,227,249 | ||||||||||||||||||||||||
Land underPromesas | 93,395,861 | 19,797,026 | 61,994,857 | 11,208,815 | 4,467,938 | — | — | 190,864,497 | ||||||||||||||||||||||||
Investment property underPromesas, net | 11,951,749 | 3,002,455 | 7,540,227 | 799,515 | — | — | — | 23,293,946 | ||||||||||||||||||||||||
Goodwill | — | — | — | — | — | — | 380,068 | 380,068 | ||||||||||||||||||||||||
Biological assets | 16,066,875 | 1,098,957 | 2,031,084 | 2,631,383 | 558,960 | — | 1,076,457 | 23,463,716 | ||||||||||||||||||||||||
Inventories | 157,219 | 20,842 | 965,047 | 474,935 | 11,899 | — | 54,508 | 1,684,450 | ||||||||||||||||||||||||
Total segment assets | 122,416,711 | 24,353,921 | 75,787,252 | 17,196,221 | 5,282,462 | 611,139 | 3,266,220 | 248,913,926 | ||||||||||||||||||||||||
The accompanying notes are an integral part of these consolidated interim financial statements.
F-130
Table of Contents
Union Agriculture Group Corp.
Notes to the Consolidated Interim Financial Statements (Continued)
(All amounts in US$, except shares and per share data and as otherwise indicated)
| 5. | Segment information (continued) |
Segment analysis for the nine-month period ended March 31, 2010 is as follows:
| Cattle | Sheep | Crops | Rice | Dairy | Corporate | All other segments | Total | |||||||||||||||||||||||||
Sales of agricultural produce and biological assets and services rendered | 125,591 | — | 9,617 | — | — | — | 11,808 | 147,016 | ||||||||||||||||||||||||
Rental income | — | — | — | 30,933 | — | — | — | 30,933 | ||||||||||||||||||||||||
Cost of agricultural produce and biological assets sold and services rendered | (110,234 | ) | — | (7,213 | ) | — | — | — | (11,455 | ) | (128,902 | ) | ||||||||||||||||||||
Initial recognition and changes in fair value of biological assets and agricultural produce | 1,070,666 | 14,682 | 405,100 | 699,466 | 19,400 | — | 332,607 | 2,541,921 | ||||||||||||||||||||||||
Cost of production | (584,510 | ) | (134,856 | ) | (825,146 | ) | (721,735 | ) | (55,498 | ) | — | (386,439 | ) | (2,708,184 | ) | |||||||||||||||||
Margin Before Operating Expenses | 501,513 | (120,174 | ) | (417,642 | ) | 8,664 | (36,098 | ) | — | (53,479 | ) | (117,216 | ) | |||||||||||||||||||
General and administrative expenses | (445,728 | ) | (55,711 | ) | (414,190 | ) | (140,083 | ) | (74,056 | ) | (995,608 | ) | (32,814 | ) | (2,158,190 | ) | ||||||||||||||||
Selling expenses | (2,512 | ) | — | — | — | — | — | (250 | ) | (2,762 | ) | |||||||||||||||||||||
Profit/ (Loss) from Operations Before Financing and Taxation | 53,273 | (175,885 | ) | (831,832 | ) | (131,419 | ) | (110,154 | ) | (995,608 | ) | (86,543 | ) | (2,278,168 | ) | |||||||||||||||||
Depreciation and amortization | (6,199 | ) | (3,888 | ) | (38,355 | ) | (15,938 | ) | (2,958 | ) | (18,155 | ) | (34,859 | ) | (120,352 | ) | ||||||||||||||||
As of June 30, 2010: | ||||||||||||||||||||||||||||||||
Property, plant and equipment, net | 262,717 | 203,137 | 1,074,942 | 463,386 | 138,821 | 581,760 | 1,763,384 | 4,488,147 | ||||||||||||||||||||||||
Land underPromesas | 35,695,466 | 3,437,937 | 46,553,446 | 10,559,882 | 4,467,938 | — | — | 100,714,669 | ||||||||||||||||||||||||
Investment property underPromesas, net | 415,354 | 238,733 | 3,206,678 | 803,203 | — | — | — | 4,663,968 | ||||||||||||||||||||||||
Goodwill | — | — | — | — | — | — | 380,068 | 380,068 | ||||||||||||||||||||||||
Biological assets | 5,111,654 | 804,007 | 420,713 | 194,726 | 255,571 | — | 957,876 | 7,744,547 | ||||||||||||||||||||||||
Inventories | 216,089 | 100,824 | 985,453 | 383,383 | 2,654 | — | 136,429 | 1,824,832 | ||||||||||||||||||||||||
Total segment assets | 41,701,280 | 4,784,638 | 52,241,232 | 12,404,580 | 4,864,984 | 581,760 | 3,237,757 | 119,816,231 | ||||||||||||||||||||||||
The accompanying notes are an integral part of these consolidated interim financial statements.
F-131
Table of Contents
Union Agriculture Group Corp.
Notes to the Consolidated Interim Financial Statements (Continued)
(All amounts in US$, except shares and per share data and as otherwise indicated)
| 5. | Segment information (continued) |
Total segment assets are measured in a manner consistent with that of the consolidated interim financial statements. These assets are allocated based on the operations of the segment and the physical location of the asset.
Total reportable segments’ assets are reconciled to total assets as per the statement of financial position as follows:
| March 31, 2011 | June 30, 2010 | |||||||
Total reportable assets as per Segment Information | 248,913,926 | 119,816,231 | ||||||
Intangible assets, net (excluding goodwill) | 27,083 | 25,236 | ||||||
Deferred income tax assets | 78,664 | 340,502 | ||||||
Trade and other receivables, net | 10,840,685 | 8,329,062 | ||||||
Financial assets at fair value through profit or loss | — | 1,190,977 | ||||||
Derivative financial instruments | 7,250 | — | ||||||
Cash and cash equivalents | 104,942,161 | 67,125,638 | ||||||
Total assets as per the Statement of Financial Position | 364,809,769 | 196,827,646 | ||||||
Since inception the Group has only operated in Uruguay. All of the Group’s property, plant and equipment, land underPromesas, investment property underPromesas and biological assets are located in Uruguay.
For the nine-month period ended March 31, 2011, revenues of US$ 1,060,673 (March 31, 2010: US$ 125,591) are derived from Frigorífico Tacuarembó S.A. These revenues are attributable to the Cattle segment.
For the nine-month period ended March 31, 2011, revenues of US$ 866,763 (March 31, 2010: nil) are derived from SAMAN. These revenues are attributable to the Rice segment.
For the nine-month period ended March 31, 2011, revenues of US$ 99,518 (March 31, 2010: nil) are derived from Central Lanera Uruguaya. These revenues are attributable to the Sheep segment.
For the nine-month period ended March 31, 2011, revenues of US$ 116,203 (March 31, 2010: nil) are derived from CONAPROLE. These revenues are attributable to the Dairy segment.
The accompanying notes are an integral part of these consolidated interim financial statements.
F-132
Table of Contents
Union Agriculture Group Corp.
Notes to the Consolidated Interim Financial Statements (Continued)
(All amounts in US$, except shares and per share data and as otherwise indicated)
| 6. | Property, plant and equipment, net |
Changes in the Group’s property, plant and equipment for the nine-month periods ended March 31, 2011 and 2010 were as follows:
| Land | Buildings and facilities | Machinery | Furniture and equipment | Fixtures | Vehicles | Total | ||||||||||||||||||||||
Nine-month period ended March 31, 2010 | ||||||||||||||||||||||||||||
Opening net book amount | 712,909 | 475,829 | 168,199 | 40,867 | 18,201 | 255,485 | 1,671,490 | |||||||||||||||||||||
Additions | — | 419,669 | 1,765,540 | 20,818 | 45,521 | 95,103 | 2,346,651 | |||||||||||||||||||||
Depreciation charge (Note 19) | — | (20,697 | ) | (40,842 | ) | (2,797 | ) | (1,585 | ) | (51,368 | ) | (117,289 | ) | |||||||||||||||
Closing net book amount | 712,909 | 874,801 | 1,892,897 | 58,888 | 62,137 | 299,220 | 3,900,852 | |||||||||||||||||||||
At March 31, 2010 | ||||||||||||||||||||||||||||
Cost | 712,909 | 912,334 | 1,953,948 | 66,423 | 66,569 | 404,300 | 4,116,483 | |||||||||||||||||||||
Accumulated depreciation | — | (37,533 | ) | (61,051 | ) | (7,535 | ) | (4,432 | ) | (105,080 | ) | (215,631 | ) | |||||||||||||||
Net book amount | 712,909 | 874,801 | 1,892,897 | 58,888 | 62,137 | 299,220 | 3,900,852 | |||||||||||||||||||||
Nine-month period ended March 31, 2011 | ||||||||||||||||||||||||||||
Opening net book amount | 712,909 | 1,425,211 | 1,898,149 | 83,087 | 69,003 | 299,788 | 4,488,147 | |||||||||||||||||||||
Additions | — | 791,259 | 3,892,934 | 116,870 | 78,199 | 329,113 | 5,208,375 | |||||||||||||||||||||
Disposals | — | — | (44,800 | ) | — | — | (38,687 | ) | (83,487 | ) | ||||||||||||||||||
Depreciation charge (Note 19) | — | (60,280 | ) | (231,389 | ) | (9,080 | ) | (5,884 | ) | (79,153 | ) | (385,786 | ) | |||||||||||||||
Closing net book amount | 712,909 | 2,156,190 | 5,514,894 | 190,877 | 141,318 | 511,061 | 9,227,249 | |||||||||||||||||||||
At March 31, 2011 | ||||||||||||||||||||||||||||
Cost | 712,909 | 2,257,930 | 5,882,996 | 211,954 | 153,853 | 715,705 | 9,935,347 | |||||||||||||||||||||
Accumulated depreciation | — | (101,740 | ) | (368,102 | ) | (21,077 | ) | (12,535 | ) | (204,644 | ) | (708,098 | ) | |||||||||||||||
Net book amount | 712,909 | 2,156,190 | 5,514,894 | 190,877 | 141,318 | 511,061 | 9,227,249 | |||||||||||||||||||||
Amounts of US$ 308,629 and US$ 93,831 of depreciation charges are included in “Cost of production” for the nine-month periods ended March 31, 2011 and 2010, respectively. Amounts of US$ 77,157 and US$ 23,458 of depreciation charges are included in “General and administrative expenses” for the nine-month periods ended March 31, 2011 and 2010, respectively.
Where assets are financed by leasing agreements and substantially all the risks and rewards of ownership are substantially transferred to the Group (“finance leases”) the assets are treated as if they had been purchased outright and the corresponding liability to the leasing company is included as an obligation under finance leases. Depreciation on assets held under finance leases is charged to the statement of comprehensive income on the same basis as owned assets. Leasing payments are treated as consisting of capital and interest elements and the interest is charged to the statement of comprehensive income as a financing charge. Assets under finance leases comprise vehicles, machinery and equipment. All other leases are treated as operating leases and the relevant annual rentals are charged to the statement of comprehensive income as incurred (See Note 23).
The accompanying notes are an integral part of these consolidated interim financial statements.
F-133
Table of Contents
Union Agriculture Group Corp.
Notes to the Consolidated Interim Financial Statements (Continued)
(All amounts in US$, except shares and per share data and as otherwise indicated)
| 7. | Land underPromesas |
Changes in the Group’s land underPromesasfor the nine-month periods ended March 31, 2011 and 2010 were as follows:
| Land under Promesas | ||||
Nine-month period ended March 31, 2010 | ||||
Opening net book amount | 11,517,302 | |||
Additions | 41,321,670 | |||
Closing net book amount | 52,838,972 | |||
At March 31, 2010 | ||||
Cost | 52,838,972 | |||
Net book amount | 52,838,972 | |||
Nine-month period ended March 31, 2011 | ||||
Opening net book amount | 100,714,669 | |||
Additions | 90,149,828 | |||
Closing net book amount | 190,864,497 | |||
At March 31, 2011 | ||||
Cost | 190,864,497 | |||
Net book amount | 190,864,497 | |||
| 8. | Investment property underPromesas, net |
In July 2010 and December 2010, the Group paid US$ 18.6 million for two investment properties underPromesas.Consequently, as of March 31, 2011, the balance of investment property underPromesascomprises primarily Las Acacias, Arroyo Blanco and Merín farmlands underPromesas, and to a lesser extent a rice mill and other warehousing space leased out to SAMAN (See Note 23 for details).
Changes in the Group’s investment property underPromesasfor the nine-month periods ended March 31, 2011 and 2010 were as follows:
| March 31, 2011 | March 31, 2010 | |||||||
At beginning of period | 4,663,968 | — | ||||||
Additions | 18,633,666 | 163,935 | ||||||
Depreciation charge (i) (Note 19) | (3,688 | ) | (2,049 | ) | ||||
At end of period (ii) | 23,293,946 | 161,886 | ||||||
| (i) | Included within “General and administrative expenses” in the statement of comprehensive income. |
| (ii) | Includes US$ 0.2 million relating to the rice mill and warehousing spaces. |
The accompanying notes are an integral part of these consolidated interim financial statements.
F-134
Table of Contents
Union Agriculture Group Corp.
Notes to the Consolidated Interim Financial Statements (Continued)
(All amounts in US$, except shares and per share data and as otherwise indicated)
| 8. | Investment property underPromesas, net (continued) |
The following amounts have been recognized in the statement of comprehensive income:
| March 31, 2011 | March 31, 2010 | |||||||
Rental income | 529,312 | 30,933 | ||||||
Direct operating expenses | (5,323 | ) | (2,958 | ) | ||||
As of March 31, 2011, the fair value of investment property underPromesasamounts to US$ 27.3 million.
| 9. | Intangible assets, net |
Changes in the Group’s intangible assets for the nine-month periods ended March 31, 2011 and 2010 were as follows:
| Goodwill | Software | Total | ||||||||||
Nine-month period ended March 31, 2010 | ||||||||||||
Opening net book amount | 380,068 | — | 380,068 | |||||||||
Additions | — | 19,258 | 19,258 | |||||||||
Amortization charge (i) (Note 19) | — | (1,014 | ) | (1,014 | ) | |||||||
Closing net book amount | 380,068 | 18,244 | 398,312 | |||||||||
At March 31, 2010 | ||||||||||||
Cost | 380,068 | 19,258 | 399,326 | |||||||||
Net book amount | 380,068 | 18,244 | 398,312 | |||||||||
Nine-month period ended March 31, 2011 | ||||||||||||
Opening net book amount | 380,068 | 25,236 | 405,304 | |||||||||
Additions | — | 3,935 | 3,935 | |||||||||
Amortization charge (i) (Note 19) | — | (2,088 | ) | (2,088 | ) | |||||||
Closing net book amount | 380,068 | 27,083 | 407,151 | |||||||||
At March 31, 2011 | ||||||||||||
Cost | 380,068 | 30,793 | 410,861 | |||||||||
Accumulated amortization | — | (3,710 | ) | (3,710 | ) | |||||||
Net book amount | 380,068 | 27,083 | 407,151 | |||||||||
| (i) | Included within “General and administrative expenses” in the statement of comprehensive income. |
The Group did not recognize any impairment losses for any of the periods presented (See Note 4 for details).
The accompanying notes are an integral part of these consolidated interim financial statements.
F-135
Table of Contents
Union Agriculture Group Corp.
Notes to the Consolidated Interim Financial Statements (Continued)
(All amounts in US$, except shares and per share data and as otherwise indicated)
| 10. | Biological assets |
Changes in the Group’s biological assets for the nine-month periods ended March 31, 2011 and 2010 were as follows:
| March 31, 2011 | June 30, 2010 | March 31, 2010 | ||||||||||
Beginning of the year/ period | 7,744,547 | 1,922,742 | 1,922,742 | |||||||||
Increase due to purchases | 9,392,155 | 2,580,886 | 403,088 | |||||||||
Initial recognition and changes in fair value of biological assets | 11,278,374 | 5,245,708 | 2,530,466 | |||||||||
Decrease due to harvest | (2,149,764 | ) | (1,671,936 | ) | — | |||||||
Decrease due to sales | (2,801,596 | ) | (332,853 | ) | (110,234 | ) | ||||||
End of the year/ period year | 23,463,716 | 7,744,547 | 4,746,062 | |||||||||
Biological assets with a production cycle of more than one year (that is, blueberry plantations, cattle and sheep) generated “Initial recognition and changes in fair value of biological assets” amounting to US$ 5,322,264 for the nine-month period ended March 31, 2011 (March 31, 2010: US$ 1,437,355). In 2011, an amount of US$ 1,934,028 (2010: US$ 564,983) was attributable to price changes, and an amount of US$ 3,388,236 (2010: US$ 872,372) was attributable to physical changes.
Biological assets as of March 31, 2011 and June 30, 2010 were as follows:
| March 31, 2011 | June 30, 2010 | |||||||
Non-current | ||||||||
Cattle for dairy production | 558,960 | 255,571 | ||||||
Breeding cattle | 11,618,626 | 3,349,598 | ||||||
Cattle for sale | 1,755,062 | 709,966 | ||||||
Blueberry plantations | 1,017,624 | 902,030 | ||||||
Sheep | 855,069 | 605,070 | ||||||
Colonies of bees | 58,833 | 55,846 | ||||||
| 15,864,174 | 5,878,081 | |||||||
Current | ||||||||
Breeding cattle | 1,594,430 | 524,240 | ||||||
Cattle for sale | 1,098,757 | 527,850 | ||||||
Sheep | 243,888 | 198,937 | ||||||
Crops | 2,031,084 | 420,713 | ||||||
Rice | 2,631,383 | 194,726 | ||||||
| 7,599,542 | 1,866,466 | |||||||
Total biological assets | 23,463,716 | 7,744,547 | ||||||
The accompanying notes are an integral part of these consolidated interim financial statements.
F-136
Table of Contents
Union Agriculture Group Corp.
Notes to the Consolidated Interim Financial Statements (Continued)
(All amounts in US$, except shares and per share data and as otherwise indicated)
| 10. | Biological assets (continued) |
The following tables present the classification of the Group’s total biological assets between bearer and consumable assets and mature and immature assets as of March 31, 2011 and June 30, 2010:
| March 31, 2011 | June 30, 2010 | |||||||||||||||||||||||
| Bearer | Consumable | Total | Bearer | Consumable | Total | |||||||||||||||||||
Non-current | ||||||||||||||||||||||||
Cattle for dairy production | 558,960 | — | 558,960 | 255,571 | — | 255,571 | ||||||||||||||||||
Breeding cattle | 11,618,626 | — | 11,618,626 | 3,349,598 | — | 3,349,598 | ||||||||||||||||||
Cattle for sale | — | 1,755,062 | 1,755,062 | — | 709,966 | 709,966 | ||||||||||||||||||
Blueberry plantations | 1,017,624 | — | 1,017,624 | 902,030 | — | 902,030 | ||||||||||||||||||
Sheep | 855,069 | — | 855,069 | 605,070 | — | 605,070 | ||||||||||||||||||
Others | 58,833 | — | 58,833 | 55,846 | — | 55,846 | ||||||||||||||||||
| 14,109,112 | 1,755,062 | 15,864,174 | 5,168,115 | 709,966 | 5,878,081 | |||||||||||||||||||
Current | ||||||||||||||||||||||||
Breeding cattle | 1,594,430 | — | 1,594,430 | 524,240 | — | 524,240 | ||||||||||||||||||
Cattle for sale | — | 1,098,757 | 1,098,757 | — | 527,850 | 527,850 | ||||||||||||||||||
Sheep | 134,118 | 109,770 | 243,888 | 109,785 | 89,152 | 198,937 | ||||||||||||||||||
Crops | — | 2,031,084 | 2,031,084 | — | 420,713 | 420,713 | ||||||||||||||||||
Rice | — | 2,631,383 | 2,631,383 | — | 194,726 | 194,726 | ||||||||||||||||||
| 1,728,548 | 5,870,994 | 7,599,542 | 634,025 | 1,232,441 | 1,866,466 | |||||||||||||||||||
Total biological assets | 15,837,660 | 7,626,056 | 23,463,716 | 5,802,140 | 1,942,407 | 7,744,547 | ||||||||||||||||||
| March 31, 2011 | June 30, 2010 | |||||||||||||||||||||||
| Mature | Immature | Total | Mature | Immature | Total | |||||||||||||||||||
Non-current | ||||||||||||||||||||||||
Cattle for dairy production | 149,110 | 409,850 | 558,960 | 255,571 | — | 255,571 | ||||||||||||||||||
Breeding cattle | 6,857,309 | 4,761,317 | 11,618,626 | 2,503,945 | 845,653 | 3,349,598 | ||||||||||||||||||
Cattle for sale | — | 1,755,062 | 1,755,062 | — | 709,966 | 709,966 | ||||||||||||||||||
Blueberry plantations | — | 1,017,624 | 1,017,624 | — | 902,030 | 902,030 | ||||||||||||||||||
Sheep | 546,961 | 308,108 | 855,069 | 468,739 | 136,331 | 605,070 | ||||||||||||||||||
Others | — | 58,833 | 58,833 | — | 55,846 | 55,846 | ||||||||||||||||||
| 7,553,380 | 8,310,794 | 15,864,174 | 3,228,255 | 2,649,826 | 5,878,081 | |||||||||||||||||||
Current | ||||||||||||||||||||||||
Breeding cattle | 1,594,430 | — | 1,594,430 | 524,240 | — | 524,240 | ||||||||||||||||||
Cattle for sale | 1,098,757 | — | 1,098,757 | 527,850 | — | 527,850 | ||||||||||||||||||
Sheep | 243,888 | — | 243,888 | 198,937 | — | 198,937 | ||||||||||||||||||
Crops | — | 2,031,084 | 2,031,084 | — | 420,713 | 420,713 | ||||||||||||||||||
Rice | — | 2,631,383 | 2,631,383 | — | 194,726 | 194,726 | ||||||||||||||||||
| 2,937,075 | 4,662,467 | 7,599,542 | 1,251,027 | 615,439 | 1,866,466 | |||||||||||||||||||
Total biological assets | 10,490,455 | 12,973,261 | 23,463,716 | 4,479,282 | 3,265,265 | 7,744,547 | ||||||||||||||||||
The accompanying notes are an integral part of these consolidated interim financial statements.
F-137
Table of Contents
Union Agriculture Group Corp.
Notes to the Consolidated Interim Financial Statements (Continued)
(All amounts in US$, except shares and per share data and as otherwise indicated)
| 10. | Biological assets (continued) |
The fair value less estimated point of sale costs of agricultural produce at the point of harvest amounted to US$ 1,189,820 and US$ 44,494 for the nine-month periods ended March 31, 2011 and 2010, respectively.
| 11. | Financial instruments by category |
The following table shows the carrying amounts of financial assets and financial liabilities by category of financial instrument and a reconciliation to the corresponding line item in the statements of financial position, as appropriate. Since the line items “Trade and other receivables, net” and “Trade and other payables” contain both financial instruments and non-financial assets or liabilities (such as other tax receivables or advance payments for services to be received in the future), the reconciliation is shown in the columns headed “Non-financial assets” and “Non-financial liabilities.”
| Financial assets at amortized cost | Financial assets at fair value through profit or loss | Subtotal financial assets | Non-financial assets | Total | ||||||||||||||||
March 31, 2011 | ||||||||||||||||||||
Assets as per statement of financial position | ||||||||||||||||||||
Trade and other receivables, net (i) | 2,900,579 | — | 2,900,579 | 7,940,106 | 10,840,685 | |||||||||||||||
Derivative financial instruments (ii) | — | 7,250 | 7,250 | — | 7,250 | |||||||||||||||
Cash and cash equivalents (iii) | 104,942,161 | — | 104,942,161 | — | 104,942,161 | |||||||||||||||
Total | 107,842,740 | 7,250 | 107,849,990 | 7,940,106 | 115,790,096 | |||||||||||||||
| Financial liabilities at amortized cost | Non-financial liabilities | Total | ||||||||||
Liabilities as per statement of financial position | ||||||||||||
Trade and other payables (iv) | 8,065,666 | 4,144,998 | 12,210,664 | |||||||||
Finance lease liabilities (v) | 5,269 | — | 5,269 | |||||||||
Total | 8,070,935 | 4,144,998 | 12,215,933 | |||||||||
| Financial assets at amortized cost | Financial assets at fair value through profit or loss | Subtotal financial assets | Non-financial assets | Total | ||||||||||||||||
June 30, 2010 | ||||||||||||||||||||
Assets as per statement of financial position | ||||||||||||||||||||
Trade and other receivables, net (i) | 4,103,188 | — | 4,103,188 | 4,225,874 | 8,329,062 | |||||||||||||||
Financial assets at fair value through profit or loss | — | 1,190,977 | 1,190,977 | — | 1,190,977 | |||||||||||||||
Cash and cash equivalents (iii) | 67,125,638 | — | 67,125,638 | — | 67,125,638 | |||||||||||||||
Total | 71,228,826 | 1,190,977 | 72,419,803 | 4,225,874 | 76,645,677 | |||||||||||||||
The accompanying notes are an integral part of these consolidated interim financial statements.
F-138
Table of Contents
Union Agriculture Group Corp.
Notes to the Consolidated Interim Financial Statements (Continued)
(All amounts in US$, except shares and per share data and as otherwise indicated)
| 11. | Financial instruments by category (continued) |
| Financial liabilities at amortized cost | Non-financial liabilities | Total | ||||||||||
Liabilities as per statement of financial position | ||||||||||||
Trade and other payables (iv) | 690,342 | 1,844,706 | 2,535,048 | |||||||||
Finance lease liabilities (v) | 6,930 | — | 6,930 | |||||||||
Total | 697,272 | 1,844,706 | 2,541,978 | |||||||||
| (i) | See Note 12 for details. |
| (ii) | See Note 3 for details. |
| (iii) | See Note 3 for details. |
| (iv) | See note 16 for details. |
| (v) | See Note 23 for details. |
Liabilities carried at amortized cost also included liabilities under finance leases where the Group is the lessee and which therefore have to be measured in accordance with IAS 17. The categories disclosed are determined by reference to IFRS 9. Finance leases are excluded from the scope of IFRS 7. Therefore, finance leases have been shown separately.
Because of the short maturities of most trade accounts receivable and payable, other receivables and liabilities, and cash and cash equivalents, their carrying amounts at the closing date do not differ significantly from their respective fair values.
Income, expense, gains and losses on financial instruments included in “Financial results, net” and “Other operating income, net” in the statement of comprehensive income can be assigned to the following categories:
| Financial assets at amortized cost | Financial assets at fair value through profit or loss | Financial liabilities at amortized cost | Total | |||||||||||||
March 31, 2011 | ||||||||||||||||
Interest income (i) | 472,225 | — | — | 472,225 | ||||||||||||
Interest expense | — | — | (132 | ) | (132 | ) | ||||||||||
Foreign exchange gains, net (ii) | 21,015 | — | — | 21,015 | ||||||||||||
Fair value gains on financial assets at fair value through profit or loss (iii) | — | 616,888 | — | 616,888 | ||||||||||||
Derivative financial instruments (iv) | — | 50,885 | — | 50,885 | ||||||||||||
Net result | 493,240 | 667,773 | (132 | ) | 1,160,881 | |||||||||||
The accompanying notes are an integral part of these consolidated interim financial statements.
F-139
Table of Contents
Union Agriculture Group Corp.
Notes to the Consolidated Interim Financial Statements (Continued)
(All amounts in US$, except shares and per share data and as otherwise indicated)
| 11. | Financial instruments by category (continued) |
| Financial assets at amortized cost | Financial assets at fair value through profit or loss | Financial liabilities at amortized cost | Total | |||||||||||||
March 31, 2010 | ||||||||||||||||
Interest income (i) | 472,079 | — | — | 472,079 | ||||||||||||
Interest expense | — | — | (105 | ) | (105 | ) | ||||||||||
Foreign exchange gains/ (losses), net (ii) | 918,376 | — | (128 | ) | 918,248 | |||||||||||
Fair value gains on financial assets at fair value through profit or loss (iii) | — | (178 | ) | — | (178 | ) | ||||||||||
Net result | 1,390,455 | (178 | ) | (233 | ) | 1,390,044 | ||||||||||
| (i) | Mainly relates to interest on loans granted to third parties. |
| (ii) | Mainly relates to foreign currency effect on Canadian dollars deposits. |
| (iii) | Relates to fair value gain on shares of New Zealand Farming System Uruguay. |
| (iv) | See Note 3 for details. |
Determining fair values
IFRS 9 defines the fair value of a financial instrument as the amount for which a financial asset could be exchanged, or a financial liability settled, between knowledgeable, willing parties in an arm’s length transaction. All financial instruments recognized at fair value are allocated to one of the valuation hierarchy levels of IFRS 7. This valuation hierarchy provides for three levels. The initial basis for the allocation is the “economic investment class”. Only if this does not result in an appropriate allocation the Group deviates from such an approach in individual cases. The allocation reflects which of the fair values derive from transactions in the market and where valuation is based on models because market transactions are lacking.
As of and for the nine-month period ended March 31, 2011, the financial instruments recognized at fair value on the statement of financial position comprise only derivative financial instruments.
In the case of Level 1, valuation is based on unadjusted quoted prices in active markets for identical financial assets that the Group can refer to at the date of the statement of financial position. A market is deemed active if transactions take place with sufficient frequency and in sufficient quantity for price information to be available on an ongoing basis. Since a quoted price in an active market is the most reliable indicator of fair value, this should always be used if available. As of March 31, 2011, the financial instruments the Group has allocated to this level comprise derivative financial instruments, for which quoted prices in active markets are available.
In the case of Level 2, financial instruments are valued using models based on observable market data. In the case of Level 3, the Group uses valuation techniques not based on inputs observable in the market. This is only permissible insofar as no observable market data are available. The inputs used reflect the Group’s assumptions regarding the factors which market players would consider in their pricing. The Group uses the best available information for this, including internal company data. The Group does not have financial instruments allocated to either level 2 or 3 for any of the periods presented.
The accompanying notes are an integral part of these consolidated interim financial statements.
F-140
Table of Contents
Union Agriculture Group Corp.
Notes to the Consolidated Interim Financial Statements (Continued)
(All amounts in US$, except shares and per share data and as otherwise indicated)
| 12. | Trade and other receivables, net |
| March 31, 2011 | June 30, 2010 | |||||||
Current | ||||||||
Trade receivables | 1,597,336 | 1,398,927 | ||||||
Loans (i) | 821,377 | 2,579,927 | ||||||
Advances for the payments of land underPromesas (ii) (Note 26) | 2,731,549 | 2,926,910 | ||||||
Receivables with shareholders (Note 25) | 412,940 | — | ||||||
Value added tax credits | 1,188,557 | 1,298,964 | ||||||
Deferred offering costs | 2,080,981 | — | ||||||
Lease receivables | 529,312 | 30,933 | ||||||
Advances to suppliers | 774,111 | — | ||||||
Other tax credits | 613,096 | — | ||||||
Other receivables | 91,426 | 93,401 | ||||||
Current portion | 10,840,685 | 8,329,062 | ||||||
Total trade and other receivables, net | 10,840,685 | 8,329,062 | ||||||
| (i) | As of March 31, 2011, the balance relates to one Uruguayan-peso denominated loan granted in May 2010 to Socur S.A., an unrelated third party engaged in consumer loan origination activities, for an amount of Uruguayan Pesos 38.6 million (equivalent to US$ 2.0 million). This loan bears interest at a fixed rate of 16.5% per annum and is being collected in four installments from August 2010 through May 2011. The loan is collateralized by certain receivables of Socur S.A. and includes customary covenants. The Group granted this loan as part of its treasury activity in order to profit from surplus funds at attractive interest rates. |
| (ii) | As of March 31, 2011 and June 30, 2010, the balance relates to advanced payments for land underPromesas. These payments were held in escrow with a notary public until due diligence and other customary procedures were finalized. Once completed, the notary public releases the funds to the sellers. |
The fair values of current trade and other receivables approximate their respective carrying amounts due to their short-term nature.
The carrying amounts of the Group’s trade and other receivables are denominated in the following currencies (expressed in US dollars):
| March 31, 2011 | June 30, 2010 | |||||||
Currency | ||||||||
US Dollar | 9,892,156 | 4,447,637 | ||||||
Uruguayan Peso | 948,529 | 3,881,425 | ||||||
| 10,840,685 | 8,329,062 | |||||||
As of March 31, 2011 and June 30, 2010, no classes within trade and other receivables were either past due or impaired.
The accompanying notes are an integral part of these consolidated interim financial statements.
F-141
Table of Contents
Union Agriculture Group Corp.
Notes to the Consolidated Interim Financial Statements (Continued)
(All amounts in US$, except shares and per share data and as otherwise indicated)
| 12. | Trade and other receivables, net (continued) |
The Group recognizes an allowance for trade receivables when there is objective evidence that the Group will not be able to collect all amounts due according to the original terms of the receivables. Delinquency in payments is an indicator that a receivable may be impaired. However, management considers all available evidence in determining when a receivable is impaired. Generally, trade receivables, which are more than 180 days past due are fully provided for. However, certain receivables 180+ days overdue may not be provided for based on a case-by-case analysis of credit quality. On the other hand, receivables, which are not 180+ days overdue, may be provided for if specific analysis indicates a potential impairment.
The maximum exposure to credit risk at the reporting date is the carrying value of each class of receivable mentioned above. The Group does not hold any collateral as security.
As of March 31, 2011 and June 30, 2010, none of the outstanding trade receivables are past due or impaired. The Group has a very limited operating history to date and its sales have been concentrated into a reduced group of external customers, especially for its cattle, sheep, rice and dairy businesses (See Note 3 for additional details). These customers were generally well-known companies in Uruguay.
As of March 31, 2011, approximately 81 % of the outstanding unimpaired trade receivables (neither past due nor impaired) relate to sales to 3 well-known multinational companies with good credit quality standing. These entities or their parent companies are externally credit-rated. The Group reviews these external ratings from credit agencies. The remaining percentage as of March 31, 2011 of the outstanding unimpaired trade receivables relate to sales to customers for which external credit ratings may not be available. However, the total base of customers without an external credit rating is relatively stable. New customers with less than six months of history with the Group are closely monitored. The Group has not experienced credit problems with these new customers to date.
The Group expects to expand its customer base in the foreseeable future, especially upon selling crop and dairy products. The Group expects to sell its crop production to well-known multinational companies with external good credit ratings. However, some of the new customers may not be externally credit-rated. As part of its credit risk strategy, the Group will evaluate the credit standing of these customers and monitor them closely.
The following is the detail of the outstanding balance of trade receivables as of March 31, 2011 together with its aging analysis:
| March 31, 2011 | ||||
1 to 3 months | 761,507 | |||
3 to 6 months | 835,829 | |||
| 1,597,336 | ||||
The accompanying notes are an integral part of these consolidated interim financial statements.
F-142
Table of Contents
Union Agriculture Group Corp.
Notes to the Consolidated Interim Financial Statements (Continued)
(All amounts in US$, except shares and per share data and as otherwise indicated)
| 13. | Inventories |
| March 31, 2011 | June 30, 2010 | |||||||
Consumable supplies | 1,653,390 | 957,686 | ||||||
Crops. | — | 779,834 | ||||||
Others | 31,060 | 87,312 | ||||||
| 1,684,450 | 1,824,832 | |||||||
The cost of inventories recognized as expense and included in “Cost of agricultural produce and biological assets sold and services rendered” amounted to US$ 3,221,632 and US$ 11,455 for the nine-month periods ended March 31, 2011 and 2010, respectively.
| 14. | Equity-settled share-based payments |
The Group has a “2008 Stock Option Plan”, under which the Group grants equity-settled options to senior managers and selected employees of the Group’s subsidiaries. In addition, the Group has granted equity-settled options to selling agents who assisted the Group in connection with its capital raising activities through private placements. Options granted to selling agents during 2008 and 2009 are collectively referred to as the “2008/2009 Broker Compensation Options” and options granted to selling agents during 2010 are collectively referred to as the “2010 Broker Compensation Options”. The 2008/2009 Broker Compensation Options, the 2010 Broker Compensation Options and the 2008 Stock Option Plan are collectively referred hereinafter as the “Option Schemes”.
For the nine-month period ended March 31, 2011, the Group incurred a charge of US$ 4.8 million, related to the options granted under the 2008 Stock Option Plan. For the nine-month period ended March 31, 2010, the Group incurred a charge of US$ 1.0 million related to the options granted under the 2008 Stock Option Plan and the 2010 Broker Compensation Options. For the nine-month period ended March 31, 2011, an amount of US$ 1.3 million was recognized as an expense in the statement of comprehensive income (March 31, 2010: US$ 0.01), and an amount of US$ 3.6 million was deducted from equity as transaction costs directly attributable to the capital issuances (March 31, 2010: US$ 1.0 million).
The fair value of the Option Schemes was measured at the date of grant using the Black-Scholes valuation technique. This valuation model takes into account factors such as non transferability, expected volatility, exercise restrictions and behavioral considerations among others.
The accompanying notes are an integral part of these consolidated interim financial statements.
F-143
Table of Contents
Union Agriculture Group Corp.
Notes to the Consolidated Interim Financial Statements (Continued)
(All amounts in US$, except shares and per share data and as otherwise indicated)
| 14. | Equity-settled share-based payments (continued) |
Key grant-date fair value and other assumptions under the Option Schemes are detailed below:
| Grant Date | June 2008 | July 2008 | July 2008 | June 2009 | August 2009 | August 2009 | March 2010 | March 2010 | ||||||||||||||||||||||||
Expected volatility | 31 | % | 31 | % | 34 | % | 64 | % | 48 | % | 44 | % | 35 | % | 32 | % | ||||||||||||||||
Expected life | 2.50 | 2.50 | 1.00 | 1.00 | 2.50 | 3.13 | 1.00 | 1.00 | ||||||||||||||||||||||||
Risk free rate | 2.80 | % | 2.82 | % | 2.30 | % | 0.47 | % | 1.34 | % | 1.61 | % | 0.39 | % | 0.44 | % | ||||||||||||||||
Expected dividend yield | 0 | % | 0 | % | 0 | % | 0 | % | 0 | % | 0 | % | 0 | % | 0 | % | ||||||||||||||||
Fair value per option | $ | 0.22 | $ | 0.31 | $ | 0.21 | $ | 0.36 | $ | 0.43 | $ | 0.45 | 0.24 | 0.22 | ||||||||||||||||||
Possibility of ceasing employment before vesting | 0 | % | 0 | % | 0 | % | 0 | % | 0 | % | 0 | % | 0 | % | 0 | % | ||||||||||||||||
Exercise price | $ | 1 | $ | 1.4 | $ | 1.4 | $ | 1.4 | $ | 1.4 | $ | 1.4 | $ | 1.7 | $ | 1.7 | ||||||||||||||||
| Grant Date | July 2010 | July 2010 | July 2010 | August 2010 | August 2010 | January 2011 | January 2011 | |||||||||||||||||||||
Expected volatility | 47 | % | 44 | % | 47 | % | 44 | % | 47 | % | 43 | % | 47 | % | ||||||||||||||
Expected life | 2.50 | 3.50 | 2.50 | 3.50 | 2.50 | 3.50 | 2.50 | |||||||||||||||||||||
Risk free rate | 0.82 | % | 1.18 | % | 0.80 | % | 0.99 | % | 0.68 | % | 1.31 | % | 0.84 | % | ||||||||||||||
Expected dividend yield | 0 | % | 0 | % | 0 | % | 0 | % | 0 | % | 0 | % | 0 | % | ||||||||||||||
Fair value per option | $ | 0.51 | $ | 0.56 | $ | 0.51 | $ | 0.56 | $ | 0.51 | $ | 0.73 | $ | 0.65 | ||||||||||||||
Possibility of ceasing employment before vesting | 0 | % | 0 | % | 0 | % | 0 | % | 0 | % | 0 | % | 0 | % | ||||||||||||||
Exercise price | $ | 1.7 | $ | 1.7 | $ | 1.7 | $ | 1.7 | $ | 1.7 | $ | 2.2 | $ | 2.2 | ||||||||||||||
Since the Group’s shares are not publicly traded expected volatility was determined by calculating the historical volatility of share prices of comparable entities in representative stock markets. The expected life used in the model has been adjusted, based on management’s best estimate, for the effects of non-transferability, exercise restrictions and behavioral considerations.
The following tables show the information relating to each plan or agreement under the Option Schemes for the nine-month periods ended March 31, 2011 and 2010:
The 2008 Stock Option Plan
This plan was effectively established in the fiscal year ended June 30, 2008 and is administered by the Board of Directors of the Group. Options under the 2008 Stock Option Plan vest immediately at the grant date, or over a two-year period from the date of grant at 25% every six months. Options are exercisable over a five-year period. The exercise price of the options is determined by the Board of Directors but under no circumstances may the price be less than 100% of the fair market value of the shares at the date of grant. For this plan, there are no performance requirements for the exercising of options, except that a participant’s employment with the Group must not have been terminated prior to the date of exercise of the relevant option. If the participant ceases to be an employee for any cause, options held by the participant will cease to be exercisable within a period of 30 days after ceasing employment. In addition, if the participant ceases to be an employee for reason of death, any portion of the share option held by he or she that has vested on that date may be exercised by his or her legal representative for a period determined by the Board of Directors in each case.
The accompanying notes are an integral part of these consolidated interim financial statements.
F-144
Table of Contents
Union Agriculture Group Corp.
Notes to the Consolidated Interim Financial Statements (Continued)
(All amounts in US$, except shares and per share data and as otherwise indicated)
| 14. | Equity-settled share-based payments (continued) |
Movements in the number of equity-settled options outstanding and their related weighted average exercise prices under the 2008 Stock Option Plan are as follows:
| March 31, 2011 | March 31, 2010 | |||||||||||||||
| Average exercise price per share | Options | Average exercise price per share | Options | |||||||||||||
At beginning of period | 1.40 | 5,271,406 | 1.38 | 5,081,406 | ||||||||||||
Granted | 1.92 | 11,725,000 | 1.40 | 440,000 | ||||||||||||
Exercised | — | — | 1.00 | (250,000 | ) | |||||||||||
At end of period | 1.76 | 16,996,406 | 1.40 | 5,271,406 | ||||||||||||
Options outstanding at each period end under the 2008 Stock Option Plan have the following expiry date and exercise prices:
| Exercise price per share | Shares | |||||||||||
| March 31, 2011 | March 31, 2010 | |||||||||||
Expiry date: | ||||||||||||
July 7, 2013 | 1.40 | 4,831,406 | 4,831,406 | |||||||||
August 18, 2014 | 1.40 | 440,000 | 440,000 | |||||||||
July 15, 2015 | 1.70 | 2,000,000 | — | |||||||||
July 16, 2015 | 1.70 | 2,050,000 | — | |||||||||
August 11, 2015 | 1.70 | 2,450,000 | — | |||||||||
January 7, 2016 | 2.20 | 5,225,000 | — | |||||||||
2008/2009 Broker Compensation Options
These options were granted to selling agents who assisted the Group in connection with its private placements during 2008 and 2009. These options vested immediately at the date of grant and are exercisable over a two-year period.
The exercise price of the options was determined by the Board of Directors but under no circumstances the price was less than 100% of the fair market value of the shares at the date of grant. No performance requirements for the exercising of options were required.
Movements in the number of equity-settled options outstanding and their related weighted average exercise prices under the 2008/2009 Broker Compensation Options are as follows:
| March 31, 2011 | March 31, 2010 | |||||||||||||||
| Average exercise price per share | Options | Average exercise price per share | Options | |||||||||||||
At beginning of period | 1.40 | 2,478,150 | 1.40 | 3,040,647 | ||||||||||||
Exercised | 1.40 | (1,687,491 | ) | — | — | |||||||||||
At end of period | 1.40 | 790,659 | 1.40 | 3,040,647 | ||||||||||||
The accompanying notes are an integral part of these consolidated interim financial statements.
F-145
Table of Contents
Union Agriculture Group Corp.
Notes to the Consolidated Interim Financial Statements (Continued)
(All amounts in US$, except shares and per share data and as otherwise indicated)
| 14. | Equity-settled share-based payments (continued) |
Options outstanding at each period end under the 2008/2009 Broker Compensation Options have the following expiry date and exercise prices:
| Exercise price per share | Shares | |||||||||||
| March 31, 2011 | March 31, 2010 | |||||||||||
Expiry date: | ||||||||||||
July 22, 2010 | 1.40 | — | 2,249,988 | |||||||||
June 25, 2011 | 1.40 | 790,659 | 790,659 | |||||||||
2010 Broker Compensation Options
These options were granted to selling agents who assisted the Group in connection with its private placements during 2010. These options vested immediately at the date of grant and are exercisable over a two-year period. The exercise price of the options was determined by the Board of Directors but under no circumstances the price was less than 100% of the fair market value of the shares at the date of grant. No performance requirements for the exercising of options were required.
Movements in the number of equity-settled options outstanding and their related weighted average exercise prices under the 2010 Broker Compensation Options are as follows:
| March 31, 2011 | March 31, 2010 | |||||||||||||||
| Average exercise price per share | Options | Average exercise price per share | Options | |||||||||||||
At beginning of period | 1.70 | 3,364,748 | — | — | ||||||||||||
Granted | — | — | 1.70 | 3,364,748 | ||||||||||||
At end of period | 1.70 | 3,364,748 | 1.70 | 3,364,748 | ||||||||||||
Options outstanding at each period end under the 2010 Broker Compensation Options have the following expiry date and exercise prices:
| Exercise price per share | Shares | |||||||||||
| March 31, 2011 | March 31, 2010 | |||||||||||
Expiry date: | ||||||||||||
March 8, 2012 | 1.70 | 3,143,328 | 3,143,328 | |||||||||
March 30, 2012 | 1.70 | 221,420 | 221,420 | |||||||||
The following table shows the exercisable shares at each period end under the Option Schemes:
| Exercisable shares | ||||
March 31, 2011 | 21,151,813 | |||
March 31, 2010 | 11,676,801 | |||
The accompanying notes are an integral part of these consolidated interim financial statements.
F-146
Table of Contents
Union Agriculture Group Corp.
Notes to the Consolidated Interim Financial Statements (Continued)
(All amounts in US$, except shares and per share data and as otherwise indicated)
| 15. | Legal and other reserves |
According to the laws of Uruguay, 5% of the profit of the year is separated to constitute legal reserves until they reach legal capped amounts (20% of total capital). These legal reserves are not available for dividend distribution and can only be released to absorb losses.
In addition, from time to time, the subsidiaries of the Group may separate portions of their profits of the year to constitute voluntary reserves according to company law and practice. These voluntary reserves may be released for dividend distribution.
The Group did not constitute legal or other reserves for any of the periods presented.
| 16. | Trade and other payables |
| March 31, 2011 | June 30, 2010 | |||||||
Current | ||||||||
Trade payables | 4,077,601 | 610,210 | ||||||
Payables for land underPromesas (ii) | 3,788,186 | — | ||||||
Amounts due to related parties (Note 25) | 161,709 | — | ||||||
Taxes payable (i) | 4,144,998 | 1,844,706 | ||||||
Other payables | 38,170 | 80,132 | ||||||
Total trade and other payables | 12,210,664 | 2,535,048 | ||||||
| (i) | Mainly comprise Net Worth Tax payable as of year-end. See note 19 for details. |
| (ii) | The balance relates to amounts due to the sellers of two lands underPromesas. These balances were paid between April and May 2011. |
The fair values of current trade and other payables approximate their respective carrying amounts due to their short-term nature.
| 17. | Taxation |
The Company is incorporated under the International Business Companies Act of the British Virgin Islands and accordingly, is exempted from payment of British Virgin Island’s income taxes. Accordingly, the Group’s tax expense comprises the charge for tax currently payable or deferred attributable to the Group’s subsidiaries in their taxable jurisdiction, which is limited to Uruguay as of the date of these financial statements. Tax is recognized in the statement of comprehensive income, except to the extent that it relates to items recognized directly in equity, in which case, it is also recognized in equity.
The operating subsidiaries in Uruguay are required to calculate and file their income tax returns on a separate basis rather than preparing a consolidated tax return. Therefore, operating subsidiaries are not allowed to offset income from one subsidiary with losses from another subsidiary.
The accompanying notes are an integral part of these consolidated interim financial statements.
F-147
Table of Contents
Union Agriculture Group Corp.
Notes to the Consolidated Interim Financial Statements (Continued)
(All amounts in US$, except shares and per share data and as otherwise indicated)
| 17. | Taxation (continued) |
The details of the provision for the Group’s income tax as of each period end are as follows:
| March 31, 2011 | March 31, 2010 | |||||||
Deferred income tax | 249,951 | 131,173 | ||||||
Income tax benefit | 249,951 | 131,173 | ||||||
The statutory income tax rate in Uruguay for all of the periods presented has been 25%.
Deferred tax assets and liabilities of the Group as of March 31, 2011 and June 30, 2010 will be recovered as follows:
| March 31, 2011 | June 30, 2010 | |||||||
Deferred income tax asset to be recovered after more than 12 months | 78,664 | 340,502 | ||||||
Deferred income tax assets | 78,664 | 340,502 | ||||||
| March 31, 2011 | June 30, 2010 | |||||||
Deferred income tax liabilities to be recovered within 12 months | 78,664 | 590,453 | ||||||
Deferred income tax liabilities | 78,664 | 590,453 | ||||||
The gross movement on the deferred income tax account is as follows:
| March 31, 2011 | March 31, 2010 | |||||||
Beginning of period | (249,951 | ) | (168,308 | ) | ||||
Income tax benefit | 249,951 | 131,173 | ||||||
End of period | — | (37,135 | ) | |||||
The accompanying notes are an integral part of these consolidated interim financial statements.
F-148
Table of Contents
Union Agriculture Group Corp.
Notes to the Consolidated Interim Financial Statements (Continued)
(All amounts in US$, except shares and per share data and as otherwise indicated)
| 17. | Taxation (continued) |
The movement in the deferred income tax assets and liabilities during the nine–month periods ended March 31, 2011 and 2010, without taking into consideration the offsetting of balances within the same tax jurisdiction, is as follows:
Deferred income tax assets | Property, plant and equipment | Equity-settled share-based compensation | Total | |||||||||
At June 30, 2009 | 11,096 | — | 11,096 | |||||||||
Credited to the statement of comprehensive income | 15,046 | 69,783 | 84,829 | |||||||||
At March 31, 2010 | 26,142 | 69,783 | 95,925 | |||||||||
At June 30, 2010 | 270,314 | 70,188 | 340,502 | |||||||||
(Charged) / credited to the statement of comprehensive income | (270,314 | ) | 8,476 | (261,838 | ) | |||||||
At March 31, 2011 | — | 78,664 | 78,664 | |||||||||
Deferred income tax liabilities | Property, plant and equipment | Biological assets | Total | |||||||||
At June 30, 2009 | 86,807 | 92,597 | 179,404 | |||||||||
(Credited) / charged to the statement of comprehensive income | (86,807 | ) | 40,463 | (46,344 | ) | |||||||
At March 31, 2010 | — | 133,060 | 133,060 | |||||||||
At June 30, 2010 | — | 590,453 | 590,453 | |||||||||
Credited to the statement of comprehensive income | — | (511,789 | ) | (511,789 | ) | |||||||
At March 31, 2011 | — | 78,664 | 78,664 | |||||||||
Deferred income tax assets are recognized for tax loss carry-forwards to the extent that the realization of the related tax benefits through future taxable profits is probable. As of March 31, 2011, the tax loss carry-forwards of the Group amount to US$ 10.6 million. The expiration date of these tax loss carry-forwards is as follows:
Tax loss carry- forwards | Date of generation | Date of expiration | ||||||
113,487 | 2008 | 2013 | ||||||
2,084,018 | 2009 | 2014 | ||||||
8,447,629 | 2010 | 2015 | ||||||
The Group will have to generate future taxable income in Uruguay to fully realize the deferred tax assets related to the tax operating losses. As of March 31, 2011, the Group did not recognize deferred tax assets relating to carry forward losses and other temporary differences of US$ 13.8 million (June 30, 2010: US$ 9.7 million). Although management believes that it will become profitable in the foreseeable future, as a result of the history of recent losses incurred during the development phase of the different Group’s business operations and the lack of verifiable and objective evidence due to the limited operating history of the Group itself, the Board of Directors has determined that there is sufficient uncertainty as to the generation of sufficient income to utilize the losses within a reasonable timeframe, therefore, no deferred tax asset is recognized in relation to these losses.
The accompanying notes are an integral part of these consolidated interim financial statements.
F-149
Table of Contents
Union Agriculture Group Corp.
Notes to the Consolidated Interim Financial Statements (Continued)
(All amounts in US$, except shares and per share data and as otherwise indicated)
| 17. | Taxation (continued) |
The tax on the Group’s profit before tax differs from the theoretical amount that would arise using the weighted average tax rate applicable to profits of the consolidated entities as follows:
| March 31, 2011 | March 31, 2010 | |||||||
Loss before income tax | (1,851,022 | ) | (877,041 | ) | ||||
Statutory income tax rate in Uruguay | 25 | % | 25 | % | ||||
Tax calculated at the statutory income tax rate in Uruguay | (462,756 | ) | (219,260 | ) | ||||
Tax effects of: | ||||||||
Non-deductible items | 2,444,534 | 2,202,407 | ||||||
Non-taxable items | (2,685,704 | ) | (345,873 | ) | ||||
Inflation adjustment for tax purposes | 1,482,943 | 122,491 | ||||||
Equity settlement share-based compensation | (4,211 | ) | (67,150 | ) | ||||
Unrecognized deferred tax assets | (781,769 | ) | (482,306 | ) | ||||
Unrecognized tax losses | (242,988 | ) | (1,341,482 | ) | ||||
Income tax benefit | (249,951 | ) | (131,173 | ) | ||||
| 18. | Sales of agricultural produce and biological assets and services rendered |
| March 31, 2011 | March 31, 2010 | |||||||
Cattle | 2,688,768 | 125,591 | ||||||
Wheat | 1,625,943 | — | ||||||
Rice | 866,763 | — | ||||||
Soybean | 517,654 | — | ||||||
Live sheep | 196,698 | — | ||||||
Milk | 116,203 | — | ||||||
Wool | 99,518 | — | ||||||
Blueberries | 82,164 | — | ||||||
Honey | 8,514 | 11,808 | ||||||
Services | 9,938 | 9,617 | ||||||
Total sales | 6,212,163 | 147,016 | ||||||
| 19. | Expenses by nature |
The Group presented the statement of comprehensive income under the function of expense method. Under this method, expenses are classified according to their function as part of the line items “cost of production”, “cost of agricultural produce and biological assets sold and services rendered”, “general and administrative expenses” and “selling expenses”.
The accompanying notes are an integral part of these consolidated interim financial statements.
F-150
Table of Contents
Union Agriculture Group Corp.
Notes to the Consolidated Interim Financial Statements (Continued)
(All amounts in US$, except shares and per share data and as otherwise indicated)
| 19. | Expenses by nature (continued) |
The following table provides the additional disclosure required on the nature of expenses and their relationship to the function within the Group:
| March 31, 2011 | March 31, 2010 | |||||||
Changes in biological assets and agricultural produce | 5,919,650 | 121,689 | ||||||
Salaries and social security expenses | 3,998,001 | 1,287,565 | ||||||
Net worth tax (*) | 3,854,590 | 1,071,533 | ||||||
Consumable supplies | 2,979,724 | 651,804 | ||||||
Contracted services | 1,368,174 | 429,152 | ||||||
Fuel and lubricants | 673,936 | 245,480 | ||||||
Fees for services | 537,692 | 157,440 | ||||||
Depreciation and amortization | 391,562 | 120,352 | ||||||
Other taxes | 321,414 | 160,336 | ||||||
Freights | 289,678 | 111,634 | ||||||
Travel expenses | 274,007 | 140,963 | ||||||
Lease expense | 162,218 | 31,284 | ||||||
Stationery and office supplies | 156,102 | 80,306 | ||||||
Maintenance and repairs | 145,032 | 269,448 | ||||||
Insurance | 115,104 | 13,361 | ||||||
Communications | 39,038 | 20,083 | ||||||
Cost of services rendered | 6,955 | 7,213 | ||||||
Others | 81,753 | 78,395 | ||||||
Total expenses by nature | 21,314,630 | 4,998,038 | ||||||
| (*) | All companies in Uruguay are subject to a Net Worth Tax, or theImpuesto al Patrimonio (IP) at a rate of 1.5% on the net worth of Uruguayan entities located in Uruguay. The IP is based on all the assets located or used economically in Uruguayan territory minus a short list of liabilities as established by law, including loans from local banks, certain debts with goods and service providers and import balances. |
| 20. | Salaries and social security expenses |
| March 31, 2011 | March 31, 2010 | |||||||
Wages and salaries | 2,693,179 | 1,258,939 | ||||||
Social security costs | 42,989 | 18,095 | ||||||
Equity-settled share-based compensation | 1,261,833 | 10,531 | ||||||
| 3,998,001 | 1,287,565 | |||||||
The accompanying notes are an integral part of these consolidated interim financial statements.
F-151
Table of Contents
Union Agriculture Group Corp.
Notes to the Consolidated Interim Financial Statements (Continued)
(All amounts in US$, except shares and per share data and as otherwise indicated)
| 21. | Financial results, net |
| March 31, 2011 | March 31, 2010 | |||||||
Finance income: | ||||||||
- Interest income | 472,225 | 472,079 | ||||||
- Changes in fair value of financial assets at fair value through profit or loss | 616,888 | — | ||||||
- Foreign exchange gains, net | 21,167 | 929,331 | ||||||
Finance income | 1,110,280 | 1,401,410 | ||||||
Finance costs: | ||||||||
- Interest expense | (132 | ) | (105 | ) | ||||
- Changes in fair value of financial assets at fair value through profit or loss | — | (178 | ) | |||||
Finance costs | (132 | ) | (283 | ) | ||||
Total financial results, net | 1,110,148 | 1,401,127 | ||||||
| 22. | Earnings per share |
Basic and diluted loss per share is calculated by dividing the loss attributable to equity holders of the Group by the weighted average number of shares in issue during the period.
| March 31, 2011 | March 31, 2010 | |||||||
Loss attributable to equity holders of the Group | (1,601,071 | ) | (724,263 | ) | ||||
Weighted average number of shares in issue (*) | 28,849,272 | 13,197,997 | ||||||
Basic and diluted losses per share | (0.055 | ) | (0.055 | ) | ||||
| (*) | For all periods presented, the weighted-average number of shares in issue was restated to give effect to the consolidation of the common shares of the Group on the basis of a ratio of one post-consolidation common share for every six pre-consolidation common shares (see Note 26 for details). |
Diluted net loss per share is computed by dividing the net loss for the period by the weighted average number of common shares outstanding, and when dilutive, adjusted for the effect of all potentially dilutive shares, including share options, on an as-if converted basis. For all periods presented, there were no differences in the weighted-average number of common shares used for basic and diluted net loss per share as the effect of all potentially dilutive shares outstanding was anti-dilutive. As of March 31, 2011, there were 21.2 million (March 31, 2010: 11.7 million) share options outstanding that could potentially have a dilutive impact in the future but were antidilutive in all periods presented.
The accompanying notes are an integral part of these consolidated interim financial statements.
F-152
Table of Contents
Union Agriculture Group Corp.
Notes to the Consolidated Interim Financial Statements (Continued)
(All amounts in US$, except shares and per share data and as otherwise indicated)
| 23. | Disclosure of leases |
The Group as lessee
Operating leases:
In November 2009, the Group entered into an agreement to lease its corporate headquarters under a cancellable operating lease with a company related to the Executive Chairman and Director of the Company. The agreement is effective as from the date the group begins using the property, which occurred in May 2010. The lease calls for fixed monthly payments for the first two years plus a 5% increase through its expiration in May 2015. Rental expense under this lease was US$ 143,256 nine-month period ended March 31, 2011. Prior to May 2010, the Group leased its corporate offices under a cancellable operating lease from an unrelated party, which was terminated upon relocating to the new premises. Rental expense under this lease for the nine-month period ended March 31, 2010 was US$ 18,000.
The future aggregate minimum lease payments under cancellable operating leases are as follows:
| March 31, 2011 | June 30, 2010 | |||||||
No later than 1 year | 175,692 | 175,692 | ||||||
Later than one year and not later than five years | 568,071 | 699,840 | ||||||
| 743,763 | 875,532 | |||||||
As from September 2009, the Group leases land for crop cultivation. The leases have an average term of a crop year. Under the lease agreements, rent accrues generally at the time of harvest and is payable at the end of the crop year. The Group makes payments based on the market value of soybean and rice multiplied by a fixed amount of tons per hectare leased. Rental expense was US$ 18,962 and US$ 13,284 for the nine-month periods ended March 31, 2011 and 2010.
Finance leases:
The Group leases certain ancillary farming assets and vehicles under various finance leases maturing between July 2011 and January 2012. The net book value of these assets under finance leases amounts to US$ 15,224 and US$ 20,760 as of March 31, 2011 and June 30, 2010.
At the commencement of the lease term, the Group recognizes a lease liability equal to the carrying amount of the leased asset. In subsequent periods, the liability decreases by the amount of lease payments made to the lessors using the effective interest method. The interest component of the lease payments is recognized in the statement of comprehensive income.
The accompanying notes are an integral part of these consolidated interim financial statements.
F-153
Table of Contents
Union Agriculture Group Corp.
Notes to the Consolidated Interim Financial Statements (Continued)
(All amounts in US$, except shares and per share data and as otherwise indicated)
| 23. | Disclosure of leases (continued) |
Gross finance lease liabilities – minimum lease payments:
| March 31, 2011 | June 30, 2010 | |||||||
Not later than one year | 5,476 | 4,916 | ||||||
Later than one year and not later than five years | — | 2,649 | ||||||
| 5,476 | 7,565 | |||||||
Future finance charges on finance leases | (207 | ) | (635 | ) | ||||
Present value of finance lease liabilities | 5,269 | 6,930 | ||||||
The present value of finance lease liabilities is as follows:
| March 31, 2011 | June 30, 2010 | |||||||
Not later than one year | 5,269 | 4,562 | ||||||
Later than one year and not later than five years | — | 2,368 | ||||||
| 5,269 | 6,930 | |||||||
The Group as lessor
Operating leases:
As of March 31, 2011, the Group acts as a lessor in connection with three non-cancelable leases. The Group leases two properties to SAMAN, namely, the Merín farmland (the “Rural Lease Agreement with SAMAN”) and a rice mill, storage facilities and warehousing spaces (the “Paso Manzagano Plant Agreement”). The third property is the Arroyo Blanco farmland and is leased to another third party. The terms of these leases are as follows:
The Rural Lease Agreement with SAMAN
The Group has a lease agreement with SAMAN, under which SAMAN agreed to lease approximately 3,000 hectares of farmland from the Group and to pay an annual cash amount equivalent to 16 “bags” of rice (each bag being approximately 50 kg) for each hectare planted. The cash price for each “bag” is determined at the end of each harvest year by reference to the prices published by the “Asociación de Cultivadores de Arroz” and the “Gremial de Molinos Arroceros.” The lease was required as a condition to the sale of the Merín farmland by SAMAN, because SAMAN had already invested in cultivating crops on the land and wanted to maintain its right to use the land until such crops could be harvested. The lease expires on June 22, 2012. Since the price is not known until the end of the harvest year this lease agreement meets the definition of contingent rent under IAS 17 “Leases”. Accordingly, rental income will be recognized once the contingent rent is known and the payment is received. No rental income has been included for the nine-months period ended March 31, 2011.
The accompanying notes are an integral part of these consolidated interim financial statements.
F-154
Table of Contents
Union Agriculture Group Corp.
Notes to the Consolidated Interim Financial Statements (Continued)
(All amounts in US$, except shares and per share data and as otherwise indicated)
| 23. | Disclosure of leases (continued) |
The Paso Manzagano Plant Agreement
The Paso Manzagano Plant Agreement has an initial term of three years, which term is automatically renewable for additional 3-year periods unless terminated by either party with one year prior notice. Under the Paso Manzagano Plant Agreement, the Group will receive an annual fixed payment of US$ 40,000 during the first year of the agreement and US$ 75,000 for the second and third year plus a variable payment of US$5 for every ton of rice milled. The fixed payment is adjusted 12.5% at the inception of every three-year period. Under the Paso Manzagano Plant Agreement, SAMAN agreed to invest in order to improve and expand the leased facilities. The Group is not obliged to reimburse any of the SAMAN investments. Both parties agreed that the SAMAN investments have an estimated useful life of 10 years and intend to maintain the Paso Manzagano Plant Agreement until the end of such period. In case the lease is terminated before the 10-year period, the Group will receive the SAMAN investments for which it will have to pay an amount equivalent to the carrying amount of the SAMAN investments as of the date of termination. The SAMAN investments have been completed at a total cost of US$ 866,086 and are not recognized in the Group’s consolidated financial statements.
Upon termination of the Paso Manzagano Plant Agreement at the tenth year (when the investments will reach the end of their estimated useful lives), the Group will receive the SAMAN investments at no cost. Thus, the Group will not recognize any assets based on the definition of cost in IFRS. Additionally, pursuant to the Paso Manzagano Plant Agreement, the Group agreed to exclusively sell its entire rice production to SAMAN for the duration of the agreement. The exclusivity ceases upon termination of the agreement. Considering a lease term of 10 years, future minimum lease payments receivable under the SAMAN Lease Agreement (excluding the variable portion) are as follows:
| March 31, 2011 | June 30, 2010 | |||||||
Not later than one year | 75,000 | 75,000 | ||||||
Later than one year and not later than five years | 328,125 | 328,125 | ||||||
Thereafter | 391,553 | 391,553 | ||||||
| 794,678 | 794,678 | |||||||
The Arroyo Blanco lease Agreement
The Group has a lease agreement with a third party, under which it agreed to lease approximately 2,300 hectares of farmland from the Group and to pay an annual cash payment of US$ 0.6 million. The lease agreement expires in May 2011. Rental income has been recognized under the straight-line basis over the lease period.
Rental income under all operating leases amounted to US$ 529,312 and US$ 30,933 for the nine-month periods ended March 31, 2011 and 2010, respectively.
Finance leases:
The Group does not act as a lessor in connection with finance leases.
The accompanying notes are an integral part of these consolidated interim financial statements.
F-155
Table of Contents
Union Agriculture Group Corp.
Notes to the Consolidated Interim Financial Statements (Continued)
(All amounts in US$, except shares and per share data and as otherwise indicated)
| 24. | Group companies |
The following table details the companies making up the Group as of March 31, 2011 and June 30, 2010. All companies are operating subsidiaries. All operating subsidiaries engage into agricultural and agricultural-related activities. All operating companies are incorporated in Uruguay where they operate. The Group does not have any associates or joint ventures in any of the periods indicated. The capital of all operating subsidiaries is represented by common shares only.
| Activity | March 31, 2011 | June 30, 2010 | ||||||||
| Ownership percentage | Ownership percentage | |||||||||
Operating companies (unless otherwise stated): | ||||||||||
Nogatir S.A. | Farm owner | 100 | % | 100 | % | |||||
Madalux S.A. | Farm owner | 100 | % | 100 | % | |||||
Vadolmar S.A. | Farm owner | 100 | % | 100 | % | |||||
Boisy S.A. | Farm owner | 100 | % | 100 | % | |||||
Rafilur S.A. | Farm owner | 100 | % | 100 | % | |||||
Union Agriculture Group S.A. | Farm management | 100 | % | 100 | % | |||||
Canteras Doradas S.A. | Farm owner | 100 | % | 100 | % | |||||
Aguacare S.A. | Farm owner | 100 | % | 100 | % | |||||
Alto Lucero S.A. | Farm owner | 100 | % | 100 | % | |||||
The accompanying notes are an integral part of these consolidated interim financial statements.
F-156
Table of Contents
Union Agriculture Group Corp.
Notes to the Consolidated Interim Financial Statements (Continued)
(All amounts in US$, except shares and per share data and as otherwise indicated)
| 25. | Related-party transactions |
The following is a summary of the balances and transactions with related parties:
Related party | Relationship | Description of transaction | Amount of transaction | Balance receivable/ (payable) | ||||||||||||||||
| March 31, 2011 | March 31, 2010 | March 31, 2011 | June 30, 2010 | |||||||||||||||||
| Union Capital Management Ltd. | (ii) | Equity placement fees (*) | (2,664,938 | ) | (3,619,292 | ) | — | — | ||||||||||||
| Stock options compensation (*) | (325,658 | ) | (107,242 | ) | — | — | ||||||||||||||
| Union Capital Holding S.A. | (i) | Stock options compensation (*) | (254,085 | ) | (42,836 | ) | — | — | ||||||||||||
| Vi Capital Investment | (iii) | Stock options compensation (*) | (1,913,528 | ) | (131,295 | ) | — | — | ||||||||||||
| Woodport Limited | (iv) | Operating lease (**) | (143,256 | ) | — | — | — | |||||||||||||
| Sanguinett, Fodere & Bragard Abogados | (v) | Legal fees (****) (Note 16) | (804,375 | ) | — | (161,709 | ) | — | ||||||||||||
| Escrow deposits (Note 12) | — | — | 2,731,549 | — | ||||||||||||||||
| Management and selected employees | Employment | Wages and salaries (**) | (546,715 | ) | (477,217 | ) | (229,646 | ) | (78,701 | ) | ||||||||||
Stock options compensation (***) | (2,344,468 | ) | (139,039 | ) | — | — | ||||||||||||||
| Oregon Public Employees Retirement Fund | (vi) | Receivables with shareholders (Note 12) | — | — | 293,700 | — | ||||||||||||||
| Radian Group Inc. | (vi) | Receivables with shareholders (Note 12) | — | — | 119,240 | — | ||||||||||||||
| (i) | Union Capital Holding S.A., a Luxembourg-based company, or UCH, is a company controlled by the Company’s Chairman, director and shareholder, Juan Sartori. |
| (ii) | Union Capital Management Ltd. is a wholly-owned subsidiary of UCH. |
| (iii) | Vi Capital Investment is a company controlled by the Company’s Chairman, director and shareholder, Juan Sartori. |
| (iv) | A BVI-based real estate entity controlled by the Company’s Chairman, director and shareholder, Juan Sartori. |
| (v) | Mr. Jean Jacques Bragard has served as a director of the Group since December 2010. Mr. Bragard is a lawyer and partner with the Uruguayan-based legal firm Sanguinetti, Fodere & Bragard Abogados from which the Group contracts legal services. |
| (vi) | Shareholders of the Company. |
| (*) | Amount deducted from share capital. |
| (**) | Income/ (loss) included in the statement of comprehensive income. |
The accompanying notes are an integral part of these consolidated interim financial statements.
F-157
Table of Contents
Union Agriculture Group Corp.
Notes to the Consolidated Interim Financial Statements (Continued)
(All amounts in US$, except shares and per share data and as otherwise indicated)
| 25. | Related-party transactions (continued) |
| (***) | For the nine-month period ended March 31, 2011, an amount of US$ 1,082,634 was deducted from share capital (March 31, 2010: US$ 128,508) and an amount of US$ 1,261,833 was charged to the statement of comprehensive income (March 31, 2010: US$ 10,531). |
| (****) | For the nine-month period ended March 31, 2011, an amount of US$ 22,840 was charged to the statement of comprehensive income , an amount of US$ 50,000 was capitalized as deferred offering costs, and an amount of US$ 731,535 was capitalized as directly attributable costs of acquiring land underPromesas. |
| 26. | Events after the date of the statement of financial position |
Productive Project Exception
On May 5, 2011, the Uruguayan government granted the Group authorization to own 17,846 hectares of land under the Second Productive Project. The Group will therefore execute the corresponding deeds of title according to standard administrative procedures under Uruguayan law. The Group expects to execute deeds of title no later than December 31, 2011. Once these deeds are executed, thePromesas will be reclassified to the land category within property, plant and equipment.
On June 22, 2011, the Group applied for an extension of the number of hectares under the Third Productive Project from 51,081 hectares to 66,645 hectares.
Payments for land under Promesas
Between April 2011 and June 2011, the Group entered into severalPromesas for land totalling approximately 15,555 hectares. The land underPromesas will primarily be used for cattle, rice and crops activities. The Group paid an aggregate US$ 51.7 million for thesePromesas. The Group used existing cash and a portion of the proceeds from the private placement completed in February 2011 to pay for them.
Equity-settled share-based payments
Between April 2011 and May 2011, 703,900 and 112,153 equity-settled options were exercised under the2008 Stock Option Plan and the2008/2009 Broker Compensation Options, respectively. The Group issued 816,053 common shares and received proceeds from the issuance for a total amount of approximately US$ 1.1 million. In June 2011, the Group issued 558,789 common shares, upon the exercise of equity-settled options under the 2008/2009 Broker Compensation Options, for a total amount of approximately US$ 0.8 million.
Amendment to the Articles of Association
On June 7, 2011, the Shareholders’ Meeting approved the amendment of the Articles of Association of the Company to authorize to issue an unlimited number of preferred shares, without par value, the rights and preferences of which may be established by the Board of Directors.
2011 Equity Incentive Plan
On June 12, 2011, the Group established the “2011 Equity Incentive Plan”, under which the Group may grant awards to employees, directors or consultants (the “Service Providers”). The awards may include incentive
The accompanying notes are an integral part of these consolidated interim financial statements.
F-158
Table of Contents
Union Agriculture Group Corp.
Notes to the Consolidated Interim Financial Statements (Continued)
(All amounts in US$, except shares and per share data and as otherwise indicated)
| 26. | Events after the date of the statement of financial position (continued) |
stock options, nonstatutory stock options, restricted stock, stock appreciation rights, restricted stock units, performance units and performance shares, among others. The plan is administered by the Board of Directors of the Group, or a committee appointed by the Board of Directors.
Line of credit
On June 14, 2011, UAG S.A., a subsidiary of the Group, entered into a US$ 10.0 million line of credit with Banco Itaú Uruguay S.A. (the “Line of credit”). The Line of credit bears a fixed interest rate of 4.5 % per annum and matures on October 31, 2011. The Line of credit contains certain restrictions, including the prohibition to sell or pledge assets of UAG S.A. without the lender’s consent, and the requirement that the Group’s borrowings do not exceed US$ 15.0 million. As of the date of these financial statements, no funds have been withdrawn under the Line of credit.
Termination of Rural Lease Agreement with SAMAN
On June 15, 2011, the Group terminated the Rural Lease Agreement with SAMAN, which originally expires in June 2012. As a result, the Group is required to pay to SAMAN a termination fee amounting to US$ 480,386, which as of the date of these financial statements has not yet been paid.
Reverse stock split
On June 7, 2011, a special Shareholders’ Meeting approved the consolidation of the outstanding common shares of the Group (the “Common Shares”) on the basis of a ratio to be selected and implemented by the Board of Directors at any time prior to the earlier of the Offering and December 31, 2011.
On June 23, 2011, the Board of Directors approved the consolidation of the Common Shares to be effected at a ratio of one post-consolidation common share for every six pre-consolidation common shares (the “Reverse Stock Split”). On a pro forma basis, after giving effect to the Reverse Stock Split, the number of outstanding common shares would decrease as of March 31, 2011 from 219,890,431 shares to 36,648,406 shares (June 30, 2009; from 69,384,374 shares to 11,564,063 shares; March 31, 2010; from 141,819,099 shares to 23,636,517 shares; June 30, 2010; from 142,969,831 shares to 23,828,306 shares) .
The weighted-average number of shares in issue used in the earnings per share calculation was restated for all periods presented to give effect to the Reverse Stock Split in accordance with IAS 33 “Earnings per share”. All other share data presented in these financial statements was not retrospectively adjusted, as the Reverse Stock Split is a non-adjusting event in accordance with IAS 10 “Events after the reporting period”.
Land under Promesas
As fully described in Note 4(a), the Government of Uruguay did not extend the Compliance Provision of Law No. 18,092 beyond June 30, 2011. However, on June 23, 2011, the Executive Power issued Decree No. 218/11 establishing that Non-Compliant Companies that had properly applied for government authorization to own and/or use farmland on or prior to June 30, 2011, would be permitted to continue to use the farmland subject to such applications pending government determination of such applications. In order to make use of the Expedited Process, on June 22, 2011, Boisy S.A. applied for authorization to use approximately 64,000 hectares of land, which were also included in the Third Productive Project. The Group expects to obtain this authorization 30 business days after its application, although there can be no assurance that the government will not deny the application. In the event the government denies Boisy S.A.’s application under the Expedited Process, processing will continue with the standard authorization under the Third Productive Project as fully described in Note 4(a).
The accompanying notes are an integral part of these consolidated interim financial statements.
F-159
Table of Contents

Until , 2011 (25 days after the date of this prospectus), all dealers effecting transactions in these securities, whether or not participating in this offering, may be required to deliver a prospectus. This is in addition to the dealers’ obligation to deliver a prospectus when acting as an underwriter and with respect to unsold allotments or subscriptions.
Table of Contents
PART II
INFORMATION NOT REQUIRED IN PROSPECTUS
| Item 6. | Indemnification of Directors and Officers |
British Virgin Islands (“BVI”) law does not limit the extent to which a company’s memorandum and articles of association may provide for indemnification of officers and directors, except to the extent any such provision may be held by BVI courts to be contrary to public policy, such as to provide indemnification against civil fraud or the consequences of committing a crime. The Registrant’s memorandum and articles of association provide that, to the fullest extent permitted by BVI law, the Registrant may indemnify its directors and officers against claims by its shareholders for any acts or omissions in the performance of their duties. Such indemnification does not affect the availability of equitable remedies such as injunctive relief or rescission. These provisions will not limit the liability of directors under United States federal securities laws.
The Registrant may indemnify any of its directors, officers, agents, a liquidator or anyone serving at its request as a director, officer, agent or liquidator of another entity against all expenses, including legal fees, and against all judgments, fines and amounts paid in settlement and reasonably incurred in connection with legal, administrative or investigative proceedings. The Registrant may only indemnify a person if he or she acted honestly and in good faith with a view to the Registrant’s best interests and, in the case of criminal proceedings, the person had no reasonable cause to believe that his or her conduct was unlawful. The decision of the Registrant’s board of directors as to whether the person acted honestly and in good faith with a view to the Registrant’s best interests and as to whether the person had no reasonable cause to believe that his or her conduct was unlawful, is, in the absence of fraud, sufficient for the purposes of indemnification, unless a question of law is involved. The termination of any proceedings by any judgment, order, settlement, conviction or the entry of no plea does not, by itself, create a presumption that a person did not act honestly and in good faith and with a view to the best interests of the Registrant or that the person had reasonable cause to believe that his or her conduct was unlawful.
The Registrant may purchase and maintain insurance in relation to any person who is or was a director, officer or liquidator of the Registrant, or anyone serving at its request as a director, officer, agent or liquidator of another entity against any liability asserted against the person and incurred by the person in that capacity, whether or not the Registrant has or would have had the power to indemnify the person against the liability as provided in the Registrant’s memorandum and articles of association.
Insofar as indemnification for liabilities arising under the Securities Act may be permitted for directors, officers or persons controlling the registrant pursuant to the foregoing provisions, the Registrant has been informed that, in the opinion of the SEC, such indemnification is against public policy as expressed in the Securities Act and is therefore unenforceable as a matter of United States law.
| Item 7. | Recent Sales of Unregistered Securities |
The following sets forth information regarding all unregistered securities sold since January 2, 2008 (the Registrant’s formation). Information in this Item 7 has not been adjusted to reflect the 6:1 reverse split of the Registrant’s outstanding common shares, which became effective on June 23, 2011.
| Name of Purchaser | Date of Purchase | Number of Common Shares Purchased | Price Per Share | |||||||||
Oscar Baltasar Costa Martínez | June 23, 2008 | 68,696 | $ | 0.01 | ||||||||
Juan Sartori | June 23, 2008 | 535,404 | $ | 0.01 | ||||||||
36 individuals | June 23, 2008 | 4,395,904 | $ | 0.01 | ||||||||
Berkano Investment Partners, L.P. | July 22, 2008 | 36,000 | Cdn$ | 1.40 | ||||||||
II-1
Table of Contents
| Name of Purchaser | Date of Purchase | Number of Common Shares Purchased | Price Per Share | |||||||||
Perth Capital Partners LP | July 22, 2008 | 143,000 | Cdn$ | 1.40 | ||||||||
TGRA Enterprise Fund (USA) LP | July 22, 2008 | 71,500 | Cdn$ | 1.40 | ||||||||
Excalibur Special Opportunities LP | July 22, 2008 | 215,000 | Cdn$ | 1.40 | ||||||||
CD Private Equity Natural Resources Fund | July 22, 2008 | 700,000 | Cdn$ | 1.40 | ||||||||
Dominion Fiduciary Nominees Limited | July 22, 2008 | 70,000 | Cdn$ | 1.40 | ||||||||
BTR Global Growth Trading Limited Ogier Fiduciary Services (Cayman) Limited | July 22, 2008 | 3,150,000 | Cdn$ | 1.40 | ||||||||
BTR Global Growth Trading Limited Ogier Fiduciary Services (Cayman) Limited | July 22, 2008 | 2,085,000 | Cdn$ | 1.40 | ||||||||
Salida Multi Strategy Hedge Fund Salida Capital Corp. | July 22, 2008 | 4,300,000 | Cdn$ | 1.40 | ||||||||
BTR Global Growth Trading Limited Ogier Fiduciary Services (Cayman) Limited | July 22, 2008 | 4,750,000 | Cdn$ | 1.40 | ||||||||
Lawrence Asset Management Inc. Global Agribusiness Trust | July 22, 2008 | 355,000 | Cdn$ | 1.40 | ||||||||
I.G. Investment Management Ltd., as trustee for Investors Canadian Growth Fund | July 22, 2008 | 800,000 | Cdn$ | 1.40 | ||||||||
Investors Group Corporate Class Inc. for Investors Canadian Growth Class | July 22, 2008 | 83,000 | Cdn$ | 1.40 | ||||||||
I.G. Investment Management Ltd., as trustee for Investors Summa Global Environmental Leaders Fund | July 22, 2008 | 90,000 | Cdn$ | 1.40 | ||||||||
I.G. Investment Management Ltd., as trustee for Investors Summa Global Environmental Leaders Fund | July 22, 2008 | 31,000 | Cdn$ | 1.40 | ||||||||
Sprott Asset Management Inc. | July 22, 2008 | 10,600,000 | Cdn$ | 1.40 | ||||||||
Wellington Management Portfolios (Cayman) Diversified Inflation Hedges Portfolio | July 22, 2008 | 910,000 | Cdn$ | 1.40 | ||||||||
Julius Baer Multistock – Natural Resources Stock Fund | July 22, 2008 | 86,200 | Cdn$ | 1.40 | ||||||||
Wellington Trust Company National Association Multiple Common Trust Funds Trust Global Agriculture Portfolio | July 22, 2008 | 6,888,300 | Cdn$ | 1.40 | ||||||||
Public Sector Pension Investment Board | July 22, 2008 | 959,000 | Cdn$ | 1.40 | ||||||||
Radian Group Inc. | July 22, 2008 | 124,500 | Cdn$ | 1.40 | ||||||||
New York State Nurses Association Pension Plan | July 22, 2008 | 201,500 | Cdn$ | 1.40 | ||||||||
Wellington Trust Company National Association Multiple Common Trust Funds Trust Emerging Companies Portfolio | July 22, 2008 | 537,000 | Cdn$ | 1.40 | ||||||||
DOW Employees’ Pension Plan | July 22, 2008 | 613,500 | Cdn$ | 1.40 | ||||||||
Lockheed Martin Corporation Master | July 22, 2008 | 639,500 | Cdn$ | 1.40 | ||||||||
Oregon Public Employees Retirement Fund | July 22, 2008 | 757,500 | Cdn$ | 1.40 | ||||||||
Wellington Trust Company National Association Multiple Collective Investment Funds Trust Emerging Companies Portfolio | July 22, 2008 | 1,194,500 | Cdn$ | 1.40 | ||||||||
Blackrock Investment Managers | July 22, 2008 | 2,140,000 | Cdn$ | 1.40 | ||||||||
RAB Special Situations (Master) Fund Limited | July 22, 2008 | 1,785,000 | Cdn$ | 1.40 | ||||||||
Cemcorp Ltd. | July 22, 2008 | 8,570 | Cdn$ | 1.40 | ||||||||
Gibralt Capital Corporation | July 22, 2008 | 110,000 | Cdn$ | 1.40 | ||||||||
Gabrielle Developments Ltd. | July 22, 2008 | 17,860 | Cdn$ | 1.40 | ||||||||
KLM Ventures | July 22, 2008 | 105,000 | Cdn$ | 1.40 | ||||||||
619161 Saskatchewan Ltd. | July 22, 2008 | 72,500 | Cdn$ | 1.40 | ||||||||
Alpha Capital Management Ltd. | July 22, 2008 | 1,071,428 | Cdn$ | 1.40 | ||||||||
Pictet Private Equity Investors SA | July 22, 2008 | 178,571 | Cdn$ | 1.40 | ||||||||
Epicurus Capital Inc. | July 22, 2008 | 150,000 | Cdn$ | 1.40 | ||||||||
Global AgriCap Fund | July 22, 2008 | 357,000 | Cdn$ | 1.40 | ||||||||
Credit Agricole (Suisse) SA | July 22, 2008 | 1,425,000 | Cdn$ | 1.40 | ||||||||
II-2
Table of Contents
| Name of Purchaser | Date of Purchase | Number of Common Shares Purchased | Price Per Share | |||||||||
Gaia World Agri Master Fund | July 22, 2008 | 350,000 | Cdn$ | 1.40 | ||||||||
23 individual investors | July 22, 2008 | 409,274 | Cdn$ | 1.40 | ||||||||
Wellington Management Portfolios (Cayman) – Diversified Inflation Hedges Portfolio | June 25, 2009 | 241,100 | $ | 1.40 | ||||||||
Global Inflation Strategy Fund of Nikko AM Investment Trust (Cayman) | June 25, 2009 | 351,000 | $ | 1.40 | ||||||||
Clariden Leu (LUX) Commodity Instruments Fund | June 25, 2009 | 48,900 | $ | 1.40 | ||||||||
Julius Baer Multistock – Natural Resources Stock Fund | June 25, 2009 | 180,800 | $ | 1.40 | ||||||||
Diversified Inflation Strategies, LP | June 25, 2009 | 87,900 | $ | 1.40 | ||||||||
Wellington Trust Company, National Association Multiple Common Trust Funds Trust Global Agricultural Portfolio | June 25, 2009 | 1,888,900 | $ | 1.40 | ||||||||
Wolf Creek Investor (Bermuda) L.P. | June 25, 2009 | 600,842 | $ | 1.40 | ||||||||
Wolf Creek Partners, LP | June 25, 2009 | 642,100 | $ | 1.40 | ||||||||
Merifin Capital B.V. | June 25, 2009 | 285,714 | $ | 1.40 | ||||||||
Elsingham Investments Ltd. | June 25, 2009 | 571,500 | $ | 1.40 | ||||||||
Stuart Investment Holdings Ltd. | June 25, 2009 | 428,600 | $ | 1.40 | ||||||||
St Peter Port Capital Limited | June 25, 2009 | 1,428,600 | $ | 1.40 | ||||||||
Canaccord Capital Corporation | June 25, 2009 | 85,000 | $ | 1.40 | ||||||||
Valartis Bank | June 25, 2009 | 50,000 | $ | 1.40 | ||||||||
RBC CEES Nominees Limited | June 25, 2009 | 50,000 | $ | 1.40 | ||||||||
I S Trading Ltd. | June 25, 2009 | 71,000 | $ | 1.40 | ||||||||
Buckland Securities Inc. | June 25, 2009 | 500,000 | $ | 1.40 | ||||||||
Centrum Bank AG | June 25, 2009 | 215,000 | $ | 1.40 | ||||||||
MIPA Paris | June 25, 2009 | 286,000 | $ | 1.40 | ||||||||
EFG Bank | June 25, 2009 | 350,000 | $ | 1.40 | ||||||||
Dominion Pension Plan Trustees (Jersey) Limited as Trustee of Deephaven Employer Financed Retirement Benefit Scheme | June 25, 2009 | 250,000 | $ | 1.40 | ||||||||
Londes Développement | June 25, 2009 | 150,000 | $ | 1.40 | ||||||||
LV Développement | June 25, 2009 | 15,000 | $ | 1.40 | ||||||||
Havasu Limited | June 25, 2009 | 71,428 | $ | 1.40 | ||||||||
Agrivent SAS | June 25, 2009 | 3,600,000 | $ | 1.40 | ||||||||
Finetfo S.A. | June 25, 2009 | 1,250,000 | $ | 1.40 | ||||||||
22 individual investors | June 25, 2009 | 2,198,783 | $ | 1.40 | ||||||||
Individual investor | September 10, 2009 | 2,435 | $ | 1.40 | ||||||||
Roytor & Col for Pictet Private Equity Investors SA | September 10, 2009 | 19,481 | $ | 1.40 | ||||||||
Fraser Kearney Capital Corp. | March 8, 2010 | 588,200 | $ | 1.70 | ||||||||
Sprott Asset Management LP | March 8, 2010 | 4,930,000 | $ | 1.70 | ||||||||
Investors Group Corporate Class Inc. for Investors Summa Global Environmental Leaders Class | March 8, 2010 | 22,000 | $ | 1.70 | ||||||||
I.G. Investment Management, Ltd., as trustee for Investors Summa Global Environmental Leaders Funds | March 8, 2010 | 95,000 | $ | 1.70 | ||||||||
I.G. Investment Management, Ltd., as trustee for Investors Summa Sri Fund | March 8, 2010 | 4,152,000 | $ | 1.70 | ||||||||
Investors Group Corporate Class Inc. for Investors Summa Sri Class | March 8, 2010 | 171,000 | $ | 1.70 | ||||||||
Investors Group Corporate Class Inc. for Investors Canadian Growth Class | March 8, 2010 | 164,000 | $ | 1.70 | ||||||||
II-3
Table of Contents
| Name of Purchaser | Date of Purchase | Number of Common Shares Purchased | Price Per Share | |||||||||
I.G. Investment Management, Ltd., as trustee for Investors Canadian Growth Fund | March 8, 2010 | 1,389,000 | $ | 1.70 | ||||||||
Deutsche Investment Management Americas | March 8, 2010 | 1,650,000 | $ | 1.70 | ||||||||
Deutsche Investment Management Americas | March 8, 2010 | 4,190,000 | $ | 1.70 | ||||||||
Deutsche Investment Management Americas | March 8, 2010 | 155,000 | $ | 1.70 | ||||||||
Clariden Leu (Lux) Commodity Instruments Fund | March 8, 2010 | 250,000 | $ | 1.70 | ||||||||
GISF: Global Agriculture Strategy | March 8, 2010 | 100,000 | $ | 1.70 | ||||||||
Julius Baer Multistock – Natural Resources Stock Fund | March 8, 2010 | 42,000 | $ | 1.70 | ||||||||
Wellington Management Portfolios (Cayman) Diversified Inflation Hedges Portfolio (for Qualified Investors) | March 8, 2010 | 486,000 | $ | 1.70 | ||||||||
Terrebonne Investors (Bermuda), L.P. | March 8, 2010 | 2,229,600 | $ | 1.70 | ||||||||
Diversified Inflation Strategies, LP | March 8, 2010 | 239,000 | $ | 1.70 | ||||||||
Wellington Trust Company, National Association Multiple Common Trust Funds Trust Global Agriculture Portfolio | March 8, 2010 | 3,100,000 | $ | 1.70 | ||||||||
TerrebonnePartners L.P. | March 8, 2010 | 1,322,700 | $ | 1.70 | ||||||||
Labamerican | March 8, 2010 | 294,118 | $ | 1.70 | ||||||||
Figerindo | March 8, 2010 | 60,000 | $ | 1.70 | ||||||||
FCPR Ice Opportunity | March 8, 2010 | 12,623,530 | $ | 1.70 | ||||||||
SYSLA SAS | March 8, 2010 | 2,000,000 | $ | 1.70 | ||||||||
Agrivent SAS | March 8, 2010 | 6,500,000 | $ | 1.70 | ||||||||
Societe Civile Chapoulart et Cie | March 8, 2010 | 900,000 | $ | 1.70 | ||||||||
FCPR Ice Opportunity | March 8, 2010 | 79,412 | $ | 1.70 | ||||||||
AMHL | March 8, 2010 | 300,000 | $ | 1.70 | ||||||||
LDRP | March 8, 2010 | 882,353 | $ | 1.70 | ||||||||
ITS | March 8, 2010 | 764,706 | $ | 1.70 | ||||||||
Societe Civile de la Laurentie | March 8, 2010 | 300,000 | $ | 1.70 | ||||||||
EFG Banque Privee | March 8, 2010 | 39,705 | $ | 1.70 | ||||||||
EFG Banque Privee | March 8, 2010 | 39,705 | $ | 1.70 | ||||||||
EFG Banque Privee | March 8, 2010 | 20,000 | $ | 1.70 | ||||||||
EFG Banque Privee | March 8, 2010 | 17,500 | $ | 1.70 | ||||||||
EFG Banque Privee | March 8, 2010 | 88,235 | $ | 1.70 | ||||||||
Pictet Private Equity Investors SA | March 8, 2010 | 80,000 | $ | 1.70 | ||||||||
Union Bancaire Privee | March 8, 2010 | 205,882 | $ | 1.70 | ||||||||
Union Bancaire Privee | March 8, 2010 | 294,115 | $ | 1.70 | ||||||||
EFG Bank | March 8, 2010 | 250,000 | $ | 1.70 | ||||||||
Bank Julius Baer & Co Ltd. | March 8, 2010 | 17,600 | $ | 1.70 | ||||||||
HAPFE Gmbh | March 8, 2010 | 8,205 | $ | 1.70 | ||||||||
Sisters UK | March 8, 2010 | 294,118 | $ | 1.70 | ||||||||
Zebank Nominees Limited | March 8, 2010 | 176,470 | $ | 1.70 | ||||||||
Stancroft Trust Ltd. | March 8, 2010 | 705,882 | $ | 1.70 | ||||||||
RAB Special Situations (Master) Fund Limited | March 8, 2010 | 588,235 | $ | 1.70 | ||||||||
City Natural Resources High Yield Trust | March 8, 2010 | 885,000 | $ | 1.70 | ||||||||
Blackrock Investment Management UK Ltd. | March 8, 2010 | 457,200 | $ | 1.70 | ||||||||
Blackrock Investment Management UK Ltd. | March 8, 2010 | 353,000 | $ | 1.70 | ||||||||
Alton Limited | March 8, 2010 | 588,235 | $ | 1.70 | ||||||||
Core Resource Assets Ltd. | March 8, 2010 | 550,000 | $ | 1.70 | ||||||||
Doran Ventures Corp. | March 8, 2010 | 60,000 | $ | 1.70 | ||||||||
RBC Trustees (CI) Limited as Trustee of Jean Philippe Courtois Trust | March 8, 2010 | 588,235 | $ | 1.70 | ||||||||
V Fors Investments Ltd. | March 8, 2010 | 58,823 | $ | 1.70 | ||||||||
II-4
Table of Contents
| Name of Purchaser | Date of Purchase | Number of Common Shares Purchased | Price Per Share | |||||||||
Stuart Investment Holdings Ltd. | March 8, 2010 | 147,058 | $ | 1.70 | ||||||||
Elsingham Investments Ltd. | March 8, 2010 | 117,647 | $ | 1.70 | ||||||||
Penshire Inc. | March 8, 2010 | 440,000 | $ | 1.70 | ||||||||
Thevenet Inc. | March 8, 2010 | 294,118 | $ | 1.70 | ||||||||
APEF Advisory Company Sam | March 8, 2010 | 440,000 | $ | 1.70 | ||||||||
Greatland Investments Limited | March 8, 2010 | 110,000 | $ | 1.70 | ||||||||
19 individual investors | March 8, 2010 | 5,069,638 | $ | 1.70 | ||||||||
Sprott Asset Management LP | March 30, 2010 | 255,000 | $ | 1.40 | ||||||||
FGP Capital SA | March 30, 2010 | 40,000 | $ | 1.40 | ||||||||
FGP Capital SA | March 30, 2010 | 250,000 | $ | 1.40 | ||||||||
FGP Capital SA | March 30, 2010 | 100,000 | $ | 1.40 | ||||||||
Charlemagne Global Opportunities Fund | March 30, 2010 | 1,296,000 | $ | 1.40 | ||||||||
Magna Umbrella Fund Magna Latin America | March 30, 2010 | 420,000 | $ | 1.40 | ||||||||
OAKS Global Opportunities Fund | March 30, 2010 | 284,000 | $ | 1.40 | ||||||||
Fitel Nominees Ltd. | March 30, 2010 | 600,000 | $ | 1.40 | ||||||||
Bergamot Enterprise Limited | March 30, 2010 | 58,823 | $ | 1.40 | ||||||||
Browns & Co. Limited | March 30, 2010 | 294,118 | $ | 1.40 | ||||||||
Broadview Growth Fund Ltd. | March 30, 2010 | 290,000 | $ | 1.40 | ||||||||
Merifin Capital B.V. | March 30, 2010 | 117,650 | $ | 1.40 | ||||||||
URE Management Limited Corp. | March 30, 2010 | 30,000 | $ | 1.40 | ||||||||
3 individual investors | March 30, 2010 | 305,882 | $ | 1.40 | ||||||||
St. Peter Port Capital Limited | May 11, 2010 | 588,235 | $ | 1.40 | ||||||||
EFG Bank Monaco | September 20, 2010 | 205,879 | $ | 1.40 | ||||||||
Columbia Acorn International Select | December 10, 2010 | 1,000,000 | $ | 2.20 | ||||||||
Columbia Acorn | December 10, 2010 | 6,818,182 | $ | 2.20 | ||||||||
Wanger Select | December 10, 2010 | 1,363,636 | $ | 2.20 | ||||||||
Wanger International | December 10, 2010 | 1,204,545 | $ | 2.20 | ||||||||
Wanger International Select | December 10, 2010 | 68,182 | $ | 2.20 | ||||||||
Columbia Acorn Select | December 10, 2010 | 9,090,909 | $ | 2.20 | ||||||||
Columbia Acorn International | December 10, 2010 | 6,818,182 | $ | 2.20 | ||||||||
Macnicol Emergence Fund | December 16, 2010 | 227,000 | $ | 2.20 | ||||||||
Fraser Kearney Capital Corp. | December 16, 2010 | 273,100 | $ | 2.20 | ||||||||
GMP Diversified Alpha Master Fund Ltd. | December 16, 2010 | 341,000 | $ | 2.20 | ||||||||
Dynamic Focus + Resource Fund | December 16, 2010 | 4,545,500 | $ | 2.20 | ||||||||
Canaccord Genuity Corp. ITF Exacalibur Special Opportunities LP | December 16, 2010 | 225,000 | $ | 2.20 | ||||||||
Seumasosha Corporation | December 16, 2010 | 11,000 | $ | 2.20 | ||||||||
Mirabaud Investment Management | December 16, 2010 | 90,000 | $ | 2.20 | ||||||||
Stancroft Trust Ltd. | December 16, 2010 | 227,273 | $ | 2.20 | ||||||||
Sisters UK | December 16, 2010 | 68,182 | $ | 2.20 | ||||||||
EFG Private Bank Limited | December 16, 2010 | 68,181 | $ | 2.20 | ||||||||
Blackrock Investment Management (UK) Ltd., acting as an agent for BGF World Agriculture Fund in its capacity as discretionary investment manager | December 16, 2010 | 300,000 | $ | 2.20 | ||||||||
Mirabaud & Cie | December 16, 2010 | 136,364 | $ | 2.20 | ||||||||
Société Générale Private Banking (Suisse) SA | December 16, 2010 | 705,500 | $ | 2.20 | ||||||||
Murana Foundation | December 16, 2010 | 10,000 | $ | 2.20 | ||||||||
Safera Company Inc. | December 16, 2010 | 35,000 | $ | 2.20 | ||||||||
Algoria Productions Inc. | December 16, 2010 | 32,000 | $ | 2.20 | ||||||||
Union Bancaire Privée Ubp Sa | December 16, 2010 | 90,909 | $ | 2.20 | ||||||||
II-5
Table of Contents
| Name of Purchaser | Date of Purchase | Number of Common Shares Purchased | Price Per Share | |||||||||
Raferi Industrial SA | December 16, 2010 | 5,000 | $ | 2.20 | ||||||||
EFG Bank | December 16, 2010 | 250,000 | $ | 2.20 | ||||||||
Société Civile L.D.R.P. | December 16, 2010 | 307,647 | $ | 2.20 | ||||||||
Altinval Sarl | December 16, 2010 | 45,000 | $ | 2.20 | ||||||||
Compagnie De La Saveur Et De L’Image Sarl | December 16, 2010 | 2,263,590 | $ | 2.20 | ||||||||
Labamerican | December 16, 2010 | 113,637 | $ | 2.20 | ||||||||
Wellington Trust Company, National Association Multiple Common Trust Funds Trust, Global Agriculture Portfolio | December 16, 2010 | 1,678,600 | $ | 2.20 | ||||||||
Bay Pond Partners, L.P. | December 16, 2010 | 5,399,500 | $ | 2.20 | ||||||||
Doblis Spf S.A. | December 16, 2010 | 68,182 | $ | 2.20 | ||||||||
Libra Fund II (Luxembourg) | December 16, 2010 | 1,365,000 | $ | 2.20 | ||||||||
Wadad Inc. | December 16, 2010 | 45,455 | $ | 2.20 | ||||||||
Rockside International SA | December 16, 2010 | 136,000 | $ | 2.20 | ||||||||
Core Resource Assets Ltd. | December 16, 2010 | 370,000 | $ | 2.20 | ||||||||
Alton Limited | December 16, 2010 | 227,273 | $ | 2.20 | ||||||||
Charlemagne Capital Ltd. on Behalf of Magna Latin America Fund Sub Fund of Magna Umbrella Fund | December 16, 2010 | 104,000 | $ | 2.20 | ||||||||
Charlemagne Capital Ltd. on Behalf of Charlemagne Global Opportunities Fund | December 16, 2010 | 248,000 | $ | 2.20 | ||||||||
Charlemagne Capital Ltd. on Behalf of Charlemagne European New Frontiers Fund | December 16, 2010 | 63,000 | $ | 2.20 | ||||||||
Elsingham Investments Limited | December 16, 2010 | 45,500 | $ | 2.20 | ||||||||
Ithan Creek Master Investors (Cayman) L.P. | December 16, 2010 | 286,300 | $ | 2.20 | ||||||||
Ithan Creek Master Investors (Cayman) L.P. | December 16, 2010 | 2,858,100 | $ | 2.20 | ||||||||
Bay Pond Investors (Bermuda) L.P. | December 16, 2010 | 2,646,500 | $ | 2.20 | ||||||||
Sasa Tatou Limited Cst Administration (Bahamas) Ltd. | December 16, 2010 | 681,818 | $ | 2.20 | ||||||||
Corsican Holdings Pte Ltd. | December 16, 2010 | 2,000,000 | $ | 2.20 | ||||||||
21 individual investors | December 16, 2010 | 4,331,544 | $ | 2.20 | ||||||||
MC Messager | December 29, 2010 | 45,000 | $ | 2.20 | ||||||||
VFORS Holding Ltd. | December 29, 2010 | 22,727 | $ | 2.20 | ||||||||
Taillevent Limited | December 29, 2010 | 909,090 | $ | 2.20 | ||||||||
Netmanagers | December 29, 2010 | 65,000 | $ | 2.20 | ||||||||
Agrivent | December 29, 2010 | 3,250,000 | $ | 2.20 | ||||||||
SYSLA | December 29, 2010 | 2,000,000 | $ | 2.20 | ||||||||
GGCP Inc. | December 29, 2010 | 340,910 | $ | 2.20 | ||||||||
TFH Partners Limited Partners | December 29, 2010 | 2,272,727 | $ | 2.20 | ||||||||
The Aosta LLC | December 29, 2010 | 113,637 | $ | 2.20 | ||||||||
Globalist Agro Holdings LLC | December 29, 2010 | 454,545 | $ | 2.20 | ||||||||
RRA Participation | December 29, 2010 | 68,182 | $ | 2.20 | ||||||||
Stuart Investment Holdings Ltd. | December 29, 2010 | 45,500 | $ | 2.20 | ||||||||
Edmond De Rothschild Europportunities II SCA, SICAR | December 29, 2010 | 3,409,090 | $ | 2.20 | ||||||||
Castle Energy S.A. | December 29, 2010 | 909,091 | $ | 2.20 | ||||||||
5 individual investors | December 29, 2010 | 239,179 | $ | 2.20 | ||||||||
The Gretchen S. Jordan 1998 Trust | January 26, 2011 | 113,636 | $ | 2.20 | ||||||||
Jordan Investment Associates, LP | January 26, 2011 | 113,636 | $ | 2.20 | ||||||||
TJT (B) (Bermuda) Investment | January 26, 2011 | 681,818 | $ | 2.20 | ||||||||
Radian Group Inc. | February 1, 2011 | 54,200 | $ | 2.20 | ||||||||
Oregon Public Employees Retirement Fund | February 1, 2011 | 133,500 | $ | 2.20 | ||||||||
Union Bancaire Privée UBP SA | February 1, 2011 | 22,727 | $ | 2.20 | ||||||||
Pictet & Cie | February 1, 2011 | 40,553 | $ | 2.20 | ||||||||
II-6
Table of Contents
| Name of Purchaser | Date of Purchase | Number of Common Shares Purchased | Price Per Share | |||||||||
LV Développement | February 1, 2011 | 5,000 | $ | 2.20 | ||||||||
Londes Développement | February 1, 2011 | 20,000 | $ | 2.20 | ||||||||
Elsingham Investments Limited | February 1, 2011 | 150,000 | $ | 2.20 | ||||||||
Stuart Investment Holdings Ltd. | February 1, 2011 | 150,000 | $ | 2.20 | ||||||||
2 individual investors | February 1, 2011 | 71,983 | $ | 2.20 | ||||||||
Havasu Limited | February 10, 2011 | 36,205 | $ | 2.20 | ||||||||
TnJ Ltd. | April 2011 | 670,000 | $ | 1.40 | ||||||||
Union Bancaire Privée | April 2011 | 22,757 | $ | 1.40 | ||||||||
Ulrike & Jurgen Frenzel | April 2011 | 33,000 | $ | 1.40 | ||||||||
Cedar Defensive Fund | April 2011 | 90,296 | $ | 1.40 | ||||||||
Nesbitt Burns | June 23, 2011 | 68,410 | $ | 1.40 | ||||||||
Wellington West Capital Markets Inc. | June 23, 2011 | 153,922 | $ | 1.40 | ||||||||
RIU Corporation | June 23, 2011 | 61,162 | $ | 1.40 | ||||||||
Quintana Corporation | June 23, 2011 | 88,707 | $ | 1.40 | ||||||||
Vi Capital Investments | June 23, 2011 | 186,588 | $ | 1.40 | ||||||||
In July 2008, we issued 48,571,203 common shares, at Cdn$1.40 per share, for an aggregate purchase price of Cdn$68.0 million. Wellington West Capital Markets Inc., Canaccord Capital Corporation and Macquarie Capital Markets Canada Ltd. acted as agents in this offering. Aggregate commissions of Cdn$3,779,981 were paid and 2,249,989 broker compensation options having an exercise price of Cdn$1.40 per share were issued to agents in connection with this offering. In June 2009, we issued 15,813,167 common shares, at $1.40 per share, for an aggregate purchase price of $22.1 million. Wellington West Capital Markets Inc., Macquarie Capital Markets Canada Ltd., BMO Nesbitt Burns Inc. and Canaccord Capital Corporation acted as agents in this offering. Aggregate commissions of $1.6 million were paid and 790,659 broker compensation options having an exercise price of $1.40 were issued to agents in connection with this offering. In July 2009, we issued 4,857,114 common shares, for no additional consideration, pursuant to an automatic conversion of the rights issued in July 2008. In September 2009, we issued 21,916 common shares, at $1.40 per share, upon the exercise of pre-emptive rights, for an aggregate purchase price of $30,682. In May 2010 we issued 588,235 common shares, at $1.70 per share, upon the exercise of pre-emptive rights, for an aggregate purchase price of $1.0 million. In March 2010, we issued 67,305,695 common shares, at $1.70 per share, for an aggregate purchase price of $114.4 million and 250,000 common shares upon the exercise of stock options having an exercise price of Cdn$1.00 per share for an aggregate purchase price of Cdn$250,000. Aggregate commissions of $6.5 million were paid and 3,364,748 broker compensation options having an exercise price of $1.70 per share were issued to agents in connection with this offering. In July 2010, we issued 1,687,491 common shares upon the exercise of broker compensation options having an exercise price of Cdn$1.40 per share for an aggregate purchase price of Cdn$2.3 million. In December 2010 and January 2011, collectively, we issued 74,343,059 common shares, at $2.20 per share, for an aggregate purchase price of $163.6 million. Credit Suisse Securities (USA) LLC acted as lead agent in this offering. Aggregate commissions of $8.6 million were paid in connection with this offering. In February 2011, we issued 684,168 common shares, at $2.20 per share, upon the exercise of pre-emptive rights for an aggregate purchase price of $1.5 million. In April 2011, we issued 703,900 common shares, at $1.40 per share, upon the exercise of stock options for an aggregate purchase price of $1.0 million, and we issued 112,153 common shares, at $1.40 per share, upon the exercise of broker compensation options for an aggregate purchase price of $0.2 million. In June 2011, we issued 558,789 common shares, at $1.40 per share, upon the exercise of broker compensation options for an aggregate purchase price of $0.8 million.
All of the transactions above were exempted from registration under the Securities Act, pursuant to Section 4(2) of the Securities Act or Regulation S under the Securities Act. The recipients of securities in each of these transactions represented their intention to acquire the securities for investment only and not with view to or for sale in connection with any distribution thereof and acknowledged that the securities had not been registered under the Securities Act and could only be registered pursuant to registration under the Securities Act or an exemption therefrom.
II-7
Table of Contents
| Item 8. | Exhibits and Financial Statement Schedules |
(a) Exhibits
| Exhibit Number | Description | |
| 1.1** | Form of Underwriting Agreement | |
| 3.1** | Memorandum of Association and Articles of Association of the Registrant | |
| 4.1** | Form of the Registrant’s Common Share Certificate | |
| 5.1 | Opinion of Harney Westwood & Riegels regarding the validity of the common shares | |
| 8.1** | Opinion of Paul, Weiss, Rifkind, Wharton & Garrison LLP regarding U.S. Taxation | |
| 8.2** | Opinion of Cassels Brock & Blackwell LLP regarding Canadian Taxation | |
| 8.3 | Opinion of Harney Westwood & Riegels regarding British Virgin Islands Taxation | |
| 10.1** | Paso Manzagano Plant Contract, dated as of November 24, 2009, between Hermosisima S.A. and Sociedad Anonima Molinos Arroceros Nacionales† | |
| 10.2** | Amendment to the Planta Paso Manzagano Contract, dated as of November 24, 2009, between UAG S.A. and Sociedad Anonima Molinos Arroceros Nacionales† | |
| 10.3** | Line of Credit† | |
| 10.4 | Form ofComodato† | |
| 21.1** | Subsidiaries of the Registrant | |
| 23.1 | Consent of PricewaterhouseCoopers, independent registered public accounting firm | |
| 23.2** | Consent of Deloitte S.C. | |
| 23.3 | Consent of Harney Westwood & Riegels (included in exhibit 5.1) | |
| 23.4** | Consent of Paul, Weiss, Rifkind, Wharton & Garrison LLP | |
| 23.5** | Consent of Cassels Brock & Blackwell LLP | |
| 23.6** | Consent of Bragard & Duran Abogados | |
| 24.1** | Power of Attorney | |
| ** | Previously filed. |
| † | English translation |
| Item 9. | Undertakings |
The undersigned registrant hereby undertakes:
(a) To provide to the underwriters at the closing specified in the underwriting agreement, certificates in such denominations and registered in such names as required by the underwriters to permit prompt delivery to each purchaser.
(b) Insofar as indemnification for liabilities arising under the Securities Act of 1933 may be permitted to directors, officers and controlling persons of the registrant pursuant to the foregoing provisions, or otherwise, the registrant has been advised that in the opinion of the Securities and Exchange Commission such indemnification is against public policy as expressed in the Act and is, therefore, unenforceable. In the event that a claim for indemnification against such liabilities (other than the payment by the registrant of expenses incurred or paid by a director, officer, or controlling person of the registrant in the successful defense of any action, suit, or proceeding) is asserted by such director, officer, or controlling person in connection with the securities being registered, the registrant will, unless in the opinion of its counsel the matter has been settled by controlling
II-8
Table of Contents
precedent, submit to a court of appropriate jurisdiction the question whether such indemnification by it is against public policy as expressed in the Act and will be governed by the final adjudication of such issue.
(c) That:
(1) for purposes of determining any liability under the Securities Act of 1933, the information omitted from the form of prospectus filed as part of this registration statement in reliance upon Rule 430A and contained in a form of prospectus filed by the registrant pursuant to Rule 424(b)(1) or (4) or 497(h) under the Securities Act shall be deemed to be part of this registration statement as of the time it was declared effective.
(2) for the purpose of determining any liability under the Securities Act of 1933, each post-effective amendment that contains a form of prospectus shall be deemed to be a new registration statement relating to the securities offered therein, and the offering of such securities at that time shall be deemed to be the initial bona fide offering thereof.
II-9
Table of Contents
SIGNATURES
Pursuant to the requirements of the Securities Act of 1933, the Registrant certifies that is has reasonable grounds to believe that it meets all of the requirements for filing on Form F-1 and has duly caused this Registration Statement to be signed on its behalf by the undersigned, thereunto duly authorized, in the City of Montevideo, State of Uruguay on July 13, 2011.
| UNION AGRICULTURE GROUP CORP | ||
| By: | /s/ Oscar León Bentancor | |
| Name: | Oscar León Bentancor | |
| Title: | Chief Financial Officer | |
II-10
Table of Contents
SIGNATURES
Pursuant to the requirements of the Securities Act of 1933, as amended, this Registration Statement on Form F-1 has been signed by the following persons in the capacities and on the dates indicated.
| Signature | Title | Date | ||
* Juan Sartori | Executive Chairman and Director | July 13, 2011 | ||
* Oscar Baltasar Costa Martínez | Chief Executive Officer and Director (Principal Executive Officer) | July 13, 2011 | ||
/s/ Oscar León Bentancor Oscar León Bentancor | Chief Financial Officer | July 13, 2011 | ||
* Edgardo Luis Cardozo Vázquez | Director | July 13, 2011 | ||
* Jérôme Tordo | Director | July 13, 2011 | ||
* Jean Jacques Bragard | Director | July 13, 2011 | ||
* Julio De Brun | Director | July 13, 2011 | ||
* Roberto Vazquez Platero | Director | July 13, 2011 | ||
| *By | /s/ Oscar León Bentancor | |
| Attorney-in-fact | ||
II-11
Table of Contents
AUTHORIZED REPRESENTATIVE
Pursuant to the requirements of Section 6(a) of the Securities Act of 1933, the undersigned has signed this Registration Statement, solely in its capacity as the duly authorized representative of Union Agriculture Group Corp in the city of Newark, Delaware on the 13th day of July, 2011.
| PUGLISI & ASSOCIATES | ||
| By: | /s/ DONALD J. PUGLISI | |
| Name: | Donald J. Puglisi | |
| Title: | Managing Director | |
II-12