Table of Contents
As filed with the Securities and Exchange Commission on December 23, 2009
Registration No. 333-160739
UNITED STATES
SECURITIES AND EXCHANGE COMMISSION
Washington, D.C. 20549
Amendment No. 2
to
FORM S-1
REGISTRATION STATEMENT
under
The Securities Act of 1933
JBS USA Holdings, Inc.
(Exact name of Registrant as specified in its charter)
| Delaware | 2011 | 20-1413756 | ||
(State or other jurisdiction of incorporation or organization) | (Primary Standard Industrial Classification Code Number) | (I.R.S. Employer Identification Number) |
JBS USA Holdings, Inc.
1770 Promontory Circle
Greeley, Colorado 80634
(970) 506-8000
(Address, including zip code, and telephone number, including area code, of Registrant’s principal executive offices)
André Nogueira de Souza
Chief Financial Officer
JBS USA Holdings, Inc.
1770 Promontory Circle
Greeley, Colorado 80634
(970) 506-8000
(Name, address, including zip code, and telephone number, including area code, of agent for service)
Copies to:
Donald E. Baker John R. Vetterli White & Case LLP 1155 Avenue of the Americas New York, New York 10036 (212) 819-8200 | Arthur D. Robinson John C. Ericson Simpson Thacher & Bartlett LLP 425 Lexington Avenue New York, New York 10017 (212) 455-2000 |
Approximate date of commencement of proposed sale to the public: As soon as practicable after this registration statement becomes effective.
If any of the securities being registered on this Form are to be offered on a delayed or continuous basis pursuant to Rule 415 under the Securities Act of 1933 check the following box: ¨.
If this Form is filed to register additional securities for an offering pursuant to Rule 462(b) under the Securities Act, please check the following box and list the Securities Act registration statement number of the earlier effective registration statement for the same offering. ¨
If this Form is a post effective amendment filed pursuant to Rule 462(c) under the Securities Act, check the following box and list the Securities Act registration statement number of the earlier effective registration statement for the same offering. ¨
If this Form is a post effective amendment filed pursuant to Rule 462(d) under the Securities Act, check the following box and list the Securities Act registration statement number of the earlier effective registration statement for the same offering. ¨
Indicate by check mark whether the registrant is a large accelerated filer, an accelerated filer, a non-accelerated filer, or a smaller reporting company. See the definitions of “large accelerated filer,” “accelerated filer” and “smaller reporting company” in Rule 12b-2 of the Exchange Act. (Check one):
| Large accelerated filer ¨ | Accelerated filer ¨ | Non-accelerated filer x | Smaller reporting company ¨ |
(Do not check if a smaller reporting company)
The registrant hereby amends this registration statement on such date or dates as may be necessary to delay its effective date until the registrant shall file a further amendment which specifically states that this registration statement shall thereafter become effective in accordance with Section 8(a) of the Securities Act of 1933 or until the registration statement shall become effective on such date as the Securities and Exchange Commission, acting pursuant to said Section 8(a), may determine.
Table of Contents
The information in this prospectus is not complete and may be changed. We may not sell these securities until the registration statement filed with the Securities and Exchange Commission is effective. This prospectus is not an offer to sell these securities, and we are not soliciting an offer to buy these securities in any state where the offer or sale is not permitted.
Subject to completion, dated , 2010
Prospectus
shares

JBS USA HOLDINGS, INC.
Common stock
This is the initial public offering of our common stock. Of the shares of common stock to be sold in the offering, we are selling shares, and JBS Hungary Holdings Kft., or the selling stockholder, is selling shares. We will not receive any of the proceeds from the shares of common stock being sold by the selling stockholder. We expect the initial public offering price to be between $ and $ per share.
Prior to the offering, there has been no public market for our common stock. We expect to apply for listing of our common stock on The New York Stock Exchange under the symbol “JBS.”
Neither the Securities and Exchange Commission nor any state securities commission has approved or disapproved of these securities or passed on the adequacy or accuracy of this prospectus. Any representation to the contrary is a criminal offense.
| Per share | Total | |||||
Initial public offering price | $ | $ | ||||
Underwriting discount | $ | $ | ||||
Proceeds to JBS USA Holdings, Inc., before expenses | $ | $ | ||||
Proceeds to the selling stockholder, before expenses | $ | $ | ||||
We have granted the underwriters an option for a period of 30 days to purchase from us up to additional shares of our common stock to cover over-allotments, if any.
Investing in our common stock involves a high degree of risk. See “Risk factors” beginning on page 26 to read about certain factors you should consider before buying shares of our common stock.
The underwriters expect to deliver the shares on or about , 2010.
| J.P.Morgan | BofA Merrill Lynch | |
| Morgan Stanley | BMO Capital Markets | |||
| ||||
| Deutsche Bank Securities | ||||
| Rabo Securities USA, Inc. | Wells Fargo Securities | |
| ING Wholesale | Santander | Stephens Inc. | ||
| Bradesco BBI | ||||
, 2010
Table of Contents
| 1 | ||
| 18 | ||
| 21 | ||
| 26 | ||
| 57 | ||
| 59 | ||
| 60 | ||
| 61 | ||
| 62 | ||
| 64 | ||
| 66 | ||
| 69 | ||
Management’s discussion and analysis of financial condition and results of operations | 85 | |
| 162 | ||
| 170 | ||
| 217 | ||
| 223 | ||
| 233 | ||
| 238 | ||
| 246 | ||
| 251 | ||
Certain material United States federal income and estate tax considerations for non-U.S. holders | 255 | |
| 259 | ||
| 266 | ||
| 266 | ||
| 267 | ||
| F-1 | ||
You should rely only on the information contained in this prospectus or in any free writing prospectus prepared by or on behalf of us and delivered or made available to you. Neither we nor the selling stockholder have authorized anyone to provide you with information different from that contained in this prospectus. We and the selling stockholder are offering to sell, and seeking offers to buy, shares of common stock only in jurisdictions where offers and sales are permitted. The information contained in this prospectus is accurate only as of the date of this prospectus, regardless of the time of delivery of this prospectus or of any sale of our common stock. Our business, financial condition, results of operations and prospects may have changed since that date.
No action is being taken in any jurisdiction outside the United States to permit a public offering of our common stock or possession or distribution of this prospectus in that jurisdiction. Persons who come into possession of this prospectus in a jurisdiction outside the United States are required to inform themselves about and to observe any restrictions as to this offering and the distribution of this prospectus applicable to that jurisdiction.
Until , 2010, all dealers that buy, sell or trade in our common stock, whether or not participating in this offering, may be required to deliver a prospectus. This is in addition to the dealers’ obligation to deliver a prospectus when acting as underwriters and with respect to their unsold allotment or subscriptions.
(i)
Table of Contents
The following summary highlights information contained elsewhere in this prospectus. Before deciding whether to buy shares of our common stock, you should read this summary and the more detailed information in this prospectus, including our consolidated financial statements and related notes and the discussion of the risks of investing in our common stock in the section entitled “Risk factors.” Except as the context otherwise requires, references in this prospectus to JBS USA Holdings, Inc. and the terms “company,” “we,” “us” and “our” refer to JBS USA Holdings, Inc. and its subsidiaries. On September 16, 2009, we entered into an agreement with Pilgrim’s Pride Corporation (“Pilgrim’s Pride” or “PPC”) to acquire 64% of the new common stock of Pilgrim’s Pride (which we refer to as the Proposed PPC Acquisition). See “Prospectus summary—Recent developments” and “The Proposed PPC Acquisition” for more information. When we present financial data “on a pro forma basis,” it means that the financial data (1) for the fiscal year ended December 28, 2008 andfor thethirty-nine weeks endedSeptember 28, 2008 reflects (A) our acquisition of Smithfield Beef Group, Inc. (which we subsequently renamed JBS Packerland, Inc., or JBS Packerland), which included the acquisition of 100% of Five Rivers Ranch Cattle Feeding LLC, or Five Rivers, (B) a portion (40%) of the sale of our common stock related to the BNDESPAR transaction and the Proposed PPC Acquisition (each as defined herein), and (C) the issuance and sale in April 2009 of our 11.625% senior unsecured notes due 2014 and the application of the proceeds therefrom, in each case, as if such event had occurred at the beginning of the period presented, (2) for the thirty-nine weeks ended September 27, 2009 reflects a portion (40%) of the sale of our common stock related to the BNDESPAR transaction, the Proposed PPC Acquisition and the issuance and sale in April 2009 of our 11.625% senior unsecured notes due 2014 and the application of the proceeds therefrom, in each case, as if such event had occurred as of December 30, 2007, and (3) as of September 27, 2009, reflects the Proposed PPC Acquisition and the BNDESPAR transaction, in each case, as if such event had occurred on September 27, 2009, in each case as further discussed under “Unaudited pro forma combined financial statements.”
JBS USA Holdings, Inc.
JBS USA Holdings, Inc. is one of the world’s largest beef and pork processing companies with approximately $15.4 billion in net sales for the fiscal year ended December 28, 2008 on a pro forma basis (excluding the net sales for the Proposed PPC Acquisition). In terms of daily slaughtering capacity, we are among the leading beef and pork processors in the United States, and we believe we are the number one processor of beef in Australia. We also believe we own and operate the largest feedlot business in the United States, and upon consummation of the Proposed PPC Acquisition, we will be one of the largest chicken producers in the United States in terms of daily processing capacity.
We process, package and deliver fresh, processed and value-added beef, pork, lamb and mutton products to customers in over 60 countries on six continents. Our operations supply fresh meat products, processed meat products and value-added meat products. Fresh meat products include refrigerated beef and pork processed to standard industry specifications and sold primarily in boxed form. Our processed meat offerings, which include beef and pork products, are cut, ground and packaged to meet customer specifications. Our value-added products include moisture-enhanced, seasoned, marinated and consumer-ready products.
1
Table of Contents
We sell our products primarily to retail customers, such as grocery store chains, wholesale clubs and other retail distributors and foodservice customers (such as foodservice distributors, further processors and chain restaurants). We also produce and sell by-products derived from our meat processing operations, such as hides and variety meats, to customers in the clothing, pet food and automotive industries, among others.
Pilgrim’s Pride operates as a vertically integrated company and controls every phase of the production of its products, including feed mills, hatcheries, processing plants and distribution centers in 14 U.S. states, Puerto Rico and Mexico. We will produce both fresh and prepared chicken products for sale to customers in retail, foodservice and international distribution channels in over 80 countries on six continents. Our fresh chicken products will include refrigerated whole and cut-up chickens and prepackaged case-ready chicken. Case-ready chicken includes various combinations of freshly refrigerated whole chickens and chicken parts ready for the retail grocer’s fresh meat counter. Our prepared chicken products will include refrigerated and frozen portion-controlled breast fillets, tenderloins and strips, delicatessen products and salads, formed nuggets and patties, and bone-in chicken parts. Our prepared chicken products may be fully cooked, partially cooked or raw and will include breaded and marinated products.
We are a wholly owned indirect subsidiary of JBS S.A., the world’s largest beef producer, which, including our operations, has a daily slaughtering capacity of 73,940 cattle. In the thirty-nine weeks ended September 27, 2009, we represented approximately 76% of JBS S.A.’s gross revenues. Over the past few years, JBS S.A. has acquired several U.S. and Australian beef and pork processing companies which now comprise JBS USA Holdings, Inc. and its subsidiaries:
| • | on July 11, 2007, JBS S.A. acquired Swift Foods Company (our predecessor company, which was subsequently renamed JBS USA Holdings, Inc.), which we refer to as the Swift Acquisition; |
| • | on May 2, 2008, we acquired substantially all of the assets of the Tasman Group Services, Pty. Ltd., or the Tasman Group, which we refer to as the Tasman Acquisition; and |
| • | on October 23, 2008, we acquired Smithfield Beef Group, Inc. (which we subsequently renamed JBS Packerland), which included the 100% acquisition of Five Rivers, the world’s largest feedlot operation. We refer to this transaction as the JBS Packerland Acquisition. |
In addition to these beef and pork processing companies, on September 16, 2009, we entered into an agreement with Pilgrim’s Pride to acquire 64% of the new common stock of Pilgrim’s Pride, which we refer to as the Proposed PPC Acquisition.
In the United States, we conduct our operations through eight beef processing facilities, three pork processing facilities, one lamb processing facility, one case-ready beef and pork facility, one hide tannery, seven leased regional distribution centers, two grease-producing facilities, and 13 feedlots operated by Five Rivers, which supply approximately 24% of the cattle we process. In Australia, we operate ten beef and small animal processing facilities, including the technologically advanced Dinmore facility, which is the largest in the country, and five feedlots that supply approximately 16% of the cattle we process. Our small animal processing facilities in Australia process hogs, lamb and sheep, or smalls. Our Australian facilities are strategically located to source cattle at a low cost and efficiently serve our global customer base in Asia and elsewhere. We have the capacity to process approximately 28,600 cattle, 48,500 hogs and 4,500
2
Table of Contents
lambs daily in the United States and 8,690 cattle and 15,000 smalls daily in Australia based on our facilities’ existing configurations.
Upon the consummation of the Proposed PPC Acquisition, we anticipate that we will have the capacity to process 7.6 million broiler chickens per day and will conduct our chicken operations through 29 chicken processing facilities, supported by 31 feed mills, 41 hatcheries and 11 rendering facilities, nine further processing facilities, and three pet food facilities. In addition, the Proposed PPC Acquisition will expand our distribution capabilities by adding five regional distribution centers in the United States, eight distribution centers in Mexico and one distribution center in Puerto Rico.
Our business operations are currently organized into two segments:
| • | our Beef segment, through which we conduct our domestic beef processing business, including the beef operations we acquired in the JBS Packerland Acquisition, and our international beef, lamb and sheep processing businesses that we acquired in the Tasman Acquisition; and |
| • | our Pork segment, through which we conduct our domestic pork and lamb processing business. |
Upon consummation of the Proposed PPC Acquisition, we will report Chicken as a third and separate segment in our consolidated financial statements for periods following the consummation of the Proposed PPC Acquisition. The domestic and international chicken processing operations of Pilgrim’s Pride will comprise our Chicken segment.
The table below sets forth on a pro forma basis our net sales (total and by segment), gross profit, Adjusted EBITDA and net income (loss) for the periods presented:
| in millions | For the fiscal year ended December 28, 2008 | For the thirty-nine weeks ended September 27, 2009 | |||||
Net sales | $ | 23,746.7 | $ | 15,194.2 | |||
Beef | 13,067.0 | 8,415.3 | |||||
Pork | 2,438.0 | 1,639.4 | |||||
Chicken | 8,348.4 | 5,211.1 | |||||
Corporate and other (including eliminations) | (106.7 | ) | (71.6) | ||||
Gross profit | 285.4 | 798.9 | |||||
Net income (loss) | (867.5 | ) | 166.7 | ||||
Net income (loss) attributable to controlling shareholder | (488.3 | ) | 145.6 | ||||
Adjusted EBITDA | $ | 63.8 | $ | 747.0 | |||
See “—Summary historical and pro forma financial data” for a discussion of how we calculate Adjusted EBITDA.
3
Table of Contents
Corporate structure
The following diagram sets forth JBS S.A.’s and our current simplified corporate structure and principal business segments after giving effect to the Proposed PPC Acquisition and contemplating the proposed BNDESPAR transaction but without giving effect to the proposed Bertin transaction. See”—Recent developments—BNDESPAR transaction” and “Principal and selling stockholder—JBS S.A./Bertin transaction.”
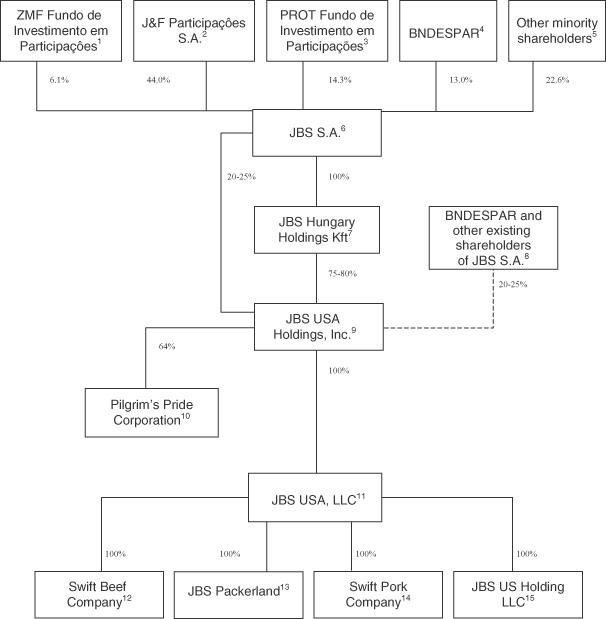
(footnotes on following page)
4
Table of Contents
| (1) | ZMF Fundo de Investimento em Participações is a Brazilian investment fund that is in turn owned by certain members of the José Batista Sobrinho family. |
| (2) | J&F Participações S.A. is a Brazilian corporation which is owned by certain members of the José Batista Sobrinho family. |
| (3) | PROT Fundo de Investimento em Participações is a Brazilian equity investment fund and an affiliate ofBanco Nacional de Desenvolvimento Econômico e Social—BNDES,the Brazilian National Bank for Economic and Social Development. |
| (4) | BNDES Participações S.A.—BNDESPAR, or BNDESPAR, is a subsidiary ofBanco Nacional de Desenvolvimento Econômico e Social—BNDES. |
| (5) | None of the holders of the remaining 20% of JBS S.A.’s outstanding common shares hold greater than 5% of such shares. 3.1% of JBS S.A.’s common shares are held in treasury. |
| (6) | On December 21, 2009, we and JBS S.A. entered into a purchase and sale agreement pursuant to which we agreed to issue and sell 20-25% of our common stock to JBS S.A. for an aggregate purchase price of $2.0 billion. The percentage of shares of our common stock to be issued and sold will be equal to $2.0 billion divided by our equity valuation in U.S. dollars based on the number of shares outstanding immediately prior to this offering, but calculated on the basis of the price per share in this offering, multiplied by 100. As a result of this purchase and sale agreement, JBS S.A. will hold a 20-25% interest in us, and the remaining interest in us will be held by JBS S.A. indirectly through the selling stockholder. See “Principal and selling stockholder—JBS S.A purchase and sale agreement.” In connection with the BNDESPAR transaction, the common stock that is acquired by JBS S.A. pursuant to the purchase and sale agreement will equal the number of our common stock that will underlie the Brazilian depositary receipts described in note (8) below. See “Principal and selling stockholder—BNDESPAR transaction.” |
| (7) | JBS Hungary Holdings Kft. is a corporation organized under the laws of Hungary and the selling stockholder of record in this offering. |
| (8) | On December 22, 2009, JBS S.A. agreed with BNDESPAR to issue exchangeable debentures. These debentures are mandatorily exchangeable into our common stock in the form of Brazilian depositary receipts, or “BDRs,” following completion of this offering under certain conditions. If all of the debentures are converted into our common stock, the holders of the debentures will own 20-25% of our common stock as measured prior to this offering. For more information, see “Principal and selling stockholder— BNDESPAR transaction.” At the time of conversion of the debentures into our common stock, such common stock will be delivered to debenture holders by JBS S.A., thereby reducing JBS S.A.’s interest in us. |
| (9) | JBS USA Holdings, Inc. is a corporation organized under the laws of Delaware and the issuer in this offering. |
| (10) | On September 16, 2009, we entered into an agreement with Pilgrim’s Pride Corporation to acquire 64% of the new common stock of Pilgrim’s Pride. If the Proposed PPC Acquisition is consummated, PPC and its subsidiaries will comprise our chicken operations. For more information, see “The Proposed PPC Acquisition.” |
| (11) | JBS USA, LLC is a corporation organized under the laws of Delaware. |
| (12) | Swift Beef Company is a corporation organized under the laws of Delaware and is the holding company for our United States beef operations, other than JBS Packerland. |
| (13) | On October 23, 2008, we acquired Smithfield Beef Group, Inc. (which we subsequently renamed JBS Packerland), which included the acquisition of Five Rivers Ranch Cattle Feeding LLC. JBS Packerland is the holding company for the beef operations we acquired in the JBS Packerland Acquisition, including the feedlots operated by Five Rivers. |
| (14) | Swift Pork Company is a corporation organized under the laws of Delaware and is the holding company for our U.S. pork operations. |
| (15) | JBS US Holding LLC is a corporation organized under the laws of Delaware and is the holding company for our Australian operations. |
Industry overview
Beef
United States
Beef products are the largest segment of the U.S. retail protein market and, according to the United States Department of Agriculture, or the USDA, represented $76 billion of retail equivalent sales in 2008. The United States has the largest grain-fed cattle industry in the world and is the world’s largest producer of beef, which is primarily high-quality grain-fed beef for domestic and export use. In 2008, the United States processed 34.4 million head of cattle and produced 26.6 billion pounds of beef. The domestic beef industry is characterized by daily price changes based on seasonal consumption patterns and overall supply and demand for beef and other proteins in the United States and abroad. Cattle prices vary over time and are impacted by inventory levels, the production cycle, weather and feed prices, among other factors.
5
Table of Contents
Beef processors include vertically integrated companies, who own and raise cattle on feed for use in their processing facilities, and pure processors, who do not own cattle on feed. The four largest U.S. beef processors, which comprise 75% of the top 30 U.S. beef processors’ capacity, according to Cattle Buyer’s Weekly, operate predominantly as pure processors. Pure U.S. beef processors generally purchase cattle in the spot market or pursuant to market-priced supply arrangements from feedlot operators, process the cattle in their own facilities and sell the beef at spot prices. Cattle are usually purchased at market prices and held for less than a day before processing. Thus, such processors are typically exposed to changing market prices for less than two weeks. Pure beef processors are primarily “spread” operators, and their operating profit is largely determined by plant operating efficiency rather than by fluctuations in the prices of cattle and beef. In the United States, we operate as a pure beef processor.
During the past few decades, consumer demand for beef products in the United States has been driven by population growth, which is the primary driver of aggregate demand. Historically, consumer demand for beef products in the United States has remained relatively stable during economic downturns, and has also remained relatively stable during the current recession. We believe that consumer demand for U.S. exports in developing countries is driven by population growth compounded by economic growth. As consumers’ economic circumstances improve, they increasingly shift their diets to protein. Export demand has varied, but demand has grown since the reopening of certain international markets in 2005, which had been closed to U.S. beef due to the discovery of isolated cases of bovine spongiform encephalopathy, or BSE (also commonly referred to as mad cow disease) in 2003. U.S. beef exports reached $3.0 billion in 2008, an increase of over 35% from 2007, according to the USDA, and exports have remained relatively stable in 2009, despite the global economic downturn.
Between 2006 and January 2008, our largest U.S. beef competitor eliminated two million head per year of slaughter capacity in four plants. This represented a reduction of nearly 7% of total U.S. industry-wide capacity and has helped improve the supply/demand balance of beef in the United States and export markets. We believe that, along with our competitors, we have benefited from the improved supply/demand balance of beef in the United States and export markets as this elimination of slaughter capacity created more stability in the industry. We currently do not expect the industry to experience a material increase in capacity for the foreseeable future.
Australia
Australia has traditionally been a supplier of grass-fed beef. Grass is a much cheaper feed source than grain. With the vast amount of land in Australia available for cattle raising and feeding, grazing is the predominant feeding method. The majority of cattle slaughtered in Australia are range or grass-fed and not finished in feedlots. Australia also has a grain-fed beef cattle sector that primarily supplies processed cattle for export to Japan and South Korea and to the domestic market. Grain-fed cattle accounted for 27% of the adult cattle slaughtered in 2008, representing 34% of total beef production in Australia. We have chosen to be vertically integrated in Australia in order to supply higher margin products, such as Kobe-style beef, to customers in Asian markets. Australia has been one of the leading beef export countries for more than a decade. We believe that approximately 75% of exports have historically been sold to the United States, Japan and South Korea, but exports of Australian beef have been increasing to Russia, Taiwan, Indonesia, Chile and the United Arab Emirates, among other countries. Australian meat packers, including our Australian operations, benefited from the closure of many markets to U.S. beef as a
6
Table of Contents
result of isolated BSE detections in U.S. cattle. However, Australian exports have remained strong following the reopening of international markets to U.S. beef.
Global exports
We sell our beef products in over 60 countries on six continents, and exports of beef products accounted for approximately 28% of our sales in 2008 on a pro forma basis and 32% of our sales for the thirty-nine weeks ended September 27, 2009. The international beef market is divided into two trading blocks based on factors that include common sanitary criteria, such as restrictions on imports of fresh beef from countries that permit foot-and-mouth disease (also known as FMD) vaccination programs and the use of growth hormones. The European Union has banned imports of beef treated with growth hormones, but permits the use of FMD vaccines. Asian markets permit the use of growth hormones, but do not allow imports of beef from areas that are not FMD-free.
The United States has been an FMD-free country since the eradication of the disease in 1929, and it does not implement vaccination programs. However, the United States treats most of their cattle with growth hormones. Accordingly, the primary export markets for U.S. beef are Asia and Mexico. The Brazilian and Argentine operations of our parent, JBS S.A., are a large exporter of beef to the European Union because South American beef is not treated with growth hormones. However, as FMD has yet to be eradicated from Brazil and Argentina, South American beef cannot be exported to Asia. Australia has eradicated FMD and does not use growth hormones, allowing Australian beef to serve all markets.
Pork
Pork products are the most widely consumed meat in the world by volume. Pork is the third largest consumed source of meat protein in the United States, behind chicken and beef. The United States is the third largest producer and consumer of pork worldwide, behind China and the European Union. The United States is also the largest exporter of pork products, according to the USDA.
The domestic pork industry is characterized by daily price changes based on seasonal consumption patterns and overall supply and demand for pork and other meats in the United States and abroad. Generally, domestic and worldwide consumer demand for pork products drive pork processors’ long-term demand for hogs. Pork processors’ profitability is driven primarily by their ability to acquire or raise hogs cost effectively and minimize processing costs by maximizing plant efficiency. Hog prices vary over time and are impacted by inventory levels, the production cycle, weather and feed prices, among other factors.
Pork processors include vertically integrated companies, which own and raise hogs on feed for use in their processing facilities, and pure processors, who do not own hogs on feed. Pure processors generally purchase finished hogs under long-term supply contracts at prevailing market prices, process the hogs in their own facilities and sell the finished products at spot prices. Finished hogs are typically purchased at market prices and held for less than one day before processing. Thus pure processors are typically exposed to changing market prices for less than two weeks. Pure pork processors are primarily “spread” operators, and their operating profit is largely determined by plant operating efficiency and not by fluctuations in the prices of hogs and pork. Our U.S. pork operations function as pure pork processors.
7
Table of Contents
While affected by seasonal consumption patterns, demand for pork has remained consistently strong. During the past few decades, we believe population growth has been the primary driver of increased aggregate pork product demand in the United States. We believe that consumer demand for U.S. exports in developing countries is driven by population growth compounded by economic growth. As consumers’ economic circumstances improve, they increasingly shift their diets to protein. To satisfy the growing global demand, U.S. pork exports have more than tripled in the past decade to four billion pounds, according to the USDA. The top three leading export markets for U.S. pork and pork variety meats are Japan, Mexico and Canada.
Chicken
The poultry industry is comprised principally of chicken and turkey products. Chicken products are the most consumed source of meat protein in the United States and second most consumed meat in the world by volume. The United States is the world’s largest producer of chicken products, according to the USDA.
The domestic chicken industry is characterized by daily price changes based on seasonal consumption patterns and overall supply and demand for chicken and other meats in the United States and abroad. Chicken prices vary over time and are affected by inventory levels, production cycles, weather and feed prices, among other factors.
Large-scale chicken processors are typically vertically integrated processors. Vertically integrated processors own and raise breeder flocks for the production of hatching eggs. Once hatched, the chicks, or broilers, are transported to independent contract grow-out farms, where they are grown to an age of seven to nine weeks. The processor supplies the contract growers with the chicks, feed and veterinary services. Vertically integrated chicken processors can be significantly affected by working capital demands as broilers feed for approximately seven to nine weeks without revenue generation until processed. Additionally, since broilers consume feed (produced principally from corn and soybean meal) with a replacement price that is subject to changing market prices, vertically integrated chicken processors have direct financial exposure to the volatility in such feed prices.
While affected by seasonal consumption patterns, demand for chicken has remained consistently strong. During the past few decades, demographic change in the workforce, dietary trends and rising foodservice demand have been the primary drivers of increased aggregate chicken product demand in the United States. We believe that consumer demand for U.S. exports in developing countries is driven by population growth compounded by economic growth. As consumers’ economic circumstances improve, they increasingly shift their diets to protein. The United States is the world’s second largest exporter of broiler meat behind Brazil, according to the USDA. The U.S. poultry industry exported 19% of production valued at $3.5 billion in 2008, an increase of $1.8 billion, or 106%, since 2004, according to the USDA. The largest importers of U.S. chicken products are Russia, China and Mexico, which together account for almost half of U.S. broiler product exports.
Competitive strengths
We are well-positioned as a leading meat processor in both the United States and Australia. We have implemented significant operational improvements since the Swift Acquisition, resulting in increases in profitability, throughput, additional value-added products, improved food safety and industry-
8
Table of Contents
leading worker safety. We believe that the Proposed PPC Acquisition will significantly strengthen our production platform by adding chicken products to our existing beef and pork products, making us one of the largest protein companies in the world. We believe that, upon the consummation of the Proposed PPC Acquisition, we will be well-positioned to become a primary provider of beef, chicken and pork for our customers’ protein needs. Our competitive strengths include:
Scale and leading market positions in beef, pork and chicken industries
We are one of the world’s largest beef and pork processing companies. In terms of daily slaughtering capacity, we are among the leading beef and pork processors in the United States and we believe we are the number one processor of beef in Australia. In addition, upon consummation of the Proposed PPC Acquisition, we will be one of the largest chicken producers in the United States in terms of daily processing capacity. We have a slaughtering capacity of 37,290 heads per day in beef, 48,500 heads per day in hogs and over 19,500 heads per day in smalls, and, upon consummation of the Proposed PPC Acquisition, we anticipate we will have a processing capacity of 7.6 million broiler chickens per day. We believe our scale provides us with significant operational flexibility.
Our processing platforms in the United States and Australia provide us with sufficient geographic diversification and operating flexibility to satisfy demand regardless of market conditions and sanitary restrictions. When foreign markets restricted U.S. beef imports in 2003 due to isolated outbreaks of BSE, our Australian beef operations retained access to those markets and helped soften the overall impact to our business. In addition, certain of our facilities can export to the European Union. We have facilities that can accommodate non-hormone treated cattle in Australia, and our Worthington pork plant is one of only four facilities in the United States certified for export of pork to the European Union.
Our facilities are strategically located close to both our raw materials and our customers, reducing freight and storage costs. The Five Rivers feedlot operations, which have a feeding capacity of approximately 839,000 head, are located adjacent to our beef slaughtering facilities. Our JBS Packerland facilities are located near major metropolitan areas, resulting in lower freight costs relative to cattle processing facilities in more rural locations. Additionally, our Australian operations are strategically located to serve our customers in Asia and elsewhere in a low-cost manner.
Through our JBS Packerland beef processing facilities, we have the operational flexibility to process both beef and dairy cattle, which are typically much heavier and require special processing. This flexibility sets us apart from many beef processing facilities in the United States because it enables us to shift our operations between beef and dairy cattle depending on market availability, seasonal demand and relative margin attractiveness.
Diversified business model with international reach
Our business is well diversified across proteins and all major distribution channels, as well as geographically with respect to production and distribution.
| • | Diversified protein offerings:We sell beef, pork, lamb, and mutton products, and, upon consummation of the Proposed PPC Acquisition, we will also sell chicken products. Following the consummation of the Proposed PPC Acquisition, we believe we will be well-positioned to |
9
Table of Contents
be a primary protein provider to our customers. Selling multiple proteins offers us the opportunity to cross-sell to our customers and to diversify typical industry risks, such as industry cycles, the impact of species-based diseases and changes in consumer protein preferences. As a result of our diversification across multiple proteins, our business is less likely to be severely impacted by issues affecting any one protein. |
| • | Sales and distribution channel diversification:We benefit from our diversified sales and distribution channels, which include national and regional retailers (including supermarket chains, independent grocers, club stores and wholesale distributors), further processors (including those that make bacon, sausage and deli and luncheon meats), international markets and the foodservice industry (including foodservice distributors, which service restaurant and hotel chains and other institutional customers). We sell our beef and pork products and, after giving effect to the Proposed PPC Acquisition, our chicken products, to over 9,000 customers worldwide with no customer accounting for more than 5% of our net sales. This level of diversification reduces our dependence on any one market or customer and provides multiple channels for potential growth. |
| • | Geographic diversification:We sell our products in over 60 countries on six continents, and, upon consummation of the Proposed PPC Acquisition, will sell our products in over 80 countries on six continents. Overall, exports accounted for approximately 24% of our sales in 2008 on a pro forma basis (excluding sales for the Proposed PPC Acquisition) and 24% of our sales during the thirty-nine weeks ended September 27, 2009. Our geographic diversification enables us to reduce exposure to any one market and concurrently have access to all export markets. Additionally, having access to international markets allows us to potentially generate higher returns as many of our export products, such as tongue, heart, kidney and other variety meats, garner higher demand and prices in foreign markets, particularly in Asia and the Middle East. In fiscal 2008, we supplied Japan and South Korea with 36% and 47% of their total beef imports, respectively, according to Meat & Livestock Australia Limited, and we believe we were their largest supplier of imported beef. Following the consummation of the Proposed PPC Acquisition, we will use our international footprint and knowledge to expand PPC’s chicken exports. |
World class operations
We believe our operations are among the most efficient in the industry. We also believe that we operate three of the six highest-throughput beef facilities in the United States. Furthermore, we continuously focus on improving our operating efficiencies. We have developed a program to improve the coordination of our planning, forecasting, scheduling, procurement and manufacturing functions to driveimproved profitability per head. In 2008, this program delivered approximately $230 million of benefit from increased beef yields, reduced operational costs, and lower overhead. We believe a significant opportunity remains to further improve the cost structure and profitability of our existing operations, particularly the PPC operations once the Proposed PPC Acquisition is consummated.
Established customer relationships
We have long-standing relationships with numerous well-established, global customers, many of whom have been doing business with us for more than 20 years. We serve many of the largest
10
Table of Contents
foodservice distributors, restaurants and retail chains in the United States. Additionally, we are focused on developing long-term, mutually beneficial relationships with our customers, who, we believe, consider us to be an extension of their operations. We believe our high-quality, long-standing relationships provide us with greater revenue stability and forecasting transparency. In addition, upon consummation of the Proposed PPC Acquisition, we will benefit from the significant relationships PPC has developed with numerous well-established, global customers. For example, PPC sells its prepared chicken products to some of the world’s largest customers in the foodservice and retail industries across the United States and around the world, including Wal-Mart Stores, Inc., which accounted for 12% of its net sales during its fiscal year ended September 26, 2009. We believe our ability to provide our customers with all three major proteins will provide an opportunity for us to expand and further strengthen our customer relationships.
Proven management team
We have a proven senior management team whose experience in the protein industry has spanned numerous market cycles. Our chief executive officer, Wesley Batista, has over 20 years of operating experience in both the United States and Brazil and is a member of the founding family of JBS S.A., our parent company, which has over 50 years of experience operating beef processing facilities in Brazil. We have appointed key members of JBS S.A.’s South American management team to management positions in our United States and Australian operations. Our management and that of our parent company have a strong track record of acquiring and successfully integrating operations as evidenced by the more than 30 acquisitions made by JBS S.A. in the last 15 years, including the integration of the JBS Packerland and Tasman Acquisition operations. We benefit from management ideas, best practices, and talent shared with the seasoned management team at our parent company.
Since seeking reorganization relief under the bankruptcy laws, PPC has strengthened its management team with the addition of Don Jackson as PPC’s president and chief executive officer, who has more than 31 years of experience in the poultry industry, and by hiring senior industry veterans to oversee sales, marketing and business development.
Our strategy
Continue to successfully integrate recent acquisitions
We have a proven track record of successfully acquiring, integrating, and improving the operating performance of our acquisitions. For example, we have fully integrated the Tasman Group with our legacy northern Australia operations in livestock procurement and sales and expect to complete full integration of the Tasman Group’s information technology systems by the end of 2009. In addition, we successfully completed the integration of JBS Packerland with our operational and financial information technology systems. We have identified additional cost-saving opportunities from further integration and have developed plans to take advantage of these opportunities. We intend to apply our recent successful integration experience to the integration of the Proposed PPC Acquisition. See “—Leverage synergies created as a result of the Proposed PPC Acquisition.”
11
Table of Contents
Continue to pursue additional value-enhancing growth acquisition opportunities
Our management and that of our parent company have a strong track record of acquiring and successfully integrating operations as evidenced by the more than 30 acquisitions made by JBS S.A. in the last 15 years. We intend to continue to selectively pursue additional value-enhancing growth opportunities as they arise, as evidenced by the Proposed PPC Acquisition. We seek acquisition opportunities that we believe are complementary to our businesses and would allow us to realize significant synergies. We frequently evaluate these acquisition opportunities in order to assess, among other things, whether they would be accretive to our earnings and consistent with our strategy. In accordance with this approach, we are actively evaluating several potential acquisitions, including acquisitions to build our distribution business in the United States, which we intend to finance using a portion of the net proceeds from this offering. As of the date of this offering, we have not entered into any commitments with respect to any potential acquisitions other than the Tatiara Meat acquisition. See “—Recent developments—Tatiara Meat acquisition.”
Continuously improve profitability through process optimization
We continue to focus on enhancing profitability through process improvements and operational efficiencies. In 2008, our initiatives led to benefits of approximately $230 million, comprised of approximately $115 million in operating efficiencies, $90 million in plant cost savings, and over $24 million in selling, general and administrative expense savings. Projects that have delivered operating efficiencies include adding a second shift at our Greeley plant, introducing a pork casing sorting system and improving deboning training and cutting techniques on the fabrication floor, which has improved yields and increased value-added production. We reduced annual selling, general and administrative expenses by nearly 21% for the fiscal year ended December 28, 2008 and in 2008 had the lowest ratio of selling, general and administrative expense to net sales among publicly traded protein companies in the United States. We expect to continue to realize benefits going forward as existing initiatives reach completion and additional projects are undertaken.
Increase sales and enhance margins by significantly expanding our direct distribution business
Since the Swift Acquisition, we have built a leading global production platform. The Proposed PPC Acquisition will strengthen our production platform by adding chicken products to our existing beef and pork products, making us one of the largest protein companies in the world. Capitalizing on our production platform, we are pursuing a global direct distribution strategy that will enable us to improve our ability to serve existing customers and allow us the opportunity to directly serve new customers, primarily in the foodservice and retail channels. Our historical sales strategy has relied primarily on the use of third-party distributors, who purchase our products and resell them to end-user customers, retaining an incremental margin for their own benefit. We intend to shift a significant portion of our sales into direct sales to end-user customers to capture this incremental margin in the value chain. The Proposed PPC Acquisition is complementary to our direct distribution strategy because it will allow us to provide a comprehensive portfolio of protein products to meet our end-user customers’ needs.
Our current distribution facilities include seven warehouses located in the United States and eight facilities in Australia. The Proposed PPC Acquisition will complement our distribution
12
Table of Contents
capabilities by adding five regional distribution centers in the United States, eight distribution centers in Mexico and one distribution center in Puerto Rico. Furthermore, the Proposed PPC Acquisition will provide us with additional employees, including sales personnel, with experience in direct distribution to customers in the foodservice and retail channels.
The execution of our direct distribution strategy will require us to substantially expand our distribution network and sales force domestically and internationally. We intend to rapidly implement this strategy, and over the next five years, we intend to invest approximately $1.5 billion to $2.0 billion, including a portion of the net proceeds of this offering, to create a leading global direct distribution business. Our implementation plans include acquiring distribution companies, and constructing and/or leasing regional distribution centers and portion control fabrication, or “cutting room,” facilities (which take primal cuts and fabricate them into individual serving chops or steaks based on customer specifications). Our direct distribution strategy also involves the direct sales and shipment of products to individual end-user customers by our sales personnel using leased delivery vehicles. We are actively evaluating several potential acquisitions, including acquisitions to support our direct distribution strategy. Ultimately, we believe this direct distribution strategy will allow us to capture incremental sales and operating margin opportunities.
Increase processed and value-added offerings
Historically, we have realized greater margins by offering value-added products and services to our customers. Examples of our value-added product and service offerings include additional processing to create sliced, cubed and tenderized products and consumer-ready chops and steaks. In addition, we provide marinated and seasoned meats. These services help reduce labor costs for our foodservice customers and stimulate consumer demand, increasing beef and pork sales.
We believe our retail and foodservice customers will continue to value more convenient, processed products from us. We currently operate 20 plants that produce beef and pork products that are cut, ground and packaged to specific customer demands. In addition, the Proposed PPC Acquisition includes eight further processed food plants. We intend to expand our processed offerings through investments in and expansion of existing production facilities, acquisitions and/or greenfield investments. For example, in 2009, we have budgeted approximately $11.3 million and $8.1 million in capital expenditures to increase our value-added offerings in our Beef and Pork segments, respectively, including the addition of a fabrication floor at our Grand Island facility for our beef products, expanding the fabrication floor at our Greeley facility, adding an advance packaging system for pork products sold to Costco Wholesale Corporation and adding a casing system for our pork products. Increasing our value-added offerings is not limited to growth in our processing capabilities, as our Five Rivers operations provide us the ability to design feeding programs that meet our customers’ specifications. We believe that increased value-added capabilities will drive margin improvement and increase the value we provide to customers.
Promote innovation across the value chain
We believe we can increase our profitability by developing and implementing innovative process and product improvements across the value chain. Our recent innovations have increased our revenues as well as reduced our costs. Recent innovations include a casing sorting system, Halal
13
Table of Contents
processing, and use of spray technology in our Australian plants. The casing sorting system, utilized in Brazil, enables the sorting of hog intestines, or casings, for sale to end-users from all of our U.S. pork processing facilities, and is expected to result in annual margin improvement of approximately $24 million. The introduction of Halal processing capabilities in Australia has generated A$317.2 million of sales of Halal-qualified products since the institution of our Halal processing capabilities in 2008. We believe this gives us an advantage over our Australian competitors as we seek to expand our exports to Muslim customers in the Middle East. The transfer of spray technology (the process by which a carcass is sprayed with water as it is chilled immediately following slaughter in order to control weight shrinkage) from the United States to our Australian beef processing facilities is expected to increase our yields by one to two percent, or approximately 40 million pounds annually. Additionally, we have developed and implemented energy conversion processes that have yielded incremental revenue and cost savings. We will continue to seek to develop innovative process and product improvements across the value chain.
Continue to prioritize food and employee safety
We prioritize our food and employee safety objectives in order to accomplish two principal goals. First, we focus on maintaining a high standard of food safety in order to ensure the quality of our products and attempt to avoid the potential adverse market reaction that is associated with recalls that occur from time to time in the meat processing industry. Second, we strive to continuously improve our employee safety in order to increase the efficiency of our facilities and reduce our operating costs. Since February 2004, we have reduced the number of lost-time injury events by approximately 33% at our beef processing facilities and by approximately 32% at our pork processing facilities through design and implementation of a comprehensive multi-faceted employee safety and injury prevention program.
Leverage synergies created as a result of the Proposed PPC Acquisition
We believe that Pilgrim’s Pride can be successfully integrated into our existing North American operations. We believe that potential synergies from the Proposed PPC Acquisition include streamlining administrative functions and sales networks, consolidating distribution networks, optimizing freight and storage costs, capturing shared purchasing opportunities, consolidating treasury and risk management systems and implementing best practices throughout the business. In addition, opportunities for revenue enhancement may include leveraging our international sales force to improve Pilgrim Pride’s penetration of key export markets, including Russia and Japan.
Recent developments
Proposed acquisition of Pilgrim’s Pride Corporation
On December 1, 2008, PPC and six of its subsidiaries filed voluntary petitions in the United States Bankruptcy Court for the Northern District of Texas, Fort Worth Division seeking reorganization relief under the provisions of Chapter 11 of Title 11 of the United States Code, or the Bankruptcy Code.
On September 16, 2009, we entered into a stock purchase agreement with Pilgrim’s Pride Corporation. Upon consummation of the transactions contemplated by the stock purchase
14
Table of Contents
agreement and in accordance with PPC’s amended plan of reorganization, we will purchase 64% of the total issued and outstanding new common stock of Pilgrim’s Pride, as reorganized in accordance with the amended plan of reorganization, in exchange for aggregate consideration of $800.0 million in cash. The reorganized PPC is also expected to enter into a credit facility as it exits from bankruptcy consisting of a three-year revolving credit facility in the amount not to exceed $600.0 million, a three-year term loan A facility in the amount not to exceed $375.0 million and a five-year term loan B facility in the amount not to exceed $775.0 million. We refer to this financing arrangement as the Exit Facility. In addition, under the terms of the stock purchase agreement, in the event we complete this offering or any other initial public offering of our common stock and the offered shares are listed on a national exchange, we will have the option to cause each share of the reorganized PPC common stock to be exchanged for new shares of our common stock according to a specified exchange offer ratio. See “The Proposed PPC Acquisition—Conversion of reorganized PPC common stock into our common stock” for more information on the exchange offer ratio and how it is calculated.
On September 17, 2009, PPC and six of its subsidiaries filed with the bankruptcy court a proposed joint plan of reorganization, or the Plan, and a proposed disclosure statement pursuant to Chapter 11 of the Bankruptcy Code. In addition, on September 17, 2009, PPC filed a motion with the bankruptcy court seeking entry of an order approving certain provisions of the stock purchase agreement. On October 7, 2009, the bankruptcy court granted the motion and approved certain provisions of the stock purchase agreement. PPC has also sought approval of the remaining portions of the stock purchase agreement as part of the approval of its proposed amended joint plan of reorganization. On October 22, 2009, PPC received approval from the bankruptcy court to begin soliciting stockholder acceptance of its proposed amended joint plan of reorganization. For more information on the terms of the stock purchase agreement, which is filed as an exhibit to the registration statement of which this prospectus is a part, see “The Proposed PPC Acquisition—Stock purchase agreement.” On December 10, 2009, the bankruptcy court entered an order confirming PPC‘s amended Plan.
The Proposed PPC Acquisition is subject to the satisfaction of customary conditions to closing, including, without limitation, the execution and delivery of definitive documentation, obtaining certain regulatory approvals and governmental filings, the expiration or termination of applicable waiting periods, material compliance with the covenants by the parties, the representations and warranties under the stock purchase agreement being true and correct (subject to certain material qualifiers), the absence of a material adverse effect with respect to PPC since the date of the stock purchase agreement. In addition, our obligations under the stock purchase agreement are conditioned on the entry by PPC into the Exit Facility. Our obligations under the stock purchase agreement, including our payment of the $800 million purchase price in exchange for 64% of the total issued and outstanding new common stock of the reorganized PPC, have no other financing conditions.
On October 14, 2009, the Proposed PPC Acquisition received antitrust clearance from the Federal Trade Commission Bureau of Competition and the U.S. Department of Justice.
BNDESPAR transaction
On December 22, 2009, JBS S.A., our indirect parent company, agreed to issue a series of exchangeable debentures in a transaction exempt from registration under the Securities Act
15
Table of Contents
pursuant to Regulation S thereunder. The debentures are expected to be issued on December 29, 2009 and will not be transferable by their terms. These debentures are mandatorily exchangeable into our common stock in the form of BDRs following this offering under certain conditions. The terms of the debentures provide that 2,000,000 debentures will be issued. BNDESPAR has agreed to subscribe for and purchase up to the entire principal amount of the debentures offered for $2 billion. Following this offering and assuming compliance with other conditions, the 2,000,000 outstanding debentures will be mandatorily exchanged for an aggregate percentage of shares of our outstanding common stock in the form of BDRs equal to $2 billion divided by our equity valuation in U.S. dollars based on the number of shares outstanding immediately prior to this offering, but calculated on the basis of the price per share in this offering, multiplied by 100. Under this agreement, the number of shares of our common stock represented by the BDRs will not represent more than 20-25% of our common stock. Based on the midpoint of the expected price range of $ to $ per share and an offering size of shares in this offering, the 2,000,000 debentures in the aggregate would be mandatorily exchanged for shares representing approximately % of our common stock.
JBS S.A. is required to, among other things, use net proceeds from the offering of debentures to capitalize our company, including to fund the $800 million purchase price for our interest in PPC pursuant to Proposed PPC Acquisition.
In order to provide funds to us for the use of proceeds stated above prior to the closing of the BNDESPAR transaction, on December 21, 2009, we and JBS S.A. entered into a purchase and sale agreement pursuant to which we agreed to issue and sell 20-25% of our common stock to JBS S.A. for an aggregate purchase price of $2.0 billion. Prior to completion of this offering, we anticipate that JBS S.A. will hold a 20-25% interest in us, in addition to the remaining 75-80% interest it will continue to hold in us indirectly through the selling stockholder. In connection with the BNDESPAR transaction, the common stock that is acquired by JBS S.A. pursuant to the purchase and sale agreement will be the common stock that will underlie the BDRs to be delivered upon the mandatory exchange of the debentures.
In connection with BNDESPAR’s investment, JBS S.A., the controlling shareholders of JBS S.A. and BNDESPAR have agreed to enter into a shareholders’ agreement pursuant to which BNDESPAR will be granted veto rights with respect to certain corporate matters involving JBS S.A. and us and will be granted the right to appoint up to two members to JBS S.A.’s board of directors. In addition, we have agreed to grant to BNDESPAR certain registration rights pertaining to our common shares. A registration rights agreement is intended to be entered into with BNDESPAR prior to the closing of BNDESPAR’s investment.
We refer to these transactions, collectively, as the BNDESPAR transaction. For more information, see “Principal and selling stockholder—BNDESPAR transaction.”
Tatiara Meat acquisition
On December 15, 2009, our Australian subsidiary, Swift Australia Pty Limited, entered into a letter of intent with Vion Food Group, a Netherlands international food company, to acquire
16
Table of Contents
Tatiara Meat Company, Australia’s largest exporter of chilled lamb, for A$30 million. This acquisition is subject to a number of conditions, including approval from Australia’s anti-trust authorities. If this acquisition is consummated, we would become the largest lamb processor in Australia with the capacity to slaughter 24,500 head per day.
Corporate information
JBS USA Holdings, Inc. was incorporated in Delaware on July 23, 2004. We are a holding company and a subsidiary of JBS Hungary Holdings Kft., the selling stockholder, and a wholly owned, indirect subsidiary of JBS S.A. JBS S.A. is a publicly traded company in Brazil and the world’s largest beef producer. On July 11, 2007, JBS S.A. acquired Swift Foods Company for an aggregate purchase price of $1,470.6 million. JBS S.A. made this acquisition through J&F Acquisition Co., which thereafter merged with Swift Foods Company and changed its name to JBS USA, Inc., and subsequently JBS USA, Inc. changed its name to JBS USA Holdings, Inc.
Our corporate headquarters and principal executive offices are located at 1770 Promontory Circle, Greeley, Colorado, and our telephone number is (970) 506-8000. Our website is www.jbsswift.com. Information contained on our website is not incorporated into, and does not constitute a part of, this prospectus.
17
Table of Contents
The following summary contains basic information about the shares and is not intended to be complete. It does not contain all of the information that is important to you. For a more complete understanding of the shares, please read the section of this prospectus entitled “Description of capital stock.”
Issuer | JBS USA Holdings, Inc. |
Selling stockholder | JBS Hungary Holdings Kft. |
Common stock offered by us | shares. |
Common stock offered by the selling stockholder | shares. |
Common stock to be outstanding after this offering | shares (or shares if the underwriters exercise in full their option to purchase additional shares to cover over-allotments, if any). |
Offering price | We expect the offering price to be between $ and $ per share. |
Over-allotment option | We have granted the underwriters an option for a period of 30 days to purchase from us up to additional shares of our common stock to cover over-allotments, if any. |
Use of proceeds | We expect to receive net proceeds from the sale of our common stock in this offering, after deducting the underwriting discount and other estimated expenses, of approximately $ million. We expect to use a portion of our net proceeds to selectively pursue value-enhancing growth opportunities as they arise. For example, within the next five years, we intend to invest approximately $1.5 billion to $2.0 billion, including a portion of the net proceeds of this offering, to create a global direct distribution business. See “Prospectus summary—Our strategy—Increase sales and enhance margins by significantly expanding our direct distribution business.“ We also intend to use a portion of our net proceeds from this offering for working capital and general corporate purposes, which may include future acquisitions. See “Use of proceeds.” |
We will not receive any of the sales proceeds associated with common stock offered by the selling stockholder.
Dividend policy | Our board of directors will adopt a dividend policy pursuant to which any future determination relating to the declaration and payment of dividends will be made at its discretion and will depend on a number of factors, including our business and financial condition, any |
18
Table of Contents
covenants under our debt agreements and the dividend requirements of JBS S.A., our parent company. However, our board of directors may, in its discretion and for any reason, amend or repeal this dividend policy. Our board of directors may increase or decrease the level of dividends provided for in our dividend policy or entirely discontinue the payment of dividends. Future dividends with respect to our common shares, if any, will depend on, among other things, our results of operations, cash requirements, financial condition, distribution of dividends made by our subsidiaries, contractual restrictions, business opportunities, provisions of applicable law and other factors that our board of directors may deem relevant. |
Voting rights | Holders of our common stock will be entitled to one vote per share on all matters submitted to a vote of our stockholders. |
Proposed New York Stock Exchange symbol | We intend to apply to have our common stock listed on The New York Stock Exchange under the trading symbol “JBS.” |
Directed share program | At our request, the underwriters have reserved up to % of the shares of common stock for sale at the initial public offering price to persons who are directors, officers or employees, or who are otherwise associated with us, through a directed share program. The sales will be made by through a directed share program. We do not know if these persons will choose to purchase all or any portion of these reserved shares, but any purchases they do make will reduce the number of shares available to the general public. See “Underwriting.” |
Lock-up agreements | In connection with this offering, we, the selling stockholder and our executive officers and directors will enter into lock-up agreements with the underwriters of this offering under which neither we nor they may, for a period of 180 days after the date of this prospectus, directly or indirectly sell, dispose of or hedge, or file or cause to be filed a registration statement with the SEC under the Securities Act or the Brazilian Securities Commission (Comissão de Valores Mobiliários, or CVM) relating to, any shares of common stock, including Brazilian depository receipts, or BDRs representing such shares, or any securities convertible into or exchangeable for shares of common stock, including BDRs representing such shares, without the prior written consent of the representatives of the underwriters. |
Certain relationships and related party transactions | Please read “Certain relationships and related party transactions” for a discussion of business relationships between us and related parties and “Underwriting” for information regarding relationships between us and the underwriters. |
19
Table of Contents
Risk factors | You should carefully read and consider the information set forth under “Risk factors” and all other information set forth in this prospectus before investing in our common stock. |
Unless otherwise indicated, all information contained in this prospectus assumes:
| • | no exercise of the underwriters’ option to purchase up to additional shares of common stock to cover over-allotments, if any, and |
| • | that the common stock to be sold in this offering is sold at $ , which is the midpoint of the range set forth on the cover page of this prospectus. |
Except as otherwise noted, the number of shares of our common stock to be outstanding after this offering:
| • | gives effect to a -for-one stock split to take place immediately prior to completion of this offering, |
| • | excludes shares available for future awards under our stock option plan (see “Compensation discussion and analysis—2010 stock incentive compensation plan” for more information), and |
| • | excludes the possible acquisition of the reorganized PPC common stock in exchange for our common stock. See “The Proposed PPC Acquisition—Conversion of reorganized PPC common stock into our common stock.” |
20
Table of Contents
Summary historical and pro forma financial data
The following tables set forth our summary historical and unaudited pro forma financial data at the dates and for the periods indicated.
Our summary historical financial information contained in this prospectus is derived from:
| (1) | our predecessor’s audited historical consolidated financial statements as of and for |
| (a) | the fiscal year ended December 24, 2006, and |
| (b) | the 198 days from December 25, 2006 through July 10, 2007 (the date immediately preceding the Swift Acquisition), |
| (2) | our audited historical consolidated financial statements as of and for |
| (a) | the 173 days from July 11, 2007 through December 30, 2007, |
| (b) | the fiscal year ended December 28, 2008, and |
| (3) | our unaudited historical consolidated financial statements as of September 27, 2009 and for the thirty-nine weeks ended September 28, 2008 and September 27, 2009. |
The financial statements in (1) and (2)(a) were audited by Grant Thornton LLP. The financial statements in (2)(b) were audited by BDO Seidman, LLP. The 2009 financial statements in (3) were reviewed by BDO Seidman, LLP.
The financial statements in (1), (2) and (3) above are included elsewhere in this prospectus, all of which have been prepared in accordance with accounting principles generally accepted in the United States, or GAAP. We have prepared our unaudited historical consolidated financial statements on the same basis as our audited financial statements and have included all adjustments, consisting of normal and recurring adjustments, that we consider necessary to present fairly our financial position and results of operations for the unaudited periods. The results of operations for any partial period are not necessarily indicative of the results of operations for other periods or for the full fiscal year.
Also included in the tables below are unaudited pro forma combined balance sheet data as of September 27, 2009 and unaudited pro forma combined statement of operations data for the fiscal year ended December 28, 2008 and the thirty-nine weeks ended September 27, 2009.
The summary unaudited pro forma combined statement of operations data for the fiscal year ended December 28, 2008 have been prepared as if each of the following events had occurred at the beginning of the period presented:
| • | our issuance and sale of our 11.625% senior unsecured notes due 2014 and the application of the proceeds therefrom, |
| • | the JBS Packerland Acquisition, |
| • | the acquisition of 50% of the equity interest in Five Rivers not previously owned by JBS Packerland, |
| • | a portion (40%) of the sale of our common stock related to the BNDESPAR transaction, and |
| • | the Proposed PPC Acquisition. |
21
Table of Contents
The summary unaudited pro forma combined financial data for the fiscal year ended December 28, 2008 are derived from (1) our audited historical consolidated financial statements for the fiscal year ended December 28, 2008, (2) unaudited historical financial information of Smithfield Beef Group, Inc. for the period from January 1, 2008 through October 22, 2008, (3) unaudited historical financial information of Five Rivers for the period from January 1, 2008 through October 22, 2008, (4) audited historical financial information of Pilgrim’s Pride as of and for the year ended September 27, 2008, (5) the unaudited historical information of Pilgrim’s Pride for the three-month period ended December 29, 2007 and (6) unaudited historical information of Pilgrim’s Pride for the three-month period ended December 27, 2008.
The summary unaudited pro forma combined financial data for the thirty-nine weeks ended September 27, 2009 have been prepared as if a portion (40%) of the sale of our common stock related to the BNDESPAR transaction, the Proposed PPC Acquisition, and the issuance and sale in April 2009 of our 11.625% senior unsecured notes due 2014 and the application of the proceeds therefrom, in each case, had occurred as of December 30, 2007. The summary unaudited pro forma combined financial data as of September 27, 2009 has been prepared as if the Proposed PPC Acquisition and the BNDESPAR transaction had occurred as of September 27, 2009. The summary unaudited pro forma combined financial data as of and for the thirty-nine weeks ended September 27, 2009 is derived from (1) our unaudited historical consolidated financial statements as of and for the thirty-nine weeks ended September 27, 2009, (2) audited historical information of Pilgrim’s Pride as of and for the fiscal year ended September 26, 2009 and (3) unaudited historical information of Pilgrim’s Pride as of and for the three months ended December 27, 2008.
The unaudited pro forma combined financial data do not give any pro forma effect to the Tasman Acquisition as it was not material and did not constitute a significant subsidiary under Regulation S-X under the Securities Act.
Historically, Smithfield Beef Group, Inc. and Five Rivers reported their financial results using the last Sunday in April, and March 31, respectively, as their fiscal year ends. Accordingly, the historical amounts presented for JBS Packerland and Five Rivers in the unaudited pro forma combined financial information do not agree with Smithfield Beef Group, Inc.’s and Five Rivers’ financial statements appearing elsewhere in this prospectus.
Historically, PPC has reported its financial results on the basis of a 52- or 53-week fiscal year ending on the Saturday closest to September 30. Accordingly, the historical amounts presented for PPC in the unaudited pro forma combined financial information do not agree with PPC’s financial statements appearing elsewhere in this prospectus.
All pro forma financial information in this prospectus is presented for informational purposes only and does not purport to be indicative of what would have occurred had (1) our issuance of our 11.625% senior unsecured notes due 2014, (2) the JBS Packerland Acquisition, (3) the acquisition of 50% of the equity interest in Five Rivers, (4) the Proposed PPC Acquisition and (5) the BNDESPAR transaction actually been consummated at the beginning of the period presented or as of the balance sheet date, as the case may be, nor is it necessarily indicative of our future combined operating results.
You should read the information contained in this table in conjunction with “Unaudited pro forma combined financial data,” “Selected historical consolidated financial data,” “Management’s discussion and analysis of financial condition and results of operations” and the financial statements and the accompanying notes thereto included elsewhere in this prospectus.
22
Table of Contents
| JBS USA Holdings, Inc. | ||||||||||||||||||||||||||||||||||
| Predecessor | Successor | |||||||||||||||||||||||||||||||||
| As of and for the fiscal year ended December 24, 2006 | As of and for the 198 days from December 25, 2006 through July 10, 2007 | As of and for the 173 days from July 11, 2007 through December 30, 2007 | As of and for the fiscal year ended December 28, 2008 | As of and for the thirty-nine weeks ended September 28, 2008 | As of and for the thirty-nine weeks ended September 27, 2009 | |||||||||||||||||||||||||||||
| in thousands, except earnings per share | Historical | Historical | Historical | Historical | Pro forma(1) | Historical | Historical | Pro forma(2) | ||||||||||||||||||||||||||
| (audited) | (audited) | (audited) | (audited) | (unaudited) | (unaudited) | (unaudited) | (unaudited) | |||||||||||||||||||||||||||
Statement of operations data: | ||||||||||||||||||||||||||||||||||
Net sales | $ | 9,691,432 | $ | 4,970,624 | $ | 4,988,984 | $ | 12,362,281 | $ | 23,746,653 | $ | 8,972,255 | $ | 10,011,154 | $ | 15,194,171 | ||||||||||||||||||
Cost of goods sold | 9,574,715 | 4,920,594 | 5,013,084 | 11,917,777 | 23,433,215 | 8,612,590 | 9,673,675 | 14,382,781 | ||||||||||||||||||||||||||
Restructuring items | — | — | — | — | 27,990 | — | — | 12,464 | ||||||||||||||||||||||||||
Gross profit (loss) | 116,717 | 50,030 | (24,100 | ) | 444,504 | 285,448 | 359,665 | 337,479 | 798,926 | |||||||||||||||||||||||||
Selling, general and administrative expenses | 158,783 | 92,333 | 60,727 | 148,785 | 599,689 | 98,296 | 158,440 | 368,277 | ||||||||||||||||||||||||||
Foreign currency transaction losses (gains)(3) | (463 | ) | (527 | ) | (5,201 | ) | 75,995 | 75,995 | 17,572 | (60,867 | ) | (60,867 | ) | |||||||||||||||||||||
Goodwill impairment(4) | — | — | — | — | 501,446 |
| — |
|
| — |
| — | ||||||||||||||||||||||
Restructuring items, net | — | — | — | — | 18,578 | — | — | (435 | ) | |||||||||||||||||||||||||
Other income, net | (4,937 | ) | (3,821 | ) | (3,581 | ) | (10,107 | ) | (11,288 | ) | (9,775 | ) | (3,629 | ) | (5,902 | ) | ||||||||||||||||||
Loss (gain) on sales of property, plant and equipment | (666 | ) | (2,946 | ) | 182 | 1,082 | 1,096 | (233 | ) | (181 | ) | (181 | ) | |||||||||||||||||||||
Interest expense, net | 118,754 | 66,383 | 34,340 | 36,358 | 206,760 | 23,287 | 69,515 | 171,747 | ||||||||||||||||||||||||||
Total expenses | 271,471 | 151,422 | 86,467 | 252,113 | 1,392,276 | 129,147 | 163,278 | 472,639 | ||||||||||||||||||||||||||
Income (loss) before reorganization items and income taxes | (154,754 | ) | (101,392 | ) | (110,567 | ) | 192,391 | (1,106,828 | ) | 230,518 | 174,201 | 326,287 | ||||||||||||||||||||||
Reorganization items | — | — | — | — | 13,250 | — | — | 74,025 | ||||||||||||||||||||||||||
Income (loss) from continuing operations before income taxes | (154,754 | ) | (101,392 | ) | (110,567 | ) | 192,391 | (1,120,078 | ) | 230,518 | 174,201 | 252,262 | ||||||||||||||||||||||
Income tax expense (benefit) | (37,348 | ) | (18,380 | ) | 1,025 | 31,287 | (252,573 | ) | 74,267 | 58,236 | 85,557 | |||||||||||||||||||||||
Net income (loss) | (117,406 | ) | (83,012 | ) | (111,592 | ) | 161,104 | (867,505 | ) | 156,251 | 115,965 | 166,705 | ||||||||||||||||||||||
Less net income (loss) attributable to non-controlling in PPC | — | — | — | — | (379,255 | ) | — | — | 21,135 | |||||||||||||||||||||||||
Net income (loss) attributable to controlling shareholder | $ | (117,406 | ) | $ | (83,012 | ) | $ | (111,592 | ) | $ | 161,104 | $ | (488,250 | ) | $ | 156,251 | $ | 115,965 | $ | 145,570 | ||||||||||||||
Basic and diluted net income (loss) per share of common stock | N/A | N/A | $ | (1,115,920 | ) | $ | 1,611,040 | $ | (4,308,086 | ) | $ | 1,562,510 | $ | 1,159,650 | $ | 1,284,440 | ||||||||||||||||||
Shares outstanding(5) | N/A | N/A | 100 | 100 | 113 1/3 |
| 100 |
|
| 100 |
| 113 1/3 | ||||||||||||||||||||||
23
Table of Contents
| JBS USA Holdings, Inc. | |||||||||||||||||||||||||||||||||
| Predecessor | Successor | ||||||||||||||||||||||||||||||||
| As of and for the fiscal year ended December 24, 2006 | As of and for the 198 days from December 25, 2006 through July 10, 2007 | As of and for the 173 days from July 11, 2007 through December 30, 2007 | As of and for the fiscal year ended December 28, 2008 | As of and for the thirty-nine weeks ended September 28, 2008 | As of and for the thirty-nine weeks ended September 27, 2009 | ||||||||||||||||||||||||||||
| in thousands, except earnings per share | Historical | Historical | Historical | Historical | Pro forma(1) | Historical | Historical | Pro forma(2) | |||||||||||||||||||||||||
| (audited) | (audited) | (audited) | (audited) | (unaudited) | (unaudited) | (unaudited) | (unaudited) | ||||||||||||||||||||||||||
Basic and diluted pro forma net income (loss) per share of common stock(6) | N/A | N/A | $ | $ | $ | $ | $ | $ | |||||||||||||||||||||||||
Balance sheet data (at period end): | |||||||||||||||||||||||||||||||||
Cash and cash equivalents | $ | 83,420 | $ | 44,673 | $ | 198,883 | $ | 254,785 | $ | 268,115 | $ | 105,740 | $1,305,740 | ||||||||||||||||||||
Accounts receivable, net | 334,341 | 365,642 | 417,375 | 588,985 | 563,441 | 607,158 | 924,111 | ||||||||||||||||||||||||||
Inventories | 457,829 | 487,598 | 466,756 | 658,287 | 627,923 | 679,251 | 1,443,120 | ||||||||||||||||||||||||||
Property, plant and equipment, net | 487,427 | 505,172 | 708,056 | 1,229,316 | 850,629 | 1,232,756 | 3,621,335 | ||||||||||||||||||||||||||
Total assets | 1,538,597 | 1,578,350 | 2,165,815 | 3,315,571 | 2,627,316 | 3,525,882 | 8,551,120 | ||||||||||||||||||||||||||
Long-term debt | 1,065,553 | 1,201,975 | 32,433 | 806,808 | 483,361 | 787,952 | 2,349,317 | ||||||||||||||||||||||||||
Total debt | 1,067,503 | 1,203,912 | 810,718 | 878,319 | 589,997 | 822,368 | 2,433,733 | ||||||||||||||||||||||||||
Stockholder’s equity (deficit) | (40,090 | ) | (98,818 | ) | 838,818 | 1,388,250 | 1,426,896 | 1,576,638 | 4,170,627 | ||||||||||||||||||||||||
Other financial data: | |||||||||||||||||||||||||||||||||
EBITDA(7) | 53,122 | 9,829 | (40,983 | ) | 321,123 | (73,099 | ) | 317,557 | 359,428 | 702,136 | |||||||||||||||||||||||
Adjusted EBITDA(7) | 51,993 | 6,356 | (46,002 | ) | 398,200 | 63,810 | 334,896 | 318,280 | 747,042 | ||||||||||||||||||||||||
Cash provided by (used in): | |||||||||||||||||||||||||||||||||
Operating activities | 67,823 | (110,661 | ) | (107,784 | ) | 282,147 | 49,680 | 189,607 | |||||||||||||||||||||||||
Investing activities(8) | (11,923 | ) | (27,777 | ) | (39,409 | ) | (783,739 | ) | (173,180 | ) | (287,206 | ) | |||||||||||||||||||||
Financing activities | (25,947 | ) | 100,492 | 346,711 | 571,265 | 192,500 | (55,122 | ) | |||||||||||||||||||||||||
Capital expenditures | $ | 47,294 | $ | 33,700 | $ | 33,461 | $ | 118,320 | $ | 274,885 | $ | 68,404 | $ | 108,150 | $ | 167,315 | |||||||||||||||||
Other operating data: | |||||||||||||||||||||||||||||||||
Head killed, Beef | 5,808 | 2,731 | 2,824 | 6,872 | 8,721 | 4,901 | 6,250 | 6,250 | |||||||||||||||||||||||||
Head killed, Pork | 12,105 | 6,511 | 6,123 | 13,113 | 13,113 | 9,638 | 9,458 | 9,459 | |||||||||||||||||||||||||
Head killed, Chicken | — | — | — | — | 2,161,999 | — | — | 1,420,234 | |||||||||||||||||||||||||
| (1) | As adjusted to give effect to (i) the JBS Packerland Acquisition, (ii) the sale of our 11.625% senior unsecured notes due 2014 and the application of proceeds therefrom, and (iii) the Proposed PPC Acquisition, in each case, as if such event had occurred at the beginning of the period presented. |
| (2) | In the case of statement of operations data, as adjusted to give effect to the (i) Proposed PPC Acquisition as if such event had occurred at the beginning of the period presented and (ii) sale of our 11.625% senior unsecured notes due 2014 and the application of proceeds therefrom as if such event had occurred at the beginning of the period through April 27, 2009. In the case of balance sheet data, as adjusted to give effect to the (1) Proposed PPC Acquisition and (2) the BNDESPAR transaction, as if each transaction had occurred at September 27, 2009. |
| (3) | Foreign currency transaction loss (gain) reflects changes in value of our U.S. dollar-denominated intercompany note between our Australian subsidiary, as debtor, and us, as lender. |
| (4) | Represents a non-cash charge for the impairment of goodwill recorded by Pilgrim’s Pride. |
| (5) | The capital structure of our predecessor company was significantly different from our capital structure. Accordingly, we do not believe our predecessor company’s earnings per share information is meaningful to investors and have not included such information. Prior to this offering, our capital structure consists of 100 common shares issued and outstanding. |
| (6) | In calculating pro forma shares of our common stock outstanding, we give retroactive effect to the stock split to occur immediately prior to completion of this offering. Basic and diluted pro forma net income (loss) per share of common stock as adjusted to reflect the sale of 13 1/3 shares of our common stock related to the BNDESPAR transaction. |
| (7) | EBITDA represents net income (loss) before income tax expense (benefit), interest expense, net, and depreciation and amortization. EBITDA and Adjusted EBITDA are presented as supplemental financial measurements in the evaluation of our business. Adjusted EBITDA as used in this prospectus represents EBITDA as defined in our 11.625% senior unsecured notes due 2014. Adjusted EBITDA, as used in our 11.625% senior unsecured notes due 2014, represents EBITDA as adjusted to exclude loss (gain) on sales of property, plant and equipment, |
24
Table of Contents
non-recurring items and foreign currency transaction losses (gains) for JBS USA, LLC and its restricted subsidiaries. We believe Adjusted EBITDA is a key measurement because (1) the ratio of JBS USA, LLC and its restricted subsidiaries’ net debt to Adjusted EBITDA is an important term of our 11.625% senior unsecured notes due 2014, (2) our 11.625% senior unsecured notes due 2014 is material indebtedness to our company, (3) information about this ratio is important to investors to understand JBS USA, LLC and its restricted subsidiaries’ liquidity, and (4) JBS USA, LLC and its restricted subsidiaries have historically represented substantially all of our operations. See “Management’s discussion and analysis of financial condition and results of operations––Liquidity and capital resources––Covenant compliance” for more information about this ratio. We present Adjusted EBITDA because we believe it is important that we present this measure on a consistent basis with how we measure Adjusted EBITDA under our 11.625% senior unsecured notes due 2014 for the reasons outlined above. However, please note that because we, and not JBS USA LLC, will own PPC, our Adjusted EBITDA is significantly different from the Adjusted EBITDA for JBS USA, LLC and its restricted subsidiaries after giving effect to the Proposed PPC Acquisition. In addition, because EBITDA and Adjusted EBITDA exclude certain non-cash charges, as well as other items that we believe are not representative of our core business operations, we believe that the presentation of these financial measures helps investors to assess our operating performance from period to period and enhances understanding of our financial performance and highlights operational trends. These measures are widely used by investors and rating agencies in the valuation, comparison, rating and investment recommendations of companies. However, the measurement of EBITDA and Adjusted EBITDA in this prospectus may not be comparable to that of other companies in our industry, which limits their usefulness as a comparative measure. EBITDA and Adjusted EBITDA are not measures required by or calculated in accordance with GAAP and should not be considered as a substitute for income (loss) from continuing operations, net income (loss) or any other measure of financial performance reported in accordance with GAAP or as measures of operating cash flows or liquidity. You should rely primarily on our GAAP results, and use this non-GAAP financial measure only supplementally, in making your investment decision. |
| Each of EBITDA and Adjusted EBITDA is reconciled to net income (loss) as follows: |
| JBS USA Holdings, Inc. | |||||||||||||||||||||||||||||||||
| Predecessor | Successor | ||||||||||||||||||||||||||||||||
| As of the fiscal year ended December 24, 2006 | As of the 198 days from December 25, 2006 through July 10, 2007 | As of the 173 days from July 11, 2007 through December 30, 2007 | As of the fiscal year ended December 28, 2008 | As of the thirty-nine weeks ended September 28, 2008 | As of the thirty-nine weeks ended September 27, 2009 | ||||||||||||||||||||||||||||
| in thousands | Historical | Historical | Historical | Historical | Pro Forma | Historical | Historical | Pro forma | |||||||||||||||||||||||||
Net income (loss) | $ | (117,406 | ) | $ | (83,012 | ) | $ | (111,592 | ) | $ | 161,104 | $ | (867,505 | ) | $ | 156,251 | $ | 115,965 | $ | 166,705 | |||||||||||||
Income tax expense (benefit) | (37,348 | ) | (18,380 | ) | 1,025 | 31,287 | (252,573 | ) | 74,267 | 58,236 | 85,557 | ||||||||||||||||||||||
Interest expense, net | 118,754 | 66,383 | 34,340 | 36,358 | 206,760 | 23,287 | 69,515 | 171,747 | |||||||||||||||||||||||||
Depreciation and amortization (a) | 89,122 | 44,838 | 35,244 | 92,374 | 344,220 | 63,752 | 115,712 | 283,415 | |||||||||||||||||||||||||
Goodwill impairment(b) | — | — | — | — | 501,446 | — | — | — | |||||||||||||||||||||||||
Amortization of capitalized financing costs | — | — | — | — | (5,447 | ) | — | — | (5,288 | ) | |||||||||||||||||||||||
EBITDA (unaudited) | 53,122 | 9,829 | (40,983 | ) | 321,123 | (73,099 | ) | 317,557 | 359,428 | 702,136 | |||||||||||||||||||||||
Loss (gain) on sales of property, plant and equipment | (666 | ) | (2,946 | ) | 182 | 1,082 | 1,096 | (233 | ) | (181 | ) | (181 | ) | ||||||||||||||||||||
Foreign currency transaction loss (gain)(c) | (463 | ) | (527 | ) | (5,201 | ) | 75,995 | 75,995 | 17,572 | (60,867 | ) | (60,867 | ) | ||||||||||||||||||||
National Beef termination fee(d) | — | — | — | — | — | — | 19,900 | 19,900 | |||||||||||||||||||||||||
Restructuring and reorganization items(e) | — | — | — | — | 59,818 | — | — | 86,054 | |||||||||||||||||||||||||
Adjusted EBITDA (unaudited) | $ | 51,993 | $ | 6,356 | $ | (46,002 | ) | $ | 398,200 | $ | 63,810 | $ | 334,896 | $ | 318,280 | $ | 747,042 | ||||||||||||||||
| (a) | Depreciation and amortization includes a goodwill impairment charge of $4.5 million for the fiscal year ended December 24, 2006. |
| (b) | Represents a non-cash charge for the impairment of goodwill recorded by Pilgrim’s Pride. |
| (c) | Foreign currency transaction loss (gain) reflects changes in value of our U.S. dollar-denominated intercompany note payable and receivable within Australia due to changes in the exchange rate between the U.S. dollar and the Australian dollar. |
| (d) | On February 18, 2009, we reached an agreement to terminate our efforts to acquire National Beef Packing Company, LLC, or National Beef, effective February 23, 2009. As a result of the termination of the agreement, we paid a breakage fee to the shareholders of National Beef totaling $19.9 million as full and final settlement of any and all liabilities relating to the potential acquisition during the thirty-nine weeks ended September 27, 2009. |
| (e) | Represents restructuring and reorganization charges recognized by PPC in 2008 and 2009. |
| (8) | Investing activities for the fiscal year ended December 28, 2008 include cash used in connection with the Tasman Acquisition and the JBS Packerland Acquisition. |
25
Table of Contents
Investing in our common stock involves a high degree of risk. You should carefully consider the risks described below as well as the other information contained in this prospectus before deciding to purchase any shares of our common stock. These risks could harm our business, operating results, financial condition and prospects. In addition, the trading price of our common stock could decline due to any of these risks and you might lose all or part of your investment.
Risks relating to our business and the beef and pork industries
Outbreaks of BSE, Foot-and-Mouth Disease, or FMD, or other species-based diseases in the United States, Australia or elsewhere may harm demand for our products.
An outbreak of disease affecting livestock, such as BSE, could result in restrictions on sales of products to our customers or purchases of livestock from our suppliers. Also, outbreaks of these diseases or concerns that these diseases may occur and spread in the future, whether or not resulting in regulatory action, can lead to cancellation of orders by our customers and create adverse publicity that may have a material adverse effect on customer demand for our products. In December 2003, the USDA reported the first confirmed case of BSE in the United States. Following the announcement, substantially all international export markets banned the import of U.S. beef. Canada also confirmed its first case of BSE in 2003, leading to the USDA’s closure to imports of live cattle from Canada. As a result, export demand declined and negatively impacted the volume of processing at our facilities. The United States currently imports cattle that is 30 months of age or younger from Canada, and Mexico reopened its borders to U.S. beef in April 2004. In late June 2005, the USDA announced a second confirmed case of BSE in the United States, followed by a third confirmed case in March 2006, resulting in the extension of some border closures and slowing the re-entry of U.S. beef to some foreign markets. In addition to the negative effect on demand and on our revenues, the direct financial cost to us of these initial confirmed cases of BSE and the subsequent bans on the import of U.S. beef by certain international export markets was approximately $43.0 million, primarily related to one-time product value write-downs and losses on open derivative contracts, as reflected in our results for the fiscal quarter ended February 27, 2004. On July 27, 2006, Japan announced it would resume importing some U.S. beef, restricted to cattle that is 20 months or younger from approved U.S. processing plants. In 2006, South Korea reopened its market to boneless beef from the United States. However, disagreements and lack of clarity over import rules and procedures slowed the re-entry of U.S. boneless beef such that such exports to South Korea did not commence until 2008. As of June 28, 2009, 16 countries were still closed to U.S. beef. We are currently unable to assess whether or when these remaining foreign markets may fully open to U.S. beef or whether existing open markets may close.
In addition to BSE (in the case of cattle) and FMD (a highly contagious animal disease), cattle, sheep and pigs are subject to outbreaks of other diseases affecting such livestock. An actual outbreak of BSE, FMD or any other diseases, or the perception by the public that such an outbreak has occurred, could result in restrictions on domestic and export sales of our products (even if our products are not actually affected by any disease), cancellations of orders by our customers and adverse publicity. In addition, if the products of our competitors become contaminated, the adverse publicity associated with such an event may lower consumer demand for our products. Any of these events could have a material adverse effect on us.
26
Table of Contents
Any perceived or real health risks related to the food industry could adversely affect our ability to sell our products. If our products become contaminated, we may be subject to product liability claims and product recalls.
We are subject to risks affecting the food industry generally, including risks posed by the following:
| • | food spoilage or food contamination, |
| • | evolving consumer preferences and nutritional and health-related concerns, |
| • | consumer product liability claims, |
| • | product tampering, |
| • | the possible unavailability and expense of product liability insurance, |
| • | the potential cost and disruption of a product recall, and |
| • | concerns about outbreaks of diseases, such as influenza A (H1N1). |
Our beef products and our pork products in the United States have in the past been, and may in the future be, exposed to contamination by organisms that may produce foodborne illnesses, such as E. coli, Listeria monocytogenes and Salmonella. These organisms are generally found in the environment and, as a result, there is a risk that they could be present in our products. These pathogens can also be introduced to our products through tampering or as a result of improper handling at the further processing, foodservice or consumer level. Once contaminated products have been shipped for distribution, illness or death may result if the products are not properly prepared prior to consumption or if the pathogens are not eliminated in further processing.
Although we have systems in place designed to monitor food safety risks throughout all stages of our processes, such systems, even when working effectively, may not eliminate the risks related to food safety. As a result, we may voluntarily recall, or be required to recall, our products if they are or may be contaminated, spoiled or inappropriately labeled. For example, on June 25, 2009, we voluntarily recalled 41,280 pounds of beef products that may have been contaminated with E. coli. Following further investigations, on June 28, 2009, we voluntarily expanded this recall to include an additional 380,000 pounds of assorted beef products. The recalled beef products were produced on April 21 and April 22, 2009 at our Greeley, Colorado facility and were shipped to distributors and retailers in multiple states and internationally.
We may be subject to significant liability in the jurisdictions in which our products are sold if the consumption of any of our products causes injury, illness or death and such liability may be in excess of applicable liability insurance policy limits. Adverse publicity concerning any perceived or real health risk associated with our products could also cause customers to lose confidence in the safety and quality of our food products, which could adversely affect our ability to sell our products. We could also be adversely affected by perceived or real health risks associated with similar products produced by others to the extent such risks cause customers to lose confidence in the safety and quality of such products generally. Any of these events may have a material adverse effect on us.
27
Table of Contents
Our results of operations may be negatively impacted by fluctuations in the prevailing market prices for livestock.
We are dependent on the cost and supply of livestock and the selling price of our products and competing protein products, all of which can vary significantly over a relatively short period of time. For the thirty-nine weeks ended September 27, 2009, we purchased approximately 71% and 32% of our annual cattle and hog needs, respectively, at spot market prices on the open market. Livestock prices demonstrate a cyclical nature both seasonally and over periods of years, reflecting the supply of and demand for livestock on the market and the market for other protein products such as livestock and fish. These costs are determined by constantly changing market forces of supply and demand as well as other factors over which we have little or no control. These other factors include:
| • | environmental and conservation regulations, |
| • | import and export restrictions, |
| • | economic conditions, |
| • | livestock diseases, and |
| • | declining cattle inventory levels in the United States and/or Australia. |
We do not generally enter into long-term sales arrangements with our customers with fixed price contracts, and, as a result, the prices at which we sell our products are determined in large part by market conditions. A majority of our livestock is purchased from independent producers who sell livestock to us under marketing contracts or on the open market. A significant decrease in beef or pork prices for a sustained period of time could have a material adverse effect on our net sales revenue and, unless our raw material costs and other costs correspondingly decrease, on our operating margins.
We attempt to manage certain of these risks through the use of risk management and hedging programs, which include forward purchase and sale agreements and futures and options. As of December 28, 2008 and September 27, 2009, we had derivatives in place covering approximately less than 1% of our anticipated cattle needs through June 2010 and 11% and 7%, respectively, of our anticipated hog requirements through August 2010. However, these strategies cannot and do not fully eliminate these risks. Furthermore, these programs may also limit our ability to participate in gains from favorable commodity price fluctuations. Also, a portion of our forward purchase and sale contracts are marked-to-market such that the related unrealized gains and losses are reported in earnings on a quarterly basis. Therefore, losses on those contracts would adversely affect our earnings and may cause significant volatility in our quarterly earnings. See “Management’s discussion and analysis of financial condition and results of operations—Quantitative and qualitative disclosure about market risk.”
Accordingly, we may be unable to pass on all or part of any increased costs we experience from time to time to consumers of our products directly, in a timely manner or at all. Additionally, if we do not attract and maintain contracts or marketing relationships with independent producers and growers, our production operations could be disrupted.
28
Table of Contents
Our businesses are subject to government policies and extensive regulations affecting the cattle, hog, beef and pork industries.
Livestock production and trade flows are significantly affected by government policies and regulations. Governmental policies affecting the livestock industry, such as taxes, tariffs, duties, subsidies and import and export restrictions on livestock products, can influence industry profitability, the use of land resources, the location and size of livestock production, whether unprocessed or processed commodity products are traded, and the volume and types of imports and exports.
Our plants and our products are subject to periodic inspections by federal, state and municipal authorities and to comprehensive food regulation, including controls over processed food. Our operations are subject to extensive regulation and oversight by state, local and foreign authorities regarding the processing, packaging, storage, distribution, advertising and labeling of our products, including food safety standards. Our exported products are often inspected by foreign food safety authorities, and any violation discovered during these inspections may result in a partial or total return of a shipment, partial or total destruction of the shipment and costs due to delays in product deliveries to our customers.
Our operations in the United States are subject to extensive regulation and oversight by the USDA, the Grain Inspection Packers and Stockyards Administration, or GIPSA, the U.S. Environmental Protection Agency, or the EPA, and other state, local and foreign authorities regarding the processing, packaging, labeling, storage, distribution and advertising of our products. Our domestic operations are subject to the Packers and Stockyards Act of 1921, or the PSA. This statute generally prohibits meat packers in the livestock industry from engaging in certain anti-competitive practices. In addition, this statute requires us to make payment for our livestock purchases before the close of the next business day following determination of the purchase price and transfer of possession of the livestock we purchase, unless otherwise agreed to by our livestock suppliers. Recently, the food safety practices and procedures of the meat processing industry have been subject to more intense scrutiny and oversight by the USDA. Food safety standards, processes and procedures are subject to the USDA Hazard Analysis Critical Control Point program, which includes compliance with the Public Health Security and Bioterrorism Preparedness and Response Act of 2002. Wastewater, storm water and air discharges from our operations are subject to extensive regulations by the EPA and other state and local authorities. Our facilities for processing beef, pork and lamb are subject to a variety of federal, state and local laws relating to the health and safety of our employees including those administered by the U.S. Occupational Safety and Health Administration, or OSHA. Our Australian operations also are subject to extensive regulation by the Australian Quarantine Inspection Service, or AQIS, and other state, local and foreign authorities. Additionally, we are routinely affected by new or amended laws, regulations and accounting standards. Our failure to comply with applicable laws and regulations or failure to obtain necessary permits and registrations could delay or prevent us from meeting current product demand or acquiring new businesses, as well as possibly subjecting us to administrative penalties, damages, injunctive relief, fines, injunctions, recalls of our products or seizure of our properties as well as potential criminal sanctions, any of which could materially adversely affect our financial results.
Government policies in the United States, Australia and other jurisdictions may adversely affect the supply of, demand for and prices of livestock protein products, restrict our ability to do business in existing and target domestic and export markets and could adversely affect our
29
Table of Contents
results of operations. For example, the European Union has banned the importation of beef raised using hormones. Our facilities in the U.S. and, to a limited extent, our facilities in Australia process cattle that have been raised with hormones and therefore, we are prohibited from exporting our products from these facilities to the European Union. In addition, the Obama administration announced in July 2009 that it would seek to ban many routine uses of antibiotics, which are fed to farm animals to encourage rapid growth, in hopes of reducing the spread of dangerous bacteria in humans.
In addition, if we are required to comply with future material changes in food safety regulations, we could be subject to material increases in operating costs and we could be required to implement regulatory changes on schedules that cannot be met without interruptions in our operations.
Compliance with environmental requirements may result in significant costs, and failure to comply may result in civil liabilities for damages as well as criminal and administrative sanctions and liability for damages.
Our operations are subject to extensive and increasingly stringent federal, state, local and foreign laws and regulations pertaining to the protection of the environment, including those relating to the discharge of materials into the environment, the handling, treatment and disposition of wastes and remediation of soil and ground water contamination. Failure to comply with these requirements can have serious consequences for us, including criminal as well as civil and administrative penalties, claims for property damage, personal injury and damage to natural resources and negative publicity. We have incurred significant capital and operating expenditures and we expect to incur approximately $30 million in additional capital expenditures between 2009 and 2012, including for the upgrade our wastewater treatment facilities and remediation of previous contamination from the release of wastewater from certain of our plants under predecessor ownership as described in “Business—Wastewater issues.” Between August 10, 2007 and June 10, 2008 while under prior ownership, our Souderton facility experienced a series of wastewater release incidents. The EPA and the United States Department of Justice commenced investigations into the incidents and issued grand jury subpoenas for documents and testimony. On December 29, 2008, the United States Department of Justice commenced a civil action against us in the federal district court for the Eastern District of Pennsylvania in connection with these incidents. If the EPA and the Department of Justice determine our remediation and upgrade measures are inadequate they may require that we make additional improvements or operational changes that could result in additional costs. Additional environmental requirements imposed in the future and/or stricter enforcement of existing requirements could require currently unanticipated investigations, assessments or expenditures and may require us to incur significant additional costs. As the nature of these potential future charges is unknown, we are not able to estimate the magnitude of any future costs, and we have not accrued any reserve for any potential future costs.
Some of our facilities have been in operation for many years. During that time, we and previous owners and operators of these facilities have generated and disposed of wastes that are or may be considered hazardous or may have polluted the soil, surface water or groundwater at our facilities and adjacent properties. Some environmental laws impose strict and, in certain circumstances, joint and several liability for costs of investigation and remediation of contaminated sites on current and former owners and operators of the sites, and on persons who arranged for disposal of wastes at such sites. Discovery of previously unknown contamination of
30
Table of Contents
property underlying or in the vicinity of our or our predecessor’s present or former properties or manufacturing facilities and/or waste disposal sites could require us to incur material unforeseen expenses. Occurrences of any of these events may have a material adverse effect on our business, financial condition, results of operations and cash flows.
In addition, increasing efforts to control emissions of greenhouse gases, or GHG, are likely to impact us. In the United States, the EPA recently issued a new rule establishing a mandatory GHG reporting system for certain activities, including manure management systems, which exceed specified emission thresholds. The EPA has also announced a finding relating to GHG emissions that may result in promulgation of GHG air quality standards. The U.S. Congress is considering various options, including a cap and trade system which would impose a limit and a price on GHG emissions and establish a market for trading GHG credits. In June 2009, the House of Representatives passed a bill contemplating such a cap and trade system, and cap and trade legislation has also been introduced in the Senate. Certain states have taken steps to regulate GHG emissions that may be more stringent than federal regulations. In Australia, the federal government has proposed a GHG cap and trade system that, if ultimately enacted as proposed, would cover agricultural operations, including certain of our feedlots, and at least two of our processing plants. Certain states in Australia could also adopt regulations of GHG emissions which are stricter than Australian federal regulations. While it is not possible to estimate the specific impact final GHG regulations will have on our operations, there can be no guarantee that these measures will not have significant additional impact on us.
Our export and international operations expose us to political and economic risks in foreign countries, as well as to risks related to currency fluctuations.
Sales outside the United States, primarily to Russia, Japan, Mexico, South Korea, Canada, Taiwan and China, accounted for approximately 24% of our total net sales for the thirty-nine weeks ended September 27, 2009. Our international activities expose us to risks not faced by companies that limit themselves to the United States. One significant risk is that the international operations may be affected by import restrictions and tariffs, other trade protection measures, and import or export licensing requirements. For example, in 2008, exports to Japan from our processing plant in Wisconsin were suspended, as were exports to South Korea from our Colorado plant and to Russia from one of our pork production plants. In April 2009, Russia halted imports from our pork facility in Louisville, Kentucky. Our future financial performance will depend significantly on economic, political and social conditions in our principal export markets (the European Union, Russia, the United States, Japan, Mexico, Canada, Taiwan, China and the Middle East). In addition, upon consummation of the Proposed PPC Acquisition, we may become exposed to additional risks. See “—Risks relating to the reorganized PPC’s business and the poultry industry—The foreign operations of the reorganized PPC pose special risks to its business and operations.” Other risks associated with our international activities include:
| • | changes in foreign currency exchange rates and inflation in the foreign countries in which we operate; |
| • | exchange controls; |
| • | changes in a specific country’s or region’s political or economic conditions, particularly in emerging markets; |
31
Table of Contents
| • | potentially negative consequences from changes in regulatory requirements; |
| • | difficulties and costs associated with complying with, and enforcing remedies under, a wide variety of complex international laws, treaties, and regulations, including, without limitation, the Foreign Corrupt Practices Act; |
| • | tax rates that may exceed those in the United States and earnings that may be subject to withholding requirements and incremental taxes upon repatriation; |
| • | potentially negative consequences from changes in tax laws; and |
| • | distribution costs, disruptions in shipping or reduced availability of freight transportation. |
An occurrence of any of these events could negatively impact our results of operations and our ability to transact business in existing or developing markets.
We attempt to manage certain of these risks through the use of risk management and hedging programs, including futures and options. As of September 27, 2009, we had open foreign currency derivative asset positions equaling approximately $6.1 million and liability positions equaling approximately $45.4 million relating to currency fluctuation risk arising from sales or anticipated sales of our finished goods that are denominated in currencies other than U.S. dollars. However, these strategies cannot and do not fully eliminate these risks.
Deterioration of economic conditions could negatively impact our business.
Our business may be adversely affected by changes in national or global economic conditions, including inflation, interest rates, availability of capital markets, consumer spending rates, energy availability and costs (including fuel surcharges) and the effects of governmental initiatives to manage economic conditions. Any such changes could adversely affect the demand for our products both in domestic and export markets, or the cost and availability of our needed raw materials, cooking ingredients and packaging materials, thereby negatively affecting our financial results.
The recent disruptions in credit and other financial markets and deterioration of national and global economic conditions, could, among other things:
| • | negatively impact global demand for protein products, which could result in a reduction of sales, operating income and cash flows; |
| • | cause our customers or end consumers of our products to “trade down” to lower-value protein cuts of beef, pork or chicken that are less profitable, putting pressure on our profit margins; |
| • | make it more difficult or costly for us to obtain financing for our operations or investments or to refinance our debt in the future; |
| • | cause our lenders to depart from prior credit industry practice and make more difficult or expensive the granting of any technical or other waivers under our debt agreements to the extent we may seek them in the future; |
| • | impair the financial condition of some of our customers, suppliers or counterparties to our derivative instruments, thereby increasing customer bad debts or non-performance by suppliers or counterparties; |
32
Table of Contents
| • | decrease the value of our investments; and |
| • | impair the financial viability of our insurers. |
Failure to successfully implement our business strategies may affect our plans to increase our revenue, cash flow and margins.
Our growth and financial performance depends, in part, on our success in implementing numerous elements of our strategies that are dependent on factors that are beyond our control.
We may be unable to fully or successfully implement our strategies. The beef and pork industries and the food distribution industry are particularly influenced by changes in customer preferences, governmental regulations, regional and national economic conditions, demographic trends and sales practices by retailers, among other factors. Some aspects of our strategy require an increase in our operating costs and a significant increase in capital expenditures that may not be offset by a corresponding increase in revenue, resulting in a decrease in our operating margins.
For example, we are pursuing a global direct distribution strategy as we seek to enhance our operating margins. The implementation of this strategy will require us to make substantial investments in order to acquire and build a distribution center network, as well as incur related operating expenses. Within the next five years, we intend to invest approximately $1.5 billion to $2.0 billion, including a portion of the net proceeds of this offering, in order to implement this strategy and significantly expand our existing direct distribution business. We are currently evaluating certain potential acquisitions, including acquisitions to build our direct distribution business in the United States. We may not be successful in negotiating agreements for these acquisitions on terms that are acceptable to us, or at all. To the extent that we expand our distribution business through acquisitions, we may not be able to successfully integrate such acquisitions, and our failure to successfully integrate any significant acquired business could have a material adverse effect on us. If we are successful in building a distribution business or integrating acquisitions of distribution companies, the increased sales levels and enhanced margins that we anticipate may not result from this strategic initiative, and we may not achieve our desired return on the required investment. In addition, this strategy may expose us to direct competition with our existing third party distribution customers in some segments, which could affect our relationship with these customers.
To the extent that the net proceeds from this offering, cash generated internally and cash available under our revolving credit facility are not sufficient to fund our global direct distribution strategy, we may require additional debt and/or equity financing. If we are unable to access additional capital on terms acceptable to us, we may not be able to fully implement our global direct distribution strategy, which may limit the future growth and development of our business. In addition, equity financings could result in dilution to our stockholders, and equity or debt securities issued in future financings may have rights, preferences and privileges that are senior to those of our common stock. If our need for capital arises because of significant losses, the occurrence of these losses may make it more difficult for us to raise the necessary capital.
Our business strategies require substantial capital and long-term investments, which we may be unable to fund as a result of capital markets conditions and contractual limitations on our ability to incur indebtedness.
Our business strategies will require substantial additional capital investment following this offering, including, for example, our strategy of creating a global direct distribution business,
33
Table of Contents
which we intend to finance using a portion of the net proceeds of this offering. To the extent that the net proceeds from this offering, cash generated internally and cash available under our revolving credit facility are not sufficient to fund our capital requirements, we will require additional debt and/or equity financing. However, this type of financing may not be available or, if available, may not be available on satisfactory terms, including as a result of adverse macroeconomic conditions. Our parent company, JBS S.A., has invested over $1.4 billion in equity capital in us since the Swift Acquisition in 2007. In addition, since July 11, 2007, we have invested $259.9 million in our U.S. and Australian manufacturing operations, excluding the JBS Packerland and Tasman Acquisitions. Our parent company may not agree to provide us with additional financing in the future. Our parent company is a public company in Brazil and may in the future have interests that conflict or compete with ours. In addition, we are limited in our ability to incur indebtedness in certain circumstances under the terms of our outstanding indebtedness under our senior secured revolving credit facility, the indenture governing our 11.625% senior unsecured notes issued by us earlier this year and the indentures governing the 10.50% senior notes due 2016 in an aggregate principal amount of $300.0 million issued by JBS S.A. in 2006.
We may be unable to obtain sufficient additional capital in the future to fund our capital requirements and our business strategy at acceptable costs. If we are unable to access additional capital on terms acceptable to us, we may not be able to fully implement our business strategy, which may limit the future growth and development of our business. In addition, equity financings could result in dilution to our stockholders, and equity or debt securities issued in future financings may have rights, preferences and privileges that are senior to those of our common stock. If our need for capital arises because of significant losses, the occurrence of these losses may make it more difficult for us to raise the necessary capital. In addition, we are limited in our ability to incur indebtedness in certain circumstances under the terms of our outstanding indebtedness under our senior secured revolving credit facility, the indenture governing our 11.625% senior unsecured notes due 2014 and the indenture governing JBS S.A.’s 10.50% senior notes due 2016, which we guarantee. Availability under our senior secured revolving credit facility is subject to a borrowing base which is based on percentages of certain of our domestic wholly owned subsidiaries’ assets (other than Five Rivers), less certain eligibility and availability reserves. As of September 27, 2009, our borrowing base totaled $306.9 million. The indentures governing our 11.625% senior unsecured notes due 2014 and JBS S.A.’s 10.50% senior notes due 2016 also contain debt covenants that, subject to limited baskets, restrict JBS S.A. and its subsidiaries (including us and our subsidiaries) from incurring indebtedness unless JBS S.A.’s leverage ratio is less than 4.75:1.0. In the event that the consolidated financial results of JBS S.A. are not sufficient to meet this ratio, we and our subsidiaries would not be permitted to incur any additional indebtedness, subject to the limited baskets in these indentures. Furthermore, our consolidated leverage, and therefore the consolidated leverage of JBS S.A., will increase due to indebtedness incurred on the closing date of the Proposed PPC Acquisition because PPC is expected to emerge from bankruptcy with approximately $1.4 billion in secured indebtedness on a consolidated basis. This indebtedness will increase the consolidated leverage of JBS S.A., which may restrict the amount of additional indebtedness that JBS S.A. and its subsidiaries (including us and our subsidiaries) may incur under the 4.75:1.0 leverage ratio. See “Management’s discussions and analysis of financial condition and results of operations—Liquidity and capital resources—External sources of liquidity and description of indebtedness” and “—Covenant compliance,” and “Risk factors—Risks relating to the reorganized PPC’s business and the chicken industry—The reorganized PPC will have significant leverage upon entering into an exit facility as contemplated by the Plan, which may adversely affect its future financial and operating flexibility” and
34
Table of Contents
“—Restrictive covenants in the Exit Facility may adversely affect the reorganized PPC’s business activities and operations.”
Implementation of any of our strategies depends on factors that are beyond our control, such as changes in the conditions of the markets in which we operate, actions taken by our competitors, or existing laws and regulations at any time by U.S. federal government or by any other state, local or national government. Our failure to successfully implement any part of our strategy may materially adversely impact our business, financial condition and results of operations.
We may not be able to successfully integrate any growth opportunities we may undertake in the future.
We intend to pursue selected growth opportunities in the future as they arise. These types of opportunities may expose us to successor liability relating to actions involving any acquired entities, their respective management or contingent liabilities incurred prior to our involvement. A material liability associated with these types of opportunities, or our failure to successfully integrate any acquired entities into our business, could adversely affect our reputation and have a material adverse effect on us.
Assumption of unknown liabilities in acquisitions may harm our financial condition and operating results. If we make acquisitions in the future, such transactions may be structured in such a manner that would result in the assumption of unknown liabilities not disclosed by the seller or uncovered during pre- acquisition due diligence. These obligations and liabilities could harm our financial condition and operating results.
We may not be able to successfully integrate any growth opportunities we may undertake in the future or successfully implement appropriate operational, financial and administrative systems and controls to achieve the benefits that we expect to result therefrom. These risks include: (1) failure of the acquired entities to achieve expected results, (2) possible inability to retain or hire key personnel of the acquired entities and (3) possible inability to achieve expected synergies and/or economies of scale. In addition, the process of integrating businesses could cause interruption of, or loss of momentum in, the activities of our existing business. The diversion of our management’s attention and any delays or difficulties encountered in connection with the integration of these businesses could negatively impact our business, results of operations, prospects and the market price of our common stock.
We face competition in our business, which may adversely affect our market share and profitability.
The beef and pork industries are highly competitive. Competition exists both in the purchase of live cattle and hogs and in the sale of beef and pork products. In addition, our beef and pork products compete with a number of other protein sources, including poultry and fish. We compete with numerous beef producers, including companies based in the United States (Tyson Foods Inc., National Beef Packing Company, LLC and Cargill Inc.) and in Australia (Teys Bros Pty Ltd. and Nippon Meat Packers Ltd.), as well as pork producers (Smithfield Foods, Inc., Tyson Foods Inc. and Cargill Inc.). The principal competitive factors in the beef and pork processing industries are operating efficiency, the availability, quality and cost of raw materials, labor, price, quality, food safety, product distribution, technological innovations and brand loyalty. Our ability to be an effective competitor depends on our ability to compete on the basis of these characteristics. Some of our competitors have greater financial and other resources and enjoy wider recognition
35
Table of Contents
for their consumer branded products. We may be unable to compete effectively with these companies, and if we are unable to remain competitive with these beef and pork producers in the future, our market share may be adversely affected.
Changes in consumer preferences could adversely affect our business.
The food industry, in general, is subject to changing consumer trends, demands and preferences. Our products compete with other protein sources, including poultry and fish. Trends within the food industry frequently change, and our failure to anticipate, identify or react to changes in these trends could lead to reduced demand and prices for our products, among other concerns, and could have a material adverse effect on our business, financial condition, results of operations and market price of our common stock.
Our business could be materially adversely affected as a result of adverse weather conditions or other unanticipated extreme events in our areas of operations.
Changes in the historical climate in the areas in which we operate could have a material adverse effect on our business. For instance, the timing of delivery to market and availability of livestock for our grass fed division in Australia is dependent on access to range lands and paddocks which can be negatively impacted by periods of extended drought. In addition, our cattle feeding operations in Australia and meat packing facilities in the U.S. and Australia rely on large volumes of potable water for the raising of healthy livestock and the fabrication of our meat products. Potable water is generally available from municipal supplies and/or naturally replenished aquifers, the access to which and availability of which could be affected in the event rainfall patterns change, aquifers become depleted or contaminated and municipal supplies are not maintained. While we own substantial water rights, occurrences of any of these events, or inability to enforce existing or secure additional water rights in the future, could have a material adverse effect on our business, financial condition, results of operations and cash flows.
Natural disasters, fire, bioterrorism, pandemics or extreme weather, including floods, excessive cold or heat, hurricanes or other storms, could impair the health or growth of livestock or interfere with our operations due to power outages, fuel shortages, damage to our production and processing facilities or disruption of transportation channels, among other things. Any of these factors, as well as disruptions in our information systems, could have an adverse effect on our financial results.
Our performance depends on favorable labor relations with our employees and our compliance with labor laws. Any deterioration of those relations or increase in labor costs due to our compliance with labor laws could adversely affect our business.
As of September 27, 2009 we had a total of approximately 31,700 employees worldwide. A majority of these employees are represented by labor organizations, and our relationships with these employees are governed by collective bargaining agreements. In the U.S., we have eight collective bargaining or other labor agreements expiring in 2009 and 2010, covering approximately 17,555 employees. In Australia, we have 20 collective bargaining or other collective labor agreements, 14 of which expire between 2010 and 2014. Upon the expiration of existing collective bargaining agreements or other collective labor agreements, we may not reach new agreements without union action, and any such new agreements may not be on terms satisfactory to us, which could result in higher wages or benefits paid to union workers. In addition, any new agreements may be for shorter durations than those of our historical
36
Table of Contents
agreements. Moreover, additional groups of currently non-unionized employees may seek union representation in the future. If we are unable to negotiate acceptable collective bargaining agreements, we may become subject to union-initiated work stoppages, including strikes.
Additionally, the Employee Free Choice Act was reintroduced in the U.S. Congress in March 2009. If enacted in its most recent form, the Employee Free Choice Act could make it significantly easier for union organizing drives to be successful. The Employee Free Choice Act could also give third-party arbitrators the ability to impose terms, which may be harmful to us, of collective bargaining agreements if the relevant company and union are unable to agree to the terms of a collective bargaining agreement. Any significant increase in labor costs, deterioration of employee relations, slowdowns or work stoppages at any of our locations, whether due to union activities, employee turnover or otherwise, could have a material adverse effect on our business, financial condition, results of operations and cash flows.
Our efforts to comply with immigration laws, the introduction of new immigration legislation, or increased immigration enforcement efforts could increase our labor costs and other costs of doing business, exacerbate potential labor shortages or otherwise disrupt our operations, and expose us to civil and possibly criminal penalties.
Immigration reform continues to attract significant attention in the public arena and the U.S. Congress. If new federal immigration legislation is enacted or if states in which we do business enact immigration laws, such laws may contain provisions that could make it more difficult or costly for us to hire United States citizens and/or legal immigrant workers. In such a case, we may incur additional labor costs and other costs of doing business which could have a material adverse effect on our business, operating results and financial condition.
In addition, despite our efforts to hire only United States citizens and/or persons legally authorized to work in the United States, we are unable to ensure that all of our employees are United States citizens and/or persons legally authorized to work in the United States. On December 12, 2006, at which time we were under our previous private equity ownership, agents from the U.S. Department of Homeland Security’s Immigration and Customs Enforcement division, or ICE, and other law enforcement agencies conducted on-site employee interviews at all of our production facilities except with respect to our production facilities located in Louisville, Kentucky and Santa Fe Springs, California, in connection with an investigation of the immigration status of an unspecified number of our workers. Approximately 1,300 individuals were detained by ICE and removed from our U.S. domestic labor force. To date, no civil or criminal charges have been filed by the U.S. government against us or any of our current or former management employees. On December 12, 2006, after a six- to seven-hour suspension of operations due to the employee interview process, we resumed production at all facilities in the United States, but at reduced output levels. We refer to this event in this prospectus as either the ICE incident or the ICE event. We estimate that the labor shortages and related disruptions to our operations as a result of the ICE event resulted in additional costs of approximately $82 million, as well as reduced revenues at the affected facilities, as lower levels of experienced staffing resulted in lower volumes of beef that met processing specifications. We resumed normal production at our pork processing facilities in March 2007 and reported in May 2007 that we had returned to standard staffing levels at all of our beef processing facilities. While we have enhanced our previous hiring and legal compliance practices to mitigate this risk, we may face similar disruptions in the future at our U.S. facilities, our enhanced hiring practices may expose us to an increased risk of lawsuits related to such practices, and our labor costs may be negatively affected as a result.
37
Table of Contents
The consolidation of our customers could negatively impact our business.
Our customers, such as supermarkets, warehouse clubs and food distributors, have consolidated in recent years, and consolidation is expected to continue throughout the United States and in other major markets. These consolidations have produced large, sophisticated customers with increased buying power who are more capable of operating with reduced inventories, opposing price increases, and demanding lower pricing, increased promotional programs and specifically tailored products. These customers also may use shelf space currently used for our products for their own private label products. If we fail to respond to these trends, our volume growth could slow or we may need to lower prices or increase promotional spending for our products, any of which would adversely affect our financial results.
We are dependent on certain key members of our management.
Our operations, particularly in connection with the implementation of our strategies and the development of our operations, depend on certain key members of our management. In addition, certain members of our management hold management positions with JBS S.A. For example, our chief executive officer, Mr. Wesley Mendonça Batista, currently serves as the interim executive director of operations at JBS S.A. and is the vice president of its board of directors. Mr. José Batista Júnior is currently a director of JBS USA, LLC and JBS S.A. While Mr. Wesley Mendonça Batista devotes the majority of his time to our management, there can be no assurances that he will not be required to devote more of his time as a director or interim executive director of operations at JBS S.A. If any of these key management personnel leaves us or devotes a significant amount of their time to JBS S.A., our results of operations and our financial condition may be adversely affected.
Our debt could adversely affect our business.
As of September 27, 2009, we have total outstanding consolidated debt on our balance sheet of $822.4 million before giving effect to the Proposed PPC Acquisition. The Proposed PPC Acquisition will further increase our leverage because PPC is expected to emerge from bankruptcy with approximately $1.4 billion in secured indebtedness on a consolidated basis. See “Management’s discussion and analysis of financial condition and results of operations—Liquidity and capital resources—Financing related to the Proposed PPC Acquisition.”
Our consolidated debt could:
| • | make it difficult for us to satisfy our respective obligations; |
| • | limit our ability to obtain additional financing to operate our business; |
| • | require us to dedicate a substantial portion of our cash flow to payments on our debt, reducing our ability to use our cash flow to fund working capital, capital expenditures and other general corporate requirements; |
| • | limit our flexibility to plan for and react to changes in our business and the industry in which we operate; |
| • | place us at a competitive disadvantage relative to some of our competitors that have less debt than us; and |
| • | increase our vulnerability to general adverse economic and industry conditions, including changes in interest rates, lower cattle and hog prices or a downturn in our business or the economy. |
38
Table of Contents
In addition to our existing debt, we are not prohibited from incurring significantly more debt, which could intensify the risks described above. The terms of the indenture governing our 11.625% senior unsecured notes due 2014 permit us to incur significant additional indebtedness in the future, including secured debt. We may borrow additional funds to fund our capital expenditures, working capital needs or other purposes, including future acquisitions.
Risks relating to the Proposed PPC Acquisition
PPC may not be able to satisfy or waive certain closing conditions contained in the stock purchase agreement, which may prevent or delay consummation of the Proposed PPC Acquisition.
The successful consummation of the Proposed PPC Acquisition is conditioned upon the satisfaction or waiver of certain closing conditions set forth in the stock purchase agreement, which include, in addition to certain customary closing conditions, the satisfaction or waiver of the conditions precedent in respect of the Exit Facility among the reorganized PPC and certain of its subsidiaries, as borrowers, and the reorganized PPC’s access to funding thereunder. We cannot predict whether these conditions will be satisfied or waived. If for any reason these conditions are not satisfied or waived, PPC will not be able to meet a condition precedent for confirmation of the Plan which could result in a failure of the Proposed PPC Acquisition.
We may not be able to fully realize all of the anticipated synergies from the Proposed PPC Acquisition.
While we believe our management and that of our parent company have significant experience in acquiring and successfully integrating companies, resulting in production and operating synergies, we may not be able to fully realize all of the anticipated synergies from the Proposed PPC Acquisition. The ability to realize the anticipated benefits of the acquisition will depend, to a large extent, on our ability to successfully integrate the businesses of the reorganized PPC with ours. The integration of two independent businesses is a complex, costly and time-consuming process. In addition, we will be integrating a business that is different from the businesses we currently operate in several respects, including the following: the lifecycles of the animals, price dynamics, margins, and volumes. As a result, we will be required to devote significant management attention and resources to integrating our business practices and operations with the reorganized PPC. The integration process and realization of anticipated benefits will be even more challenging for so long as the reorganized PPC remains an independent, publicly-traded entity. The integration process may disrupt the business of either or both of us or PPC and, if implemented ineffectively, would preclude realization of the full benefits we expect to realize. The failure to meet the challenges involved in integrating successfully the operations of the reorganized PPC with ours or otherwise to realize the anticipated benefits of the transaction could cause an interruption of, or a loss of momentum in, activities of ours and the reorganized PPC’s existing businesses and could seriously harm our results of operations. In addition, the overall integration may result in unanticipated problems, expenses, liabilities, competitive responses, loss of customer and supplier relationships, and diversion of management’s attention, and may cause the reorganized PPC’s common stock price to decline. The challenges we face in integrating the operations of PPC with ours include, among others:
| • | consolidating corporate and administrative infrastructures and eliminating duplicative operations; |
39
Table of Contents
| • | maintaining employee morale and retaining and hiring key personnel; |
| • | minimizing the diversion of management’s attention from ongoing business concerns; |
| • | coordinating geographically separate organizations; |
| • | addressing unanticipated issues in integrating information technology, communications and other systems; and |
| • | managing tax costs or inefficiencies associated with integrating operations. |
In addition, even if the operations of the reorganized PPC are integrated successfully with ours, we may not realize the full benefits of the transaction, including synergies, cost savings or sales or growth opportunities. These benefits may not be achieved within the anticipated timeframe, or at all. As a result, while we expect and believe that the Proposed PPC Acquisition will result in substantial benefits from the synergies outlined above, we cannot ensure or make any affirmative guarantee that these results will be fully realized.
Risks relating to the reorganized PPC’s business and the chicken industry
The reorganized PPC will have significant leverage upon entering into the Exit Facility as contemplated by the Plan, which may adversely affect its future financial and operating flexibility.
The reorganized PPC will have substantial indebtedness, which could adversely affect its financial condition. On the closing date of the Proposed PPC Acquisition, or the Proposed PPC Acquisition Closing Date, after giving effect to the transactions contemplated by the Plan, PPC expects, on a consolidated basis, to have approximately $1.4 billion in secured indebtedness and the ability to borrow an additional approximately $0.3 billion under the Exit Facility. Significant amounts of cash flow will be necessary to make payments of interest and repay the principal amount of such indebtedness.
The reorganized PPC’s ability to make payments on and to refinance its debt, including the Exit Facility, will depend on its ability to generate cash in the future. This, to a certain extent, is dependent on various business factors (including, among others, the commodity prices of feed ingredients and chicken) and general economic, financial, competitive, legislative, regulatory, and other factors that are beyond its and our control.
The reorganized PPC may be unable to generate sufficient cash flow from operations and future borrowings may not be available under credit facilities in an amount sufficient to enable the reorganized PPC to pay its debt obligations, including its obligations under the Exit Facility, or to fund its other liquidity needs. The reorganized PPC may need to refinance all or a portion of its debt on or before maturity. The reorganized PPC may be unable to refinance any of its debt on commercially reasonable terms or at all.
Restrictive covenants in the Exit Facility may adversely affect the reorganized PPC’s business activities and operations.
The Exit Facility will contain various covenants that may adversely affect the reorganized PPC’s ability to, among other things, incur additional indebtedness, incur liens, pay dividends or make certain restricted payments, consummate certain asset sales, enter into certain transactions with us and PPC’s other affiliates, merge, consolidate and/or sell or dispose of all or substantially all of its assets. In addition, the Exit Facility will likely require the reorganized PPC and certain of its
40
Table of Contents
subsidiaries to maintain certain financial ratios and meet certain tests, including leverage and fixed charge coverage ratios. Covenants in the Exit Facility will also require the reorganized PPC to use a portion of its cash flow and the proceeds it receives from certain asset sales and specified debt or equity issuances and upon the occurrence of other events to repay outstanding borrowings under the Exit Facility. These restrictions could limit PPC’s ability to plan for or react to market conditions or to meet extraordinary capital needs or otherwise could restrict its activities. In addition, these restrictions could also adversely affect its ability to finance its future operations or capital needs or to engage in other business activities that would be in its interest. The Exit Facility will be secured by substantially all of the assets of the reorganized PPC.
We cannot assure you that the reorganized PPC and certain of its subsidiaries will be able to comply with the provisions of the respective debt instruments, including, without limitation, the covenants in the Exit Facility.
The liabilities of our consolidated company following the reorganized PPC’s emergence from bankruptcy proceedings could materially exceed our and PPC’s estimates.
Under the PPC amended joint plan of reorganization, all allowed claims filed against PPC are unimpaired (except for the interests of PPC’s pre-bankruptcy equity holders) and must be paid in full in their allowed amount. The estimated amount of allowed administrative (other than ordinary course claims), priority and general unsecured claims against PPC that will be paid in full pursuant to the amended joint plan of reorganization is approximately $250 million (including $180 million of general unsecured claims and $35 million of priority non-tax claims), not including professional compensation and reimbursement claims, payment of PPC’s outstanding notes, intercompany claims, flow-through claims and certain other de minimis claims. PPC has recorded a liability for this amount on its balance sheet based on its judgment as to the aggregate amount of the allowed claims and the amounts for which it believes it can settle any disputed claims. However, the aggregate amounts claimed by unsecured creditors in the proofs of claim filed by holders of disputed claims are significantly higher than PPC’s estimate of allowed claims, and PPC may be unable to settle these disputed claims for its lower estimate. For example, the aggregate amount of allowed general unsecured claims would exceed PPC’s $180 million estimate. Any disputed claim that is ultimately allowed will be a liability of our consolidated company following PPC’s emergence from bankruptcy, as any such claim must be paid in full pursuant to PPC’s amended joint plan of reorganization.
In many instances, the final amount of allowed claims will not be determined prior to the Proposed PPC Acquisition Closing Date, and a number of important steps will occur after that date, including the following:
| • | The deadline for filing requests for payment of administrative expense claims is generally 60 days following the Proposed PPC Acquisition Closing Date, and the reorganized PPC will have 30 days after that date in which it may file an objection to a claim. |
| • | For claims other than administrative expense claims, the reorganized PPC will have at least 150 days in which it may file an objection to a claim before any such objection is adjudicated and the claim becomes an allowed claim. |
| • | An estimated 200 personal injury lawsuits have been filed against PPC and its affiliates relating to pre-petition injuries, and PPC estimates that there may be more than 700 other personal injury claims with respect to which no lawsuits have yet been commenced. As of September 4, 2009, 63 of these claims had been resolved through the alternative dispute resolution mechanisms described in the amended joint plan of reorganization. Although the amount |
41
Table of Contents
estimated to be necessary to resolve the remaining claims is included in the $180 million total estimate of allowed general unsecured claims, that amount could ultimately prove to be higher than the estimate and will not be known for some time after the Proposed PPC Acquisition Closing Date. |
In addition, PPC exercised its rights in bankruptcy to reject certain executory contracts and unexpired leases, including contracts with chicken growers. Such rejection damage claims will not be fully determined prior to the Proposed PPC Acquisition, and PPC may need to engage in litigation to resolve these claims for damages. The allowed amount of such rejection damages claims, as ultimately agreed among the parties or determination by the bankruptcy court, will constitute general unsecured claims that must be paid in full pursuant to PPC’s amended joint plan of reorganization. Additionally, for contracts that the reorganized PPC will assume, the reorganized PPC will be required to pay amounts necessary to cure outstanding defaults under the contracts. Any such rejection damages claims (in the case of rejected contracts) or cure amounts (in the case of assumed contracts) may prove to be greater than PPC currently anticipates.
For all these reasons, the liabilities of our consolidated company may exceed the estimated claims reflected in the amended joint plan of reorganization and may not be resolved for some time following the Proposed PPC Acquisition Closing Date. Any claims or costs that materially exceed our and PPC’s estimates could adversely affect our consolidated results of operations, financial condition and cash flows.
The bankruptcy proceedings may have negatively affected the businesses of PPC, including its relationships with customers, suppliers and vendors, which could adversely impact the reorganized PPC’s future financial and operating results.
Due to the disruptions in PPC’s businesses as a result of the initiation of bankruptcy proceedings, certain of PPC’s relationships with customers, suppliers and vendors may have been adversely affected and/or terminated. Customers, suppliers or vendors may have entered into alternate relationships with other counterparties or modified their relationship with PPC due to performance issues or concerns. Certain customers, suppliers and vendors currently hold or previously held outstanding or settled claims totaling $355.7 million in connection with the bankruptcy proceedings. The effect of the bankruptcy process and the resolution of such claims against PPC (including the confirmation of the amended joint plan of reorganization) may have adversely affected or may in the future adversely affect the relationships between such parties and PPC. In addition, the risks and uncertainties associated with the bankruptcy proceedings may be used by competitors with respect to its existing customers or may discourage future customers from purchasing products under long-term arrangements. Changes in relationships with customers, suppliers and vendors could have a material adverse effect on the reorganized PPC’s financial and operating results. PPC has not completed its review of the claims. PPC’s most recent listing of claims may reflect claim amounts that have since been amended, are duplicate in nature, and/or do not agree with PPC’s books and records. Some of the claims may also have since been resolved. PPC intends to continue to review and object to claims in accordance with the claims objections procedures authorized by the bankruptcy court.
42
Table of Contents
Industry cyclicality can affect the earnings of the reorganized PPC, especially due to fluctuations in commodity prices of feed ingredients and chicken.
Profitability in the chicken industry is materially affected by the commodity prices of feed ingredients and chicken, which are determined by supply and demand factors. As a result, the chicken industry is subject to cyclical earnings fluctuations.
The production of feed ingredients is positively or negatively affected primarily by the global level of supply inventories and demand for feed ingredients, the agricultural policies of the United States and foreign governments and weather patterns throughout the world. In particular, weather patterns often change agricultural conditions in an unpredictable manner. A significant change in weather patterns could affect supplies of feed ingredients, as well as both the industry’s and the reorganized PPC’s ability to obtain feed ingredients, grow chickens or deliver products.
The cost of corn and soybean meal, PPC’s primary feed ingredients, increased significantly from August 2006 to July 2008, before moderating in 2009, and the price of corn or soybean meal could significantly rise again as a result of, among other things, increasing demand for these products around the world and alternative uses of these products, such as ethanol and biodiesel production. High feed ingredient prices may have a material adverse effect on the reorganized PPC’s operating results which may result in additional non-cash expenses due to impairment of the carrying amounts of certain of its assets. PPC periodically seeks, to the extent available, to enter into advance purchase commitments or financial derivative contracts or advance purchase commitments for the purchase of feed ingredients in an effort to manage its feed ingredient costs. As of September 26, 2009, PPC had no outstanding financial derivative contracts but was party to advance purchase commitments for the purchase of corn and soybean meal totaling $71.4 million. However, the use of such instruments and techniques may not be successful.
Outbreaks of livestock diseases in general and chicken diseases in particular, including avian influenza, may significantly affect the reorganized PPC’s ability to conduct its operations and demand for its products.
Events beyond PPC’s control, such as the outbreaks of disease, either in its own flocks or elsewhere, could significantly affect demand for its products or its ability to conduct its operations. Furthermore, an outbreak of disease could result in governmental restrictions on the import and export of the reorganized PPC’s fresh chicken or other products to or from its suppliers, facilities or customers, or require it to destroy one or more of its flocks. This could also result in the cancellation of orders by the reorganized PPC’s customers and create adverse publicity that may have a material adverse effect on its ability to market its products successfully and on the business, reputation and prospects of the reorganized PPC.
During the first half of 2006, there was substantial publicity regarding a highly pathogenic strain of avian influenza, known as H5N1, which has been affecting Asia since 2002 and which has also been found in Europe and Africa. Worldwide fears about avian disease, such as avian influenza, could adversely impact the reorganized PPC’s sales. It is widely believed that H5N1 is spread by migratory birds, such as ducks and geese. There have also been some cases where H5N1 is believed to have passed from birds to humans as humans came into contact with live birds that were infected with the disease.
Although the highly pathogenic H5N1 has not been identified in North America, there have been outbreaks of low pathogenic strains of avian influenza in North America, and in Mexico
43
Table of Contents
outbreaks of both high and low-pathogenic strains of avian influenza are a fairly common occurrence. Even if the highly pathogenic H5N1 strain does not spread to North or Central America, there could be a material adverse effect on demand for North or Central American-produced chicken internationally and/or domestically, and, if it were to spread to North or Central America, there would likely be a significant effect on the ability of the reorganized PPC to conduct its operations and/or on demand for its products, in each case in a manner having a material adverse effect on the business, reputation and/or prospects of the reorganized PPC.
If the reorganized PPC’s chicken products become contaminated, it may be subject to product liability claims and product recalls.
Chicken products may be subject to contamination by disease-producing organisms, or pathogens, such as Listeria monocytogenes, Salmonella and generic E. coli. These pathogens are generally found in the environment, and, as a result, there is a risk that they, as a result of food processing, could be present in the reorganized PPC’s prepared chicken products. These pathogens can also be introduced as a result of improper handling at the further processing, foodservice or consumer level. These risks may be controlled, although not eliminated, by adherence to good manufacturing practices and finished product testing. The reorganized PPC will have little, if any, control over proper handling once the product has been shipped. Illness and death may result if the pathogens are not eliminated at the further processing, foodservice or consumer level. Even an inadvertent shipment of contaminated products is a violation of law and may lead to increased risk of exposure to product liability claims, product recalls and increased scrutiny by federal and state regulatory agencies and may have a material adverse effect on the business, reputation and prospects of the reorganized PPC.
In October 2002, one product sample produced in the PPC’s Franconia, Pennsylvania facility that had not been shipped to customers tested positive for Listeria. PPC later received information from the USDA suggesting environmental samples taken at the facility had tested positive for both the strain of Listeria identified in the product and a strain having characteristics similar to those of the strain identified in a Northeastern Listeria outbreak. As a result, PPC voluntarily recalled all cooked deli products produced at the plant from May 1, 2002 through October 11, 2002. The total cost of this recall was approximately $100 million. PPC was able to collect approximately $50 million from insurance coverage in connection with this recall.
Product liability claims or product recalls can adversely affect the business reputation of the reorganized PPC and expose it to increased scrutiny by federal and state regulators.
The packaging, marketing and distribution of food products entail an inherent risk of product liability and product recall and the resultant adverse publicity. The reorganized PPC may be subject to significant liability if the consumption of any of its products causes injury, illness or death. The reorganized PPC could be required to recall certain of its products in the event of contamination or damage to the products. In addition to the risks of product liability or product recall due to deficiencies caused by the production or processing operations of the reorganized PPC, the same risks may occur if any third party tampers with its products. There can be no assurance that the reorganized PPC will not be required to perform product recalls, or that product liability claims will not be asserted against them, in the future. Any claims that may be made may create adverse publicity that would have a material adverse effect on the ability of the reorganized PPC to market its products successfully or on its business, reputation, prospects, financial condition and results of operations.
44
Table of Contents
The reorganized PPC is exposed to risks relating to product liability, product recall, property damage and injuries to persons for which insurance coverage is expensive, limited and potentially inadequate.
The reorganized PPC’s business operations will entail a number of risks, including risks relating to product liability claims, product recalls, property damage and injuries to persons. PPC currently maintains insurance with respect to certain of these risks, including product liability insurance, property insurance, workers compensation insurance, business interruption insurance and general liability insurance, but in many cases such insurance is expensive, difficult to obtain and no assurance can be given that such insurance can be maintained by the reorganized PPC in the future on acceptable terms, or in sufficient amounts to protect the reorganized PPC against losses due to any such events, or at all. Moreover, even though the reorganized PPC’s insurance coverage may be designed to protect it from losses attributable to certain events, it may not adequately protect it from liability and expenses incurred in connection with such events. For example, the losses attributable to PPC’s October 2002 recall of cooked deli products produced at one of its facilities significantly exceeded available insurance coverage. The total cost of this recall was approximately $100 million. PPC was able to collect approximately $50 million from insurance coverage in connection with this recall. Additionally, in the past, two of PPC’s insurers encountered financial difficulties and were unable to fulfill their obligations under the insurance policies as anticipated and, separately, one of PPC’s other insurers contested coverage with respect to claims covered under policies purchased, forcing PPC to litigate the issue of coverage before it was able to collect under these policies.
Competition in the chicken industry with other vertically integrated chicken companies may make the reorganized PPC unable to compete successfully in these industries, which could adversely affect its business.
The chicken industry is highly competitive. In both the United States and Mexico, the reorganized PPC will primarily compete with other vertically integrated chicken companies. Competitive factors vary by major market. In the foodservice market, PPC believes competition is based primarily on consistent quality, product development, service and price. In the United States retail market, PPC believes that competition is based primarily on product quality, brand awareness, customer service and price. Further, there is some competition with non-vertically integrated further processors in the prepared chicken business.
In Mexico, where product differentiation has traditionally been limited, PPC believes product quality and price have been the most critical competitive factors. The North American Free Trade Agreement eliminated tariffs for chicken and chicken products sold to Mexico on January 1, 2003. However, in July 2003, the United States and Mexico entered into a safeguard agreement with regard to imports into Mexico of chicken leg quarters from the United States. Under this agreement, a tariff rate for chicken leg quarters of 98.8% of the sales price was established. On January 1, 2008, the tariff was eliminated. As a result of the elimination of this tariff, greater amounts of chicken have been imported into Mexico from the United States. Industry exports of ready-to-cook chicken into Mexico have increased to 818 million pounds, or 12.0% of all U.S. ready-to-cook chicken exports, in 2009 from 503 million pounds, or 9.4% of all U.S. ready-to-cook chicken exports, in 2005. These trends, should they continue to increase, could negatively affect the profitability of Mexican chicken producers located in the northern states of Mexico. Although we believe the impact on producers, such as PPC, located in the central states of Mexico should be less pronounced, there could be a broader negative impact on the Mexican chicken industry.
45
Table of Contents
The loss of one or more of the largest customers could adversely affect the business of the reorganized PPC.
In 2009, PPC’s two largest customers accounted for approximately 18% of its net sales, and PPC’s largest customer, Wal-Mart Stores Inc., accounted for 12% of its net sales. The initiation of bankruptcy proceedings by PPC and the associated risks and uncertainties may have affected PPC’s customers’ perception of its business and increased its risk of losing key customers. The reorganized PPC’s business could suffer significant setbacks in revenues and operating income if it lost one or more of its largest customers, or if its customers’ plans and/or markets were to change significantly.
The foreign operations of the reorganized PPC pose special risks to its business and operations.
The reorganized PPC will continue to have significant operations and assets located in Mexico and may participate in or acquire operations and assets in other foreign countries in the future. In addition to the general risks we highlight under “—Risks relating to our business and the beef and pork industries—Our export and international operations expose us to political and economic risks in foreign countries, as well as to risks related to currency fluctuations,” PPC’s foreign operations are subject to a number of special risks, including among others:
| • | exchange rate fluctuations of the Mexican peso and inflation or deflation in Mexico; |
| • | formal or informal trade barriers between Mexico and the United States; |
| • | exchange controls; |
| • | expropriation by the Mexican government; and |
| • | changes in Mexican laws and policies, including those governing foreign-owned operations. |
Currency exchange rate fluctuations have adversely affected PPC in the past. Exchange rate fluctuations or one or more other risks may have a material adverse effect on the business or operations of the reorganized PPC in the future.
The reorganized PPC’s operations in Mexico will be conducted through subsidiaries organized under the laws of Mexico. The reorganized PPC may rely in part on intercompany loans and distributions from its subsidiaries to meet obligations. Claims of creditors of subsidiaries, including trade creditors, will generally have priority as to the assets of the reorganized PPC’s subsidiaries over claims by the reorganized PPC. Additionally, the ability of the reorganized PPC’s Mexican subsidiaries to make payments and distributions to the reorganized PPC will be subject to, among other things, Mexican law. In the past, these laws have not had a material adverse effect on the ability of the Mexican subsidiaries to make these payments and distributions. However, laws such as these may have a material adverse effect on the ability of the reorganized PPC’s Mexican subsidiaries to make these payments and distributions in the future.
Disruptions in international markets and distribution channels could adversely affect the business of PPC.
Historically, PPC has targeted international markets to generate additional demand for its products. In particular, given U.S. customers’ general preference for white meat, it has targeted international markets for the sale of dark chicken meat, specifically leg quarters, which are a natural by-product of its U.S. operations’ concentration on prepared chicken products. As part of this initiative, PPC has created a significant international distribution network into several
46
Table of Contents
markets in Mexico, Eastern Europe (including Russia), and the Far East (including China). The success of the reorganized PPC in these markets may be, and the success of PPC in recent periods has been, adversely affected by disruptions in chicken export markets. For example, the United States poultry industry is currently engaged in an anti-dumping proceeding in Ukraine and an anti-dumping and countervailing duty proceeding in China that could materially adversely affect the reorganized PPC’s sales in these countries. A significant risk is disruption due to import restrictions and tariffs, other trade protection measures, and import or export licensing requirements. In addition, disruptions may be caused by outbreaks of disease such as avian influenza, either in the flocks of the reorganized PPC or elsewhere in the world, and resulting changes in consumer preferences. For example, the occurrence of avian influenza in Eastern Europe in October 2005 affected demand for poultry in Europe. One or more of these or other disruptions in the international markets and distribution channels could adversely affect the business of the reorganized PPC.
Existing regulation, the introduction of new laws and regulations, or changes in interpretation or enforcement of existing or new laws and regulations may materially affect the business or operations of the reorganized PPC.
The operations of the reorganized PPC will continue to be subject to federal, state and local governmental regulation, including in the health, safety and environmental areas. The reorganized PPC anticipates increased regulation by various agencies concerning food safety, the use of medication in feed formulations and the disposal of chicken by-products and wastewater discharges.
In addition, changes in laws or regulations or the application thereof may lead to government enforcement actions and the resulting litigation by private litigants. We are aware of an industry-wide investigation by the Wage and Hour Division of the United States Department of Labor to ascertain compliance with various wage and hour issues, including the compensation of employees for the time spent on such activities such as donning and doffing work equipment following a 2005 United States Supreme Court ruling. In IBP, Inc. v. Alvarez, employees sued their employer alleging that the employer violated the Fair Labor Standards Act, or FLSA, by not paying them for time spent walking to the worksite after donning required equipment. The federal district court and court of appeals ruled that the employer must compensate its employees for the disputed time. The Supreme Court unanimously ruled that donning required safety equipment qualified as a “principal activity” under the FLSA and therefore constituted the start of the workday for which employees must be compensated. PPC has been named a defendant in a number of similar suits brought by employees. PPC has reached a settlement with respect to one of the two principal lawsuits related to donning and doffing issues. The bankruptcy court has entered an order approving the settlement. PPC expects to finalize this settlement prior to the PPC Acquisition Closing Date. The other principal lawsuit relating to donning and doffing is in settlement negotiations, and certain smaller claims are in the process of being settled. As a result, PPC reduced its litigation reserves as of September 26, 2009 based on the terms of the settlements. These settlements are not expected to materially affect the financial position, operating results or cash flows of PPC. However, it is possible that the reorganized PPC may be subject to additional employee claims.
Unknown matters, new laws and regulations, or stricter interpretations of existing laws or regulations may materially affect the business or operations of the reorganized PPC in the future. The reorganized PPC’s business and operations will continue to be subject to extensive domestic and international government regulation.
47
Table of Contents
The reorganized PPC may face significant costs for compliance with existing or changing environmental requirements and for potential environmental obligations relating to current or discontinued operations.
A number of PPC facilities have been operating below capacity due to economic conditions, and upgrades at some facilities have been delayed or deferred because of the bankruptcy. Before production can be restored to pre-bankruptcy levels, capital expenditures estimated at $11.5 million may be necessary at some facilities for installation of new pollution control equipment in order to achieve compliance with existing or changing environmental requirements, including more stringent limitations imposed or expected in recently-renewed or soon-to be renewed environmental permits.
PPC in the past acquired businesses with operations such as pesticide and fertilizer production that involved greater use of hazardous materials and generation of more hazardous wastes than PPC’s current operations. While many of those operations have been sold or closed, some environmental laws impose strict and, in certain circumstances, joint and several liability for costs of investigation and remediation of contaminated sites on current and former owners and operators of the sites, and on persons who arranged for disposal of wastes at such sites. In addition, current owners or operators of such contaminated sites may seek to recover cleanup costs from PPC based on past operations or contractual indemnifications.
New environmental requirements, stricter interpretations of existing environmental requirements, or obligations related to the investigation or clean-up of contaminated sites, may materially affect the business or operations of the reorganized PPC in the future.
PPC’s performance depends on favorable labor relations with its employees and its compliance with labor laws. Any deterioration of those relations or increase in labor costs due to PPC’s compliance with labor laws could adversely affect its business.
As of September 26, 2009, PPC had approximately 36,600 employees in the United States and approximately 4,640 employees in Mexico. Approximately 10,370 of its employees at various facilities in the United States are members of collective bargaining units. In Mexico, approximately 2,600 of its employees are covered by collective bargaining agreements. Upon the expiration of existing collective bargaining agreements or other collective labor agreements, PPC may not reach new agreements without union action, and any such new agreements may not be on terms satisfactory to PPC, which could result in higher wages or benefits paid to union workers. In addition, any new agreements may be for shorter durations than those of PPC’s historical agreements. Moreover, additional groups of currently non-unionized employees may seek union representation in the future. If PPC is unable to negotiate acceptable collective bargaining agreements, it may become subject to union-initiated work stoppages, including strikes.
Since March 2009, PPC has been involved in negotiations with the unions representing its U.S. employees to modify certain terms of the collective bargaining agreements that PPC believes are necessary for its successful reorganization. PPC has successfully negotiated settlements with a majority of these unions, and these settlements were approved by the bankruptcy court on October 13, 2009. PPC has not yet reached a settlement with the International Brotherhood of Teamsters, or IBT, and negotiations are ongoing. Currently, approximately 254 employees are covered under three expired IBT collective bargaining agreements.
48
Table of Contents
PPC’s efforts to comply with immigration laws, the introduction of new immigration legislation or increased enforcement efforts could increase the reorganized PPC’s labor costs and other costs of doing business, exacerbate potential labor shortages or otherwise disrupt its operations, and expose it and us to civil and possibly criminal penalties.
Immigration reform continues to attract significant attention in the public arena and the United States Congress. If new federal immigration legislation is enacted or if states in which the reorganized PPC does business enact immigration laws, such laws may contain provisions that could make it more difficult or costly for the reorganized PPC to hire United States citizens and/ or legal immigrant workers. In such case, the reorganized PPC may incur additional costs to run its business or may have to change the way it conducts its operations, either of which could have a material adverse effect on the business, operating results and financial condition of the reorganized PPC. Also, despite PPC’s efforts to hire only United States citizens and/or persons legally authorized to work in the United States, the reorganized PPC may be unable to ensure that all of its employees are United States citizens and/or persons legally authorized to work in the United States. With PPC’s cooperation, the U.S. Department of Homeland Security’s Immigration and Customs Enforcement division, or ICE, arrested fewer than 30 PPC employees in 2007 and approximately 350 PPC employees in 2008 who did not have proper immigration documentation. In the future, further enforcement efforts by governmental authorities could occur, which could include civil or possibly criminal penalties, and the reorganized PPC could face disruptions in its workforce or its operations at one or more facilities, thereby negatively impacting the business of the reorganized PPC.
Loss of essential employees could have a significant negative impact on the reorganized PPC’s business.
The success of the reorganized PPC is largely dependent on the skills, experience, and efforts of its management and other employees. The deteriorating financial performance of PPC, along with the filing and continuation of the bankruptcy proceedings, creates uncertainty that may lead to an increase in unwanted attrition. The loss of the services of one or more members of the senior management of PPC or of numerous employees with essential skills could have a negative effect on the business, financial condition and results of operations of the reorganized PPC.
The change of control agreements between PPC and its executive officers and key employees could have a significant impact on the reorganized PPC’s business and may pose conflicts of interest.
The acquisition of a majority of the reorganized PPC common stock by us pursuant to the terms of the stock purchase agreement will constitute a change in control of the reorganized PPC under the terms of change in control agreements between PPC and its executive officers and certain of its key employees. Reorganized PPC has assumed 21 change in control agreements with certain of PPC’s executive officers and key employees that, upon the occurrence of specific events outlined below, could require reorganized PPC to make payments to such individuals that, in the aggregate, could constitute a material amount. In general, the change in control agreements provide that reorganized PPC pay each participant a percentage of his/her base salary, bonus, and benefits if that participant’s employment is terminated without cause within a specific period following a change in control event. Should reorganized PPC trigger the change in control payment obligation in case of termination without cause with respect to all 21 participants except Lonnie “Bo” Pilgrim, its total payment obligation would be approximately $33.0 million.
49
Table of Contents
In addition, executive officers and/or key employees of the reorganized PPC will have fiduciary duties to both reorganized PPC and us, and such interests may conflict or compete with one another from time to time until we exercise our option to exchange each share of reorganized PPC common stock for new shares of our common stock according to a specified exchange offer ratio. See “The Proposed PPC Acquisition—Conversion of reorganized PPC common stock into our common stock.”
Extreme weather or natural disasters could negatively impact the business of the reorganized PPC.
Extreme weather or natural disasters, including droughts, floods, excessive cold or heat, hurricanes or other storms, could impair the health or growth of the reorganized PPC’s flocks, production or availability of feed ingredients, or interfere with operations due to power outages, fuel shortages, damage to production and processing facilities or disruption of transportation channels, among other things. Any of these factors could have an adverse effect on the financial results of the reorganized PPC.
Risks related to our common stock and this offering
We are controlled by JBS S.A., which is a publicly traded company in Brazil, whose interest in our business may be different than yours.
We are a wholly owned indirect subsidiary of JBS S.A., a publicly traded company in Brazil. JBS S.A. will indirectly own approximately % of our outstanding common stock after the consummation of this offering and assuming that all the exchangeable debentures are exchanged into our common stock (or % if the underwriters exercise their over-allotment option in full and assuming that all of the exchangeable debentures are exchanged into our common stock). The Batista family indirectly owns and controls approximately 50.1% of the voting equity capital of JBS S.A. Prior to this offering, all of our directors and our president and chief executive officer were members of the Batista family. Members of the Batista family are also officers of JBS S.A. Accordingly, JBS S.A. is, and will continue to be, able to exercise significant influence over our business policies and affairs, including the composition of our board of directors, which has the authority to direct our business and appoint and remove our officers, and over any action requiring the approval of our stockholders, including the adoption of amendments to our certificate of incorporation and bylaws, which govern the rights attached to our shares of common stock, and the approval of mergers or sales of substantially all of our assets. JBS S.A. is a public company in Brazil, and, therefore, its directors have their own independent fiduciary duties, and their interests may conflict or compete with those of our company.
JBS S.A. and its subsidiaries comprise the largest exporter of canned beef in the world. With respect to business opportunities relating to customers or markets which would otherwise be available to both us and JBS S.A.’s other subsidiaries, JBS S.A. may not permit us to pursue those opportunities or JBS S.A.’s other subsidiaries may directly compete with us for those opportunities. For example, in January 2007, JBS S.A. acquired SB Holdings and its subsidiaries, which comprise one of the largest distributors of processed beef in the United States. This acquisition provided JBS S.A. (and not us) with access to the processed beef market in the United States through two distribution centers located in Fort Lauderdale, Florida and Newport Beach, California. We believe that our U.S. export operations of fresh beef today do not directly compete with our parent company’s Brazilian and Argentine export operations of fresh beef in
50
Table of Contents
our main export destinations. Consequently, we do not have formal arrangements with JBS S.A. to coordinate our exports in our export markets. However, to the extent that sanitary restrictions change in the future, we could become direct competitors of our parent company in certain export markets.
In addition, we do compete with JBS S.A. to a limited degree, for example, to the extent that our Australian operations export to markets in the European Union, the Middle East and Southeast Asia, to which JBS S.A. also exports. JBS S.A. had sales of beef products to the European Union, the Middle East and Southeast Asia of approximately $401.5 million, $129.6 million and $5.4 million, respectively, for the thirty-nine weeks ended September 27, 2009. Our Australian subsidiaries had sales of beef products of approximately $18.2 million and $52.8 million to the European Union and Southeast Asia, respectively, for the thirty-nine weeks ended September 27, 2009. Our Australian subsidiaries did not sell any beef products to the Middle East for the thirty-nine weeks ended September 27, 2009. If JBS S.A. materially increases its exports of products to these markets, or if it begins to commence material exports into other markets to which we export, our results of operations could be adversely affected.
The concentration of ownership of our shares may also delay, defer or even prevent an acquisition by a third party or other change of control of our company in a transaction that might otherwise give you the opportunity to realize a premium over the then-prevailing market price of our common stock, even if you perceive such transaction to be in the best interests of minority stockholders. This concentration of ownership may also adversely affect our stock price. For additional information regarding the share ownership of, and our relationship with, JBS S.A., you should read the information under the headings “Business—Description of business segments—Beef segment—Global exports,” “Principal and selling stockholder” and “Certain relationships and related party transactions.”
As a result of the BNDESPAR transaction, BNDESPAR, whose interest in our business may be different from yours, will have veto rights over certain key corporate decisions, among other rights.
Upon completion of the mandatory exchange of debentures for shares of our common stock as a result of the BNDESPAR transaction, BNDESPAR may own up to % of our outstanding common stock, based on the midpoint of the estimated price range of our common stock in this offering and an estimated offering size of $ . In connection with the BNDESPAR transaction, JBS S.A. and BNDESPAR have entered into a shareholders’ agreement pursuant to which JBS S.A. has granted to BNDESPAR the right to veto certain key corporate decisions that we may take, including:
| • | the incurrence of indebtedness over certain limits; |
| • | payment of dividends or interest over certain limits; |
| • | effecting certain capital reductions; |
| • | engaging in corporate transformations, mergers, spin-offs or certain other corporate transactions; |
| • | engaging in related party transactions above certain amounts; |
| • | adopting an annual budget that implies the incurrence of indebtedness over certain limits; |
51
Table of Contents
| • | deregistering our shares of common stock under the Securities Exchange Act of 1934, as amended; |
| • | creating any additional class of shares (including preferred stock); |
| • | making material acquisitions not contemplated by the approved annual budget or business plan; |
| • | making non-current asset sales above certain limits; and |
| • | creating liens or granting guarantees in favor of unrelated third parties above certain amounts. |
In addition, the shareholders’ agreement grants to BNDESPAR the right to appoint up to two members of JBS S.A.’s board of directors. See “Principal and selling stockholder—BNDESPAR transaction—JBS S.A./BNDESPAR shareholders’ agreement.” BNDESPAR may exercise its veto rights in ways that conflict with your interests as an investor in us.
Our directors who hold key management positions at JBS S.A. and JBS USA, LLC may have conflicts of interest with respect to matters involving our company.
Upon completion of this offering, the majority of our directors will be affiliated with JBS S.A. For example, Mr. Wesley Mendonça Batista currently serves as the interim executive director of operations of JBS S.A. and is the vice president of its board of directors. Mr. Joesley Mendonça Batista currently serves as the chief executive of JBS S.A. and the president of its board of directors. Mr. José Batista Júnior is currently a director of JBS USA, LLC and JBS S.A. These persons will have fiduciary duties to both us and JBS S.A. As a result, they may have real or apparent conflicts of interest on matters affecting both us and JBS S.A., which in some circumstances may have interests adverse to ours. It may also limit the ability of these directors to participate in consideration of certain matters. In addition, as a result of JBS S.A.’s ownership interest, conflicts of interest could arise with respect to transactions involving business dealings between us and JBS S.A. including, but not limited to, potential acquisitions of businesses or properties, the issuance of additional securities, the payment of dividends by us and other matters.
We will be a “controlled company” within the meaning of the NYSE rules, and, as a result, will rely on exemptions from certain corporate governance requirements that provide protection to stockholders of other companies.
Upon completion of this offering, JBS S.A. will own more than 50% of the total voting power of our common shares and we will be a “controlled company” under the New York Stock Exchange, or NYSE, corporate governance standards. As a controlled company, exemptions under the NYSE standards will free us from the obligation to comply with certain NYSE corporate governance requirements, including the requirements:
| • | that a majority of our board of directors consists of “independent directors,” as defined under the rules of the NYSE; |
| • | that we have a corporate governance and nominating committee that is composed entirely of independent directors with a written charter addressing the committee’s purpose and responsibilities; |
| • | that we have a compensation committee that is composed entirely of independent directors with a written charter addressing the committee’s purpose and responsibilities; and |
52
Table of Contents
| • | for an annual performance evaluation of the nominating and governance committee and compensation committee. |
Accordingly, for so long as we are a “controlled company,” you will not have the same protections afforded to stockholders of companies that are subject to all of the NYSE corporate governance requirements.
There has been no prior public market for our common stock and the trading price of our common stock may be adversely affected if an active trading market in our common stock does not develop.
Prior to this offering, there has been no public market for our common stock, and an active trading market may not develop or be sustained upon the completion of this offering. We cannot predict the extent to which investor interest will lead to the development of an active trading market in shares of our common stock or whether such a market will be sustained. The initial public offering price of the common stock offered in this prospectus was determined through our negotiations with the underwriters and may not be indicative of the market price of the common stock after this offering. The market price of shares of our common stock may decline below the initial public offering price, and you may not be able to sell your shares of common stock at or above the initial public offering price, or at all.
Our stock price may be volatile, and you may be unable to resell your shares at or above the offering price or at all.
The market price of our common stock after this offering will be subject to significant fluctuations in response to, among other factors, variations in our operating results, market conditions specific to our industry and the other considerations described in this “Risk factors” section. Furthermore, the stock markets have experienced price and volume fluctuations that have affected and continue to affect the market prices of equity securities of many companies. These fluctuations often have been unrelated or disproportionate to the operating performance of those companies. Future market fluctuations may negatively affect the market price of our common stock.
Future sales of shares of our common stock in the public market could cause our stock price to fall significantly even if our business is profitable.
Upon the completion of this offering, we will have outstanding shares of common stock (or approximately shares if the underwriters exercise their over-allotment option in full). Of these shares, the shares of common stock offered in this prospectus will be freely tradable without restriction in the public market, unless purchased by our affiliates. We expect that the remaining shares of common stock will become available for resale in the public market as shown in the chart below. Our officers, directors and the holders of all of our outstanding shares of common stock will sign lock-up agreements pursuant to which they have agreed not to sell, transfer or otherwise dispose of any of their shares for a period of 180 days following the date of this prospectus, subject to extension in the case of an earnings release or material news or a material event relating to us. The underwriters may, in their sole discretion and without notice, release all or any portion of the common stock subject to lock-up agreements. The underwriters are entitled to waive the underwriter lock-up provisions at their discretion prior to the expiration dates of such lock-up agreements.
53
Table of Contents
Immediately following the consummation of this offering, our shares of common stock will become available for resale in the public market as follows:
| Number of shares | Percentage | Date of availability for resale into the public market | ||
| % | Upon the effectiveness of this prospectus | |||
| % | 180 days after the date of this prospectus, of which approximately shares of our common stock are subject to holding period, volume and other restrictions under Rule 144 | |||
As restrictions on resale end, the market price of our common stock could drop significantly if the holders of these restricted shares sell them or are perceived by the market as intending to sell them. These factors could also make it more difficult for us to raise additional funds through future offerings of our common stock or other securities.
Following the completion of this offering, we intend to file a registration statement on Form S-8 to register the total number of common stock reserved for issuance under our stock option plan. In addition, to the extent that we exchange shares of reorganized PPC common stock for new shares of our common stock additional shares of our common stock will become available for resale in the public market. For more information about the mandatory exchange, see “The Proposed PPC Acquisition.”
In connection with the BNDESPAR transaction, BNDESPAR and other existing shareholders of JBS S.A. will exchange their 2,000,000 debentures for shares representing % in the aggregate of our common stock. BNDESPAR and these other shareholders will be able to resell these shares of common stock in the public market subject to holding period, volume and other restrictions under Rule 144. In addition, we have agreed to enter into a registration rights agreement with BNDESPAR. To the extent that BNDESPAR exercises these rights, the shares of our common stock held by BNDESPAR and other existing shareholders of JBS S.A. will become available for resale in the public market. For more information about the BNDESPAR transaction, see “Principal and selling stockholders—BNDESPAR transaction.”
Actual dividends paid on our shares may not be consistent with the dividend policy adopted by our board of directors.
Our board of directors will adopt a dividend policy pursuant to which any future determination relating to dividend policy will be made at its discretion and will depend on a number of factors, including our business and financial condition, any covenants under our debt agreements and our parent company’s legal obligation to distribute dividends. Our parent company, JBS S.A., is required by the Brazilian corporate law to distribute on an annual basis dividends representing 25% of its net income (as calculated under generally accepted accounting principles in Brazil, subject to certain adjustments mandated by Brazilian corporate law, which may differ in significant respects from net income calculated under U.S. GAAP) unless its board of directors has determined, in its discretion, that such distribution would not be advisable or appropriate in light of its financial condition. Although our dividend policy is not governed by Brazilian law and is separate from that of our parent company, JBS S.A., we may in the future pay cash dividends to JBS S.A. in order for it to fulfill its dividend policy obligations under Brazilian corporate law. Accordingly, our board of directors may, in its discretion and for any reason, amend or repeal our dividend policy. Our board of directors may increase or decrease the level of dividends provided for in our dividend policy or entirely discontinue the payment of dividends. The dividend policy
54
Table of Contents
obligation of our parent company under Brazilian corporate law is one of many factors we may consider when determining the level of any dividends distributed to be paid to our shareholders. Future dividends with respect to our common shares, if any, will also depend on, among other things, our results of operations, cash requirements, financial condition, distribution of dividends made by our subsidiaries, contractual restrictions, business opportunities, provisions of applicable law and other factors that our board of directors may deem relevant. Any future dividend distributions with respect to our common shares will be paid equally to all holders of our common shares. For the foregoing reasons, you will not be able to rely on dividends to receive a return on your investment. In addition, to the extent that we pay dividends, the amounts distributed to our shareholders may not be available to us to fund future growth and may affect our other liquidity needs.
You will incur immediate and substantial dilution.
The initial public offering price of our common stock is substantially higher than the net tangible book values per share of outstanding common stock prior to completion of the offering. Based on our net tangible book value as of September 27, 2009 and upon the issuance and sale of shares of common stock by us at an assumed initial public offering price of $ per share (the midpoint of the initial public offering price range indicated on the cover of this prospectus), if you purchase our common stock in this offering, you will pay more for your shares than the amounts paid by our existing stockholders for their shares and you will suffer immediate dilution of approximately $ per share in net tangible book value. We also intend to implement a stock option plan that will grant (i) options to our executive officers to purchase common stock with exercise prices that may be below the estimated initial public offering price of our common stock and (ii) shares of restricted stock to certain of our executive officers. To the extent that these options are granted and exercised and restricted stock is awarded to our executive officers, you will experience further dilution.
In addition, under the terms of the reorganized PPC’s restated certificate of incorporation, upon the completion of the initial public offering of our common stock and the listing of the offered shares on a national securities exchange, then, during the period beginning 30 days following this offering and ending two years thereafter, we will have the right to cause each share of the reorganized PPC common stock held by stockholders other than us to be automatically exchanged for a number of new duly authorized, validly issued, fully paid and non-assessable shares of our common stock in accordance with the exchange offer ratio specified in the reorganized PPC’s restated certificate of incorporation. For more information on the exchange offer ratio and how it is calculated, see “The Proposed PPC Acquisition—Conversion of reorganized PPC common stock into our common stock.”
We will have broad discretion in applying the net proceeds of this offering, and we may not use those proceeds in ways that will ultimately enhance the market value of our common stock.
We have broad discretion in applying any net proceeds we will receive in this offering. As part of your investment decision, you will not be able to assess or direct how we apply these net proceeds. If we do not apply these funds effectively, we may lose significant business opportunities. Furthermore, our stock price could decline if the market does not view our use of the net proceeds from this offering favorably. A significant portion of the offering is by the selling stockholder, and we will not receive proceeds from the sale of the shares offered by it.
55
Table of Contents
Provisions in our amended and restated certificate of incorporation and amended and restated bylaws and Delaware law may discourage, delay or prevent a change of control of our company or changes in our management.
Our amended and restated certificate of incorporation and amended and restated bylaws and Delaware law will contain provisions that could act to discourage, delay or prevent a change of control of our company or changes in our management. These provisions:
| • | authorize the issuance of “blank check” preferred stock that our board of directors could issue (subject to the approval of BNDESPAR) to increase the number of outstanding shares to discourage a takeover attempt; |
| • | provide for a classified board of directors (three classes); |
| • | provide that stockholders may only remove directors for cause; |
| • | provide that any vacancy on our board of directors, including a vacancy resulting from an increase in the size of the board, may only be filled by the affirmative vote of a majority of our directors then in office, even if less than a quorum; |
| • | provide that a special meeting of stockholders may only be called by our board of directors or by the chairman of the board of directors; |
| • | provide that action by written consent of the stockholders may be taken only if JBS S.A. and any of its subsidiaries own at least 50% of our outstanding shares of common stock; |
| • | limit the liability of, and provide indemnification to, our directors and officers; |
| • | limit the ability of our stockholders to call and bring business before special meetings and to take action by written consent in lieu of a meeting; and |
| • | provide that the board of directors is expressly authorized to make, alter or repeal our bylaws. |
Additionally, we are subject to Section 203 of the Delaware General Corporation Law, which generally prohibits a Delaware corporation from engaging in any of a broad range of business combinations with any “interested” stockholder for a period of three years following the date on which the stockholder became an “interested” stockholder.
These provisions may act to prevent a change of control, a change in our management or other actions, including actions that our stockholders may deem advantageous. These provisions may also have a negative effect on the trading price of our stock.
56
Table of Contents
Special note regarding forward-looking statements
All statements included in this prospectus, other than statements of historical fact, that address, activities, events or developments that we or our management expect, believe or anticipate will or may occur in the future are forward-looking statements. These statements represent our reasonable judgment on the future based on various factors and using numerous assumptions and are subject to known and unknown risks, uncertainties and other factors that could cause our actual results and financial position to differ materially from those contemplated by the statements. You can identify these statements by the fact that they do not relate strictly to historical or current facts. They use words such as “anticipate,” “estimate,” “project,” “forecast,” “plan,” “may,” “will,” “should,” “could,” “expect” and other words of similar meaning. In particular, these include, but are not limited to, statements of our current views and estimates of future economic circumstances, industry conditions in domestic and international markets and our performance and financial results. These forward-looking statements are subject to a number of factors and uncertainties that could cause the actual results and experiences of us to differ materially from the anticipated results and expectations expressed in such forward-looking statements. We caution readers not to place undue reliance on any forward-looking statements, which speak only as of the date made. Except as required by law, we undertake no obligation to publicly update any forward-looking statements, whether as a result of new information, future events or otherwise.
Among the factors that may cause actual results and experiences to differ from the anticipated results and expectations expressed in such forward-looking statements are the following:
| • | outbreaks of diseases affecting livestock and chicken, or product contamination or recall concerns; |
| • | fluctuations in the prices of live cattle, hogs, chicken, corn and soymeal; |
| • | fluctuations in the selling prices of beef, pork and chicken products; |
| • | developments in, or changes to, the laws, regulations and governmental policies governing our business and products or failure to comply with them, including environmental and sanitary liabilities; |
| • | currency exchange rate fluctuations, trade barriers, exchange controls, political risk and other risks associated with export and foreign operations; |
| • | deterioration of economic conditions; |
| • | our strategic direction and future operation; |
| • | our ability to implement our business plan, including our ability to arrange financing when required and on reasonable terms and the implementation of our financing strategy and capital expenditure plan; |
| • | our acquisitions (including the Proposed PPC Acquisition and any acquisitions to expand our direct distribution business), joint ventures, strategic alliances or divestiture plans; |
| • | the competitive nature of the industry in which we operate and the consolidation of our customers; |
| • | customer demands and preferences; |
57
Table of Contents
| • | adverse weather conditions in our areas of operations; |
| • | continued access to a stable workforce and favorable labor relations with employees; |
| • | consolidation of our customers; |
| • | our dependence on key members of our management; |
| • | interests of our controlling shareholders; |
| • | the declaration or payment of dividends or interest attributable to shareholders’ equity; |
| • | the risk factors discussed under the heading “Risk factors”; |
| • | other factors or trends affecting our financial conditions or results of operations; and |
| • | other statements contained in this prospectus regarding matters that are not historical facts. |
Any or all of our forward-looking statements may turn out to be wrong. They can be affected by inaccurate assumptions or by known or unknown risks, uncertainties and other factors, many of which are beyond our control, including those set forth under “Risk factors.”
In addition, there may be other factors that could cause our actual results to be materially different from the results referenced in the forward-looking statements. Many of these factors will be important in determining our actual future results. Consequently, no forward-looking statement can be guaranteed. Our actual future results may vary materially from those expressed or implied in any forward-looking statements.
All forward-looking statements contained in this prospectus are qualified in their entirety by this cautionary statement. Forward-looking statements speak only as of the date they are made.
58
Table of Contents
Industry data
Certain market and industry data included in this prospectus have been obtained from third-party sources that we believe to be reliable, such as the USDA, Meat and Livestock Australia Limited, Informa Economics, Inc. and the U.S. Meat Export Federation. While we are not aware of any misstatements regarding any market, industry or similar data presented herein, such data involves risks and uncertainties and is subject to change based on various factors, including those discussed above and in “Risk factors.”
Certain definitions
References in this prospectus to “$” or “U.S.$” are to U.S. dollars. References in this prospectus to “A$” are to Australian dollars. References in this prospectus to “R$” are to Brazilianreais.
Brands
Swift,Swift Premium,Swift Angus Select,Swift Premium Black Angus, Miller Blue Ribbon Beef andG.F. Swift 1855 are brands that belong to us. In addition, upon consummation of the Proposed PPC Acquisition, our brands will includePilgrim’s Pride,Country Pride,Gold Kist andPierceChicken. This prospectus also includes trademarks, trade names and trade dress of other companies. Use or display by us of other parties’ trademarks, trade names or trade dress or products is not intended to and does not imply a relationship with, or endorsement or sponsorship of us by, the trademark, trade name or trade dress owners. Solely for the convenience of the reader, in some cases we refer to our brands in this prospectus without the® symbol, but these references are not intended to indicate in any way that we will not assert our rights to these brands to the fullest extent permitted by law.
Rounding
Certain figures included in this prospectus have been subject to rounding adjustments. Accordingly, figures shown as totals in certain tables may not be an arithmetic aggregation of the figures that precede them.
59
Table of Contents
We estimate that the net proceeds from our sale of shares of common stock in this offering at an assumed initial public offering price of $ per share, the midpoint of the price range set forth on the front cover of this prospectus, after deducting estimated underwriting discounts and commissions and estimated offering expenses, will be approximately $ million. A $1.00 increase (decrease) in the assumed initial public offering price would increase (decrease) the net proceeds to us from this offering by $ million, assuming the number of shares offered by us, as set forth on the front cover of this prospectus, remains the same and after deducting the estimated underwriting discounts and commissions.
Within the next five years, we intend to invest approximately $1.5 billion to $2.0 billion, including a portion of the net proceeds of this offering, to create a global direct distribution business. Our investments will include both acquisitions of distribution companies and construction of regional distribution centers and “cutting room” facilities in population centers across the United States and around the world. While we are actively evaluating acquisition opportunities to support our direct distribution strategy, we cannot predict the number of acquisitions that we will close at this time. In addition, to the extent that acquisition opportunities do not materialize in particular regions, we may make investments to expand our direct distribution business organically through the construction of facilities in such regions. At this time, we are unable to quantify with specificity the amount of the proceeds that may be used for future acquisitions as opposed to construction of facilities or other uses in implementing our global distribution strategy. See “Prospectus summary–Our strategy–Increase sales and enhance margins by significantly expanding our direct distribution business.”
We also intend to use a portion of our net proceeds from this offering for working capital and general corporate purposes, which may include future acquisitions. See “Prospectus summary–Our strategy–Continue to pursue additional value-enhancing growth acquisition opportunities.” Our management will have broad discretion in the application of these proceeds and investors will be relying on the judgment of our management regarding their application. Pending their use, we plan to invest the net proceeds from this offering in short-term, interest-bearing obligations, investment-grade instruments, certificates of deposit or direct or guaranteed obligations of the U.S. government.
We will not receive any proceeds from the sale of our common stock by the selling stockholder, including any proceeds resulting from the underwriters’ exercise of their option to purchase additional shares from the selling stockholder.
60
Table of Contents
Our board of directors will adopt a dividend policy pursuant to which any future determination relating to the declaration and payment of dividends will be made at its discretion and will depend on a number of factors, including our business and financial condition, and any covenants under our debt agreements and our parent company’s legal obligation to distribute dividends. However, our board of directors may, in its discretion and for any reason, amend or repeal this dividend policy. Our board of directors may increase or decrease the level of dividends provided for in our dividend policy or entirely discontinue the payment of dividends. Future dividends with respect to our common shares, if any, will depend on, among other things, our results of operations, cash requirements, financial condition, distribution of dividends made by our subsidiaries, contractual restrictions, business opportunities, provisions of applicable law and other factors that our board of directors may deem relevant.
61
Table of Contents
The following table sets forth our consolidated cash and cash equivalents and capitalization as of September 27, 2009 on:
| • | an actual basis; |
| • | a pro forma basis to give effect to the Proposed PPC acquisition and the BNDESPAR transaction; and |
| • | a pro forma as adjusted basis to give effect to: |
| (1) | the Proposed PPC Acquisition, |
| (2) | the BNDESPAR transaction, |
| (3) | the issuance and sale of shares of our common stock sold by us in this offering and our receipt of approximately $ million in net proceeds from such sale, based on an assumed public offering price of $ per share, the midpoint of the range set forth on the cover page of this prospectus, after deducting the underwriting discount and estimated offering expenses payable by us, and |
| (4) | a -for-one stock split to take place immediately prior to completion of this offering. |
The information below is illustrative only, and our capitalization following the completion of this offering will be adjusted based on the actual initial public offering price and other terms of this offering determined at pricing. You should read this table together with “Management’s discussion and analysis of financial condition and results of operations” and our consolidated financial statements and the related notes appearing elsewhere in this prospectus.
| As of September 27, 2009 | |||||||||
| in thousands, except share data | Actual | Pro forma | Pro forma as adjusted | ||||||
Cash and cash equivalents(1) | $ | 105,740 | $ | 1,305,740 | $ | ||||
Indebtedness: | |||||||||
Short-term debt: | |||||||||
Secured credit facilities | 29,955 | 29,955 | |||||||
Exit Facility(2) | — | 50,000 | |||||||
Total short-term debt | 29,955 | 79,955 | |||||||
Current portion of long-term debt: | |||||||||
Installment note payable | 928 | 928 | |||||||
Capital lease obligations | 3,533 | 3,533 | |||||||
Total current portion of long-term debt | 4,461 | 4,461 | |||||||
Long-term: | |||||||||
Exit Facility(2) | — | 1,520,303 | |||||||
Secured revolving credit facility PPC (Mexico) | — | 41,062 | |||||||
Senior unsecured notes due 2014, net of unaccreted discount | 655,441 | 655,441 | |||||||
Intercompany loans | 95,079 | 95,079 | |||||||
Installment note payable | 8,626 | 8,626 | |||||||
Capital lease obligations | 28,806 | 28,806 | |||||||
Total long-term debt, less current portion | 787,952 | 2,349,317 | |||||||
Total debt | 822,368 | 2,433,733 | |||||||
Stockholders’ equity: | |||||||||
Common stock, $0.01 par value per share (actual, authorized 500,000,000 shares, 100 shares issued and outstanding; pro forma, authorized 500,000,000 shares, 133.33 shares issued and outstanding; pro forma as adjusted, authorized shares, shares issued and outstanding) | — | — | |||||||
Additional paid-in capital(3) | 1,400,159 | 3,400,159 | |||||||
Accumulated other comprehensive income | 11,002 | 11,002 | |||||||
Retained earnings | 165,477 | 165,477 | |||||||
Total JBS USA Holdings’ equity | 1,576,638 | 3,576,638 | |||||||
Non-controlling interest in PPC | — | 593,989 | |||||||
Total stockholders’ equity | 1,576,638 | 4,170,627 | |||||||
Total capitalization (total debt plus stockholders’ equity) | $ | 2,399,006 | $ | 6,604,360 | $ | ||||
62
Table of Contents
| (1) | Reflects the $2.0 billion sale of our common stock to JBS S.A. related to the BNDESPAR transaction offset by the use of $800.0 million of such proceeds to fund the Proposed PPC Acquisition. |
| (2) | The Exit Facility assumes the following borrowings: (i) a three-year revolving credit facility not to exceed $600.0 million; (ii) a three-year $375.0 million term loan A; and (iii) a five-year $775.0 million term loan B. From these facilities, the estimated outstanding borrowings are $50.0 million reflected as short-term debt and $1.5 billion reflected as long-term debt. |
| (3) | Reflects the $2.0 billion sale of our common stock to JBS S.A. related to the BNDESPAR transaction. |
A $1.00 decrease or increase in the initial public offering price would result in an approximately $ million decrease or increase in each of pro forma as adjusted total stockholders’ equity and total capitalization. The above table does not reflect shares of common stock reserved for future issuance under our stock option plan and does not give effect to (1) the possible conversion of the reorganized PPC common stock into our common stock or (2) any acquisition we may pursue as part of our strategy to expand our direct distribution business.
63
Table of Contents
If you invest in our common stock, you will be diluted to the extent the initial public offering price per share of our common stock exceeds the net tangible book value per share of our common stock immediately after this offering.
Our pro forma net tangible book value as of September 27, 2009 was approximately $ million, or $ per share of common stock. Pro forma net tangible book value per share represents the amount of our tangible net worth, or total tangible assets less total liabilities as of September 27, 2009, divided by the number of shares of our common stock outstanding immediately prior to completion of this offering after giving effect to the decrease per share attributable to the Proposed PPC Acquisition, the BNDESPAR transaction, and a -for-one stock split of our common stock that will occur immediately prior to consummation of this offering.
After giving effect to the issuance and sale of shares of our common stock sold by us in this offering and our receipt of approximately $ million in net proceeds from such sale, based on an assumed public offering price of $ per share, the midpoint of the range set forth on the cover page of this prospectus, after deducting the underwriting discount and estimated offering expenses payable by us, our as adjusted pro forma net tangible book value per share as of September 27, 2009 would have been approximately $ million, or $ per share. This amount represents an immediate increase in pro forma net tangible book value of $ to existing stockholders and an immediate dilution in pro forma net tangible book value of $ per share to new investors purchasing shares of our common stock in this offering. Dilution per share is determined by subtracting the net tangible book value per share as adjusted for this offering from the amount of cash paid by a new investor for a share of our common stock. Net tangible book value is not affected by the sale of shares of our common stock offered by the selling stockholder.
The following table illustrates the per share dilution:
| (in millions) | Per share | |||||
Assumed initial public offering price per share | $ | |||||
Pro forma net tangible book value per share as of September 27, 2009 | $ | |||||
Increase in net tangible book value per share attributable to existing investors | ||||||
Adjusted pro forma net tangible book value per share after this offering | ||||||
Dilution per share to new investors | $ | |||||
A $1.00 increase (decrease) in the assumed initial public offering price of $ per share would increase (decrease) our net tangible book value by $ , the net tangible book value per share after this offering by $ and the dilution per share to new investors by $ , assuming the number of shares offered by us, as set forth on the cover page of this prospectus, remains the same, and after deducting the estimated underwriting discounts and commissions and estimated offering expenses payable by us.
The foregoing discussion and table do not give effect to (1) shares of common stock that we will issue if the underwriters exercise their over-allotment option in full or (2) the possible acquisition of the reorganized PPC common stock in exchange for our common stock. If the underwriters exercise their option to purchase additional shares of common stock in full, the as adjusted net tangible book value per share as of September 27, 2009 would be approximately $ per share and the dilution per share to new investors would be $ per share.
64
Table of Contents
The following table summarizes, as of September 27, 2009, on a pro forma basis after giving effect to the BNDESPAR transaction and a -for-one stock split that will occur immediately prior to consummation of this offering, the number of shares of our common stock we issued and sold, the total consideration we received and the average price per share paid to us by existing stockholders prior to this offering, and by new investors purchasing shares of common stock in this offering. The table assumes an initial public offering price of $ per share (the midpoint of the price range set forth on the cover page of this prospectus):
| Shares purchased | Total consideration | Average price per share | |||||||||
| Number | Percent | Number | Percent | ||||||||
Existing stockholders | % | % | $ | ||||||||
New investors in this offering | % | % | $ | ||||||||
Total | 100.0% | 100.0% | $ | ||||||||
The number of shares of our common stock held by new investors will increase to , or approximately % of the total number of shares of our common stock outstanding after this offering, and the number of shares held by the selling stockholder, will decrease to shares, or approximately % of the total number of shares of our common stock outstanding after this offering. If the underwriters exercise their option to purchase additional shares of common stock in full, the number of shares of our common stock held by new investors will increase to , or approximately $ per share and the dilution per share to new investors would be $ per share.
In addition, we may choose to raise additional capital due to market conditions or strategic considerations even if we believe we have sufficient funds for our current or future operating plans. To the extent that additional capital is raised through the sale of equity or convertible debt securities, the issuance of such securities could result in further dilution to our stockholders. See “Prospectus summary—Recent developments— BNDESPAR transaction.”
65
Table of Contents
Selected historical consolidated financial data
The following tables set forth our selected historical consolidated financial data at the dates and for the periods indicated. Our selected historical consolidated financial information contained in this prospectus is derived from
| (1) | our predecessor’s unaudited historical consolidated financial statements as of and for the fiscal years ended May 30, 2004, May 29, 2005 and May 28, 2006, |
| (2) | our predecessor’s audited historical consolidated financial statements as of and for |
| (a) | the fiscal year ended December 24, 2006, and |
| (b) | the 198 days from December 25, 2006 through July 10, 2007 (the date immediately preceding the Swift Acquisition), |
| (3) | our audited historical consolidated financial statements as of and for |
| (a) | the 173 days from July 11, 2007 through December 30, 2007, |
| (b) | the fiscal year ended December 28, 2008, and |
| (4) | our unaudited historical financial statements as of September 27, 2009 and for the thirty-nine weeks ended September 28, 2008 and September 27, 2009. |
The financial statements in (1) were reviewed by Grant Thornton LLP, and the financial statements in (2) and (3)(a) were audited by Grant Thornton LLP. The financial statements in (3)(b) were audited by BDO Seidman, LLP. The 2009 financial statements in (4) were reviewed by BDO Seidman, LLP.
The financial statements in (2), (3) and (4) above are included elsewhere in this prospectus and have been prepared in accordance with generally accepted accounting principles in the United States, or GAAP. Our current fiscal year is based on the 52- or 53-week period ending on the last Sunday in December. Our predecessor company’s fiscal year was based on the 52- or 53-week period ending on the last Sunday in May. The Swift Acquisition closed on July 11, 2007, and the financial statements for the 198 days from December 25, 2006 to July 10, 2007 represent the period between the end of the fiscal year ended December 24, 2006 and the day prior to the closing of the Swift Acquisition. The periods ended prior to July 11, 2007 are referred to as the “predecessor” periods. The financial statements for the 173-day period from July 11, 2007 through December 30, 2007 represent the period from the date of the Swift Acquisition through December 30, 2007. The periods ended subsequent to July 10, 2007 are referred to as the “successor” periods.
The results of operations for any partial period are not necessarily indicative of the results of operations for other periods or for the full fiscal year. We have prepared our unaudited historical consolidated financial statements on the same basis as our audited financial statements and have included all adjustments, consisting of normal and recurring adjustments, that we consider necessary to present fairly our financial position and results of operations for the unaudited periods.
On May 26, 2006, we completed the sale of our non-fed cattle business, including our operating plant assets in Omaha, Nebraska and our idled Nampa, Idaho assets. Due to our significant continuing involvement with the non-fed processing facilities through a raw material supply
66
Table of Contents
agreement, the operating results related to these plants have been reflected in our continuing operations through the fiscal year ended December 24, 2006.
Our consolidated results of operations for the 198-day period ended July 10, 2007 and the 173-day period ended December 30, 2007 are not fully comparable to our results for the fiscal year ended December 24, 2006 due to the change in cost basis and recapitalization that occurred on July 11, 2007.
Our consolidated results of operations for the fiscal year ended December 28, 2008 are not fully comparable to our results of operations for the combined 198-day period ended July 10, 2007 and the 173-day period ended December 30, 2007 due to the (1) change in cost basis and recapitalization that occurred on July 11, 2007, (2) Tasman Acquisition that closed on May 2, 2008 and (3) JBS Packerland Acquisition that closed on October 23, 2008.
Our consolidated results of operations for the thirty-nine weeks ended September 27, 2009 are not fully comparable to our results of operations for the thirty-nine weeks ended September 28, 2008 due to the (1) Tasman Acquisition that closed on May 2, 2008 and (2) JBS Packerland Acquisition that closed on October 23, 2008.
You should read the selected historical consolidated financial data set forth below in conjunction with, and the data is qualified by reference to, “Unaudited pro forma combined financial statements,” “Management’s discussion and analysis of financial condition and results of operations” and the consolidated financial statements and accompanying notes thereto included elsewhere in this prospectus.
| Predecessor | ||||||||||||
| Fiscal year ended | ||||||||||||
| May 30, 2004 | May 29, 2005 | May 28, 2006 | ||||||||||
| in thousands | Unaudited | Unaudited | Unaudited | |||||||||
Statement of operations data: | ||||||||||||
Net sales | $ | 9,427,235 | $ | 9,664,249 | $ | 9,348,151 | ||||||
Cost of goods sold | 9,165,466 | 9,452,638 | 9,267,142 | |||||||||
Gross profit | 261,769 | 211,611 | 81,009 | |||||||||
Selling, general and administrative | 134,016 | 146,830 | 166,172 | |||||||||
Goodwill impairment | — | 11,869 | 4,488 | |||||||||
Foreign currency transaction loss (gain) | 824 | (396 | ) | 19 | ||||||||
Other income, net | (9,776 | ) | (5,884 | ) | (3,357 | ) | ||||||
Loss on sales of property, plant and equipment | 851 | 1,031 | 662 | |||||||||
Interest expense, net | 91,802 | 100,237 | 112,264 | |||||||||
Total expenses | 217,717 | 253,687 | 280,248 | |||||||||
Income (loss) from continuing operations before income taxes | 44,052 | (42,076 | ) | (199,239 | ) | |||||||
Income tax expense (benefit) | 14,965 | (31,645 | ) | (57,736 | ) | |||||||
Equity method investment earnings (losses) | (6,592 | ) | 4,247 | — | ||||||||
Income from discontinued operations | 3,672 | 27,852 | — | |||||||||
Net income (loss) | $ | 26,167 | $ | 21,668 | $ | (141,503 | ) | |||||
Balance sheet data (at period end): | ||||||||||||
Cash and cash equivalents | $ | 136,195 | $ | 79,712 | $ | 52,291 | ||||||
Accounts receivable, net | 329,944 | 373,167 | 366,744 | |||||||||
Inventories | 480,679 | 499,039 | 503,426 | |||||||||
Property, plant and equipment, net | 602,416 | 562,454 | 504,271 | |||||||||
Total assets | 1,784,833 | 1,709,481 | 1,604,928 | |||||||||
Long-term debt | 787,428 | 946,496 | 1,102,717 | |||||||||
Total debt | 791,667 | 997,978 | 1,104,519 | |||||||||
Stockholder’s equity (deficit) | 411,659 | 124,137 | (20,029 | ) | ||||||||
67
Table of Contents
| Predecessor | Successor | |||||||||||||||||||||||||
| Fiscal year ended December 24, 2006 | 198 days from December 25, 2006 through July 10, 2007 | 173 days from July 11, 2007 through December 30, 2007 | Fiscal year ended December 28, 2008 | Thirty- nine weeks ended September 28, 2008 | Thirty- nine weeks ended September 27, 2009 | |||||||||||||||||||||
| in thousands, except earnings per share | Audited | Audited | Audited | Audited | Unaudited | Unaudited | ||||||||||||||||||||
Statement of operations data: | ||||||||||||||||||||||||||
Net sales | $ | 9,691,432 | $ | 4,970,624 | $ | 4,988,984 | $ | 12,362,281 | $ | 8,972,255 | $ | 10,011,154 | ||||||||||||||
Cost of goods sold | 9,574,715 | 4,920,594 | 5,013,084 | 11,917,777 | 8,612,590 | 9,673,675 | ||||||||||||||||||||
Gross profit (loss) | 116,717 | 50,030 | (24,100 | ) | 444,504 | 359,665 | 337,479 | |||||||||||||||||||
Selling, general and administrative expenses(1) | 158,783 | 92,333 | 60,727 | 148,785 | 98,296 | 158,440 | ||||||||||||||||||||
Foreign currency transaction loss (gain)(2) | (463 | ) | (527 | ) | (5,201 | ) | 75,995 | 17,572 | (60,867 | ) | ||||||||||||||||
Other income, net | (4,937 | ) | (3,821 | ) | (3,581 | ) | (10,107 | ) | (9,775 | ) | (3,629 | ) | ||||||||||||||
Loss (gain) on sales of property, plant and equipment | (666 | ) | (2,946 | ) | 182 | 1,082 | (233 | ) | (181 | ) | ||||||||||||||||
Interest expense, net | 118,754 | 66,383 | 34,340 | 36,358 | 23,287 | 69,515 | ||||||||||||||||||||
Total expenses | 271,471 | 151,422 | 86,467 | 252,113 | 129,147 | 163,278 | ||||||||||||||||||||
Income (loss) before income tax expense | (154,754 | ) | (101,392 | ) | (110,567 | ) | 192,391 | 230,518 | 174,201 | |||||||||||||||||
Income tax expense (benefit) | (37,348 | ) | (18,380 | ) | 1,025 | 31,287 | 74,267 | 58,236 | ||||||||||||||||||
Net income (loss) | $ | (117,406 | ) | $ | (83,012 | ) | $ | (111,592 | ) | $ | 161,104 | $ | 156,251 | $ | 115,965 | |||||||||||
Basic and diluted net income (loss) per share of common stock(3) | N/A | N/A | $ | (1,115,920 | ) | $ | 1,611,040 | $ | 1,562,510 | $ | 1,159,650 | |||||||||||||||
Basic and diluted pro forma net income (loss) per share of common stock(4) | N/A | N/A | $ | $ | $ | $ | ||||||||||||||||||||
Balance sheet data (at period end): | ||||||||||||||||||||||||||
Cash and cash equivalents | $ | 83,420 | $ | 44,673 | $ | 198,883 | $ | 254,785 | $ | 268,115 | $ | 105,740 | ||||||||||||||
Accounts receivable, net | 334,341 | 365,642 | 417,375 | 588,985 | 563,441 | 607,158 | ||||||||||||||||||||
Inventories | 457,829 | 487,598 | 466,756 | 658,287 | 627,923 | 679,251 | ||||||||||||||||||||
Property, plant and equipment, net | 487,427 | 505,172 | 708,056 | 1,229,316 | 850,629 | 1,232,756 | ||||||||||||||||||||
Total assets | 1,538,597 | 1,578,350 | 2,165,815 | 3,315,571 | 2,627,316 | 3,525,882 | ||||||||||||||||||||
Long-term debt | 1,065,553 | 1,201,975 | 32,433 | 806,808 | 483,361 | 787,952 | ||||||||||||||||||||
Total debt | 1,067,503 | 1,203,912 | 810,718 | 878,319 | 589,997 | 822,368 | ||||||||||||||||||||
Stockholder’s equity (deficit) | (40,090 | ) | (98,818 | ) | 838,818 | 1,388,250 | 1,426,896 | 1,576,638 | ||||||||||||||||||
| (1) | On February 18, 2009, we reached an agreement to terminate our efforts to acquire National Beef Packing Company, LLC, or National Beef, effective February 23, 2009. As a result of the termination of the agreement, we paid a breakage fee to the shareholders of National Beef totaling $19.9 million as full and final settlement of any and all liabilities relating to the potential acquisition. In addition, we recorded an additional $1.0 million related to legal costs in the thirty-nine weeks ended September 27, 2009. These costs were reflected as selling, general and administrative expenses. |
| (2) | For the successor periods only, the foreign currency transaction loss (gain) reflects changes in the value of our U.S. dollar-denominated intercompany between our Australian subsidiary, as debtor, and us, as lender. |
| (3) | The capital structure of our predecessor company was significantly different from our capital structure. Prior to this offering, our capital structure consists of 100 common shares issued and outstanding, and we do not have any warrants or options that may be exercised. Accordingly, we do not believe our predecessor company’s earnings per share information is meaningful to investors and have not included such information. |
| (4) | In calculating pro forma shares of our common stock outstanding, we give retroactive effect to the stock split to occur immediately prior to completion of this offering. |
68
Table of Contents
Unaudited pro forma combined financial statements
On October 23, 2008, we acquired Smithfield Beef Group, Inc. (now known as JBS Packerland) for $569.1 million in cash (including $32.0 million of transaction-related costs). This acquisition included 100% of Five Rivers, which had been previously held by Smithfield Beef Group, Inc. in a 50/50 joint venture with Continental Grain Company.
On April 27, 2009, our wholly owned subsidiaries, JBS USA, LLC and JBS USA Finance, Inc., issued 11.625% senior unsecured notes due 2014 in an aggregate principal amount of $700.0 million and applied the net proceeds to repay $100.0 million of borrowings under our secured revolving credit facility and to repay $550.8 million of the outstanding principal and accrued interest on intercompany loans to us from a subsidiary of JBS S.A.
On September 16, 2009, we entered into an agreement with PPC to acquire 64% of the total issued and outstanding new common stock of PPC, as reorganized in accordance with its plan of reorganization, in exchange for aggregate consideration of $800.0 million in cash. See “The Proposed PPC Acquisition—Stock purchase agreement.”
On December 22, 2009, JBS S.A., our indirect parent company, agreed to issue a series of exchangeable debentures. These debentures are mandatorily exchangeable into our common stock in the form of BDRs following this offering under certain conditions. The terms of the debentures provide that 2,000,000 debentures will be issued. BNDESPAR has agreed to subscribe for and purchase up to the entire principal amount of the debentures offered for $2 billion. Following this offering and assuming compliance with other conditions, the 2,000,000 outstanding debentures will be mandatorily exchanged for an aggregate percentage of shares of our outstanding common stock in the form of BDRs equal to $2 billion divided by our equity valuation in U.S. dollars based on the number of shares outstanding immediately prior to this offering, but calculated on the basis of the price per share in this offering, multiplied by 100. See “Prospectus summary—Recent developments—BNDESPAR transaction.”
JBS S.A. is required to, among other things, use net proceeds from the offering of debentures to capitalize our company, including to fund the $800 million purchase price for our interest in PPC pursuant to Proposed PPC Acquisition.
In order to provide funds to us for the use of proceeds stated above prior to the closing of the BNDESPAR transaction, on December 21, 2009, we and JBS S.A. entered into a purchase and sale agreement pursuant to which we agreed to issue and sell 20-25% of our common stock to JBS S.A. for an aggregate purchase price of $2.0 billion. Prior to completion of this offering, we anticipate that we will have issued and sold to JBS S.A. 20-25% of our common stock for an aggregate purchase price of $2.0 billion pursuant to this agreement. The shares of our common stock to be delivered to holders of the debentures upon their mandatory exchange will be delivered by JBS S.A.
The unaudited pro forma combined statement of operations for the fiscal year ended December 28, 2008 has been prepared as if each of the following events had occurred at the beginning of the period presented:
| • | the issuance and sale of $561.9 million of our 11.625% senior unsecured notes due 2014 and the application of the proceeds therefrom (considering this smaller principal amount because the proceeds of the remaining principal amount of these notes were used for other purposes), |
| • | the JBS Packerland Acquisition, |
69
Table of Contents
| • | the acquisition of 50% of the equity interest in Five Rivers not previously owned, |
| • | a portion (40%) of the sale of our common stock related to the BNDESPAR transaction (using this percentage because it is equivalent to the percentage of the proceeds of the BNDESPAR transaction expected to be used to fund the cash consideration for the Proposed PPC Acquisition), and |
| • | the Proposed PPC Acquisition. |
The unaudited pro forma combined statement of operations for the fiscal year ended December 28, 2008 is derived from (1) our audited historical consolidated financial statements for the fiscal year ended December 28, 2008, (2) unaudited historical financial information of Smithfield Beef Group, Inc. for the period from January 1, 2008 through October 22, 2008, (3) unaudited historical financial information of Five Rivers for the period from January 1, 2008 through October 22, 2008, (4) audited historical financial information of Pilgrim’s Pride for the year ended September 27, 2008, (5) the unaudited historical information of Pilgrim’s Pride for the three-month period ended December 29, 2007 and (6) unaudited historical information of Pilgrim’s Pride for the three-month period ended December 27, 2008.
The unaudited pro forma combined statement of operations for the thirty-nine weeks ended September 27, 2009 has been prepared as if (1) the issuance and sale of $561.9 million of our 11.625% senior unsecured notes due 2014 and the application of the proceeds therefrom and (2) a portion (40%) of the sale of our common stock related to the BNDESPAR transaction and the Proposed PPC Acquisition had occurred as of December 30, 2007. The summary unaudited pro forma combined balance sheet as of September 27, 2009 has been prepared as if the Proposed PPC Acquisition and the BNDESPAR transaction and the application of the proceeds therefrom had each occurred as of September 27, 2009.
The summary unaudited pro forma combined financial data as of and for the thirty-nine weeks ended September 27, 2009 is derived from (1) our unaudited historical consolidated financial statements as of and for the thirty-nine weeks ended September 27, 2009, (2) audited historical information of Pilgrim’s Pride as of and for the fiscal year ended September 26, 2009, and (3) unaudited historical information of Pilgrim’s Pride for the three months ended December 27, 2008.
The unaudited pro forma combined financial data do not give any pro forma effect to the Tasman Acquisition as it was not material and did not constitute a significant subsidiary under Regulation S-X.
Historically, Smithfield Beef Group, Inc. and Five Rivers reported their financial results using the last Sunday in April, and March 31, respectively, as their fiscal year ends. Accordingly, the historical amounts presented for JBS Packerland and Five Rivers in the unaudited pro forma combined financial information do not agree with Smithfield Beef Group, Inc.’s and Five Rivers’ historical financial statements appearing elsewhere in this prospectus.
Historically, PPC has reported its financial results on the basis of a 52- or 53-week fiscal year ending on the Saturday closest to September 30. Accordingly, the historical amounts presented for PPC in the unaudited pro forma combined financial information do not agree with PPC’s historical financial statements appearing elsewhere in this prospectus.
70
Table of Contents
The unaudited pro forma combined financial statements set forth herein reflect certain adjustments for:
| • | the 50% equity ownership in Five Rivers owned by Smithfield Beef Group, Inc. prior to October 22, 2008 to avoid double counting such equity ownership since the historical financial statements of Smithfield Beef Group, Inc. reflect such ownership under the equity method of accounting, but, on a pro forma basis, we have reflected the ownership of Five Rivers on a fully consolidated basis, |
| • | the elimination of transaction expenses incurred by Smithfield Foods, Inc. in connection with the sale of Smithfield Beef Group, Inc. to JBS USA, LLC, |
| • | the elimination of revenue and operating expenses associated with Five Rivers’ company-owned cattle during the period January 1 through October 22, 2008, since subsequent to that date, Five Rivers does not own cattle but operates solely as a hotelling operation for other entities’ cattle, |
| • | the elimination of revenue and operating expenses of cattle owned by Smithfield Beef Group, Inc. during the period January 1 through October 22, 2008, since subsequent to that date, JBS Packerland does not own cattle, and |
| • | the elimination of other assets and insignificant businesses not acquired and liabilities not assumed. |
The unaudited pro forma combined financial statements reflect pro forma adjustments that are described above and in the accompanying notes and are based on available information and certain assumptions that we believe are reasonable under the circumstances, and the actual results could differ materially from these anticipated results. In our opinion, all adjustments that are necessary to present fairly the unaudited pro forma consolidated data have been made. The unaudited pro forma combined financial statements are presented for informational purposes only and do not purport to be indicative of what would have occurred had the JBS Packerland Acquisition, the BNDESPAR transaction and the Proposed PPC Acquisition actually been consummated at the dates indicated, nor are they necessarily indicative of our future consolidated operating results.
You should read the following unaudited pro forma combined financial statements in conjunction with, and the data is qualified by reference to, “Selected historical consolidated financial data,” “Management’s discussion and analysis of financial condition and results of operations” and the financial statements and accompanying notes included elsewhere in this prospectus.
71
Table of Contents
Unaudited pro forma combined statement of operations for the fiscal year ended December 28, 2008
| JBS USA Holdings, Inc. | JBS Packerland | JBS Packerland | JBS Packerland | Five Rivers | Five Rivers | Pilgrim’s Pride | Adjustment for transactions | JBS USA Holdings, Inc. | |||||||||||||||||||||||||||||||
| Fiscal year ended December 28, 2008 | December 31, 2007 through October 22, 2008 (a)(i) | Adjustment for 50% equity interest in Five Rivers (b) | Adjustment for assets not acquired (c)(i) | December 31, 2007 through October 22, 2008 (a)(ii) | Adjustment for assets not acquired (c)(ii) | 52 weeks ended December 27, 2008 (d) | Fiscal year ended December 28, 2008 | ||||||||||||||||||||||||||||||||
| Historical | Historical | Historical | Notes | Pro forma | |||||||||||||||||||||||||||||||||||
| in thousands, except earnings (loss) per share | (+) | (-) | (-) | (+) | (-) | (+) | (+) | ||||||||||||||||||||||||||||||||
Net sales | $ | 12,362,281 | $ | 2,548,224 | — | $ | 4,923 | $ | 1,461,140 | $ | 912,920 | $ | 8,348,395 | $ | (55,544 | ) | (e) | $ | 23,746,653 | ||||||||||||||||||||
Cost of goods sold | 11,917,777 | 2,397,551 | — | 4,949 | 1,511,462 | 988,814 | 8,672,385 | (72,197 | ) | (e | ),(f),(g) | 23,433,215 | |||||||||||||||||||||||||||
Restructuring items | — | — | — | — | — | — | 27,990 | — | 27,990 | ||||||||||||||||||||||||||||||
Gross profit (loss) | 444,504 | 150,673 | — | (26 | ) | (50,322 | ) | (75,894 | ) | (351,980 | ) | 16,653 | 285,448 | ||||||||||||||||||||||||||
Selling, general and administrative expenses | 148,785 | 78,793 | — | 7,307 | 11,093 | 9 | 364,603 | 3,731 | (f | ),(g),(h) | 599,689 | ||||||||||||||||||||||||||||
Restructuring items, net | — | — | — | — | — | — | 18,578 | — | 18,578 | ||||||||||||||||||||||||||||||
Foreign currency transaction losses | 75,995 | — | — | — | — | — | — | — | 75,995 | ||||||||||||||||||||||||||||||
Goodwill impairment | — | — | — | — | — | — | 501,446 | — | 501,446 | ||||||||||||||||||||||||||||||
Other (income) expense | (10,107 | ) | 44,465 | 39,139 | 5,555 | (208 | ) | (74 | ) | (818 | ) | — | (11,288 | ) | |||||||||||||||||||||||||
Loss on sales of property, plant and equipment | 1,082 | 107 | — | — | 131 | 224 | — | — | 1,096 | ||||||||||||||||||||||||||||||
Interest expense, net | 36,358 | 30,837 | — | 31,005 | 16,940 | 16,940 | 141,233 | 29,337 | (i) | 206,760 | |||||||||||||||||||||||||||||
Total expenses, net | 252,113 | 154,202 | 39,139 | 43,867 | 27,956 | 17,099 | 1,025,042 | 33,068 | 1,392,276 | ||||||||||||||||||||||||||||||
Income (loss) from continuing operations before reorganization items and income taxes | 192,391 | (3,529 | ) | (39,139 | ) | (43,893 | ) | (78,278 | ) | (92,993 | ) | (1,377,022 | ) | (16,415 | ) | (1,106,828 | ) | ||||||||||||||||||||||
Reorganization items | — | — | — | — | — | — | 13,250 | — | 13,250 | ||||||||||||||||||||||||||||||
Income (loss) from continuing operations before income taxes | 192,391 | (3,529 | ) | (39,139 | ) | (43,893 | ) | (78,278 | ) | (92,993 | ) | (1,390,272 | ) | (16,415 | ) | (1,120,078 | ) | ||||||||||||||||||||||
Income tax expense (benefit) | 31,287 | 2,222 | — | 2,222 | — | — | (201,910 | ) | (81,950 | ) | (j) | (252,573 | ) | ||||||||||||||||||||||||||
Net income (loss) | 161,104 | (5,751 | ) | (39,139 | ) | (46,115 | ) | (78,278 | ) | (92,993 | ) | (1,188,362 | ) | 65,535 | (867,505 | ) | |||||||||||||||||||||||
Less net loss attributable to non-controlling interest in PPC | — | — | — | — | — | — | — | (379,255 | ) | (k) | (379,255 | ) | |||||||||||||||||||||||||||
Net income (loss) attributable to controlling shareholder | $ | 161,104 | $ | (5,751 | ) | $ | (39,139 | ) | $ | (46,115 | ) | $ | (78,278 | ) | $ | (92,993 | ) | $ | (1,188,362 | ) | $ | 444,790 | $ | (488,250 | ) | ||||||||||||||
Basic and diluted net income (loss) per share of common stock | $ | 1,611,040 | $ | (4,308,086 | ) | ||||||||||||||||||||||||||||||||||
Shares outstanding | 100 | 13 1/3 | (l) | 113 1/3 | |||||||||||||||||||||||||||||||||||
72
Table of Contents
| (a) | Represents the historical results of |
| (i) | JBS Packerland, and |
| (ii) | Five Rivers |
| for | the period from December 31, 2007 through October 22, 2008. |
| (b) | Represents the elimination of the 50% equity interest in Five Rivers from the historical results of JBS Packerland for the period from December 31, 2007 through October 22, 2008. On a pro forma basis, the results of Five Rivers are reflected on a fully consolidated basis as part of the JBS Packerland Acquisition. |
| (c) | Reflects the elimination of assets not acquired for |
| (i) | JBS Packerland and |
| (ii) | Five Rivers. |
| The adjustment for assets not acquired includes, among others, (1) revenue and expenses associated with cattle owned by Smithfield Beef Group, Inc. that were retained by the seller, Smithfield Foods, Inc., (2) revenue and expenses associated with cattle owned by Five Rivers that were retained by Smithfield Foods, Inc., (3) elimination of $5.8 million of transaction expenses incurred by Smithfield Foods, Inc. in connection with the sale of the Smithfield Beef Group, Inc. to us recorded in its selling, general and administrative expenses, (4) elimination of $31.0 million and $16.9 million in historical interest expense related to funding working capital requirements of assets not acquired, and (5) other assets and insignificant businesses not acquired and liabilities not assumed. |
| (d) | Represents the historical results of Pilgrim’s Pride for the fifty-two weeks ended December 27, 2008, derived as a combination of (i) the fifty-two weeks ended September 27, 2008,minus (ii) the three months ended December 29, 2007plus (iii) the three months ended December 27, 2008, as follows: |
| Pilgrim’s Pride | ||||||||||||||||
| 52 weeks ended September 27, 2008 | Three months ended December 29, 2007 | Three months ended December 27, 2008 | 52 weeks ended December 27, 2008 | |||||||||||||
| in thousands | (-) | (+) | ||||||||||||||
Net sales | $ | 8,518,757 | $ | 2,047,353 | $ | 1,876,991 | $ | 8,348,395 | ||||||||
Cost of goods sold | 8,654,262 | 1,942,250 | 1,960,373 | 8,672,385 | ||||||||||||
Restructuring items | 27,990 | — | — | 27,990 | ||||||||||||
Gross profit (loss) | (163,495 | ) | 105,103 | (83,382 | ) | (351,980 | ) | |||||||||
Selling, general and administrative expenses | 376,599 | 104,433 | 92,437 | 364,603 | ||||||||||||
Restructuring items, net | 16,156 | — | 2,422 | 18,578 | ||||||||||||
Goodwill impairment | 501,446 | — | — | 501,446 | ||||||||||||
Other income, net | (2,230 | ) | (2,863 | ) | (1,451 | ) | (818 | ) | ||||||||
Interest expense, net | 131,627 | 29,432 | 39,038 | 141,233 | ||||||||||||
Total expenses | 1,023,598 | 131,002 | 132,446 | 1,025,042 | ||||||||||||
Loss from continuing operations before reorganization items and income taxes | (1,187,093 | ) | (25,899 | ) | (215,828 | ) | (1,377,022 | ) | ||||||||
Reorganization items | — | — | 13,250 | 13,250 | ||||||||||||
Loss from continuing operations before income taxes | (1,187,093 | ) | (25,899 | ) | (229,078 | ) | (1,390,272 | ) | ||||||||
Income tax expense (benefit) | (194,921 | ) | 7,267 | 278 | (201,910 | ) | ||||||||||
Net loss | $ | (992,172 | ) | $ | (33,166 | ) | $ | (229,356 | ) | $ | (1,188,362 | ) | ||||
| (e) | Reflects the elimination of (i) $8.0 million of intercompany sales and $8.0 million of intercompany purchases (recorded as cost of goods sold) between JBS Packerland and the legacy Swift Beef segment for the period from December 31, 2007 through October 22, 2008, and (ii) $47.5 million of intercompany sales and $47.5 million of intercompany purchases (recorded as cost of goods sold) between us and Pilgrim’s Pride for the period from December 31, 2007 through December 28, 2008. |
| (f) | On March 4, 2008, JBS S.A. and Smithfield Foods, Inc (“Smithfield Foods”) entered into a Stock Purchase Agreement (the “Smithfield Agreement”). Pursuant to the Smithfield Agreement, JBS S.A., through our company, acquired Smithfield Beef Group, Inc. (“Smithfield Beef”) for $569.4 million in cash (including $32.3 million of transaction-related costs). We received the funds and contributed them to JBS USA, LLC (“JBS USA”), which finalized the acquisition of Smithfield Beef (“JBS Packerland Acquisition”). The purchase included 100% of Five Rivers Ranch Cattle Feeding LLC (“Five Rivers”), which was held by Smithfield Beef in a 50/50 joint venture with Continental Grain Company (“CGC,” formerly ContiGroup Companies, Inc.). On October 23, 2008, the acquisition of Smithfield Beef was completed. In conjunction with the closing of this purchase, Smithfield Beef was renamed JBS Packerland, and Five Rivers was renamed JBS Five Rivers Cattle Feeding LLC (“JBS Five Rivers”). The assets acquired include four processing plants and eleven feedlots. |
| The purchase excluded substantially all live cattle inventories held by Smithfield Beef and Five Rivers as of the closing date, together with its associated debt. The excluded live cattle were raised by JBS Five Rivers after closing for a negotiated fee. |
73
Table of Contents
| The purchase price allocation is preliminary pending completion of independent valuations of identified tangible and intangible assets acquired and certain liabilities acquired, including, but not limited to, deferred income taxes. In addition, we are in the process of finalizing costs associated with the relocation of certain employees from the former Green Bay, Wisconsin headquarters of Smithfield Beef to our Greeley, Colorado headquarters. We expect to finalize these costs during the fourth quarter of our fiscal year 2009. The allocation presented below reflects the estimated fair value of the individual assets acquired and liabilities assumed as of October 23, 2008 (in thousands): |
| Purchase price allocation: | ||||
Purchase price paid to previous shareholders | $ | 537,068 | ||
Fees and direct expenses | 32,322 | |||
Total purchase price | $ | 569,390 | ||
Preliminary purchase price allocation: | ||||
Current assets and liabilities, net | $ | 47,097 | ||
Property, plant and equipment(i) | 314,306 | |||
Deferred tax income liability | (102,781 | ) | ||
Goodwill | 174,553 | |||
Intangible assets(ii) | 131,044 | |||
Other non-current assets and liabilities, net | 5,171 | |||
Total purchase price allocation | $ | 569,390 | ||
| (i) | Property, plant and equipment was recorded at preliminary estimated fair values as of the date of the JBS Packerland Acquisition as follows (in thousands): |
| Land | $ | 51,383 | |
| Land improvements | 43,574 | ||
Building, machinery, and equipment | 210,850 | ||
Furniture, fixtures, office equipment, and other | 2,106 | ||
Construction in progress | 6,393 | ||
Total plant, property and equipment | $ | 314,306 | |
| Depreciation and amortization is recorded using the straight-line method over the estimated useful lives of the assets as follows: |
| Furniture, fixtures, office equipment and other | 5 to 7 years | |
Machinery and equipment | 5 to 15 years | |
Buildings and improvements | 15 to 40 years | |
Leasehold improvements | shorter of useful life or the lease term | |
| (ii) | Intangible assets include customer relationships resulting from the JBS Packerland Acquisition that are being amortized on an accelerated basis over 18 years. This represents management’s estimate of the period of expected economic benefit and annual customer profitability. Identified intangible assets were recorded at preliminary estimated fair values as of the date of the JBS Packerland Acquisition as follows (in thousands): |
| Customer relationships | $ | 99,500 | |
Non-amortizing trademarks | 19,400 | ||
Non-amortizing water rights | 12,144 | ||
Total intangible assets | $ | 131,044 | |
| The $2.6 million increase in pro forma depreciation and amortization expense reflected in cost of goods sold is comprised of (1) estimated depreciation and amortization expense for the period January 1 through October 22, 2008 of $23.8 million based on estimated fair values and useful lives of identified tangible and intangible assets, and (2) elimination of historical depreciation and amortization expense of $21.1 million for the period January 1 through October 22, 2008. |
74
Table of Contents
| The $4.4 million increase in pro forma depreciation and amortization expense reflected in selling, general and administrative expenses is comprised of (1) estimated depreciation and amortization expense for the period January 1 through October 22, 2008 of $5.6 million based on estimated fair values and useful lives of identified tangible and intangible assets, and (2) elimination of historical depreciation and amortization expense of $1.2 million for the period January 1 through October 22, 2008: |
| Estimated depreciation and amortization expense | |||||||||||||||||
| (in thousands, except useful lives) | Historical net book value | Estimated fair value | Estimated useful lives (yrs) | Cost of goods sold | Selling, general and administrative | Total | |||||||||||
Land | $ | 34,058 | $ | 51,383 | n/a | $ | n/a | $ | n/a | $ | n/a | ||||||
Land improvements | 42,765 | 43,574 | 8 | 4,363 | 182 | 4,545 | |||||||||||
Buildings, machinery, and equipment | 130,249 | 210,850 | 9 | 18,891 | 787 | 19,678 | |||||||||||
Furniture, fixtures, office equipment, and other | 5,851 | 2,106 | 3 | 498 | 21 | 519 | |||||||||||
Construction in progress | 6,393 | 6,393 | n/a | n/a | n/a | n/a | |||||||||||
Customer relationships | n/a | 99,500 | 18 | n/a | 4,571 | 4,571 | |||||||||||
Trademarks | 6,488 | 19,400 | n/a | n/a | n/a | n/a | |||||||||||
Water rights | 12,144 | 12,144 | n/a | n/a | n/a | n/a | |||||||||||
Total | $ | 237,948 | $ | 445,350 | $ | 23,752 | $ | 5,561 | $ | 29,313 | |||||||
Less historical depreciation and amortization expense | 21,143 | 1,170 | 22,313 | ||||||||||||||
Adjustment for the transaction | $ | 2,609 | $ | 4,391 | $ | 7,000 | |||||||||||
| (g) | On September 16, 2009, we entered into a stock purchase agreement with Pilgrim’s Pride Corporation. Upon consummation of the transactions contemplated by the stock purchase agreement and in accordance with PPC’s amended joint plan of reorganization, we will purchase 64% of the total issued and outstanding new common stock of the reorganized PPC in exchange for aggregate consideration of $800.0 million in cash. The reorganized PPC is also expected to enter into a credit facility as it exits from bankruptcy consisting of a three-year revolving credit facility in the amount not to exceed $600.0 million, a three-year term loan A facility in the amount of up to $375.0 million and a five-year term loan B facility in the amount of up to $775.0 million. We refer to this financing arrangement as the Exit Facility. |
| The purchase price allocation is preliminary pending completion of the acquisition and the independent valuations by a third-party firm. The allocation presented below reflects management’s preliminary estimated fair values of the individual assets and liabilities as of December 23, 2009 (in thousands): |
| Purchase price allocation: | ||||
Purchase price paid to previous shareholders | $ | 800,000 | ||
Non-controlling interest(i) | 593,989 | |||
Total purchase price | $ | 1,393,989 | ||
Preliminary purchase price allocation: | ||||
Current assets and liabilities, net | $ | 582,699 | ||
Property, plant and equipment(ii) | 2,388,579 | |||
Intangible assets(iii) | 81,000 | |||
Goodwill | 58,107 | |||
Non-current assets and liabilities, net | (1,716,396 | ) | ||
Total purchase price allocation | $ | 1,393,989 | ||
| (i) | The non-controlling interest of $594.0 million is calculated based on a market share price of $7.70 as of December 22, 2009 multiplied by the number of shares outstanding of 77,141,389 at September 27, 2009. |
| (ii) | Property, plant and equipment was recorded at preliminary estimated fair values as of December 23, 2009 as follows (in thousands): |
Land | $ | 96,159 | |
Building, machinery, and equipment | 2,166,948 | ||
Autos and trucks | 50,529 | ||
Construction in progress | 74,943 | ||
Total plant, property and equipment | $ | 2,388,579 | |
| Depreciation and amortization is recorded using the straight-line method over the estimated useful lives of the assets as follows: |
Building, machinery, and equipment | 11 years | |
Autos and trucks | 5 years | |
75
Table of Contents
| (iii) | Identified intangible assets were recorded at preliminary estimated fair values as of December 23, 2009 as follows (in thousands): |
Customer relationships | $ | 45,611 | |
Trade names | 35,121 | ||
Non-compete agreement | 268 | ||
Total intangible assets | $ | 81,000 | |
| The customer relationship intangible asset is being amortized on a straight-line basis over 13 years. This represents management’s preliminary estimate of the period of economic benefit and annual customer profitability. The trade name intangible assets and non-compete intangible assets are being amortized on a straight-line basis over six and three years, respectively. |
| The $19.3 million decrease in pro forma depreciation and amortization expense for the period December 31, 2007 through December 28, 2008 reflected in cost of goods sold is comprised of (1) estimated depreciation and amortization expense of $190.5 million based on the estimated fair values and useful lives of identified tangible and intangible assets and (2) elimination of historical depreciation and amortization expense of $209.8 million. |
| The $2.9 million decrease in pro forma depreciation and amortization expense for the period December 31, 2007 through December 28, 2008 reflected in selling, general and administrative expenses is comprised of (1) estimated depreciation and amortization expense of $26.0 million based on the estimated fair values and useful lives of identified tangible and intangible assets and (2) elimination of historical depreciation and amortization expense of $28.9 million: |
| Estimated depreciation and amortization expense | ||||||||||||||||||||
| (in thousands, except useful lives) | Historical net book value | Estimated fair value | Estimated useful lives (yrs) | Cost of | Selling, general and administrative | Total | ||||||||||||||
Land | $ | $ | 96,159 | n/a | $ | n/a | $ | n/a | $ | n/a | ||||||||||
Buildings, machinery, and equipment | 2,166,948 | 11 | 181,236 | 15,760 | 196,996 | |||||||||||||||
Autos and trucks | 50,529 | 5 | 9,297 | 808 | 10,105 | |||||||||||||||
Construction in progress | 74,943 | n/a | n/a | n/a | n/a | |||||||||||||||
Customer relationships | 45,611 | 13 | n/a | 3,509 | | 3,509 | | |||||||||||||
Trade names | 35,121 | 6 | n/a | 5,854 | 5,854 | |||||||||||||||
Non-compete agreement | 268 | 3 | n/a | 89 | 89 | |||||||||||||||
Total | $ | 1,556,655 | $ | 2,469,579 | $ | 190,533 | $ | 26,020 | $ | 216,553 | ||||||||||
Less historical depreciation and amortization expense | 209,795 | 28,907 | 238,702 | |||||||||||||||||
Adjustment for the transaction | $ | (19,262 | ) | $ | (2,887 | ) | $ | (22,149 | ) | |||||||||||
| (h) | Reflects an estimated $2.2 million of incremental costs associated with being a public company on the New York Stock Exchange. This includes incremental audit fees, directors’ and officers’ insurance coverage, internal audit and Sarbanes-Oxley expenses and printing costs, based on preliminary discussions with anticipated service providers. |
| (i) | Reflects the following adjustments to interest expense, net (in thousands): |
Interest expense, 11.625% senior unsecured notes due 2014(i) | $ | 65,316 | ||
Debt issuance cost amortization, 11.625% senior unsecured notes due 2014(ii) | 638 | |||
Debt discount accretion, 11.625% senior unsecured notes due 2014(iii) | 7,814 | |||
Interest expense, intercompany debt(iv) | (27,047 | ) | ||
Interest expense, PPC debt(v) | (29,643 | ) | ||
Debt issuance cost amortization, PPC Exit Facility(vi) | 12,259 | |||
Total interest expense, net | $ | 29,337 | ||
| On April 27, 2009, our wholly owned subsidiaries, JBS USA, LLC and JBS USA Finance, Inc., issued 11.625% senior unsecured notes due 2014 in an aggregate principal amount of $700.0 million. Net proceeds, after deducting the debt discount costs of $48.7 million and debt issuance costs of $0.5 million, were $650.8 million. The net proceeds, in addition to $3.4 million of cash on hand, were applied to repay $550.8 million of the outstanding principal and accrued interest on intercompany loans to us from a subsidiary of JBS S.A. (reflecting $519.6 million outstanding principal payments and $31.2 million accrued interest), $100.0 million of borrowings under our secured revolving credit facility, and $3.4 million of additional debt issuance costs. In order to calculate the pro forma interest adjustments shown in (i), (ii) and (iii), we pro-rated the gross debt issuance costs and debt discount amounts based on the net proceeds used to repay the outstanding principal on intercompany loans of $519.6 million as a percentage of (1) total proceeds of $650.8 million less (2) debt issuance costs paid with $3.4 million cash on hand, or net proceeds of $647.4 million. These pro-rated amounts represent the costs we would have incurred to generate the net proceeds used to repay the outstanding principal on intercompany loans of $519.6 million. |
76
Table of Contents
| (i) | Includes pro forma interest expense on $561.9 million outstanding principal ($519.6 million proceeds plus $39.1 million of pro-rated bond discount and $3.2 million of pro-rated debt issuance costs) of our 11.625% senior unsecured notes due 2014 for the period from December 31, 2007 through December 28, 2008, calculated on a straight-line basis over five years. The $3.2 million pro-rated debt issuance cost is calculated as the ratio of the $519.6 million of outstanding principal on our consolidated intercompany loans which were repaid divided by net proceeds of $647.4 million multiplied by the total debt issuance costs of $4.0 million. The $39.1 million pro-rated bond discount is calculated as the ratio of $519.6 million of outstanding principal on our consolidated intercompany loans which were repaid divided by net proceeds of $647.4 million multiplied by bond discount of $48.7 million. The total principal amount of our 11.625% senior secured notes due 2014 is $700.0 million, and our pro forma interest expense accordingly does not purport to be indicative of what our interest expense will be in the future. |
| (ii) | Includes pro forma interest expense for the amortization of pro-rated debt issuance costs of $3.2 million on $561.9 million of our 11.625% senior unsecured notes due 2014 for the period from December 31, 2007 through December 28, 2008, calculated on a straight-line basis over five years. |
| (iii) | Includes pro forma interest expense for the accretion of the pro-rated bond discount of $39.1 million on $561.9 million of our 11.625% senior unsecured notes due 2014 for the period from December 31, 2007 through December 28, 2008, calculated on a straight-line basis over five years. |
| (iv) | Includes the reduction of pro forma interest expense for the period from December 31, 2007 through December 28, 2008 on our consolidated intercompany loans from JBS S.A. due to a $519.6 million reduction in the aggregate principal amount of those loans using a portion of the net proceeds of our 11.625% senior unsecured notes due 2014. The $27.0 million reduction of interest expense is comprised of the (1) elimination of actual interest costs of $31.1 million incurred on outstanding borrowings for the period from December 31, 2007 through December 28, 2008 less (2) historical interest expense of $4.1 million on average borrowings of $194.8 million for a 124-day period for which the borrowings were in excess of $519.6 million at an average interest rate of 6.10%. |
| (v) | The $29.7 million decrease in pro forma interest expense is comprised of (1) elimination of historical interest expense of $139.6 million incurred on PPC’s historical borrowings for the period December 31, 2007 through December 28, 2008 net of (2) $109.9 million of interest expense on $1,570.3 million outstanding borrowings for the period December 31, 2007 through December 28, 2008 at an estimated average interest rate of 7.0% related to PPC’s anticipated Exit Facility. The historical interest income recognized by PPC and the historical interest expense associated with PPC’s Mexican revolving credit facility were not adjusted as it was not part of the bankruptcy filing. |
| (vi) | Includes pro forma interest expense of $12.3 million for the amortization of debt issuance costs related to the PPC Exit Facility for the period December 31, 2007 through December 28, 2008, calculated on a straight-line basis over a weighted average life of 3.9 years. |
| (j) | The $252.6 million pro forma income tax benefit is comprised of the (1) historical income tax expense of JBS USA Holdings, Inc. and (2) income tax benefit from the pro forma income (loss) from continuing operations on all pro forma adjustments as follows (in thousands): |
JBS USA Holdings, Inc., historical income tax expense | $ | 31,287 | ||||||||
Income (loss) from continuing operations before income taxes: | ||||||||||
Packerland, historical | (+ | ) | (3,529 | ) | ||||||
Packerland, adjustment for 50% equity interest in Five Rivers | (- | ) | (39,139 | ) | ||||||
Packerland, adjustments for assets not acquired | (- | ) | (43,893 | ) | ||||||
Five Rivers, historical | (+ | ) | (78,278 | ) | ||||||
Five Rivers, adjustments for assets not acquired | (- | ) | (92,993 | ) | ||||||
Pilgrim’s Pride, historical | (+ | ) | (1,390,272 | ) | ||||||
Pilgrim’s Pride, goodwill impairment (non deductible) | (+ | ) | 501,446 | |||||||
Adjustment for pro forma transactions | (+ | ) | (16,415 | ) | ||||||
Total loss from continuing operations | (811,023 | ) | ||||||||
Pro forma income tax benefit at 35% | (283,860 | ) | ||||||||
Total pro forma income tax benefit | $ | (252,573 | ) |
| The Company has not yet reached a decision as to whether the undistributed earnings of PPC’s subsidiary in Mexico will continue to be permanently reinvested, and therefore the actual accounting for income taxes could differ. |
| (k) | Reflects the elimination of the 36% non-controlling shareholder net loss of PPC for purposes of calculating the earnings per share of the controlling shareholder. The $(379.3) million adjustment is calculated as follows (in thousands): |
Pilgrim’s Pride historical net loss | $ | (1,188,362 | ) | |
Pilgrim’s Pride adjustment for pro forma transactions: | ||||
Depreciation and amortization benefit | 22,149 | |||
Interest expense benefit(i) | 17,384 | |||
Income tax benefit(ii) | 95,343 | |||
Total Pilgrim’s Pride adjustment for pro forma transactions | 134,876 | |||
Pilgrim’s Pride adjusted pro forma net loss | (1,053,486 | ) | ||
Non-controlling shareholder pro forma interest (36%) | $ | (379,255 | ) |
77
Table of Contents
| (i) | Includes interest expense, PPC and amortization of debt issuance costs on PPC’s Exit Facility, as reflected in (i)(v) and (vi). |
| (ii) | The $95.3 million pro forma income tax benefit for PPC is comprised of the (1) $7.8 million tax effect of the pro forma depreciation and amortization adjustment ($22,149 multiplied by 35%), plus (2) $6.1 million tax effect of the pro forma interest expense ($17,384 multiplied by 35%), less (3) $311.1 million tax effect of the historical PPC loss from continuing operations before the non-taxable goodwill impairment and income taxes ($888,806 multiplied by 35%), plus (4) $201.9 million historical PPC income tax benefit. |
| (l) | Includes 40% of the 33 1/3 shares of our common stock sold related to the BNDESPAR transaction. We reflect only 40% of these shares because 40% of the proceeds of the sale of the shares (40% of $2.0 billion, which is $800.0 million) are expected to be used to pay the cash consideration for the Proposed PPC Acquisition and are therefore directly attributable to the Proposed PPC Acquisition. See note (g) above. We intend to initially fund a portion of the cash consideration for the Proposed PPC Acquisition from cash received from subsidiaries and cash on hand pending the funding of the remaining portion of our $2.0 billion stock purchase agreement with JBS S.A., which we expect to occur following the issuance by JBS S.A. of the debentures in connection with the BNDESPAR transaction. This interim funding would not require us to modify the contract described in “Principal and selling stockholder—JBS S.A. purchase and sale agreement” or the proceeds ultimately received from JBS S.A. under that contract. |
78
Table of Contents
Unaudited pro forma combined statement of operations for the thirty-nine weeks ended September 27, 2009
| JBS USA Holdings, Inc. | Pilgrim’s Pride | JBS USA Holdings, Inc. | ||||||||||||||||
| September 27, 2009 | Thirty-nine weeks ended September 26, 2009 | Adjustment for transactions | September 27, 2009 | |||||||||||||||
| Historical | Pro forma | |||||||||||||||||
| in thousands, except earnings per share | (a) (+) | (+) | Notes | |||||||||||||||
Net sales | $ | 10,011,154 | $ | 5,211,064 | $ | (28,047 | ) | (b) | $ | 15,194,171 | ||||||||
Cost of goods sold | 9,673,675 | 4,744,784 | (35,678 | ) | (b), (c) | 14,382,781 | ||||||||||||
Restructuring items | — | 12,464 | — | 12,464 | ||||||||||||||
Gross profit | 337,479 | 453,816 | 7,631 | 798,926 | ||||||||||||||
Selling, general and administrative expenses | 158,440 | 208,683 | 1,154 | (c), (d) | 368,277 | |||||||||||||
Restructuring items | — | (435 | ) | — | (435 | ) | ||||||||||||
Foreign currency transaction gains | (60,867 | ) | — | — | (60,867 | ) | ||||||||||||
Other income, net | (3,629 | ) | (2,273 | ) | — | (5,902 | ) | |||||||||||
Gain on sales of property, plant and equipment | (181 | ) | — | — | (181 | ) | ||||||||||||
Interest expense, net | 69,515 | 118,505 | (16,273 | ) | (e) | 171,747 | ||||||||||||
Total expenses | 163,278 | 324,480 | (15,119 | ) | 472,639 | |||||||||||||
Income from continuing operations before reorganization items and before income taxes | 174,201 | 129,336 | 22,750 | 326,287 | ||||||||||||||
Reorganization items | — | 74,025 | — | 74,025 | ||||||||||||||
Income from continuing operations before income taxes | 174,201 | 55,311 | 22,750 | 252,262 | ||||||||||||||
Income tax expense (benefit) | 58,236 | (21,864 | ) | 49,185 | (f) | 85,557 | ||||||||||||
Net income (loss) | 115,965 | 77,175 | (26,435 | ) | 166,705 | |||||||||||||
Less net income attributable to non-controlling interest in PPC | — | — | 21,135 | (g) | 21,135 | |||||||||||||
Net income (loss) attributable to controlling shareholder | 115,965 | 77,175 | (47,570 | ) | 145,570 | |||||||||||||
Basic and diluted net income per share of common stock | $ | 1,159,650 | $ | 1,284,440 | ||||||||||||||
Shares outstanding | 100 | 13 1/3 | (h) | 113 1/3 | ||||||||||||||
| (a) | Represents the historical results of Pilgrim’s Pride for the thirty-nine weeks ended September 26, 2009 by combining the financial results for the fiscal year ended September 26, 2009 less the three months ended December 27, 2008, as follows: |
| Pilgrim’s Pride | ||||||||||||
| Fiscal year ended September 26, 2009 | Three months ended December 27, 2008 | 39 Weeks ended September 26, 2009 | ||||||||||
| in thousands | (-) | Pro forma | ||||||||||
Net sales | $ | 7,088,055 | $ | 1,876,991 | $ | 5,211,064 | ||||||
Cost of goods sold | 6,705,157 | 1,960,373 | 4,744,784 | |||||||||
Restructuring items | 12,464 | — | 12,464 | |||||||||
Gross profit (loss) | 370,434 | (83,382 | ) | 453,816 | ||||||||
Selling, general and administrative expenses | 301,120 | 92,437 | 208,683 | |||||||||
Restructuring items | 1,987 | 2,422 | (435 | ) | ||||||||
Other income, net | (3,724 | ) | (1,451 | ) | (2,273 | ) | ||||||
Interest expense, net | 157,543 | 39,038 | 118,505 | |||||||||
Total expenses | 456,926 | 132,446 | 324,480 | |||||||||
Income (loss) from continuing operations before reorganization items and before income taxes | (86,492 | ) | (215,828 | ) | 129,336 | |||||||
Reorganization items | 87,275 | 13,250 | 74,025 | |||||||||
Income (loss) from continuing operations before income taxes | (173,767 | ) | (229,078 | ) | 55,311 | |||||||
Income tax expense (benefit) | (21,586 | ) | 278 | (21,864 | ) | |||||||
Net income (loss) | $ | (152,181 | ) | $ | (229,356 | ) | $ | 77,175 | ||||
79
Table of Contents
| (b) | Reflects the elimination of $28.0 million of intercompany sales and $28.0 million of intercompany purchases (recorded as cost of goods sold) between us and Pilgrim’s Pride for the period from December 29, 2008 through September 27, 2009. |
| (c) | On September 16, 2009, we entered into a stock purchase agreement with Pilgrim’s Pride Corporation. Upon consummation of the transactions contemplated by the stock purchase agreement and in accordance with PPC’s amended joint plan of reorganization, we will purchase 64% of the total issued and outstanding new common stock of the reorganized PPC, in exchange for aggregate consideration of $800.0 million in cash. The reorganized PPC is also expected to enter into a credit facility as it exits from bankruptcy consisting of a three-year revolving credit facility in the amount not to exceed $600.0 million, a three-year term loan A facility in the amount of up to $375.0 million and a five-year term loan B facility in the amount of up to $775.0 million. We refer to this financing arrangement as the Exit Facility. |
| The purchase price allocation is preliminary pending completion of the acquisition and the independent valuations by a third-party firm. The allocation presented below reflects management’s estimated fair values of the individual assets and liabilities as of December 23, 2009 (in thousands): |
Purchase price allocation: | ||||
Purchase price paid to previous shareholders | $ | 800,000 | ||
Non-controlling interest(i) | 593,989 | |||
Total purchase price | $ | 1,393,989 | ||
Preliminary purchase price allocation: | ||||
Current assets and liabilities, net | $ | 582,699 | ||
Property, plant and equipment(ii) | 2,388,579 | |||
Intangible assets(iii) | 81,000 | |||
Goodwill | 58,107 | |||
Non-current assets and liabilities, net | (1,716,396 | ) | ||
Total purchase price allocation | $ | 1,393,989 | ||
| (i) | The non-controlling interest of $594.0 million is calculated based on a market share price of $7.70 as of December 22, 2009 multiplied by the number of shares outstanding of 77,141,389 at September 27, 2009. |
| (ii) | Property, plant and equipment was recorded at preliminary estimated fair values as of December 23, 2009 (in thousands). |
Land | $ | 96,159 | |
Building, machinery, and equipment | 2,166,948 | ||
Autos and trucks | 50,529 | ||
Construction in progress | 74,943 | ||
Total plant, property and equipment | $ | 2,388,579 | |
| Depreciation and amortization is recorded using the straight-line method over the estimated useful lives of the assets as follows: |
Building, machinery, and equipment | 11 years | |
Autos and trucks | 5 years | |
| (iii) | Identified intangible assets were recorded at preliminary estimated fair values as of December 23, 2009 (in thousands): |
Customer relationships. | $ | 45,611 | |
Trade names | 35,121 | ||
Non-compete agreement | 268 | ||
Total intangible assets | $ | 81,000 | |
| The customer relationship intangible asset is being amortized on a straight-line basis over 13 years. This represents management’s preliminary estimate of the period of economic benefit and annual customer profitability. The trade name intangible assets and non-compete intangible assets are being amortized on a straight-line basis over six and three years, respectively. |
| The $7.6 million decrease in pro forma depreciation and amortization expense reflected in cost of goods sold is comprised of (1) the estimated depreciation and amortization expense of $142.9 million based on estimated fair values and useful lives of identified tangible and intangible assets, and (2) elimination of historical depreciation and amortization expense of $150.5 million for the period December 29, 2008 through September 27, 2009. |
80
Table of Contents
| The $0.5 million decrease in pro forma depreciation and amortization expense for the period December 29, 2008 through September 27, 2009 reflected in selling, general and administrative expenses is comprised of (1) estimated depreciation and amortization expense of $19.5 million based on the estimated fair values and useful lives of identified tangible and intangible assets and (2) elimination of historical depreciation and amortization expense of $20.0 million: |
| Estimated depreciation and amortization expense | ||||||||||||||||||||
| (in thousands, except useful lives) | Historical net book value | Estimated fair value | Estimated useful lives (yrs) | Cost of goods sold | Selling, general and administrative | Total | ||||||||||||||
Land | $ | 96,159 | n/a | $ | n/a | $ | n/a | $ | n/a | |||||||||||
Buildings, machinery, and equipment | 2,166,948 | 11 | 135,927 | 11,820 | 147,747 | |||||||||||||||
Autos and trucks | 50,529 | 5 | 6,973 | 606 | 7,579 | |||||||||||||||
Construction in progress | 74,943 | n/a | n/a | n/a | n/a | |||||||||||||||
Customer relationships | 45,611 | 13 | n/a | 2,631 | 2,631 | |||||||||||||||
Trade names | 35,121 | 6 | n/a | 4,390 | 4,390 | |||||||||||||||
Non-compete agreement | 268 | 3 | n/a | 67 | 67 | |||||||||||||||
Total | $ | 1,556,655 | $ | 2,469,579 | $ | 142,900 | $ | 19,514 | $ | 162,414 | ||||||||||
Less historical depreciation and amortization expense | 150,531 | 20,028 | 170,559 | |||||||||||||||||
Adjustment for the transaction | $ | (7,631 | ) | $ | (514 | ) | $ | (8,145 | ) | |||||||||||
| (d) | Reflects an estimated $1.7 million of incremental costs associated with being a public company on the New York Stock Exchange. These costs include incremental audit fees, directors’ and officers’ insurance, internal audit and Sarbanes-Oxley expenses and printing costs, based on preliminary discussions with anticipated service providers. |
| (e) | Reflects the following adjustments to interest expense, net (in thousands): |
Interest expense, 11.625% senior unsecured notes due 2014(i) | $ | 21,533 | ||
Debt issuance cost amortization, 11.625% senior unsecured notes due 2014(ii) | 210 | |||
Debt discount accretion, 11.625% senior unsecured notes due 2014(iii) | 2,576 | |||
Interest expense, intercompany debt(iv) | (13,726 | ) | ||
Interest expense, PPC debt(v) | (36,060 | ) | ||
Debt issuance cost amortization, PPC Exit Facility (vi) | 9,194 | |||
Total interest expense, net | $ | (16,273 | ) | |
| On April 27, 2009, our wholly owned subsidiaries, JBS USA, LLC and JBS USA Finance, Inc., issued 11.625% senior unsecured notes due 2014 in an aggregate principal amount of $700.0 million. Net proceeds, after deducting the debt discount costs of $48.7 million and debt issuance costs of $0.5 million, were $650.8 million. The net proceeds, in addition to $3.4 million of cash on hand, were applied to repay $550.8 million of the outstanding principal and accrued interest on intercompany loans to us from a subsidiary of JBS S.A. (reflecting $519.6 million outstanding principal payments and $31.2 million accrued interest), $100.0 million of borrowings under our secured revolving credit facility, and $3.4 million of additional debt issuance costs. In order to calculate the pro forma interest adjustments shown in (i), (ii) and (iii), we pro-rated the gross debt issuance costs and debt discount amounts based on the net proceeds used to repay the outstanding principal on intercompany loans of $519.6 million as a percentage of (1) total proceeds of $650.8 million less (2) debt issuance costs paid with $3.4 million cash on hand, or net proceeds of $647.4 million. These pro-rated amounts represent the costs we would have incurred to generate the net proceeds used to repay the outstanding principal on intercompany loans of $519.6 million. |
| (i) | Includes pro forma interest expense on $561.9 million outstanding principal ($519.6 million proceeds plus $39.1 million of pro-rated bond discount and $3.2 million of pro-rated debt issuance costs) of our 11.625% senior unsecured notes due 2014 for the period from December 29, 2008 through April 27, 2009, calculated on a straight-line basis over five years. The $3.2 million pro-rated debt issuance cost is calculated as the ratio of the $519.6 million of outstanding principal on our consolidated intercompany loans which were repaid divided by net proceeds of $647.4 million multiplied by the total debt issuance costs of $4.0 million. The $39.1 million pro-rated bond discount is calculated as the ratio of $519.6 million of outstanding principal on our consolidated intercompany loans which were repaid divided by net proceeds of $647.4 million multiplied by bond discount of $48.7 million. The total principal amount of our 11.625% senior secured notes due 2014 is $700.0 million, and our pro forma interest expense accordingly does not purport to be indicative of what our interest expense will be in the future. |
| (ii) | Includes pro forma interest expense for the amortization of pro-rated debt issuance costs of $3.2 million on $561.9 million of our 11.625% senior unsecured notes due 2014 for the period from December 29, 2008 through April 27, 2009, calculated on a straight-line basis over five years. |
| (iii) | Includes pro forma interest expense for the accretion of the pro-rated bond discount of $39.1 million on $561.9 million of our 11.625% senior unsecured notes due 2014 for the period from December 29, 2008 through April 27, 2009, calculated on a straight-line basis over five years. |
81
Table of Contents
| (iv) | Includes the reduction of pro forma interest expense for the period from December 29, 2008 through May 12, 2009 on our consolidated intercompany loans from JBS S.A. due to a $519.6 million reduction in the aggregate principal amount of those loans using a portion of the net proceeds of our 11.625% senior unsecured notes due 2014. The $13.7 million reduction of interest expense is comprised of (1) elimination of actual interest costs of $17.4 million incurred on outstanding borrowings for the period from December 29, 2008 through May 12, 2009 less (2) interest expense of $3.7 million on average borrowings of $139.0 million for a 135-day period for which the borrowings were in excess of $519.6 million at an average interest rate of 7.0%. |
| (v) | The $36.1 million decrease in pro forma interest expense is comprised of (1) elimination of historical interest expense of $118.5 million incurred on PPC’s historical borrowings for the period December 29, 2008 through September 27, 2009 net of (2) $82.4 million of interest expense on $1,570.3 million outstanding borrowings for the period December 29, 2008 through September 27, 2009 at an estimated average interest rate of 7.0% related to PPC’s anticipated Exit Facility. The historical interest income recognized by PPC and the historical interest expense associated with PPC’s Mexican revolving credit facility was not adjusted as it was not part of the bankruptcy filing. |
| (vi) | Includes pro forma interest expense of $9.2 million for the amortization of debt issuance costs related to the Exit Facility for the period December 29, 2008 through September 27, 2009, calculated on a straight-line basis over a weighted average life of 3.9 years. |
| (f) | The $85.6 million pro forma income tax expense is comprised of (1) historical income tax expense of JBS USA Holdings, Inc. and (2) income tax expense from pro forma income from continuing operations on all pro forma adjustments as follows (in thousands): |
JBS USA Holdings Inc., historical income tax expense | $ | 58,236 | |||||
Income from continuing operations before income taxes: | |||||||
Pilgrim’s Pride, historical | (+) | 55,311 | |||||
Adjustment for transactions | (+) | 22,750 | |||||
Total income from continuing operations | 78,061 | ||||||
Pro forma income tax expense at 35% | 27,321 | ||||||
Total pro forma income tax expense | $ | 85,557 | |||||
| The Company has not yet reached a decision as to whether the undistributed earnings of PPC’s subsidiary in Mexico will continue to be permanently reinvested, and therefore the actual accounting for income taxes could differ. |
| (g) | Reflects the elimination of the 36% non-controlling shareholder net income of PPC for purposes of calculating the earnings per share of the controlling shareholder. The $21.1 million adjustment is calculated as follows (in thousands): |
Pilgrim’s Pride historical net income | $ | 77,175 | ||
Pilgrim’s Pride adjustment for pro forma transactions: | ||||
Depreciation and amortization benefit | 8,145 | |||
Interest expense benefit(i) | 26,866 | |||
Income tax expense(ii) | (53,477 | ) | ||
Total Pilgrim’s Pride adjustment for pro forma transactions | (18,466 | ) | ||
Pilgrim’s Pride adjusted pro forma net income | 58,709 | |||
Non-controlling shareholder pro forma interest (36%) | $ | 21,135 | ||
| (i) | Includes interest expense for PPC and amortization of debt issuance costs on PPC’s Exit Facility, as reflected in (e)(v) and (vi). |
| (ii) | The $53.5 million pro forma income tax expense for PPC is comprised of the following (1) $2.8 million tax effect of the pro forma depreciation and amortization adjustment ($8,145 multiplied by 35%), plus (2) $9.4 million tax effect of the pro forma interest expense ($26,866 multiplied by 35%), plus (3) $19.4 million tax effect of historical PPC income from continuing operations before income taxes ($55,311 multiplied by 35%), plus (4) $21.9 million historical PPC income tax benefit. |
| (h) | Includes 40% of the shares of our common stock sold related to the BNDESPAR transaction. We reflect only 40% of these shares because 40% of the proceeds of the sale of the shares (40% of $2.0 billion, which is $800.0 million) are expected to be used to pay the cash consideration for the Proposed PPC Acquisition and are therefore directly attributable to the Proposed PPC Acquisition. See note (c) above. We intend to initially fund a portion of the cash consideration for the Proposed PPC Acquisition from cash received from subsidiaries and cash on hand pending the funding of the remaining portion of our $2.0 billion stock purchase agreement with JBS S.A., which we expect to occur following the issuance by JBS S.A. of the debentures in connection with the BNDESPAR transaction. This interim funding would not require us to modify the contract described in “Principal and selling stockholder—JBS S.A. purchase and sale agreement” or the proceeds ultimately received from JBS S.A. under that contract. |
82
Table of Contents
Unaudited pro forma balance sheet as of September 27, 2009
| (in thousands) | JBS USA Holdings, Inc. | Pilgrim’s Pride(a) | Adjustments for the transactions | Notes | JBS USA Holdings, Inc. Pro forma | ||||||||||||
Assets | |||||||||||||||||
Current assets: | |||||||||||||||||
Cash and cash equivalents | $ | 105,740 | $ | 225,331 | $ | 974,669 | (b),(c) | $ | 1,305,740 | ||||||||
Trade accounts receivable, net | 607,158 | 316,953 | — | 924,111 | |||||||||||||
Inventories | 679,251 | 763,869 | — | 1,443,120 | |||||||||||||
Other current assets | 163,883 | 60,041 | — | 223,924 | |||||||||||||
Total current assets | 1,556,032 | 1,366,194 | 974,669 | 3,896,895 | |||||||||||||
Property, plant and equipment, net | 1,232,756 | 1,499,476 | 889,103 | (d) | 3,621,335 | ||||||||||||
Goodwill | 229,971 | — | 58,107 | (e) | 288,078 | ||||||||||||
Other intangibles, net | 267,107 | 57,179 | 23,821 | (f) | 348,107 | ||||||||||||
Other assets | 240,016 | 137,655 | 19,034 | (g) | 396,705 | ||||||||||||
Total assets | $ | 3,525,882 | $ | 3,060,504 | $ | 1,964,734 | $ | 8,551,120 | |||||||||
Liabilities and stockholder’s equity | |||||||||||||||||
Current liabilities: | |||||||||||||||||
Short-term debt | $ | 29,955 | $ | — | $ | 50,000 | (h) | $ | 79,955 | ||||||||
Current portion of long-term debt | 4,461 | — | — | 4,461 | |||||||||||||
Accounts payable, including book overdrafts | 344,009 | 182,173 | — | 526,182 | |||||||||||||
Accrued liabilities | 414,277 | 325,991 | — | 740,268 | |||||||||||||
Total current liabilities | 792,702 | 508,164 | 50,000 | 1,350,866 | |||||||||||||
Long-term debt, less current portion | 787,952 | 41,062 | 1,520,303 | (h) | 2,349,317 | ||||||||||||
Liabilities subject to compromise | — | 2,233,161 | (2,233,161 | ) | (i) | — | |||||||||||
Other non-current liabilities | 368,590 | 127,197 | 184,523 | (j) | 680,310 | ||||||||||||
Total liabilities | 1,949,244 | 2,909,584 | (478,335 | ) | 4,380,493 | ||||||||||||
Stockholder’s equity: | |||||||||||||||||
Common stock | — | 771 | (771 | ) | (k) | — | |||||||||||
Additional paid-in capital | 1,400,159 | 646,793 | 1,353,207 | (k),(l) | 3,400,159 | ||||||||||||
Accumulated earnings (loss) | 165,477 | (469,407 | ) | 469,407 | (k) | 165,477 | |||||||||||
Accumulated other comprehensive income (loss) | 11,002 | (27,237) | 27,237 | (k) | 11,002 | ||||||||||||
Total JBS USA Holdings, Inc. equity | 1,576,638 | 150,920 | 1,849,080 | 3,576,638 | |||||||||||||
Non-controlling interest in PPC | — | — | 593,989 | (m) | 593,989 | ||||||||||||
Total stockholder’s equity | 1,576,638 | 150,920 | 2,443,069 | 4,170,627 | |||||||||||||
Total liabilities and stockholder’s equity | $ | 3,525,882 | $ | 3,060,504 | $ | 1,964,734 | $ | 8,551,120 | |||||||||
83
Table of Contents
| (a) | Reflects the audited historical balance sheet for Pilgrim’s Pride as of September 26, 2009. |
| (b) | Reflects the reduction of PPC historical cash on hand at September 26, 2009 to be applied as a reduction of the initial borrowings under the Exit Facility and the payment of debt issuance costs related thereto. |
| (c) | Reflects the $2.0 billion sale of our common stock related to the BNDESPAR transaction, less $800.0 million of such proceeds to fund the Proposed PPC Acquisition. We intend to initially fund a portion of the cash consideration for the Proposed PPC Acquisition from cash received from our subsidiaries and from cash on hand. This interim funding would not require us to modify the contracts described in “Principal and selling stockholder—BNDESPAR transaction” and “—JBS S.A. purchase and sale agreement” and would not alter the common stock sold or the proceeds ultimately received under those contracts. |
| (d) | Reflects the estimated preliminary fair value adjustment to historical cost of PPC’s property, plant and equipment. See footnote (c) to the Unaudited pro forma combined statement of operations for the thirty-nine weeks ended September 27, 2009. |
| (e) | Reflects the excess of the purchase price of the Proposed PPC Acquisition over the preliminary estimated fair value of assets acquired and liabilities assumed of PPC. See footnote (c) to the Unaudited pro forma combined statement of operations for the thirty-nine weeks ended September 27, 2009. |
| (f) | Reflects the preliminary estimated fair value adjustment to historical cost of PPC’s other intangible assets (customer relationships, trade names, and non-compete agreements). See footnote (c) to the Unaudited pro forma combined statement of operations for the thirty-nine weeks ended September 27, 2009. |
| (g) | The $19.0 million increase in other non-current assets reflects the additional debt issuance costs associated with the Exit Facility of $45.6 million, which will be amortized as interest expense on a straight-line basis over a weighted average life of 3.9 years, less (1) a $19.1 million decrease in debt issuance costs related to historical PPC debt and less (2) a $7.5 million deferred tax asset that no longer exists after applying purchase accounting. |
| (h) | Reflects the estimated borrowings under the Exit Facility. |
| (i) | Reflects the elimination of PPC’s historical liabilities subject to compromise resulting from payment of those liabilities upon PPC’s emergence from bankruptcy as a condition precedent to the Proposed PPC Acquisition. |
| (j) | Reflects the non-current deferred tax liability associated with the fair value adjustments on identified tangible and intangible assets at a 35% tax rate and the elimination of the portion of PPC’s valuation allowance that is no longer necessary following the Proposed PPC Acquisition. |
| (k) | Reflects the elimination of historical stockholders’ equity of PPC. |
| (l) | Reflects the $2.0 billion sale of our common stock related to the BNDESPAR transaction, of which $800.0 million of such proceeds will be used to fund the Proposed PPC Acquisition. We intend to initially fund a portion of the cash consideration for the Proposed PPC Acquisition from cash received from our subsidiaries and from cash on hand. This interim funding would not require us to modify the contracts described in “Principal and selling stockholder—BNDESPAR transaction” and “—JBS S.A. purchase and sale agreement” and would not alter the common stock sold or the proceeds ultimately received under those contracts. |
| (m) | The non-controlling interest of $594.0 million is calculated based on a market share price of $7.70 as of December 22, 2009 multiplied by the number of shares outstanding of 77,141,389 at September 27, 2009. |
84
Table of Contents
Management’s discussion and analysis of financial condition and results of operations
Overview
JBS USA Holdings, Inc.
JBS USA Holdings, Inc. is one of the world’s largest beef and pork processing companies with approximately $15.4 billion in net sales for the fiscal year ended December 28, 2008 on a pro forma basis (excluding the net sales for the Proposed PPC Acquisition). In terms of daily slaughtering capacity, we are among the leading beef and pork processors in the United States and we believe we are the number one processor of beef in Australia. We believe we also own and operate the largest feedlot business in the United States, and upon consummation of the Proposed PPC Acquisition, we will be one of the largest chicken producers in the United States in terms of daily processing capacity.
We process, package and deliver fresh, processed and value-added beef, pork, lamb and mutton products to customers in over 60 countries on six continents. Our operations supply fresh meat products, processed meat products and value-added meat products. Fresh meat products include refrigerated beef and pork processed to standard industry specifications and sold primarily in boxed form. Our processed meat offerings, which include beef and pork products, are cut, ground and packaged to meet customer specifications. Our value-added products include moisture-enhanced, seasoned, marinated and consumer-ready products.
We sell our products primarily to retail customers, such as grocery store chains, wholesale clubs and other retail distributors and foodservice customers (such as foodservice distributors, further processors and chain restaurants). We also produce and sell by-products derived from our meat processing operations, such as hides and variety meats, to customers in the clothing, pet food and automotive industries, among others.
Pilgrim’s Pride operates as a vertically integrated company and controls every phase of the production of its products, including feed mills, hatcheries, processing plants and distribution centers in 14 U.S. states, Puerto Rico and Mexico. We will produce both fresh and prepared chicken products for sale to customers in retail, foodservice and international distribution channels in over 80 countries on six continents. Our fresh chicken products will include refrigerated whole and cut-up chickens and prepackaged case-ready chicken. Case-ready chicken includes various combinations of freshly refrigerated whole chickens and chicken parts ready for the retail grocer’s fresh meat counter. Our prepared chicken products will include refrigerated and frozen portion-controlled breast fillets, tenderloins and strips, delicatessen products and salads, formed nuggets and patties, and bone-in chicken parts. Our prepared chicken products may be fully cooked, partially cooked or raw and will include breaded and marinated products.
Our business operations are currently organized into two segments:
| • | our Beef segment, through which we conduct our domestic beef processing business, including the beef operations we acquired in the JBS Packerland Acquisition, and our international beef, lamb and sheep processing businesses that we acquired in the Tasman Acquisition; and |
| • | our Pork segment, through which we conduct our domestic pork and lamb processing business. |
85
Table of Contents
We also present “Corporate and other” in our financial statements, which include certain revenues and expenses not directly attributable to the primary segments, as well as eliminations resulting from the consolidation process.
Upon consummation of the Proposed PPC Acquisition, we will report Chicken as a third and separate segment in our consolidated financial statements for periods following the consummation of the Proposed PPC Acquisition. The domestic and international chicken processing operations of Pilgrim’s Pride will comprise our Chicken segment.
We are a wholly owned indirect subsidiary of JBS S.A., the world’s largest beef producer, which, including our operations, has a daily slaughtering capacity of 73,940 cattle. In the thirty-nine weeks ended September 27, 2009, we represented approximately 76% of JBS S.A.’s gross revenues. Over the past few years, JBS S.A. has acquired several U.S. and Australian beef and pork processing companies which now comprise JBS USA Holdings, Inc. and its subsidiaries:
| • | on July 11, 2007, JBS S.A. acquired Swift Foods Company (our predecessor company, which was subsequently renamed JBS USA Holdings, Inc.), which we refer to as the Swift Acquisition; |
| • | on May 2, 2008, we acquired substantially all of the assets of the Tasman Group Services, Pty. Ltd., or the Tasman Group, which we refer to as the Tasman Acquisition; and |
| • | on October 23, 2008, we acquired Smithfield Beef Group, Inc. (which we subsequently renamed JBS Packerland), which included the 100% acquisition of Five Rivers, the world’s largest feedlot operation. We refer to this transaction as the JBS Packerland Acquisition. |
In addition to these beef and pork processing companies, on September 16, 2009, we entered into a stock purchase agreement with Pilgrim’s Pride Corporation. Upon consummation of the transactions contemplated by the stock purchase agreement and in accordance with PPC’s amended plan of reorganization, we will purchase 64% of the total issued and outstanding new common stock of Pilgrim’s Pride, as reorganized in accordance with the amended joint plan of reorganization, in exchange for aggregate consideration of $800.0 million in cash. The reorganized PPC is also expected to enter into a credit facility as it exits from bankruptcy consisting of a three-year revolving credit facility in the amount not to exceed $600.0 million, a three-year term loan A facility in the amount of up to $375.0 million and a five-year term loan B facility in the amount of up to $775.0 million. We refer to this financing as the Exit Facility. In addition, under the terms of the reorganized PPC’s restated certificate of incorporation, in the event we complete this offering or any other initial public offering of our common stock and the offered shares are listed on a national exchange, we will have the right, subject to certain restrictions, to cause each share of the reorganized PPC common stock to be exchanged for new shares of our common stock according to a specified ratio. See “The Proposed PPC Acquisition—Conversion of reorganized PPC common stock into our common stock.”
Critical accounting policies and estimates
The preparation of consolidated financial statements requires us to make estimates and assumptions. These estimates and assumptions affect the reported amounts of assets and liabilities and disclosure of contingent assets and liabilities at the date of the consolidated financial statements and the reported amounts of revenues and expenses during the reporting period. Actual results could differ from those estimates. The following is a summary of certain accounting estimates we consider critical. See Note 4, “Basis of presentation and accounting policies,” to our audited combined financial statements included elsewhere in this prospectus for a detailed discussion of these and other accounting policies.
86
Table of Contents
Contingent liabilities
From time to time we are subject to lawsuits, investigations and other claims related to wage and hour/labor, livestock procurement, securities, environmental, product, taxes and other matters, and are required to assess the likelihood of any adverse judgments or outcomes to these matters, as well as potential ranges of probable losses. A determination of the amount of reserves and disclosures required, if any, for these contingencies is made after considerable analysis of each individual issue. We accrue for contingent liabilities when an assessment of the risk of loss is probable and can be reasonably estimated. We disclose contingent liabilities when the risk of loss is reasonably possible or probable. Due to the unpredictable nature of these lawsuits, investigations, and claims, our contingent liabilities reflect uncertainties. The eventual outcome will result from future events, and determination of current reserves requires estimates and judgments related to future changes in facts and circumstances, differing interpretations of the law and assessments of the amount of damages, and the effectiveness of strategies or other factors beyond our control. We have not made any material changes in the accounting methodology used to establish our contingent liabilities during the past three fiscal years. We do not believe there is a reasonable likelihood there will be a material change in the estimates or assumptions used to calculate our contingent liabilities. However, if actual results are not consistent with our estimates or assumptions, we may be exposed to gains or losses that could be material.
Marketing and advertising costs
We incur advertising, retailer incentive and consumer incentive costs to promote products through marketing programs. These programs include cooperative advertising, volume discounts, in-store display incentives, coupons and other programs. Marketing and advertising costs are charged in the period incurred. We accrue costs based on the estimated performance, historical utilization and redemption of each program. Cash consideration given to customers is considered a reduction in the price of our products, and thus is recorded as a reduction to sales. The remainder of marketing and advertising costs is recorded as a selling, general and administrative expense. Recognition of the costs related to these programs contains uncertainties due to the judgment required to estimate the potential performance and redemption of each program. These estimates are based on many factors, including experience of similar promotional programs. We have not made any material changes in the accounting methodology used to establish our marketing accruals during the past three fiscal years. We do not believe there is a reasonable likelihood there will be a material change in the estimates or assumptions used to calculate our marketing accruals. However, if actual results are not consistent with our estimates or assumptions, we may be exposed to gains or losses that could be material.
Accrued self-insurance
We are self-insured for employee medical and dental benefits and purchase insurance policies with deductibles for certain losses related to worker’s compensation and property and casualty claims. We purchase stop-loss coverage in order to limit our exposure to any significant level of certain claims. Self-insured losses are accrued based upon periodic assessments of estimated settlements for known and anticipated claims. We have not made any material changes in the accounting methodology used to establish our self-insurance liability during the past three fiscal years. We do not believe there is a reasonable likelihood there will be a material change in the estimates or assumptions used to calculate our self-insurance liability. However, if actual results
87
Table of Contents
are not consistent with our estimates or assumptions, we may be exposed to gains or losses that could be material. A 10% increase in our estimated self-insurance liability at September 27, 2009 would increase the amount we recorded for our self-insurance liability by approximately $19.3 million.
Impairment of long-lived assets
Long-lived assets are evaluated for impairment whenever events or changes in circumstances indicate the carrying value may not be recoverable. Examples include a significant adverse change in the extent or manner in which we use a long-lived asset or a change in its physical condition. When evaluating long-lived assets for impairment, we compare the carrying value of the asset to the asset’s estimated undiscounted future cash flows. An impairment is indicated if the estimated future cash flows are less than the carrying value of the asset. The impairment is the excess of the carrying value over the fair value of the long-lived asset. Our impairment analysis contains uncertainties due to judgment in assumptions and estimates surrounding undiscounted future cash flows of the long-lived asset, including forecasting useful lives of assets and selecting the discount rate that reflects the risk inherent in future cash flows to determine fair value. We have not made any material changes in the accounting methodology used to evaluate the impairment of long-lived assets during the last three fiscal years. We do not believe there is a reasonable likelihood there will be a material change in the estimates or assumptions used to calculate impairments of long-lived assets. However, if actual results are not consistent with our estimates and assumptions used to calculate estimated future cash flows, we may be exposed to impairment losses that could be material.
Impairment of goodwill and other non-amortizing intangible assets
Goodwill impairment is determined using a two-step process. The first step is to identify if a potential impairment exists by comparing the fair value of an operating unit, which for us is a reportable segment, with its carrying amount, including goodwill. If the fair value of a segment exceeds its carrying amount, goodwill of the segment is not considered to have a potential impairment and the second step of the impairment test is not necessary. However, if the carrying amount of a segment exceeds its fair value, a second step is performed to determine if goodwill is impaired and to measure the amount of impairment loss to recognize, if any. The second step compares the implied fair value of goodwill with the carrying amount of goodwill. If the implied fair value of goodwill exceeds the carrying amount, then goodwill is not considered impaired. However, if the carrying amount of goodwill exceeds the implied fair value, an impairment loss is recognized in an amount equal to that excess.
The implied fair value of goodwill is determined in the same manner as the amount of goodwill recognized in a business combination (i.e., the fair value of the segment is allocated to all the assets and liabilities, including any unrecognized intangible assets, as if the segment had been acquired in a business combination and the fair value of the segment was the purchase price paid to acquire the segment).
For our other non-amortizing intangible assets, if the carrying value of the intangible asset exceeds its fair value, an impairment loss is recognized in an amount equal to that excess. We have elected to make the last day of the fourth quarter the annual impairment assessment date for goodwill and other intangible assets. However, we could be required to evaluate the recoverability of goodwill and other intangible assets prior to the required annual assessment if
88
Table of Contents
we experience disruptions to the business, unexpected significant declines in operating results, cash flows, or upon divestiture of a significant component of the business.
We estimate the fair value of our segments using various valuation techniques, with the primary technique being a discounted cash flow analysis. A discounted cash flow analysis requires us to make various judgmental assumptions about sales, operating margins, growth rates and discount rates. Assumptions about sales, operating margins and growth rates are based on our budgets, business plans, economic projections, anticipated future cash flows and marketplace data. Assumptions are also made for varying perpetual growth rates for periods beyond the long-term business plan period.
While estimating the fair value of our segments, we assumed operating margins in future years in excess of the margins realized in the most current year. The fair value estimates for these segments assume normalized operating margin assumptions and improved operating efficiencies based on long-term expectations and margins historically realized in our industries.
Other intangible asset fair values have been calculated for trademarks using a royalty rate method and using the present value of future cash flows for patents and in-process technology. Assumptions about royalty rates are based on the rates at which similar brands and trademarks are licensed in the marketplace. Our impairment analysis contains uncertainties due to uncontrollable events that could positively or negatively impact the anticipated future economic and operating conditions.
We have not made any material changes in the accounting methodology used to evaluate impairment of goodwill and other intangible assets during the last three years. As a result of the first step of the 2008 goodwill impairment analysis, the fair value of each segment exceeded its carrying value. The second step could have resulted in an impairment loss for goodwill.
While we believe we have made reasonable estimates and assumptions to calculate the fair value of the segments and other intangible assets, it is possible a material change could occur. If our actual results are not consistent with our estimates and assumptions used to calculate fair value, we may be required to perform the second step which could result in a material impairment of our goodwill.
Income taxes
We estimate total income tax expense based on statutory tax rates and tax planning opportunities available to us in various jurisdictions in which we earn income. Federal income taxes include an estimate for taxes on earnings of foreign subsidiaries expected to be remitted to the United States and be taxable, but not for earnings considered indefinitely invested in the foreign subsidiary. Deferred income taxes are recognized for the future tax effects of temporary differences between financial and income tax reporting using tax rates in effect for the years in which the differences are expected to reverse. Valuation allowances are recorded when it is likely a tax benefit will not be realized for a deferred tax asset. We record unrecognized tax benefit liabilities for known or anticipated tax issues based on our analysis of whether, and the extent to which, additional taxes will be due. This analysis is performed in accordance with the requirements of Financial Accounting Standards Board Interpretation No. 48, “Accounting for Uncertainty in Income Taxes,” or FIN 48, which we adopted on May 28, 2007. Changes in tax laws and rates could affect recorded deferred tax assets and liabilities in the future. Changes in projected future earnings could affect the recorded valuation allowances in the future. Our
89
Table of Contents
calculations related to income taxes contain uncertainties due to judgment used to calculate tax liabilities in the application of complex tax regulations across the tax jurisdictions where we operate. Our analysis of unrecognized tax benefits contain uncertainties based on judgment used to apply the more likely than not recognition and measurement thresholds of FIN 48. We do not believe there is a reasonable likelihood there will be a material change in the tax related balances or valuation allowances. However, due to the complexity of some of these uncertainties, the ultimate resolution may result in a payment that is materially different from the current estimate of the tax liabilities. To the extent we prevail in matters for which FIN 48 liabilities have been established, or are required to pay amounts in excess of our recorded FIN 48 liabilities, our effective tax rate in a given financial statement period could be materially affected. Any change to our valuation allowance will impact our effective tax rate in a given financial statement period and could materially impact our tax expense. An unfavorable tax settlement would require use of our cash and result in an increase in our effective tax rate in the period of resolution. A favorable tax settlement would be recognized as a reduction in our effective tax rate in the period of resolution.
Recent accounting pronouncements
Fair value measurements
In December 2007, the Financial Accounting Standards Board, or FASB, issued Statement of Financial Accounting Standards, or SFAS, No. 141(R), “Business Combinations,” or SFAS No. 141(R). SFAS No. 141(R) is intended to provide greater consistency in the accounting and reporting of business combinations. SFAS 141(R) requires the acquiring entity in a business combination to recognize all assets acquired and liabilities assumed in the transaction and any non-controlling interest in the acquiree at the acquisition date, measured at fair value at that date. This includes the measurement of the acquirer’s shares issued as consideration in a business combination, the recognition of contingent consideration, the accounting for pre-acquisition gains and loss contingencies, the recognition of capitalized in–process research and development, the accounting for acquisition related restructuring cost accruals, the treatment of acquisition related transaction costs and the recognition of changes in the acquirer’s income tax valuation allowance and deferred taxes. One significant change in this statement is the requirement to expense direct costs of the transaction, which under existing standards are included in the purchase price of the acquired company. This statement also established disclosure requirements to enable the evaluation of the nature and financial effect of the business combination. SFAS No. 141(R) is effective for business combinations consummated after December 31, 2008. Also effective, as a requirement of the statement, after December 31, 2008 any adjustments to uncertain tax positions from business combinations consummated prior to December 31, 2008 will no longer be recorded as an adjustment to goodwill, but will be reported in income. SFAS No. 141(R) is effective for business combinations for which the acquisition date is on or after the beginning of the first annual reporting period beginning on or after December 15, 2008.
In February 2008, the FASB issued FASB Staff Position, or FSP, No. 157-2, which defers the effective date of SFAS No. 157, “Fair Value Measurements,” or SFAS No. 157, for nonfinancial assets and nonfinancial liabilities, except for items that are recognized or disclosed at fair value in an entity’s financial statements on a recurring basis, at least annually. We will be required to adopt SFAS No. 157 for these nonfinancial assets and nonfinancial liabilities as of December 29,
2008. We believe the adoption of SFAS No. 157 deferral provisions will not have a material impact on our financial position results of operations or cash flows.
90
Table of Contents
In March 2008, the FASB issued SFAS No. 161, “Disclosures about Derivative Instruments and Hedging Activities,” or SFAS No. 161, an amendment of SFAS No. 133, which provides for enhanced disclosures about the use of derivatives and their impact on a company’s financial position and results of operations. We adopted SFAS No. 161 at the beginning of the current fiscal year. The adoption of SFAS No. 161 did not have a material impact on our financial position, results of operations, or cash flows.
In April 2009, the FASB issued FSP No. 157-4, which relates to determining fair values when there is no active market or where the price inputs being used represents distressed sales. FSP No. 157-4 provides additional guidance for estimating fair value when the volume and level of activity for the asset or liability have significantly decreased. We adopted FSP No. 157-4 on June 15, 2009. The adoption of FSP No. 157-4 did not have a material impact on our financial position, result of operations or cash flows.
In April 2009, the FASB issued FSP No. 107-1, which requires disclosures regarding fair value of financial instruments for interim reporting periods of publically traded companies as well as in annual financial statements. We adopted FSP No. 107 at the beginning of the current fiscal year. The adoption of FSP No. 107 did not have a material impact on our financial position, results of operations or cash flows.
Subsequent events
In May 2009, the FASB issued FAS 165, “Subsequent Events,” or SFAS No. 165, which enhances guidance in regards to disclosing subsequent events and their impact on the financial statements. We adopted SFAS No. 165 on June 15, 2009. The adoption did not have a material impact on our financial position, results of operations or cash flow.
Variable interest entities and our evaluation of J&F Oklahoma
In June 2009, the FASB issued SFAS No. 167, “Amendments to FASB Interpretation No. 46(R),” or SFAS No. 167. SFAS No. 167 provides for enhanced financial reporting by enterprises involved with variable interest entities and is effective for fiscal years beginning after November 15, 2009. We are currently evaluating the impact, if any, of SFAS No. 167 on our financial position, results of operations and cash flows. Since SFAS No. 167 retains the concept that the primary beneficiary of a variable interest entity is required to consolidate such variable interest entity and since we have determined that we are not the primary beneficiary of J&F Oklahoma, we do not believe that the adoption of SFAS No. 167 will have a material impact on our financial position, results of operations or cash flows.
Accounting standards codification
In June 2009, the FASB issued SFAS No. 168, “The FASB Accounting Standards Codification and the Hierarchy of Generally Accepted Accounting Principles,” or SFAS No. 168. SFAS No. 168 establishes the FASB Accounting Standards Codification as the source of authoritative GAAP recognized by the FASB to be applied by nongovernmental entities and is effective for financial statements issued for periods ending after September 15, 2009. The adoption of SFAS No. 168 will not have a material impact on our financial position, results of operations, or cash flows.
91
Table of Contents
Factors affecting our results of operations
Our results of operations have been influenced and will continue to be influenced by a variety of factors. Our management monitors a number of metrics and indicators that affect our operations, including the following:
| • | production volume, |
| • | plant capacity utilization, |
| • | sales volume, |
| • | selling prices of beef and pork products, |
| • | customer demands and preferences (see “Risk factors—Risks relating to our business and the beef and pork industries—Changes in consumer preferences could adversely affect our business”), |
| • | commodity futures board prices for livestock (see “Risk factors—Risks relating to our business and the beef and pork industries—Our results of operations may be negatively impacted by fluctuations in the prevailing market prices for livestock” and Note 6, “Derivative financial instruments,” to our unaudited consolidated financial statements included in this prospectus), |
| • | the spread between livestock prices and selling prices for finished goods, |
| • | utility prices and trends, |
| • | livestock availability, |
| • | production yield, |
| • | currency exchange rate fluctuations (in particular, between the U.S. dollar and the Australian dollar) (see “Risk factors—Risks relating to our business and the beef and pork industries—Our export and international operations expose us to political and economic risks in foreign countries, as well as to risks related to currency fluctuations”), and |
| • | trade barriers, exchange controls and political risk and other risks associated with export and foreign operations. See “Risk factors—Risks relating to our business and the beef and pork industries—Our export and international operations expose us to political and economic risks in foreign countries, as well as to risks related to currency fluctuations.” |
Our operating results are also influenced by seasonal factors, which impact the price that we pay for livestock as well as the ultimate price at which we sell our products.
In the beef industry, the seasonal demand for beef products is highest in the summer and fall months as weather patterns permit more outdoor activities, and there is typically an increased demand for higher value items that are grilled, such as steaks. Both live cattle prices and boxed beef prices tend to be at seasonal highs during the summer and fall. Because of higher consumption, more favorable growing conditions and the housing of animals in feedlots for the winter months, there are generally more cattle available in the summer and fall. In Australia, seasonal demand does not fluctuate as significantly as it does in the United States.
The pork industry has similar seasonal cycles but in different months. It takes an average of 11 months from conception for a hog to reach market weight. Generally, sows are less productive in summer months, resulting in fewer hogs available in the spring and early summer, which causes
92
Table of Contents
prices of hogs and boxed pork to rise, but production to fall. The highest demand for pork occurs from October to March, as hog availability and holiday occasions increase the demand for hams, tenderloins and other higher value pork products. During the thirty-nine weeks ended September 27, 2009, seasonal demand followed normal historical patterns.
We believe that our results of operations are not materially affected by moderate changes in the inflation rate. Inflation and changing prices did not have a material effect on our operations in fiscal years 2008, 2007 and 2006. Severe increases in inflation, however, could affect the global and U.S. economies and could have an adverse effect on our business, financial condition and results of operations.
Other factors that impact the results of our operations include outbreaks of livestock disease, product contamination or recalls, our ability to implement our business plan (including our ability to arrange financing when required and on reasonable terms), and the implementation of our financing strategy and capital expenditure plan.
Factors affecting PPC’s results of operations
Following the consummation of the Proposed PPC Acquisition, we expect to account for the reorganized PPC’s business as a new Chicken segment. Many of the factors influencing PPC’s chicken operations are similar to those influencing our Beef and Pork segments, but there are also important differences, including the following:
| • | Production volume: While we have the ability to process 28,600 cattle and 48,500 hogs per day in the United States, the production volumes of the PPC are significantly higher, with a broiler capacity of 7.6 million heads per day. The chicken industry has experienced oversupply of chicken products that exceeded profitable demand. |
| • | Chicken production: PPC is a vertically integrated company and controls every phase of the production of its products. PPC operates feed mills, hatcheries and processing plants. By contrast, in our Beef and Pork segments, we are primarily a “spread” operator, purchasing cattle and hogs pursuant to market-priced supply arrangements from feedlot operators or on the spot market, processing the beef and pork, and selling our products by contract or on the spot market (though in our Australian beef operations, we are a vertically integrated beef processor). The operating profits of our U.S. beef and pork businesses are therefore largely determined by our plant operating efficiency rather than by fluctuations in the price of cattle or beef. On the other hand, operating profits of PPC are highly dependent on prevailing commodity prices for chicken. |
| • | Commodity price impact: Like our beef and pork businesses, PPC’s chicken business is affected by fluctuations in the prices of certain commodities. However, PPC’s business is more heavily influenced by fluctuations in the prices of corn and soymeal, which are feed ingredients, as PPC supplies feed to growers as part of its vertically integrated operations. Our Beef and Pork segments, on the other hand, are only indirectly affected by fluctuations in the prices of feed ingredients since we do not own or raise our own cattle or hogs (except for our Australian cattle operations). Rather, our Beef and Pork segments are more directly affected by fluctuations in the spot market for cattle and hogs, where we purchase a significant portion of the cattle and hogs we need. PPC is also significantly influenced by fluctuations in the cost of energy, both in terms of production and manufacturing costs and with respect to associated transportation delivery expenses. |
93
Table of Contents
| • | Foreign operations: Like us, PPC has foreign operations, but those operations are concentrated in Mexico. PPC’s business is therefore affected by fluctuations in the exchange rate between the Mexican peso and the U.S. dollar. |
| • | Seasonal trends. PPC does not experience large fluctuations in demand due to seasonality. However, PPC’s net sales have historically been higher in its third and fourth fiscal quarters, corresponding to the spring and summer months. PPC’s net sales have historically been lowest in its first fiscal quarter, corresponding to the fall and early winter. |
We provide below additional detail regarding PPC’s feed ingredient purchases, given their importance to PPC’s business, as well as PPC’s historical net operating loss carryforwards:
| • | Feed ingredient purchases. Feed ingredient purchases are the single largest component of PPC’s cost of sales, representing 35.7% of PPC’s consolidated cost of sales incurred in the nine months ended June 28, 2009 and 39.5% of consolidated cost of sales incurred in the year ended September 27, 2008. The production of feed ingredients is positively or negatively affected primarily by weather patterns throughout the world, the global level of supply inventories and demand for feed ingredients, and the agricultural policies of the U.S. and foreign governments. |
The cost of corn and soybean meal, PPC’s primary feed ingredients, increased sharply during the prior two years and reached unprecedented levels in the year ended September 27, 2008. Market prices for these feed ingredients decreased in 2009. Market prices for feed ingredients remain volatile, however, and there can be no assurance that they will not increase materially as a result of, among other things, increasing demand for these products around the world and alternative uses of these products, such as ethanol and biodiesel production.
Based on PPC’s feed consumption during the three months ended June 28, 2009, a hypothetical $0.01 per bushel movement in the corn price and $1 per ton movement in the soybean meal price would have resulted in annualized cost of sales changes of approximately $1.9 million and $1.8 million, respectively.
| • | Operating loss carryforwards. As of September 26, 2009, PPC had U.S. federal net operating loss carryforwards of $796.6 million that will begin to expire in 2026 and state net operating loss carryforwards of $569.3 million that will begin to expire in 2010. PPC also had Mexico net operating loss carry forwards at September 26, 2009 approximating $174.6 million that will begin to expire in 2011. Section 382 of the Internal Revenue Code of 1986 limits the use of net operating loss carryforwards in the event of an ownership change in which the percentage of a company’s equity held by one or more “5% shareholders” (as defined in Section 382) increases by more than 50 percentage points over the lowest percentage of stock owned by those shareholders at any time during a three-year rolling testing period. The Proposed PPC Acquisition is expected to constitute an ownership change for purposes of Section 382, and the Mandatory Exchange Transaction, as defined and described in “The Proposed PPC Acquisition—Conversion of reorganized PPC common stock into our common stock” may constitute a second ownership change. Each of these events is expected to limit the amount of net operating loss carryforwards available to PPC. You should not assume, therefore, that PPC’s historical net operating loss carryforwards are indicative of the future tax benefits of our combined company following the Proposed PPC Acquisition. |
94
Table of Contents
Results of operations
Our current fiscal year is based on the 52- or 53-week period ending on the last Sunday in December. Our predecessor company’s fiscal year was based on the 52- or 53-week period ending on the last Sunday in May. We present financial statements for the following periods:
| • | the fiscal year ended December 24, 2006, |
| • | the 198 days from December 25, 2006 through July 10, 2007, |
| • | the 173 days from July 11, 2007 (the date of the Swift Acquisition) through December 30, 2007, |
| • | the fiscal year ended December 28, 2008, and |
| • | the thirty-nine weeks ended September 28, 2008 and September 27, 2009. |
The Swift Acquisition closed on July 11, 2007, and the financial statements for the 198 days from December 25, 2006 to July 10, 2007 represent the period between the end of the last day of the fiscal year ended December 24, 2006 and the day prior to the closing of the Swift Acquisition. The periods ended prior to July 11, 2007 are referred to as the “predecessor” periods. The financial statements for the 173-day period from July 11, 2007 through December 30, 2007 represent the period from the date of the Swift Acquisition through December 30, 2007. The periods ended subsequent to July 10, 2007 are referred to as the “successor” periods.
On May 26, 2006, we completed the sale of our non-fed cattle business, including our operating plant assets in Omaha, Nebraska and our idled Nampa, Idaho assets. Due to our significant continuing involvement with the non-fed processing facilities through a raw material supply agreement, the operating results related to these plants have been reflected in our continuing operations through the fiscal year ended December 24, 2006.
Our consolidated results of operations for the 198-day period ended July 10, 2007 and the 173-day period ended December 30, 2007 are not fully comparable to our results for the fiscal year ended December 24, 2006 due to the change in cost basis and recapitalization that occurred on July 11, 2007.
Our consolidated results of operations for the fiscal year ended December 28, 2008 are not fully comparable to our results of operations for the combined 198-day period ended July 10, 2007 and the 173-day period ended December 30, 2007 due to the (1) change in cost basis and recapitalization that occurred on July 11, 2007, (2) Tasman Acquisition that closed on May 2, 2008 and (3) JBS Packerland Acquisition that closed on October 23, 2008.
Our consolidated results of operations for the fiscal quarter ended September 27, 2009 are not fully comparable to our results of operations for the fiscal quarter ended September 28, 2008 due to the JBS Packerland Acquisition that closed on October 23, 2008.
Our consolidated results of operations for the thirty-nine weeks ended September 27, 2009 are not fully comparable to our results of operations for the thirty-nine weeks ended September 28, 2008 due to the JBS Packerland Acquisition that closed on October 23, 2008.
Prior to the Tasman Acquisition in May 2008, which added five plants and one feedlot located in the southern coastal area of Australia, we owned and operated four beef processing plants and four cattle feedlots in the northern coastal area of Australia, which we acquired in the Swift Acquisition in July 2007.
Because of its significance to our pro forma financial condition and results of operations, PPC’s audited consolidated financial statements as of September 26, 2009 and September 27, 2008 and for the three years ended September 26, 2009 are also included in this prospectus.
95
Table of Contents
Supplemental financial data
The following table presents segment results for the fiscal year ended December 24, 2006, the 198 days ended July 10, 2007, the 173 days ended December 30, 2007, the fiscal year ended December 28, 2008, the thirteen weeks ended September 28, 2008 and September 27, 2009, and the thirty-nine weeks ended September 28, 2008 and September 27, 2009.
| Predecessor | Successor | |||||||||||||||||||||||||||||||||
| in thousands | Fiscal year ended December 24, 2006 | 198 days ended July 10, 2007 | 173 days ended | Fiscal year ended | 13 weeks September 28, 2008 | 13 weeks September 27, 2009 | 39 weeks September 28, 2008 | 39 weeks September 27, 2009 | ||||||||||||||||||||||||||
| (audited) | (audited) | (audited) | (audited) | (unaudited) | (unaudited) | (unaudited) | (unaudited) | |||||||||||||||||||||||||||
Net sales: | ||||||||||||||||||||||||||||||||||
Beef | $ | 7,576,136 | $ | 3,757,295 | $ | 3,942,231 | $ | 9,975,510 | $ | 2,686,121 | $ | 2,843,355 | $ | 7,169,178 | $ | 8,415,311 | ||||||||||||||||||
Pork | 2,152,583 | 1,234,133 | 1,063,644 | 2,438,049 | 682,158 | 559,282 | 1,837,586 | 1,639,365 | ||||||||||||||||||||||||||
Corporate and other | (37,287 | ) | (20,804 | ) | (16,891 | ) | (51,278 | ) | (14,637 | ) | (18,217 | ) | (34,509 | ) | (43,522 | ) | ||||||||||||||||||
Total | $ | 9,691,432 | $ | 4,970,624 | $ | 4,988,984 | $ | 12,362,281 | $ | 3,353,642 | $ | 3,384,420 | $ | 8,972,255 | $ | 10,011,154 | ||||||||||||||||||
Depreciation, amortization expense and goodwill impairment(1): | ||||||||||||||||||||||||||||||||||
Beef | $ | 65,443 | $ | 32,913 | $ | 25,627 | $ | 68,721 | $ | 16,200 | $ | 27,135 | $ | 46,735 | $ | 89,429 | ||||||||||||||||||
Pork | 23,679 | 11,925 | 9,617 | 23,653 | 6,479 | 6,761 | 17,017 | 26,283 | ||||||||||||||||||||||||||
Total | $ | 89,122 | $ | 44,838 | $ | 35,244 | $ | 92,374 | $ | 22,679 | $ | 33,896 | $ | 63,752 | $ | 115,712 | ||||||||||||||||||
| (1) | The fiscal year ended December 24, 2006 included a $4.5 million goodwill impairment charge. |
Fiscal quarter ended September 27, 2009 compared to fiscal quarter ended September 28, 2008
JBS USA consolidated
Net sales. Net sales is defined as gross sales (amounts invoiced to customers) less any returns and allowances. We grant allowances that are customary in our business. Net sales for the fiscal quarter ended September 27, 2009 totaled $3,384.4 million as compared to net sales of $3,353.6 million for the fiscal quarter ended September 28, 2008. Net sales for the fiscal quarter ended September 27, 2009 increased $30.8 million, or 0.9%, as compared to the fiscal quarter ended September 28, 2008, primarily reflecting an overall 8.2% increase in volume, partially offset by a 13.8% overall decrease in sales prices. Excluding the JBS Packerland and Tasman Acquisitions, net sales would have been $2,486.3 million for fiscal quarter ended September 27, 2009, representing a decrease of $775.2 million. The overall sales price decrease included a 13.1% decrease in our Beef segment prices and an 18.9% decrease in our Pork segment prices. The Beef segment price decrease was primarily driven by weaker overall market conditions, as well as the effects of a 6.5% depreciation of the Australian dollar to U.S. dollar exchange rate, while our Pork segment sales price decline was driven by overall weaker market conditions, including significantly lower hog prices that indirectly impacted selling prices for finished goods. Volumes increased in both segments with a 21.8% increase in slaughter volumes in our Beef segment and a 1.1% increase in our Pork segment. The volume increases resulted primarily from the JBS Packerland Acquisition in October 2008. Excluding the JBS Packerland and Tasman Acquisitions, volume in our Beef segment decreased 9.7% in the period, primarily due to an increased strategic emphasis in 2009 on yield (meat product per carcass) as opposed to volume (heads of cattle processed). The addition of smalls in
96
Table of Contents
Australia for the period from 2008 through September 27, 2009 was the primary driver of the decline in per unit selling prices in our Beef segment.
Cost of goods sold. Cost of goods sold for the fiscal quarter ended September 27, 2009 totaled $3,257.7 million as compared to cost of goods sold of $3,154.6 million for the fiscal quarter ended September 28, 2008. Cost of goods sold increased $103.1 million, or 3.3%, for the fiscal quarter ended September 27, 2009 as compared to the fiscal quarter ended September 28, 2008. Excluding the JBS Packerland and Tasman Acquisitions, cost of goods sold would have been $2,391.2 million for fiscal quarter ended September 27, 2009, representing a decrease of $672.2 million. Cost of goods sold increased 7.5% in our Beef segment as a result of a 21.8% increase in slaughtering volumes (primarily attributable to the JBS Packerland Acquisition), partially offset by a decrease in cattle prices of 14.1% (including a 6.5% depreciation in the Australian to U.S. dollar exchange rate). In our Pork segment, cost of goods sold decreased by 13.5%, mainly driven by a 17.9% decrease in hog prices, partially offset by a 1.1% increase in volumes.
Gross margin percentages. Gross margin percentages (gross profit as a percent of net sales) were 3.7% for the fiscal quarter ended September 27, 2009 as compared to 5.9% for the fiscal quarter ended September 28, 2008, representing a decrease of 2.2 percentage points. Gross margin percentages reflect a 1.5 percentage point margin decrease in our Beef segment and a 5.1 percentage point margin decrease in our Pork segment. Excluding the JBS Packerland and Tasman Acquisitions, gross margin percentage would have been 3.8% for fiscal quarter ended September 27, 2009, representing a decrease of 2.1 percentage points. Margin declines in our Beef segment were attributable to weaker overall economic conditions and competition from alternative proteins, including pork, which saw lower than seasonally normal prices during the current third quarter. Margin decreases in our Pork segment were driven by an 18.9% decline in pork selling prices which more than offset the 17.9% decrease in hog prices.
Selling, general and administrative expenses. Selling, general and administrative expenses were $39.2 million for the fiscal quarter ended September 27, 2009 as compared to $32.5 million for the fiscal quarter ended September 28, 2008. These expenses increased by $6.7 million, or 20.7%, primarily due to the JBS Packerland Acquisition in October 2008. Excluding the JBS Packerland and Tasman Acquisitions, selling, general and administrative expenses decreased $2.0 million, or 6.4%, when compared to the prior period as we reduced fixed costs to address the lower Beef volumes in the legacy Swift business described above and ongoing efforts to increase our efficiency. In addition, the Australian to U.S. dollar exchange rate decreased 6.5% between the comparative fiscal quarters, partially offsetting the overall increase.
Foreign currency transaction, net. Foreign currency transaction, net was a net gain of $16.3 million in the quarter year ended September 27, 2009 as compared to a loss of $42.8 million in the quarter ended September 28, 2008. This $59.1 million increase is related to the effects of the variation in the value of the Australian dollar as compared to the U.S. dollar on our U.S. dollar-denominated intercompany note between our Australian subsidiary, as debtor, and us, as lender. The value of the Australian dollar as compared to the U.S. dollar appreciated 7.5% from the June 28, 2009 period-end rate to the September 27, 2009 period-end rate compared to the 13.5% depreciation from the June 29, 2008 period-end rate to the September 28, 2008 period-end rate.
Interest expense, net. Interest expense, net for the fiscal quarter ended September 27, 2009 was $28.1 million as compared to $8.9 million for the fiscal quarter ended September 28, 2008. The interest expense increase of $19.2 million, or 216.6%, related primarily to higher borrowings, principally related to the issuance and sale in April 2009 of our senior unsecured notes due 2014.
Income tax expense, net. Income tax expense, net for the fiscal quarter ended September 27, 2009 was $25.7 million as compared to $34.6 million for the fiscal quarter ended September 28,
97
Table of Contents
2008. The $8.9 million decrease related principally to a decrease in U.S. pre-tax income and the effects of a change from a foreign loss position to a foreign income position in the fiscal quarter ended September 27, 2009.
Net income (loss). As a result of the factors discussed above, our net income for the fiscal quarter ended September 27, 2009 decreased to income of $51.6 million from $83.9 million for the fiscal quarter ended September 28, 2008.
Beef segment
Net sales. Net sales totaled $2,843.3 million for the fiscal quarter ended September 27, 2009 as compared to net sales of $2,686.1 million for the fiscal quarter ended September 28, 2008. Net sales increased by $157.2 million, or 5.9%, primarily reflecting an overall increase in production volume of 21.8% and partially offset by a an overall 13.1% decrease in sales prices (including a 6.5% depreciation of Australian dollar to U.S. dollar exchange rate). Volume increases in our Beef segment were attributable primarily to the JBS Packerland Acquisition in October 2008 as the legacy Swift facilities had a 9.7% decrease in volume in our Beef segment between the two quarters, primarily due to an increased strategic emphasis in 2009 on yield (meat produced per head of cattle) as opposed to volume (heads of cattle processed). Price decreases resulted from weaker overall market conditions. Excluding the JBS Packerland and Tasman Acquisitions, net sales would have been $1,945.2 million for fiscal quarter ended September 27, 2009, representing a decrease of $648.7 million, or 25%, driven primarily by weaker overall market conditions, as well as the effects of the 6.5% depreciation in the average Australian to U.S. dollar exchange rate between the two quarters.
Cost of goods sold. Cost of goods sold totaled $2,734.9 million for the fiscal quarter ended September 27, 2009 as compared to $2,544.1 million for the fiscal quarter ended September 28, 2008. The increase in cost of goods sold of $190.8 million, or 7.5%, for the fiscal quarter ended September 27, 2009 as compared to the fiscal quarter ended September 28, 2008 resulted from a 21.8% increase in slaughter volumes, partially offset by a 14.1% decrease in cattle prices. Excluding the JBS Packerland and Tasman Acquisitions, cost of goods sold would have been $1,868.4 million for the fiscal quarter ended September 27, 2009, representing a decrease of $584.5 million. The decrease in cost of goods sold is attributable primarily to the decrease in volume in the legacy Swift facilities described above, as well as the effects of a 6.5% depreciation in the Australian dollar compared to the U.S. dollar. Although total cost of goods sold increased quarter over quarter, on a cost per head basis, we realized cost reductions in freight expenses driven by lower diesel fuel prices, warehousing, overtime costs and utilities driven by lower natural gas prices.
Gross margin percentages. Gross margin percentages (gross profit as a percent of net sales) were 3.8% for the fiscal quarter ended September 27, 2009 as compared to 5.3% for the fiscal quarter ended September 28, 2008, representing a decrease of 1.5 percentage points. Excluding the JBS Packerland and Tasman Acquisitions, gross margins would have been 3.9% for the fiscal quarter ended September 27, 2009, representing a decrease of 1.4 percentage points. The percentage point gross margin decline was driven by weaker overall market conditions and competition from alternative proteins, including pork, which saw lower than seasonally normal prices during the current third quarter.
Selling, general and administrative expenses. Selling general, and administrative expenses were $28.3 million for the fiscal quarter ended September 27, 2009 as compared to $20.8 million for the fiscal quarter ended September 28, 2008. The increase in selling, general, and administrative expenses of $7.5 million, or 36.5%, resulted primarily from the JBS Packerland Acquisition in October 2008. Excluding the JBS Packerland and Tasman Acquisitions, selling, general and
98
Table of Contents
administrative expenses totaled $18.0 million for the fiscal quarter ended September 27, 2009, a decrease of $2.8 million from the fiscal quarter ended September 28, 2008, as we reduced fixed costs to address the lower Beef volumes in the legacy Swift business described above and ongoing efforts to increase our efficiency. In addition, the Australian to U.S. dollar exchange rate decreased 6.5% between the comparative fiscal quarters, partially offsetting the increase.
Depreciation and amortization expense. Depreciation and amortization expense for the fiscal quarter ended September 27, 2009 was $27.1 million as compared to $16.2 million for the fiscal quarter ended September 28, 2008. The increase of $10.9 million, or 67.5%, related to the JBS Packerland Acquisition. Excluding the JBS Packerland and Tasman Acquisitions, depreciation and amortization would have increased $1.1 million, or 7.9%, related to the impairment of a customer contract intangible that no longer has a useful life, and partially offset by the impact of assets fully depreciated during the period. See Note 4, “Property, plant and equipment,” to our unaudited consolidated financial statements included in this prospectus for more information about how this depreciation and amortization is reflected in our financial statements.
Pork segment
Net sales. Net sales totaled $559.3 million for the fiscal quarter ended September 27, 2009 as compared to net sales of $682.2 million for the fiscal quarter ended September 28, 2008. The decrease of $122.9 million, or 18.0%, primarily reflects an overall 1.1% increase in production volume, offset by an 18.9% overall decrease in sales prices. The decrease in selling prices was driven by weaker overall market conditions, including higher industry-wide processing by vertically integrated operators.
Cost of goods sold. Cost of goods sold totaled $541.0 million for the fiscal quarter ended September 27, 2009 as compared to cost of goods sold of $625.1 million for the fiscal quarter ended September 28, 2008. The decrease of $84.1 million, or 13.5%, for the fiscal quarter ended September 27, 2009 as compared to the fiscal quarter ended September 28, 2008 was due primarily to a 17.9% decrease in hog prices driven by overall weaker market conditions, partially offset by a 1.1% increase in hog slaughter volumes. On a cost per head basis, we realized cost reductions in freight expenses driven by lower diesel fuel prices, warehousing, overtime costs and utilities driven by lower natural gas prices.
Gross margin percentages. Gross margin percentages (gross profit as a percent of net sales) were 3.3% for the fiscal quarter ended September 27, 2009 as compared to 8.4% for the fiscal quarter ended September 28, 2008. The 5.1 percentage point decline in our Pork segment gross margins was due to overall weaker market conditions as an 18.9% decline in pork selling prices more than offset the 17.9% decrease in hog prices. Sales margins were also negatively impacted by lower rendered product prices driven by lower worldwide petroleum prices as rendered oils serve as a replacement for petroleum-based oils in some markets.
Selling, general and administrative expenses. Selling, general and administrative expenses were $10.1 million for the fiscal quarter ended September 27, 2009 as compared to $11.7 million for the fiscal quarter ended September 28, 2008. The decrease of $1.6 million, or 13.9%, was primarily the result of reductions in incentive accruals tied to overall business performance for the fiscal quarter ended September 27, 2009.
Depreciation and amortization expense. Depreciation and amortization expense for the fiscal quarter ended September 27, 2009 was $6.8 million as compared to $6.5 million for the fiscal quarter ended September 28, 2008. See Note 4, “Property, plant and equipment,” to our
99
Table of Contents
unaudited consolidated financial statements included in this prospectus for more information about how this depreciation and amortization is reflected in our financial statements.
Thirty-nine weeks ended September 27, 2009 compared to thirty-nine weeks ended September 28, 2008
JBS USA Consolidated
Net sales. Net sales for the thirty-nine weeks ended September 27, 2009 totaled $10,011.2 million as compared to net sales of $8,972.3 million for the thirty-nine weeks ended September 28, 2008. The increase of $1,038.9 million, or 11.6%, was due primarily to an overall 8.0% increase in volume, partially offset by an 8.1% overall decrease in sales prices. Excluding the JBS Packerland and Tasman Acquisitions, net sales would have been $7,289.9 million for the thirty-nine weeks ended September 27, 2009, representing a decrease of $1,510.8 million. The sales price decrease included a 7.9% decrease in our Beef segment prices and a 9.1% decrease in our Pork segment prices. Volumes increased in our Beef segment by 27.5%, driven primarily by the JBS Packerland and Tasman Acquisitions (a 5.9% decrease excluding the JBS Packerland and Tasman Acquisitions, primarily due to weaker market conditions and an increased strategic emphasis in 2009 on yield (meat produced per head of cattle) as opposed to volume (heads of cattle processed)), with a 1.9% decrease in our Pork segment due to lower demand and industry-wide pork margins. In addition, the Australian to U.S. dollar exchange rate depreciated 18.4% between the comparative periods, which negatively affected net sales from our international operations included in our Beef segment. Net sales for the thirty-nine weeks ended September 27, 2009 include a gain of $48.3 million on a foreign currency contract we entered into to assist JBS S.A. in its risk management activities, as discussed in note 10 to our financial statements.
Cost of goods sold. Cost of goods sold totaled $9,673.7 million for the thirty-nine weeks ended September 27, 2009 as compared to cost of goods sold of $8,612.6 million for the thirty-nine weeks ended September 28, 2008, an increase of $1,061.1 million, or 12.3%. Excluding the JBS Packerland and Tasman Acquisitions, cost of goods sold would have been $7,060.0 million for the thirty-nine weeks ended September 27, 2009, representing a decrease of $1,377.0 million. Cost of goods sold increased 17.7% in our Beef segment as a result of a 27.5% increase in slaughter volumes driven primarily by the JBS Packerland and Tasman Acquisitions, partially offset by a 5.9% decrease in slaughter volumes in the legacy Swift beef facilities and a 9.5% decline in cattle prices (including the effect of the 18.4% depreciation in the Australian to U.S. dollar exchange rate). Costs of goods sold decreased 8.9% in our Pork segment, driven by a 9.2% decrease in hog prices and a 1.9% decrease in volumes due to lower demand and industry-wide pork margins. Although total cost of goods sold increased during the comparative periods, on a cost per head basis we realized cost reductions in freight expenses driven by lower diesel fuel prices, warehousing, overtime costs and utilities driven by lower natural gas prices.
Gross margin percentages. Gross margin percentages (gross profit as a percent of net sales)
were 3.4% for the thirty-nine weeks ended September 27, 2009 as compared to 4.0% for the
thirty-nine weeks ended September 28, 2008, representing a decrease of 0.6 percentage points. The decrease in gross margin reflects a 0.3 percentage point decline in our Beef segment and a 2 percentage point decline in our Pork segment. Excluding the JBS Packerland and Tasman Acquisitions, gross margins would have been 3.2% for the thirty-nine weeks ended September 27, 2009, representing a decrease of 0.8 percentage points. Margin declines in our Beef segment were attributable to weaker overall economic conditions and competition from alternative proteins, including pork, which
100
Table of Contents
saw lower than seasonally normal prices during the current third quarter. Margin decreases in our Pork segment were attributable to slightly higher non-livestock related operating costs in the first quarter due to the reduction in slaughter volumes. Gross margin for the thirty-nine weeks ended September 27, 2009 was favorably affected by a gain of $48.3 million on a foreign currency contract we entered into to assist JBS S.A. in its risk management activities, as discussed in Note 10 to our financial statements.
Selling,general and administrative expenses. Selling, general and administrative expenses were $158.4 million for the thirty-nine weeks ended September 27, 2009 as compared to $98.3 million for the thirty-nine weeks ended September 28, 2008. The increase of $60.1 million, or 61.2%, was primarily attributable to a breakage fee and related legal costs totaling $20.9 million following our decision not to pursue the acquisition of National Beef Packing Company LLC, or National Beef, $0.8 million in transaction costs relating to the Proposed PPC Acquisition, and a $6.9 million one-time write-off during the second fiscal quarter of 2009 of an intangible asset originally created at July 11, 2007 due to the termination of a contractual relationship. The contract was terminated in order to bring the sales of our rendered products in-house and generate higher margins from their sales. The breakage fee and related non-recurring costs totaling $20.9 million were recorded in selling, general and administrative expenses in the “Corporate and other” segment. Excluding the JBS Packerland and Tasman Acquisitions, selling, general and administrative expenses would have been $122.9 million for the thirty-nine weeks ended September 27, 2009, representing an increase of $27.4 million for the reasons described above. This increase in selling, general and administrative expense was partially offset by the effect of the depreciation of 18.4% in the value of the Australian dollar as compared to the U.S. dollar between the comparative periods.
Foreign currency transaction, net. Foreign currency transaction, net was a net gain of $60.9 million in the thirty-nine weeks ended September 27, 2009 as compared to a loss of $17.6 million in the thirty-nine weeks ended September 28, 2008. This $78.5 million increase is related to the effects of the variation in the value of the Australian dollar as compared to the U.S. dollar on our U.S. dollar-denominated intercompany note between our Australian subsidiary, as debtor, and us, as lender. The value of the Australian dollar as compared to the U.S. dollar appreciated 27.2% from the December 28, 2008 period-end rate to the September 27, 2009 period-end rate compared to the 5.1% depreciation from the December 30, 2007 period-end rate to the September 28, 2008 period-end rate.
Interest expense, net. Interest expense, net for the thirty-nine weeks ended September 27, 2009 was $69.5 million as compared to $23.3 million for the thirty-nine weeks ended September 28, 2008. The interest expense increase of $46.2 million, related primarily to the issuance and sale in April 2009 of our senior unsecured notes due 2014.
Income tax expense, net. Income tax expense, net for the thirty-nine weeks ended September 27, 2009 was $58.2 million as compared to $74.3 million for the thirty-nine weeks ended September 28, 2008. The income tax expense, net decrease of $16.1 million primarily related to a decrease in pre-tax income.
Net income (loss). As a result of the factors discussed above, our net income for the thirty-nine
weeks ended September 27, 2009 decreased to income of $116.0 million from $156.3 million for the thirty-nine weeks ended September 28, 2008.
101
Table of Contents
Beef segment
Net sales. Net sales totaled $8,415.3 million for the thirty-nine weeks ended September 27, 2009 as compared to $7,169.2 million for the thirty-nine weeks ended September 28, 2008. The increase of $1,246.1 million, or 17.4%, reflected an overall 27.5% increase in volume due primarily to the JBS Packerland and Tasman Acquisitions, partially offset by a 5.9% decrease in slaughter volumes in the legacy Swift facilities. Excluding the JBS Packerland and Tasman Acquisitions, net sales would have been $5,694.0 million for the thirty-nine weeks ended September 27, 2009, representing a decrease of $1,303.5 million primarily due to such decrease in volume and a 7.9% overall decrease in sales prices primarily due to overall weaker market conditions, as well as the effects of a 18.4% depreciation of the Australian dollar to U.S. dollar exchange rate between the two periods.
Cost of goods sold. Cost of goods sold totaled $8,138.3 million for the thirty-nine weeks ended September 27, 2009 as compared to $6,913.4 million for the thirty-nine weeks ended September 28. The increase of $1,224.9 million, or 17.7%, reflected a 27.5% increase in slaughter volumes due primarily to the JBS Packerland and Tasman Acquisitions, partially offset by a 9.5% decrease in cattle prices (including the effect of the 18.4% depreciation in the Australian to U.S. dollar exchange rates). Excluding the JBS Packerland and Tasman Acquisitions, cost of goods sold would have been $5,524.6 million for the thirty-nine weeks ended September 27, 2009, representing a decrease of $1,213.2 million. The decrease is primarily attributable to lower production volumes in the legacy Swift facilities and lower cattle prices. Although total cost of goods sold increased during the comparative periods, on a cost per head basis we realized cost reductions in freight expenses driven by lower diesel fuel prices, warehousing, overtime costs and utilities driven by lower natural gas prices.
Gross margin percentages. Gross margin percentages (gross profit as a percent of net sales)
were 3.3% for the thirty-nine weeks ended September 27, 2009 as compared to 3.6% for the
thirty-nine weeks ended September 28, 2008, representing a decrease of 0.3 percentage points. Excluding the JBS Packerland and Tasman Acquisitions, gross margins would have been 3.0% for the thirty-nine weeks ended September 27, 2009, representing a decrease of 0.6 percentage points. The decrease in gross margin percentage was attributable to weaker overall market conditions and competition from alternative proteins, including pork, which saw lower than seasonally normal prices during the period.
Selling, general and administrative expenses. Selling, general and administrative expenses were $96.4 million for the thirty-nine weeks ended September 27, 2009 as compared to $62.8 million for the thirty-nine weeks ended September 28, 2008. The increase of $33.6 million, or 53.6%, was due primarily to the JBS Packerland and Tasman Acquisitions. Excluding the JBS Packerland and Tasman Acquisitions, selling, general and administrative expenses would have been $60.9 million for the thirty-nine weeks ended September 27, 2009, representing an increase of $0.9 million. The increase was primarily attributable to a breakage fee and related legal costs totaling $20.9 million following our decision not to pursue the acquisition of National Beef and a $6.9 million one-time write-off of an intangible asset originally created at July 11, 2007 due to the termination of a contractual relationship during the second fiscal quarter. The contract was terminated in order to bring the sales of our rendered products in house in order to generate higher margins from their sales. The Australian to U.S. dollar exchange rate partially offset the increase as the Australian dollar depreciated 18.4% between the two periods, partially offset by the impact of assets fully depreciated during the period.
102
Table of Contents
Depreciation and amortization expense. Depreciation and amortization expense for the thirty-nine weeks ended September 27, 2009 was $89.4 million as compared to $46.7 million for the thirty-nine weeks ended September 28, 2008. The increase of $42.7 million, or 91.4%, related to the impairment of a customer contract intangible that no longer has a useful life, as well as to the JBS Packerland Acquisition. Excluding the JBS Packerland and Tasman Acquisitions, depreciation and amortization would have increased $18.2 million, or 30.3%, related to the impairment of the customer contract intangible, and partially offset by the impact of assets fully depreciated during the period. See Note 4, “Property, plant and equipment,” to our unaudited consolidated financial statements included in this prospectus for more information about how this depreciation and amortization is reflected in our financial statements.
Pork segment
Net sales. Net sales totaled $1,639.4 million for the thirty-nine weeks ended September 27, 2009 as compared to $1,837.6 million for the thirty-nine weeks ended September 28, 2008. The decrease of $198.2 million, or 10.8%, primarily reflected an overall 1.9% decrease in volume combined with a 9.1% overall decrease in sales prices. Declines in pork volumes and selling prices were attributable to lower industry-wide economics especially in terms of lower selling prices for rendered products due to declines in petroleum product prices with which rendered products compete as fuel.
Cost of goods sold. Cost of goods sold totaled $1,578.9 million for the thirty-nine weeks ended September 27, 2009 as compared to $1,733.7 million for the thirty-nine weeks ended September 28, 2008. The decrease of $154.8 million, or 8.9% primarily reflected a 1.9% decrease in hog slaughter volumes combined with a 9.2% decrease in hog prices. On a cost per head basis, we realized cost reductions in freight expenses driven by lower diesel fuel prices, warehousing, overtime costs and utilities driven by lower natural gas prices.
Gross margin percentages. Gross margin percentages (gross profit as a percent of net sales) were 3.7% for the thirty-nine weeks ended September 27, 2009 as compared to 5.7% for the thirty-nine weeks ended September 28, 2008. The gross margin decline of 2.0 percentage points in the current period reflected weaker overall market conditions and weaker selling prices, especially on rendered products whose prices were weaker due to lower petroleum product prices.
Selling, general and administrative expenses. Selling, general and administrative expenses were $40.3 million for the thirty-nine weeks ended September 27, 2009 as compared to $35.5 million for the thirty-nine weeks ended September 28, 2008. The increase of $4.7 million, or 13.3% was driven primarily by a $6.1 million one-time write-off during the second fiscal quarter of an intangible asset originally created at July 11, 2007 due to the termination of a contractual relationship. The contract was terminated in order to bring the sales of our rendered products in house in order to generate higher margins from their sales.
Depreciation and amortization expense. Depreciation and amortization expense for the thirty-nine weeks ended September 27, 2009 was $26.3 million as compared to $17.0 million for the thirty-nine weeks ended September 28, 2008. The increase of $9.3 million, or 54.5%, was primarily related to the impairment of a customer contract intangible. See Note 4, “Property, plant and equipment,” to our unaudited consolidated financial statements included in this prospectus for more information about how this depreciation and amortization is reflected in our financial statements.
103
Table of Contents
The 173-day period from July 11, 2007 through December 30, 2007 (successor) compared to the fiscal year ended December 28, 2008 (successor)
Net sales. Net sales in the 173-day period from July 11, 2007 through December 30, 2007 (successor) were $4,989.0 million compared to $12,362.3 million for the fiscal year ended December 28, 2008 (successor). Net sales per day increased due to per day volume increases of 12.1%, partially offset by a price decline of 6.4%.
Cost of goods sold. Cost of goods sold totaled $11,917.8 million for the fiscal year ended December 28, 2008 (successor) as compared to $5,013.1 million for the 173-day period from July 11, 2007 through December 30, 2007 (successor). This increase was due to the per day volume increases of 12.1%, partially offset by a price decline of 10.7%. In addition, the increase is also attributable to the JBS Packerland and Tasman Acquisitions, coupled with the 28.3% appreciation in the Australian dollar relative to the U.S. dollar between the two periods.
Gross margin percentages. Gross margin percentage (gross profit as a percentage of net sales) in the 173-day period from July 11, 2007 through December 30, 2007 (successor) was (0.5)% compared to 3.6% for the fiscal year ended December 28, 2008 (successor). The increase in gross margin percentage in the more recent period was due principally to continuing improvements in production throughput, operating costs, efficiency and product yields as employees hired subsequent to the December 12, 2006 investigation by the U.S. Department of Homeland Security’s Immigration and Customs Enforcement division, or the ICE event, gained the ability to perform at the level of pre-ICE event production employees. See “Risk factors—Risks relating to our business and the beef and pork industries—Our performance depends on favorable labor relations with our employees and our compliance with labor laws. Any deterioration of those relations or increase in labor costs due to our compliance with labor laws could adversely affect our business.”
Selling, general and administrative expenses. Selling, general and administrative expenses in the 173-day period from July 11, 2007 through December 30, 2007 (successor) were $60.7 million compared to $148.8 million for the fiscal year ended December 28, 2008 (successor). Selling, general and administrative expenses per day increased due to the JBS Packerland and Tasman Acquisitions, more than offsetting the favorable impact of the company’s de-layering of management effective July 13, 2007 and the renegotiation of professional service contracts in the areas of audit, tax and legal services. In addition, the Australian dollar appreciated relative to the U.S. dollar by 28.3% between the two periods.
Foreign currency transaction, net. Foreign currency transaction, net was a net $76.0 million loss in the fiscal year ended December 28, 2008 as compared to a net $5.2 million gain in the 173-day period from July 11, 2007 to December 30, 2007. This $81.2 million decrease related to the effects of the variation in the value of the Australian dollar as compared to the U.S. dollar on our U.S. dollar-denominated intercompany note between our Australian subsidiary, as debtor, and us, as lender. The value of the Australian dollar as compared to the U.S. dollar appreciated 1.8% from the July 11, 2007 period-end rate to the December 30, 2007 period-end rate compared to the 23.3% depreciation from the December 30, 2007 period-end rate to the December 28, 2008 period-end rate.
Interest expense, net. Interest expense, net for the 173-day period from July 11, 2007 through December 30, 2007 (successor) was $34.3 million compared to $36.4 million for the fiscal year ended December 28, 2008 (successor). This increase of 5.9% in the more recent period as compared to the prior period reflects the fact that borrowings decreased an average of
104
Table of Contents
$393.2 million due primarily to improved operating cash flows, as well as a one-time cost of $12.7 million incurred in the 2007 period associated with an unconsummated debt offering in July 2007.
Income tax expense (benefit). Income tax expense, net for the 173-day period from July 11, 2007 through December 30, 2007 (successor) was $1.0 million as compared to $31.2 million for the fiscal year ended December 28, 2008. This $30.2 million increase is related primarily to an increase in our pretax income and a reduction in our valuation allowance due to a reassessment of the need for a valuation allowance.
Net income (loss). As a result of the factors discussed above, we had net income for the fiscal year ended December 28, 2008 of $161.1 million as compared to an $111.6 million net loss for the 173-day period from July 11, 2007 to December 30, 2007.
The 198-day period from December 25, 2006 to July 10, 2007 (predecessor) compared to the fiscal year ended December 24, 2006 (predecessor)
Net sales. Net sales for the 198-day period from December 25, 2006 to July 10, 2007 (predecessor) were $4,970.6 million compared to $9,691.4 million for the fiscal year ended December 24, 2006 (predecessor). Net sales per day decreased due to volume decreases of 5.2% offset by price increases of 5.6%. In addition, the value of the Australian dollar as compared to the U.S. dollar decreased 7.1% between the two periods.
Cost of goods sold. Cost of goods sold totaled $4,920.6 million for the 198-day period from December 25, 2006 to July 10, 2007 (predecessor) as compared to $9,574.7 million for the fiscal year ended December 24, 2006 (predecessor). Cost of goods sold per day decreased due to volume decreases of 5.2%, partially offset by price increases of 5.9%. In addition, the value of the Australian dollar as compared to the U.S. dollar decreased 7.1% between the two periods.
Gross margin percentages. Gross margin percentage (gross profit as a percentage of net sales) for the 198-day period from December 25, 2006 to July 10, 2007 (predecessor) was 1.0% as compared to 1.2% for the fiscal year ended December 24, 2006 (predecessor). This decrease in gross margin percentage in the more recent period was due principally to the negative impact of the ICE event on production throughput, operating costs, efficiency and product yields as lesser-trained replacement workers were not able to perform at the level of pre-ICE event production employees. See “Risk factors—Risks relating to our business and the beef and pork industries—Our performance depends on favorable labor relations with our employees and our compliance with labor laws. Any deterioration of those relations or increase in labor costs due to our compliance with labor laws could adversely affect our business.”
Selling, general and administrative expenses. Selling, general and administrative expenses for the 198-day period from December 25, 2006 to July 10, 2007 (predecessor) were $92.3 million as compared $158.8 million for the fiscal year ended December 24, 2006 (predecessor). Selling, general and administrative expense per day increased between the two periods primarily as a result of the one-time costs of approximately $13.0 million incurred relating sell-side expenses incurred by our predecessor in connection with the Swift Acquisition, including legal costs, employee severance costs and employee retention bonuses accrued as earned in the days immediately prior to the acquisition. These costs were partially offset by a decrease of 7.1% in the value of the Australian dollar as compared to the U.S. dollar between the two periods.
105
Table of Contents
Interest expense. Interest expense for the 198-day period from December 25, 2006 to July 10, 2007 (predecessor) was $66.4 million as compared to $118.8 million for the fiscal year ended December 24, 2006 (predecessor). Interest expense on a per day basis increased 2.8% in the more recent period as compared to the prior fiscal year as borrowings had increased an average of $136.4 million due primarily to negative operating cash flows resulting from the ICE event impact on production volumes.
Income tax expense (benefit). Income tax benefit, net for the 198-day period from December 25, 2006 to July 10, 2007 (predecessor) was $18.4 million as compared to $37.3 million for the fiscal year ended December 24, 2006. This $18.9 million decrease related primarily to a change in our valuation allowance due to our history of losses in the United States.
Net loss. As a result of the factors described above, we recorded a net loss for the 198-day period ended July 10, 2007 of $83.0 million, as compared to a net loss incurred in the fiscal year ended December 24, 2006 of $117.4 million.
Pro forma results of operations
Our consolidated results of operations for the thirty-nine weeks ended September 27, 2009 are not fully comparable to our results of operations for the thirty-nine weeks ended September 28, 2008 due to (1) the Tasman Acquisition that closed on May 2, 2008 and (2) the JBS Packerland Acquisition that closed on October 23, 2008.
In addition, our consolidated results of operations for the fiscal year ended December 28, 2008 are not fully comparable to our results of operations for the fiscal year ended December 30, 2007 due to (1) the change in cost basis and recapitalization that occurred on July 11, 2007 in connection with the Swift Acquisition, (2) the Tasman Acquisition that closed on May 2, 2008 and (3) the JBS Packerland Acquisition that closed on October 23, 2008.
In light of these transactions, as well as the offering and sale of our 11.625% senior unsecured notes due 2014 that occurred in April 2009, and in order to facilitate an analysis of our financial information, we are presenting pro forma statements of operations for the thirty-nine weeks ended September 27, 2009 and for the fiscal year ended December 28, 2008. See “Unaudited pro forma financial statements.”
We are also presenting supplementary pro forma statements of operations for the following periods for comparative purposes:
| • | the thirty-nine weeks ended September 28, 2008 as if (a) our offering of our 11.625% senior unsecured notes due 2014 and the application of proceeds therefrom, (b) the JBS Packerland Acquisition, (c) the Proposed PPC Acquisition, and (d) a portion (40%) of the sale of our common stock related to the BNDESPAR transaction (using this percentage because it is equivalent to the percentage of the proceeds of the BNDESPAR transaction expected to be used to fund the cash consideration for the Proposed PPC Acquisition), in each case, had occurred at the beginning of the period presented, and |
| • | the fiscal year ended December 30, 2007 as if (a) our offering of our 11.625% senior unsecured notes due 2014 and the application of proceeds therefrom, (b) the change in cost basis and recapitalization that occurred on July 11, 2007 in connection with the Swift Acquisition, (c) the JBS Packerland Acquisition, (d) the Proposed PPC Acquisition, and (e) a portion (40%) of the sale of our common stock related to the BNDESPAR transaction, in each case, had occurred at the beginning of the period presented. |
106
Table of Contents
The following unaudited pro forma statements of operations tables reflect pro forma adjustments that are described in the accompanying notes and are based on available information and certain assumptions that we believe are reasonable under the circumstances, and the actual results could differ materially from these anticipated results. In our opinion, all adjustments that are necessary to present fairly the unaudited pro forma consolidated data have been made. The following unaudited pro forma statements of operations tables are presented for informational purposes only and do not purport to be indicative of what would have occurred had the JBS Packerland Acquisition, Tasman Acquisition, Swift Acquisition, the Proposed PPC Acquisition or the offering of our 11.625% senior unsecured notes due 2014 and the application of the proceeds therefrom actually been consummated at the beginning of the period presented, nor are they necessarily indicative of our future consolidated operating results.
107
Table of Contents
Unaudited pro forma combined statement of operations for the thirty-nine weeks ended September 27, 2009
| JBS USA Holdings, Inc. | Pilgrim’s Pride | JBS USA Holdings, Inc. | ||||||||||||||||
| September 27, 2009 | Thirty-nine weeks ended September 26, 2009 | Adjustment for transactions | September 27, 2009 | |||||||||||||||
| Historical | Pro forma | |||||||||||||||||
| in thousands, except earnings per share | (a) (+) | (+) | Notes | |||||||||||||||
Net sales | $ | 10,011,154 | $ | 5,211,064 | $ | (28,047 | ) | (b) | $ | 15,194,171 | ||||||||
Cost of good sold | 9,673,675 | 4,744,784 | (35,678 | ) | (b), (c) | 14,382,781 | ||||||||||||
Restructuring items | — | 12,464 | — | 12,464 | ||||||||||||||
Gross profit | 337,479 | 453,816 | 7,631 | 798,926 | ||||||||||||||
Selling, general and administrative expenses | 158,440 | 208,683 | 1,154 | (c), (d) | 368,277 | |||||||||||||
Restructuring items | — | (435 | ) | — | (435 | ) | ||||||||||||
Foreign currency transaction gains | (60,867 | ) | — | — | (60,867 | ) | ||||||||||||
Other income, net | (3,629 | ) | (2,273 | ) | — | (5,902 | ) | |||||||||||
Gain on sales of property, plant and equipment | (181 | ) | — | — | (181 | ) | ||||||||||||
Interest expense, net | 69,515 | 118,505 | (16,273 | ) | (e) | 171,747 | ||||||||||||
Total expenses | 163,278 | 324,480 | (15,119 | ) | 472,639 | |||||||||||||
Income from continuing operations before reorganization items and before income taxes | 174,201 | 129,336 | 22,750 | 326,287 | ||||||||||||||
Reorganization items | — | 74,025 | — | 74,025 | ||||||||||||||
Income from continuing operations before income taxes | 174,201 | 55,311 | 22,750 | 252,262 | ||||||||||||||
Income tax expense (benefit) | 58,236 | (21,864 | ) | 49,185 | (f) | 85,557 | ||||||||||||
Net income (loss) | 115,965 | 77,175 | (26,435 | ) | 166,705 | |||||||||||||
Less net income attributable to non-controlling interest in PPC | — | — | 21,135 | (g) | 21,135 | |||||||||||||
Net income (loss) attributable to controlling shareholder | 115,965 | 77,175 | (47,570 | ) | 145,570 | |||||||||||||
Basic and diluted net income per share of common stock | $ | 1,159,650 | $ | 1,284,440 | ||||||||||||||
Shares outstanding | 100 | 13 1/3 | (h) | 113 1/3 | ||||||||||||||
| (a) | Represents the historical results of Pilgrim’s Pride for the thirty-nine weeks ended September 26, 2009 by combining the financial results for the fiscal year ended September 26, 2009 less the three months ended December 27, 2008, as follows: |
| Pilgrim’s Pride | ||||||||||||
| Fiscal year ended September 26, 2009 | Three months ended December 27, 2008 | 39 Weeks ended September 26, 2009 | ||||||||||
| in thousands | (-) | Pro forma | ||||||||||
Net sales | $ | 7,088,055 | $ | 1,876,991 | $ | 5,211,064 | ||||||
Cost of good sold | 6,705,157 | 1,960,373 | 4,744,784 | |||||||||
Restructuring items | 12,464 | — | 12,464 | |||||||||
Gross profit (loss) | 370,434 | (83,382 | ) | 453,816 | ||||||||
Selling, general and administrative expenses | 301,120 | 92,437 | 208,683 | |||||||||
Restructuring items | 1,987 | 2,422 | (435 | ) | ||||||||
Other income, net | (3,724 | ) | (1,451 | ) | (2,273 | ) | ||||||
Interest expense, net | 157,543 | 39,038 | 118,505 | |||||||||
Total expenses | 456,926 | 132,446 | 324,480 | |||||||||
Income (loss) from continuing operations before reorganization items and before income taxes | (86,492 | ) | (215,828 | ) | 129,336 | |||||||
Reorganization items | 87,275 | 13,250 | 74,025 | |||||||||
Income (loss) from continuing operations before income taxes | (173,767 | ) | (229,078 | ) | 55,311 | |||||||
Income tax expense (benefit) | (21,586 | ) | 278 | (21,864 | ) | |||||||
Net income (loss) | $ | (152,181 | ) | $ | (229,356 | ) | $ | 77,175 | ||||
108
Table of Contents
| (b) | Reflects the elimination of $28.0 million of intercompany sales and $28.0 million of intercompany purchases (recorded as cost of goods sold) among us, and Pilgrim’s Pride for the period from December 29, 2008 through September 27, 2009. |
| (c) | On September 16, 2009, we entered into a stock purchase agreement with Pilgrim’s Pride Corporation. Upon consummation of the transactions contemplated by the stock purchase agreement and in accordance with PPC’s amended joint plan of reorganization, we will purchase 64% of the total issued and outstanding new common stock of the reorganized PPC in exchange for aggregate consideration of $800.0 million in cash. The reorganized PPC is also expected to enter into a credit facility as it exits from bankruptcy consisting of a three-year revolving credit facility in the amount not to exceed $600.0 million, a three-year term loan A facility in the amount of up to $375.0 million and a five-year term loan B facility in the amount of at least up to $775.0 million. We refer to this financing arrangement as the Exit Facility. |
| The purchase price allocation is preliminary pending completion of the acquisition and the independent valuations by a third-party firm. The allocation presented below reflects management’s estimated fair values of the individual assets and liabilities as of December 23, 2009 (in thousands): |
Purchase price allocation: | ||||
Purchase price paid to previous shareholders | $ | 800,000 | ||
Non-controlling interest(i) | 593,989 | |||
Total purchase price | $ | 1,393,989 | ||
Preliminary purchase price allocation: | ||||
Current assets and liabilities, net | $ | 582,699 | ||
Property, plant and equipment(ii) | 2,388,579 | |||
Intangible assets(iii) | 81,000 | |||
Goodwill | 58,107 | |||
Non-current assets and liabilities, net | (1,716,396 | ) | ||
Total purchase price allocation | $ | 1,393,989 | ||
| (i) | The non-controlling interest of $594.0 million is calculated based on a market share price of $7.70 as of December 22, 2009 multiplied by the number of shares outstanding of 77,141,389 at September 27, 2009. |
| (ii) | Property, plant and equipment was recorded at preliminary estimated fair values as of December 23, 2009 (in thousands). |
Land | $ | 96,159 | |
Building, machinery, and equipment | 2,166,948 | ||
Autos and trucks | 50,529 | ||
Construction in progress | 74,943 | ||
Total plant, property and equipment | $ | 2,388,579 | |
| Depreciation and amortization is recorded using the straight-line method over the estimated useful lives of the assets as follows: |
Building, machinery, and equipment | 11 years | |
Autos and trucks | 5 years | |
| (iii) | Identified intangible assets were recorded at preliminary estimated fair values as of December 23, 2009 (in thousands): |
Customer relationships. | $ | 45,611 | |
Trade names | 35,121 | ||
Non-compete agreement | 268 | ||
Total intangible assets | $ | 81,000 | |
| The $7.6 million decrease in pro forma depreciation and amortization expense reflected in cost of goods sold is comprised of (1) the estimated depreciation and amortization expense of $142.9 million based on estimated fair values and useful lives of identified tangible and intangible assets, and (2) elimination of historical depreciation and amortization expense of $150.5 million for the period December 29, 2008 through September 27, 2009. |
109
Table of Contents
| The $0.5 million decrease in pro forma depreciation and amortization expense for the period December 29, 2008 through September 27, 2009 reflected in selling, general and administrative expenses is comprised of (1) estimated depreciation and amortization expense of $19.5 million based on the estimated fair values and useful lives of identified tangible and intangible assets and (2) elimination of historical depreciation and amortization expense of $20.0 million: |
| Estimated depreciation and amortization expense | ||||||||||||||||||||
(in thousands, except useful | Historical | Estimated | Estimated useful | Cost of | Selling, | Total | ||||||||||||||
Land | $ | 96,159 | n/a | $ | n/a | $ | n/a | $ | n/a |
| ||||||||||
Buildings, machinery, and equipment | 2,166,948 | 11 | 135,927 | 11,820 | | 147,747 | | |||||||||||||
Autos and trucks | 50,529 | 5 | 6,973 | 606 | 7,579 | |||||||||||||||
Construction in progress | 74,943 | n/a | n/a | n/a | n/a | |||||||||||||||
Customer relationships | 45,611 | 13 | n/a | 2,631 | 2,631 | |||||||||||||||
Trade names | 35,121 | 6 | n/a | 4,390 | 4,390 | |||||||||||||||
Non-compete agreement | 268 | 3 | n/a | 67 | 67 | |||||||||||||||
Total | $ | 1,556,655 | $ | 2,469,579 | $ | 142,900 | $ | 19,514 | $ | 162,414 | ||||||||||
Less historical depreciation and amortization expense | 150,531 | 20,028 | 170,559 | |||||||||||||||||
Adjustment for the transaction | $ | (7,631 | ) | $ | (514 | ) | $ | (8,145 | ) | |||||||||||
| The customer relationship intangible asset is being amortized on a straight-line basis over 13 years. This represents management’s preliminary estimate of the period of economic benefit and annual customer profitability. The trade name intangible assets and non-compete intangible assets are being amortized on a straight-line basis over six and three years, respectively. |
| (d) | Reflects an estimated $1.7 million of incremental costs associated with being a public company on the New York Stock Exchange. These costs include incremental audit fees, directors’ and officers’ insurance, internal audit and Sarbanes-Oxley expenses and printing costs, based on preliminary discussions with anticipated service providers. |
| (e) | Reflects the following adjustments to interest expense, net (in thousands): |
Interest expense, 11.625% senior unsecured notes due 2014(i) | $ | 21,533 | ||
Debt issuance amortization, 11.625% senior unsecured notes due 2014(ii) | 210 | |||
Debt discount accretion, 11.625% senior unsecured notes due 2014(iii) | 2,576 | |||
Interest expense, intercompany debt(iv) | (13,726 | ) | ||
Interest expense, PPC debt(v) | (36,060 | ) | ||
Debt issuance amortization, PPC Exit Facility (vi) | 9,194 | |||
Total interest expense, net | $ | (16,273 | ) | |
| On April 27, 2009, our wholly owned subsidiaries, JBS USA, LLC and JBS USA Finance, Inc., issued 11.625% senior unsecured notes due 2014 in an aggregate principal amount of $700.0 million. Net proceeds, after deducting the debt discount costs of $48.7 million and debt issuance costs of $0.5 million, were $650.8 million. The net proceeds, in addition to $3.4 million of cash on hand, were applied to repay $550.8 million of the outstanding principal and accrued interest on intercompany loans to us from a subsidiary of JBS S.A. (reflecting $519.6 million outstanding principal payments and $31.2 million accrued interest), $100.0 million of borrowings under our secured revolving credit facility, and $3.4 million of additional debt issuance costs. In order to calculate the pro forma interest adjustments shown in (i), (ii) and (iii), we pro-rated the gross debt issuance costs and debt discount amounts based on the net proceeds used to repay the outstanding principal on intercompany loans of $519.6 million as a percentage of (1) total offering proceeds of $650.8 million less (2) debt issuance costs paid with $3.4 million cash on hand, or net proceeds of $647.4 million. These pro-rated amounts represent the costs we would have incurred to generate the net proceeds used to repay the outstanding principal on intercompany loans of $519.6 million. |
| (i) | Includes pro forma interest expense on $561.9 million outstanding principal ($519.6 million proceeds plus $39.1 million pro-rated bond discount and $3.2 million pro-rated debt issuance costs) of our 11.625% senior unsecured notes due 2014 for the period from December 29, 2008 through April 27, 2009, calculated on a straight-line basis over five years. The $3.2 million pro-rated debt issuance cost is calculated as the ratio of the $519.6 million of outstanding principal on our consolidated intercompany loans which were repaid divided by net proceeds of $647.4 million multiplied by the total debt issuance costs of $4.0 million. The $39.1 million pro-rated bond discount is calculated as the ratio of $519.6 million of outstanding principal on our consolidated intercompany loans which were repaid divided by net proceeds of $647.4 million multiplied by bond discount of $48.7 million. The total principal amount of our 11.625% senior secured notes due 2014 is $700.0 million, and our pro forma interest expense accordingly does not purport to be indicative of what our interest expense will be in the future. |
110
Table of Contents
| (ii) | Includes pro forma interest expense for the amortization of pro-rated debt issuance costs of $3.2 million on $561.9 million of our 11.625% senior unsecured notes due 2014 for the period from December 29, 2008 through April 27, 2009, calculated on a straight-line basis over five years. |
| (iii) | Includes pro forma interest expense for the accretion of the pro-rated bond discount of $39.1 million on $561.9 million of our 11.625% senior unsecured notes due 2014 for the period from December 29, 2008 through April 27, 2009, calculated on a straight-line basis over five years. |
| (iv) | Includes the reduction of pro forma interest expense for the period from December 29, 2008 through May 12, 2009 on our consolidated intercompany loans from JBS S.A. due to a $519.6 million reduction in the aggregate principal amount of those loans using a portion of the net proceeds of our 11.625% senior unsecured notes due 2014. The $13.7 million reduction of interest expense is comprised of the (1) elimination of actual interest costs of $17.4 million incurred on outstanding borrowings for the period from December 29, 2008 through May 12, 2009, net of (2) pro forma interest expense of $3.7 million based on average borrowings of $139.0 million for a 135-day period for which the borrowings were in excess of $519.6 million at an average interest rate of 7.0%. |
| (v) | The $36.1 million decrease in pro forma interest expense is comprised of (1) elimination of historical interest expense of $118.5 million incurred on PPC’s historical borrowings for the period December 29, 2008 through September 27, 2009 net of (2) $82.4 million of interest expense on $1,570.3 million outstanding borrowings for the period December 29, 2008 through September 27, 2009 at an estimated average interest rate of 7.0% related to PPC’s anticipated Exit Facility. The historical interest income recognized by PPC and the historical interest expense associated with PPC’s Mexican revolving credit facility were not adjusted as it was not part of the bankruptcy filing. |
| (vi) | Includes pro forma interest expense of $9.2 million for the amortization of debt issuance costs related to the Exit Facility for the period December 29, 2008 through September 27, 2009, calculated on a straight-line basis over a weighted average life of 3.9 years. |
| (f) | The $85.6 million pro forma income tax expense is comprised of (1) historical income tax expense of JBS USA Holdings, Inc. and (2) income tax expense from pro forma income from continuing operations on all pro forma adjustments as follows (in thousands): |
JBS USA Holdings Inc., historical income tax expense | $ | 58,236 | |||||
Income from continuing operations: | |||||||
Pilgrim’s Pride, historical | (+) | 55,311 | |||||
Adjustment for transactions | (+) | 22,750 | |||||
Total income from continuing operations | 78,061 | ||||||
Pro forma income tax expense at 35% | 27,321 | ||||||
Total pro forma income tax expense | $ | 85,557 | |||||
| The Company has not yet reached a decision as to whether the undistributed earnings of PPC’s subsidiary in Mexico will continue to be permanently reinvested, and therefore the actual accounting for income taxes could differ. |
| (g) | Reflects the elimination of the 36% non-controlling shareholder net income of PPC for purposes of calculating the earnings per share of the controlling shareholder. The $21.1 million adjustment is calculated as follows (in thousands): |
Pilgrim’s Pride historical net income | $ | 77,175 | ||
Pilgrim’s Pride adjustment for pro forma transactions: | ||||
Depreciation and amortization benefit | 8,145 | |||
Interest expense benefit(i) | 26,866 | |||
Income tax expense(ii) | (53,477 | ) | ||
Total Pilgrim’s Pride adjustment for pro forma transactions | (18,466 | ) | ||
Pilgrim’s Pride adjusted pro forma net income | 58,709 | |||
Non-controlling shareholder pro forma interest (36%) | $ | 21,135 | ||
| (i) | Includes interest expense for PPC and amortization of debt issuance cost on PPC’s Exit Facility, as reflected in (e)(v)(vi). |
| (ii) | The $53.5 million pro forma income tax expense for PPC is comprised of the following (1) $2.8 million tax effect of the pro forma depreciation and amortization adjustment ($8,145 multiplied by 35%), plus (2) $9.4 million tax effect of the pro forma interest expense ($26,866 multiplied by 35%), plus (3) $19.4 million tax effect of historical PPC income from continuing operations before income taxes ($55,311 multiplied by 35%), plus (4) $21.9 million historical PPC income tax benefit. |
| (h) | Includes 40% of the 33 1/3 shares of our common stock sold related to the BNDESPAR transaction. We reflect only 40% of these shares because 40% of the proceeds of the sale of the shares (40% of $2.0 billion, which is $800.0 million) are expected to be used to pay the cash consideration for the Proposed PPC Acquisition and are therefore directly attributable to the Proposed PPC Acquisition. See note (c) above. We intend to initially fund a portion of the cash consideration for the Proposed PPC Acquisition from cash received from subsidiaries and cash on hand pending the funding of the remaining portion of our $2.0 billion stock purchase agreement with JBS S.A., which we expect to occur following the issuance by JBS S.A. of the debentures in connection with the BNDESPAR transaction. This interim funding would not require us to modify the contract described in “Principal and selling stockholder—JBS S.A. purchase and sale agreement” or the proceeds ultimately received from JBS S.A. under that contract. |
111
Table of Contents
Unaudited pro forma combined statement of operations for the thirty-nine weeks ended September 28, 2008
| JBS USA Holdings | JBS Packerland | JBS Packerland | JBS Packerland | Five Rivers | Five Rivers | Pilgrim’s Pride | JBS USA Holdings | |||||||||||||||||||||||||||||||
| Thirty-nine weeks ended September 28, 2008 | December 31, 2007 through September 28, 2008 (a)(i) | Adjustment for 50% equity interest in Five Rivers (b) | Adjustment for assets not acquired (c)(i) | December 31, 2007 through September 28, 2008 (a)(ii) | Adjustment for assets not acquired (c)(ii) | Thirty-nine weeks ended September 27, 2008 (d) | Adjustment for transactions | Notes | Thirty-nine weeks ended September 28, 2008 | |||||||||||||||||||||||||||||
| Historical | Historical | Historical | Pro forma | |||||||||||||||||||||||||||||||||||
| in thousands, except earnings (loss) per share | (+) | (-) | (-) | (+) | (-) | (+) | (+) | |||||||||||||||||||||||||||||||
Net sales | $ | 8,972,255 | $ | 2,357,339 | $ | — | $ | 3,673 | $ | 1,331,649 | $ | 828,389 | $ | 6,471,404 | $ | (48,432 | ) | (e | ) | $ | 18,252,153 | |||||||||||||||||
Cost of goods sold | 8,612,590 | 2,197,001 | — | (14,454 | ) | 1,342,048 | 862,032 | 6,712,012 | (60,840 | ) | (e | ), (f), (g) | 17,955,233 | |||||||||||||||||||||||||
Restructuring items | — | — | — | — | — | — | 27,990 | — | 27,990 | |||||||||||||||||||||||||||||
Gross profit | 359,665 | 160,338 | — | 18,127 | (10,399 | ) | (33,643 | ) | (268,598 | ) | 12,408 | 268,930 | ||||||||||||||||||||||||||
Selling, general and administrative expenses | 98,296 | 74,000 | — | 11,391 | 10,432 | — | 272,166 | 2,884 | (f | ), (g), (h) | 446,387 | |||||||||||||||||||||||||||
Restructuring items, net | — | — | — | — | — | — | 16,156 | — | 16,156 | |||||||||||||||||||||||||||||
Foreign currency transaction losses | 17,572 | — | — | — | — | — | — | — | 17,572 | |||||||||||||||||||||||||||||
Goodwill impairment charges | — | — | — | — | — | — | 501,446 | — | 501,446 | |||||||||||||||||||||||||||||
Other (income) expense | (9,775 | ) | 7,550 | 17,359 | (9,546 | ) | (265 | ) | 16 | 633 | — | (9,686 | ) | |||||||||||||||||||||||||
Losses (gains) on sales of plant, property and equipment | (233 | ) | 152 | — | — | 8 | — | — | — | (73 | ) | |||||||||||||||||||||||||||
Interest expense, net | 23,287 | 29,521 | — | 29,521 | 14,142 | 14,179 | 102,195 | 27,733 | (i | ) | 153,178 | |||||||||||||||||||||||||||
Total expenses | 129,147 | 111,223 | 17,359 | 31,366 | 24,317 | 14,195 | 892,596 | 30,617 | 1,124,980 | |||||||||||||||||||||||||||||
Income (loss) from continuing operations before income taxes | 230,518 | 49,115 | (17,359 | ) | (13,239 | ) | (34,716 | ) | (47,838 | ) | (1,161,194 | ) | (18,209 | ) | (856,050 | ) | ||||||||||||||||||||||
Income tax expense (benefit) | 74,267 | 1,911 | — | 1,911 | — | — | (202,188 | ) | (2,606 | ) | (j | ) | (130,527 | ) | ||||||||||||||||||||||||
Net income (loss) | 156,251 | 47,204 | (17,359 | ) | (15,150 | ) | (34,716 | ) | (47,838 | ) | (959,006 | ) | (15,603 | ) | (725,523 | ) | ||||||||||||||||||||||
Less net loss attributable to non-controlling interest in PPC | — | — | — | — | — | — | — | (328,681 | ) | (k | ) | (328,681 | ) | |||||||||||||||||||||||||
Net income (loss) attributable to controlling shareholder | $ | 156,251 | $ | 47,204 | $ | (17,359 | ) | $ | (15,150 | ) | $ | (34,716 | ) | $ | (47,838 | ) | $ | (959,006 | ) | $ | 313,078 | $ | (396,842 | ) | ||||||||||||||
Basic and diluted net income per share | $ | 1,562,510 | $ | (3,501,548 | ) | |||||||||||||||||||||||||||||||||
Shares outstanding | 100 | 13 1/3 | (l | ) | 113 1/3 | |||||||||||||||||||||||||||||||||
112
Table of Contents
| (a) | Represents the historical results of |
| (i) | JBS Packerland, and |
| (ii) | Five Rivers |
for the period from December 31, 2007 through September 28, 2008.
| (b) | Represents the elimination of the 50% equity interest in Five Rivers from the historical results of JBS Packerland for the period from December 31, 2007 through September 28, 2008. On a pro forma basis, the results of Five Rivers are reflected on a fully consolidated basis as part of the JBS Packerland Acquisition. |
| (c) | Reflects the elimination of assets not acquired for |
| (i) | JBS Packerland, and |
| (ii) | Five Rivers. |
| The adjustment for assets not acquired includes, among others (1) revenue and expenses associated with cattle owned by Smithfield Beef Group, Inc. that were retained by the seller, Smithfield Foods, Inc., (2) revenue and expenses associated with cattle owned by Five Rivers that were retained by Smithfield Foods, Inc., (3) elimination of transaction expenses incurred by Smithfield Foods, Inc. in connection with the sale of the Smithfield Beef Group, Inc. to us recorded in selling, general and administrative expenses, (4) elimination of $29.5 million and $14.2 million in historical interest expense related to funding working capital requirements of assets not acquired, and (5) other assets and insignificant businesses not acquired and liabilities not assumed. |
| (d) | Represents the historical results of Pilgrim’s Pride for the thirty-nine weeks ended September 27, 2008 by combining the historical financial results for the fiscal year ended September 27, 2008 less the three months ended December 29, 2007 as follows: |
| Pilgrim’s Pride | ||||||||||||
| Fiscal year ended September 27, 2008 | Three months ended December 29, 2007 | 39 weeks ended September 27, 2008 | ||||||||||
| in thousands | (-) | |||||||||||
Net sales | $ | 8,518,757 | $ | 2,047,353 | $ | 6,471,404 | ||||||
Cost of good sold | 8,654,262 | 1,942,250 | 6,712,012 | |||||||||
Restructuring items | 27,990 | — | 27,990 | |||||||||
Gross profit (loss) | (163,495 | ) | 105,103 | (268,598 | ) | |||||||
Selling, general and administrative expenses | 376,599 | 104,433 | 272,166 | |||||||||
Restructuring items | 16,156 | — | 16,156 | |||||||||
Goodwill impairment charges | 501,446 | — | 501,446 | |||||||||
Other income, net | (2,230 | ) | (2,863 | ) | 633 | |||||||
Interest expense, net | 131,627 | 29,432 | 102,195 | |||||||||
Total expenses | 1,023,598 | 131,002 | 892,596 | |||||||||
Loss from continuing operations before income taxes | (1,187,093 | ) | (25,899 | ) | (1,161,194 | ) | ||||||
Income tax expense (benefit) | (194,921 | ) | 7,267 | (202,188 | ) | |||||||
Net loss | $ | (992,172 | ) | $ | (33,166 | ) | $ | (959,006 | ) | |||
| (e) | Reflects the elimination of (i) $6.9 million of intercompany sales and $6.9 million of intercompany purchases (recorded as cost of goods sold) between JBS Packerland and us for the period from December 31, 2007 through September 28, 2008, and (ii) $41.5 million of intercompany sales and $41.5 million of intercompany purchases (recorded as cost of goods sold) among us, JBS Packerland, and Pilgrim’s Pride for the period from December 31, 2007 through September 28, 2008. |
| (f) | On March 4, 2008, JBS S.A. and Smithfield Foods, Inc., or Smithfield Foods, entered into a Stock Purchase Agreement, or the Smithfield Agreement. Pursuant to the Smithfield Agreement, JBS S.A. executed through us the acquisition of Smithfield Beef Group, Inc., or Smithfield Beef, for $569.4 million in cash (including $32.3 million of transaction related costs). We then contributed the funds to JBS USA, LLC, which finalized the acquisition of Smithfield Beef, or the Smithfield Acquisition. The purchase included 100% of Five Rivers Ranch Cattle Feeding LLC, or Five Rivers, which was held by Smithfield Beef in a 50/50 joint venture with Continental Grain Company. On October 23, 2008, the acquisition of Smithfield Beef was completed. In conjunction with the closing of this purchase, Smithfield Beef was renamed JBS Packerland and Five Rivers was renamed JBS Five Rivers Cattle Feeding LLC, or JBS Five Rivers. The assets acquired include four processing plants and eleven feedlots. The Smithfield Acquisition provides additional capacity to continue to meet customer demand. |
| The purchase excluded substantially all live cattle inventories held by Smithfield Beef and Five Rivers as of the closing date, together with its associated debt. The excluded live cattle were raised by JBS Five Rivers after closing for a negotiated fee. |
The purchase price allocation is preliminary pending completion of independent valuations of identified tangible and intangible assets acquired and certain liabilities acquired, including, but not limited to deferred income taxes. In addition, we are in the process of finalizing costs associated with the relocation of certain employees from the former Green Bay, Wisconsin headquarters of Smithfield Beef Group, Inc. to the Greeley, Colorado headquarters of JBS USA Holding, Inc. We |
113
Table of Contents
expect to finalize these costs during the fourth quarter of our fiscal year 2009. The allocation presented below reflects the estimated fair value of the individual assets acquired and liabilities assumed as of October 23, 2008 (in thousands): |
Purchase price allocation: | ||||
Purchase price paid to previous shareholders | $ | 537,068 | ||
Fees and direct expenses | 32,322 | |||
Total purchase price | $ | 569,390 | ||
Preliminary purchase price allocation: | ||||
Current assets and liabilities, net | $ | 47,097 | ||
Property, plant and equipment(i) | 314,306 | |||
Deferred income tax liability | (102,781 | ) | ||
Goodwill | 174,553 | |||
Intangible assets(ii) | 131,044 | |||
Other non-current assets and liabilities, net | 5,171 | |||
Total purchase price allocation | $ | 569,390 | ||
| (i) | Property, plant and equipment was recorded at preliminary estimated fair values as of the date of the JBS Packerland Acquisition as follows (in thousands): |
Land | $ | 51,383 | |
Land improvements | 43,574 | ||
Building, machinery, and equipment | 210,850 | ||
Furniture, fixtures, office equipment, and other | 2,106 | ||
Construction in progress | 6,393 | ||
Total plant, property and equipment | $ | 314,306 | |
| Depreciation and amortization is recorded using the straight-line method over the estimated useful lives of the assets as follows: |
Furniture, fixtures, office equipment and other | 5 to 7 years | |
Machinery and equipment | 5 to 15 years | |
Buildings and improvements | 15 to 40 years | |
Leasehold improvements | shorter of useful life or the lease term | |
| (ii) | Intangible assets include customer relationships resulting from the JBS Packerland Acquisition are being amortized on an accelerated basis over 18 years. This represents management’s estimate of the period of expected economic benefit and annual customer profitability. |
Customer relationships | $ | 99,500 | |
Non-amortizing trademarks | 19,400 | ||
Non-amortizing water rights | 12,144 | ||
Total intangible assets | $ | 131,044 | |
| The $2.4 million increase in pro forma depreciation and amortization expense reflected in cost of goods sold is comprised of (1) estimated depreciation and amortization expense of $21.5 million based on estimated fair values and useful lives of identified tangible and intangible assets for the period January 1 through September 28, 2008, and (2) elimination of historical depreciation and amortization expense of $19.1 million for the period January 1 through September 28, 2008. |
| The $3.9 million increase in pro forma depreciation and amortization expense reflected in selling, general, and administrative expense is comprised of (1) estimated depreciation and amortization expense of $5.0 million based on estimated fair values and useful lives of identified tangible and intangible assets for the period January 1 through September 20, 2008, and (2) elimination of historical depreciation and amortization expense of $1.1 million for the period January 1 through September 28, 2008. |
114
Table of Contents
| Estimated depreciation and amortization expense | |||||||||||||||||
| (in thousands, except useful lives) | Historical net book value | Estimated fair value | Estimated useful lives (yrs) | Cost of goods sold | Selling, general and administrative | Total | |||||||||||
Land | $ | 34,058 | $ | 51,383 | n/a | $ | n/a | $ | n/a | $ | n/a | ||||||
Land improvements | 42,765 | 43,574 | 8 | 3,958 | 165 | 4,123 | |||||||||||
Buildings, machinery, and equipment | 130,249 | 210,850 | 9 | 17,134 | 714 | 17,848 | |||||||||||
Furniture, fixtures, office equipment, and other | 5,851 | 2,106 | 3 | 452 | 19 | 471 | |||||||||||
Construction in progress | 6,393 | 6,393 | n/a | n/a | n/a | n/a | |||||||||||
Customer relationships | n/a | 99,500 | 18 | n/a | 4,146 | 4,146 | |||||||||||
Trademark | 6,488 | 19,400 | n/a | n/a | n/a | n/a | |||||||||||
Water rights | 12,144 | 12,144 | n/a | n/a | n/a | n/a | |||||||||||
Total | $ | 237,948 | $ | 445,350 | $ | 21,544 | $ | 5,044 | $ | 26,588 | |||||||
Less historical depreciation and amortization expense | 19,094 | 1,060 | 20,154 | ||||||||||||||
Adjustment for the transaction | $ | 2,450 | $ | 3,984 | $ | 6,434 | |||||||||||
| (g) | On September 16, 2009, we entered into a stock purchase agreement with Pilgrim’s Pride Corporation. Upon consummation of the transactions contemplated by the stock purchase agreement and in accordance with PPC’s amended joint plan of reorganization, we will purchase 64% of the total issued and outstanding new common stock of Pilgrim’s Pride, as reorganized in accordance with the amended joint plan of reorganization, in exchange for aggregate consideration of $800 million in cash. The reorganized PPC is also expected to enter into a credit facility as it exits from bankruptcy consisting of a three-year revolving credit facility in the amount not to exceed $600.0 million, a three-year term loan A facility in the amount of up to $375.0 million and a five-year term loan B facility in the amount of up to $775.0 million. We refer to this financing arrangement as the Exit Facility. |
| The purchase price allocation is preliminary pending completion of the acquisition and the independent valuations by a third-party firm. The allocation presented below reflects management’s estimated fair values of the individual assets acquired and liabilities assumed as of December 23, 2009 (in thousands): |
Purchase price allocation: | ||||
Purchase price paid to previous shareholders | $ | 800,000 | ||
Non-controlling interest(i) | 593,989 | |||
Total purchase price | $ | 1,393,989 | ||
Preliminary purchase price allocation: | ||||
Current assets and liabilities, net | $ | 582,699 | ||
Property, plant and equipment(ii) | 2,388,579 | |||
Intangible assets(iii) | 81,000 | |||
Goodwill | 58,107 | |||
Non-current assets and liabilities, net | (1,716,396 | ) | ||
Total purchase price allocation | $ | 1,393,989 | ||
| (i) | The non-controlling interest of $594.0 million is calculated based on a market share price of $7.70 as of December 22, 2009 multiplied by the number of shares outstanding of 77,141,389 at September 27, 2009. |
| (ii) | Property, plant and equipment was recorded at preliminary estimated fair values as of December 23, 2009 (in thousands) as follows: |
Land | $ | 96,159 | |
Building, machinery, and equipment | 2,166,948 | ||
Autos and trucks | 50,529 | ||
Construction in progress | 74,943 | ||
Total plant, property and equipment | $ | 2,388,579 | |
| Depreciation and amortization is recorded using the straight-line method over the estimated useful lives of the assets as follows: |
Building, machinery, and equipment | 11 years | |
Autos and trucks | 5 years | |
115
Table of Contents
| (iii) | Identified intangible assets were recorded at preliminary estimated fair values as of December 23, 2009 as follows (in thousands): |
Customer relationships | $ | 45,611 | |
Trade names | 35,121 | ||
Non-compete agreement | 268 | ||
Total intangible assets | $ | 81,000 | |
| The customer relationship intangible asset is being amortized on a straight-line basis over 13 years. This represents management’s preliminary estimate of the period of economic benefit and annual customer profitability. The trade name intangible assets and non-compete intangible assets are being amortized on a straight-line basis over six and three years, respectively. |
| The $14.9 million decrease in pro forma depreciation and amortization expense for the period January 1, 2008 through September 28, 2008 reflected in cost of goods sold is comprised of (1) the estimated depreciation and amortization expense of $142.9 million based on estimated fair values and useful lives of identified tangible and intangible assets, and (2) elimination of historical depreciation and amortization expense of $157.8 million. |
| The $2.8 million decrease in pro forma depreciation and amortization expense for the period January 1, 2008 through September 28, 2008 reflected in selling, general and administrative expenses is comprised of (1) estimated depreciation and amortization expense of $19.5 million based on the estimated fair values and useful lives of identified tangible and intangible assets and (2) elimination of historical depreciation and amortization expense of $22.3 million: |
Estimated depreciation and | ||||||||||||||||||||
| (in thousands, except useful lives) | Historical net book value | Estimated fair value | Estimate useful lives (yrs) | Cost of goods sold | Selling, general, and administrative | Total | ||||||||||||||
Land | $ | 96,159 | n/a | $ | n/a | $ | n/a | $ | n/a | |||||||||||
Buildings, machinery, and equipment | 2,166,948 | 11 | 135,927 | 11,820 | 147,747 | |||||||||||||||
Autos and trucks | 50,529 | 5 | 6,973 | 606 | 7,579 | |||||||||||||||
Construction in progress | 74,943 | n/a | n/a | n/a | n/a | |||||||||||||||
Customer Relationships | 45,611 | 13 | n/a | 2,631 | 2,631 | |||||||||||||||
Trade name | 35,121 | 6 | n/a | 4,390 | 4,390 | |||||||||||||||
Non-compete agreement | 268 | 3 | n/a | 67 | 67 | |||||||||||||||
Total | $ | 1,556,655 | $ | 2,469,579 | $ | 142,900 | $ | 19,514 | $ | 162,414 | ||||||||||
Less historical depreciation and amortization expense | 157,757 | 22,287 | 180,044 | |||||||||||||||||
Adjustment for the transaction | $ | (14,857 | ) | $ | (2,773 | ) | $ | (17,630 | ) | |||||||||||
| (h) | Reflects $1.7 million additional costs associated with being a public company on the New York Stock Exchange. These costs include incremental audit fees, directors’ and officers’ insurance, internal audit and Sarbanes-Oxley related expenses and printing costs, based on preliminary discussions with anticipated service providers. |
| (i) | Reflects the following adjustments to interest expense, net (in thousands): |
Interest expense, 11.625% senior unsecured notes due 2014(i) | $ | 48,987 | ||
Debt issuance amortization, 11.625% senior unsecured notes due 2014(ii) | 479 | |||
Debt discount accretion, 11.625% senior unsecured notes due 2014(iii) | 5,861 | |||
Interest expense, other debt(iv) | (18,642 | ) | ||
Interest expense, PPC debt(v) | (18,146 | ) | ||
Debt issuance amortization, PPC Exit Facility(vi) | 9,194 | |||
Total Interest expense, net | $ | 27,733 | ||
| On April 27, 2009, our wholly owned subsidiaries, JBS USA, LLC and JBS USA Finance, Inc., issued 11.625% senior unsecured notes due 2014 in an aggregate principal amount of $700.0 million. Net proceeds, after deducting the debt discount costs of $48.7 million and debt issuance costs of $0.5 million, were $650.8 million. The net proceeds, in addition to $3.4 million of cash on hand, were applied to repay $550.8 million of the outstanding principal and accrued interest on intercompany loans to us from a subsidiary of JBS S.A. (reflecting $519.6 million outstanding principal payments and $31.2 million accrued interest), $100.0 million of borrowings under our secured revolving credit facility, and $3.4 million of additional debt issuance costs. In order to calculate the pro forma interest adjustments shown in (i), (ii), (iii), we pro-rated the gross debt issuance costs and debt discount amounts based on the net proceeds used to repay the outstanding principal on intercompany loans of $519.6 million as a percentage of (1) total offering proceeds of $650.8 million less (2) debt issuance costs paid with $3.4 million cash on hand, or net proceeds of $647.4 million. These pro-rated amounts represent the costs we would have incurred to generate the net proceeds used to repay the outstanding principal on intercompany loans of $519.6 million. |
| (i) | Includes pro forma interest expense on $561.9 million outstanding principal ($519.6 million proceeds plus $39.1 million pro-rated bond discount and $3.2 million pro-rated debt issuance costs) of our 11.625% senior unsecured notes due |
116
Table of Contents
2014 for the period from December 31, 2007 through September 28, 2008, calculated on a straight-line basis over five years. The $3.2 million pro-rated debt issuance cost is calculated as the ratio of the $519.6 million of outstanding principal on our consolidated intercompany loans which were repaid divided by net proceeds of $647.4 million multiplied by the total debt issuance costs of $4.0 million. The $39.1 million pro-rated bond discount is calculated as the ratio of $519.6 million of outstanding principal on our consolidated intercompany loans which were repaid divided by net proceeds of $647.4 million multiplied by bond discount of $48.7 million. The total principal amount of our 11.625% senior secured notes due 2014 is $700.0 million, and our pro forma interest expense accordingly does not purport to be indicative of what our interest expense will be in the future. |
| (ii) | Includes pro forma interest expense for the amortization of pro-rated debt issuance costs of $3.2 million on $561.9 million of our 11.625% senior unsecured notes due 2014 for the period from December 31, 2007 through September 28, 2008, calculated on a straight-line basis over five years. |
| (iii) | Includes pro forma interest expense for the accretion of the pro-rated bond discount of $39.1 million on $561.9 million of our 11.625% senior unsecured notes due 2014 for the period from December 31, 2007 through September 28, 2008, calculated on a straight-line basis over five years. |
| (iv) | Includes the reduction of pro forma interest expense for the period from December 31, 2007 through September 28, 2008 on our consolidated intercompany loans from JBS S.A. due to a $519.6 million reduction in the aggregate principal amount of those loans using a portion of the net proceeds of our 11.625% senior unsecured notes due 2014. The $18.6 million reduction of interest expense is comprised of the (2) pro forma interest expense of $2.0 million based on average borrowings of $230.4 million for a 55 day period for which the borrowings were in excess of 519.6 million at an average interest rate of 5.6%, and (2) elimination of actual interest costs of $20.6 million incurred on outstanding borrowings for the period from December 31, 2007 through September 28, 2008. |
| (v) | The $18.2 million decrease in pro forma interest expense is comprised of (1) pro forma interest expense of $82.4 million on $1,570.3 million outstanding borrowings for the period December 31, 2007 through September 28, 2008 at an estimated interest rate of 7.0% related to PPC’s anticipated Exit Facility, and (2) elimination of historical interest expense of $100.6 million incurred on borrowings for the period December 31, 2007 through September 28, 2008. The historical interest income recognized by PPC and the historical interest expense associated with PPC’s Mexican revolving credit facility were not adjusted as they were not part of the bankruptcy filing. |
| (vi) | Includes pro forma interest expense of $9.2 million for the amortization of debt issuance costs related to the PPC Exit Facility for the period January 1, 2008 through September 28, 2008, calculated on a straight-line basis over a weighted average life of 3.9 years. |
| (j) | The $130.5 million income tax benefit is comprised of the (1) historical income tax expense of JBS USA Holdings, Inc. and (2) income tax benefit from pro forma net loss from continuing operations on all pro forma adjustments as follows (in thousands): |
JBS USA Holdings, Inc., historical income tax expense | $ | 74,267 | ||||||||
Income (loss) from continuing operations: | ||||||||||
Packerland, historical | (+ | ) | 49,115 | |||||||
Packerland, adjustment for 50% equity interest in Five Rivers | (- | ) | (17,359 | ) | ||||||
Packerland, adjustment for assets not acquired | (- | ) | (13,239 | ) | ||||||
Five Rivers historical | (+ | ) | (34,716 | ) | ||||||
Five Rivers adjustment for assets not acquired | (- | ) | (47,838 | ) | ||||||
Pilgrim’s Pride, historical | (+ | ) | (1,161,194 | ) | ||||||
Pilgrim’s Pride, goodwill impairment | (+ | ) | 501,446 | |||||||
Adjustment for transactions | (+ | ) | (18,209 | ) | ||||||
Total pro forma net loss from continuing operations | (585,122 | ) | ||||||||
Pro forma income tax benefit at 35% | (204,794 | ) | ||||||||
Total pro forma income tax benefit | $ | (130,527 | ) | |||||||
| The Company has not yet reached a decision as to whether the undistributed earnings of PPC’s subsidiary in Mexico will continue to be permanently reinvested and therefore the actual accounting for income taxes could differ. |
| (k) | Reflects the elimination of the 36% non-controlling shareholder net loss of Pilgrim’s Pride for purposes of calculating the earnings per share of the controlling shareholder. The $(328.7) million adjustment is calculated as follows (in thousands): |
Pilgrim’s Pride historical net loss | $ | (959,006 | ) | |
Pilgrim’s Pride pro forma adjustments for transactions: | ||||
Depreciation and amortization benefit | 17,630 | |||
Interest expense benefit(i) | 8,952 | |||
Income tax benefit(ii) | 19,421 | |||
Total Pilgrim’s Pride pro forma adjustment for transactions | 46,003 | |||
Pilgrim’s Pride pro forma net loss | (913,003 | ) | ||
Non-controlling shareholder pro forma interest (36%) | $ | (328,681 | ) | |
117
Table of Contents
| (i) | Includes interest expense for PPC and amortization of debt issuance cost on PPC’s Exit Facility, as reflected in (i)(v)(vi). |
| (ii) | The $19.4 million pro forma income tax benefit for PPC is comprised of the following (1) $6.2 million tax effect of the pro forma depreciation and amortization adjustment ($17,630 multiplied by 35%), plus (2) $3.1 million tax effect of the pro forma interest expense ($8,952 multiplied by 35%), less (3) $230.9 million tax effect of historical PPC loss from continuing operations before the non-taxable goodwill impairment and income taxes ($659,748 multiplied by 35%), plus (4) $202.2 million historical PPC income tax benefit. |
| (l) | Includes 40% of the 33 1/3 shares of our common stock sold related to the BNDESPAR transaction. We reflect only 40% of these shares because 40% of the proceeds of the sale of the shares (40% of $2.0 billion, which is $800.0 million) are expected to be used to pay the cash consideration for the Proposed PPC Acquisition and are therefore directly attributable to the Proposed PPC Acquisition. See note (g) above. We intend to initially fund a portion of the cash consideration for the Proposed PPC Acquisition from cash received from subsidiaries and cash on hand pending the funding of the remaining portion of our $2.0 billion stock purchase agreement with JBS S.A., which we expect to occur following the issuance by JBS S.A. of the debentures in connection with the BNDESPAR transaction. This interim funding would not require us to modify the contract described in “Principal and selling stockholder—JBS S.A. purchase and sale agreement” or the proceeds ultimately received from JBS S.A. under that contract. |
118
Table of Contents
Pro forma fiscal thirty-nine weeks ended September 29, 2009 compared to the pro forma fiscal thirty-nine weeks ended September 28, 2008
Net sales. Net sales were $15,194.2 million for the pro forma thirty-nine weeks ended September 27, 2009 as compared to $18,252.2 million for the pro forma thirty-nine weeks ended September 28, 2008. The decrease of $3,058.0 million, or 16.8%, primarily reflected a 15.6% decrease in our Chicken segment volumes, a 5.3% decrease in our Beef segment volumes, a 1.9% decrease in our Pork segment slaughter volumes and an overall decrease in sales prices, including the effect of the 18.4% depreciation in the Australian dollar to U.S. dollar exchange rate. The decrease in our Beef segment volumes resulted from weaker market conditions as well as an increased strategic emphasis in 2009 on yield (meat produced per head of cattle) as opposed to volume (heads of cattle processed). Declines in pork volumes and selling prices were attributable to lower industry-wide economics, especially lower selling prices for rendered products due to declines in petroleum product prices with which rendered products compete as fuel. The sales price decrease included an 11.3% decrease in our Beef segment prices, a 9.1% decrease in Pork segment prices and a 4.6% decrease in our Chicken segment prices. The decreases in our Chicken segment sales volume were primarily driven by the impact of production cutbacks and subsequent reorganization efforts in both 2008 and 2009, which included in the United States the closure of six processing complexes, two prepared foods plants and eight distribution centers. PPC also experienced a decrease in the volume of protein conversion products it sold during the thirty-nine weeks ended September 26, 2009 as a result of the ongoing impact of a fire at its Mt. Pleasant, Texas protein conversion facility in late 2008 and subsequent reorganization efforts. In Mexico, PPC experienced a decrease in sales volume as a result of production cutbacks. Also negatively affecting the sales comparison was a 29.8% depreciation in the average Mexican peso to U.S. dollar exchange rate between the comparative periods.
Cost of goods sold. Cost of goods sold totaled $14,382.8 million for the pro forma thirty-nine weeks ended September 27, 2009 as compared to $17,955.2 million for the pro forma thirty-nine weeks ended September 28, 2008. The decrease of $3,572.4 million, or 19.9%, was primarily the result of a decrease in cost of goods sold in our Beef, Chicken and Pork segments. Cost of goods sold decreased 15.3% in our Beef segment as a result of a 5.3% decrease in processing volumes driven by weaker market conditions and declining cattle prices, including the effect of the 18.4% depreciation in the Australian dollar to U.S. dollar exchange rate. Cost of goods sold decreased 8.9% in our Pork segment primarily driven by a 9.2% decrease in hog prices and a 1.9% decrease in hog slaughter volumes. Cost of goods sold decreased in our Chicken segment by $1,860.7 million, or 29.6%, from cost of goods sold incurred by PPC’s United States operations for the pro forma thirty-nine weeks ended September 27, 2008. This decrease resulted primarily from production cutbacks, decreased feed ingredient purchases, decreased feed ingredient prices, and gains related to insurance recoveries, including business interruption insurance coverage, related to a fire at PPC’s Mt. Pleasant, Texas facility, in each case recognized in 2009, and an aggregate net loss of $44.8 million on derivative financial instruments executed to manage its exposure to changes in corn and soybean meal prices that PPC recognized during the pro forma thirty-nine weeks ended September 27, 2008. The cost of feed ingredients per pound purchased during the pro forma thirty-nine weeks ended September 27, 2009 decreased 17.9% from the cost of feed ingredients per pound purchased during the pro forma thirty-nine weeks ended September 28, 2008. Cost of goods sold incurred by PPC’s Mexico operations for the pro forma thirty-nine weeks ended September 27, 2009 decreased $121.4 million, or 27.1%, from cost of goods sold incurred by its Mexico operations for the pro forma thirty-nine weeks ended September 28, 2008. This decrease resulted primarily from production cutbacks and decreased feed ingredients costs. The
119
Table of Contents
cost of feed ingredients per pound purchased during the pro forma thirty-nine weeks ended September 27, 2009 decreased 10.5% from the cost of feed ingredients per pound purchased during the pro forma thirty-nine weeks ended September 28, 2008.
Gross margin percentages. Gross margin percentages (gross profit as a percent of net sales) were 5.3% on a pro forma basis for the thirty-nine weeks ended September 27, 2009 as compared to 1.5% on a pro forma basis for the thirty-nine weeks ended September 28, 2008. Gross margin percentages reflect a 12.8 percentage point increase in gross margin in our Chicken segment, which was partially offset by a 0.9 percentage point decline in margin in our Beef segment margin and a 2.0 percentage point decline in our Pork segment margin. Margin declines in our Beef segment were attributable to weaker overall economic conditions and competition from alternative proteins, including pork, which was lower than seasonally normal prices during the current third quarter. Margin decreases in our Pork segment were attributable to slightly higher non-livestock related operating costs in the first quarter due to the reduction in slaughter volumes, together with margin declines in the third quarter due to overall weaker market conditions. The increase in our Chicken segment gross margins reflects the impact that the production cutbacks, reorganization efforts and decreased cost of feed ingredients had on PPC’s profit margin.
Selling, general and administrativeexpenses. Selling, general and administrative expenses were $368.3 million for the pro forma thirty-nine weeks ended September 27, 2009 as compared to $446.4 million for the pro forma thirty-nine weeks ended September 28, 2008. These expenses decreased by $78.1 million, or 17.5%, driven by reductions in our Chicken segment, including lower administrative restructuring charges (composed entirely of cash-based severance), employee retention, lease commitment and other facility closing charges recognized in 2008 related to the closure of two processing complexes, one prepared foods plant and seven distribution centers, as well as reduced or consolidated production at various facilities throughout the United States; reductions in employee compensation and related benefit costs resulting from restructuring actions taken in 2008 and 2009; and reductions in litigation reserves due to pending settlements. These reductions in selling, general and administrative expenses in our Chicken segment were partially offset by increases in selling, general and administrative expenses in our Beef and Pork segments attributable to a breakage fee and related legal costs totaling $20.9 million following our decision not to pursue the acquisition of National Beef, $0.8 million in transaction costs relating to the Proposed PPC Acquisition, and a $13.0 million one-time write-off during the second fiscal quarter of 2009 of an intangible asset originally created at July 11, 2007 due to the termination of a contractual relationship. The contract was terminated in order to bring the sales of our rendered products in house in order to generate higher margins from their sales. The non-recurring costs relating to the termination of the National Beef acquisition were recorded in selling, general and administrative expenses in the “Corporate and other” segment. This increase in our Beef and Pork segments was partially offset by the effect of the depreciation of 18.4% in the value of the Australian dollar as compared to the U.S. dollar between the comparative periods.
Foreign currency transaction, net. Foreign currency transaction, net was a gain of $60.9 million in the pro forma thirty-nine weeks ended September 27, 2009 as compared to a loss of $17.6 million in the pro forma thirty-nine weeks ended September 28, 2008. This $78.5 million change is due to the effects of the variation in the value of the Australian dollar as compared to the U.S. dollar on our U.S. dollar-denominated intercompany note between our Australian subsidiary, as debtor, and us, as lender. The value of the Australian dollar as compared to the U.S. dollar appreciated 27.2% from the December 28, 2008 period-end rate to the September 27, 2009
120
Table of Contents
period-end rate compared to the 5.1% depreciation from the December 30, 2007 period-end rate to the September 28, 2008 period-end rate.
Reorganization items, net. PPC incurred reorganization costs of $74.0 million in the pro forma thirty-nine weeks ended September 26, 2009. These costs included (1) severance and other costs related to post-petition facility closures and reduction in force actions, (2) professional fees charged for reorganization services, (3) asset impairment costs related to a closed processing complex, and (4) a loss recognized on the sale of PPC’s interest in a hog farming joint venture. These costs were partially offset by a gain recognized on the sale of one of PPC’s closed processing complexes and a gain recognized on the sale of undeveloped land.
Interest expense, net. Interest expense for the pro forma thirty-nine weeks ended September 27, 2009 was $171.7 million as compared to $153.2 million for the pro forma thirty-nine weeks ended September 28, 2008. The interest expense increase of $18.5 million related to the April 2009 issuance of our senior unsecured notes, increased revolver borrowings in the Chicken segment used to fund operational losses, a decrease in amounts of interest capitalized during the period and increased interest rates recognized on several of PPC’s credit facilities.
Income tax expense, net. Income tax expense for the pro forma thirty-nine weeks ended September 27, 2009 was $85.6 million as compared to a tax benefit of $130.5 million for the pro forma thirty-nine weeks ended September 28, 2008. The income tax expense increase of $216.1 million primarily related to an increase in pre-tax income.
Net income. As a result of the factors described above, we recorded net income for the pro forma thirty-nine weeks ended September 27, 2009 of $166.7 million as compared to a net loss of $725.5 million for the pro forma thirty-nine weeks ended September 28, 2008.
121
Table of Contents
Unaudited pro forma combined statement of operations for the fiscal year ended December 28, 2008
| JBS USA Holdings, Inc. | JBS Packerland | JBS Packerland | JBS Packerland | Five Rivers | Five Rivers | Pilgrim’s Pride | Adjustment for transactions | JBS USA Holdings, Inc. | ||||||||||||||||||||||||||||||
| Fiscal year ended December 28, 2008 | December 31, 2007 through October 22, 2008 (a)(i) | Adjustment for 50% equity interest in Five Rivers (b) | Adjustment for assets not acquired (c)(i) | December 31, 2007 through October 22, 2008 (a)(ii) | Adjustment for assets not acquired (c)(ii) | 52 weeks ended December 27, 2008 (d) | Fiscal year ended December 28, 2008 | |||||||||||||||||||||||||||||||
| Historical | Historical | Historical | Notes | Pro forma | ||||||||||||||||||||||||||||||||||
| in thousands, except earnings (loss) per share | (+) | (-) | (-) | (+) | (-) | (+) | (+) | |||||||||||||||||||||||||||||||
Net sales | $ | 12,362,281 | $ | 2,548,224 | — | $ | 4,923 | $ | 1,461,140 | $ | 912,920 | $ | 8,348,395 | $ | (55,544 | ) | (e) | $ | 23,746,653 | |||||||||||||||||||
Cost of goods sold | 11,917,777 | 2,397,551 | — | 4,949 | 1,511,462 | 988,814 | 8,672,385 | (72,197 | ) | (e),(f),(g) | 23,433,215 | |||||||||||||||||||||||||||
Restructuring items | — | — | — | — | — | — | 27,990 | — | 27,990 | |||||||||||||||||||||||||||||
Gross profit (loss) | 444,504 | 150,673 | — | (26 | ) | (50,322 | ) | (75,894 | ) | (351,980 | ) | 16,653 | 285,448 | |||||||||||||||||||||||||
Selling, general and administrative expenses | 148,785 | 78,793 | — | 7,307 | 11,093 | 9 | 364,603 | 3,731 | (f),(g),(h) | 599,689 | ||||||||||||||||||||||||||||
Restructuring items, net | — | — | — | — | — | — | 18,578 | — | 18,578 | |||||||||||||||||||||||||||||
Foreign currency transaction losses | 75,995 | — | — | — | — | — | — | — | 75,995 | |||||||||||||||||||||||||||||
Goodwill impairment | — | — | — | — | — | — | 501,446 | — | 501,446 | |||||||||||||||||||||||||||||
Other (income) expense | (10,107 | ) | 44,465 | 39,139 | 5,555 | (208 | ) | (74 | ) | (818 | ) | — | (11,288 | ) | ||||||||||||||||||||||||
Loss on sales of property, plant and equipment | 1,082 | 107 | — | — | 131 | 224 | — | — | 1,096 | |||||||||||||||||||||||||||||
Interest expense, net | 36,358 | 30,837 | — | 31,005 | 16,940 | 16,940 | 141,233 | 29,337 | (i) | 206,760 | ||||||||||||||||||||||||||||
Total expenses, net | 252,113 | 154,202 | 39,139 | 43,867 | 27,956 | 17,099 | 1,025,042 | 33,068 | 1,392,276 | |||||||||||||||||||||||||||||
Income (loss) from continuing operations before reorganization items and income taxes | 192,391 | (3,529 | ) | (39,139 | ) | (43,893 | ) | (78,278 | ) | (92,993 | ) | (1,377,022 | ) | (16,415 | ) | (1,106,828 | ) | |||||||||||||||||||||
Reorganization items | — | — | — | — | — | — | 13,250 | — | 13,250 | |||||||||||||||||||||||||||||
Income (loss) from continuing operations before income taxes | 192,391 | (3,529 | ) | (39,139 | ) | (43,893 | ) | (78,278 | ) | (92,993 | ) | (1,390,272 | ) | (16,415 | ) | (1,120,078 | ) | |||||||||||||||||||||
Income tax expense (benefit) | 31,287 | 2,222 | — | 2,222 | — | — | (201,910 | ) | (81,950 | ) | (j) | (252,573 | ) | |||||||||||||||||||||||||
Net income (loss) | 161,104 | (5,751 | ) | (39,139 | ) | (46,115 | ) | (78,278 | ) | (92,993 | ) | (1,188,362 | ) | 65,535 | (867,505 | ) | ||||||||||||||||||||||
Less net loss attributable to non-controlling interest in PPC | — | — | — | — | — | — | — | (379,255 | ) | (k) | (379,255 | ) | ||||||||||||||||||||||||||
Net income (loss) attributable to controlling shareholder | $ | 161,104 | $ | (5,751 | ) | $ | (39,139 | ) | $ | (46,115 | ) | $ | (78,278 | ) | $ | (92,993 | ) | $ | (1,188,362 | ) | $ | 444,790 | $ | (488,250 | ) | |||||||||||||
Basic and diluted net income (loss) per share of common stock | $ | 1,611,040 | $ | (4,308,086 | ) | |||||||||||||||||||||||||||||||||
Shares outstanding | 100 | 13 1/3 | (l) | 113 1/3 | ||||||||||||||||||||||||||||||||||
122
Table of Contents
| (a) | Represents the historical results of |
| (i) | JBS Packerland, and |
| (ii) | Five Rivers |
| for | the period from December 31, 2007 through October 22, 2008. |
| (b) | Represents the elimination of the 50% equity interest in Five Rivers from the historical results of JBS Packerland for the period from December 31, 2007 through October 22, 2008. On a pro forma basis, the results of Five Rivers are reflected on a fully consolidated basis as part of the JBS Packerland Acquisition. |
| (c) | Reflects the elimination of assets not acquired for |
| (i) | JBS Packerland and |
| (ii) | Five Rivers. |
| The adjustment for assets not acquired includes, among others (1) revenue and expenses associated with cattle owned by Smithfield Beef Group, Inc. that were retained by the seller, Smithfield Foods, Inc., (2) revenue and expenses associated with cattle owned by Five Rivers that were retained by Smithfield Foods, Inc., (3) elimination of $5.8 million of transaction expenses incurred by Smithfield Foods, Inc. in connection with the sale of the Smithfield Beef Group, Inc. to us recorded in selling, general and administrative expenses, (4) elimination of $31.0 million and $16.9 million in historical interest expense related to funding working capital requirements of assets not acquired, and (5) other assets and insignificant businesses not acquired and liabilities not assumed. |
| (d) | Represents the historical results of Pilgrim’s Pride for the fifty-two weeks ended December 27, 2008, derived as a combination of (i) the fifty-two weeks ended September 27, 2008,minus (ii) the three months ended December 29, 2007plus (iii) the three months ended December 27, 2008, as follows: |
| Pilgrim’s Pride | ||||||||||||||||
| 52 weeks ended September 27, 2008 | Three months ended December 29, 2007 | Three months ended December 27, 2008 | 52 weeks ended December 27, 2008 | |||||||||||||
| in thousands | (-) | (+) | ||||||||||||||
Net sales | $ | 8,518,757 | $ | 2,047,353 | $ | 1,876,991 | $ | 8,348,395 | ||||||||
Cost of goods sold | 8,654,262 | 1,942,250 | 1,960,373 | 8,672,385 | ||||||||||||
Restructuring items | 27,990 | — | — | 27,990 | ||||||||||||
Gross profit (loss) | (163,495 | ) | 105,103 | (83,382 | ) | (351,980 | ) | |||||||||
Selling, general and administrative expenses | 376,599 | 104,433 | 92,437 | 364,603 | ||||||||||||
Restructuring items, net | 16,156 | — | 2,422 | 18,578 | ||||||||||||
Goodwill impairment | 501,446 | — | — | 501,446 | ||||||||||||
Other income, net | (2,230 | ) | (2,863 | ) | (1,451 | ) | (818 | ) | ||||||||
Interest expense, net | 131,627 | 29,432 | 39,038 | 141,233 | ||||||||||||
Total expenses | 1,023,598 | 131,002 | 132,446 | 1,025,042 | ||||||||||||
Loss from continuing operations before reorganization items and income taxes | (1,187,093 | ) | (25,899 | ) | (215,828 | ) | (1,377,022 | ) | ||||||||
Reorganization items | — | — | 13,250 | 13,250 | ||||||||||||
Loss from continuing operations before income taxes | (1,187,093 | ) | (25,899 | ) | (229,078 | ) | (1,390,272 | ) | ||||||||
Income tax expense (benefit) | (194,921 | ) | 7,267 | 278 | (201,910 | ) | ||||||||||
Net loss | $ | (992,172 | ) | $ | (33,166 | ) | $ | (229,356 | ) | $ | (1,188,362 | ) | ||||
| (e) | Reflects the elimination of (i) $8.0 million of intercompany sales and $8.0 million of intercompany purchases (recorded as cost of goods sold) between JBS Packerland and the legacy Swift Beef segment for the period from December 31, 2007 through October 22, 2008, and (ii) $47.5 million of intercompany sales and $47.5 million of intercompany purchases (recorded as cost of goods sold) among us, and Pilgrim’s Pride for the period from December 31, 2007 through December 28, 2008. |
| (f) | On March 4, 2008, JBS S.A. and Smithfield Foods entered into the Smithfield Agreement. Pursuant to the Smithfield Agreement, JBS S.A. executed through us the acquisition of Smithfield Beef for $569.4 million in cash (including $32.3 million of transaction related costs). We then contributed the funds to JBS USA, LLC , which finalized the Smithfield Acquisition. The purchase included 100% of Five Rivers, which was held by Smithfield Beef in a 50/50 joint venture with Continental Grain Company. On October 23, 2008, the acquisition of Smithfield Beef was completed. In conjunction with the closing of this purchase, Smithfield Beef was renamed JBS Packerland and Five Rivers was renamed JBS Five Rivers Cattle Feeding LLC . The assets acquired include four processing plants and eleven feedlots. The Smithfield Acquisition provides additional capacity to continue to meet customer demand. |
| The purchase excluded substantially all live cattle inventories held by Smithfield Beef and Five Rivers as of the closing date, together with its associated debt. The excluded live cattle were raised by JBS Five Rivers after closing for a negotiated fee. |
123
Table of Contents
| The purchase price allocation is preliminary pending completion of independent valuations of identified tangible and intangible assets acquired and certain liabilities acquired, including, but not limited to deferred income taxes. In addition, we are in the process of finalizing costs associated with the relocation of certain employees from the former Green Bay, Wisconsin headquarters of Smithfield Beef Group, Inc. to the Greeley, Colorado headquarters of JBS USA Holdings, Inc. We expect to finalize these costs during the fourth quarter of our fiscal year 2009. The allocation presented below reflects the estimated fair value of the individual assets and liabilities as of October 23, 2008 (in thousands): |
| Purchase price allocation: | ||||
Purchase price paid to previous shareholders | $ | 537,068 | ||
Fees and direct expenses | 32,322 | |||
Total purchase price | $ | 569,390 | ||
Preliminary purchase price allocation: | ||||
Current assets and liabilities, net | $ | 47,097 | ||
Property, plant and equipment(i) | 314,306 | |||
Deferred tax income liability | (102,781 | ) | ||
Goodwill | 174,553 | |||
Intangible assets(ii) | 131,044 | |||
Other non-current assets and liabilities, net | 5,171 | |||
Total purchase price allocation | $ | 569,390 | ||
| (i) | Property, plant and equipment was recorded at preliminary estimated fair values as of the date of the JBS Packerland Acquisition as follows (in thousands): |
| Land | $51,383 | ||
| Land improvements | 43,574 | ||
Building, machinery, and equipment | 210,850 | ||
Furniture, fixtures, office equipment, and other | 2,106 | ||
Construction in progress | 6,393 | ||
Total plant, property and equipment | $ | 314,306 | |
| Depreciation and amortization is recorded using the straight-line method over the estimated useful lives of the assets as follows: |
| Furniture, fixtures, office equipment and other | 5 to 7 years | |
Machinery and equipment | 5 to 15 years | |
Buildings and improvements | 15 to 40 years | |
Leasehold improvements | shorter of useful life or the lease term | |
| (ii) | Intangible assets include customer relationships resulting from the JBS Packerland Acquisition are being amortized on an accelerated basis over 18 years. This represents management’s estimate of the period of expected economic benefit and annual customer profitability. |
| Customer relationships | $99,500 | ||
Non-amortizing trademarks | 19,400 | ||
Non-amortizing water rights | 12,144 | ||
Total intangible assets | $ | 131,044 | |
| The $2.6 million increase in pro forma depreciation and amortization expense reflected in cost of goods sold is comprised of (1) estimated depreciation and amortization expense for the period January 1 through October 22, 2008 of $23.8 million based on estimated fair values and useful lives of identified tangible and intangible assets, and (2) elimination of historical depreciation and amortization expense of $21.1 million for the period January 1 through October 22, 2008. |
124
Table of Contents
| The $4.4 million increase in pro forma depreciation and amortization expense reflected in selling, general, and administrative expenses is comprised of (1) the estimated depreciation and amortization expense for the period January 1 through October 22, 2008 of $5.6 million based on estimated fair values and useful lives of identified tangible and intangible assets, and (2) elimination of historical depreciation and amortization expense of $1.2 million for the period January 1 through October 22, 2008: |
| Estimated depreciation and amortization expense | |||||||||||||||||
| (in thousands, except useful lives) | Historical net book value | Estimated fair value | Estimated useful lives (yrs) | Cost of goods sold | Selling, general and administrative | Total | |||||||||||
Land | $ | 34,058 | $ | 51,383 | n/a | $ | n/a | $ | n/a | $ | n/a | ||||||
Land improvements | 42,765 | 43,574 | 8 | 4,363 | 182 | 4,545 | |||||||||||
Buildings, machinery, and equipment | 130,249 | 210,850 | 9 | 18,891 | 787 | 19,678 | |||||||||||
Furniture, fixtures, office equipments, and other | 5,851 | 2,106 | 3 | 498 | 21 | 519 | |||||||||||
Construction in progress | 6,393 | 6,393 | n/a | n/a | n/a | n/a | |||||||||||
Customer relationships | n/a | 99,500 | 18 | n/a | 4,571 | 4,571 | |||||||||||
Trademarks | 6,488 | 19,400 | n/a | n/a | n/a | n/a | |||||||||||
Water rights | 12,144 | 12,144 | n/a | n/a | n/a | n/a | |||||||||||
Total | $ | 237,948 | $ | 445,350 | $ | 23,752 | $ | 5,561 | $ | 29,313 | |||||||
Less historical depreciation and amortization expense | 21,143 | 1,170 | 22,313 | ||||||||||||||
Adjustment for the transaction | $ | 2,609 | $ | 4,391 | $ | 7,000 | |||||||||||
| (g) | On September 16, 2009, we entered into a stock purchase agreement with Pilgrim’s Pride Corporation. Upon consummation of the transactions contemplated by the stock purchase agreement and in accordance with PPC’s amended joint plan of reorganization, we will purchase 64% of the total issued and outstanding new common stock of Pilgrim’s Pride, as reorganized in accordance with the amended joint plan of reorganization, in exchange for aggregate consideration of $800.0 million in cash. The reorganized PPC is also expected to enter into a credit facility as it exits from bankruptcy consisting of a three-year revolving credit facility in the amount of at least $600.0 million, a three-year term loan A facility in the amount of up to $375.0 million and a five-year term loan B facility in the amount of up to $775.0 million. We refer to this financing arrangement as the Exit Facility. |
| The purchase price allocation is preliminary pending completion of the acquisition and the independent valuations by a third-party firm. The allocation presented below reflects management’s preliminary estimated fair values of the individual assets and liabilities as of December 23, 2009 (in thousands): |
| Purchase price allocation: | ||||
Purchase price paid to previous shareholders | $ | 800,000 | ||
Non-controlling interest(i) | 593,989 | |||
Total purchase price | $ | 1,393,989 | ||
Preliminary purchase price allocation: | ||||
Current assets and liabilities, net | $ | 582,699 | ||
Property, plant and equipment(ii) | 2,388,579 | |||
Intangible assets(iii) | 81,000 | |||
Goodwill | 58,107 | |||
Non-current assets and liabilities, net | (1,716,396 | ) | ||
Total purchase price allocation | $ | 1,393,989 | ||
| (i) | The non-controlling interest of $594.0 million is calculated based on a market share price of $7.70 as of December 22, 2009 multiplied by the number of shares outstanding of 77,141,389 at September 27, 2009. |
| (ii) | Property, plant and equipment was recorded at preliminary estimated fair values as of December 23, 2009 as follows (in thousands): |
Land | $ | 96,159 | |
Building, machinery, and equipment | 2,166,948 | ||
Autos and trucks | 50,529 | ||
Construction in progress | 74,943 | ||
Total plant, property and equipment | $ | 2,388,579 | |
| Depreciation and amortization is recorded using the straight-line method over the estimated useful lives of the assets as follows: |
Building, machinery, and equipment | 11 years | |
Autos and trucks | 5 years | |
125
Table of Contents
| (iii) | Identified intangible assets were recorded at preliminary estimated fair values as of December 23, 2009 as follows (in thousands): |
Customer relationships | $ | 45,611 | |
Trade names | 35,121 | ||
Non-compete agreement | 268 | ||
Total intangible assets | $ | 81,000 | |
| The customer relationship intangible asset is being amortized on a straight-line basis over 13 years. This represents management’s preliminary estimate of the period of economic benefit and annual customer profitability. The trade name intangible assets and non-compete intangible assets are being amortized on a straight-line basis over six years and three years, respectively. |
| The $19.3 million decrease in pro forma depreciation and amortization expense for the period December 31, 2007 through December 28, 2008 reflected in cost of goods sold is comprised of (1) estimated depreciation and amortization expense of $190.5 million based on the estimated fair values and useful lives of identified tangible and intangible assets, and (2) elimination of historical depreciation and amortization expense of $209.8 million. |
| The $2.9 million decrease in pro forma depreciation and amortization expense for the period December 31, 2007 through December 28, 2008 reflected in selling, general and administrative expenses is comprised of (1) estimated depreciation and amortization expense of $26.0 million based on the estimated fair values and useful lives of identified tangible and intangible assets and (2) elimination of historical depreciation and amortization expense of $28.9 million: |
| Estimated depreciation and amortization expense | ||||||||||||||||||||
| (in thousands, except useful lives) | Historical net book value | Estimated fair value | Estimate useful lives (yrs) | Cost of | Selling, general and administrative | Total | ||||||||||||||
Land | $ | 96,159 | n/a | $ | n/a | $ | n/a | $ | n/a | |||||||||||
Buildings, machinery, and equipment | 2,166,948 | 11 | 181,236 | 15,760 | 196,996 | |||||||||||||||
Autos and trucks | 50,529 | 5 | 9,297 | 808 | 10,105 | |||||||||||||||
Construction in progress | 74,943 | n/a | n/a | n/a | n/a | |||||||||||||||
Customer Relationships | 45,611 | 13 | n/a | 3,509 | 3,509 | |||||||||||||||
Trade names | 35,121 | 6 | n/a | 5,854 | 5,854 | |||||||||||||||
Non-compete agreement | 268 | 3 | n/a | 89 | 89 | |||||||||||||||
Total | $ | 1,556,655 | $ | 2,469,579 | $ | 190,533 | $ | 26,020 | $ | 216,553 | ||||||||||
Less historical depreciation and amortization expense | 209,795 | 28,907 | 238,702 | |||||||||||||||||
Adjustment for the transaction | $ | (19,262 | ) | $ | (2,887 | ) | $ | (22,149 | ) | |||||||||||
| (h) | Reflects $2.2 million incremental costs associated with being a public company on the New York Stock Exchange. This includes incremental audit fees, directors’ and officers’ insurance coverage, internal audit and Sarbanes-Oxley expenses and printing costs, based on preliminary discussions with anticipated service providers. |
| (i) | Reflects the following adjustments to interest expense, net (in thousands): |
Interest expense, 11.625% senior unsecured notes due 2014(i) | $ | 65,316 | ||
Debt issuance amortization, 11.625% senior unsecured notes due 2014(ii) | 638 | |||
Debt discount accretion, 11.625% senior unsecured notes due 2014(iii) | 7,814 | |||
Interest expense, intercompany debt(iv) | (27,047 | ) | ||
Interest expense, PPC debt(v) | (29,643 | ) | ||
Debt issuance amortization, PPC Exit Facility(vi) | 12,259 | |||
Total Interest expense, net | $ | 29,337 | ||
On April 27, 2009, our wholly owned subsidiaries, JBS USA, LLC and JBS USA Finance, Inc., issued 11.625% senior unsecured notes due 2014 in an aggregate principal amount of $700.0 million. Net proceeds, after deducting the debt discount costs of $48.7 million and debt issuance costs of $0.5 million, were $650.8 million. The net proceeds, in addition to $3.4 million of cash on hand, were applied to repay $550.8 million of the outstanding principal and accrued interest on intercompany loans to us from a subsidiary of JBS S.A. (reflecting $519.6 million outstanding principal payments and $31.2 million accrued interest), $100.0 million of borrowings under our secured revolving credit facility, and $3.4 million of additional debt issuance costs. In order to calculate the pro forma interest adjustments shown in (i), (ii), (iii), we pro-rated the gross debt issuance costs and debt discount amounts based on the net proceeds used to repay the outstanding principal on intercompany loans of $519.6 million as a percentage of (1) total offering proceeds of $650.8 million less (2) debt issuance costs paid with $3.4 million cash |
126
Table of Contents
on hand, or net proceeds of $647.4 million. These pro-rated amounts represent the costs we would have incurred to generate the net proceeds used to repay the outstanding principal on intercompany loans of $519.6 million. |
| (i) | Includes pro forma interest expense on $561.9 million outstanding principal ($519.6 million proceeds plus $39.1 million pro-rated bond discount and $3.2 million pro-rated debt issuance costs) of our 11.625% senior unsecured notes due 2014 |
| for the period from December 31, 2007 through December 28, 2008, calculated on a straight-line basis over five years. The $3.2 million pro-rated debt issuance cost is calculated as the ratio of the $519.6 million of outstanding principal on our consolidated intercompany loans which were repaid divided by net proceeds of $647.4 million multiplied by the total debt issuance costs of $4.0 million. The $39.1 million pro-rated bond discount is calculated as the ratio of $519.6 million of outstanding principal on our consolidated intercompany loans which were repaid divided by net proceeds of $647.4 million multiplied by bond discount of $48.7 million. The total principal amount of our 11.625% senior secured notes due 2014 is $700.0 million, and our pro forma interest expense accordingly does not purport to be indicative of what our interest expense will be in the future. |
| (ii) | Includes pro forma interest expense for the amortization of pro-rated debt issuance costs of $3.2 million on $561.9 million of our 11.625% senior unsecured notes due 2014 for the period from December 31, 2007 through December 28, 2008, calculated on a straight-line basis over five years. |
| (iii) | Includes pro forma interest expense for the accretion of the pro-rated bond discount of $39.1 million on $561.9 million of our 11.625% senior unsecured notes due 2014 for the period from December 31, 2007 through December 28, 2008, calculated on a straight-line basis over five years. |
| (iv) | Includes the reduction of pro forma interest expense for the period from December 31, 2007 through December 28, 2008 on our consolidated intercompany loans from JBS S.A. due to a $519.6 million reduction in the aggregate principal amount of those loans using a portion of the net proceeds of our 11.625% senior unsecured notes due 2014. The $27.0 million reduction of interest expense is comprised of the (1) pro forma interest expense of $4.1 million based on average borrowings of $194.8 million for a 124 day period for which the borrowings were in excess of $519.6 million at an average interest rate of 6.10%, and (2) elimination of actual interest costs of $31.1 million incurred on outstanding borrowings for the period from December 31, 2007 through December 28, 2008. |
| (v) | The $29.7 million decrease in pro forma interest expense is comprised of (1) $109.9 million of interest expense on $1,570.3 million outstanding borrowings for the period December 31, 2007 through December 28, 2008 at an estimated average interest rate of 7.0% related to PPC’s anticipated Exit Facility, and (2) elimination of historical interest expense of $139.6 million incurred on borrowings for the period December 31, 2007 through December 28, 2008. The historical interest income recognized by PPC and the historical interest expense associated with PPC’s Mexican revolving credit facility were not adjusted as it was not part of the bankruptcy filing. |
| (vi) | Includes pro forma interest expense of $12.3 million for the amortization of debt issuance costs related to the PPC Exit Facility for the period December 31, 2007 through December 28, 2008, calculated on a straight-line basis over a weighted average life of 3.9 years. |
| (j) | The $252.6 million pro forma income tax benefit is comprised of the (1) historical income tax expense of JBS USA Holdings, Inc. and (2) income tax benefit from pro forma income (loss) from continuing operations on all pro forma adjustments as follows (in thousands): |
JBS USA Holdings, Inc., historical income tax expense | $ | 31,287 | ||||||||
Income (loss) from continuing operations: | ||||||||||
Packerland, historical | (+ | ) | (3,529 | ) | ||||||
Packerland, adjustment for 50% equity interest in Five Rivers | (- | ) | (39,139 | ) | ||||||
Packerland, adjustments for assets not acquired | (- | ) | (43,893 | ) | ||||||
Five Rivers, historical | (+ | ) | (78,278 | ) | ||||||
Five Rivers, adjustments for assets not acquired | (- | ) | (92,993 | ) | ||||||
Pilgrim’s Pride, historical | (+ | ) | (1,390,272 | ) | ||||||
Pilgrim’s Pride, goodwill impairment (non deductible) | (+ | ) | 501,446 | |||||||
Adjustment for pro forma transactions | (+ | ) | (16,415 | ) | ||||||
Total loss from continuing operations | (811,023 | ) | ||||||||
Pro forma income tax benefit at 35% | (283,860 | ) | ||||||||
Total pro forma income tax benefit | $ | (252,573 | ) |
| The Company has not yet reached a decision as to whether the undistributed earnings of PPC’s subsidiary in Mexico will continue to be permanently reinvested and therefore the actual accounting for income taxes could differ. |
| (k) | Reflects the elimination of the 36% non-controlling shareholder net income (loss) of Pilgrim’s Pride for purposes of calculating the earnings per share of the controlling shareholder. The $(379.3) million adjustment is calculated as follows (in thousands): |
Pilgrim’s Pride historical net loss | $ | (1,188,362 | ) | |
Pilgrim’s Pride adjustment for pro forma transactions: | ||||
Depreciation and amortization benefit | 22,149 | |||
Interest expense benefit(i) | 17,384 | |||
Income tax benefit(ii) | 95,343 | |||
Total Pilgrim’s Pride adjustment for pro forma transactions | 134,876 | |||
Pilgrim’s Pride adjusted pro forma net loss | (1,053,486 | ) | ||
Non-controlling shareholder pro forma interest (36%) | $ | (379,255 | ) |
127
Table of Contents
| (i) | Includes interest expense for PPC and amortization of debt issuance cost on PPC’s Exit Facility, as reflected in (i)(v)(vi). |
| (ii) | The $95.3 million pro forma income tax benefit for PPC is comprised of the following (1) $7.8 million tax effect of the pro forma depreciation and amortization adjustment ($22,149 multiplied by 35%), plus (2) $6.1 million tax effect of the pro forma interest expense ($17,384 multiplied by 35%), less (3) $311.1 million tax effect of historical PPC loss from continuing operations before the non-taxable goodwill impairment and income taxes ($888,806 multiplied by 35%), plus (4) $201.9 million historical PPC income tax benefit. |
| (l) | Includes 40% of the 33 1/3 shares of our common stock sold related to the BNDESPAR transaction. We reflect only 40% of these shares because 40% of the proceeds of the sale of the shares (40% of $2.0 billion, which is $800.0 million) are expected to be used to pay the cash consideration for the Proposed PPC Acquisition and are therefore directly attributable to the Proposed PPC Acquisition. See note (g) above. We intend to initially fund a portion of the cash consideration for the Proposed PPC Acquisition from cash received from subsidiaries and cash on hand pending the funding of the remaining portion of our $2.0 billion stock purchase agreement with JBS S.A., which we expect to occur following the issuance by JBS S.A. of the debentures in connection with the BNDESPAR transaction. This interim funding would not require us to modify the contract described in “Principal and selling stockholder—JBS S.A. purchase and sale agreement” or the proceeds ultimately received from JBS S.A. under that contract. |
128
Table of Contents
Unaudited pro forma combined statement of operations for the fiscal year ended December 30, 2007
| JBS USA Holdings, Inc. | JBS USA Holdings, Inc. | JBS Packerland | JBS Packerland | JBS Packerland | Five Rivers | Five Rivers | Pilgrim’s Pride | Adjustment for Transactions | JBS USA Holdings, Inc. | |||||||||||||||||||||||||||||||||
| Dec. 25, 2006 to July 10, 2007 (a) | July 11, 2007 to Dec. 30, 2007 (a) | Dec. 25, 2006 through Dec. 30, 2007 (b)(i) | Adjustment for 50% equity interest in Five Rivers (c) | Adjustment for assets not acquired (d)(i) | Dec. 25, 2006 through Dec. 30, 2007 (b)(ii) | Adjustment for assets not acquired (d)(ii) | Fifty two weeks ended December 29, 2007 (e) | Dec. 25, 2006 to Dec. 30, 2007 | ||||||||||||||||||||||||||||||||||
| Historical | Historical | Historical | Historical | Notes | Pro forma | |||||||||||||||||||||||||||||||||||||
| in thousands, except earnings per share | (+) | (+) | (-) | (-) | (+) | (-) | (+) | (+) | ||||||||||||||||||||||||||||||||||
Net sales | $ | 4,970,624 | $ | 4,988,984 | $ | 2,823,496 | $ | — | $ | 8,083 | $ | 1,995,238 | $ | 1,410,422 | $ | 8,208,833 | $ | (62,337 | ) | (f) | $ | 21,506,333 | ||||||||||||||||||||
Cost of goods sold | 4,920,594 | 5,013,084 | 2,750,464 | — | 41,475 | 1,941,093 | 1,393,107 | 7,576,526 | (51,451 | ) | (f),(g),(h),(i) | 20,715,728 | ||||||||||||||||||||||||||||||
Gross profit (loss) | 50,030 | (24,100 | ) | 73,032 | — | (33,392 | ) | 54,145 | 17,315 | 632,307 | (10,886 | ) | 790,605 | |||||||||||||||||||||||||||||
Selling, general and administrative expenses | 92,333 | 60,727 | 74,829 | — | 1,938 | 12,953 | — | 391,540 | 12,385 | (g),(h),(i),(j) | 642,829 | |||||||||||||||||||||||||||||||
Foreign currency transaction gains | (527 | ) | (5,201 | ) | — | — | — | — | — | — | — | (5,728 | ) | |||||||||||||||||||||||||||||
Other (income) expense | (3,821 | ) | (3,581 | ) | (3,005 | ) | (7,406 | ) | 4,511 | (1,996 | ) | (54 | ) | (8,501 | ) | — | (17,955 | ) | ||||||||||||||||||||||||
(Gain) loss on sales of property, plant and equipment | (2,946 | ) | 182 | 133 | — | — | 324 | — | — | — | (2,307 | ) | ||||||||||||||||||||||||||||||
Interest expense, net | 66,383 | 34,340 | 41,056 | — | 41,056 | 28,052 | 28,136 | 161,832 | (25,128 | ) | (k) | 237,343 | ||||||||||||||||||||||||||||||
Total expenses | 151,422 | 86,467 | 113,013 | (7,406 | ) | 47,505 | 39,333 | 28,082 | 544,871 | (12,743 | ) | 854,182 | ||||||||||||||||||||||||||||||
Income (loss) from continuing operations before income taxes | (101,392 | ) | (110,567 | ) | (39,981 | ) | 7,406 | (80,897 | ) | 14,812 | (10,767 | ) | 87,436 | 1,857 | (63,577 | ) | ||||||||||||||||||||||||||
Income tax expense (benefit) | (18,380 | ) | 1,025 | 2,273 | — | 2,273 | — | — | 60,350 | (8,416 | ) | (l) | 34,579 | |||||||||||||||||||||||||||||
Net income (loss) | (83,012 | ) | (111,592 | ) | (42,254 | ) | 7,406 | (83,170 | ) | 14,812 | (10,767 | ) | 27,086 | 10,273 | (98,156 | ) | ||||||||||||||||||||||||||
Less net income attributable to non-controlling interest in PPC | — | — | — | — | — | — | — | — | 24,115 | (m) | 24,115 | |||||||||||||||||||||||||||||||
Net income (loss) attributable to controlling shareholder | $ | (83,012 | ) | $ | (111,592 | ) | $ | (42,254 | ) | $ | 7,406 | $ | (83,170 | ) | $ | 14,812 | $ | (10,767 | ) | $ | 27,086 | $ | (13,842 | ) | $ | (122,271 | ) | |||||||||||||||
Basic and diluted net income (loss) per share (n) | N/A | $ | (1,115,920 | ) | $ | (1,078,862 | ) | |||||||||||||||||||||||||||||||||||
Shares outstanding | N/A | 100 | 13 1/3 | (o) | | 113 1/3 | | |||||||||||||||||||||||||||||||||||
| (a) | Represents the historical results of JBS USA Holdings, Inc. for the period from December 25, 2006 through July 10, 2007 (predecessor) and the period from July 11, 2007 through December 30, 2007 (successor). |
| (b) | Represents the historical results of |
129
Table of Contents
| (i) | JBS Packerland, and |
| (ii) | Five Rivers |
for the period from December 25, 2006 through December 30, 2007.
| (c) | Represents the elimination of the 50% equity interest in Five Rivers from the historical results of JBS Packerland for the period from December 25, 2006 through December 30, 2007. On a pro forma basis, the results of Five Rivers are reflected on a fully consolidated basis as part of the JBS Packerland Acquisition. |
| (d) | Reflects the elimination of assets not acquired for |
| (i) | JBS Packerland, and |
| (ii) | Five Rivers. |
| The adjustment for assets not acquired includes, among others (1) revenue and expenses associated with cattle owned by Smithfield Beef Group, Inc. that were retained by the seller, Smithfield Foods, Inc., (2) revenue and expenses associated with cattle owned by Five Rivers that were retained by Smithfield Foods, Inc., (3) elimination of $41.1 million and $28.1 million in historical interest expense related to funding working capital requirements of assets not acquired, and (4) other assets and insignificant businesses not acquired and liabilities not assumed. |
| (e) | Represents the historical results of Pilgrim’s Pride for the fifty-two weeks ended December 29, 2007 derived as a combination of (i) the fifty-two weeks ended September 30, 2007,minus (ii) the three months ended December 30, 2006,plus (iii) the three months ended December 29, 2007 (in thousands) as follows: |
| Pilgrim’s Pride | ||||||||||||||||
| Fifty-two weeks ended September 30, 2007 | Three months ended December 30, 2006 | Three months ended December 29, 2007 | Fifty-two weeks ended December 29, 2007 | |||||||||||||
| In thousands | (-) | (+) | ||||||||||||||
Net sales | $ | 7,498,612 | $ | 1,337,132 | $ | 2,047,353 | $ | 8,208,833 | ||||||||
Cost of goods sold | 6,905,882 | 1,271,606 | 1,942,250 | 7,576,526 | ||||||||||||
Gross profit | 592,730 | 65,526 | 105,103 | 632,307 | ||||||||||||
Selling, general and administrative expenses | 355,539 | 68,432 | 104,433 | 391,540 | ||||||||||||
Other income, net | (6,649 | ) | (1,011 | ) | (2,863 | ) | (8,501 | ) | ||||||||
Interest expense, net | 145,005 | 12,605 | 29,432 | 161,832 | ||||||||||||
Total expenses | 493,895 | 80,026 | 131,002 | 544,871 | ||||||||||||
Income (loss) from continuing operations before income taxes | 98,835 | (14,500 | ) | (25,899 | ) | 87,436 | ||||||||||
Income tax expense (benefit) | 47,319 | (5,764 | ) | 7,267 | 60,350 | |||||||||||
Net income (loss) | $ | 51,516 | $ | (8,736 | ) | $ | (33,166 | ) | $ | 27,086 | ||||||
| (f) | Reflects the elimination of (i) $6.1 million of intercompany sales and $6.1 million of intercompany purchases (recorded as cost of goods sold) between JBS Packerland and us for the period from December 25, 2006 through December 30, 2007, and (ii) $56.2 million of intercompany sales and $56.2 million of intercompany purchases (recorded as cost of goods sold) among us, JBS Packerland, and Pilgrim’s Pride for the period from December 25, 2006 through December 30, 2007. |
| (g) | Represents incremental depreciation and amortization expense for the period December 25, 2006 through July 10, 2007 of $9.6 million and $5.3 million reflected in cost of goods sold and selling, general and administrative expenses, respectively based on the fair values and useful lives of identified tangible and intangible assets for the Swift Acquisition in July 2007. |
The allocation presented below reflects the fair values of the individual assets acquired and liabilities assumed as of July 11, 2007 (in thousands).
Purchase price allocation: | ||||
Purchase price paid to controlling shareholders’ | $ | 225,000 | ||
Debt paid including accrued interest of $22.8 million | 1,197,123 | |||
Fees and direct expenses | 48,545 | |||
Total purchase price | $ | 1,470,668 | ||
Purchase price allocation: | ||||
Current assets and liabilities, net | $ | 583,972 | ||
Plant, property and equipment (i) | 693,672 | |||
Intangible assets (ii) | 188,432 | |||
Deferred income tax asset | 56,537 | |||
Goodwill | 42,762 | |||
Non-current assets and liabilities, net | (94,707 | ) | ||
Total purchase price allocation | $ | 1,470,668 | ||
130
Table of Contents
| (i) | Plant, property and equipment was recorded at fair value as of July 11, 2007 as follows (in thousands): |
Land | $ | 53,470 | |
Building, machinery, and equipment | 552,966 | ||
Property and equipment under capital lease | 16,964 | ||
Furniture, fixtures, office equipment, and other | 36,355 | ||
Construction in progress | 33,917 | ||
Total plant, property and equipment | $ | 693,672 | |
| Depreciation and amortization is recorded using the straight-line method over the estimated useful lives of the assets as follows: |
Furniture, fixtures, office equipment and other | 5 to 7 years | |
Machinery and equipment | 5 to 15 years | |
Buildings and improvements | 15 to 40 years | |
Leasehold improvements | shorter of useful life or the lease term | |
| (ii) | Intangible assets were recorded at fair value as of July 11, 2007 as follows (in thousands): |
Customer relationships | $ | 129,000 | |
Customer contracts | 15,400 | ||
Patents | 2,900 | ||
Rental contract | 3,507 | ||
Deferred revenue | 1,483 | ||
Mineral rights | 742 | ||
Trademark | 33,300 | ||
Water rights | 2,100 | ||
Total intangible assets | $ | 188,432 | |
| Customer relationship intangibles and customer contract intangibles are amortized on an accelerated basis over 12 and 7 years respectively, representing management’s estimate of the period of expected economic benefit and annual customer profitability. |
| (h) | On March 4, 2008, JBS S.A. and Smithfield Foods entered into the Smithfield Agreement. Pursuant to the Smithfield Agreement, JBS S.A. executed through us the acquisition of Smithfield Beef for $569.4 million in cash (including $32.3 million of transaction related costs). We then contributed the funds to JBS USA, LLC, which finalized the Smithfield Acquisition. The purchase included 100% of Five Rivers, which was held by Smithfield Beef in a 50/50 joint venture with Continental Grain Company. On October 23, 2008, the acquisition of Smithfield Beef was completed. In conjunction with the closing of this purchase, Smithfield Beef was renamed JBS Packerland and Five Rivers was renamed JBS Five Rivers Cattle Feeding LLC. The assets acquired include four processing plants and eleven feedlots. The Smithfield Acquisition provides additional capacity to continue to meet customer demand. |
| The purchase excluded substantially all live cattle inventories held by Smithfield Beef and Five Rivers as of the closing date, together with its associated debt. The excluded live cattle were raised by JBS Five Rivers after closing for a negotiated fee. |
| The purchase price allocation is preliminary pending completion of independent valuations of identified tangible and intangible assets acquired and certain liabilities acquired, including, but not limited to deferred income taxes. In addition, we are in the process of finalizing costs associated with the relocation of certain employees from the former Green Bay, Wisconsin headquarters of Smithfield Beef Group, Inc. to the Greeley, Colorado headquarters of JBS USA Holdings, Inc. We expect to finalize these costs during the fourth quarter of our fiscal year 2009. The allocation presented below reflects the estimated fair value of the individual assets and liabilities as of October 23, 2008 (in thousands): |
Purchase price allocation: | ||||
Purchase price paid to previous shareholders | $ | 537,068 | ||
Fees and direct expenses | 32,322 | |||
Total purchase price | $ | 569,390 | ||
Preliminary purchase price allocation: | ||||
Current assets and liabilities, net | $ | 47,097 | ||
Property, plant and equipment(i) | 314,306 | |||
Deferred income tax liability | (102,781 | ) | ||
Goodwill | 174,553 | |||
Intangible assets(ii) | 131,044 | |||
Other non-current assets and liabilities, net | 5,171 | |||
Total purchase price allocation | $ | 569,390 | ||
131
Table of Contents
| (i) | Property, plant and equipment was recorded at preliminary estimated fair values as of the date of the JBS Packerland Acquisition as follows (in thousands): |
Land | $ | 51,383 | |
Land improvements | 43,574 | ||
Building, machinery, and equipment | 210,850 | ||
Furniture, fixtures, office equipment, and other | 2,106 | ||
Construction in progress | 6,393 | ||
Total plant, property and equipment | $ | 314,306 | |
| Depreciation and amortization is recorded using the straight-line method over the estimated useful lives of the assets as follows: |
Furniture, fixtures, office equipment and other | 5 to 7 years | |
Machinery and equipment | 5 to 15 years | |
Buildings and improvements | 15 to 40 years | |
Leasehold improvements | shorter of useful life or the lease term | |
| (ii) | Intangible assets include customer relationships resulting from the JBS Packerland Acquisition are being amortized on an accelerated basis over 18 years. This represents management’s estimate of the period of expected economic benefit and annual customer profitability. |
Customer relationships | $ | 99,500 | |
Non-amortizing trademarks | 19,400 | ||
Non-amortizing water rights | 12,144 | ||
Total intangible assets | $ | 131,044 | |
| The $3.7 million increase in pro forma depreciation and amortization expense for the period January 1, 2007 through December 30, 2007 reflected in cost of goods sold is comprised of (1) estimated depreciation and amortization expense of $28.7 million based on estimated fair values and useful lives of identified tangible and intangible assets, and (2) elimination of historical depreciation and amortization expense of $25.0 million. |
| The $5.1 million increase in pro forma depreciation and amortization expense for the period January 1, 2007 through December 30, 2007 reflected in selling, general, and administrative expenses is comprised of (1) estimated depreciation and amortization expense of $6.7 million based on estimated fair values and useful lives of identified tangible and intangible assets, and (2) elimination of historical depreciation and amortization expense of $1.6 million. |
| Estimated depreciation and amortization expense | |||||||||||||||||
| (in thousands, except useful lives) | Historical net book value | Estimated fair value | Estimated useful lives (yrs) | Cost of goods sold | Selling, general and administrative | Total | |||||||||||
Land | $ | 34,058 | $ | 51,383 | n/a | $ | n/a | $ | n/a | $ | n/a | ||||||
Land improvements | 42,765 | 43,574 | 8 | 5,277 | 220 | 5,497 | |||||||||||
Buildings, machinery, and equipment | 130,249 | 210,850 | 9 | 22,845 | 952 | 23,797 | |||||||||||
Furniture, fixtures, office equipment, and other | 5,851 | 2,106 | 3 | 602 | 25 | 627 | |||||||||||
Construction in progress | 6,393 | 6,393 | n/a | n/a | n/a | n/a | |||||||||||
Customer relationships | n/a | 99,500 | 18 | n/a | 5,528 | 5,528 | |||||||||||
Trademark | 6,488 | 19,400 | n/a | n/a | n/a | n/a | |||||||||||
Water rights | 12,144 | 12,144 | n/a | n/a | n/a | n/a | |||||||||||
Total | $ | 237,948 | $ | 445,350 | $ | 28,724 | $ | 6,725 | $ | 35,449 | |||||||
Less historical depreciation and amortization expense | 24,956 | 1,560 | 26,516 | ||||||||||||||
Adjustment for the transaction | $ | 3,768 | $ | 5,165 | $ | 8,933 | |||||||||||
| (i) | On September 16, 2009, we entered into a stock purchase agreement with Pilgrim’s Pride Corporation. Upon consummation of the transactions contemplated by the stock purchase agreement and in accordance with PPC’s amended joint plan of reorganization, we will purchase 64% of the total issued and outstanding new common stock of Pilgrim’s Pride, as reorganized in accordance with the amended joint plan of reorganization, in exchange for aggregate consideration of $800 million in cash. The reorganized PPC is also expected to enter into a credit facility as it exits from bankruptcy consisting of a three-year revolving credit facility in the amount of at least $600.0 million, a three-year term loan A facility in the amount of up to $375.0 million and a five-year term loan B facility in the amount of up to $775.0 million. We refer to this financing arrangement as the Exit Facility. |
132
Table of Contents
| The purchase price allocation is preliminary pending completion of the acquisition and the independent valuations by a third-party firm. The allocation presented below reflects management’s estimated fair values of the individual assets and liabilities as of December 23, 2009 (in thousands): |
Purchase price allocation: | ||||
Purchase price paid to previous shareholders | $ | 800,000 | ||
Non-controlling interest(i) | 593,989 | |||
Total purchase price | $ | 1,393,989 | ||
Preliminary purchase price allocation: | ||||
Current assets and liabilities, net | $ | 582,699 | ||
Property, plant and equipment(ii) | 2,388,579 | |||
Intangible assets(iii) | 81,000 | |||
Goodwill | 58,107 | |||
Non-current assets and liabilities, net | (1,716,396 | ) | ||
Total purchase price allocation | $ | 1,393,989 | ||
| (i) | The non-controlling interest of $594.0 million is calculated based on a market share price of $7.70 as of December 22, 2009 multiplied by the number of shares outstanding of 77,141,389 at September 27, 2009. |
| (ii) | Property, plant and equipment was recorded at preliminary estimated fair values as of December 23, 2009 as follows (in thousands): |
Land | $ | 96,159 | |
Building, machinery, and equipment | 2,166,948 | ||
Autos and trucks | 50,529 | ||
Construction in progress | 74,943 | ||
Total plant, property and equipment | $ | 2,388,579 | |
| Depreciation and amortization is recorded using the straight-line method over the estimated useful lives of the assets as follows: |
Building, machinery, and equipment | 11 years | |
Autos and trucks | 5 years | |
| (iii) | Identified intangible assets were recorded at preliminary estimated fair values as of December 23, 2009 as follows (in thousands): |
Customer relationships | $ | 45,611 | |
Trade names | 35,121 | ||
Non-compete agreement | 268 | ||
Total intangible assets | $ | 81,000 | |
| The customer relationship intangible asset is being amortized on a straight-line basis over 13 years. This represents management’s preliminary estimate of the period of economic benefit and annual customer profitability. The trade name intangible assets and non-compete intangible assets are being amortized on a straight-line basis over six and three years, respectively. |
| The $2.5 million decrease in pro forma depreciation and amortization expense for the period January 1, 2007 through December 30, 2007 reflected in cost of goods sold is comprised of (1) the estimated depreciation and amortization expense of $190.5 million based on estimated fair values and useful lives of identified tangible and intangible assets, and (2) elimination of historical depreciation and amortization expense of $193.0 million. |
133
Table of Contents
| The $0.3 million decrease in pro forma depreciation and amortization expense for the period January 1, 2007 through December 30, 2007 reflected in selling, general and administrative expenses is comprised of (1) estimated depreciation and amortization expense of $26.0 million based on the estimated fair values and useful lives of identified tangible and intangible assets and (2) elimination of historical depreciation and amortization expense of $26.3 million: |
| Estimated depreciation and amortization expense | ||||||||||||||||||||
| (in thousands, except useful lives) | Historical net book value | Estimated fair value | Estimated useful lives (yrs) | Cost of goods sold | Selling, general and administrative | Total | ||||||||||||||
Land | $ | 96,159 | n/a | $ | n/a | $ | n/a | $ | n/a | |||||||||||
Buildings, machinery, and equipment | 2,166,948 | 11 | 181,236 | 15,760 | 196,996 | |||||||||||||||
Autos and trucks | 50,529 | 5 | 9,297 | 808 | 10,105 | |||||||||||||||
Construction in progress | 74,943 | n/a | n/a | n/a | n/a | |||||||||||||||
Customer Relationships | 45,611 | �� | 13 | n/a | 3,509 | 3,509 | ||||||||||||||
Trade names | 35,121 | 6 | n/a | 5,854 | 5,854 | |||||||||||||||
Non-compete agreement | 268 | 3 | n/a | 89 | 89 | |||||||||||||||
Total | $ | 1,556,655 | $ | 2,469,579 | $ | 190,533 | 26,020 | $ | 216,553 | |||||||||||
Less historical depreciation and amortization expense | 192,992 | 26,317 | 219,309 | |||||||||||||||||
Adjustment for the transaction | $ | (2,459 | ) | $ | (297 | ) | $ | (2,756 | ) | |||||||||||
| (j) | Reflects $2.2 million additional costs associated with being a public company on the New York Stock Exchange. These costs include incremental audit fees, directors’ and officers’ insurance, internal audit and Sarbanes-Oxley related expenses and printing costs, based on preliminary discussions with anticipated service providers. |
| (k) | Reflects the following adjustments to interest expense, net (in thousands): |
Interest expense, 11.625% senior unsecured notes due 2014(i) | $ | 66,572 | ||
Debt issuance amortization, 11.625% senior unsecured notes due 2014(ii) | 651 | |||
Debt discount accretion, 11.625% senior unsecured notes due 2014(iii) | 7,965 | |||
Interest expense, predecessor, December 25, 2006 through July 10, 2007(iv) | (65,785 | ) | ||
Interest expense, predecessor, July 11, 2007 through December 30, 2007(v) | (13,822 | ) | ||
Interest expense, successor(vi) | (7,845 | ) | ||
Interest expense, PPC debt(vii) | (25,123 | ) | ||
Debt issuance amortization, PPC Exit Facility(viii) | 12,259 | |||
Total Interest expense, net | $ | (25,128 | ) | |
On April 27, 2009, our wholly owned subsidiaries, JBS USA, LLC and JBS USA Finance, Inc., issued 11.625% senior unsecured notes due 2014 in an aggregate principal amount of $700.0 million. Net proceeds, after deducting the debt discount costs of $48.7 million and debt issuance costs of $0.5 million, were $650.8 million. The net proceeds, in addition to $3.4 million of cash on hand, were applied to repay $550.8 million of the outstanding principal and accrued interest on intercompany loans to us from a subsidiary of JBS S.A. (reflecting $519.6 million outstanding principal payments and $31.2 million accrued interest), $100.0 million of borrowings under our secured revolving credit facility, and $3.4 million of additional debt issuance costs. In order to calculate the pro forma interest adjustments shown in (i), (ii), (iii), we pro-rated the gross debt issuance costs and debt discount amounts based on the net proceeds used to repay the outstanding principal on intercompany loans of $519.6 million as a percentage of (1) total offering proceeds of $650.8 million less (2) debt issuance costs paid with $3.4 million cash on hand, or net proceeds of $647.4 million. These pro-rated amounts represent the costs we would have incurred to generate the net proceeds used to repay the outstanding principal on intercompany loans of $519.6 million.
| (i) | Includes pro forma interest expense on $561.9 million outstanding principal ($519.6 million proceeds plus $39.1 million pro-rated bond discount and $3.2 million pro-rated debt issuance costs) of our 11.625% senior unsecured notes due 2014 for the period from December 25, 2006 through December 30, 2007, calculated on a straight-line basis over five years. The $3.2 million pro-rated debt issuance cost is calculated as the ratio of the $519.6 million of outstanding principal on our consolidated intercompany loans which were repaid divided by net proceeds of $647.4 million multiplied by the total debt issuance costs of $4.0 million. The $39.1 million pro-rated bond discount is calculated as the ratio of $519.6 million of outstanding principal on our consolidated intercompany loans which were repaid divided by net proceeds of $647.4 million multiplied by bond discount of $48.7 million. The total principal amount of our 11.625% senior secured notes due 2014 is $700.0 million, and our pro forma interest expense accordingly does not purport to be indicative of what our interest expense will be in the future. |
| (ii) | Includes pro forma interest expense for the amortization of pro-rated debt issuance costs of $3.2 million on $561.9 million of our 11.625% senior unsecured notes due 2014 for the period from December 25, 2006 through December 30, 2007, calculated on a straight-line basis over five years. |
| (iii) | Includes pro forma interest expense for the accretion of the pro-rated bond discount of $39.1 million on $561.9 million of our 11.625% senior unsecured notes due 2014 for the period from December 25, 2006 through December 30, 2007, calculated on a straight-line basis over five years. |
134
Table of Contents
| (iv) | Includes pro forma elimination of predecessor interest expense of $65.8 million for the period from December 25, 2006 through July 10, 2007 related to debt that was repaid in connection with the Swift Acquisition. |
| (v) | Includes pro forma elimination of predecessor interest expense of $13.8 million for the period from July 11, 2007 through December 30, 2007 related to debt that was repaid in connection with the Swift Acquisition. |
| (vi) | Includes the reduction of pro forma interest expense for the period from December 25, 2006 through December 30, 2007 on our consolidated intercompany loans from JBS S.A. due to a $519.6 million reduction in the aggregate principal amount of those loans using a portion of the net proceeds of our 11.625% senior unsecured notes due 2014. The $7.8 million reduction of interest expense is comprised of the (1) pro forma interest expense of $15.1 million based on average borrowings of $230.4 million for a 371 day period for which the borrowings were in excess of $519.6 million at an average interest rate of 6.37%, and (2) elimination of actual interest costs of $22.9 million incurred on outstanding borrowings for the period from July 11, 2007 through December 30, 2007. |
| (vii) | The $25.1 million decrease in pro forma interest expense is comprised of (1) pro forma interest expense of $109.9 million on $1,570.3 million outstanding borrowings for the period December 25, 2006 through December 30, 2007 at an estimated interest rate of 7.0% related to PPC’s anticipated Exit Facility, and (2) elimination of historical interest expense of $135.0 million incurred on borrowings for the period December 25, 2006 through December 30, 2007. The historical interest income and historical interest expense associated with PPC’s Mexican revolving credit facility were not adjusted as they were not included as part of the bankruptcy filing. |
| (viii) | Includes pro forma interest expense of $12.3 million for the amortization of debt issuance costs related to the PPC Exit Facility for the period January 1, 2007 through December 30, 2007, calculated on a straight-line basis over a weighted average life of 3.9 years. |
| (l) | The $34.6 million income tax expense is comprised of the (1) historical income tax expense of JBS USA Holdings, Inc. and (2) income tax benefit from pro forma net income from continuing operations on all pro forma adjustments as follows: |
JBS USA Holdings, Inc., historical income tax benefit | $ | (18,380 | ) | |||||||
JBS USA Holdings, Inc., historical income tax expense | 1,025 | |||||||||
Income (loss) from continuing operations: | ||||||||||
Packerland, historical | (+ | ) | (39,981 | ) | ||||||
Packerland, adjustment for 50% equity interest in Five Rivers | (- | ) | 7,406 | |||||||
Packerland, adjustments for assets not acquired | (- | ) | (80,897 | ) | ||||||
Five Rivers, historical | (+ | ) | 14,812 | |||||||
Five Rivers, adjustments for assets not acquired | (- | ) | (10,767 | ) | ||||||
Pilgrim’s Pride, historical | (+ | ) | 87,436 | |||||||
Adjustment for transactions | (+ | ) | 1,857 | |||||||
Total pro forma net income from continuing operations | 148,382 | |||||||||
Pro forma income tax expense at 35% | 51,934 | |||||||||
Total pro forma income tax expense | $ | 34,579 | ||||||||
| The Company has not yet reached a decision as to whether the undistributed earnings of PPC’s subsidiary in Mexico will continue to be permanently reinvested and therefore the actual accounting for income taxes could differ. |
135
Table of Contents
| (m) | Reflects the elimination of the 36% non-controlling shareholder net loss of Pilgrim’s Pride for purposes of calculating the earnings per share of the controlling shareholder. The $24.1 million adjustment is calculated as follows: |
Pilgrim’s Pride historical net income | $ | 27,086 | |
Pilgrim’s Pride adjustment for transactions: | |||
Depreciation and amortization benefit | 2,756 | ||
Interest expense benefit(i) | 12,864 | ||
Income tax benefit(ii) | 24,281 | ||
Total Pilgrim’s Pride pro forma adjustment for transactions | 39,901 | ||
Pilgrim’s Pride pro forma net income | 66,987 | ||
Non-controlling shareholder pro forma interest (36%) | $ | 24,115 | |
| (i) | Includes interest expense, PPC and amortization of debt issuance cost on PPC’s Exit Facility, as reflected in (k) (vii) (viii). |
| (ii) | The $24.3 million pro forma income tax benefit for PPC is comprised of the following (1) $1.0 million tax effect of the pro forma depreciation and amortization adjustment ($2,756 multiplied by 35%), plus (2) $4.5 million tax effect of the pro forma interest expense ($12,864 multiplied by 35%), plus (3) $30.6 million tax effect of historical PPC income from continuing operations before income taxes ($87,436 multiplied by 35%), less (4) $60.4 million historical PPC income tax expense. |
| (n) | The capital structure of our predecessor company was significantly different from our capital structure. Prior to this offering, our capital structure consists of 100 common shares issued and outstanding, and we do not have any warrants or options that may be exercised. Accordingly, we do not believe our predecessor company’s earnings per share information is meaningful to investors and have not included such information. |
| (o) | Includes 40% of the 33 1/3 shares of our common stock sold related to the BNDESPAR transaction. We reflect only 40% of these shares because 40% of the proceeds of the sale of the shares (40% of $2.0 billion, which is $800.0 million) are expected to be used to pay the cash consideration for the Proposed PPC Acquisition and are therefore directly attributable to the Proposed PPC Acquisition. See note (h) above. We intend to initially fund a portion of the cash consideration for the Proposed PPC Acquisition from cash received from subsidiaries and cash on hand pending the funding of the remaining portion of our $2.0 billion stock purchase agreement with JBS S.A., which we expect to occur following the issuance by JBS S.A. of the debentures in connection with the BNDESPAR transaction. This interim funding would not require us to modify the contract described in “Principal and selling stockholder—JBS S.A. purchase and sale agreement” or the proceeds ultimately received from JBS S.A. under that contract. |
136
Table of Contents
Pro forma fiscal year ended December 28, 2008 (53 weeks) compared to the pro forma fiscal year ended December 30, 2007 (52 weeks)
Net sales. Net sales were $23,746.7 million for the pro forma fiscal year ended December 28, 2008 as compared to $21,506.3 million for the pro forma fiscal year ended December 30, 2007. Net sales increased by $2,240.4 million, or 10.4%, primarily reflecting an overall increase in volume combined with an overall increase in sales prices. The volume increase was partially due to an additional week of operating activity in the fiscal year ended December 28, 2008, as well as increases in production volumes from the ramp-up of the second shift of production at our Greeley plant, commencing in September 2007. The sales price increase included a 4.1% increase in Beef prices, a 2.2% increase in Pork prices and a 3.4% increase in Chicken prices. Volumes increased 13.0% in our Beef segment and 3.8% in our Pork segment, partially offset by a 2.1% reduction in the Chicken segment. The volume increases in our Pork segment occurred across all of our facilities. The volume increases in our Beef segment were driven primarily by adding the second shift of production at our Greeley plant, but they also included volume increases at all of our Beef segment plants in the United States. In part, these volume increases were attributable to the return in mid-year 2008 of the South Korean beef market, as well as the identification of markets which maximize the margin of certain cuts, such as short rib to South Korea, picanha to Brazil, and the introduction of Australian meat to South American markets. PPC’s sales volumes decreased as a result of production cutbacks PPC implemented throughout the year to help alleviate an oversupply of chicken in the domestic market. PPC also experienced a decrease in the volume of rendered chicken products it sold during the year as a result of a fire that destroyed its Mt. Pleasant, Texas rendered chicken product plant in July 2008. For calculation of the price changes in the period subsequent to the Tasman Acquisition, we have used a 12 to 1 ratio of smalls to cattle equivalents based on relative weights.
Cost of goods sold. Cost of goods sold totaled $23,433.2 million for the pro forma fiscal year ended December 28, 2008 as compared to $20,715.7 million for the pro forma fiscal year ended December 30, 2007. The increase of $2,717.5 million, or 13.1%, was partially due to an additional week of operating activity in the fiscal year ended December 28, 2008. Cost of goods sold increased 13.8% in our Beef segment as a result of a 0.6% increase in cattle prices and a 13.0% increase in slaughter volumes, along with a 5.6% increase in our Pork segment driven by a 1.7% increase in hog prices and a 3.8% increase in slaughter volumes. In addition, PPC’s production costs increased primarily as a result of the increased cost of feed ingredients. PPC’s cost of feed ingredients per pound purchased during the pro forma fiscal year ended December 28, 2008 increased 37.2% from the cost of feed ingredients per pound purchased during the pro forma fiscal year ended December 30, 2007. PPC also experienced increased production and freight costs related to operational inefficiencies, labor shortages at several facilities, and higher energy and fuel costs. We believe the labor shortages were attributable in part to heightened publicity surrounding governmental immigration enforcement efforts, our ongoing immigration compliance efforts and continued changes in our employment practices in light of recently published governmental best practices and new labor hiring regulations. During the pro forma fiscal year ended December 28, 2008, PPC recognized losses totaling $65.4 million on derivative financial instruments executed to manage its exposure to changes in corn and soybean meal prices. The aggregate loss recognized on derivative financial instruments during the pro forma fiscal year ended December 30, 2007 was $2.0 million. PPC also recognized asset impairment charges totaling $13.1 million related to the closure of two operating complexes, one prepared foods plant and seven distribution centers during the pro forma fiscal year ended December 28, 2008. Cost of goods sold incurred by PPC’s Mexico operations for the pro forma fiscal year ended December 28, 2008 increased $116.1 million, or
137
Table of Contents
24.1%, from cost of goods sold incurred by its Mexico operations for the pro forma fiscal year ended December 30, 2007. This increase resulted primarily from increased feed ingredients costs. The cost of feed ingredients per pound purchased during the pro forma fiscal year ended December 28, 2008 increased 32.3% from the cost of feed ingredients per pound purchased during the pro forma fiscal year ended December 30, 2007.
Although total cost of sales increased year over year due to increased production volumes, we demonstrated reductions in per head cost for the Beef and Pork segments in the following categories: renegotiation of contracts, operational performance improvements, packaging, freight, hourly labor, overtime, maintenance, contract services and operating supplies.
Gross margin percentages. Gross margin percentage (gross profit as a percentage of net sales) was 1.3% for the pro forma fiscal year ended December 28, 2008 as compared to 3.7% for the pro forma fiscal year ended December 30, 2007. This decrease reflects PPC’s margin decrease of 11.9 percentage points to a negative margin of 4.2% in 2008 from a positive margin of 7.7% in 2007, which was partially offset by a margin increase of 3.3 percentage points in our Beef segment and a margin increase of 0.5 percentage points in our Pork segment. The improvements in our Beef and Pork segments resulted from improvements in Beef and Pork sales to markets which place higher value on certain cuts, reductions in our operating costs and improvements in plant efficiency and yields. Margin enhancements in our Beef segment include cost reductions due to the renegotiation of supply contracts, elimination of certain third-party service providers (including cattle hotelling, lab services and maintenance service providers) and the in-sourcing of these items at lower cost, operational yield enhancements which generated additional pounds to sell from each carcass and improved margins due to enhanced product mix resulting from the increases in volumes sold to international markets where products like the special cuts described above generate a higher return. PPC’s margin decrease reflects the impact that (i) the increased costs of feed ingredients, production and freight, and (ii) the significantly larger loss incurred on derivative financial instruments had on our profit margin.
Selling, general and administrative expenses. Selling, general and administrative expenses were $599.7 million for the pro forma fiscal year ended December 28, 2008 as compared to $642.8 million for the pro forma fiscal year ended December 30, 2007. These expenses decreased by $43.1 million, or 6.7%. This decrease reflected a reduction in selling, general and administrative costs in our Beef and Pork segments and of PPC. The decrease in the Beef and Pork segments derived from increased management focus on spending, the elimination of outside consultants, reductions in professional service fees and reductions in the number of executive management personnel in mid-2007 for which a full year of cost savings is reflected in fiscal 2008, partially offset by the inclusion of higher management incentives in fiscal 2008 due to improved business performance and the additional week of operating expenses for the period ended December 28, 2008. Selling, general and administrative expenses of PPC decreased $27.0 million, or 6.9%, primarily due to reductions in employee compensation and related benefit costs resulting from restructuring actions taken in 2008. These reductions in the Chicken segment were partially offset by severance, lease obligation and other facility closing charges related to the closure of two operating complexes, one prepared foods plant, one administrative office and seven distribution centers during the pro forma fiscal year ended December 28, 2008.
Foreign currency transaction, net. Foreign currency transaction, net for the pro forma fiscal year ended December 28, 2008 was a loss of $76.0 million as compared to a gain of $5.7 million for the pro forma fiscal year ended December 30, 2007. This $81.7 million decrease related to the effects of the variation in the value of the Australian dollar as compared to the U.S. dollar on our
138
Table of Contents
U.S. dollar-denominated intercompany note between our Australian subsidiary, as debtor, and us, as lender. The value of the Australian dollar as compared to the U.S. dollar depreciated 22.1% from the December 30, 2007 period-end rate to the December 28, 2008 period-end rate compared to the 11.8% appreciation from the December 24, 2006 period-end rate to the December 30, 2007 period-end rate.
Interest expense, net. Interest expense, net was $206.8 million for the pro forma fiscal year ended December 28, 2008 as compared to $237.3 million for the pro forma fiscal year ended December 30, 2007. Interest expense, net decreased by $30.5 million, or 12.9%, due primarily to reduced borrowings and lower interest rates on our variable rate debt instruments, coupled with a one-time charge of $29.4 million recognized by PPC in fiscal 2007 related to early extinguishment of debt.
Income tax expense, net. Income tax expense, net for the pro forma fiscal year ended December 28, 2008 was a net benefit of $252.6 million as compared to an expense of $34.6 million for the pro forma fiscal year ended December 30, 2007. This $287.2 million decrease is primarily related to a significant decrease in pre-tax income and a reduction in our valuation allowance due to a reassessment of the need for a valuation allowance.
Net loss. As a result of the factors described above, we recorded a pro forma net loss for the fiscal year ended December 28, 2008 was $867.5 million as compared to a net loss of $122.3 million for the fiscal year ended December 30, 2007.
Liquidity and capital resources
The following liquidity and capital resources discussion does not give effect to the Proposed PPC Acquisition or the BNDESPAR transaction.
Our ongoing operations require the availability of funds to service debt, fund working capital needs, invest in our business, and pay our liabilities. We currently finance and expect to continue to finance these activities through cash flow from operations and from amounts available under our senior secured revolving credit facility.
As of September 27, 2009, we had working capital of $763.3 million compared to $829.1 million at December 28, 2008. The decrease from December 2008 is primarily due to normal seasonality. Our average Days Inventory Outstanding, or DIO and Days Sales Outstanding, or DSO , for the thirty-nine weeks ended September 27, 2009 were 18.97 and 16.33, respectively. We consider accounts receivable and inventory to be readily convertible to cash and an additional source of cash liquidity as compared to companies and industries with longer DSO or DIO.
We believe that cash on hand, cash flows from operations and availability under our senior secured revolving credit facility will be sufficient to meet ongoing operating requirements, make scheduled principal and interest payments on debt, and fund capital expenditures for the foreseeable future. Our ability to generate sufficient cash, however, is subject to certain general economic, financial, industry, legislative, regulatory and other factors beyond our control. Capital expenditures for 2009 are expected to approximate $165.0 million, of which approximately 50% is expected to be for maintenance and the remainder for major renewals, improvements and the development of new processing capabilities. We anticipate that we may spend approximately $2.0 billion to $2.5 billion from 2010 through 2012, of which approximately $500 million is
139
Table of Contents
expected to be for maintenance, major renewals, improvements and the development of new processing facilities, and the remainder, or approximately $1.5 to $2.0 billion, including a portion of the net proceeds of this offering, may be used to fund our strategy to enhance our direct distribution capabilities.
Cash flows
Operating activities. Net cash provided by (used in) operating activities increased to $282.1 million for the fiscal year ended December 28, 2008 as compared to $(110.7) million for the 173-day period from July 11, 2007 through December 30, 2007 (successor) and $(107.8) million for the 198-day period from December 25, 2006 to July 10, 2007 (predecessor), respectively. The primary source of operational cash flow improvements was improved operational results between the periods driven by increased volumes, higher sales margins and lower operating costs, coupled with a deferred revenue advance payment of $175.0 million. See “—External sources of liquidity and description of indebtedness—Customer advance payment relating to raw material supply agreement.”
Net cash provided by operating activities increased by $139.9 million to $189.6 million for the thirty-nine weeks ended September 27, 2009 as compared to $49.7 million for the thirty-nine weeks ended September 28, 2008. The increase is attributable primarily to changes in working capital items, including receivables and inventory, between the two periods attributable to market prices and quantities of inventory on hand, as well as to improved margins which are the result of improvements in our sales product mix, identification of higher value markets for certain of our products, coupled with a reduction in our manufacturing costs and improved operational efficiencies including year over year inventory management.
Investing activities. Cash used in investing activities totaled $783.7 million for the fiscal year ended December 28, 2008 as compared to cash used of $39.4 million for the 173-day period July 11, 2007 through December 30, 2007 (successor) and $27.8 million for the 198-day period from December 25, 2006 to July 10, 2007 (predecessor), respectively. The primary factors in the increase in investments were the JBS Packerland and Tasman Acquisitions during the fiscal year ended December 28, 2008.
Cash used in investing activities totaled $287.2 million for the thirty-nine weeks ended September 27, 2009 as compared to cash used of $173.2 million for the thirty-nine weeks ended September 28, 2008. The increase in cash used was primarily due to the issuance of a $174.0 million note receivable to an unconsolidated affiliate. The cash we loaned to the affiliate was used to acquire live cattle to feed in the Five Rivers feedlots and ultimately to be delivered for processing to the JBS Beef plants. See “Certain relationships and related party transactions—Arrangements with J&F Oklahoma—Cattle purchase and sale agreement.” The increase was partially offset by the $107.7 million spent in the prior year period to acquire Tasman.
Financing activities. For the fiscal year ended December 28, 2008, cash provided by financing activities totaled $571.3 million, as compared to cash provided by financing activities of $346.7 million for the 173-day period July 11, 2007 through December 30, 2007 (successor) and $100.5 million for the 198-day period from December 25, 2006 to July 10, 2007 (predecessor), respectively. The primary source of the increase in financing activities was the increase in capital contributions from our parent and intercompany borrowings as compared to the prior year periods.
Cash used in financing activities totaled $55.1 million for the thirty-nine weeks ended September 27, 2009, a decrease of $247.6 million from cash provided by financing activities of
140
Table of Contents
$192.5 million in the thirty-nine weeks ended September 28, 2008. The decrease resulted primarily from reduced borrowings on our senior secured revolving credit facility and the debt refinancings in the current year while the prior year funding was from investments from JBS S.A., net of payments on outstanding debt.
External sources of liquidity and description of indebtedness
Our primary financing objective is to maintain a balance sheet that provides the flexibility to pursue our business strategy. To finance our working capital needs, we utilize cash flow from operations and borrow from our senior secured revolving credit facility in addition to a combination of equity and long-term debt to finance non-current assets.
Senior secured revolving credit facility
On November 5, 2008, we entered into a senior secured revolving credit facility that allows borrowings up to $400.0 million, and terminates on November 5, 2011. On April 22, 2009, we entered into an amendment to our senior secured revolving facility that allows us to request an increase in the size of the facility to $500.0 million, to the extent we receive additional commitments.
Up to $75.0 million of the revolving credit facility is available for the issuance of letters of credit. Borrowings that are index rate loans will bear interest at a per annum rate equal to the prime rate plus a margin of 2.25% while LIBOR rate loans will bear interest at a per annum rate equal to the applicable LIBOR rate plus a margin of 3.25%. At September 27, 2009, the index loan rate was 5.50%. Upon approval by the lender, LIBOR rate loans may be taken for one, two-, or three-month terms (or six months at the discretion of the agent under our senior secured revolving credit facility).
Availability. Availability under our senior secured revolving credit facility is subject to a borrowing base. The borrowing base is based on certain of our domestic wholly owned subsidiaries’ assets as described below, with the exclusion of Five Rivers. The borrowing base consists of percentages of eligible accounts receivable, inventory, and supplies and less certain eligibility and availability reserves. As of September 27, 2009, our borrowing base totaled $306.9 million.
Security and guarantees. Borrowings made by us and all guarantees of those borrowings are collateralized by a first priority perfected lien and interest in accounts receivable, inventory, and general intangibles related thereto and proceeds of the foregoing.
Covenants. Our senior secured revolving credit facility contains customary representations and warranties and a springing financial covenant that requires a minimum fixed charge coverage ratio of not less than 1.15 to 1.00. The fixed charge coverage ratio is defined as the ratio of EBITDA to fixed charges, each as defined in our senior secured revolving credit facility. This ratio is only applicable if borrowing availability falls below the minimum threshold, which is the greater of 20% of the aggregate commitments or $70.0 million. Our senior secured revolving credit facility also contains negative covenants that limit our ability and the ability of our subsidiaries to, among other things:
| • | make capital expenditures greater than $175.0 million per year; |
141
Table of Contents
| • | incur additional indebtedness; |
| • | create liens on property, revenue, or assets; |
| • | make certain loans or investments; |
| • | sell or dispose of assets; |
| • | pay certain dividends and other restricted payments; |
| • | prepay, cancel or amend certain indebtedness; |
| • | dissolve, consolidate, merge, or acquire the business or assets of other entities; |
| • | enter into joint ventures other than certain permitted joint ventures or create certain other subsidiaries; |
| • | enter into new lines of business; |
| • | enter into certain transactions with affiliates; and |
| • | enter into sale/leaseback transactions. |
Events of default. Our senior secured revolving credit facility also contains customary events of default, including failure to perform or observe terms, covenants or agreements included in our senior secured revolving credit facility, payment of defaults on other indebtedness, defaults on other indebtedness if the effect is to permit acceleration, entry of unsatisfied judgments or orders against a loan party or its subsidiaries, failure of any collateral document to create or maintain a priority lien, and certain events related to bankruptcy and insolvency or matters relating to the Employee Retirement Income Security Act of 1974, or ERISA. If an event of default occurs the lenders under our senior secured revolving credit facility may, among other things, terminate their commitments, declare all outstanding borrowings to be immediately due and payable together with accrued interest, and fees and exercise remedies under the collateral documents relating to our senior secured revolving credit facility. At September 27, 2009, we were in compliance with all covenants.
Amounts outstanding. As of September 27, 2009, we were in compliance with all covenants and had $0 million outstanding under the credit facility and outstanding letters of credit of $39.0 million.
11.625% senior unsecured notes due 2014
Our wholly owned subsidiaries JBS USA, LLC and JBS USA Finance, Inc. issued 11.625% notes due 2014 in an aggregate principal amount of $700.0 million on April 27, 2009. These notes are guaranteed by JBS S.A., us, JBS Hungary Holdings Kft. (a wholly owned, indirect subsidiary of JBS S.A., the selling stockholder in this offering and our direct controlling stockholder), and each of our U.S. restricted subsidiaries that guarantee our senior secured revolving facility (subject to certain exceptions). Interest on these notes accrues at a rate of 11.625% per annum and is payable semi-annually in arrears on May 1 and November 1 of each year, beginning on November 1, 2009. The principal amount of these notes is payable in full on May 1, 2014.
142
Table of Contents
Covenants. The indenture for the 11.625% senior unsecured notes due 2014, contains customary negative covenants that limit our, JBS USA, LLC’s and restricted subsidiaries’ ability to, among other things:
| • | incur additional indebtedness subject to complying with certain net debt to EBITDA incurrence ratios; |
| • | incur liens; |
| • | sell or dispose of assets; |
| • | pay dividends or make certain payments to our shareholders; |
| • | permit restrictions on dividends and other restricted payments by its restricted subsidiaries; |
| • | enter into related party transactions; |
| • | enter into sale/leaseback transactions; and |
| • | undergo changes of control without making an offer to purchase the notes. |
Events of default. The indenture also contains customary events of default, including failure to perform or observe terms, covenants or other agreements in the indenture, defaults on other indebtedness if the effect is to permit acceleration, failure to make a payment on other indebtedness waived or extended within the applicable grace period, entry of unsatisfied judgments or orders against the issuer or its subsidiaries, and certain events related to bankruptcy and insolvency matters. If an event of default occurs, the trustee or the holders of at least 25% in aggregate principal amount of the notes then outstanding, may declare such principal and accrued interest on the notes to be immediately due and payable.
Guarantee of 10.50% senior notes due 2016 of JBS S.A.
On August 4, 2006, JBS S.A. issued 10.50% senior notes due 2016, or the 2016 Notes, in an aggregate principal amount of $300.0 million. Interest on the 2016 Notes accrues at a rate of 10.50% per annum and is payable semi-annually in arrears on February 4 and August 4 of each year, beginning on February 4, 2007. The principal amount of the 2016 Notes is payable in full on August 4, 2016.
Guarantees. The indenture governing the 2016 Notes requires any “significant subsidiary” (as defined in the indenture governing the 2016 Notes) of JBS S.A. to guarantee all the obligations under the 2016 Notes, subject to the exception below. The 2016 Notes are currently guaranteed by JBS Hungary Holdings Kft. (a wholly owned, indirect subsidiary of JBS S.A., the selling stockholder in this offering and our direct controlling stockholder), us, JBS USA Holdings, Inc., JBS USA, LLC and Swift Beef Company. In the event that other subsidiaries of JBS S.A. (including our subsidiaries) constitute a significant subsidiary in the future, such subsidiary will be required to become a guarantor of the 2016 Notes. The maximum amount of the guarantee will be limited so as not to (i) subject such guarantee to avoidance under applicable law, including fraudulent conveyance laws, or (ii) result in a breach or violation of any agreement in effect when such guarantee is provided. A “significant subsidiary” is defined as any subsidiary constituting at least 20% of JBS S.A.’s total assets or annual gross revenues, as reported in the latest financial statements of JBS S.A.
143
Table of Contents
Covenants. The indenture for the 2016 Notes contains customary negative covenants that limit the ability of JBS S.A. and its subsidiaries (including us) to, among other things:
| • | incur additional indebtedness; |
| • | incur liens; |
| • | sell or dispose of assets; |
| • | pay dividends or make certain payments to JBS S.A.’s shareholders; |
| • | permit restrictions on dividends and other restricted payments by its subsidiaries; |
| • | enter into related party transactions; |
| • | enter into sale/leaseback transactions; and |
| • | undergo changes of control without making an offer to purchase the notes. |
Events of default. The indentures also contain customary events of default, including for failure to perform or observe terms, covenants or other agreements in the indenture, defaults on other indebtedness if the effect is to permit acceleration, failure to make a payment on other indebtedness waived or extended within the applicable grace period, entry of unsatisfied judgments or orders against the issuer or its subsidiaries, and certain events related to bankruptcy and insolvency matters. If an event of default occurs, the trustee or the holders of at least 25% in aggregate principal amount of the notes then outstanding, may declare such principal and accrued interest on the notes to be immediately due and payable.
Unsecured Australian revolving credit facility
Our Australian subsidiary Swift Australia Pty Limited, or Swift Australia, entered into an Australian dollar denominated, A$120.0 million unsecured revolving credit facility on February 26, 2008 to fund working capital and letter of credit requirements.
Availability. Under this facility, A$80.0 million can be borrowed for cash needs, including to assist with working capital and capital expenditure requirements. Additionally, A$40.0 million is available to assist with the issuance of bank guarantees, including to fund letters of credit. Borrowings are made at the quoted bank bill swap bid rate, or BBSY, plus a margin of 0.975% plus a commitment fee of 0.1%.
Guarantees. The unsecured revolving credit facility requires that Swift Australia’s parent company, JBS Holdco Australia Pty Ltd., and certain named subsidiaries guarantee all of Swift Australia’s obligations under the facility. The following entities are acting as guarantors under the facility: JBS Holdco Australia Pty Ltd., S&C Australia Holdco Pty Ltd., Burcher Pty Ltd., ZM Australia Pty Ltd., and Swift Australia Pty Ltd.
Covenants. The unsecured revolving credit facility contains customary representations and warranties. This credit facility also contains certain financial covenants which require JBS Holdco Australia Pty Ltd. and its subsidiaries to maintain predetermined ratio levels related to interest coverage, debt coverage, tangible net worth and current assets to current liabilities, including a requirement to maintain a ratio of EBITDA (as defined in the credit agreement) to total interest expense of at least 1.6:1 for any period as included in the most recent consolidated profit and
144
Table of Contents
loss statement. In addition, this credit facility contains financial covenants which limit JBS Holdco Australia Pty Ltd.’s and its subsidiaries’ ability to incur additional indebtedness over 60% of net indebtedness over total tangible assets, allow the tangible net worth of JBS Holdco Australia Pty Ltd. and its subsidiaries to fall below A$170.0 million and/or to allow the consolidated ratio of current assets to current liabilities to be below a ratio of 1.5:1. In addition, this credit facility contains certain financial covenants that limit Swift Australia, JBS Holdco Australia Pty Ltd. and its subsidiaries, to among other things:
| • | sell, dispose or transfer any assets; |
| • | sell, dispose or transfer any receivables; |
| • | incur additional indebtedness; |
| • | create or permit any security interest, mortgage or pledge over any of its assets; |
| • | enter into any merger or corporate restructuring without consent of the lender; |
| • | enter into any partnership or joint venture with another person or entity without prior approval of the lender; |
| • | change the status of unsecured and unsubordinated claims of the lender such that its loans cease to rank at leastpari passuwith the claims of all its other unsecured and unsubordinated creditors; |
| • | engage in derivative transactions for speculative purposes; |
Events of default. The Australian unsecured revolving credit facility contains customary events of default, including failure to perform or observe terms, covenants or agreements included in the unsecured revolving credit facility, payments, while in default, on other indebtedness by JBS Holdco Australia Pty Ltd. or any of its subsidiaries, defaults on other indebtedness if the effect is to permit acceleration, any misrepresentations in the financing documents, any subsidiary of JBS Holdco Australia Pty Ltd. becoming insolvent, and any expropriation affecting the assets of the companies. If an event of default occurs the lenders under the unsecured revolving credit facility may, among other things, cancel their commitments, declare all or part of outstanding borrowings to be immediately due and payable together with accrued interest and declare cash cover in respect to each guarantee immediately due and payable. The lenders may also terminate the facility if the ratings of JBS S.A. are downgraded.
Amounts outstanding. As of September 27, 2009, we were in compliance with all covenants and had no amounts outstanding under the credit facility and had U.S.$33.2 million utilized under letters of credit. This facility terminated on October 1, 2009 but the letter of credit facility was extended to November 1, 2009, at which time it will terminate. We are currently in discussions with the lenders to refinance this facility. In anticipation of the November expiration, on October 27, 2009, we funded our Australian subsidiary with a U.S.$37.0 million intercompany loan from JBS USA, LLC to JBS Swift Australia Pty Ltd. to allow them to cash collateralize their letters of credit.
Secured credit / multi-option bridge facility
Our Australian subsidiary Swift Australia (Southern) Pty Limited (formerly known as Tasman Group Services Pty Ltd A.C.N.), entered into an A$80.0 million secured credit/ multi-option bridge facility on May 2, 2008.
145
Table of Contents
Availability. Under this facility, up to (i) A$50.0 million can be borrowed to provide funding relating to the Tasman Acquisition, (ii) A$15.0 million may be used to provide working capital and to fund letters of credit, and (iii) A$15.0 million may be used to finance payroll and general expenses. Borrowings are made at BBSY plus a margin of 0.70% plus an activation fee of 0.90%.
Security and guarantees. The amount of the secured credit/multi-option bridge facility is secured by certain registered mortgages, which include the following:
| • | Registered mortgage over property at 30 Industry Park Drive, Brooklyn VIC more particularly described in Certificate of Title Volume 10081 Folio 085 and property situated at Lots 10, 12, 14-19 (inclusive) Trade Place, Brooklyn VIC (currently in the name of Industry Park Ltd. A.C.N. 007 256 082); |
| • | Registered mortgage over property situated at “Yarrawonga Abattoir,” Hicks Road, Yarrawonga VIC more particularly described in Certificates of Title Volume 8893 Folios 814-816 given by Tasman Group Services Pty Ltd. A.C.N. 005 062 082; |
| • | Registered mortgage over property situated at “Cobrair Abattoir,” Racecourse Road, Cobram VIC more particularly described in Certificate Title Volume 10898 Folios 667 and 668, Certificate of Title Volume 10536 Folio 125, Certificate of Title Volume 9894 Folios 664 and 665 given by Tasman Group Services Pty Ltd. A.C.N. 005 062 082 (currently in the name of King Island Beef Pty Ltd. A.C.N. 061 982 304); |
| • | Registered mortgages over property situated at 250 Old Wilby Road Yarrawonga VIC more particularly described in Certificate of Title Volume 10418 Folios 580 and 582 given by Tasman Group Services Pty Ltd. A.C.N. 005 062 082; |
| • | Registered mortgages over property situated at “Longford Abatoir,” Tannery Road, Longford TAS more particularly described in Certificate of Title Volume 127128 Folios 1-4, Certificate of Title Volume 127129 Folio 1, Certificate of Title Volume 127180 Folio 1, Certificate of Title Volume 128346 Folio 1, Certificate of Title Volume 54242 Folio 1 and Certificate of Title Volume 230667 Folio 1 given by Tasman Group Services Pty Ltd. A.C.N. 005 062 082; |
| • | Registered mortgage over property situated at “Devenport Abattoir,” Saleyard Road, Devonport TAS more particularly described in Certificate of Title Volume 132831 Folios 2 and 6 given by Tasman Group Services Pty Ltd. A.C.N. 005 062 082 (currently in the name of King Island Beef Pty Ltd. A.C.N. 061 982 304); |
| • | Registered mortgage over property situated at Colonial Lodge, 13 Main Street Currie, King Island TAS more particularly described in Certificate of Title Volume 230928 Folio 1 given by Tasman Group Services Pty Ltd. A.C.N. 005 062 082; |
| • | Registered mortgage over property situated at “Allawah,” Burraboi-Jimaringle Road, Burraboi NSW more particularly described in Certificate of Title Folio Identifier 78/756543, Lot 78 in Deposit Plan 756543 in the Parish of Gynong Wakool given by Tasman Group Services Pty Ltd. A.C.N. 005 062 082; and |
| • | Registered mortgage over property situated at “Yambinya,” Burraboi-Jimaringle Road, Burraboi NSW more particularly described in Certificate of Title Folio Identifier Lots 76 and 77 in Deposit Plan 756543 in the Parish of Gyong Wakool given by Tasman Group Services Pty Ltd. A.C.N. 005 062 082. |
Subordination. In addition, pursuant to a deed of subordination agreement, dated May 19, 2008, among National Australia Bank Limited ABN, JBS Southern Australia Pty Ltd. and us,
146
Table of Contents
amounts that are owed to us by JBS Southern Australia Pty Ltd. are subordinated to the obligations under the secured credit/ multi-option bridge facility. Under the deed of subordination, the subordinated debt will not be repayable unless and until the bank debt is repaid in full; provided, however, that, subject to the satisfaction of certain conditions, such as no event of default occurring under the secured credit/multi-option bridge facility, payments of principal owed on the subordinated debt are permissible so long as the outstanding amount of the subordinated debt after giving effect to such payments does not fall below A$70.0 million.
Covenants. The secured credit / multi-option bridge facility contains customary representations and warranties. The facility also contains a number of restrictive covenants that limit the borrowers’ ability to, among other things:
| • | repay loans; |
| • | make redemptions of equity; |
| • | grant additional security interests over certain identified property; |
| • | raise any financial accommodation from any other party; |
| • | merge with or acquire another company or entity and dispose of assets; |
Events of default. The secured credit / multi-option bridge facility contains customary events of default, including failure to perform or observe terms, covenants or other agreements in the facility, defaults on other indebtedness if the effect is to permit acceleration, failure to make a payment on other indebtedness waived or extended within the applicable grace period, and failure to provide the lenders with information or documents reasonably required. If an event of default occurs, the lenders may at their option treat the total amount due as payable immediately and may immediately enforce any security or guarantee. The default interest rate will be 12.13%, plus a customer margin of 1.60% plus a default margin of 4.50%.
Amounts outstanding. As of September 27, 2009, we were in compliance with all covenants and had U.S.$29.9 million outstanding under the facility. This facility was to terminate on October 1, 2009 but has been renewed until January 31, 2010. We are currently in discussions with the lenders to refinance this facility.
Cactus bonds
On May 15, 2007, we entered into an Installment Bond Purchase Agreement with the city of Cactus, Texas. Under this agreement, we committed to purchase up to $26.5 million of bonds from the city of Cactus, which are being issued to fund improvements to the city’s sewer system, which is used by our beef processing plant located in Cactus, Texas. We will purchase the bonds in installments as improvements are completed through an anticipated date of June 2010. The interest rate on the bonds is six-month LIBOR plus 350 basis points. The bonds mature on June 1, 2032 and are subject to annual mandatory sinking fund redemption payments beginning on June 1, 2011. We have purchased $18.0 million in bonds as of September 27, 2009 and expect to purchase the remaining $8.5 million in 2009. For information on how we account for these bonds, see the description of “Other Assets” included in Note 4 to our consolidated financial statements.
147
Table of Contents
Related party debt
As of March 29, 2009, we owed an aggregate of $658.6 million under various intercompany loans from JBS S.A., which were subsequently assigned to JBS HU Liquidity Management LLC (Hungary), a wholly owned, indirect subsidiary of JBS S.A. The proceeds of these intercompany loans were used to fund our operations, the Tasman Acquisition and the JBS Packerland Acquisition. On April 27, 2009, in connection with the issuance of the 11.625% senior unsecured notes due 2014 by our subsidiary JBS USA LLC, these intercompany loan agreements were consolidated into one loan agreement, the maturity dates of the principal of the intercompany loans were extended to April 18, 2019, and the interest rate was changed from approximately 6.5% to 12% per annum. The net proceeds of the offering of the 11.625% senior unsecured notes due 2014 (other than $100.0 million) were used to repay accrued interest and a portion of the principal on these intercompany loans. As of September 27, 2009, we owed an aggregate principal amount of $89.1 million under the consolidated intercompany loan agreement. In addition, we entered into an additional intercompany term loan agreement in the aggregate principal amount of $6.0 million on the same terms as the consolidated intercompany loan agreement.
Customer advance payment relating to raw material supply agreement
On October 22, 2008, we received an advance cash payment of $175.0 million relating to a raw material supply agreement entered into on February 27, 2008 pursuant to which we granted a customer the exclusive right to collect a certain beef fabrication by-product from all of our U.S. beef plants for the term of the agreement. This customer advance payment is recorded as deferred revenue in our audited financial statements and is amortized as sales revenue as the agreed upon by-product is delivered to the customer over the term of the agreement. The customer advance payment is secured by a note agreement, which bears interest at two-month LIBOR plus 200 basis points and provides the lender with an option to convert the outstanding amount of the loan under the note agreement into our common stock upon the occurrence and continuance of any event of default under the note agreement. For more information on how we account for this transaction, see “Deferred Revenue” included in Note 10 to our consolidated financial statements.
Dividend restrictions
Certain covenants of our debt agreements include restrictions on our ability to pay dividends. As of December 28, 2008 and September 27, 2009, we had $20.6 million and $87.4 million, respectively, of retained earnings available to pay dividends.
Covenant compliance
JBS S.A. pro forma net debt to EBITDA ratio
The terms and conditions of (1) our 11.625% senior unsecured notes due 2014 and (2) JBS S.A.’s 10.50% senior notes due 2016 both include a covenant prohibiting JBS S.A. and its subsidiaries, including us, from incurring any debt (subject to certain exceptions) unless JBS S.A.’s pro forma net debt to EBITDA ratio at the date of such incurrence is less than 4.75 to 1.0.
The terms and conditions of both of these notes define:
| • | the Net Debt to EBITDA ratio as the ratio of JBS S.A.’s Net Debt to JBS S.A.’s EBITDA for the then most recently concluded period of four consecutive fiscal quarters, subject to adjustments for asset dispositions and investments made during the period; |
148
Table of Contents
| • | Net Debt at any time as the aggregate amount of debt of JBS S.A. and its subsidiaries (including us) less the sum of cash, cash equivalents and marketable securities recorded as current assets (except for any capital stock in any person); and |
| • | EBITDA for any period as to JBS S.A. and its subsidiaries (on a consolidated basis) as |
| • | aggregate net income (or loss)plus |
| • | current and deferred income tax and social contribution;minus |
| • | non-operating income (expense), net;plus |
| • | equity in the earnings (loss) of subsidiary companies;plus |
| • | financial income (expenses), net;plus |
| • | any depreciation or amortization. |
as each such item is reported on the most recent financial statements or financial information prepared in accordance with generally accepted accounting principles in Brazil.
JBS S.A. has informed us that it believes it will be able to comply with this financial ratio for the foreseeable future to the extent that it or any of its subsidiaries decides to incur debt.
JBS USA, LLC pro forma net debt to EBITDA ratio
In addition, our 11.625% senior unsecured notes due 2014 include a covenant prohibiting our subsidiary, JBS USA, LLC and its subsidiaries that are guaranteeing the 11.625% senior unsecured notes due 2014 from incurring any debt or issuing any disqualified capital stock (subject to certain exceptions) unless JBS USA, LLC’s pro forma net debt to EBITDA ratio at the date of such incurrence and the application of the proceeds therefrom, would be less than 3.0 to 1.0. The co-issuers of our 11.625% senior unsecured notes due 2014 were our wholly-owned subsidiaries JBS USA, LLC and JBS USA Finance, Inc.
The calculation of the net debt to EBITDA ratio thereunder is calculated based on the net debt and EBITDA of JBS USA, LLC and its restricted subsidiaries, and not our company.
The terms and conditions of these notes define:
| • | the Net Debt to EBITDA ratio as of any date of determination (the “Calculation Date”) the ratio of JBS USA, LLC’s Net Debt as of the Calculation Date to consolidated EBITDA for JBS USA, LLC and its restricted subsidiaries for the period of the then most recently concluded period of four consecutive fiscal quarters, subject to adjustments for asset dispositions and investments made during the period; |
| • | Net Debt at any time as the aggregate amount of debt of JBS USA, LLC and its restricted subsidiaries less the sum of cash, cash equivalents and marketable securities recorded as current assets (except for any capital stock in any person);provided that Net Debt shall include the aggregate principal amount of JBS S.A.’s 10.50% senior notes due 2016 and any other debt of JBS S.A. that may be guaranteed by JBS USA, LLC or its restricted subsidiaries; and |
| • | consolidated EBITDA of JBS USA, LLC and its restricted subsidiaries for any period as |
| (1) | consolidated net income for such period, subject to certain adjustments,minus |
| (2) | the sum of: |
| (a) | income tax credits; |
149
Table of Contents
| (b) | interest income; |
| (c) | gain from extraordinary items; |
| (d) | any aggregate net gain (but not any aggregate net loss) arising from the sale, exchange or other disposition of capital assets by JBS USA, LLC and its restricted subsidiaries (including any fixed assets, whether tangible or intangible, all inventory sold in conjunction with the disposition of fixed assets and all securities); and |
| (e) | any other non-cash gains that have been added in determining consolidated net income, |
in each case to the extent included in the calculation of consolidated net income of JBS USA, LLC in accordance with GAAP, but without duplication,plus
| (3) | the sum of: |
| (a) | any provision for income taxes; |
| (b) | consolidated interest expense; |
| (c) | loss from extraordinary items; |
| (d) | depreciation and amortization; |
| (e) | any aggregate net loss (but not any aggregate net gain) arising from the sale, exchange or other disposition of capital assets by JBS USA, LLC (including any fixed assets, whether tangible or intangible); |
| (f) | amortized debt discount; |
| (g) | the amount of any deduction to consolidated net income as the result of any grant to any members of the management of JBS USA, LLC or its restricted subsidiaries of any equity interests; and |
| (h) | any other non-cash losses that have been deducted in determining consolidated net income (other than non-cash losses related to write-downs or write-offs of accounts receivable or inventory), |
in each case to the extent included in the calculation of consolidated net income of JBS USA, LLC in accordance with GAAP, but without duplication, and as further adjusted to exclude certain non-cash items and non-recurring items.
For purposes of this covenant, consolidated net income is adjusted to exclude, among other things, (1) income from restricted subsidiaries to the extent that the payment of dividends or similar distributions by the restricted subsidiaries is not permitted by law or any agreement to which the restricted subsidiaries are parties, (2) income of any entity in which JBS USA, LLC has a joint interest, except to the extent of the dividends or other distributions actually paid to JBS USA, LLC or one of its wholly owned restricted subsidiaries and (3) certain non-cash items and non-recurring items.
The net debt to EBITDA ratio calculation mentioned above is based on the net debt and EBITDA of JBS USA, LLC and its restricted subsidiaries, and not our net debt and EBITDA. We had Adjusted EBITDA of $63.8 million on a pro forma basis in the fiscal year ended December 28, 2008 and $747.0 million in the thirty-nine week period ended September 27, 2009. For these same
150
Table of Contents
periods, JBS USA, LLC and its restricted subsidiaries had Adjusted EBITDA of $392.9 million and $298.6 million, respectively. The main differences between our Adjusted EBITDA and JBS USA, LLC and its restricted subsidiaries’ Adjusted EBITDA are that JBS USA, LLC’s Adjusted EBITDA excludes (1) PPC’s consolidated net income as PPC will not be a subsidiary of JBS USA, LLC, (2) Five Rivers’ consolidated net income because Five Rivers is currently an unrestricted subsidiary under the 11.625% senior unsecured notes due 2014 and (3) the payment by us (and not JBS USA, LLC) of a one-time breakage fee to the shareholders of National Beef totaling $19.9 million as full and final settlement of any and all liabilities relating to the potential acquisition of National Beef in the first quarter ended March 29, 2009 that we (and not JBS USA, LLC) recorded as a non-recurring expense. For the Five Rivers’ assets that we acquired, Five Rivers had consolidated pro forma net income of $7.6 million for the period from January 1, 2008 through October 22, 2008 and $2.9 million for the period from October 23, 2008 through December 28, 2008.
We had net debt of $623.5 million as of December 28, 2008 and $716.7 million as of September 27, 2009. We calculated net debt as of December 28, 2008 as total debt of $878.3 million minus cash and cash equivalents of $254.8 million and net debt as of September 27, 2009 as total debt of $822.4 million minus cash and cash equivalents of $105.7 million. For these same periods, JBS USA, LLC and its restricted subsidiaries had net debt of $134.0 million and $638.7 million, respectively. JBS USA, LLC calculated net debt as of December 28, 2008 as total debt of $219.7 million minus cash and cash equivalents of $85.7 million and net debt as of September 27, 2009 as total debt of $727.3 million minus cash and cash equivalents of $88.6 million. The main differences between our net debt and the net debt of JBS USA, LLC and its restricted subsidiaries are that (1) JBS USA, LLC’s net debt excludes Five Rivers’ debt and cash because Five Rivers is an unrestricted subsidiary and (2) JBS USA, LLC’s guarantee of JBS S.A.’s 10.50% senior notes due 2016 would also be included in JBS USA, LLC’s net debt (and not in ours) for purposes of calculating its net debt to EBITDA ratio.
For the four fiscal quarters ended September 27, 2009, JBS USA, LLC had a net debt to EBITDA ratio of 1.8 to 1.00. We cannot assure you that JBS USA, LLC will not need to incur additional indebtedness at a time when its net debt to EBITDA ratio is equal to or greater than 3.0 to 1.0. JBS USA, LLC’s compliance with this covenant could limit its flexibility in planning for, or reacting to changes in, our business by limiting the funds that we can seek to borrow or raise in the capital markets to pursue capital expenditures, acquisitions, our distribution strategy or other plans.
We have included this calculation of JBS USA, LLC’s net debt, EBITDA and net debt to EBITDA ratio, as we believe that this ratio is important to investors, and the indenture governing our 11.625% senior unsecured notes due 2014 is a material debt agreement for us.
Financing related to the Proposed PPC Acquisition
Exit Facility
The reorganized PPC and certain of its subsidiaries is also expected to enter into the Exit Facility as it exits from bankruptcy in order to provide funding for Plan distributions and working capital. On August 11, 2009, the bankruptcy court entered an order authorizing PPC to enter into certain mandate, commitment and fee letters in connection with the Exit Facility and to pay certain fees related thereto. Any merger or consolidation of the reorganized PPC with us will require prepayment in full of the Exit Facility, which prepayment cannot be waived without the consent of the required lenders to the Exit Facility or a refinancing of the Exit Facility. On November 20, 2009, PPC and certain of its subsidiaries filed as a supplement to its Plan a form of credit agreement detailing the terms and conditions of the Exit Facility it expects to enter into as it exits from bankruptcy. The material terms and conditions of the Exit Facility are as follows.
151
Table of Contents
The Exit Facility, as currently contemplated, will provide (i) a senior secured financing facility in an aggregate principal amount not to exceed $1,750.0 million, to include a three-year revolving credit facility, in an aggregate principal amount not to exceed $600.0 million, (ii) a three-year term A loan facility in an aggregate principal amount of up to $375.0 million, and (iii) a five-year term B loan facility in an aggregate principal amount of up to $775.0 million. As contemplated, a portion of the revolving commitments under the Exit Facility of at least $200.0 million will be available for the issuance of standby letters of credit and trade letters of credit. The revolving loan commitment will mature in 2012. The term A loans will mature in 2012. The term B loans will mature in 2014. After the effective date of the Exit Facility and subject to certain conditions, the term A loan may be increased by an amount not to exceed $100.0 million and the term B loan may be increased in an amount from $25 million to $400.0 million. The aggregate principal amount outstanding under the Exit Facility may not increase to greater than $1,850.0 million.
The revolving loans will bear interest at a per annum rate equal to one of the following rates, at PPC’s election:
| • | 3.50% plus the greater of: |
| • | the prime rate; |
| • | the average federal funds rate plus 0.5%; and |
| • | the one month LIBOR rate plus 1.0%; or |
| • | 4.50% plus the one, two, three or six-month LIBOR rate adjusted by the applicable statutory reserve. |
The term A and term B-1 loans will bear interest at a per annum rate equal to one of the following rates, at PPC’s election:
| • | 4.00% plus the greater of: |
| • | the prime rate |
| • | the average federal funds rate plus 0.5%; and |
| • | the one month LIBOR rate plus 1.0%, or |
| • | 5.00% plus the one, two, three or six-month LIBOR rate adjusted by the applicable statutory reserve. |
Interest on the term A loans will increase by 1.00% if such loans are not repaid within two years from the effective date of the Exit Facility and by an additional 1.00% if the loans are not repaid within two years and six months from such date. Upon repayment in full of the term A loans, the interest rate on the remaining loans shall decrease by 0.50%.
The term B-2 loan will bear interest at a per annum rate of 9.00%.
Availability. Availability under the Exit Facility is subject to a borrowing base, which is based on certain of the borrowers’ assets. The borrowing base consists of percentages of certain eligible accounts receivables, inventory, cash deposits and commodity brokerage accounts less certain reserves and payables.
Security and guarantees. Borrowings under the Exit Facility and the obligations relating to certain specified bank products and hedging agreements will be guaranteed by certain subsidiaries of PPC and be secured by a perfected first priority security interest in all assets, whether real or personal, tangible or intangible, subject to certain exceptions. In the case of certain foreign subsidiaries, PPC will pledge 100% of the non-voting capital stock and 65% of the voting capital stock.
152
Table of Contents
Covenants. The Exit Facility will contain customary representations and warranties and financial covenants, including a covenant that requires a minimum fixed charge coverage ratio of not less than 1.2 to 1.0. The fixed charge coverage ratio is defined as the ratio of EBITDA (as defined in the credit agreement) of PPC minus certain unfinanced capital expenditures and certain taxes paid in cash to fixed charges, as defined in the Exit Facility.
The Exit Facility will also require a leverage ratio on a rolling four quarter basis of not greater than 3.5 to 1.0 for the fiscal quarter ended December 27, 2009, 3.25 to 1.0 for the fiscal quarters ended March 28, 2010 and June 27, 2010, and 3.0 to 1.0 for each subsequent fiscal quarter. The leverage ratio is defined as the ratio of total indebtedness to EBITDA. PPC’s EBITDA is not calculated in the same manner as our EBITDA. PPC is expected to be in compliance with its leverage ratio upon the closing of the Proposed PPC Acquisition.
The Exit Facility will additionally require a consolidated tangible net worth of not less than the sum of 70% of PPC’s consolidated tangible net worth as of the effective date of the Exit Facility, and 50% of cumulative net income. Consolidated tangible net worth is defined as PPC’s shareholders’ equity minus intangible assets (as such terms are defined in the Exit Facility).
The Exit Facility will also contain negative covenants that limit the ability of PPC and its subsidiaries to, among other things:
| • | incur additional indebtedness; |
| • | create liens on property or assets; |
| • | dissolve, consolidate, merge, transfer substantially all assets, liquidate or change entity type or jurisdiction of organization; |
| • | make certain investments, loans, advances, guarantees and acquisitions; |
| • | sell transfer, lease or dispose of assets; |
| • | enter into sale/leaseback transactions; |
| • | enter into swap agreements; |
| • | make certain payments of indebtedness and management fees and other restricted payments (including dividends); |
| • | enter into transactions with affiliates; |
| • | enter into restrictive agreements; |
| • | prepay, cancel or amend certain indebtedness; |
| • | change fiscal year; and |
| • | make capital expenditures in an amount greater than $225.0 million during PPC’s 2010 fiscal year, $275.0 million during PPC’s 2011 fiscal year, and $350.0 million during PPC’s fiscal year 2012 and thereafter. |
Events of default.The Exit Facility will also contain customary events of default, including failure to make a payment, failure to make payments on other indebtedness, any event or condition that would permit acceleration of material debt, and certain events related to bankruptcy and insolvency.
153
Table of Contents
If an event of default occurs, the lenders under the Exit Facility may, among other things, terminate their commitments, declare all outstanding borrowings to be immediately due and payable together with accrued interest and fees, and exercise other rights and remedies under the loan documents.
Contractual obligations
The following table summarizes our contractual obligations as of December 28, 2008:
| in millions | 2009 | 2010 | 2011 | 2012 | 2013 | After year 5 | Total | ||||||||||||||
Contractual obligations: | |||||||||||||||||||||
Revolving credit facilities | $ | 67.0 | $ | — | $ | 114.7 | $ | — | $ | — | $ | — | $ | 181.7 | |||||||
Related party debt | — | 658.6 | — | — | — | — | 658.6 | ||||||||||||||
Deferred revenue | 46.1 | 18.0 | 18.0 | 18.0 | 18.0 | 83.2 | 201.3 | ||||||||||||||
Interest(1) | 59.8 | 54.2 | 12.1 | 6.3 | 6.0 | 15.8 | 154.2 | ||||||||||||||
Capital lease obligations | 3.2 | 3.0 | 2.6 | 2.3 | 2.4 | 13.2 | 26.7 | ||||||||||||||
Operating leases(2) | 17.4 | 13.4 | 11.0 | 4.9 | 4.1 | 5.1 | 55.9 | ||||||||||||||
Installment note payable | 1.3 | 1.3 | 0.9 | 0.9 | 6.9 | — | 11.3 | ||||||||||||||
Purchase obligations: | |||||||||||||||||||||
Livestock procurement(3) | 3,395.2 | 1,035.1 | 862.4 | 710.2 | 483.7 | 99.1 | 6,585.7 | ||||||||||||||
Cactus bonds(4) | 14.5 | — | — | — | — | — | 14.5 | ||||||||||||||
Other(5) | — | — | — | — | — | 16.2 | 16.2 | ||||||||||||||
Total contractual obligations | $ | 3,604.5 | $ | 1,783.6 | $ | 1,021.7 | $ | 742.6 | $ | 521.1 | $ | 232.6 | $ | 7,906.1 | |||||||
| (1) | Interest expense assumes the continuation of interest rates and outstanding borrowings under our credit facilities as of December 28, 2008. |
| (2) | Excludes amounts associated with operating leases having remaining non-cancelable lease terms of one year or less. |
| (3) | Represents hog and cattle purchase agreements with certain hog and cattle producers. The number of animals that we will be obligated to purchase is based on minimum quantity commitments to the extent the agreements contain those commitments, or management estimates based on past history for such hog and cattle purchases. The contracts are subject to market pricing at delivery. Due to the uncertainty of market prices at the time of future delivery we have estimated market prices based on futures contracts and applied those prices to all years. Cattle purchase agreements are short-term contracts with renewal options. Therefore, cattle purchase commitments have only been estimated through year one. See Note 13, “Commitments and contingencies” to our audited consolidated financial statements included in this prospectus. |
| (4) | On May 15, 2007, we entered into an Installment Bond Purchase Agreement with the City of Cactus, Texas, or the City. Under this agreement, we committed to purchase up to $26.5 million of bonds from the City, which are being issued to fund improvements to its sewer system, which is used by our beef processing plant located in Cactus, Texas. We will purchase the bonds in installments as improvements are completed through an anticipated date of June 2010. The interest rate on the bonds is six-month LIBOR plus 350 basis points. The bonds mature on June 1, 2032 and are subject to annual mandatory sinking fund redemption payments beginning on June 1, 2011. We have purchased $12.0 million in bonds as of December 28, 2008 and expect to purchase the remaining $14.5 million in 2009. |
| (5) | Includes certain obligations for capital expenditures and other insignificant purchase obligations. |
154
Table of Contents
The following table summarizes our contractual obligations as of September 27, 2009, without giving effect to the Proposed PPC Acquisition:
| in millions | 2009 | 2010 | 2011 | 2012 | 2013 | After year 5 | Total | ||||||||||||||
Contractual obligations: | |||||||||||||||||||||
Revolving credit facilities | $ | 29.9 | $ | — | $ | — | $ | — | $ | — | $ | — | $ | 29.9 | |||||||
11.625% senior unsecured notes due 2014 | — | — | — | — | — | 700.0 | 700.0 | ||||||||||||||
Related party debt | — | — | — | — | — | 95.1 | 95.1 | ||||||||||||||
Deferred revenue | 6.6 | 22.5 | 16.7 | 16.7 | 16.7 | 81.4 | 160.6 | ||||||||||||||
Interest(1) | 25.2 | 99.5 | 99.2 | 98.9 | 98.6 | 103.6 | 525.0 | ||||||||||||||
Capital lease obligations | 0.7 | 3.4 | 2.9 | 2.3 | 2.4 | 20.7 | 32.4 | ||||||||||||||
Operating leases(2) | 12.1 | 25.5 | 20.8 | 12.7 | 10.0 | 30.1 | 111.2 | ||||||||||||||
Installment note payable | 0.2 | 0.9 | 0.9 | 0.9 | 6.6 | — | 9.5 | ||||||||||||||
Purchase obligations: | |||||||||||||||||||||
Livestock procurement(3) | 2,591.7 | 982.0 | 756.6 | 680.8 | 464.7 | 107.9 | 5,583.7 | ||||||||||||||
Cactus bonds(4) | 8.5 | — | — | — | — | — | 8.5 | ||||||||||||||
Other(5) | — | — | — | — | — | 16.2 | 16.2 | ||||||||||||||
Total contractual obligations | $ | 2,674.9 | $ | 1,133.8 | $ | 897.1 | $ | 812.3 | $ | 599.0 | $ | 1,155.0 | $ | 7,272.1 | |||||||
| (1) | Interest expense assumes the continuation of interest rates and outstanding borrowings under our credit facilities as of September 27, 2009. |
| (2) | Excludes amounts associated with operating leases having remaining non-cancelable lease terms of one year or less. |
| (3) | Represents hog and cattle purchase agreements with certain hog and cattle producers. The number of animals that we will be obligated to purchase is based on minimum quantity commitments to the extent the agreements contain those commitments, or management estimates based on past history for such hog and cattle purchases. The contracts are subject to market pricing at delivery. Due to the uncertainty of market prices at the time of future delivery we have estimated market prices based on futures contracts and applied those prices to all years. Cattle purchase agreements are short-term contracts with renewal options. Therefore, cattle purchase commitments have only been estimated through year one. See Note 12, “Commitments and contingencies” to our unaudited consolidated financial statements included in this prospectus. |
| (4) | On May 15, 2007, we entered into an Installment Bond Purchase Agreement with the City of Cactus, Texas, or the City. Under this agreement, we committed to purchase up to $26.5 million of bonds from the City, which are being issued to fund improvements to its sewer system which is utilized by our beef processing plant located in Cactus, Texas. We will purchase the bonds in installments as improvements are completed through an anticipated date of June 2010. The interest rate on the bonds is six-month LIBOR plus 350 basis points. The bonds mature on June 1, 2032 and are subject to annual mandatory sinking fund redemption beginning on June 1, 2011. We have purchased $18.0 million in bonds as of September 27, 2009 and expect to purchase the remaining $8.5 million in 2009. |
| (5) | Includes certain obligations for capital expenditures and other insignificant purchase obligations. |
155
Table of Contents
The following table summarizes our contractual obligations, on a pro forma basis, as of September 27, 2009, giving effect to the Proposed PPC Acquisition:
| in millions | 2009 | 2010 | 2011 | 2012 | 2013 | After year 5 | Total | ||||||||||||||
Contractual obligations: | |||||||||||||||||||||
Revolving credit facilities | $ | 29.9 | $ | — | $ | — | $ | — | $ | — | $ | — | $ | 29.9 | |||||||
11.625% senior unsecured notes due 2014 | — | — | — | — | — | 700.0 | 700.0 | ||||||||||||||
Related party debt | — | — | — | — | — | 95.1 | 95.1 | ||||||||||||||
Deferred revenue | 6.6 | 22.5 | 16.7 | 16.7 | 16.7 | 81.4 | 160.6 | ||||||||||||||
Interest(1) | 25.2 | 99.5 | 99.2 | 98.9 | 98.6 | 103.6 | 525.0 | ||||||||||||||
Capital lease obligations | 0.7 | 3.4 | 2.9 | 2.3 | 2.4 | 20.7 | 32.4 | ||||||||||||||
Operating leases(2) | 12.1 | 25.5 | 20.8 | 12.7 | 10.0 | 30.1 | 111.2 | ||||||||||||||
Installment note payable | 0.2 | 0.9 | 0.9 | 0.9 | 6.6 | — | 9.5 | ||||||||||||||
Purchase obligations: | |||||||||||||||||||||
Livestock procurement(3) | 2,591.7 | 982.0 | 756.6 | 680.8 | 464.7 | 107.9 | 5,583.7 | ||||||||||||||
Cactus bonds(4) | 8.5 | — | — | — | — | — | 8.5 | ||||||||||||||
Other(5) | — | — | — | — | — | 16.2 | 16.2 | ||||||||||||||
PPC contractual obligations(6): | |||||||||||||||||||||
Exit Facility(7) | 12.5 | 50.0 | 100.0 | 732.8 | 50.0 | 625.0 | 1,570.3 | ||||||||||||||
Secured revolving credit facility (Mexico) | — | 41.1 | — | — | — | — | 41.1 | ||||||||||||||
Interest(8) | 28.7 | 113.8 | 107.9 | 98.6 | 47.3 | 32.9 | 429.2 | ||||||||||||||
Capital lease obligations | 0.1 | 0.4 | 0.2 | 0.1 | 0.1 | 0.6 | 1.5 | ||||||||||||||
Operating leases | 10.5 | 40.6 | 24.3 | 13.6 | 5.1 | 0.8 | 94.9 | ||||||||||||||
Purchase obligations: | |||||||||||||||||||||
Feed ingredients procurement(9) | 70.5 | 0.9 | — | — | — | — | 71.4 | ||||||||||||||
Capital expenditures | 20.2 | — | — | — | — | — | 20.2 | ||||||||||||||
Total contractual obligations | $ | 2,817.4 | $ | 1,380.6 | $ | 1,129.5 | $ | 1,657.4 | $ | 701.5 | $ | 1,814.3 | $ | 9,500.7 | |||||||
| (1) | Interest expense assumes the continuation of interest rates and outstanding borrowings under our credit facilities as of September 27, 2009. |
| (2) | Excludes amounts associated with operating leases having remaining non-cancelable lease terms of one year or less. |
| (3) | Represents hog and cattle purchase agreements with certain hog and cattle producers. The number of animals that we will be obligated to purchase is based on minimum quantity commitments to the extent the agreements contain those commitments, or management estimates based on past history for such hog and cattle purchases. The contracts are subject to market pricing at delivery. Due to the uncertainty of market prices at the time of future delivery we have estimated market prices based on futures contracts and applied those prices to all years. Cattle purchase agreements are short-term contracts with renewal options. Therefore, cattle purchase commitments have only been estimated through year one. See Note 12, “Commitments and contingencies” to our unaudited condensed consolidated financial statements included in this prospectus. |
| (4) | On May 15, 2007, we entered into an Installment Bond Purchase Agreement with the City of Cactus, Texas, or the City. Under this agreement, we committed to purchase up to $26.5 million of bonds from the City, which are being issued to fund improvements to its sewer system which is utilized by our beef processing plant located in Cactus, Texas. We will purchase the bonds in installments as improvements are completed through an anticipated date of June 2010. The interest rate on the bonds is six-month LIBOR plus 350 basis points. The bonds mature on June 1, 2032 and are subject to annual mandatory sinking fund redemption beginning on June 1, 2011. We have purchased $18.0 million in bonds as of September 27, 2009 and expect to purchase the remaining $8.5 million in 2009. |
| (5) | Includes certain obligations for capital expenditures and other insignificant purchase obligations. |
| (6) | The total amount of PPC’s unrecognized tax benefits at September 26, 2009 was $22.7 million. We did not include this amount in the contractual obligations table above as reasonable estimates cannot be made at this time of the amounts or timing of future cash outflows. |
156
Table of Contents
| (7) | Exit Facility assumes the following borrowings: (i) a three-year revolving credit facility of at least $600 million; (ii) a three year $375.0 million term loan A; and (iii) a five-year $775.0 million term loan B. |
| (8) | Interest expense assumes the continuation of interest rates and outstanding borrowings under PPC’s Exit Facility as of the effective date of such facility and assumes the continuation of interest rates and outstanding borrowings under PPC’s Mexican Credit Agreement as of September 26, 2009. |
| (9) | Includes agreements to purchase goods that are enforceable and legally binding on PPC and that specify all significant terms, including fixed or minimum quantities to be purchased; fixed, minimum or variable price provisions; and the approximate timing of each transaction. |
Off-balance sheet arrangements
As of September 27, 2009, we did not have any significant off-balance sheet arrangements as defined in Item 303(a)(4)(ii) of SEC Regulation S-K.
However, as of September 27, 2009, we did have the following guarantees and keepwell obligations that are not recorded on our balance sheet: (1) our guarantee of JBS S.A.’s 10.5% senior notes due 2016 described under “—Liquidity and capital resources—External sources of liquidity and description of indebtedness—Guarantee of 10.5% senior notes due 2016 of JBS S.A.” and (2) Five Rivers’ obligation under a keepwell agreement to pay up to $250.0 million of the obligations of J&F Oklahoma under J&F Oklahoma’s credit facility described in “Certain relationships and related party transactions—Arrangements with J&F Oklahoma—Guarantee of J&F Oklahoma revolving credit facility.”
Quantitative and qualitative disclosures about market risk
Market risk relating to our operations results primarily from changes in commodity prices, interest rates and foreign exchange rates, as well as credit risk concentrations. To address certain of these risks, we enter into various derivative transactions as described below. If a derivative instrument is accounted for as a hedge, as defined by Statement of Financial Accounting Standards, or SFAS, No. 133, “Accounting for Derivative Instruments and Hedging Activities,” as amended, or SFAS No. 133(R), depending on the nature of the hedge, changes in the fair value of the instrument either will be offset against the change in fair value of the hedged assets, liabilities or firm commitments through earnings, or be recognized in other comprehensive income (loss) until the hedged item is recognized in earnings. The ineffective portion of an instrument’s change in fair value, as defined by SFAS No. 133(R), is recognized immediately. Additionally, we hold certain positions, primarily in grain and livestock futures, that either do not meet the criteria for hedge accounting or are not designated as hedges. These positions are marked to market, and the unrealized gains and losses are reported in earnings at each reporting date. Changes in market value of derivatives used in our risk management activities relating to forward sales contracts are recorded in net sales. Changes in market value of derivatives used in our risk management activities surrounding inventories on hand or anticipated purchases of inventories are recorded in cost of sales.
The sensitivity analyses presented below are the measures of potential losses of fair value resulting from hypothetical changes in market prices related to commodities. Sensitivity analyses do not consider the actions we may take to mitigate our exposure to changes, nor do they consider the effects such hypothetical adverse changes may have on overall economic activity. Actual changes in market prices may differ from hypothetical changes.
157
Table of Contents
JBS USA Holdings, Inc. market risks
Commodity risk
We utilize various raw materials in our operations, including cattle, hogs, and energy, such as natural gas, electricity and diesel fuel, which are all considered commodities. We consider these raw materials generally available from a number of different sources and believe we can obtain them to meet our requirements. These commodities are subject to price fluctuations and related price risk due to factors beyond our control, such as economic and political conditions, supply and demand, weather, governmental regulation and other circumstances. Generally, we purchase derivatives in an attempt to mitigate price risk related to our anticipated consumption of commodity inputs for periods of up to 12 months. We may enter into longer-term derivatives on particular commodities if deemed appropriate. As of December 28, 2008 and September 27, 2009, we had derivative positions in place covering less than 1% and 2.7% of anticipated cattle needs and 0.9% and 6.6%, respectively, of anticipated hog needs, in the case of September 27, 2009 through December 2010.
We use derivatives for the purpose of mitigating exposure to market risk, such as changes in commodity prices and foreign currency exchange rates. We use exchange-traded futures and options to hedge livestock commodities. The fair value of derivative assets is recognized within other current assets, while the fair value of derivative liabilities is recognized within accrued liabilities. The fair value of derivatives at December 28, 2008 and September 27, 2009 are as follows:
| in thousands | As of December 28, 2008 | As of September 27, 2009 | |||||
Assets: | |||||||
Commodity derivatives | $ | 42,087 | $ | 18,193 | |||
Foreign currency rate derivatives | 12,002 | 6,138 | |||||
Total fair value, assets | 54,089 | 24,331 | |||||
Liabilities: | |||||||
Commodity derivatives | 16,392 | 8,414 | |||||
Foreign currency rate derivatives | 592 | 45,429 | |||||
Total fair value, liabilities | 16,984 | 53,843 | |||||
Net commodity derivatives | 25,695 | 9,779 | |||||
Net foreign currency rate derivatives | 11,410 | (39,291 | ) | ||||
Total net fair value | $ | 37,105 | $ | (29,512 | ) | ||
The balance of deferred derivative adjustments in accumulated other comprehensive income (loss), net of taxes at December 28, 2008 and September 27, 2009 was $(0.4) million and $(0.2) million, respectively. We anticipate these amounts will be transferred out of accumulated other comprehensive income (loss) and recognized in earnings over the next twelve months.
Interest rate risk
As of December 28, 2008 and September 27, 2009, we had fixed-rate debt of $19.0 million and $811.0 million, respectively, with a weighted average interest rate of 8.4% as of December 28, 2008 and 11.6% as of September 27, 2009. We have exposure to changes in interest rates on this
158
Table of Contents
fixed-rate debt. Market risk for fixed-rate debt is estimated as the potential increase in fair value resulting from a hypothetical 10% decrease in interest rates. A hypothetical 10% decrease in interest rates would have increased the fair value of our fixed-rate debt by approximately $32.9 million at September 27, 2009 and $0.4 million at December 28, 2008. The fair values of our debt were estimated based on quoted market prices and/or published market interest rates.
As of December 28, 2008 and September 27, 2009, we had variable rate debt of $859.3 million and $55.8 million, respectively, with a weighted average interest rate of 6.2% and 3.1%, respectively. A hypothetical 10% increase in interest rates effective at September 27, 2009, and December 28, 2008, would have increased annualized interest expense by approximately $0.2 million for the period ended September 27, 2009 and $5.3 million for the fiscal year ended December 28, 2008.
Foreign currency risk
We have foreign exchange gain/loss exposure from fluctuations in foreign currency exchange rates primarily as a result of a U.S. dollar-denominated intercompany note between two of our subsidiaries (the Australia subsidiary and its U.S. parent). The primary currency exchange rate to which we have exposure is the U.S. dollar to Australian dollar exchange rate due to: (1) our significant investment in our Australian subsidiaries and (2) sales denominated in currencies other than U.S. dollars. While we use foreign currency forward contracts to mitigate price risk on committed future deliveries, we have elected not to use foreign currency forward contracts to mitigate the risk related to our investment in Australia, primarily since the effect of these fluctuations is non-cash in nature and the purchase of forward contracts would have a cash cost. In addition, the definition of EBITDA used by our lending institutions eliminates foreign currency gains and losses prior to calculating covenant compliance. In the future we may elect to enter into forward contracts to mitigate this foreign currency risk.
Sensitivity analysis
The following sensitivity analysis table estimates our exposure to changes in the fair value of commodity price derivatives and foreign currency exchange rate derivatives at December 28, 2008 and September 27, 2009. The sensitivity analysis reflects the impact of a hypothetical 10% adverse change in the fair value of applicable commodity prices and foreign exchange currency rates and excludes the underlying items that are being hedged, such as future sales commitments or future livestock commitments.
| in thousands | As of December 28, 2008 | As of September 27, 2009 | |||||
Fair value: | |||||||
Commodity derivatives | $ | 25,695 | $ | 9,779 | |||
Foreign currency rate derivatives | 11,410 | (39,291 | ) | ||||
Total | 37,105 | (29,512 | ) | ||||
Estimated fair value volatility (-10%): | |||||||
Commodity derivatives | 17,680 | (59,986) | |||||
Foreign currency rate derivatives | 25,391 | (45,048) | |||||
Total | $ | 43,071 | $ | (105,034 | ) | ||
159
Table of Contents
PPC market risks
The risk inherent in PPC’s market risk-sensitive instruments and positions is primarily the potential loss arising from adverse changes in the price of feed ingredients, foreign currency exchange rates, interest rates and the credit quality of its available-for-sale securities as discussed below. The sensitivity analyses presented do not consider the effects that such adverse changes may have on overall economic activity, nor do they consider additional actions our management may take to mitigate our exposure to such changes. Actual results may differ.
Feed ingredients. PPC purchases certain commodities, primarily corn and soybean meal, for use as ingredients in the feed it either sells commercially or consumes in its live operations. As a result, PPC’s earnings are affected by changes in the price and availability of such feed ingredients. In the past, PPC has from time to time attempted to minimize its exposure to the changing price and availability of such feed ingredients using various techniques, including, but not limited to, (i) executing purchase agreements with suppliers for future physical delivery of feed ingredients at established prices and (ii) purchasing or selling derivative financial instruments such as futures and options.
Market risk is estimated as a hypothetical 10% increase in the weighted-average cost of PPC’s primary feed ingredients as of September 26, 2009. Based on PPC’s feed consumption during 2009, such an increase would have resulted in an increase to cost of sales of approximately $243.9 million, excluding the impact of any feed ingredients derivative financial instruments in that period. A 10% change in ending feed ingredients inventories at September 26, 2009 would be $8.0 million, excluding any potential impact on the production costs of PPC’s chicken inventories. As of September 27, 2008, the fair market value of the PPC’s open derivative positions related to commodities was an $18.0 million liability. During 2009, PPC liquidated its open derivative positions related to commodities and recognized a loss of $21.1 million.
Foreign currency. PPC’s earnings are affected by foreign exchange rate fluctuations related to the Mexican peso net monetary position of its Mexican subsidiaries. PPC manages this exposure primarily by attempting to minimize its Mexican peso net monetary position. PPC is also exposed to the effect of potential exchange rate fluctuations to the extent that amounts are repatriated from Mexico to the United States. However, PPC currently anticipates that the future cash flows of its Mexican subsidiaries will be reinvested in its Mexican operations. In addition, the Mexican peso exchange rate can directly and indirectly impact PPC’s financial condition and results of operations in several ways, including potential economic recession in Mexico because of devaluation of their currency. The impact on PPC’s financial position and results of operations resulting from a hypothetical change in the exchange rate between the U.S. dollar and the Mexican peso cannot be reasonably estimated. Foreign currency exchange gains and losses, representing the change in the U.S. dollar value of the net monetary assets of PPC’s Mexican subsidiaries denominated in Mexican pesos, was a loss of $0.1 million in 2009, a gain of $0.6 million in 2008 and a loss of $1.4 million in 2007. The average exchange rates for 2009, 2008 and 2007 were 13.49 Mexican pesos to 1 U.S. dollar, 10.61 Mexican pesos to 1 U.S. dollar and 10.95 Mexican pesos to 1 U.S. dollar, respectively. No assurance can be given as to how future movements in the Mexican peso could affect our future financial condition or results of operations.
Available-for-sale securities. PPC and certain retirement plans that it sponsors invest in a variety of financial instruments. In response to the continued turbulence in global financial markets, PPC has analyzed its portfolios of investments and, to the best of PPC’s knowledge, none of its
160
Table of Contents
investments, including money market funds units, commercial paper and municipal securities, have been downgraded because of this turbulence, and neither PPC nor any fund in which PPC participates hold significant amounts of structured investment vehicles, mortgage backed securities, collateralized debt obligations, auction-rate securities, credit derivatives, hedge funds investments, fund of funds investments or perpetual preferred securities. At September 26, 2009, the fair value of the PPC’s available-for-sale portfolio was $62.6 million. PPC’s management does not believe a hypothetical change in interest rates of 25 basis points or a 10% decrease in equity prices would be material to PPC.
Impact of inflation. Due to low to moderate inflation in the United States and Mexico and PPC’s rapid inventory turnover rate, the results of operations have not been significantly affected by inflation during the past three-year period.
161
Table of Contents
Overview of PPC
Formed in 1946 as a retail feed store partnership between Lonnie A. “Bo” Pilgrim and his brother, Aubrey E. Pilgrim, PPC has been a publicly traded company since 1986. PPC was incorporated in 1968 in Texas and reincorporated in 1986 in Delaware.
PPC is the indirect or direct parent company of various entities operating in the United States, including Puerto Rico, and in Mexico and other foreign jurisdictions. Business operations in the United States are carried out by PPC and PPC’s affiliates. Business operations in Mexico are conducted through subsidiaries organized under the laws of Mexico.
PPC acquired WLR Foods, Inc. in 2001 and the chicken division of ConAgra Foods, Inc., or ConAgra, in 2003. In December 2006, PPC acquired a majority of the outstanding common stock of Gold Kist Inc., or Gold Kist, through a tender offer. PPC acquired the remaining shares of Gold Kist in January 2007, making Gold Kist its wholly-owned subsidiary.
On December 1, 2008, following significant increases in the commodity costs of feed ingredients, increases in costs of energy, an oversupply of chicken products, increased leverage, lack of liquidity and an overall downturn in the U.S. and world economies, PPC and six of its subsidiaries filed voluntary petitions in the United States Bankruptcy Court for the Northern District of Texas, Fort Worth Division seeking reorganization relief under the Bankruptcy Code.
PPC’s headquarters are located in Pittsburg, Texas. Prior to seeking protection under the bankruptcy laws, PPC owned 34 processing plants and 12 prepared-food production facilities in the United States, and three processing plants in Mexico. In the United States, the processing plants were supported by 43 hatcheries, 32 feed mills and 12 rendering plants. In Mexico, the processing plants were supported by six hatcheries, four feed mills and two rendering plants.
Prior to seeking protection under the bankruptcy laws, PPC contracted with more than 5,500 growers working on almost 6,000 farms, many of whom are small farm owners who either raise and care for the chickens PPC uses for breeding or who grow the broiler chickens from hatchlings until they are ready to be processed. PPC maintains title to and ownership of the chickens and feed ingredients fed to them, but PPC contracts with growers to administer feed and tend to the chickens used for breeding and for the broiler chickens until they reach certain targeted weights. The growers are independent contractors. The growers own, operate and provide the farms, the chicken houses, equipment, utilities and labor necessary to tend the chickens. Once the broiler chickens have reached a certain weight and meet other specifications, these chickens are returned to PPC to be processed, packaged and transported to customers.
Under the Pilgrim’s Pride brand name, PPC’s fresh chicken retail line is sold throughout the United States, throughout Puerto Rico, and in the northern and central regions of Mexico. PPC’s prepared chicken products meet the needs of some of the largest customers in the foodservice industry across the United States. Additionally, PPC exports commodity chicken products to approximately 80 countries on six continents.
162
Table of Contents
During the fiscal year ended September 26, 2009, PPC sold 7.2 billion pounds of dressed chicken, and its net sales totaled $7.1 billion. Approximately 92.7% of PPC’s sales were attributed to its U.S. operations while 7.3% was attributed to its operations in Mexico. Of PPC’s U.S. chicken sales of $6.6 billion, approximately 65% was sold to foodservice, 24% to retail, and the remaining 11% to export and other channels in Mexico.
PPC believes a key element of its long-term business strategy is to focus its growth efforts on the historically higher-value prepared chicken products and become a recognized industry leader in this market. Accordingly, PPC has focused its sales efforts on the foodservice industry, principally chain restaurants and food processors.
Stock purchase agreement
The Plan is premised on a transaction with us, the Proposed PPC Acquisition, whereby we will purchase 64% of the reorganized PPC common stock in exchange for $800 million in cash. The cash consideration provided as part of the Proposed PPC Acquisition is to be used by the reorganized PPC to, among other things, fund distributions to holders of allowed claims under the Plan. The terms of the Proposed PPC Acquisition are set forth in the stock purchase agreement. A summary of the terms of the stock purchase agreement is as follows:
| • | Upon the closing of the Proposed PPC Acquisition (which we expect to occur by December 28, 2009, or the Proposed PPC Acquisition Closing Date, holders of PPC common stock will become entitled to receive, for each share of PPC common stock held by them (other than treasury shares and unvested restricted shares), one share of the reorganized PPC common stock. Upon the Proposed PPC Acquisition Closing Date, the former PPC stockholders will collectively own an aggregate of 36% of the reorganized PPC common stock. |
| • | Until the Proposed PPC Acquisition Closing Date, subject to certain exceptions, PPC must conduct its business in a reasonable manner consistent with past practice and must obtain our consent for certain enumerated actions. |
| • | We and PPC will work together to determine the contracts to be assumed by the reorganized PPC on the Proposed PPC Acquisition Closing Date and to resolve objections, if any, to certain cure amounts for assumed contracts. |
| • | We and PPC will use our reasonable best efforts in good faith cooperation with each other to obtain listing of the reorganized PPC common stock on the New York Stock Exchange. |
| • | For a period of six years after the Proposed PPC Acquisition Closing Date, the reorganized PPC will indemnify the present and former directors and officers of PPC and its subsidiaries from all liabilities arising in connection with their service as directors and officers. |
| • | We will, or will cause the reorganized PPC to, after the Proposed PPC Acquisition Closing Date, honor certain severance, change in control and other employment agreements. |
| • | We and PPC will work together to obtain all authorizations, consents and approvals of governmental authorities, including under antitrust laws, necessary to consummate the Proposed PPC Acquisition. |
163
Table of Contents
| • | The stock purchase agreement contains certain conditions to each of PPC’s and our obligations to consummate the Proposed PPC Acquisition, which include (i) the absence of a breach of the representations, warranties and covenants contained in the stock purchase agreement, which, in the case of PPC, would or would be reasonably expected to cause a material adverse effect (without giving effect to any exception relating to materiality or a material adverse effect (as defined in the stock purchase agreement)), or in the case of us, would be a material breach, (ii) entry by the bankruptcy court of a confirmation order approving the Proposed PPC Acquisition, (iii) expiration or termination of waiting periods for antitrust laws or satisfaction of any related requirements, (iv) absence of an enacted order or law prohibiting the consummation of the Proposed PPC Acquisition, and (v) absence of a threatened order or law that would have the effect of prohibiting the consummation of the Proposed PPC Acquisition and is reasonably likely to cause a material adverse effect. In addition to the conditions specified above, the conditions to our obligations to consummate the Proposed PPC Acquisition include (i) absence of a material adverse effect and (ii) the satisfaction or waiver of the conditions precedent in respect of the Exit Facility described in “Management’s discussion and analysis of financial condition and results of operations—Liquidity and capital resources—Financing related to the Proposed PPC Acquisition” for a commitment of up to $1,750.0 million and the reorganized PPC’s access to funding thereunder. |
| • | The stock purchase agreement may be terminated prior to the Proposed PPC Acquisition Closing Date upon the following events: (i) by either party if the other party has breached and is unable to cure certain of its representations, warranties and covenants contained in the stock purchase agreement, (ii) by us if certain milestones are not met with respect to the filing of the Plan and related disclosure statement with the bankruptcy court or the entry of the Plan sponsor order, (iii) by either party if certain milestones are not met with respect to the entry of the disclosure statement order or the confirmation order, (iv) by either party if the Proposed PPC Acquisition is not consummated prior to March 31, 2010 (or May 1, 2010 if the parties are awaiting antitrust approvals), (v) by PPC, if it determines to enter into an agreement with respect to a superior proposal, (vi) by either party upon the issuance of an order prohibiting the consummation of the Proposed PPC Acquisition or (vii) by mutual written consent of the parties. |
| • | If PPC terminates the stock purchase agreement due to its receipt of a superior proposal, then PPC will be required to pay a $45 million termination fee to us along with an additional $5 million as reimbursement of expenses. |
On September 17, 2009, PPC filed a motion with the bankruptcy court seeking entry of an order approving certain provisions of the stock purchase agreement. On October 7, 2009, the bankruptcy court granted the motion and approved certain provisions of the stock purchase agreement. PPC has also sought approval of the remaining portions of the stock purchase agreement as part of the approval of its amended joint plan of reorganization. On October 14, 2009, the Proposed PPC Acquisition received antitrust clearance from the Federal Trade Commission Bureau of Competition and the U.S. Department of Justice.
On October 22, 2009, PPC received approval from the bankruptcy court to begin soliciting stockholder acceptance of its proposed amended joint plan of reorganization. On December 10, 2009, the bankruptcy court entered an order confirming PPC’s amended joint plan of reorganization.
A copy of the stock purchase agreement is filed as Exhibit 2.1 to the registration statement of which this prospectus is a part.
164
Table of Contents
Conversion of reorganized PPC common stock into our common stock
In the event we complete this offering or any other initial public offering of our common stock and the offered shares are listed on a national securities exchange, then, at any time during an exchange window (as defined below) falling within the period commencing on the date of the closing of this offering or such other offering and ending two years and 30 days from the Proposed PPC Acquisition Closing Date, we will have the right to deliver written notice of the mandatory exchange of all the reorganized PPC common stock, or the Mandatory Exchange Transaction, to the reorganized PPC at its principal place of business. Upon delivery to the reorganized PPC of notice of the Mandatory Exchange Transaction, each share of the reorganized PPC common stock held by stockholders other than us will automatically, without any further action on behalf of the reorganized PPC or any of those holders, be exchanged for a number of duly authorized, validly issued, fully paid and non-assessable shares of our common stock equal to the Exchange Offer Ratio (as defined below). An “exchange window” is a period of time beginning on the sixth trading day after the first day on which both the reorganized PPC and us will have each made public our respective annual or quarterly reports or earnings releases relating to the immediately preceding fiscal year or quarter, as applicable, and ending on the last day of the fiscal quarter during which the first day of the exchange window fell.
The Exchange Offer Ratio is a fraction, the numerator of which is the average volume-weighted daily trading price per share on the principal securities exchange for the reorganized PPC common stock and the denominator of which is the average volume-weighted daily trading price per share on the principal securities exchange for our common stock, in each case, for the applicable measurement period. The measurement period will be a number of consecutive trading days which is equal to twice the number of consecutive trading days between (i) the first date on which both we and the reorganized PPC shall have both made respective annual or quarterly reports or earnings releases, as applicable and (ii) the date on which we deliver to the reorganized PPC the notice of the Mandatory Exchange Transaction. For example, based on an assumed average volume-weighted daily trading price of $ per share of reorganized PPC common stock for the measurement period (which represents the closing price of PPC’s common stock on ) as the numerator and the midpoint of the expected initial public offering price of $ per share of our common stock as the denominator, each stockholder of the reorganized PPC common stock, other than us, would be entitled to receive shares of our common stock.
Stockholders agreement
On the Proposed PPC Acquisition Closing Date, we and the reorganized PPC will enter into a stockholders agreement, or the Stockholders Agreement, which will set forth certain rights with respect to the reorganized PPC common stock, corporate governance and other related corporate matters. A summary of the terms of the Stockholders Agreement is as follows:
| • | Until the expiration of the standstill period on the date that is two years and 30 days after the Proposed PPC Acquisition Closing Date, we and our affiliates will be prohibited from acquiring, directly or indirectly, any shares of the reorganized PPC common stock, except (i) by way of stock splits, stock dividends, reclassifications, recapitalizations, or other distributions by the reorganized PPC to all holders of the reorganized PPC common stock on a pro rata basis, (ii) pursuant to the Mandatory Exchange Transaction or (iii) repurchases by PPC of the reorganized PPC common stock from minority investors if certain conditions are met. |
165
Table of Contents
| • | In accordance with the Plan, the Stockholders Agreement provides that the initial board of directors of the reorganized PPC will consist of nine directors: (i) six directors designated by us, or the JBS Directors, (ii) two directors designated by an equity committee, or the Equity Directors and (iii) the Founder Director, who, at the Proposed PPC Acquisition Closing Date, will initially be Lonnie A. “Bo” Pilgrim. The Stockholders Agreement contains terms regarding the appointment and removal of directors, the requirement for certain directors to be “independent” for purposes of applicable SEC rules and exchange listing requirements and the change in the size of the board of directors or relative numbers of JBS Directors and Equity Directors in the event that the respective parties’ ownership percentages change or changes in applicable law or exchange listing requirements. If our ownership percentage in the reorganized PPC increases to 90% or above, the minority stockholders will no longer have the right to elect the Equity Directors. |
| • | The Stockholders Agreement requires the approval of at least a majority of the Equity Directors and any Founder Director, as a group, for certain actions, including the amendment or repeal of certain provisions of our restated certificate of incorporation or the amended and restated bylaws or amendments that would or could reasonably be expected to adversely affect, in any material respect, the rights of the stockholders other than us and our affiliates, or the minority investors. |
| • | The Stockholders Agreement provides that we will cause all shares of the reorganized PPC common stock beneficially owned by us or our affiliates to (i) be voted in the same proportion as the shares of the reorganized PPC common stock held by the minority investors are voted with respect to (A) the election or removal of Equity Directors and (B) proposals to amend the bylaws that would adversely affect, or could reasonably be expected to adversely affect, in any material respect, the rights of the minority investors, as a class, and (ii) be voted for the election, or against the removal, of the Founding Director until the Founding Director is no longer on the board of directors. With respect to all other matters submitted to a vote of holders of the reorganized PPC common stock, we may vote, or abstain from voting, in our sole and absolute discretion. |
| • | The Stockholders Agreement contains certain covenants designed to cause the Mandatory Exchange Transaction to be consummated as a tax-free transaction. |
| • | The Stockholders Agreement requires us and the reorganized PPC to use our respective commercially reasonable efforts to maintain the listing of the reorganized PPC common stock on a national securities exchange. However, neither we and our affiliates nor the reorganized PPC will be obligated to ensure that the share price or market value of the reorganized PPC common stock is sufficient to maintain such listing. |
| • | The Stockholders Agreement may be terminated (i) by written agreement of the parties, (ii) on the consummation of the Mandatory Exchange Transaction or (iii) in the event that we own 100% of the reorganized PPC common stock, subject to the survival of certain covenants related to the preservation of tax-free treatment for the Mandatory Exchange Transaction. |
| • | The Equity Directors will have the exclusive authority to exercise the reorganized PPC’s rights under the Stockholders Agreement. |
A copy of the Stockholders Agreement is filed as Exhibit 2.2 to the registration statement of which this prospectus is a part.
166
Table of Contents
Plan support agreement
On September 16, 2009, we and Mr. Lonnie A. “Bo” Pilgrim entered into a plan support agreement, or the PSA. Under the PSA, Mr. Pilgrim agreed, among other things, to:
| • | support the Plan and the stock purchase agreement; |
| • | not support any action, agreement or proposal that would result in a breach of any covenant, representation or warranty or any other obligation or agreement of PPC under the stock purchase agreement that could result in any of the conditions to PPC’s obligations under the stock purchase agreement not being fulfilled; and |
| • | support any other matter necessary to the consummation of the transactions (as defined in the PSA). |
Nothing in the PSA limits or affects any actions taken by the Mr. Pilgrim in his capacity as a director or officer of PPC or the reorganized PPC or any of its subsidiaries.
A copy of the PSA is filed as Exhibit 2.3 to the registration statement of which this prospectus is a part.
Change in control agreements
PPC entered into change in control agreements with (i) each of Lonnie Ken Pilgrim, Richard A. Cogdill and certain other key officers in October 2008 and (ii) each of Don Jackson and certain other key officers in September 2009, some of which will be assumed by us on the Proposed PPC Acquisition Closing Date (collectively, the Change in Control Agreements). The Change in Control Agreements have an initial term of three years, except in the case of Mr. Jackson’s agreement which has an initial term that expires December 31, 2011. The Change in Control Agreements have two triggers: (1) a change in control or the Change in Control and (2) involuntary termination with PPC. The change of ownership of PPC pursuant to the Plan will qualify as the first trigger.
Generally, the Change in Control Agreements provide that, except in the case of Dr. Jackson, any stock options and other equity awards held by the executives will become fully vested and exercisable upon a Change in Control (however, no such awards will be outstanding as of the Change in Control) and that, if PPC terminates an executive’s employment for reasons other than “cause” or if the executive resigns for “good reason” (as these terms are defined in the Change in Control Agreements) within a specified employment period following a Change in Control, then the executive will be entitled to certain severance benefits. The employment period is 24 months in the case of Mr. Pilgrim and Dr. Jackson and 18 months in the case of Mr. Cogdill. Upon the termination of an executive’s employment during the employment period, the Change in Control Agreements provide:
| • | for a lump sum severance payment that includes the executive’s target annual bonus for the fiscal year in which the termination occurs, prorated through the date of termination, and an amount based on the sum of the executive’s annual base salary and target annual bonus, multiplied by 3.0 in the case of Mr. Pilgrim and Dr. Jackson and by 2.5 in the case of Mr. Cogdill. |
| • | that the executives may be entitled to receive a tax gross-up payment to compensate them for specified excise taxes, if any, imposed on payments that may be subject to an excise tax. |
| • | up to 18 months of PPC-paid COBRA premiums. |
167
Table of Contents
| • | in the case of Dr. Jackson, any stock option and other equity awards held by him will become fully vested and exercisable. |
In addition, the Change in Control Agreements provide that, for a period of 24 months in the case of Mr. Pilgrim and Dr. Jackson and 18 months in the case of Mr. Cogdill, from the date of any termination of the executive’s employment that results in a severance payment under the executive’s Change in Control Agreement, the executive will not (a) divulge confidential information regarding PPC, (b) solicit or induce employees of PPC to terminate their employment with PPC, or (c) seek or obtain any employment or consulting relationship with any specified competitor of PPC.
The following table sets forth the name of the executive officers and directors of PPC that are party to Change in Control Agreements, their position, the salary paid to such executive or director for PPC’s fiscal year that ended September 26, 2009, the executive’s or director’s target annual bonus, the total amount of such executive’s or director’s salary and bonus, the percentage multiplier and the total amount to be paid to such executive or director upon a Change in Control if an executive or director is terminated for reasons other than “cause” or if the executive or director resigns for “good reasons” within a specified employment period:
| Name | Position | Base Pay September 26, 2009 ($) | Target Annual Bonus (%) | Base Pay plus Bonus ($) | % Multiplier (%) | Total ($) | ||||||
Lonnie “Bo” Pilgrim | Chairman of the Board | |||||||||||
Don Jackson | President and Chief Executive Officer | |||||||||||
Richard Cogdill | Chief Financial Officer | |||||||||||
Lonnie “Ken” Pilgrim | Senior Vice President of Transportation | |||||||||||
In addition to the Change in Control Agreements described above, on the Proposed PPC Acquisition Closing Date, PPC expects to enter into change in control or severance agreements with certain other employees, as agreed with us.
Employment agreement with Don Jackson
Pursuant to the Plan, reorganized PPC will assume the employment agreement that PPC entered into with Don Jackson as chief executive officer and president on January 27, 2009. The employment agreement has a term of three years, but it may be extended with the mutual written consent of the parties. The material terms of the employment agreement with Dr. Jackson are as follows:
| • | The annual base salary for Dr. Jackson will not be less than $1.5 million during the term of the agreement. |
| • | Dr. Jackson received a sign-on bonus in the amount of $3.0 million, or the Sign-on Bonus, that is subject to repayment on a pro-rata basis over a three year period under specified conditions, or the Sign-on Bonus. |
| • | Upon the attainment of certain performance targets, an equity award of up to 3,085,656 shares of PPC’s common stock, or the Stock Grant, which was received by Dr. Jackson as a sign-on stock grant, vested following confirmation of the Plan and Dr. Jackson is entitled to receive up to $2.0 million as a reorganization bonus. |
168
Table of Contents
| • | If the employment agreement is terminated other than for “cause” by PPC or its successor or with “good reason” by Dr. Jackson during the term, any remaining unforgiven amount of the Sign-on Bonus will be immediately forgiven. |
| • | If Dr. Jackson terminates his employment without “good reason” (as such term is defined in the employment agreement) during the term of his employment agreement, he will be required to repay PPC any remaining unforgiven amount of the Sign-on Bonus, and the unvested portion of his Stock Grant will forfeit. |
| • | If PPC or its successor terminates the executive’s employment for “cause” (as such term is defined in the employment agreement) during the term, Dr. Jackson will have any remaining unforgiven amount of the Sign-on Bonus immediately forgiven and the unvested portion of his Stock Grant will forfeit. |
| • | After the date of the termination of Dr. Jackson, he may not solicit or induce employees of PPC to terminate their employment with PPC during the 24-month period following the date of employment termination or seek or obtain any employment or consulting relationship with any specified competitor of PPC during the applicable restricted period. |
2009 performance bonus plan
During the bankruptcy proceedings, PPC’s board of directors approved an incentive plan for the fiscal year 2009 for approximately 80 employees and executives, including senior vice presidents and above (who currently are not included in any incentive plan), vice presidents, complex managers and select manager-level employees tasked with assisting PPC in the bankruptcy proceedings to incentivize these key employees to see PPC through a successful exit from bankruptcy. The amounts to be paid to the key employees are linked to PPC’s earnings before interest, taxes, depreciation, amortization and restructuring costs in the third and fourth quarters of PPC’s fiscal 2009 and the successful emergence of PPC from bankruptcy (participants are also required to still be employed on the date immediately preceding PPC’s emergence from bankruptcy). Key employees eligible to receive payments under this incentive plan who also participate in PPC’s performance incentive plan or who are parties to the key employee incentive compensation agreements will receive only the highest amount payable under any of the three arrangements. On September 29, 2009, the bankruptcy court entered an order approving the incentive plan for key employees.
169
Table of Contents
Overview
JBS USA Holdings, Inc. is one of the world’s largest beef and pork processing companies with approximately $15.4 billion in net sales for the fiscal year ended December 28, 2008 on a pro forma basis (excluding the net sales for the Proposed PPC Acquisition). In terms of daily slaughtering capacity, we are among the leading beef and pork processors in the United States and we believe we are the number one processor of beef in Australia. We also believe we own and operate the largest feedlot business in the United States, and upon consummation of the Proposed PPC Acquisition, we will be one of the largest chicken producers in the United States in terms of daily processing capacity.
We process, package and deliver fresh, processed and value-added beef, pork, lamb and mutton products to customers in over 60 countries on six continents. Our operations supply fresh meat products, processed meat products and value-added meat products. Fresh meat products include refrigerated beef and pork processed to standard industry specifications and sold primarily in boxed form. Our processed meat offerings, which include beef and pork products, are cut, ground and packaged to meet customer specifications. Our value-added products include moisture-enhanced, seasoned, marinated and consumer-ready products.
We sell our products primarily to retail customers, such as grocery store chains, wholesale clubs and other retail distributors and foodservice customers (such as foodservice distributors, further processors and chain restaurants). We also produce and sell by-products derived from our meat processing operations, such as hides and variety meats, to customers in the clothing, pet food and automotive industries, among others.
Pilgrim’s Pride operates as a vertically integrated company and controls every phase of the production of its products, including feed mills, hatcheries, processing plants and distribution centers in 14 U.S. states, Puerto Rico and Mexico. We will produce both fresh and prepared chicken products for sale to customers in retail, foodservice and international distribution channels in over 80 countries on six continents. Our fresh chicken products will include refrigerated whole and cut-up chickens and prepackaged case-ready chicken. Case-ready chicken includes various combinations of freshly refrigerated whole chickens and chicken parts ready for the retail grocer’s fresh meat counter. Our prepared chicken products will include refrigerated and frozen portion-controlled breast fillets, tenderloins and strips, delicatessen products and salads, formed nuggets and patties, and bone-in chicken parts. Our prepared chicken products may be fully cooked, partially cooked or raw and will include breaded and marinated products.
We are a wholly owned indirect subsidiary of JBS S.A., the world’s largest beef producer, which, including our operations, has a daily slaughtering capacity of 73,940 cattle. In the thirty-nine weeks ended September 27, 2009, we represented approximately 76% of JBS S.A.’s gross revenues. Over the past few years, JBS S.A. has acquired several U.S. and Australian beef and pork processing companies which now comprise JBS USA Holdings, Inc. and its subsidiaries. We describe our corporate history below under “Corporate history.”
In the United States, we conduct our operations through eight beef processing facilities, three pork processing facilities, one lamb processing facility, one case-ready beef and pork facility, one hide tannery, seven leased regional distribution centers, two grease-producing facilities, and 13 feedlots operated by Five Rivers, which supply approximately 24% of the cattle we process. In
170
Table of Contents
Australia, we operate ten beef and small animal processing facilities, including the technologically advanced Dinmore facility, which is the largest in the country, and five feedlots that supply approximately 16% of the cattle we process. Our small animal processing facilities in Australia process hogs, lamb and sheep, or smalls. Our Australian facilities are strategically located to source cattle at a low cost and efficiently serve our global customer base in Asia and elsewhere. We have the capacity to process approximately 28,600 cattle, 48,500 hogs and 4,500 lambs daily in the United States and 8,690 cattle and 15,000 smalls daily in Australia based on our facilities’ existing configurations.
Upon the consummation of the Proposed PPC Acquisition, we anticipate that we will have the capacity to process 7.6 million broiler chickens per day and will conduct our chicken operations through 29 chicken processing facilities, supported by 31 feed mills, 41 hatcheries and 11 rendering facilities, nine further processing facilities, and three pet food facilities. In addition, the Proposed PPC Acquisition will expand our distribution capabilities by adding five regional distribution centers in the United States, eight distribution centers in Mexico and one distribution center in Puerto Rico.
Our business operations are currently organized into two segments:
| • | our Beef segment, through which we conduct our domestic beef processing business, including the beef operations we acquired in the JBS Packerland Acquisition, and our international beef, lamb and sheep processing businesses that we acquired in the Tasman Acquisition; and |
| • | our Pork segment, through which we conduct our domestic pork and lamb processing business. |
Upon consummation of the Proposed PPC Acquisition, we will report Chicken as a third and separate segment in our consolidated financial statements for periods following the consummation of the Proposed PPC Acquisition. The domestic and international chicken processing operations of Pilgrim’s Pride will comprise our Chicken segment.
Industry overview
Beef
United States
Beef products are the largest segment of the U.S. retail protein market and, according to the United States Department of Agriculture, or the USDA, represented $76 billion of retail equivalent sales in 2008. The United States has the largest grain-fed cattle industry in the world and is the world’s largest producer of beef, which is primarily high-quality grain-fed beef for domestic and export use. In 2008, the United States processed 34.4 million head of cattle and produced 26.6 billion pounds of beef. The domestic beef industry is characterized by daily price changes based on seasonal consumption patterns and overall supply and demand for beef and other proteins in the United States and abroad. Cattle prices vary over time and are impacted by inventory levels, the production cycle, weather and feed prices, among other factors.
Beef processors include vertically integrated companies, who own and raise cattle on feed for use in their processing facilities, and pure processors, who do not own cattle on feed. The four largest U.S. beef processors, which comprise 75% of top 30 U.S. beef processors’ capacity, according to Cattle Buyer’s Weekly, operate predominantly as pure processors. Pure U.S. beef processors generally purchase cattle in the spot market or pursuant to market-priced supply arrangements from feedlot operators, process the cattle in their own facilities and sell the beef
171
Table of Contents
at spot prices. Cattle are usually purchased at market prices and held for less than a day before processing. Thus, such processors are typically exposed to changing market prices for less than two weeks. Pure beef processors are primarily “spread” operators, and their operating profit is largely determined by plant operating efficiency rather than by fluctuations in the prices of cattle and beef. In the United States, we operate as a pure beef processor.
During the past few decades, consumer demand for beef products in the United States has been driven by population growth, which is the primary driver of aggregate demand. Historically, consumer demand for beef products in the United States has remained relatively stable during economic downturns, and has also remained relatively stable during the current recession. We believe that consumer demand for U.S. exports in developing countries is driven by population growth compounded by economic growth. As consumers’ economic circumstances improve, they increasingly shift their diets to protein. Export demand has varied, but demand has grown since the reopening of certain international markets in 2005, which had been closed to U.S. beef due to the discovery of isolated cases of bovine spongiform encephalopathy, or BSE (also commonly referred to as mad cow disease) in 2003. U.S. beef exports reached $3.0 billion in 2008, an increase of over 35% from 2007, according to the USDA, and exports have remained relatively stable in 2009, despite the global economic downturn.
Between 2006 and January 2008, our largest U.S. beef competitor eliminated two million head per year of slaughter capacity in four plants. This represented a reduction of nearly 7% of total U.S. industry-wide capacity and has helped improve the supply/demand balance of beef in the United States and export markets. We believe that, along with our competitors, we have benefited from the improved supply/demand balance of beef in the United States and export markets as this elimination of slaughter capacity created more stability in the industry. We currently do not expect the industry to experience a material increase in capacity for the foreseeable future.
Australia
Australia has traditionally been a supplier of grass-fed beef. Grass is a much cheaper feed source than grain. With the vast amount of land in Australia available for cattle raising and feeding, grazing is the predominant feeding method. The majority of cattle slaughtered in Australia are range or grass-fed and not finished in feedlots. Australia also has a grain-fed beef cattle sector that primarily supplies processed cattle for export to Japan and South Korea and to the domestic market. Grain-fed cattle accounted for 27% of the adult cattle slaughtered in 2008, representing 34% of total beef production in Australia. We have chosen to be vertically integrated in Australia in order to supply higher margin products, such as Kobe-style beef, to customers in Asian markets. Australia has been one of the leading beef export countries for more than a decade. We believe that approximately 75% of exports have historically been sold to the United States, Japan and South Korea, but exports of Australian beef have been increasing to Russia, Taiwan, Indonesia, Chile and the United Arab Emirates, among other countries. Australian meat packers, including our Australian operations, benefited from the closure of many markets to U.S. beef as a result of isolated BSE detections in U.S. cattle. However, Australian exports have remained strong following the reopening of international markets to U.S. beef.
Global exports
We sell our beef products in over 60 countries on six continents, and exports of beef products accounted for approximately 28% of our sales in 2008 on a pro forma basis and 32% of our sales
172
Table of Contents
for the thirty-nine weeks ended September 27, 2009. The international beef market is divided into two trading blocks based on factors that include common sanitary criteria, such as restrictions on imports of fresh beef from countries that permit foot-and-mouth disease (also known as FMD) vaccination programs and the use of growth hormones. The European Union has banned imports of beef treated with growth hormones, but permits the use of FMD vaccines. Asian markets permit the use of growth hormones, but do not allow imports of beef from areas that are not FMD-free.
The United States has been an FMD-free country since the eradication of the disease in 1929, and it does not implement vaccination programs. However, the United States treats most of their cattle with growth hormones. Accordingly, the primary export markets for U.S. beef are Asia and Mexico. The Brazilian and Argentine operations of our parent, JBS S.A., are a large exporter of beef to the European Union because South American beef is not treated with growth hormones. However, as FMD has yet to be eradicated from Brazil and Argentina, South American beef cannot be exported to Asia. Australia has eradicated FMD and does not use growth hormones, allowing Australian beef to serve all markets.
Pork
Pork products are the most widely consumed meat in the world by volume. Pork is the third largest consumed source of meat protein in the United States, behind chicken and beef. The United States is the third largest producer and consumer of pork worldwide, behind China and the European Union. The United States is also the largest exporter of pork products, according to the USDA.
The domestic pork industry is characterized by daily price changes based on seasonal consumption patterns and overall supply and demand for pork and other meats in the United States and abroad. Generally, domestic and worldwide consumer demand for pork products drive pork processors’ long-term demand for hogs. Pork processors’ profitability is driven primarily by their ability to acquire or raise hogs cost effectively and minimize processing costs by maximizing plant efficiency. Hog prices vary over time and are impacted by inventory levels, the production cycle, weather and feed prices, among other factors.
Pork processors include vertically integrated companies, which own and raise hogs on feed for use in their processing facilities, and pure processors, who do not own hogs on feed. Pure processors generally purchase finished hogs under long-term supply contracts at prevailing market prices, process the hogs in their own facilities and sell the finished products at spot prices. Finished hogs are typically purchased at market prices and held for less than one day before processing. Thus pure processors are typically exposed to changing market prices for less than two weeks. Pure pork processors are primarily “spread” operators, and their operating profit is largely determined by plant operating efficiency and not by fluctuations in the prices of hogs and pork. Our U.S. pork operations function as pure pork processors.
While affected by seasonal consumption patterns, demand for pork has remained consistently strong. During the past few decades, we believe population growth has been the primary driver of increased aggregate pork product demand in the United States. We believe that consumer demand for U.S. exports in developing countries is driven by population growth compounded by economic growth. As consumers’ economic circumstances improve, they increasingly shift their diets to protein. To satisfy the growing global demand, U.S. pork exports have more than tripled in the past decade to four billion pounds, according to the USDA. The top three leading export markets for U.S. pork and pork variety meats are Japan, Mexico and Canada.
173
Table of Contents
Chicken
The poultry industry is comprised principally of chicken and turkey products. Chicken products are the most consumed source of meat protein in the United States and second most consumed meat in the world by volume. The United States is the world’s largest producer of chicken products, according to the USDA.
The domestic chicken industry is characterized by daily price changes based on seasonal consumption patterns and overall supply and demand for chicken and other meats in the United States and abroad. Chicken prices vary over time and are affected by inventory levels, production cycles, weather and feed prices, among other factors.
Large -scale chicken processors are typically vertically integrated processors. Vertically integrated processors own and raise breeder flocks for the production of hatching eggs. Once hatched, the chicks, or broilers, are transported to independent contract grow-out farms, where they are grown to an age of seven to nine weeks. The processor supplies the contract growers with the chicks, feed and veterinary services. Vertically integrated chicken processors can be significantly affected by working capital demands as broilers feed for approximately seven to nine weeks without revenue generation until processed. Additionally, since broilers consume feed (produced principally from corn and soybean meal) with a replacement price that is subject to changing market prices, vertically integrated chicken processors have direct financial exposure to the volatility in such feed prices.
While affected by seasonal consumption patterns, demand for chicken has remained consistently strong. During the past few decades, demographic change in the workforce, dietary trends and rising foodservice demand have been the primary drivers of increased aggregate chicken product demand in the United States. We believe that consumer demand for U.S. exports in developing countries is driven by population growth compounded by economic growth. As consumers’ economic circumstances improve, they increasingly shift their diets to protein. The United States is the world’s second largest exporter of broiler meat behind Brazil, according to the USDA. The U.S. poultry industry exported 19% of production valued at $3.5 billion in 2008, an increase of $1.8 billion, or 106%, since 2004, according to the USDA. The largest importers of U.S. chicken products are Russia, China and Mexico, which together account for almost half of U.S. broiler product exports.
Competitive strengths
We are well-positioned as a leading meat processor in both the United States and Australia. We have implemented significant operational improvements since the Swift Acquisition, resulting in increases in profitability, throughput, additional value-added products, improved food safety and industry-leading worker safety. We believe that the Proposed PPC Acquisition will significantly strengthen our production platform by adding chicken products to our existing beef and pork products, making us one of the largest protein companies in the world. We believe that, upon the consummation of the Proposed PPC Acquisition, we will be well-positioned to become a primary provider of beef, chicken and pork for our customers’ protein needs. Our competitive strengths include:
Scale and leading market positions in beef, pork and chicken industries
We are one of the world’s largest beef and pork processing companies. In terms of daily slaughtering capacity, we are among the leading beef and pork processors in the United States
174
Table of Contents
and we believe we are the number one processor of beef in Australia. In addition, upon consummation of the Proposed PPC Acquisition, we will be one of the largest chicken producers in the United States in terms of daily processing capacity. We have a slaughtering capacity of 37,290 heads per day in beef, 48,500 heads per day in hogs and over 19,500 heads per day in smalls, and, upon consummation of the Proposed PPC Acquisition, we anticipate we will have a processing capacity of 7.6 million broiler chickens per day. We believe our scale provides us with significant operational flexibility.
Our processing platforms in the United States and Australia provide us with sufficient geographic diversification and operating flexibility to satisfy demand regardless of market conditions and sanitary restrictions. When foreign markets restricted U.S. beef imports in 2003 due to isolated outbreaks of BSE, our Australian beef operations retained access to those markets and helped soften the overall impact to our business. In addition, certain of our facilities can export to the European Union. We have facilities that can accommodate non-hormone treated cattle in Australia, and our Worthington pork plant is one of only four facilities in the United States certified for export of pork to the European Union.
Our facilities are strategically located close to both our raw materials and our customers, reducing freight and storage costs. The Five Rivers feedlot operations, which have a feeding capacity of approximately 839,000 head, are located adjacent to our beef slaughtering facilities. Our JBS Packerland facilities are located near major metropolitan areas, resulting in lower freight costs relative to cattle processing facilities in more rural locations. Additionally, our Australian operations are strategically located to serve our customers in Asia and elsewhere in a low-cost manner.
Through our JBS Packerland beef processing facilities, we have the operational flexibility to process both beef and dairy cattle, which are typically much heavier and require special processing. This flexibility sets us apart from many beef processing facilities in the United States because it enables us to shift our operations between beef and dairy cattle depending on market availability, seasonal demand and relative margin attractiveness.
Diversified business model with international reach
Our business is well diversified across proteins and all major distribution channels, as well as geographically with respect to production and distribution.
| • | Diversified protein offerings: We sell beef, pork, lamb, and mutton products, and, upon consummation of the Proposed PPC Acquisition, we will also sell chicken products. Following the consummation of the Proposed PPC Acquisition, we believe we will be well-positioned to be a primary protein provider to our customers. Selling multiple proteins offers us the opportunity to cross-sell to our customers and to diversify typical industry risks, such as industry cycles, the impact of species-based diseases and changes in consumer protein preferences. As a result of our diversification across multiple proteins, our business is less likely to be severely impacted by issues affecting any one protein. |
| • | Sales and distribution channel diversification: We benefit from our diversified sales and distribution channels, which include national and regional retailers (including supermarket chains, independent grocers, club stores and wholesale distributors), further processors (including those that make bacon, sausage and deli and luncheon meats), international markets and the foodservice industry (including foodservice distributors, which service |
175
Table of Contents
restaurant and hotel chains and other institutional customers). We sell our beef and pork products and, after giving effect to the Proposed PPC Acquisition, our chicken products, to over 9,000 customers worldwide with no customer accounting for more than 5% of our net sales. This level of diversification reduces our dependence on any one market or customer and provides multiple channels for potential growth. |
| • | Geographic diversification: We sell our products in over 60 countries on six continents, and, upon consummation of the Proposed PPC Acquisition, will sell our products in over 80 countries on six continents. Overall, exports accounted for approximately 24% of our sales in 2008 on a pro forma basis (excluding sales for the Proposed PPC Acquisition) and 24% of our sales during the thirty-nine weeks ended September 27, 2009. Our geographic diversification enables us to reduce exposure to any one market and concurrently have access to all export markets. Additionally, having access to international markets allows us to potentially generate higher returns as many of our export products, such as tongue, heart, kidney and other variety meats, garner higher demand and prices in foreign markets, particularly in Asia and the Middle East. In fiscal 2008, we supplied Japan and South Korea with 36% and 47% of their total beef imports, respectively, according to Meat & Livestock Australia Limited, and we believe we were their largest supplier of imported beef. Following the consummation of the Proposed PPC Acquisition, we will use our international footprint and knowledge to expand PPC’s chicken exports. |
World class operations
We believe our operations are among the most efficient in the industry. We also believe that we operate three of the six highest-throughput beef facilities in the United States. Furthermore, we continuously focus on improving our operating efficiencies. We have developed a program to improve the coordination of our planning, forecasting, scheduling, procurement and manufacturing functions to driveimproved profitability per head. In 2008, this program delivered approximately $230 million of benefit from increased beef yields, reduced operational costs, and lower overhead. We believe a significant opportunity remains to further improve the cost structure and profitability of our existing operations, particularly the PPC operations once the Proposed PPC Acquisition is consummated.
Established customer relationships
We have long-standing relationships with numerous well-established, global customers, many of whom have been doing business with us for more than 20 years. We serve many of the largest foodservice distributors, restaurants and retail chains in the United States. Additionally, we are focused on developing long-term, mutually beneficial relationships with our customers, who, we believe, consider us to be an extension of their operations. We believe our high-quality, long-standing relationships provide us with greater revenue stability and forecasting transparency. In addition, upon consummation of the Proposed PPC Acquisition, we will benefit from the significant relationships PPC has developed with numerous well-established, global customers. For example, PPC sells its prepared chicken products to some of the world’s largest customers in the foodservice and retail industries across the United States and around the world, including Wal-Mart Stores, Inc., which accounted for 12% of its net sales during its fiscal year ended September 26, 2009. We believe our ability to provide our customers with all three major proteins will provide an opportunity for us to expand and further strengthen our customer relationships.
176
Table of Contents
Proven management team
We have a proven senior management team whose experience in the protein industry has spanned numerous market cycles. Our chief executive officer, Wesley Batista, has over 20 years of operating experience in both the United States and Brazil and is a member of the founding family of JBS S.A., our parent company, which has over 50 years of experience operating beef processing facilities in Brazil. We have appointed key members of JBS S.A.’s South American management team to management positions in our United States and Australian operations. Our management and that of our parent company have a strong track record of acquiring and successfully integrating operations as evidenced by the more than 30 acquisitions made by JBS S.A. in the last 15 years, including the integration of the JBS Packerland and Tasman Acquisition operations. We benefit from management ideas, best practices, and talent shared with the seasoned management team at our parent company.
Since seeking reorganization relief under the bankruptcy laws, PPC has strengthened its management team with the addition of Don Jackson as PPC’s president and chief executive officer, who has more than 31 years of experience in the poultry industry, and by hiring senior-level industry veterans to oversee sales, marketing and business development.
Our strategy
Continue to successfully integrate recent acquisitions
We have a proven track record of successfully acquiring, integrating, and improving the operating performance of our acquisitions. For example, we have fully integrated the Tasman Group with our legacy northern Australia operations in livestock procurement and sales and expect to complete full integration of the Tasman Group’s information technology systems by the end of 2009. In addition, we successfully completed the integration of JBS Packerland with our operational and financial information technology systems. We have identified additional cost-saving opportunities from further integration and have developed plans to take advantage of these opportunities. We intend to apply our recent successful integration experience to the integration of the Proposed PPC Acquisition. See “—Leverage synergies created as a result of the Proposed PPC Acquisition.”
Continue to pursue additional value-enhancing growth acquisition opportunities
Our management and that of our parent company have a strong track record of acquiring and successfully integrating operations as evidenced by the more than 30 acquisitions made by JBS S.A. in the last 15 years. We intend to continue to selectively pursue additional value-enhancing growth opportunities as they arise, as evidenced by the Proposed PPC Acquisition. We seek acquisition opportunities that we believe are complementary to our businesses and would allow us to realize significant synergies. We frequently evaluate these acquisition opportunities in order to assess, among other things, whether they would be accretive to our earnings and consistent with our strategy. In accordance with this approach, we are actively evaluating several potential acquisitions, including acquisitions to build our distribution business in the United States; which we intend to finance using a portion of the net proceeds from this offering. As of the date of this offering, we have not entered into any commitments with respect to any potential acquisitions other than the Tatiara Meat acquisition. See “Prospectus summary—Recent developments—Tatiara Meat acquisition.”
177
Table of Contents
Continuously improve profitability through process optimization
We continue to focus on enhancing profitability through process improvements and operational efficiencies. In 2008, our initiatives led to benefits of approximately $230 million, comprised of approximately $115 million in operating efficiencies, $90 million in plant cost savings, and over $24 million in selling, general and administrative expense savings. Projects that have delivered operating efficiencies include adding a second shift at our Greeley plant, introducing a pork casing sorting system and improving deboning training and cutting techniques on the fabrication floor, which has improved yields and increased value-added production. We reduced annual selling, general and administrative expenses by nearly 21% for the fiscal year ended December 28, 2008 and in 2008 had the lowest ratio of selling, general and administrative expense to net sales among publicly traded protein companies in the United States. We expect to continue to realize benefits going forward as existing initiatives reach completion and additional projects are undertaken.
Increase sales and enhance margins by significantly expanding our direct distribution business
Since the Swift Acquisition, we have built a leading global production platform. The Proposed PPC Acquisition will strengthen our production platform by adding chicken products to our existing beef and pork products, making us one of the largest protein companies in the world. Capitalizing on our production platform, we are pursuing a global direct distribution strategy that will enable us to improve our ability to serve existing customers and allow us the opportunity to directly serve new customers, primarily in the foodservice and retail channels. Our historical sales strategy has relied primarily on the use of third-party distributors, who purchase our products and resell them to end-user customers, retaining an incremental margin for their own benefit. We intend to shift a significant portion of our sales into direct sales to end-user customers to capture this incremental margin in the value chain. The Proposed PPC Acquisition is complementary to our direct distribution strategy because it will allow us to provide a comprehensive portfolio of protein products to meet our end-user customers’ needs.
Our current distribution facilities include seven warehouses located in the United States and eight facilities in Australia. The Proposed PPC Acquisition will complement our distribution capabilities by adding five regional distribution centers in the United States, eight distribution centers in Mexico and one distribution center in Puerto Rico. Furthermore, the Proposed PPC Acquisition will provide us with additional employees, including sales personnel, with experience in direct distribution to customers in the foodservice and retail channels.
The execution of our direct distribution strategy will require us to substantially expand our distribution network and sales force domestically and internationally. We intend to rapidly implement this strategy, and over the next five years, we intend to invest approximately $1.5 billion to $2.0 billion, including a portion of the net proceeds of this offering, to create a leading global direct distribution business. Our implementation plans include acquiring distribution companies, and constructing and/or leasing regional distribution centers and portion control fabrication, or “cutting room,” facilities (which take primal cuts and fabricate them into individual serving chops or steaks based on customer specifications). Our direct distribution strategy also involves the direct sales and shipment of products to individual end-user customers by our sales personnel using leased delivery vehicles. We are actively evaluating several potential acquisitions, including acquisitions to support our direct distribution strategy. Ultimately, we believe this direct distribution strategy will allow us to capture incremental sales and operating margin opportunities.
178
Table of Contents
Increase processed and value-added offerings
Historically, we have realized greater margins by offering value-added products and services to our customers. Examples of our value-added product and service offerings include additional processing to create sliced, cubed and tenderized products and consumer-ready chops and steaks. In addition, we provide marinated and seasoned meats. These services help reduce labor costs for our foodservice customers and stimulate consumer demand, increasing beef and pork sales.
We believe our retail and foodservice customers will continue to value more convenient, processed products from us. We currently operate 20 plants that produce beef and pork products that are cut, ground and packaged to specific customer demands. In addition, the Proposed PPC Acquisition includes eight further processed food plants. We intend to expand our processed offerings through investments in and expansion of existing production facilities, acquisitions and/or greenfield investments. For example, in 2009, we have budgeted approximately $11.3 million and $8.1 million in capital expenditures to increase our value-added offerings in our Beef and Pork segments, respectively, including the addition of a fabrication floor at our Grand Island facility for our beef products, expanding the fabrication floor at our Greeley facility, adding an advance packaging system for pork products sold to Costco Wholesale Corporation and adding a casing system for our pork products. Increasing our value-added offerings is not limited to growth in our processing capabilities, as our Five Rivers operations provide us the ability to design feeding programs that meet our customers’ specifications. We believe that increased value-added capabilities will drive margin improvement and increase the value we provide to customers.
Promote innovation across the value chain
We believe we can increase our profitability by developing and implementing innovative process and product improvements across the value chain. Our recent innovations have increased our revenues as well as reduced our costs. Recent innovations include a casing sorting system, Halal processing, and use of spray technology in our Australian plants. The casing sorting system, utilized in Brazil, enables the sorting of hog intestines, or casings, for sale to end-users from all of our U.S. pork processing facilities, and is expected to result in annual margin improvement of approximately $24 million. The introduction of Halal processing capabilities in Australia has generated A$317.2 million of sales of Halal-qualified products since the institution of our Halal processing capabilities in 2008. We believe this gives us an advantage over our Australian competitors as we seek to expand our exports to Muslim customers in the Middle East. The transfer of spray technology (the process by which a carcass is sprayed with water as it is chilled immediately following slaughter in order to control weight shrinkage) from the United States to our Australian beef processing facilities is expected to increase our yields by one to two percent, or approximately 40 million pounds annually. Additionally, we have developed and implemented energy conversion processes that have yielded incremental revenue and cost savings. We will continue to seek to develop innovative process and product improvements across the value chain.
Continue to prioritize food and employee safety
We prioritize our food and employee safety objectives in order to accomplish two principal goals. First, we focus on maintaining a high standard of food safety in order to ensure the quality of our products and attempt to avoid the potential adverse market reaction that is associated with recalls that occur from time to time in the meat processing industry. Second, we strive to continuously improve our employee safety in order to increase the efficiency of our facilities and
179
Table of Contents
reduce our operating costs. Since February 2004, we have reduced the number of lost-time injury events by approximately 33% at our beef processing facilities and by approximately 32% at our pork processing facilities through design and implementation of a comprehensive multi-faceted employee safety and injury prevention program.
Leverage synergies created as a result of the Proposed PPC Acquisition
We believe that Pilgrim’s Pride can be successfully integrated into our existing North American operations. We believe that potential synergies from the Proposed PPC Acquisition include streamlining administrative functions and sales networks, consolidating distribution networks, optimizing freight and storage costs, capturing shared purchasing opportunities, consolidating treasury and risk management systems and implementing best practices throughout the business. In addition, opportunities for revenue enhancement may include leveraging our international sales force to improve Pilgrim Pride’s penetration of key export markets, including Russia and Japan.
PPC recent developments
Since seeking protection under the bankruptcy laws on December 1, 2008, PPC has made a series of significant operational changes to reduce costs and increase its operating efficiency. The operational changes have been directed in two phases. Phase I focused on preserving cash and mitigating losses through shift and associated headcount reduction, and other lean manufacturing initiatives. Phase II reduced PPC’s production footprint and served to mitigate capacity utilization and efficiency issues created by previously enacted across-the-board production cuts. Initiatives that took place as part of Phase I included:
| • | consolidating or eliminating second shifts at PPC’s Live Oak, Florida; Athens, Georgia; and Nacogdoches and Waco, Texas facilities; |
| • | realigning PPC operations into four geographic regions in order to flatten the organization, speed decision-making and reduce costs; |
| • | expanding focus on lean manufacturing to reduce waste and gain additional value from existing processes; and |
| • | strengthening PPC’s management team by hiring senior industry veterans to oversee sales, marketing and business development. |
Initiatives that took place as part of Phase II included:
| • | closing or idling PPC processing facilities in El Dorado, Arkansas, Douglas, Georgia, and Farmerville, Louisiana, which produced mostly low-value commodity chicken. The Farmerville facility was subsequently sold to Foster Poultry Farms for approximately $72.3 million in May 2009. These three plants employed a total of approximately 3,000 people, or approximately 7% of PPC’s total U.S. workforce. Approximately 430 independent contract growers who supply birds to these three plants were also affected; |
| • | closing its protein salad operation in Franconia, Pennsylvania, and shifting production to its further-processing facility in Moorefield, West Virginia; and |
| • | closing its chicken processing plant in Dalton, Georgia, and consolidating production at PPC’s processing facility in Chattanooga, Tennessee. |
180
Table of Contents
In addition, PPC is realizing other business improvements and efficiency gains from ongoing actions and a more favorable product mix. These ongoing improvements include reductions in selling, general and administrative expenses through administrative headcount reductions, supply chain and margin improvements, savings from contract rejections and additional improvements.
The majority of PPC’s customers and suppliers have continued to do business with PPC throughout the reorganization process. In addition, PPC has gained new business from a number of customers. We believe this is a direct result of the strong relationships PPC has maintained with many of its business partners.
In October 2009, PPC ceased production at two additional facilities located in Athens, Georgia and Athens, Alabama in order to obtain additional savings. Production from the Athens, Alabama plant will be consolidated into two existing PPC complexes, bringing those facilities to full capacity. Production from the Athens, Georgia, plant has been consolidated with several existing PPC complexes, bringing those facilities to full capacity. PPC does not expect that the collective closures will impair PPC’s ability to service any of its customers.
Corporate history
Prior to 2002, our predecessor was owned and operated by a multinational food company and not operated as a raw material supplier for the processed portions of its business. From 2002 to 2007, our predecessor was owned by a private equity company that pursued a strategy of restricting our capital expenditures and maximizing dividends, including reducing the operations at our Greeley, Colorado plant to a single shift and selling five feedlot facilities, two cattle slaughter facilities, and an Australian beef patty-making and distribution facility.
On May 25, 2007, J&F Participações S.A. entered into a merger agreement with Swift Foods Company, pursuant to which a subsidiary of J&F Participações incorporated in the United States agreed to merge with and into Swift Foods Company. In accordance with the terms of the merger agreement, J&F Participações transferred its rights and obligations under the merger agreement to JBS S.A., which JBS S.A.’s board of directors approved on June 1, 2007. On July 11, 2007, JBS S.A. (through J&F Acquisition Co., which thereafter merged Swift Foods Company with and into itself and subsequently changed its name to JBS USA Holdings, Inc.) acquired 100% of the outstanding share capital of Swift Foods Company for an aggregate purchase price of $1,470.6 million.
Since the Swift Acquisition in July 2007, we have expanded our annual slaughtering and processed beef production capacity significantly as a result of the following two acquisitions:
| • | Tasman Acquisition. On May 2, 2008, under the terms of a share purchase agreement, we acquired substantially all of the assets of the Tasman Group Services, Pty. Ltd. and Industry Park Pty. Ltd., or the Tasman Group, for a purchase price of $116.9 million. We refer to this acquisition as the Tasman Acquisition. Prior to the Tasman Acquisition in May 2008, we owned and operated four beef processing plants and four feedlots in the northern coastal area of Australia. In connection with the Tasman Acquisition, we acquired: (1) six slaughterhouses located in the following Australian cities: Brooklyn/Victoria (cattle and small breed animals), Cobram/Victoria (small breed animals), Devonport/Tasmania (cattle and small breed animals), Londford/Tasmania (cattle and small breed animals), Yarrawonga/Victoria (cattle) and King Island/Tasmania (cattle); and (2) one cattle confinement center in Yambinya/New South Wales, Australia with a capacity to maintain 25,000 head of cattle and 45,000 head of sheep; and |
181
Table of Contents
| • | JBS Packerland Acquisition. On October 23, 2008, under the terms of a stock purchase agreement, we acquired Smithfield Beef Group, Inc. (which we subsequently renamed JBS Packerland) and its subsidiary Five Rivers Ranch Cattle Feeding LLC, or Five Rivers, for a purchase price of $569.4 million. We refer to this acquisition as the JBS Packerland Acquisition. The JBS Packerland Acquisition represented the beef segment of Smithfield Foods, Inc., excluding cattle owned by Smithfield Beef Group, Inc. which were retained by Smithfield Foods, Inc. In connection with the JBS Packerland Acquisition, we acquired: (1) four slaughterhouses (cattle only) located in Green Bay, Wisconsin, Plainwell, Michigan, Souderton, Pennsylvania and Tolleson, Arizona; (2) one grease producing plant located in Elroy, Pennsylvania (3) a cattle confinement center in South Charleston, Ohio, (4) approximately 120 refrigerated trucks in the United States to transport its beef products, and (5) 11 cattle confinement centers operated by Five Rivers with a capacity to hold approximately 820,000 head of cattle located in the states of Colorado, Idaho, Kansas, Oklahoma and Texas. |
These acquisitions and capital expenditures have enabled us to (1) increase our daily slaughtering capacity by 59% from 23,500 head of cattle in 2007 to 37,290 head of cattle as of September 27, 2009, (2) achieve and consolidate our leading position in the global beef market, and (3) increase the geographic diversification of our operations by enhancing our presence in Australia.
On March 3, 2008, JBS S.A. entered into an agreement to acquire National Beef Packing Company LLC, or National Beef. National Beef owns several slaughterhouses and other beef production facilities in the United States, and JBS S.A. intended to contribute its ownership interest in National Beef to us as part of our Beef segment. The closing of this transaction was subject to certain closing conditions, including U.S. antitrust approval. In October 2008, the U.S. Justice Department and 13 states filed a lawsuit seeking an order to prevent the proposed acquisition on antitrust grounds. On February 20, 2009, JBS S.A. announced that it had terminated its efforts to acquire National Beef. For the fiscal year ended December 28, 2008, we recorded $1.9 million in costs related to the proposed National Beef acquisition that we had previously capitalized, which we were required to expense in accordance with SFAS No. 141(R), Accounting for Business Combinations. In March 2009, we also paid a fee of $19.9 million in connection with the termination of the agreement relating to this acquisition.
On September 16, 2009, we entered into an agreement with Pilgrim’s Pride Corporation to acquire 64% of the new common stock of Pilgrim’s Pride. See “The Proposed PPC Acquisition” for more information.
On September 16, 2009, J&F Participações and ZMF Fundo de Investimento em Participações, the controlling shareholders of JBS S.A., entered into an association agreement with the controlling shareholders of Bertin S.A., a Brazilian company that is one of the largest exporters of beef and other cattle by-products in Latin America. Pursuant to the terms of the association agreement: (1) the controlling shareholders of JBS S.A. have agreed to contribute their shares of JBS S.A. owned, directly or indirectly, by them in exchange for shares to be issued by a newly formed holding company; and (2) the controlling shareholders of Bertin S.A. have agreed to contribute all of their shares representing 73.1% of Bertin S.A. in exchange for shares to be issued by this newly formed holding company. The parties are currently analyzing the optimal corporate structure to be used to consummate this transaction.
On December 15, 2009, our Australian subsidiary, Swift Australia Pty Limited, entered into a letter of intent with Vion Food Group, a Netherlands international food company, to acquire Tatiara Meat Company, Australia’s largest exporter of chilled lamb, for A$30 million. This
182
Table of Contents
acquisition is subject to a number of conditions, including approval from Australia’s anti-trust authorities. If this acquisition is consummated, we would become the largest lamb processor in Australia with the capacity to slaughter 24,500 head per day.
Corporate structure
The following diagram sets forth JBS S.A.’s and our current simplified corporate structure and principal business segments after giving effect to the Proposed PPC Acquisition and contemplating the proposed BNDESPAR transaction but without giving effect to the proposed Bertin transaction. See “—Prospectus Summary—Recent Developments—BNDESPAR transaction” and “Principal and selling stockholder—JBS S.A./Bertin transaction.”
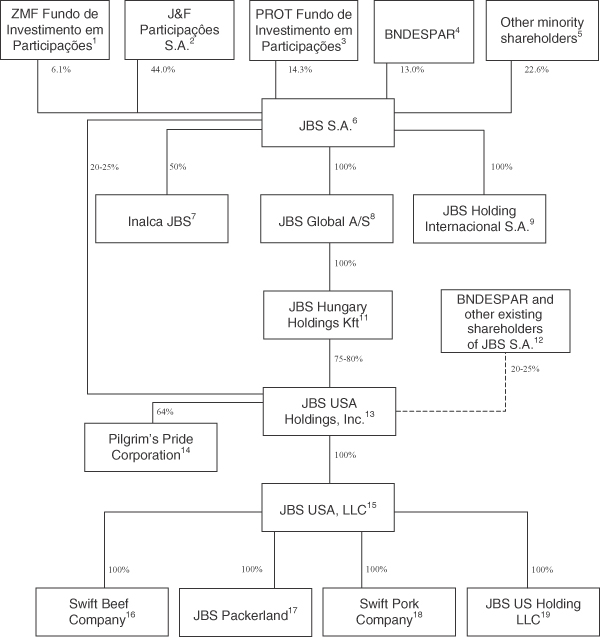
(footnotes on following page)
183
Table of Contents
| (1) | ZMF Fundo de Investimento em Participações is a Brazilian investment fund which owns 6.1% of the total capital of JBS S.A. The Batista family (except for Mr. José Batista Sobrinho and Mrs. Flora Mendonça Batista) owns 100% of the equity interests in ZMF Fundo de Investimento em Participações. |
| (2) | J&F Participações S.A. is a Brazilian corporation which owns 44.0% of the total capital of JBS S.A. The members of the Batista family (José Batista Sobrinho and Flora Mendonça Batista, and their six children José Batista Júnior, Valéria Batista Mendonça Ramos, Vanessa Mendonça Batista, Wesley Mendonça Batista, Joesley Mendonça Batista and Vivianne Mendonça Batista) indirectly, through several holding companies, own 100.0% of the issued and outstanding shares of J&F Participações S.A. |
| (3) | PROT Fundo de Investimento em Participações is a Brazilian equity investment fund and an affiliate of Banco Nacional de Desenvolvimento Económico e Social. |
| (4) | BNDES Participações S.A.—BNDESPAR, is a subsidiary ofBanco Nacional de Desenvolvimento Económico e Social. BNDESPAR invests, and owns equity interests, in Brazilian companies, including JBS S.A. |
| (5) | None of the holders of the remaining 20% of JBS S.A.’s outstanding common shares hold greater than 5% of such shares. 3.1% of JBS S.A.’s common shares are held in treasury. |
| (6) | JBS S.A. is a Brazilian company whose common shares are listed on theNovo Mercadosegment (the highest level of corporate governance requirements) of the BOVESPA (Bolsa de Valores de São Paulo) through which it conducts its Brazilian operations. |
| (7) | On December 6, 2007, JBS S.A. entered into a joint venture agreement with Cremonini SpA, a corporation organized under the laws of Italy, pursuant to which JBS S.A. agreed to acquire 50% of the capital stock of Inalca SpA (subsequently renamed Inalca JBS SpA), a corporation organized under the laws of Italy. Inalca JBS SpA is Italy’s leading beef company and one of the main beef processing companies in Europe. |
| (8) | JBS Global A/S is a corporation organized under the laws of Denmark and is a wholly-owned subsidiary of JBS S.A. JBS Global A/S is a holding company of certain subsidiaries of JBS S.A., including JBS Hungary Holdings Kft. |
| (9) | JBS Holding Internacional is the holding company for JBS S.A.’s Argentine operations. |
| (10) | On December 21, 2009, we and JBS S.A. entered into a purchase and sale agreement pursuant to which we agreed to issue and sell 20-25% of our common stock to JBS S.A. for an aggregate purchase price of $2.0 billion. The percentage of shares of our common stock to be issued and sold will be equal to $2.0 billion divided by our equity valuation in U.S. dollars based on the number of shares outstanding immediately prior to this offering, but calculated on the basis of the price per share in this offering, multiplied by 100. As a result of this purchase and sale agreement, JBS S.A. will hold a 20-25% interest in us, and the remaining interest in us will be held by JBS S.A. indirectly through the selling stockholder. See “Principal and selling stockholder—JBS S.A. purchase and sale agreement.” In connection with the BNDESPAR transaction, the common stock that is acquired by JBS S.A. pursuant to the purchase and sale agreement will equal the number of our common stock that will underlie the Brazilian depositary receipts described in note (12) below. See “Principal and selling stockholder—BNDESPAR transaction.” |
| (11) | JBS Hungary Holdings Kft. is a corporation organized under the laws of Hungary and is the selling stockholder of record in this offering and a wholly-owned subsidiary of JBS Global A/S. |
| (12) | On December 22, 2009, JBS S.A. agreed with BNDESPAR to issue exchangeable debentures. These debentures are mandatorily exchangeable into our common stock in the form of Brazilian depositary receipts, or “BDRs,” following completion of this offering under certain conditions. If all of the debentures are converted into our common stock, the holders of the debentures will own 20-25% of our common stock as measured prior to this offering. For more information, see “Principal and selling stockholder— BNDESPAR transaction.” At the time of conversion of the debentures into our common stock, such common stock will be delivered to debenture holders by JBS S.A., thereby reducing JBS S.A.’s interest in us. |
| (13) | JBS USA Holdings, Inc. is a corporation organized under the laws of Delaware and is the issuer of this offering. |
| (14) | On September 16, 2009, we entered into an agreement with Pilgrim’s Pride Corporation to acquire 64% of the new common stock of Pilgrim’s Pride. If the Proposed PPC Acquisition is consummated, PPC and its subsidiaries will comprise our chicken operations. For more information, see “The Proposed PPC Acquisition.” |
| (15) | JBS USA, LLC is a corporation organized under the laws of Delaware and is our wholly-owned subsidiary. |
| (16) | Swift Beef Company is a corporation organized under the laws of Delaware and is the holding company for our United States beef operations, other than JBS Packerland. |
| (17) | On October 23, 2008, we acquired Smithfield Beef Group, Inc. (which we subsequently renamed JBS Packerland), which included the acquisition of Five Rivers Ranch Cattle Feeding LLC. JBS Packerland is the holding company for the beef operations we acquired in the JBS Packerland Acquisition, including the feedlots operated by Five Rivers. |
| (18) | Swift Pork Company is a corporation organized under the laws of Delaware and is the holding company for our U.S. pork operations. |
| (19) | JBS US Holding LLC is a corporation organized under the laws of Delaware and is the holding company for our Australian operations. |
184
Table of Contents
| The following map details our facilities in the United States and Australia, including daily slaughtering capacity and total feeding capacity in heads of cattle, as applicable. |
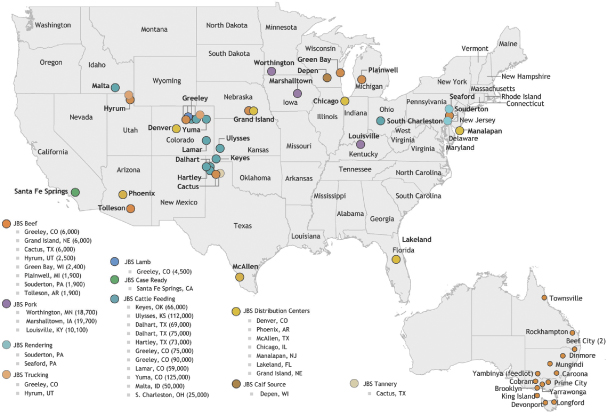
185
Table of Contents
Description of business segments
Beef segment
Products, sales and marketing
United States
The majority of our beef revenues in the U.S. are generated from the sale of fresh beef, which includes chuck cuts, rib cuts, loin cuts, round cuts, thin meats, ground beef and other products. In addition, we sell beef by-products to the variety meat, feed processing, fertilizer, and pet food industries. Cattle hides are sold for both domestic and international use, primarily to the clothing and automotive industries. We market products under several brand names, including “Swift Premium,Swift Angus Select,Swift Premium Black Angus, Miller Blue Ribbon Beef andG.F. Swift 1855.”Our hallmark brand,Swift, was founded in 1855, and we believe it is synonymous with our industry leadership in innovation and food quality. We believe that our brands, marketed primarily at the wholesale level, provide a platform for further growth and expansion of our value-added and premium program product lines.
We market our beef products through several channels including:
| • | national and regional retailers including supermarket chains, independent grocers, club stores and wholesale distributors; |
| • | further processors who use our beef products as a food ingredient for prepared meals, raw materials for hamburger, and by-products for pharmaceutical and leather production; |
| • | the foodservice industry, including foodservice distributors, which service restaurant and hotel chains and other institutional customers; and |
| • | international markets, including Japan, Mexico, South Korea, Canada, and China among others, many of which have reopened to U.S. beef following the 2003 BSE outbreak, as well as other smaller foreign markets, some of which are limited to boxed beef products from cattle younger than 30 months of age. |
Our largest distribution channel is retail. We have increased sales to the international channels by approximately 139% from 176 million pounds in 2005 to 420 million pounds in 2008, trending toward pre-BSE levels, which were 456 million pounds in 2003. We intend to continue to focus on increasing our sales in the foodservice and international distribution channels, in particular, quick-service restaurants and their suppliers, which we believe are likely to continue to be profitable and growing over time.
Total net sales contribution by channel is:
Fiscal year ended | Thirty-nine weeks ended September 27, | |||||||||||
| 2006 | 2007 | 2008 | ||||||||||
Retail | 36 | % | 34 | % | 36 | % | 41 | % | ||||
Further processors | 21 | 21 | 21 | 17 | ||||||||
Foodservice | 17 | 16 | 11 | 10 | ||||||||
International | 26 | 29 | 32 | 32 | ||||||||
Total | 100 | % | 100 | % | 100 | % | 100 | % | ||||
186
Table of Contents
Australia
The majority of our beef revenues in Australia are generated from the sale of fresh beef, which includes chuck cuts, rib cuts, loin cuts, round cuts, thin meats, ground beef and other products. We also produce value-added meat products, including toppings for pizza. Approximately 79% of the beef products sold by our Australian operations are derived from grass-fed cattle. The remainder of our beef products are derived from grain-fed animals and are sold primarily to Japan. Grain-fed cattle provide higher quality meat, which commands a premium price. Our Beef segment also includes our lamb and sheep operations in Australia.
Our Australian operations currently generate approximately 87% of total net sales as exports to foreign countries, including Japan, the largest export market for our Australian operations, as well as the United States. Australia’s sales to export markets have continued to benefit from the 2003 North American BSE incident, which had closed key Asian markets to the import of U.S. beef. Since 2003, these market closings increased the marketability of our Australian beef into those markets as Australia had no similar import restrictions on its production.
Global exports
We sell our beef products in over 60 countries on six continents. Overall, exports accounted for approximately 28% of our sales in 2008 on a pro forma basis, giving effect to the JBS Packerland Acquisition (but not the Proposed PPC Acquisition) and 32% of our sales for the thirty-nine weeks ended September 27, 2009. The international beef market is divided between the Pacific Block (which includes the United States, Japan, Canada, Mexico and South Korea) and the Atlantic Block (Europe, Africa, the Middle East and South America). This division reflects not only historical and geographical ties but also certain common sanitary criteria.
The Pacific Block prohibits imports of fresh beef from countries or regions where there is still a risk of new outbreaks of foot-and-mouth disease, or FMD, and from countries or regions that are FMD-free but implement FMD vaccination programs. However, the Pacific Block permits imports of processed beef (including cooked and pre-cooked products) from these countries.
Most countries of the Atlantic Block permit imports of fresh beef from FMD-free countries that implement FMD vaccination programs. They also recognize that FMD can be eradicated on a regional (as opposed to national) basis in certain countries, including Brazil, which has areas that are FMD-free and have vaccination programs, qualifying them to export fresh beef. Under this regionalization concept, many beef producing regions in Brazil are thus qualified to export fresh beef to countries in the Atlantic Block. Notwithstanding the foregoing, most countries in the Atlantic Block impose import restrictions on beef treated with growth hormones, citing health concerns. Brazil and Argentina have prohibited the use of growth hormones on their cattle.
The United States has been an FMD-free country since the eradication of the disease, and it does not implement vaccination programs. However, the United States treats most of their cattle with growth hormones, and, accordingly, the European Union and several other countries have banned imports of beef treated with growth hormones from the United States.
Australia is an FMD-free country and does not implement vaccination programs against the disease. It also does not use growth hormones in a small part of its cattle herd and is therefore able to export to any country in the world.
As a result of this division and the sanitary restrictions between the Pacific Block and the Atlantic Block, we believe that our U.S. export operations of fresh beef today do not directly compete
187
Table of Contents
with our parent company’s Brazilian and Argentine export operations of fresh beef in our main export destinations. Although JBS S.A. is a large exporter of beef to the European Union, for example, we do not have relevant export volume to the European Union because of its restrictions on beef treated with growth hormones. Consequently, we do not have formal arrangements with JBS S.A. to coordinate our exports in our export markets. However, to the extent that sanitary restrictions change in the future, we could become direct competitors of our parent company in certain export markets.
In addition, we do compete with JBS S.A. to a limited degree, for example, to the extent that our Australian operations export to markets in the European Union, the Middle East and Southeast Asia, to which JBS S.A. also exports. JBS S.A. had sales of beef products to the European Union, the Middle East and Southeast Asia of approximately $401.5 million, $129.6 million and $5.4 million, respectively, for the thirty-nine weeks ended September 27, 2009. Our Australian subsidiaries had sales of beef products of approximately $18.2 million and $52.8 million to the European Union and Southeast Asia, respectively, for the thirty-nine weeks ended September 27, 2009. Our Australian subsidiaries did not sell any beef products to the Middle East for the thirty-nine weeks ended September 27, 2009. We do not believe our Australian operations’ competition with JBS S.A. in these markets has a material adverse effect on our current business.
Raw material and feedlot operations
United States
The primary raw material for our U.S. processing facilities is live cattle. All of our U.S. cattle procurement process is centralized at our headquarters in Greeley, Colorado. We require all of our cattle suppliers to document the quality of their feedlot operations, verify that the use of antibiotics and agricultural chemicals follow the manufacturer’s intended standards and confirm that feed containing animal based protein products, which have been associated with outbreaks of BSE, has not been used. We have in excess of 3,000 cattle suppliers.
At September 27, 2009, approximately 2.2 million of our annual cattle needs, or 29% of our annual cattle purchases, were under forward purchase arrangements. We purchase our remaining needs on the spot market. These forward purchase contracts are not fixed price contracts but rather they are priced at market upon delivery, thus generally minimizing our exposure to price volatility before delivery. See “Certain relationships and related party transactions— Arrangements with J&F Oklahoma—Cattle purchase and sale agreement.”
Five Rivers operates 13 cattle feedlots with a one-time feeding capacity of approximately 839,000 cattle, located in Colorado, Idaho, Kansas, Oklahoma, New Mexico, Wisconsin, Ohio and Texas, adjacent to our existing Beef segment slaughter facilities. Almost 1.5 million head of cattle were fattened in these feedlots in 2008 and approximately 1.2 million head of cattle during the thirty-nine weeks ended September 27, 2009. Five Rivers operates exclusively as a custom feedlot, sometimes known as a “hotelling” operation. Under this model, the feedlot “hotels” cattle owned by third parties in return for fees. Five Rivers has such an agreement with our affiliate, J&F Oklahoma Holdings, Inc., or J&F Oklahoma, which is a wholly owned subsidiary of J&F Participações S.A., a shareholder of JBS S.A. Under this agreement, Five Rivers has agreed to “hotel” cattle owned by J&F Oklahoma in exchange for fees. While the feedlot operator generally sells the cattle on behalf of the owner (deducting the fees from the sale proceeds), the ultimate risk of the cattle going unsold is borne by the cattle’s owner, not the feedlot.
188
Table of Contents
In addition to Five Rivers’ hotelling agreement with J&F Oklahoma, we (through our subsidiary, JBS USA, LLC) have agreed to purchase a minimum number of cattle owned by J&F Oklahoma each year from 2009 through 2011. The pricing terms of this agreement are consistent with those provided to other third-parties. J&F Oklahoma supplies us with approximately 24% of our cattle needs and is obligated to sell to us, on an annual basis, a minimum of 500,000 cattle at market prices upon delivery.
Historically, cattle prices have been subject to substantial fluctuations. Cattle supplies and prices are affected by factors such as corn and soybean meal prices, weather and farmers’ access to capital. JBS Packerland’s four processing plants purchase lean Holstein steers and cows and other cattle primarily from feedlots, auction barns, direct contract relationships with suppliers in close proximity to processing plants and from its existing cattle feeding operations. The close proximity of these plants to most of their suppliers reduces transportation costs, shrinkage and bruising of livestock in transit.
Vertically integrated beef processors, which own cattle on feed, can be subject to significant financial impact in terms of working capital utilization, since cattle on feed eat in the yards for 90-180 days and do not generate revenue until slaughtered. Since cattle on feed consume feed with a replacement price that is subject to market changes, vertically integrated beef processors have direct financial exposure to the volatility in corn and other feedstock prices. By contrast, our beef business in the United States is that of a “pure processor,” which consists of processing, preparing, packaging and delivering fresh, further processed and value-added beef products for sale to customers. We do not own cattle on feed, and we generally purchase cattle in the spot market or pursuant to market-priced supply arrangements from feedlot operators, and, except as described below, typically hold cattle for less than one day before processing. After processing, we sell the beef at spot prices. Because we generally buy cattle at market prices and sell the finished beef product at market prices with just a short time between the purchase and sale, we are not exposed to changing market prices over as great a span of time as vertically integrated processors. As such we are primarily a “spread” operator, and our operating profit is largely determined by plant operating efficiency and not by fluctuations in prices of cattle and beef.
Australia
The primary raw materials we use in our Australian processing facilities are live cattle, lamb and sheep. Our cattle procurement function is focused on efficiently sourcing both grass-fed cattle and feeder cattle for our grain-fed business. Grass-fed cattle are primarily sourced from third-party suppliers with specific weight and grade characteristics. This process helps ensure that the cattle we source meet our future order requirements. The majority of grain-fed cattle are sourced from company-owned feedlot operations.
We operate five feedlots that provide grain-fed cattle exclusively for our processing operations in Australia. We source feeder cattle from livestock producers in Australia. On average, cattle remain in our feedlots for approximately 140 days before they are transferred to our processing operations. Our feedlots produce approximately 288,000 cattle per year for processing. Our Australian feedlots operate essentially in the same manner as retained ownership feedlots in the United States, meaning that we own the cattle and therefore carry the risk on the cattle. For a large proportion of these cattle, we know the eventual customers and their product requirements based on our close relationship with these customers and their purchasing history. Feed rations are determined based on scientific analysis. It is worth highlighting the distinction between retained ownership feedlots and custom feedlots, like our U.S. feedlots. In custom
189
Table of Contents
feedlots the animals are sold by the feedlot to beef processors on behalf of the livestock owner and the livestock owner’s proceeds are paid to the livestock owner after the feedlot has deducted the yardage cost for fattening the animal and delivering the fattened animal to the meat processor. The distinction is important since in custom feedlots the livestock owner is at risk for the ultimate sale of the animal at completion, whereas in retained ownership feedlots the feedlot carries the risk of holding the cattle until they are sold.
In Australia, our beef business operates under a “vertically integrated” model that includes cattle ownership in addition to our beef processing activities. Our Australian feedlots operate under a retained ownership structure, meaning that we own the cattle housed in the feedlots. We source the cattle from livestock producers in Australia. Therefore, unlike the custom feedlot model adopted by us in our U.S. beef operations, the risk of the Australian cattle going unsold is borne by us.
Processing facilities
United States
Our beef operations in the United States consist of eight beef cattle facilities. These facilities process steers and heifers raised on concentrated rations, or “fed cattle.” On May 26, 2006, we completed the sale of our legacy non-fed cattle business (cattle not fed on concentrated rations), including our operating plant assets in Omaha, Nebraska and our idled Nampa, Idaho assets. Due to our significant continuing involvement with the non-fed processing facilities through a raw material supply agreement, the operating results related to these plants have been reflected in our continuing operations through the fiscal year ended December 24, 2006.
Our facilities utilize modern, highly-automated equipment to process and package beef products, which are typically marketed in the form of boxed beef. We also customize production and packaging of beef products for several large domestic and international customers. The designs of our facilities emphasize worker safety to ensure regulatory compliance and to reduce worker injuries. Our facilities are also designed to reduce waste products and emissions and dispose of waste in accordance with applicable environmental standards. We have equipped our Santa Fe Springs, California facility to process value-added products, including, for example, theG.F. Swift 1855 brand line of premium beef products. Our Greeley, Colorado, Cactus, Texas, and Grand Island, Nebraska facilities have been equipped to produce value-added operations, including slicing, grinding and cubing of beef products for retail and foodservice customers.
Our JBS Packerland beef processing facilities are engineered to provide us with the flexibility to process a variety of cattle, which allows further diversification of our beef product offerings. Specifically, our JBS Packerland facilities are engineered to process both beef cattle, which are raised for beef production, and dairy cattle, which are bred to produce milk and which tend to be much larger and require different processing capabilities. This flexibility enables us to shift our operations on a daily basis between beef and dairy cattle depending on market availability, seasonal demand and relative margin attractiveness, setting us apart from many beef processing facilities in the United States. In addition, this processing flexibility provides us with the ability to take advantage of seasonal increases in the availability of animals for slaughter. Beef cattle (both fed and non-fed) are generally available year round for slaughter, whereas dairy cattle are generally retained on dairy farms during the spring and summer months and considered for slaughter in the fall, resulting in a significant increase in the availability of animals for slaughter in the fall months. Beef processors with plants that are designed to process the much heavier
190
Table of Contents
dairy cattle are able to take advantage of this increase in animals for slaughter. In addition, our JBS Packerland facilities are located near major metropolitan areas, resulting in lower freight costs compared to cattle processing facilities in other localities. JBS Packerland’s Tolleson, Arizona plant is located near Phoenix, Tucson, and Los Angeles; the Plainwell, Michigan plant is located near Chicago and Detroit; the Green Bay plant is located near Milwaukee and Chicago; and the Souderton, Pennsylvania plant is located near Baltimore, Philadelphia and New York.
Our food safety efforts incorporate what we believe to be a comprehensive network of leading technologies, such as MultiCheck, that minimize the risks involved in beef processing. Two of the elements of MultiCheck are double pasteurization of carcasses prior to chilling and a chilled carcass treatment using organic acid immediately prior to carcass disassembly.SwiftTraceTM is another element we implemented as part of our on-going commitment to animal and human safety.SwiftTraceTM is a process whereby live animals and finished animal products can be traced backward or forward in the supply chain. This process helps to build confidence from suppliers, customers and consumers in the food supply chain.
Australia
Our ten processing facilities are strategically located for efficient livestock acquisition, availability of labor and access to shipping and distribution. Our facilities utilize modern, highly automated equipment to process and package beef products. The Dinmore facility is the largest plant in Australia. The Beef City plant processes grain-fed cattle.
Since July 2007, we have made important capital and operational expenditures, including the installation of plate freezers and finely textured meat processing, as well as value-added variety meats capture technology. These expenditures have enhanced product quality, improved customer satisfaction and increased sales potential. We have equipped our facilities to process value-added products and consumer-ready products. Our facilities produce additional value-added products, including seasoned and marinated beef items. The design of our facilities emphasizes worker safety to ensure regulatory compliance and to reduce worker injuries. Our facilities are also designed to reduce waste products and emissions and dispose of waste in accordance with applicable environmental standards.
All products are subject to stringent animal husbandry and food safety procedures. Our processing facilities are subject to extensive regulation and inspection by the Australian government, through the Australian Quarantine and Inspection Service, or AQIS, the Australian equivalent of the USDA. Our Australian processing facilities are currently in compliance with all AQIS international customer requirements. Our Dinmore and Beef City facilities are European Union-certified facilities, which enable us to export primal cuts to Europe. Our feedlots are managed with cattle friendly policies, providing a clean and scientific feeding regimen to ensure that safe grain-fed products are delivered to our customers.
Pork segment
Products, sales and marketing
We are the third largest pork producer in the United States, with a slaughtering capacity of 48,500 head per day. A significant portion of our revenues are generated from the sale of fresh pork products, including trimmed cuts such as loins, roasts, chops, butts, picnics and ribs. Other pork products, including hams, bellies and trimmings, are sold predominantly to further processors who, in turn, manufacture bacon, sausage and deli and luncheon meats. The
191
Table of Contents
remaining sales are derived from by-products and from further-processed, higher margin products. Due to the higher margins attributable to value-added products, we intend to place greater emphasis on the sale of moisture-enhanced, seasoned, marinated and consumer-ready pork products to the retail channel and boneless ham and skinless bellies to the further processor channel. Our U.S. lamb business currently operates under our Pork segment and accounted for less than 1% of our total net sales for the thirty-nine weeks ended September 27, 2009. During the thirty-nine weeks ended September 27, 2009, our Pork segment had net sales of $1.6 billion.
We market our pork products through several channels, including:
| • | national and regional retailers including supermarket chains, independent grocers, club stores and wholesale distributors; |
| • | further processors that use its pork products as a food ingredient for prepared meals, raw material for sausage manufacturing and by-products for pharmaceutical production; |
| • | international markets including Japan, Mexico and China, among others; and |
| • | the foodservice industry, including foodservice distributors, fast food, restaurant and hotel chains and other institutional customers. |
Pork products sold to the domestic retail and further processor channels comprised approximately 82% of total net sales for the thirty-nine weeks ended September 27, 2009. Pork exports contributed approximately 14% of net sales over the same period. We consider the overseas markets an opportunity for future growth.
Total net sales contribution by channel were:
| Fiscal year ended | Thirty-nine weeks ended | |||||||||||
| 2006 | 2007 | 2008 | ||||||||||
Retail | 44 | % | 42 | % | 40 | % | 43 | % | ||||
Further processors | 41 | 42 | 40 | 39 | ||||||||
International | 11 | 12 | 16 | 14 | ||||||||
Foodservice | 4 | 4 | 4 | 4 | ||||||||
Total | 100 | % | 100 | % | 100 | % | 100 | % | ||||
Raw material
The primary raw material that we use in our processing facilities is live hogs. We employ a network of hog buyers at our processing plants and buying stations to secure our hog supply. In 2008, approximately 68% of our hog purchases were made through various forms of supply contracts that provide us with a stable supply of high-quality hogs. These supply contracts are typically four to five years in duration and stipulate minimum and maximum purchase commitments with prices based in part on the market price of hogs upon delivery, with adjustments based on quality, weight, lean composition and meat quality. We purchased the remaining approximately 32% of our hogs on the spot market at a daily market price with the same general quality and yield grade as we require under our contracts. We require an extensive supplier certification program and conduct comprehensive cutting tests of our potential suppliers’ animals to determine carcass composition and leanness.
192
Table of Contents
Vertically integrated pork processors, which own hogs on feed, can be subject to significant financial impact in terms of working capital utilization, since hogs on feed eat in the yards for approximately 180 days and do not generate revenue until slaughtered. In addition, since hogs on feed consume feed with a replacement price that is subject to market changes, vertically integrated pork processors have direct financial exposure to the volatility in corn and other feedstock prices. Currently, we are a non-vertically integrated pork processor. We do not own hogs on feed and generally purchase finished hogs under long-term supply contracts at prevailing market prices, fabricate the hogs in our production facilities and sell the finished products at spot prices. Because the finished hogs typically are acquired within 24 hours of slaughter, they are not exposed to changing market prices over as great a span of time as vertically integrated processors.
Processing facilities
Our operations in the United States consist of three processing facilities located in close proximity to major hog growing regions of the country, a value-added facility that produces consumer-ready pork for certain customers and a lamb processing facility.
Our facilities utilize modern, highly-automated equipment to process and package pork products, which are typically marketed in the form of boxed pork. Since July 2007, we have made important capital and operational expenditures, including the installation of plate freezers and finely textured meat processing, as well as value-added variety meats capture technology. We believe that these expenditures have enhanced product quality, improved customer satisfaction and increased sales potential. We have equipped our Santa Fe Springs, California facility to process value-added products and consumer-ready products. Our Louisville, Kentucky and Marshalltown, Iowa facilities produce additional value-added products, including seasoned and marinated pork items. The design of our facilities emphasizes worker safety to ensure regulatory compliance and to reduce worker injuries. Our facilities are also designed to reduce waste products and emissions and dispose of waste in accordance with applicable environmental standards. Our Worthington, Minnesota and Marshalltown, Iowa pork plants currently have International Standards Organization (ISO) 9001 certified quality management systems, and Worthington is a European Union-certified facility that enables us to export primal cuts to Europe.
Our food safety task force consists of experts in the field of meat processing, food microbiology and quality assurance, all working together to assure compliance at all stages of the production chain and distribution channels. Our internal programs, policies and standards are designed to exceed both regulatory requirements and customer specifications. Our food safety efforts incorporate what we believe is a comprehensive network of leading technologies, such as MultiCheck, that minimize the risks involved in pork processing.
Chicken segment
Upon consummation of the Proposed PPC Acquisition, we will report Chicken as a third and separate segment in our consolidated financial statements for periods following the consummation of the Proposed PPC Acquisition and will conduct our domestic and international chicken processing business through the newly designated Chicken segment. The following disclosure sets forth certain information regarding PPC’s operations and our proposed Chicken
193
Table of Contents
segment following consummation of the Proposed PPC Acquisition. There can be no assurance that the Proposed PPC Acquisition will be consummated. See “Risk Factors—Risks relating to the Proposed PPC Acquisition.”
PPC—Products, sales and marketing
Products of PPC’s U.S. operations
PPC’s chicken products consist primarily of the products described below.
Fresh chicken: PPC sells fresh chicken products, which are refrigerated (non-frozen) whole or cut-up chickens sold to the foodservice industry either pre-marinated or non-marinated. Fresh chicken also includes prepackaged case-ready chicken, which includes various combinations of freshly refrigerated, whole chickens and chicken parts in trays, bags or other consumer packs labeled and priced ready for the retail grocer’s fresh meat counter.
PPC’s fresh chicken business is a significant component of its sales and accounted for approximately 51% of its total U.S. chicken sales for its fiscal year ended September 26, 2009. In addition to maintaining sales of mature, traditional fresh chicken products, PPC’s strategy is to shift the mix of its U.S. fresh chicken products by continuing to increase sales of faster-growing products, such as marinated whole chicken and chicken parts, and to continually shift portions of this product mix into the higher-value prepared chicken category. Most fresh chicken products are sold to established customers, based upon certain weekly or monthly market prices reported by the USDA and other public price reporting services, plus a markup, which is dependent upon the customer’s location, volume, product specifications and other factors. We believe that PPC’s practices with respect to sales of fresh chicken are generally consistent with those of its competitors. The majority of these products are sold pursuant to agreements with varying terms that either set a fixed price for the products or set a price according to formulas based on an underlying commodity market, subject in many cases to minimum and maximum prices.
Prepared chicken: PPC sells prepared chicken products, which are products such as portion-controlled breast fillets, tenderloins and strips, delicatessen products, salads, formed nuggets and patties and bone-in chicken parts. These products are sold either refrigerated or frozen and may be fully cooked, partially cooked or raw. In addition, these products are breaded or non-breaded and either pre-marinated or non-marinated. During its fiscal year ended September 26, 2009, $2,294.6 million of PPC’s U.S. chicken sales were from sales of prepared chicken products to foodservice customers and retail distributors. These numbers reflect the impact of PPC’s increasing strategic focus on the prepared chicken markets and its acquisition of Gold Kist. The market for prepared chicken products has experienced, and we believe that it will continue to experience, greater growth and higher average sales prices than fresh chicken products. Also, the production and sale in the United States of prepared chicken products reduce the impact of the costs of feed ingredients on profitability. Feed ingredient costs are the single largest component of PPC’s total U.S. cost of sales, representing approximately 37.1% of its total U.S. cost of sales for its fiscal year ended September 26, 2009. The production of feed ingredients is positively or negatively affected primarily by the global level of supply inventories, demand for feed ingredients, the agricultural policies of the U.S. and foreign governments and weather patterns throughout the world. As further processing is performed, feed ingredient costs become a decreasing percentage of a product’s total production cost, thereby reducing their impact on PPC’s profitability. Products sold in this form enable PPC to charge a premium, reduce the impact of feed ingredient costs on profitability and improve and stabilize profit margins.
194
Table of Contents
PPC establishes prices for its prepared chicken products based primarily upon perceived value to the customer, production costs and prices of competing products. The majority of these products are sold pursuant to agreements with varying terms that either set a fixed price for the products or set a price according to formulas based on an underlying commodity market, subject in many cases to minimum and maximum prices. Many times, these prices are dependent upon the customer’s location, volume, product specifications and other factors.
Export and other chicken products: PPC’s exports consist of whole chickens and branded and non-branded prepared chicken products for distribution to export markets, and its other chicken products consist of chicken parts sold primarily in bulk, non-branded form, either refrigerated to distributors in the United States or frozen for distribution to export markets. In its fiscal year ended September 26, 2009, approximately 10.8% of PPC’s total U.S. chicken sales were attributable to U.S. chicken export and other products. These exports and other products, other than the prepared chicken products, have historically been characterized by lower prices and greater price volatility than PPC’s more value-added product lines. For other chicken products sold in the United States, prices are negotiated daily or weekly and are generally related to market prices quoted by the USDA or other public price reporting services. PPC sells U.S.-produced chicken products for export to Eastern Europe (including Russia), the Far East (including China), Mexico and other world markets.
Historically, PPC has targeted international markets to generate additional demand for its dark chicken meat, which is a natural by-product of its U.S. operations, given PPC’s concentration on prepared chicken products and the U.S. customers’ general preference for white chicken meat. PPC has also begun selling prepared chicken products for export to the international divisions of its U.S. chain restaurant customers. We believe that U.S. chicken exports will continue to grow as worldwide demand increases for high-grade, low-cost meat protein sources.
Other products. PPC’s other products consist of: (a) other types of meat protein along with various other staples purchased and sold by PPC’s distribution centers as a convenience to its chicken customers who purchase through the distribution centers, and (b) the production and sale of table eggs, commercial feed, related items and protein conversion products.
195
Table of Contents
The following table sets forth, for the fiscal years indicated, the amount of net U.S. chicken sales attributable to each of PPC’s primary product lines and the markets serviced with those products. PPC based the table and related discussion on its internal sales reports and its classification of product types and customers.
| Fiscal 2009 | Fiscal 2008 | Fiscal 2007(a) | Fiscal 2006 | |||||||||
| (52 weeks) | (52 weeks) | (52 weeks) | (52 weeks) | |||||||||
| (In thousands) | ||||||||||||
U.S. chicken: | ||||||||||||
Prepared chicken: | ||||||||||||
Foodservice | $ | 1,828,038 | $ | 2,033,489 | $ | 1,897,643 | $ | 1,567,297 | ||||
Retail | 466,538 | 518,576 | 511,470 | 308,486 | ||||||||
Total prepared chicken | 2,294,576 | 2,552,065 | 2,409,113 | 1,875,783 | ||||||||
Fresh chicken: | ||||||||||||
Foodservice | 2,128,112 | 2,550,339 | 2,280,057 | 1,388,451 | ||||||||
Retail | 984,950 | 1,041,446 | 975,659 | 496,560 | ||||||||
Total fresh chicken | 3,113,062 | 3,591,785 | 3,255,716 | 1,885,011 | ||||||||
Export and other: | ||||||||||||
Export: | ||||||||||||
Prepared chicken | 85,135 | 94,795 | 83,317 | 64,338 | ||||||||
Fresh chicken | 553,407 | 818,239 | 559,429 | 257,823 | ||||||||
Total export(b) | 638,542 | 913,034 | 642,746 | 322,161 | ||||||||
Other chicken by-products | 17,734 | 20,163 | 20,779 | 15,448 | ||||||||
Total export and other | 656,276 | 933,197 | 663,525 | 337,609 | ||||||||
Total U.S. chicken | 6,063,914 | 7,077,047 | 6,328,354 | 4,098,403 | ||||||||
Mexico chicken | 487,785 | 543,583 | 488,466 | 418,745 | ||||||||
Total chicken | 6,551,699 | 7,620,630 | 6,816,820 | 4,517,148 | ||||||||
Other products: | ||||||||||||
U.S. | 505,738 | 863,495 | 661,115 | 618,575 | ||||||||
Mexico | 30,618 | 34,632 | 20,677 | 17,006 | ||||||||
Total other products | 536,356 | 898,127 | 681,792 | 635,581 | ||||||||
Total net sales | 7,088,055 | $ | 8,518,757 | $ | 7,498,612 | $ | 5,152,729 | |||||
Total prepared chicken | 2,379,711 | $ | 2,646,860 | $ | 2,492,430 | $ | 1,940,121 | |||||
| (a) | The Gold Kist acquisition on December 27, 2006 and the ConAgra Chicken acquisition on November 23, 2003, have been accounted for as purchases. |
| (b) | Export items include certain chicken parts that have greater value in the overseas markets than in the United States. |
Customers of PPC’s U.S. operations
PPC markets its chicken products in the United States primarily to foodservice customers, retail customers and export and other product customers.
Foodservice. The foodservice market principally consists of chain restaurants, food processors, broad-line distributors and certain other institutions located throughout the continental United States. PPC supplies chicken products ranging from portion-controlled refrigerated chicken parts to fully-cooked and frozen, breaded or non-breaded chicken parts or formed products.
196
Table of Contents
We believe that PPC is positioned to be the primary or secondary supplier to national and international chain restaurants who require multiple suppliers of chicken products. Additionally, we believe that PPC is well suited to be the sole supplier for many regional chain restaurants. Regional chain restaurants often offer better margin opportunities and a growing base of business.
We believe that PPC’s competitive strengths include its full-line product capabilities, high-volume production capacities, research and development expertise and extensive distribution and marketing experience relative to smaller and non-vertically integrated producers. Foodservice growth, outside of any temporary effects resulting from the current recessionary impacts being experienced in the United States, is anticipated to continue.
Foodservice-prepared chicken. PPC’s prepared chicken sales to the foodservice market were $1,828.0 million in its fiscal year ended September 26, 2009. In addition to the significant increase in sales created by the acquisition of Gold Kist, PPC attributes this growth in sales of prepared chicken to the foodservice market to a number of factors. First, there has been significant growth in the number of foodservice operators offering chicken on their menus and in the number of chicken items offered. Second, foodservice operators are increasingly purchasing prepared chicken products, which allow them to reduce labor costs while providing greater product consistency, quality and variety across all restaurant locations.
There is a strong need among larger foodservice companies for a limited-source supplier base in the prepared chicken market. A viable supplier must be able to ensure supply, demonstrate innovation and new product development and provide competitive pricing. PPC has been successful in becoming a supplier of choice to many large foodservice companies as well as to many mid-sized foodservice organizations. Through vertical integration, PPC manages the breeding, hatching and growing of chickens. PPC also manages the processing, preparation, packaging, sale and distribution of its product lines, which we believe has made it one of the highest quality, lowest-cost producers of chicken in North America. PPC’s further processing facilities, with a wide range of capabilities, are particularly well-suited to the high-volume production as well as low-volume custom production runs necessary to meet both the capacity and quality requirements of the foodservice market. In addition, PPC has established a reputation for dependable quality, highly responsive service and excellent technical support.
PPC’s in-house product development group follows a customer-driven research and development focus designed to develop new products to meet customers’ changing needs. PPC’s research and development personnel often work directly with institutional customers in developing products for these customers. We believe that PPC is a leader in using advanced processing technology, which enables it to better meet its customers’ needs for product innovation, consistent quality and cost efficiency.
Foodservice-fresh chicken. PPC produces and markets fresh, refrigerated chicken for sale to U.S. quick-service restaurant chains, delicatessens and other customers. These chickens have the giblets removed, are usually of specific weight ranges and are usually pre-cut to customer specifications. They are often marinated to enhance value and product differentiation. By growing and processing to customers’ specifications, PPC is able to assist quick-service restaurant chains in controlling costs and maintaining quality and size consistency of chicken pieces sold to the consumer. PPC’s fresh chicken products sales to the foodservice market were $2,128.1 million in its fiscal year September 26, 2009.
197
Table of Contents
Retail. The retail market consists primarily of grocery store chains, wholesale clubs and other retail distributors. PPC concentrates its efforts in this market on sales of branded, prepackaged cut-up and whole chicken and chicken parts to grocery store chains and retail distributors. For a number of years, PPC has invested in both trade and retail marketing designed to establish brand name awareness and consumer preferences.
PPC utilizes numerous marketing techniques, including advertising, to develop and strengthen trade and consumer awareness and increase brand loyalty for consumer products marketed under the Pilgrim’s Pride® brand. We believe that PPC’s efforts to achieve and maintain brand awareness and loyalty help to provide more secure distribution for its products. PPC also maintains an active program to identify consumer preferences. The program primarily consists of discovering and validating new product ideas, packaging designs and methods through sophisticated qualitative and quantitative consumer research techniques in key geographic markets.
Retail-prepared chicken. PPC sells retail-oriented prepared chicken products primarily to grocery store chains located throughout the United States. PPC’s prepared chicken products sales to the retail market were $466.5 million in its fiscal year ended September 26, 2009. We believe that PPC’s growth in this market segment will continue as retailers concentrate on satisfying consumer demand for more products that are quick, easy and convenient to prepare at home.
Retail-fresh chicken. PPC’s prepackaged retail products include various combinations of freshly refrigerated, whole chickens and chicken parts in trays, bags or other consumer packs labeled and priced ready for the retail grocer’s fresh meat counter. PPC’s retail fresh chicken products are sold in the central, southwestern, southeastern and western regions of the United States. Its fresh chicken sales to the retail market were $985.0 million in its fiscal year ended September 26, 2009. We believe the retail prepackaged fresh chicken business will continue to be a large and relatively stable market, providing opportunities for product differentiation and regional brand loyalty.
Mexico
PPC is the second-largest producer and seller of chicken in Mexico and sales in Mexico represented approximately 7.3% of PPC’s net sales in its fiscal year ended September 26, 2009. We believe that PPC is one of the lower cost producers of chicken in Mexico.
While the market for chicken products in Mexico is less developed than in the United States, with sales attributed to fewer, more basic products, PPC has been successful in differentiating its products through high-quality client service and product improvements such as dry-air chilled, eviscerated products. Additionally, PPC is an important player in the live market, which accounts for 27% of the industry-wide chicken sales in Mexico. The supermarket chains consider PPC one of the leaders in innovation for fresh products. The market for value-added products is increasing. PPC’s strategy is to capitalize on this trend through its vast U.S. experience in both products and quality and its well-known service.
PPC markets its chicken products in Mexico primarily to wholesalers, large restaurant chains, fast food accounts, supermarket chains and direct retail distribution in selected markets. Due to production cutbacks and other cost-reduction measures it implemented this past year, PPC has converted its Mexico operations primarily into a regional producer servicing the central states in Mexico where it has been able to gain market share.
198
Table of Contents
PPC—Processing facilities
As of September 1, 2009, PPC operated 27 chicken processing plants located in Alabama, Arkansas, Florida, Georgia, Kentucky, Louisiana, North Carolina, South Carolina, Tennessee, Texas, Virginia, and West Virginia. PPC’s U.S. chicken processing plants have weekly capacity to process 37.2 million broilers and are expected to operate at approximately 84% of capacity in 2009. In the U.S., the processing plants were supported by 34 hatcheries, 26 feed mills, eight rendering plants and three pet food plants. The hatcheries, feed mills, rendering plants and pet food plants are expected to operate at approximately 82%, 71%, 44% and 59% of capacity, respectively, in fiscal year 2009. Capacity utilization for PPC’s rendering plants is very low because a fire in late 2008 left one of its larger plants inoperable for the first half of fiscal 2009. This rendering plant returned to its pre-fire utilization level in May 2009.
In October 2009, PPC ceased production at two facilities located in Athens, Georgia and Athens, Alabama in order to obtain additional savings. Production from the Athens, Alabama plant will be consolidated into two existing PPC complexes, bringing those facilities to full capacity. Production from the Athens, Georgia, plant has been consolidated with several existing PPC complexes, bringing those facilities to full capacity. PPC does not expect that the collective closures will impair PPC’s ability to service any of its customers.
PPC has three chicken processing plants in Mexico that have a combined capacity to process 3.2 million broilers per week and are expected to operate at 73% of capacity in 2009. As of September 1, 2009, these plants were supported by six hatcheries, four feed mills and two rendering facilities. The Mexico hatcheries, feed mills and rendering facilities are expected to operate at approximately 94%, 75% and 68% of capacity, respectively, in 2009.
PPC has one chicken processing plant in Puerto Rico with the capacity to process 0.3 million broilers per week based on one eight-hour shift per day. As of September 26, 2009, this plant was supported by one hatchery, one feed mill and one rendering facility, which are expected to operate at approximately 85%, 72% and 59% of capacity, respectively, in 2009.
PPC also operates eight prepared food production facilities. These plants are located in Alabama, Georgia, South Carolina, Tennessee, Texas and West Virginia. These plants have the capacity to produce approximately 1.3 billion pounds of further-processed product per year. In 2009, these plants are expected to operate at approximately 81% of capacity.
PPC markets fresh eggs under the Pilgrim’s Pride® brand name, as well as under private labels, in various sizes of cartons and flats to U.S. retail grocery and institutional foodservice customers located primarily in Texas. The U.S. egg industry has been consolidating over the last few years. PPC competes with other U.S. egg producers primarily on the basis of product quality, reliability, price and customer service.
PPC produces and sells livestock feeds at its feed mill in Mt. Pleasant, Texas, and at its farm supply store in Pittsburg, Texas, to dairy farmers and livestock producers in northeastern Texas. PPC engages in similar sales activities at its other U.S. feed mills. Also included in this category are chicken by-products, which are converted into protein products and sold primarily to manufacturers of pet foods.
PPC also has a small pork operation that it acquired through the Gold Kist acquisition that raises and sells live hogs to processors.
199
Table of Contents
PPC—Key customers
PPC’s two largest customers accounted for approximately 18% of its net sales in its fiscal year ended September 26, 2009, and its largest customer, Wal-Mart Stores Inc., accounted for 12% of its net sales in the same period.
Facilities
In the United States, we conduct our Beef and Pork segment operations through eight beef processing facilities, three pork processing facilities, one lamb slaughter facility, one case-ready beef and pork facility, one hide tannery, seven leased regional distribution centers and two grease producing facilities, as well as 13 feedlots operated by Five Rivers. In Australia, we operate our Beef segment operations through ten beef and smalls processing facilities, including the largest and what we believe is the most technologically advanced facility in Australia, and five feedlots, all of which are owned by us. Our facilities are strategically located to access raw materials in a cost effective manner and to service our global customer base. We have the ability to process approximately 28,600 cattle, 48,500 hogs, and 4,500 lambs daily in the United States and the ability to process 8,690 cattle and 15,000 smalls daily in Australia based on our facilities’ existing configurations. In addition, our leased Sante Fe Springs facility is used to process beef and pork products.
Upon the consummation of the Proposed PPC Acquisition, we anticipate that we will have a broiler capacity of 7.6 million head per day and will conduct our Chicken segment operations through 29 chicken processing facilities, supported by multiple feed mills, hatcheries and rendering facilities, nine further processing facilities, three pet food facilities and 14 distribution centers throughout the United States, Puerto Rico and Mexico. Of PPC’s 29 chicken processing facilities, 25 are located in the United States, with an aggregate broiler capacity of 6.9 million head per day, three are located in Mexico, with an aggregate broiler capacity of 600,000 head per day, and one is located in Puerto Rico, with a broiler capacity of 67,000 head per day.
The following table shows the location, capacity and segments represented by our processing facilities in the United States and Australia (without giving effect to the Proposed PPC Acquisition), as of September 27, 2009, all of which are owned:
| Facility location by segment | ||||||
| Beef segment | Cattle/day | Smalls/day | Hogs/day | |||
United States | ||||||
Cactus, TX | 6,000 | — | — | |||
Grand Island, NE | 6,000 | — | — | |||
Greeley, CO | 6,000 | — | — | |||
Green Bay, WI | 2,400 | — | — | |||
Hyrum, UT | 2,500 | — | — | |||
Plainwell, MI | 1,900 | — | — | |||
Souderton, PA | 1,900 | — | — | |||
Tolleson, AZ | 1,900 | — | — | |||
Australia | ||||||
Beef City | 1,100 | — | — | |||
Brooklyn | 1,500 | 8,000 | — | |||
Cobram | — | 3,000 | — | |||
Devon Port | 150 | 2,500 | — | |||
200
Table of Contents
Dinmore | 3,350 | — | — | |||
King’s Island | 180 | — | — | |||
Longford | 480 | 1,500 | — | |||
Rockhampton | 650 | — | — | |||
Townsville | 900 | — | — | |||
Yarrawonga | 380 | — | — | |||
| Pork segment | Cattle/day | Smalls/day | Hogs/day | |||
United States | ||||||
Greeley, CO | — | 4,500 | — | |||
Louisville, KY | — | — | 10,100 | |||
Marshalltown, IA | — | — | 19,700 | |||
Worthington, MN | — | — | 18,700 | |||
Transportation
We own or lease approximately 600 trucks in the United States and Australia that are specially equipped to transport raw materials and finished products. In addition, we have recently entered into an agreement to lease an additional 400 trucks, which have begun to be delivered. We also utilize third-party shipping companies that provide us with additional trucks to transport our raw materials and finished products. Diesel fuel cost is not a significant cost since the fuel cost is generally borne by the customer and so is “passed through” to the buyer of the finished goods. We do not have long-term contracts to purchase diesel fuel since we purchase most of our fuel for our trucks on the national highway system in truck stops.
PPC currently owns or leases approximately 1,300 tractors and 2,600 trailers which are used to transport chicks from the hatcheries and feed to the contract growers and chickens from the contract growers to the processing plants.
We intend to pursue a global direct distribution strategy that will enable us to improve our ability to service current customers and give us the opportunity to directly service new customers. This direct distribution strategy, which we intend to finance using a portion of the net proceeds of this offering, will require that we substantially expand our distribution network, including through the acquisition or lease of a significant additional number of trucks. See “—Our strategy—Increase sales and enhance margins by significantly expanding our direct distribution business.”
Distribution
Our distribution varies by product type. We lease seven distribution facilities located in New Jersey, Illinois, Florida, Nebraska, Arizona, Colorado and Texas and eight trading/distribution facilities in Australia. These distribution facilities are strategically located near certain of our processing facilities. We also sell our products to foodservice distributors that further distribute our products to restaurants and hotel chains and other customers. These foodservice distributors purchase our products from both our processing facilities and our current distribution facilities. We intend to pursue a global direct distribution strategy that will enable us to improve our ability to service current customers and give us the opportunity to directly service new customers in the foodservice and retail channels. This direct distribution strategy, which we intend to finance using a portion of the net proceeds of this offering, requires that we substantially expand our distribution business and sales force domestically and internationally. See “—Our
201
Table of Contents
strategy—Increase sales and enhance margins by significantly expanding our direct distribution business.” We intend to continue to sell our products to foodservice distributors following the implementation of our direct distribution strategy.
PPC currently owns five distribution centers in the United States, eight distribution centers in Mexico and one distribution center in Puerto Rico. PPC’s regional distribution centers located in Arizona, Texas and Utah are primarily focused on distributing its own chicken products. However, the distribution centers also distribute certain chicken and non-chicken products purchased from third parties to independent grocers and quick-service restaurants. PPC’s non-chicken distribution business is conducted as an accommodation to its customers and to achieve greater economies of scale in distribution logistics.
Competition
The beef, pork and chicken processing industries are highly competitive. Competition exists both in the purchase of live cattle and hogs, as well as in the sale of beef, pork and chicken products. Our products compete with a large number of other protein sources, including turkey and seafood, but their principal competition comes from other beef, pork and chicken processors, including Tyson Foods, Inc. and Cargill, Inc. Our management believes that the principal competitive factors in the beef, pork and chicken processing industries are price, quality, food safety, and product distribution.
The chicken industry is also highly competitive. In both the United States and Mexico, the reorganized PPC will primarily compete with other vertically integrated chicken companies. Competitive factors vary by major market. In the foodservice market, PPC believes competition is based primarily on consistent quality, product development, service and price. In the United States retail market, PPC believes that competition is based primarily on product quality, brand awareness, customer service and price. Further, there is some competition with non-vertically integrated further processors in the prepared chicken business.
In addition, we are pursuing a global direct distribution strategy as we seek to enhance our operating margins. This strategy, which we intend to finance using a portion of the net proceeds of this offering, may expose us to direct competition with our existing third-party foodservice distribution customers in some segments, which could affect our relationship with these customers. See “Risk factors—Risks relating to our business and the beef and pork industry—We face competition in our business, which may adversely affect our market share and profitability” and “—Risks relating to Reorganized PPC’s business and the chicken industry—Competition in the chicken industry with other vertically integrated companies may make Reorganized PPC unable to compete successfully in these industries, which could adversely affect its business.”
In Mexico, where product differentiation has traditionally been limited, product quality, service and price have been the most critical competitive factors. In July 2003, the United States and Mexico entered into a safeguard agreement with regard to imports into Mexico of chicken leg quarters from the United States. Under this agreement, a tariff rate for chicken leg quarters of 98.8% of the sales price was established. This tariff was imposed because of concerns that the duty-free importation of such products as provided by the North America Free Trade Agreement would injure Mexico’s poultry industry. This tariff rate was eliminated on January 1, 2008. As a result of the elimination of this tariff, PPC expects greater amounts of chicken to be imported into Mexico from the U.S. This could negatively affect the profitability of Mexican chicken producers, including PPC’s Mexico operations.
202
Table of Contents
Employees
Upon consummation of the Proposed PPC Acquisition, we will have approximately 72,940 employees, including, as of September 27, 2009, approximately 25,500 in our Beef segment, approximately 6,200 in our Pork segment, and approximately 41,240 in our proposed Chicken segment.
Beef and Pork segments
As of September 27, 2009, we had approximately 31,700 employees, including approximately 25,500 in our Beef segment and approximately 6,200 in our Pork segment. We consider relations with our employees to be good. Approximately 17,555 employees at our United States facilities work under collective bargaining agreements expiring in 2009 and 2010. Approximately 6,400 employees at our Australia plants are parties to Awards of Enterprise or Certified Agreements between various labor organizations and our Australian subsidiaries and work under collective agreements expiring between 2010 and 2014.
In 2001, ConAgra Beef Company, the predecessor to Swift Beef Company, paid a fine as a result of a lawsuit by the Department of Labor claiming that ConAgra Beef Company had acted improperly in too aggressively investigating the backgrounds of its job applicants. As a result, at the government’s suggestion, we began to use E-Verify, a free and voluntary online system operated jointly by the United States Department of Homeland Security and the Social Security Administration, through which participating employers can determine the employment eligibility of new hires. To date, no civil or criminal charges have been filed by the U.S. government against us or any of our current or former management employees related to an employee’s eligibility to work in the U.S.
On December 12, 2006, agents from ICE and other law enforcement agencies conducted on-site employee interviews at all of our U.S. production facilities, except with respect to the facilities located in Louisville, Kentucky and Santa Fe Springs, California, in connection with an investigation of the immigration status of an unspecified number of our workers. Approximately 1,300 individuals were detained by ICE and removed from our domestic labor force. On December 12, 2006, after a six- to seven-hour suspension of operations due to the employee interview process, we resumed production at all of our facilities in the United States, but at reduced output levels. We resumed normal production at our pork processing facilities in March 2007 and reported in May 2007 that we had returned to standard staffing levels at all of our beef processing facilities. See “Risk factors—Risks relating to our business and the beef and pork industries—Our performance depends on favorable labor relations with our employees and our compliance with labor laws. Any deterioration of those relations or increase in labor costs due to our compliance with labor laws could adversely affect our business.”
As of April 18, 2007, we implemented new policies for hiring our employees. According to the new policies, our human resources department uses all information obtained during the initial review of the documentation of the individuals applying for a job with us to verify the veracity of the relevant applicant’s information throughout the entire hiring process. This policy includes (1) checking if such information is consistent with other information related to the applicant (such as prior places of residence and previous jobs) and (2) cross-checking the information against certain indicia of fraud to determine whether the documentation is consistent with the applicant’s known identity. Applicants will not be hired if false documents are identified at any stage of the hiring process. In addition to these policies, we audit 100% of the documentation of
203
Table of Contents
new employees on a weekly basis and, on a quarterly basis, a manager that is not involved in the hiring process audits the documentation and the hiring process of 50 randomly selected employees. We also utilize a third-party immigration law expert to periodically audit our processes and methods.
Our performance depends on favorable labor relations with our employees. Any deterioration of those relations or increase in labor costs could adversely affect our business. See “Risk factors—Risk factors relating to our business and the beef and pork industry—Our performance depends on favorable labor relations with our employees and our compliance with labor laws. Any deterioration of those relations or increase in labor costs due to our compliance with labor laws could adversely affect our business.”
PPC—Employees
As of September 26, 2009, PPC had approximately 36,600 employees in the United States and approximately 4,640 employees in Mexico. Approximately 10,370 of its employees at various facilities in the United States are members of collective bargaining units. In Mexico, approximately 2,600 of its employees are covered by collective bargaining agreements. PPC has not experienced any work stoppage at any location in over six years. Approximately 80% of PPC’s unionized employees are represented by the United Food and Commercial Workers International Union and its various local affiliates, including the Retail, Wholesale, and Department Store Union, or collectively, the UFCW. PPC also has collective bargaining agreements with the following unions and their local affiliates: (1) International Brotherhood of Teamsters, or IBT; (2) Bakery, Confectionery, Tobacco Workers and Grain Millers International Union, or BCTW; and (3) The United Steel Workers of America, or USW. Since March 2009, PPC has been involved in negotiations with these unions to modify certain terms of its collective bargaining agreements that it believes are necessary for its successful reorganization. PPC has successfully negotiated settlements with UFCW, BCTW, and USW, with the result that it need not seek relief from the bankruptcy court pursuant to Section 1113 of the Bankruptcy Code. PPC’s negotiations with IBT are ongoing.
On October 13, 2009, the bankruptcy court entered an order approving PPC’s settlement agreements with the UFCW, BCTW, and USW. PPC will seek further court action with respect to the proposed modifications of PPC’s collective bargaining agreements with the IBT should it become necessary or appropriate to do so.
In late 2007, ICE began investigating immigration documentation of a portion of PPC’s workforce. With PPC’s cooperation, ICE arrested fewer than 30 employees in 2007 and more than 300 foreign national workers of Pilgrim’s Pride’s in 2008. Since April 2007, PPC has retained immigration consultants to address these issues and currently follows ICE’s “best practices” for immigration compliance, as posted by ICE in its February 2008 Worksite Enforcement Advisory. PPC is currently engaged in discussions with ICE with the intent of avoiding any future governmental enforcement against its employees or PPC. See “Risk factors—Risks relating to the reorganized PPC and the poultry industry—PPC’s efforts to comply with immigration laws, or the introduction of new immigration legislation or increased enforcement efforts, could increase our the reorganized PPC’s labor costs and other costs of doing business, exacerbate potential labor shortages or otherwise disrupt its operations, and expose it and us to civil and possibly criminal penalties.”
204
Table of Contents
PPC—PBGC Matters
PPC is a contributing sponsor or member of a contributing sponsor’s controlled group, as defined in 29 U.S.C. § 1301(a)(14), with respect to three defined benefit pension plans, which are single employer plans covered by Title IV of ERISA. Under ERISA, the contributing sponsor of a pension plan covered by Title IV of ERISA and each member of its “controlled group” is jointly and severally liable for certain obligations relating to such plan. The Pension Benefit Guaranty Corporation, or PBGC, is a wholly owned United States government corporation which administers the federal pension insurance programs under Title IV of ERISA. PBGC has filed estimated proofs of claim against PPC for unfunded benefit liabilities (in the aggregate amount of $60.3 million as of September 26, 2009), statutorily required and unpaid minimum funding contributions and past due and future insurance premiums to PBGC, which, in part, are contingent upon termination of such single employer plans. PPC has accrued this amount for the unfunded benefit liabilities as part of pension benefits in its historical financial statements included elsewhere in this prospectus. The reorganized PPC will assume, and the Plan specifically provides for the assumption of, all single employer plans of PPC and their controlled group covered by Title IV of ERISA.
Regulation
Our operations are subject to extensive regulation by the USDA, the EPA, and other state, local and foreign authorities regarding the processing, packaging, storage, distribution, advertising and labeling of its products, including food safety standards.
Our United States operations are subject to extensive regulation by the EPA and other state and local authorities relating to handling and discharge of waste water, storm water, air emissions, treatment, storage and disposal of wastes, handling of hazardous substances and remediation of contaminated soil, surface water and groundwater. Our Australian operations also are subject to extensive regulation by the Australian Quarantine Inspection Service as well as Australian environmental authorities. The EPA, AQIS, and/or other U.S. or Australian state and local authorities may, from time to time, adopt revisions to environmental rules and regulations, and/ or changes in the terms and conditions of our environmental permits, with which we must comply. Such compliance may require us to incur additional capital and operating expenses which may be significant. In order to ensure ongoing compliance with existing environmental laws, rules, and regulations, we must, from time to time, replace, repair, or upgrade existing facilities, equipment, or supplies, which may require us to incur additional capital. Some of our facilities discharge wastewater to municipally operated wastewater treatment plants, and if such municipal plants are unable to comply with their own environmental permits, they may require that we make improvements or operational changes that could result in additional costs. In addition, some of our facilities use hazardous substances such as ammonia in refrigerant systems, and releases resulting from leaks or other accidental occurrences could result in liability. Some of our properties have been impacted by contamination from spills or other releases, and we or our predecessors have incurred costs to remediate such contamination. We also have voluntarily upgraded some existing facilities to address concerns of local governmental officials and/or our neighbors. See “Risk factors—Risks relating to our business and the beef and pork industries—Compliance with environmental requirements may result in significant costs, and failure to comply may result in civil liabilities for damages as well as criminal and administrative sanctions and liability for damages.”
205
Table of Contents
Increasing efforts to control emissions of greenhouse gases, or GHG, are likely to impact us. In the United States, the EPA recently issued a new rule establishing a mandatory GHG reporting system for certain activities, including manure management systems, which exceed specified emission thresholds. The EPA has also announced a finding relating to GHG emissions that may result in promulgation of GHG air quality standards. The U.S. Congress is considering various options including a cap and trade system which would impose a limit and a price on GHG emissions, and establish a market for trading GHG credits. In June 2009, the House of Representatives passed a bill contemplating such a cap and trade system, and cap and trade legislation has also been introduced in the Senate. Certain states have taken steps to regulate GHG emissions that may be more stringent than federal regulations. In Australia, the federal government has proposed a GHG cap and trade system that, if ultimately enacted as proposed, would cover agricultural operations, including certain of our feedlots, and at least two of our processing plants. Certain states in Australia could also adopt regulations of GHG emissions which are stricter than Australian federal regulations. While it is not possible to estimate the specific impact final GHG regulations will have on our operations, there can be no guarantee that these measures will not result in significant impacts on us.
Our U.S. operations are subject to the U.S. Packers and Stockyards Act of 1921. This statute generally prohibits meat packers in the livestock industry from engaging in certain anti-competitive practices. In addition, this statute requires us to make payment for our livestock purchases before the close of the next business day following the purchase and transfer of possession of the livestock we purchase, unless otherwise agreed to by our livestock suppliers. Any delay or attempt to delay payment will be deemed an unfair practice in violation of the statute. Under the Packers and Stockyards Act, we must hold our cash livestock purchases in trust for our livestock suppliers until they have received full payment of the cash purchase price. As of September 27, 2009, we maintained surety bonds in the aggregate amount of approximately $77.8 million to secure our payment obligations to our livestock suppliers.
We are also subject to voluntary market withdrawals and recalls of our meat products in the event of suspected contamination or adulteration that could constitute food safety hazards. We maintain a rigorous program of interventions, inspections and testing to reduce the likelihood of food safety hazards. As a proactive measure, our management team expanded our testing procedures in all of our beef processing plants. For example, on June 25, 2009, we voluntarily undertook a recall of certain of our beef products that may have been contaminated with E. coli. While we are unable to ascertain the exact cost we will incur relating to these voluntary recalls, we estimate the total cost of these recalls was less than $4 million. See “Risk factors—Risks relating to our business and the beef and pork industries—Any perceived or real health risks related to the food industry could adversely affect our ability to sell our products. If our products become contaminated, we may be subject to product liability claims and product recalls.”
We monitor certain asset retirement obligations in connection with our operations. These obligations relate to clean-up, removal or replacement activities and related costs for “in-place” exposures only when those exposures are moved or modified, such as during renovations of our facilities. These in-place exposures include asbestos, refrigerants, wastewater, oil, lubricants and other contaminants common in manufacturing environments. Under existing regulations, we are not required to remove these exposures and there are no plans or expectations of plans to undertake a renovation that would require removal of the asbestos, nor the remediation of the other in place exposures at this time. The facilities are expected to be maintained and repaired by activities that will not result in the removal or disruption of these in place exposures. As a result, there is an indeterminate settlement date for these asset retirement obligations because
206
Table of Contents
the range of time over which we may incur these liabilities is unknown and cannot be reasonably estimated. Therefore, we cannot reasonably estimate and have not recorded the fair value of the potential liability.
Our facilities have, from time to time received notices from regulatory authorities, citizens groups or others asserting that we are not in compliance with specified laws and regulations, and sometimes our facilities have been subject to additional investigations and/or enforcement actions regarding such alleged violations by us or by our predecessors. In some instances, litigation ensues, including the matters discussed below in “Legal proceedings.”
PPC—Regulation and environmental matters
The chicken industry is subject to government regulation, particularly in the health and environmental areas, including provisions relating to the discharge of materials into the environment, by the USDA, the FDA and the EPA in the United States and by similar governmental agencies in Mexico. PPC’s chicken processing facilities in the U.S. are subject to on-site examination, inspection and regulation by the USDA. The FDA inspects the production of PPC’s feed mills in the United States. PPC’s Mexican food processing facilities and feed mills are subject to on-site examination, inspection and regulation by a Mexican governmental agency that performs functions similar to those performed by the USDA and FDA. PPC believes that it is in substantial compliance with all applicable laws and regulations relating to the operations of its facilities.
PPC’s operations are subject to extensive regulation by the EPA and other state and local authorities relating to handling and discharge of waste water, storm water, air emissions, treatment, storage and disposal of wastes, handling of hazardous substances and remediation of contaminated soil, surface water and groundwater. PPC’s Mexican operations also are subject to extensive regulation by Mexican environmental authorities. The EPA and/or other U.S. or Mexican state and local authorities may, from time to time, adopt revisions to environmental rules and regulations, and/or changes in the terms and conditions of PPC’s environmental permits, with which PPC must comply. A number of PPC facilities have been operating below capacity due to economic conditions, and upgrades at some facilities have been delayed or deferred because of the bankruptcy. Before production can be restored to pre-bankruptcy levels, capital expenditures and operating expenses which may be significant may be necessary at some facilities in order to achieve compliance with existing or new environmental requirements, including more stringent limitations imposed or expected in recently-renewed or soon-to be renewed environmental permits.
Some of PPC’s properties have been impacted by contamination from spills or other releases, and PPC has incurred costs to remediate such contamination. In addition, PPC in the past acquired businesses with operations such as pesticide and fertilizer production that involved greater use of hazardous materials and generation of more hazardous wastes than PPC’s current operations. While many of those operations have been sold or closed, some environmental laws impose strict and, in certain circumstances, joint and several liability for costs of investigation and remediation of contaminated sites on current and former owners and operators of the sites, and on persons who arranged for disposal of wastes at such sites. In addition, current owners or operators of such contaminated sites may seek to recover cleanup costs from PPC based on past operations or contractual indemnifications. See “Risk factors—Risks relating to the Proposed PPC Acquisition—The reorganized PPC may face significant costs for compliance with existing or changing
207
Table of Contents
environmental requirements and for potential environmental obligations relating to current or discontinued operations.”
We anticipate increased regulation by the USDA concerning food safety, by the FDA concerning the use of medications in feed and by the EPA and various other state agencies concerning discharges to the environment. Currently, we do not anticipate any regulations having a material adverse effect, however, changes in laws or regulations or the application thereof may lead to government enforcement actions and the resulting litigation by private litigants. Additionally, unknown matters, new laws and regulations, or stricter interpretations of existing laws or regulations may materially affect PPC’s business or operations in the future.
Legal proceedings
From time to time, we are parties to various legal proceedings incident to our business. As of the date of this prospectus, there were no legal proceedings against us with respect to matters arising outside the ordinary course of business or which we anticipate would have a material adverse effect on us other than the matters described under “Wastewater issues” below.
Wastewater issues
Smithfield Souderton, Pennsylvania facility
In connection with the JBS Packerland Acquisition, we acquired a beef processing plant in Souderton, Pennsylvania. There were two reported wastewater incidents at the Souderton facility in 2006. These incidents were resolved by a consent order and agreement with the State of Pennsylvania providing for civil penalties and damages totaling $77,888 and establishing an enforceable schedule for the completion of a planned $5 million upgrade to the facility’s existing wastewater treatment system.
On August 10, 2007, the Souderton facility experienced a separate wastewater release, which reached a nearby tributary, Skippack Creek. The facility received an EPA Section 308 Information Request pursuant to the Clean Water Act from the Environmental Protection Agency Region III requesting further details on, among other things, this incident and overflows generally from the collection system that routes wastewater from facility process units to the wastewater treatment works.
On December 5, 2007, the Souderton facility experienced an operational upset in a part of the chlorination system of its wastewater treatment plant. The plant discharges to Skippack Creek. JBS Packerland provided notice of the upset on the same day, and then filed a written report to the Pennsylvania Department of Environmental Protection and the Pennsylvania Fish and Boat Commission. In the written report, JBS Packerland stated that it had already reconfigured the chlorination system to prevent a recurrence and that the facility intended to replace the existing chlorination system, pending approval of plans that had been submitted to the State prior to the upset. The EPA and the Department of Justice have commenced an investigation into the incident and have issued grand jury subpoenas for documents and testimony. The facility is cooperating with the investigation.
On June 10, 2008, the Souderton facility experienced a separate release, which reached Skippack Creek and resulted in a fish kill. An initial investigation revealed the discharge was condenser water from JBS Packerland’s rendering plant which had bypassed the wastewater treatment
208
Table of Contents
facility. The facility provided notice of the release on the same day to state environmental authorities and filed a written report with the Pennsylvania Department of Environmental Protection and Fish and Boat Commission. The EPA has commenced an investigation, and the facility is cooperating with the investigation.
On December 29, 2008, the United States Department of Justice commenced a civil action against us in the federal district court for the Eastern District of Pennsylvania in connection with these past violations of the federal Clean Water Act at the Souderton facility. At this time, due to the nature and circumstances of this enforcement action, it is not possible to assess the liability, including any potential penalties, associated with these incidents. In connection with the JBS Packerland Acquisition, Smithfield Foods, Inc. agreed to indemnify us for all damages arising from the wastewater incidents of August 10, 2007 and December 5, 2007 and June 10, 2008.
In addition, Smithfield Foods, Inc. provided us with the following indemnity for liability arising out of the Souderton, Pennsylvania facility’s wastewater releases:
| • | dollar-for-dollar indemnity for liability arising out of the 2006 and 2007 wastewater releases; |
| • | indemnity for any liability arising out of the June 2008 release subject to a $2.5 million deductible, a $100 million liability cap and a $25,000 minimum claim exclusion; and |
| • | indemnity for any liability arising out of a breach of the representations and warranties contained in the JBS Packerland acquisition documents subject to a $2.5 million deductible, a $100 million liability cap and a $25,000 minimum claim exclusion. |
In addition, Smithfield Foods, Inc. is generally liable for costs associated with facility upgrades, operational changes, and capital expenditures required in connection with the Souderton facility releases. Notwithstanding the foregoing, Smithfield Foods, Inc.’s indemnification obligation does not extend to capital expenditures relating to the upgrade of the Souderton wastewater facility required by the October 11, 2007 consent order and agreement relating to the June and September 2006 releases.
Grand Island, Nebraska facility
In May 2008, the Nebraska Department of Environmental Quality, or DEQ, and the EPA alleged that from 2004 to the present the wastewater discharge from our Grand Island, Nebraska plant had violated various provisions of the Nebraska Environmental Protection Act and the federal Clean Water Act by causing the City of Grand Island to violate the limits in its wastewater discharge permit. The EPA and DEQ are seeking a fine and an injunction to ensure our future compliance with the Nebraska Environmental Protection Act and the federal Clean Water Act. We are currently conducting settlement negotiations with the EPA and DEQ to resolve this matter.
In January 2009, we received a grand jury subpoena from the United States Attorney’s Office for the District of Nebraska, requesting documents related to our wastewater pretreatment system for the Grand Island plant. We are complying with the subpoena. We are currently engaged in settlement discussions with the DEQ and the EPA.
We do not currently maintain insurance covering environmental liability.
209
Table of Contents
EEOC proceedings
In September 2008, approximately 190 employees at our Greeley and Grand Island, Nebraska plants walked off the job when told that they could not break to pray at sundown to mark the end of a daylong fast, a requirement of Islam during the period of Ramadan. Approximately 100 employees and 90 employees were fired from our Greeley and Grand Island plants, respectively, after not returning for work days later. Complaints on behalf of most of the fired employees were filed with the U.S. Equal Employment Opportunity Commission, or the EEOC, alleging, among other things, discrimination in employment and failure to accommodate religious requests of employees. On August 31, 2009, the EEOC determined that we had violated a portion of the civil rights law prohibiting certain forms of discrimination in employment, denied religious accommodation and retaliated against workers who complained about discrimination. The EEOC determination requires that we conciliate the terms of a settlement with the fired employees. We recently received notice from the EEOC that conciliation had failed, and, as a result, either the EEOC or the fired employees may file a lawsuit against us. Following the September 2008 incidents, we established special prayer rooms at our plants and have implemented procedures allowing our Muslim employees to take the necessary time to meet their religious obligations, and we did not experience any problems during this year’s period of Ramadan.
PPC—Legal proceedings
Donning and doffing litigation
PPC is a defendant in two collective actions brought by employees or former employees for unpaid wages, unpaid overtime wages, liquidated damages, costs and attorneys’ fees, based on time spent donning and doffing uniforms and protective gear. Those actions areRandolph Benbow et al v. Gold Kist, pending in the United States District Court for the District of South Carolina, or the Benbow Action, andMDL 1832 Pilgrim’s Pride Fair Labor Standards Act Litigation, pending in the United States District Court for the Western District of Arkansas, or the MDL Action. Following the filing of these actions, a similar suit was filed as an adversary proceeding in the bankruptcy court, entitledAnna Atkinson, et al. v. Pilgrim’s Pride Corporation, Gold Kist, Inc., or the Atkinson Action, which was subsequently consolidated into the Benbow Action. Collectively, these actions include approximately 13,900 employees. Class proofs of claim were filed on behalf of the plaintiffs in the MDL Action for at least $45 million and for the plaintiffs in the Benbow Action for at least $11 million. The MDL Action is currently in settlement negotiations. PPC has entered into a settlement agreement for the Benbow Action for $1.75 million. The bankruptcy court has entered an order approving the settlement agreement. PPC expects to finalize this settlement prior to the Proposed PPC Acquisition Closing Date. With respect to both actions, PPC denies liability to the plaintiffs under various theories, including without limitation, that the plaintiffs spend only ade minimis amount of time each day donning and doffing protective gear.
In addition, the Department of Labor, or DOL, had pending a suit seeking approximately $6.1 million for workers in PPC’s Dallas plant for time spent donning and doffing. This case involves approximately 500 employees and former employees and seeks essentially the same types of damages as are sought in the Benbow Action and the MDL Action. The DOL is also seeking injunctive relief to require PPC to pay for donning and doffing time in all of PPC’s U.S. plants. PPC denies any liability to the DOL.
210
Table of Contents
Securities litigation
On October 29, 2008, Ronald Acaldo filed a purported class action suit in the U.S. District Court for the Eastern District of Texas, Marshall Division, against PPC and individual defendants Lonnie “Bo” Pilgrim, Lonnie Ken Pilgrim, J. Clinton Rivers, Richard A. Cogdill and Clifford E. Butler, or the Acaldo Case. The complaint alleged that PPC and the individual defendants violated Sections 10(b) and 20(a) of the Securities Exchange Act of 1934, as amended, and Rule 10b-5 promulgated thereunder. The complaint sought unspecified injunctive relief and an unspecified amount of damages. On November 13, 2008, Chad Howes filed suit in the U.S. District Court for the Eastern District of Texas, Marshall Division, against PPC and individual defendants Lonnie “Bo” Pilgrim, Lonnie Ken Pilgrim, J. Clinton Rivers, Richard A. Cogdill and Clifford E. Butler, or the Howes Case. The allegations in the Howes Case complaint are identical to those in the Acaldo Case complaint, as are the class allegations and relief sought. The defendants were never served with the Howes Case complaint.
On December 29, 2008, the Pennsylvania Public Fund Group filed a motion to consolidate the Howes Case into the Acaldo Case, and filed a motion to be appointed lead plaintiff and for approval of lead plaintiff’s selection of lead counsel and liaison counsel. Also on that date, the Pilgrim’s Investor Group (in which Mr. Acaldo is a part) filed a motion to consolidate the Howes Case into the Acaldo Case and a motion to be appointed lead plaintiff. The Pilgrim’s Investor Group subsequently filed a notice of non-opposition to the Pennsylvania Public Fund Group’s motion for appointment of lead plaintiff. Mr. Howes did not seek to be appointed lead plaintiff.
On May 14, 2009, the court consolidated the Acaldo Case and the Howes Case and renamed the style of the case, “In re: Pilgrim’s Pride Corporation Securities Litigation.” On May 21, 2009, the court granted the Pennsylvania Public Fund Group’s motion for appointment of lead plaintiff. Thereafter, on June 26, 2009, lead plaintiff filed a consolidated (and amended) complaint. The consolidated complaint dismissed PPC and Clifford E. Butler as defendants. In addition, the consolidated complaint added the following directors as defendants: Charles L. Black, S. Key Coker, Blake D. Lovette, Vance C. Miller, James G. Vetter, Jr., Donald L. Wass, Linda Chavez, and Keith W. Hughes. The directors are indemnified by PPC and have insurance to offset the defense costs and damages, which coverage is being provided by the carriers under a reservation of rights by the insurance carriers.
The consolidated complaint alleges four causes of action: violations of Sections 10(b) and 20(a) of the Securities Exchange Act of 1934, as amended, and Rule 10b-5 promulgated thereunder, solely against Lonnie “Bo” Pilgrim, Clint Rivers, and Richard A. Cogdill, collectively, Officer Defendants. Those claims assert that, during the class period of May 5, 2008 through October 28, 2008, the defendants, through various financial statements, press releases and conference calls, made material misstatements of fact and/or omitted to disclose material facts by purportedly failing to completely impair the goodwill associated with the Gold Kist acquisition. The consolidated complaint also asserts claims under Section 11 of the Securities Act of 1933, as amended, or the Securities Act, against all defendants, asserting that, statements made in the registration statement relating to the May 14, 2008 secondary offering of PPC common stock were materially false and misleading for their failure to completely impair the goodwill associated with the Gold Kist acquisition. Finally, the consolidated complaint asserts a violation of Section 15 of the Securities Act against the Officer Defendants only, claiming that the Officer Defendants were controlling persons of PPC and the other defendants in connection with the Section 11 violation. By the consolidated complaint, the lead plaintiff seeks certification of the class, undisclosed damages, and costs and attorneys’ fees.
211
Table of Contents
On July 27, 2009, defendants filed a motion to dismiss the consolidated class action complaint. The plaintiffs filed an opposition to the motion to dismiss on August 27, 2009. Defendants filed a reply brief on September 10, 2009, and plaintiffs filed a sur-reply on September 24, 2009. That motion is still pending.
Grower litigation
On July 1, 2002, three individuals, on behalf of themselves and a putative class of chicken growers, filed their original class action complaint against PPC in the United States District Court for the Eastern District of Texas, Texarkana Division, styledCody Wheeler, et al. v. Pilgrim’s Pride Corporation. In their lawsuit, the plaintiffs initially alleged (a) that PPC violated sections 192(a)-(b) of the Packers and Stockyards Act of 1921, or the PSA, (b) breached grower contracts, and (c) various other extra-contractual and tort causes of action. The plaintiffs also brought individual actions for breach of contract, breach of fiduciary duties, and violations of the PSA. During the litigation, the district court dismissed certain claims and plaintiffs abandoned their class claims. On September 30, 2005, plaintiffs amended their lawsuit to join several entities owned and/or operated by Tyson Foods, Inc. as a co-defendants alleging that the Tyson Foods, Inc. entities and PPC conspired to depress grower pay in certain areas of Texas and Arkansas in violation of the Sherman Antitrust Act of 1890, or the Sherman Antitrust Act. Plaintiffs also sought to certify a class based on the new the Sherman Antitrust Act claim. Thereafter, the district court bifurcated the lawsuit into two separate cases, an antitrust case that includes the Tyson entities and the original PSA case. Later, the district court denied plaintiffs’ request to certify a class action based on the Sherman Antitrust Act claim. The Sherman Antitrust Act claim was stayed due to the bankruptcy filing. However, the stay will be lifted in February 2010. The plaintiffs’ PSA case was pending before the United States Fifth Circuit Court of Appeals based on a certified legal issue as to whether plaintiffs must prove an anticompetitive effect in order to prevail under their PSA claims. On December 15, 2009, the Fifth Circuit overturned a previous ruling issued by the court and held that an adverse effect on competition is required to prevail under the PSA. The plaintiffs are permitted to appeal the Fifth Circuit’s decision to the United States Supreme Court but have given no indication whether or not they plan to appeal. PPC expresses no opinion as to the likelihood of an unfavorable outcome and denies liability in both cases.
An adversary proceeding was filed on behalf of 555 claimants, predominantly growers or former growers, seeking, in general, unspecified damages under the PSA, the Texas Deceptive Trade Practices Act, or the DTPA, common law fraud and fraudulent non-disclosure, promissory estoppel and intentional infliction of emotional distress. This action is entitledAdams, et al. v. Pilgrim’s Pride Corporation. In response to the adversary proceeding, the reference of which was withdrawn from the bankruptcy court to the federal district court, PPC filed a motion to dismiss. This case was consolidated with the City of Clinton case described below. The motion to dismiss was granted in part, dismissing all the plaintiffs’ claims except for claims brought under the PSA and claims brought by Texas growers under the DTPA, subject to the plaintiffs’ right to file a motion for leave to file an amended complaint. Plaintiffs filed a motion seeking leave to amend their complaint to replead their claims and a motion to transfer the case from the federal district court in Fort Worth, Texas to a federal district court in the Eastern District of Texas. The court granted plaintiffs’ motion for leave, and plaintiffs filed their amended complaint on December 7, 2009. PPC filed an opposition to the motion to transfer venue, but the motion to transfer venue was granted. PPC denies liability and expresses no opinion as to the likelihood of an unfavorable outcome.
212
Table of Contents
A lawsuit was also filed by Ricky Arnold and others against PPC and two of its employees, Danny Boone and Jamie Statler, in the Circuit Court of Van Buren County, Arkansas. The case is styled
Ricky Arnold, et al. v Pilgrim’s Pride Corporation, et al., or the Arnold Suit. The plaintiffs in the Arnold Suit include independent contract broiler growers from 74 separate chicken farms. In the Arnold Suit, the plaintiffs allege that PPC and its employees made various false representations to induce the plaintiffs into building chicken farms and entering into chicken growing agreements with PPC. The plaintiffs allege that they discovered the representations were false when PPC idled its Clinton, Arkansas processing plant on or around August 11, 2008. The plaintiffs assert claims for: (a) fraud and deceit; (b) promissory estoppel; and (c) violations of the Arkansas Livestock and Poultry Contract Protection Act. The damages (if any) are not liquidated. The plaintiffs filed proofs of claim in the bankruptcy court and PPC filed objections to the proofs of claim. The case was stayed due to the bankruptcy filing. PPC denies any liability to the Arnold plaintiffs and expresses no opinion as to the likelihood of an unfavorable outcome.
ERISA litigation
In re Pilgrim’s Pride Stock Investment Plan ERISA Litigation, No. 2:08-cv-472-TJW, is pending in the United States District Court for the Eastern District of Texas, Marshall Division, against defendants Lonnie “Bo” Pilgrim, Lonnie “Ken” Pilgrim, Clifford E. Butler, J. Clinton Rivers, Richard A. Cogdill, Renee N. DeBar, the Compensation Committee and other unnamed defendants, or the PPC Defendants. This case is the consolidation of two putative class actions filed by Kenneth Patterson and Denise Smalls, respectively, pursuant to section 502 of ERISA, or the Patterson Case. During the Chapter 11 cases, PPC sought to extend the bankruptcy stay to the Patterson Case. PPC’s motion was denied by the bankruptcy court without prejudice.
Plaintiffs allege generally that the individual defendants breached fiduciary duties of prudence and loyalty owed to participants and beneficiaries of the PPC Retirement Savings Plan and the To-Ricos, Inc. Employee Savings and Retirement Plan, together, the Savings Plan, due to the Savings Plan’s allegedly imprudent investment in PPC common stock, and the defendants’ alleged failure to provide accurate information to participants and beneficiaries. Patterson and Smalls object to the releases set forth in the Plan to the extent they are interpreted to release claims in the Patterson case.
Deadlines in the Patterson Case have been adjourned until January 15, 2010 to allow the parties to pursue mediation. If mediation is unsuccessful, the parties will submit a proposed briefing schedule to the court to address the deadlines for filing an amended complaint, for continuing discovery on expert and non-expert issues (including but not limited to class certification), for submission of a motion to dismiss, and for briefing on class certification. If mediation is unsuccessful, it is anticipated that plaintiffs will seek certification of a class of all persons or entities who were participants in or beneficiaries of the Savings Plan at any time between May 5, 2008 through the present and whose accounts held PPC common stock or units in PPC common stock, and will seek actual damages in the amount of any losses the Savings Plan suffered, to be allocated among the participants’ individual accounts as benefits due in proportion to the accounts’ diminution in value, attorneys’ fees, an order for equitable restitution and the imposition of constructive trust, and a declaration that each of the defendants have breached their fiduciary duties to the Savings Plan participants. The court has ordered discovery to proceed on expert and non-expert issues. The parties have commenced discovery. The court has also ordered briefing on class certification, with a hearing to be held on March 30, 2010.
The likelihood of an unfavorable outcome or the amount or range of any possible loss to PPC cannot be determined at this time. PPC has a liability insurance policy in place that is available to offset the defense costs and damages in the Patterson case, which coverage is being provided
213
Table of Contents
under a reservation of rights. The insurance provider has acknowledged its duty to defend these claims by consenting to the representation of the PPC Defendants by legal counsel selected by PPC. The insurance provider has also agreed to pay defense costs as PPC has been unable to indemnify the PPC Defendants due to its current financial condition.
On October 9, 2009, David Simmons, Carla Simmons, Patty L. Funkhouser, and Dickie L. Funkhouser, or collectively, Funkhouser, filed a putative class action, styledSimmons et al v.Pilgrim, et al., Action No. 2:09-CV-121, against Lonnie A. Pilgrim, Lonnie “Ken” Pilgrim, Clifford Butler, O.B. Goolsby, Richard A. Cogdill, S. Key Coker, Blake D. Lovette, Vance C. Miller, James G. Vetter, Donald L. Wass, Charles L. Black, Linda Chavez, J. Clinton Rivers, Keith W. Hughes, Don Jackson, the Administrative Committee of the Pilgrim’s Pride Retirement Savings Plan, or PPC Retirement Savings Plan, Renee DeBar, Jane Brookshire, Gerry Evenwel, the Prudential Retirement Insurance and Annuity Company, and other unnamed defendants in the United States District Court for the Northern District of West Virginia, alleging that the fiduciaries breached their duties to the participants and beneficiaries by, among other things, amending the PPC Retirement Savings Plan, allowing imprudent investments in PPC common stock, failing to collect delinquent employer contributions and failing to file unsecured and priority claims on behalf of the 401(k) plan or otherwise protect the rights of 401(k) participants in the Chapter 11 cases, or the Funkhouser Action. The plaintiffs sought certification of a class of all persons or entities who were participants or beneficiaries under the PPC Retirement Savings Plan between October 3, 2002 and the present, and sought a determination that the defendants breached their fiduciary and co-fiduciary duties to the PPC Retirement Savings Plan and the participants and beneficiaries, restoration to the PPC Retirement Savings Plan and to their participants and beneficiaries of the losses sustained by the PPC Retirement Savings Plan, imposition of a constructive trust, attorneys’ fees, and further legal, equitable or remedial relief. Before the defendants were required to respond to the complaint, an amended complaint was filed on December 14, 2009, which, among other things, named additional defendants and amended certain allegations. Although PPC is not a named defendant, its bylaws require PPC to indemnify its current and former directors and officers from liabilities and expenses incurred by them in connection with actions taken by them. PPC’s liability insurer has been notified of the Funkhouser Action.
Certain of the participants, or the ERISA claimants in PPC’s 401(k) plans have also filed individual and putative class proofs of claims against PPC relating to essentially the same facts as those underlying the Patterson Case and the Funkhouser Action, together the ERISA POCs. In the ERISA POCs, the ERISA claimants assert claims in excess of $35 million. PPC denies any liability to the ERISA claimants and expresses no opinion as to the likelihood of an unfavorable outcome.
The Plan contemplates assumption of the 401(k) plans and provides that PPC will cure any default under the 401(k) plan documents for which the bankruptcy court finds PPC liable. To the extent the claims alleged in the ERISA POCs relate to defaults under the 401(k) plan documents, PPC will cure such defaults in the amount determined by, and upon a final order of, the bankruptcy court finding PPC liable for such defaults.
Environmental litigation
Drexel Chemical Company, or Drexel, has filed suit in the United States District Court for the Middle District of Georgia, seeking to recover remediation costs in connection with a plant Drexel purchased from Gold Kist. Drexel filed a proof of claim in the amount of $1.9 million plus any remediation costs incurred during the bankruptcy proceedings. PPC denies liability to Drexel.
214
Table of Contents
City of Clinton, Arkansas
The City of Clinton, Arkansas, or the City of Clinton, filed an adversary proceeding against PPC on June 1, 2009 seeking to establish a claim pursuant to the PSA, fraud and fraudulent non-disclosure, and for promissory estoppel related to the idling of PPC’s Clinton, Arkansas plant. The City of Clinton is seeking approximately $28 million in damages relating to construction of and/or improvements to a wastewater facility to purify water discharged from the PPC’s processing plant. This action is entitledThe City of Clinton v. Pilgrim’s Pride Corporation.In response to the adversary proceeding, the reference of which was withdrawn from the bankruptcy court to the federal district court, PPC filed a motion to dismiss, which was granted by the federal district court on September 15, 2009. This case has been consolidated with the Adams case described above. Recently, the City of Clinton sought leave to replead its claims. PPC opposed the City of Clinton’s request for leave to file an amended repleading. On December 2, 2009, the court ruled that the City of Clinton could not replead its claims and dismissed the claims with prejudice.
Intellectual property
We hold a number of trademarks, patents and domain names that we believe are material to our business and which are registered with the United States Patent and Trademark Office, including “Swift” and “Monfort” derivative trade names and “Miller Blue Ribbon Beef.” We have also registered “Swift” and “Monfort” derivative trademarks in most of the foreign countries to which we sell our products, except in Argentina, Canada, Japan and in the Philippines. In Argentina, the “Swift” and derivative trademarks are owned by JBS S.A. In Japan, we are authorized to use the trademark “Swift” under an exclusive license agreement entered into with Nippon Meat Packers Inc. In addition, upon consummation of the Proposed PPC Acquisition, our brands will include the Pilgrim’s Pride,Country Pride,Gold Kist andPierce Chicken trade names. Currently, we have a number of patent applications and trademark registrations pending in the United States and in foreign countries. In addition to trademark protection, we attempt to protect our unregistered trademarks and other proprietary information under trade secret laws, employee and third-party non-disclosure agreements and other laws and methods of protection.
Insurance
We have an insurance program that provides for protection against (1) property damages affecting most of our buildings, furniture, machinery, appliances, products and raw materials caused by fire, lightning, explosion, flooding, electrical faults, landslides, riots, strikes, lock-outs and windstorms, (2) deterioration of goods in refrigerated areas, and (3) robbery and theft. Our insurance is renewed annually. We believe that our insurance policy provides suitable coverage for the risks inherent to our operations both in terms of the type of coverage and of the insured amounts. Even though we have insurance policies, there are risks that are not insurable, such as war, unavoidable and unforeseen circumstances or the interruption of some activities and losses arising from events that are not insured. If any of these events occur, we may incur significant costs which may have a material adverse effect upon our financial performance and results of operation.
We are self-insured for employee medical and dental benefits and purchase insurance policies with deductibles for certain losses related to worker’s compensation and casualty and property damage claims. We purchase stop-loss coverage in order to limit our exposure to any significant
215
Table of Contents
level of certain claims. We are self-insured for risks relating to environmental liability. Self- insured losses are accrued based upon periodic assessments of estimated settlements for known and anticipated claims.
Information technology
Our software system of accounts receivable, accounts payable, inventory, accounting, payroll and procurement, which is used by our legacy business units, allows us to accurately manage our cash flows, accounts receivable and accounts payable in our operating locations. These systems are being integrated into the newly acquired businesses. We continue to analyze new information technology alternatives to increase our efficiency and reduce our costs.
We have experience managing the integration of information technology. For example, we have already fully integrated into our reporting structure the Tasman Group and JBS Packerland, including Five Rivers, and we expect to have fully integrated Pilgrim’s Pride’s into our reporting structure by the Proposed PPC Acquisition Closing Date.
216
Table of Contents
Directors and executive officers
The following table sets forth the name, age and position of individuals who currently serve as the directors and executive officers of JBS USA Holdings, Inc. Ages are as of September 27, 2009.
| Name | Age | Position(s) | ||
Wesley Mendonça Batista | 39 | President, Chief Executive Officer and Director | ||
André Nogueira de Souza | 41 | Chief Financial Officer | ||
Dennis Roerty | 45 | Treasurer | ||
Robert Daubenspeck | 50 | Head of Human Resources | ||
Martin J. Dooley | 48 | Head of Pork | ||
Brent Eastwood | 43 | Head of JBS Trading | ||
William G. Trupkiewicz | 46 | Chief Accounting Officer, Secretary | ||
Richard Vesta | 62 | Head of Beef | ||
Joesley Mendonça Batista | 37 | Director | ||
José Batista Júnior | 49 | Director | ||
The following is a biographical summary of the experience of our directors and executive officers.
Wesley Mendonça Batistabecame our President and Chief Executive Officer in May 2007. Mr. Batista also serves as a member of our Board of Directors. In addition to his responsibilities in the United States, Mr. Batista is currently the interim Executive Director of Operations of JBS S.A. and is the Vice President of its Board of Directors. Mr. Batista has served in various capacities at JBS S.A. since 1987. Mr. Batista is the brother of Joesley Mendonça Batista, the President of JBS S.A., and José Batista Júnior, a Director of JBS S.A., and is the son of José Batista Sobrinho, the founder of JBS S.A. and a member of its Board of Directors.
André Nogueira de Souzabegan acting as our Chief Financial Officer in August 2007. Before joining us, Mr. Nogueira served as head of Corporate Banking for Banco do Brasil in their New York and São Paulo offices from January 2000 to August 2007.
Dennis Roertybecame our Treasurer in February 2009. Prior to that date, Mr. Roerty was the Treasurer of UAP Holding Corp. from March 2004 to February 2009, where he was responsible for treasury, financial planning and analysis, and leading the company’s acquisition program. Prior to joining UAP, Mr. Roerty worked for PPL Global, LLC from 1998 to 2004, serving most recently as Director of Acquisitions and Divestitures. Mr. Roerty also held various positions in financial analysis and treasury with Air Products and Chemicals from 1988 to 1998.
Robert Daubenspeckbecame our head of Human Resources in February 2009. Prior to serving in such role, Mr. Daubenspeck served in the same capacity for JBS Packerland from 2002 to 2008. Previously, Mr. Daubenspeck has served as human resources director for JBS Packerland’s Souderton, Pennsylvania plant.
Martin J. Dooleybecame the head of our Pork segment in June 2007. From May 2006 to May 2007, Mr. Dooley was our Executive Vice President, Margin Management. From November 2004
217
Table of Contents
to May 2006, Mr. Dooley was employed as Vice President, Margin Management of Swift Foods Company and was responsible for cattle and hog procurement, beef and pork pricing, and risk management. From September 2002 to November 2004, Mr. Dooley was employed as Vice President, Processor Sales, Beef and Pork of Swift Food Company. From 1998 to 2002, Mr. Dooley was Swift Food Company’s Vice President Processor Sales and Risk Management, Pork. From 1993 to 1998, Mr. Dooley was Swift Food Company’s Vice President Processor Sales, Pork. Prior to 1993, Mr. Dooley was employed in various positions in product management and sales for Swift Food Company.
Brent Eastwoodbecame our head of JBS Trading in October 2007. Prior to serving as head of JBS Trading, Mr. Eastwood served as General Manager of Trading for Swift/AMH in Australia for six years. Prior to joining Swift, Mr. Eastwood served as Managing Director of ConAgra Trade Group’s Australian Meat Division.
William G. Trupkiewiczbecame our Corporate Controller, Chief Accounting Officer and Secretary in July 2007. Mr. Trupkiewicz served as our Acting Treasurer from June 2008 to February 2009 and as Acting Chief Financial Officer of predecessor companies effective February 20, 2006 until October 26, 2006. Mr. Trupkiewicz served in senior financial positions including Senior Vice President, Corporate Controller and Chief Accounting Officer of predecessor companies from September 2002 until May 2006. Mr. Trupkiewicz has been employed by JBS USA Holdings, Inc. and its predecessor companies in various senior finance and accounting positions since October 1994. From June 1993 until October 1994, Mr. Trupkiewicz was employed as Vice President, Controller of Vessels Oil and Gas Company, a Denver-based oil and gas production company. Prior to his employment at Vessels, Mr. Trupkiewicz served as Vice President Financial Reporting and Tax for SafeCard Services, Inc., a NYSE traded consumer products company. From July 1985 until June 1992, Mr. Trupkiewicz was employed by Price Waterhouse LLC serving in various capacities in its audit practice. Mr. Trupkiewicz is a Certified Public Accountant.
Richard Vestabecame the head of our Beef segment in March 2009. Prior to that date, Mr. Vesta served as president and chief executive officer of Smithfield Beef Group, Inc. (now known as JBS Packerland) from 2002 to 2009. Prior to that, Mr. Vesta held senior executive positions in the beef industry with Packerland Packing Company, Inc., Land O’Lakes, Swift Independent Packing Company and Val-Agri Inc., Monfort and Murco. Mr. Vesta began his career in the meat industry as a retail meat cutter, eventually holding various senior positions in retail meat sales at a regional chain.
Joesley Mendonça Batistais currently the Chief Executive of JBS S.A. and the President of its board of directors. Mr. Batista has served in various capacities at JBS S.A. since 1988. Mr. Batista is the brother of Wesley Mendonça Batista and the son of José Batista Sobrinho, the founder of JBS S.A.
José Batista Júnioris currently a director of JBS USA, LLC and JBS S.A. Mr. Batista Júnior has served in various capacities at JBS S.A. since 1974 and as a member of the board of directors of JBS S.A. since January 2, 2007. Mr. Batista Júnior is the brother of Wesley Mendonça Batista and Joesley Mendonça Batista, and the son of José Batista Sobrinho, the founder of JBS S.A.
Effect of Proposed PPC Acquisition
PPC has entered into a five year consulting agreement with Lonnie “Bo” Pilgrim pursuant to which Mr. Pilgrim will be paid $1.5 million per year and will provide services to the reorganized PPC that are comparable in the aggregate with the services provided by him to PPC prior to the
218
Table of Contents
consummation of the Proposed PPC Acquisition. He will also be subject to a customary non-solicitation and non-competition provision. In addition, Mr. Pilgrim and his spouse will be provided with medical benefits (or will be compensated for medical coverage) that are comparable in the aggregate to the medical benefits afforded to employees of the reorganized PPC. This consulting agreement will become effective upon the consummation of the Proposed PPC Acquisition. For the term of this consulting agreement, Mr. Pilgrim or, in the event of Mr. Pilgrim’s resignation, death or the determination by a court of competent jurisdiction that he has become incapacitated, Lonnie “Ken” Pilgrim, shall serve on the board of directors of the reorganized PPC and, following the Mandatory Exchange Transaction, shall be a member of our board of directors.
If the Proposed PPC Acquisition is consummated, we expect that Don Jackson, the current president and chief executive officer of PPC, will become an executive officer of our company as the head of our Chicken segment.
Board composition after this offering
Upon the closing of this offering, our board of directors will consist of seven members. Our amended and restated certificate of incorporation and amended and restated bylaws in effect immediately following this offering will provide that the number of directors will be fixed from time to time by resolution of the board.
All directors hold office until their successors have been elected and qualified or until their earlier death, resignation, disqualification or removal. Effective upon the closing of this offering, we will divide the terms of office of the directors into three classes:
| • | Class I, whose term will expire at the annual meeting of stockholders to be held in 2011; |
| • | Class II, whose term will expire at the annual meeting of stockholders to be held in 2012; and |
| • | Class III, whose term will expire at the annual meeting of stockholders to be held in 2013. |
Upon the closing of this offering, Class I shall consist of Messrs. and , Class II shall consist of Messrs. and and Class III shall consist of Messrs. , and .
At each annual meeting of stockholders after the initial classification, the successors to directors whose terms then expire will serve from the time of election and qualification until the third annual meeting following election and until their successors are duly elected and qualified. Any additional directorships resulting from an increase in the number of directors will be distributed among the three classes so that, as nearly as possible, each class will consist of one-third of the directors.
Director independence
Currently, our three directors are not considered independent under the applicable provisions of federal securities laws and the rules and regulations of the New York Stock Exchange, or the NYSE, as detailed below:
| Director | Reason for lack of independence | |
Joesley Mendonça Batista | Chief Executive Officer of JBS S.A. and beneficial ownership greater than 5% | |
Wesley Mendonça Batista | Chief Executive Officer of JBS USA Holdings, Inc. and beneficial ownership greater than 5% | |
José Batista Júnior | Beneficial ownership greater than 5% | |
219
Table of Contents
We intend to avail ourselves of the “controlled company” exception under the corporate governance rules of the NYSE. Accordingly, we will not have a majority of independent directors on our board of directors. In accordance with NYSE rules applicable to “controlled companies” such as ours, upon the completion of this offering, we expect that at least one member of our board of directors will be independent. We expect to add another independent director within three months following the completion of this offering and one additional independent director to our board of directors within one year following the completion of this offering.
Committees of the board of directors
Upon the closing of this offering, we will have an audit committee and a compensation committee. As a “controlled company,” we do not expect to have a nominating or corporate governance committee upon the closing of this offering, and we do not intend for our compensation committee to be composed entirely of independent directors.
Audit committee
The “controlled company” exception does not modify the independence requirements for the audit committee, and upon the completion of this offering our audit committee will composed of at least three members, a majority of whom will be independent within three months from the date of this prospectus and each of whom will be independent within one year from the date of this prospectus. For each individual to be deemed to be independent, our board will determine (a) that there is no relationship with JBS USA Holdings, Inc. or (b) the relationship is immaterial. The board has considered the independence standards of the NYSE.
The composition, duties, and responsibilities of our audit committee are set forth below.
Upon completion of this offering our audit committee will consist of (chair), and . is an “audit committee financial expert” within the meaning of the rules and regulations of the Securities and Exchange Commission.
The audit committee is responsible for:
| • | selecting the independent auditor; |
| • | approving the overall scope of the audit; |
| • | discussing the annual audited financial statements and quarterly reviewed financial statements, including matters required to be reviewed under applicable legal and regulatory requirements, with management and the independent auditor; |
| • | discussing earnings press releases and other financial information provided to the public with management and the independent auditor, as appropriate; |
| • | discussing with management and the independent auditor, as appropriate, any audit problems or difficulties and management’s response; |
| • | discussing our risk assessment and risk management policies; |
| • | reviewing our financial reporting and accounting standards and principles, significant changes in such standards or principles, and the key accounting decisions affecting our financial statements; |
| • | reviewing and approving the internal corporate audit staff functions; |
220
Table of Contents
| • | reviewing our internal system of audit, financial, and disclosure controls and the results of internal audits; |
| • | annually reviewing the independent auditor’s written report describing the auditing firm’s internal quality-control procedures and any material issues raised by the auditing firm’s internal quality-control review or peer reviews of the auditing firm; |
| • | reviewing and investigating matters pertaining to the integrity of management; |
| • | reviewing and approving all transactions between us and our officers, directors and principal stockholders and their affiliates for potential conflicts of interest; |
| • | establishing procedures concerning the treatment of complaints and concerns regarding accounting, internal accounting controls, or audit matters; |
| • | meeting separately with management, the corporate audit staff, and the independent auditor; |
| • | handling such other matters that are specifically delegated to the audit committee by the board of directors from time to time; and |
| • | reporting regularly to the full board of directors. |
Compensation committee
For fiscal 2008, compensation decisions were made by a committee comprised of Wesley Batista, our chief executive officer, and our head of human resources. Between January 1, 2008 and October 22, 2008, the position of head of human resources was filled by John R. Shandley. From October 23, 2008 through December 28, 2008, that position was held by our current head of human resources, Robert Daubenspeck. Decisions concerning our chief executive officer’s compensation are made by our board of directors.
Upon completion of this offering our compensation committee will consist of (chair), and .
The compensation committee is responsible for:
| • | reviewing and approving corporate goals and objectives relevant to the compensation of our executives and key management employees; |
| • | annually evaluating our executives’ and key management employees’ performance in light of these goals; |
| • | reviewing and approving the compensation and incentive opportunities of our executives and key management employees; |
| • | reviewing and approving employment contracts, severance arrangements, incentive arrangements, change-in-control arrangements, and other similar arrangements between us and our executives and key management employees; |
| • | receiving periodic reports on our compensation programs as they affect all employees; reviewing executive succession plans for business and staff organizations; and |
| • | handling such other matters that are specifically delegated to the compensation committee by the board of directors from time to time. |
221
Table of Contents
On and after the effective date of this offering, the compensation committee shall continue to oversee our executive compensation program on behalf of the board. In the performance of this function, the compensation committee will meet at least quarterly and, among other things, review and discuss with management the compensation discussion and analysis set forth below.
Other committees
Our board of directors may establish other committees as it deems necessary or appropriate from time to time.
Code of ethics
We have adopted a code of conduct applicable to all employees. In 2002, we adopted a code of ethics specifically applying to our chief executive officer, chief financial officer, chief accounting officer and controller. The code of ethics for such officers reinforces our commitment to:
| • | deter wrongdoing and promote honest and ethical conduct; |
| • | provide full, fair, accurate, timely, and understandable disclosure in public reports; |
| • | comply with applicable laws; |
| • | ensure prompt internal reporting of code violations; and |
| • | provide accountability for adherence to the code. |
The financial code of ethics is available in the investor information section of our website at www.jbsswift.com.
222
Table of Contents
Compensation discussion and analysis
Overview
This compensation discussion and analysis describes the material elements of compensation paid to our executive officers as well as the objectives and material factors underlying our compensation policies and decisions. The information in this compensation discussion and analysis provides context for the compensation disclosures in the tables and related narrative discussions that follow. When we refer to our named executive officers, we are referring to the five individuals listed in the summary compensation table below.
In designing our executive compensation program, we place significant emphasis on performance. Consequently, a majority of each named executive officer’s total potential compensation is “at risk” and tied to our financial performance. During fiscal 2008, our overall financial performance was above that of recent years. This had the effect of increasing the amount of incentive compensation received by our corporate level executives and by many of the managers of our business units, including our named executive officers. These results were consistent with our fundamental philosophy of paying for performance.
Compensation philosophy and objectives
The primary goal of our executive compensation program is the same as our goal for our overall operations—to maximize corporate performance. To accomplish this goal, our executive compensation program is designed to achieve the following objectives:
| • | Attracting and retaining top talent. The compensation of our executives must be competitive with the organizations with which we compete for talent so that we may attract and retain talented and experienced executives. Our executives have, on average, approximately 15 years of experience with us and our predecessors. |
| • | Paying for performance. We structure a significant portion of our executives’ compensation to be subject to corporate and business unit performance measures and therefore be “at risk.” Amounts of performance-based compensation can vary widely from year to year depending on an executive’s performance and the volatile nature of our agricultural commodity-based industry. However, in fiscal 2008, our chief executive officer declined to receive performance-based compensation despite our record financial performance. We anticipate developing a performance-based compensation package for our chief executive officer following this offering. |
| • | Alignment with the interests of our shareholders. We believe that equity-based awards can be an effective means of aligning an executive’s financial interests with those of our shareholders by providing value to the executive only if the market price of our stock increases. While we did not have the ability to provide equity-based awards in fiscal 2008, we intend to adopt a stock-based incentive plan which will become effective immediately prior to this offering. See “2010 stock incentive compensation plan” below. |
Each element of our compensation program is designed to achieve one or more of these objectives. The structure of a particular executive’s compensation may vary depending on the scope and level of that executive’s responsibilities. For an executive with corporate level responsibilities and qualifications, performance-based compensation is generally based on our
223
Table of Contents
consolidated results of operations. In contrast, for an executive responsible for an individual business unit, performance-based compensation historically has been based on a combination of the following: individual behavioral assessment, personal goal achievement, business unit performance and overall consolidated results of operations. Our compensation practices for business unit executives were adopted in recognition of the belief that the efforts of these executives primarily impact the financial performance of the respective units they manage and thus, it is important that compensation be tied directly to the executive’s performance and business unit performance as well as our consolidated results of operations. In addition, beginning in fiscal 2009, these business unit managers are expected to receive an increased proportion of their total compensation in the form of long-term equity incentives, thus providing the managers with incentives tied to our overall operating and share performance.
Determining executive compensation
Our chief executive officer makes recommendations to the compensation committee regarding the amounts of salaries, annual cash incentive payments and, beginning in fiscal 2009, stock-based awards, if any, for key employees, including all other named executive officers. For executive officers, including all other named executive officers, whose annual cash incentive awards are based partly on individual performance, our chief executive officer’s evaluation of the executive officer’s individual performance is provided to and reviewed by the compensation committee. To assist the compensation committee in carrying out its responsibilities, the compensation committee may from time to time retain an independent compensation consultant. We did not retain an independent compensation consultant in 2008 and currently do not use an independent compensation consultant. The compensation committee also annually reviews executive pay tallies for our executive officers detailing the amount of each element of total compensation and accumulated equity holdings. Based on the foregoing, the compensation committee uses its judgment in making compensation decisions that it believes will best carry out our compensation philosophy and objectives. The board of directors determines our chief executive officer’s compensation based on its evaluation of our chief executive officer’s individual performance and our company’s performance.
Elements of our compensation program
In fiscal 2008, total compensation for our executive officers consisted of the following components:
| • | base salary; |
| • | annual incentive cash payments; |
| • | additional cash bonuses; |
| • | retirement compensation; and |
| • | perquisites and personal benefits. |
All of our named executive officers are employed at-will, without employment agreements, severance payment agreements or payment arrangements that would be triggered by a change of control of us, with the exception of Mr. Dooley, who has a retention agreement with us as described under “Estimated payments upon termination or change of control” below.
Base salary. Base salaries are intended to provide a fixed level of compensation sufficient to attract and retain an effective management team when considered in combination with other
224
Table of Contents
components of our executive compensation program that are performance-based. The relative levels of base salary for executive officers are designed to reflect each executive officer’s scope of responsibilities and accountability within our company. Base salaries are reviewed annually to determine if they are equitably aligned within our company and are at sufficient levels to attract and retain top talent. Consistent with our greater emphasis on performance-based pay, base salaries for executives are normally changed only on an infrequent basis and may remain the same for several years.
Annual incentive cash payments. During fiscal 2008, we provided performance-based annual cash incentive compensation opportunities to our named executive officers, excluding our chief executive officer. These awards are based on performance measures that seek to provide a direct link between the company’s and an executive’s performance and the amount of incentive compensation earned.
These awards utilize formulas set by our compensation committee at the beginning of the fiscal year, generally based on the named executive officers’ personal performance goals and our Adjusted EBITDA, the Adjusted EBITDA of a particular subsidiary or business segment, or a combination of the two, depending upon the scope of the executive’s duties. See “Summary historical and pro forma financial data” for the definition of Adjusted EBITDA. The potential payouts of these awards are a percentage of the named executive officer’s base salary, as determined by our compensation committee at the beginning of the fiscal year. The weighting of each of these performance measures and target payout as a percentage of base salary for fiscal 2008 are displayed in the following table for each relevant named executive officer:
| Weighting | ||||||||
| Name | Personal goals (%) | Business unit (%) | Company (%) | Target payout (%) | ||||
André Nogueira de Souza | 30 | — | 70 | 75 | ||||
Iain Mars(1) | — | 100 | — | 100 | ||||
Martin J. Dooley(2) | 30 | 20 | 50 | 70 | ||||
H. Brent Eastwood | 30 | 20 | 50 | 100 | ||||
| (1) | Australian operations |
| (2) | Pork segment |
Under our performance-based annual cash incentive program, if actual business unit or company Adjusted EBITDA performance is below a threshold of 85% of the corresponding target Adjusted EBITDA, no amount is paid out under the financial portion of this program. If at least 85% of target business unit or company Adjusted EBITDA is achieved, 50% of the corresponding target Adjusted EBITDA-based annual cash incentive is payable. If actual business unit or company Adjusted EBITDA performance is between the corresponding threshold and target Adjusted EBITDA, the remaining 50% of the Adjusted EBITDA-based annual cash incentive that is payable is determined on a linear basis based on the extent to which actual performance exceeds 85%, and is less than 100%, of the target Adjusted EBITDA. If actual performance equals target business unit or company Adjusted EBITDA, 100% of the corresponding Adjusted EBITDA-based annual cash incentive is payable. If actual business unit or company Adjusted EBITDA performance exceeds 100% of the corresponding target Adjusted EBITDA, the Adjusted EBITDA-
based annual cash incentive payable exceeds the targeted payout in the same proportion as
225
Table of Contents
actual performance exceeds target Adjusted EBITDA. There is no limit on the maximum business unit or company Adjusted EBITDA-based annual cash incentive payable as described above. The compensation committee may, in its discretion, pay bonuses in excess of the amount determined by the formula under the incentive program. See “Additional cash bonuses” below. If a named executive officer’s personal performance goals are not satisfied, then his annual cash incentive payout is reduced by his personal performance goals weighting percentage (shown in the table above). On the other hand, if a named executive officer’s personal performance goals are met or exceeded, then the target payout based on personal performance goals is paid out.
Financial goals are the same objectives set forth in our internally developed corporate budget. For fiscal 2008, our target Adjusted EBITDA was $284.6 million, and our actual Adjusted EBITDA was $398.2 million, or 140% of target. The Adjusted EBITDA target by business unit was $137.3 million for U.S. Beef, $94.4 million for Pork, and $52.9 million for Australia. Business unit Adjusted EBITDA for each subsidiary or business segment is typically set at challenging levels. In four of our last five fiscal years, budgeted company and business unit financial performance goals were not met. Personal performance goals are intended to add economic value and to align each executive officer’s compensation with expectations of leadership and achievement placed on the executive officer to realize various aspects of our business plan. Personal performance goals are set so that the full amount of the annual cash incentive with respect to these goals may only be attained through superior performance. For fiscal 2008, personal goals of our named executive officers related to cost reduction efforts, productivity (yield and throughput increases), improved employee satisfaction and organizational leadership. A named executive officer’s actual performance against his personal performance goals is determined by our compensation committee based on its subjective evaluation of the named executive officer’s performance.
The potential payouts under the named executive officers’ annual cash incentive awards are displayed in the “Grants of plan-based awards table” below. In February 2009, the compensation committee evaluated performance against the relevant performance goals and determined the amount of annual cash incentive payment made to each of our named executive officers (other than our chief executive officer). Each such named executive officer achieved his personal performance goals and achieved or exceeded relevant business unit and company Adjusted EBITDA targets. The actual amount of annual cash incentive payment made to each named executive officer is displayed in the “Non-equity incentive plan compensation” column of the summary compensation table below.
Additional cash bonuses. We paid additional cash bonuses to Messrs. Nogueira and Dooley with respect to fiscal 2008 in amounts the compensation committee determined, in its discretion, to be appropriate to reward elements of performance that were not reflected in the annual incentive awards and in light of our outstanding financial performance during fiscal 2008. These additional cash bonuses are shown in the “Bonus” column of the summary compensation table below. Mr. Nogueira received a discretionary bonus of $200,000 at the sole discretion of our compensation committee. In connection with the Swift Acquisition in July 2007, we entered into employee retention agreements with key members of management, including Mr. Dooley. Under the terms of his agreement, during fiscal 2008, he was paid the second installment of $318,750. The remaining $200,000 reported in the “Bonus” column of the summary compensation table for Mr. Dooley represents the discretionary component of his annual cash incentive, as determined by our compensation committee.
226
Table of Contents
Retirement compensation. Our named executive officers participate in the same retirement plans on the same terms as provided to most of our salaried employees. In the United States, this plan is a tax-qualified employee-funded 401(k) savings plan with employer matching contributions. Participation in this plan is voluntary. Therefore, the amount of compensation deferred and the amount of our matching contribution varies among employees, including our named executive officers. However, the same formulas are used to determine benefits for all participants in this plan. We also contribute to a superannuation plan on behalf of Mr. Mars (who is not eligible to participate in our 401(k) savings plan). These plans do not involve any above-market returns, as returns depend on actual investment results.
Perquisites and personal benefits. We provide a limited number of perquisites to our executive officers, including our named executive officers. The summary compensation table below contains an itemized disclosure of all perquisites to our named executive officers, regardless of amount. We believe that these minimal perquisites are reasonable and consistent with those paid to other executives in our industry. Providing these perquisites helps to keep our base compensation packages competitive. Although we do not typically provide our executives with tax gross-ups, in fiscal 2008, we provided Mr. Eastwood with a tax gross-up for the company’s reimbursement of certain relocation expenses incurred by him to relocate to Greeley, Colorado in connection with his commencement of employment with us.
We also provide certain benefits to substantially all salaried employees that are not included as perquisites in the summary compensation table for the named executive officers because they are broadly available. These include health and welfare benefits, disability and life insurance, education and tuition reimbursement and an employee assistance program.
Future equity incentive awards. Historically, we have not provided long-term incentive compensation in the form of stock options. Beginning on the completion date of this offering, however, we anticipate providing long-term incentive compensation to our named executive officers and other select employees in the form of stock-based awards under our 2010 stock incentive compensation plan, or the 2010 Plan, the material terms of which are summarized below under “2010 stock incentive compensation plan.” We believe that stock-based compensation can serve as an effective motivational tool by aligning an executive’s economic interests with those of our shareholders. We anticipate providing stock-based awards with terms and conditions that promote long-term tenure and encourage long-term strategic decision-making by our executive officers. We also anticipate that stock-based compensation will constitute a larger percentage of total compensation for corporate level executives than for business unit management because a business unit manager has less involvement in the performance of other business units which impact overall results and indirectly impact the market price of our common stock.
We anticipate that our chief executive officer will recommend to the compensation committee the recipients and sizes of stock-based awards, and the board of directors will determine the size of stock-based awards to be granted to our chief executive officer. In evaluating these recommendations, and in determining the size of stock-based awards for our chief executive officer, we anticipate that the compensation committee and the board of directors, as applicable, will consider a number of factors, including but not limited to:
| • | the level of incentive already provided to the recipient by the size of prior grants or existing holdings of common stock; |
| • | whether the recipient’s responsibilities involve company-wide strategic decision-making; and |
227
Table of Contents
| • | the compensation committee’s subjective evaluation of the recipient’s potential contribution to our future success. |
As of the closing of this offering, we intend to grant shares of restricted stock under the 2010 Plan to the following named executive officers in the following amounts:
| Name | Number of shares | |
We anticipate that these restricted stock awards will generally vest at the rate of one-third per year of service following the grant date.
Summary compensation table
The following table includes information concerning compensation paid to or earned by our named executive officers listed in the table for the fiscal year ended December 28, 2008.
| Name and principal position(1) | Salary ($) | Bonus(2) ($) | Non-equity incentive plan compensation(3) ($) | All other compensation(4) ($) | Total ($) | |||||
Wesley M. Batista(5) | 1,126,395 | — | — | 84,437 | 1,210,832 | |||||
President, Chief executive officer and director | ||||||||||
André Nogueira de Souza(6) | 379,922 | 200,000 | 300,000 | 200,568 | 1,080,490 | |||||
Chief financial officer | ||||||||||
Iain Mars(7) | 229,641 | — | 850,514 | 218,208 | 1,298,363 | |||||
Head of Australia | ||||||||||
Martin J. Dooley(8) | 406,010 | 518,750 | 300,000 | 14,110 | 1,238,870 | |||||
Head of Pork | ||||||||||
H. Brent Eastwood(9) | 259,615 | — | 275,000 | 160,994 | 695,609 | |||||
Head of JBS Trading | ||||||||||
| (1) | The principal position listed in the table for each named executive officer was such individual’s title during fiscal 2008. |
| (2) | Represents cash bonuses received by each of Messrs. Nogueira and Dooley, as described under “Compensation discussion and analysis—Additional cash bonuses” above. |
| (3) | Represents annual incentive cash payments described in more detail under “Compensation discussion and analysis—Annual incentive cash payments” above. |
| (4) | The following table includes information concerning amounts reported in the “All other compensation column” of the summary compensation table above. |
| Name and principal position | Relocation ($) | Tax (b) ($) | Contributions (c) ($) | Company ($) | Company ($) | Company ($) | Excess ($) | Total ($) | ||||||||
Wesley M. Batista | 65,448 | — | — | 18,989 | — | — | — | 84,437 | ||||||||
André Nogueira de Souza | 200,000 | — | — | — | — | — | 568 | 200,568 | ||||||||
Iain Mars | — | — | 68,178 | — | 86,358 | 63,672 | — | 218,208 | ||||||||
Martin J. Dooley | — | — | 11,500 | — | — | — | 2,610 | 14,110 | ||||||||
H. Brent Eastwood | 148,754 | 12,240 | — | — | — | — | — | 160,994 | ||||||||
The value of perquisites and other personal benefits and other compensation is based on the estimated incremental cost to us, for the following:
| (a) | reimbursement of relocation expenses, |
228
Table of Contents
| (b) | tax gross-up on reimbursement of relocation expenses for Mr. Eastwood, |
| (c) | company contributions to 401(k) plan (or, in the case of Mr. Mars, to superannuation plan), |
| (d) | personal use of company aircraft, the direct cost per flight hour as calculated from our records for company-owned aircraft or as billed by third parties for chartered aircraft, |
| (e) | for company-leased automobiles, 100% of the lease cost, repairs, maintenance and fees, |
| (f) | for personal use of the company-leased residence, the average daily cost of maintaining the residence multiplied by the number of days used for personal purposes, and |
| (g) | for excess life insurance (i.e., having a face amount of coverage in excess of $50,000), the amount of premiums paid by us, on behalf of the executive. |
| (5) | Mr. Batista served as President and Chief Executive Officer from December 31, 2007 to December 28, 2008. Included in the salary above is salary in the amount of $419,000 paid by JBS S.A. from December 31, 2007 to February 15, 2008. |
| (6) | As an employee of JBS S.A. in Brazil, Mr. Nogueira provided financial oversight for JBS S.A. from December 31, 2007 through September 30, 2008. On October 1, 2008, Mr. Nogueira transferred to JBS USA Holdings, Inc. and served as our Chief Financial Officer through December 28, 2008. Included in Mr. Nogueira’s salary above is salary in the amount of $263,000 paid by JBS S.A. from December 31, 2007 to September 30, 2008. |
| (7) | Mr. Mars served as the Head of Australia from December 31, 2007 to December 28, 2008. For purposes of computation, the exchange rate used was based on the calendar 2008 average U.S. dollar to Australian dollar exchange rate of .8369. |
| (8) | Mr. Dooley served as the Head of Pork from December 31, 2007 to December 28, 2008. |
| (9) | Mr. Eastwood served as the Head of JBS Trading from December 31, 2007 to December 28, 2008. |
Grants of plan-based awards
The following table includes information concerning grants of plan-based awards made to our named executive officers listed in the table during the fiscal year ended December 28, 2008.
| Estimated future payouts under non-equity incentive plan awards | ||||||
| Name and principal position | Threshold(1) ($) | Target ($) | Maximum ($) | |||
Wesley M. Batista | N/A | N/A | N/A | |||
André Nogueira de Souza | 150,000 | 300,000 | N/A | |||
Iain Mars | 192,500 | 385,000 | N/A | |||
Martin J. Dooley | 131,250 | 262,500 | N/A | |||
H. Brent Eastwood | 137,500 | 275,000 | N/A | |||
| (1) | There is no threshold with respect to the payout amount based on personal performance goals under our performance-based annual cash incentive program. As such, these amounts assume that a named executive officer met his personal performance goals and that the target payout based on personal performance is paid out. See “Compensation discussion and analysis—Annual incentive cash payments”. |
Estimated payments upon termination or change of control.
On July 11, 2007, we entered into a retention agreement with Mr. Dooley. If Mr. Dooley’s employment was terminated by us without cause on December 28, 2008, the last day of fiscal 2008, he would have received a cash severance payment in the amount of $673,500 under this retention agreement. No other named executive officer would have received any payments or benefits in connection with termination of their employment or a change of control of us had the triggering event occurred on December 28, 2008.
Director compensation
During fiscal 2008, our directors received no compensation for attending our board of directors’ meetings. However, after the completion of this offering, we anticipate that we will institute a director compensation program for our non-employee directors which will compensate them for
229
Table of Contents
attending meetings in person or telephonically and serving on committees of the board of directors.
The following table includes information concerning compensation paid to or earned by our directors listed in the table for the fiscal year ended December 28, 2008.
| Name and principal position | Fees earned or paid in cash ($) | Non-equity incentive plan compensation ($) | All other ($) | Total ($) | ||||
José Batista Júnior | — | — | 709,115 | 709,115 | ||||
Director | ||||||||
Joesley Mendonça Batista | — | — | — | — | ||||
Director | ||||||||
| (1) | Mr. José Batista Júnior received the compensation reflected above for his services as an employee of JBS USA, LLC. This amount includes: $646,150 paid as cash compensation, $59,250 paid to reimburse relocation expenses and $3,715 related to insurance premiums paid by us. |
2010 stock incentive compensation plan
Prior to the closing of this offering, we intend to adopt the JBS USA, Inc. 2010 stock incentive compensation plan, or the “2010 Plan”, which will become effective immediately prior to this offering. The 2010 Plan is intended to further our success by increasing the ownership interest of certain of our employees and directors in our company and to enhance our ability to attract and retain employees and directors. This is a summary of the 2010 Plan. You should read the text of the 2010 Plan filed as an exhibit to the registration statement of which this prospectus is part for a full statement of the terms and provisions of the 2010 Plan.
We may issue up to shares of our common stock, subject to adjustment if particular capital changes affect the common stock, upon the exercise or settlement of stock options, stock appreciation rights (“SARs”), restricted stock awards, restricted stock units, performance unit awards, performance share awards, cash-based awards and other stock-based awards granted under the 2010 Plan. The shares of common stock that may be issued under the 2010 Plan may be either authorized and unissued shares or previously issued shares held as treasury stock.
A stock option is the right to purchase a specified number of shares of common stock in the future at a specified exercise price and subject to the other terms and conditions specified in the option agreement and the 2010 Plan. Any stock options granted under the 2010 Plan are either “incentive stock options,” which may be eligible for special tax treatment under the Internal Revenue Code of 1986, or options other than incentive stock options (referred to as “nonqualified stock options”), as determined by the compensation committee and stated in the option agreement. The exercise price of each option granted under the 2010 Plan is equal to or greater than the fair market value of our common stock on the option grant date, with certain limited exceptions for options granted in exchange for other outstanding awards in connection with a corporate transaction. The exercise price of any stock options granted under the 2010 Plan may be paid in cash, a cashless broker-assisted exercise that complies with law, withholding of shares otherwise deliverable upon exercise or any other method permitted by law and approved by the compensation committee.
SARs may be granted under the 2010 Plan alone or together with specific stock options granted under the 2010 Plan. SARs are awards that, upon their exercise, give a participant the right to
230
Table of Contents
receive from us an amount equal to (1) the number of shares for which the SAR is exercised, multiplied by (2) the excess of the fair market value of a share of the common stock on the exercise date over the grant price of the SAR. The grant price of each SAR granted under the 2010 Plan is equal to or greater than the fair market value of our common stock on the SAR’s grant date, with certain limited exceptions for SARs granted under the 2010 Plan in exchange for other outstanding awards in connection with a corporate transaction. A SAR may be settled in cash, shares or a combination of cash and shares, as determined by the compensation committee. If an option and a SAR are granted in tandem, the option and the SAR may become exercisable and will terminate at the same time, but the holder may exercise only the option or the SAR, but not both, for a given number of shares.
Restricted stock awards are shares of common stock that are awarded to a participant subject to the satisfaction of terms and conditions established by the compensation committee. Until such time as the applicable restrictions lapse, shares of restricted stock are subject to forfeiture and may not be sold, assigned, pledged or otherwise disposed of by the participant who holds those shares. Restricted stock units are denominated in units of shares of common stock, except that no shares are actually issued to the participant on the grant date. When a restricted stock unit award vests, the participant is entitled to receive shares of common stock, a cash payment based on the value of shares of common stock or a combination of shares and cash.
Performance units, performance shares and cash-based awards entitle the recipient to receive shares of common stock or a cash payment if performance goals and other conditions specified by the compensation committee are attained. Other stock-based awards are stock-based or stock-related awards payable in common stock or cash on terms and conditions set by the compensation committee and may include a grant or sale of unrestricted shares of common stock. The compensation committee may provide for the payment of dividend equivalents with respect to shares of common stock subject to an award, such as restricted stock units, that have not actually been issued under that award.
The compensation committee administers the 2010 Plan. The board of directors may, subject to any legal limitations, exercise any powers or duties of the compensation committee concerning the 2010 Plan. The compensation committee will select eligible employees, directors and/or consultants of us and our subsidiaries or affiliates to receive awards under the 2010 Plan and will determine the sizes and types of awards, the terms and conditions of awards and the form and content of the award agreements representing awards.
Holders of options, SARs, unvested restricted stock and other awards may not transfer those awards, unless they die or, except in the case of incentive stock options, the compensation committee determines otherwise.
A change of control of us (as defined in the 2010 Plan) will have no effect on outstanding awards under the 2010 Plan that the board of directors or the compensation committee determines will be honored or assumed or replaced with new rights by a new employer so long as any such alternative award is substantially equivalent to the outstanding award and has certain terms that appropriately protect the holder of the award, as determined under criteria set forth in the 2010 Plan. If the board of directors or the compensation committee does not make this determination with respect to any outstanding awards, then (a) the awards will fully vest and, if applicable, become fully exercisable and will be settled in cash and/or publicly traded securities of the new employer, generally based on the fair market value of our common stock on the change of control date, in the case of options or SARs, reduced by the exercise or grant price of the option
231
Table of Contents
or SAR, or the price per share offered for our common stock in the change of control transaction, or, in some cases, the highest fair market value of the common stock during the 30 trading days preceding the change of control date, in the case of restricted stock, restricted stock units and any other awards denominated in shares, (b) the target performance goals applicable to any outstanding awards will be deemed to be fully attained, unless actual performance exceeds the target, in which case actual performance will be used, for the entire performance period then outstanding; and (c) the board of directors or the compensation committee may otherwise adjust or settle outstanding awards as it deems appropriate, consistent with the plan’s purposes.
In the event of a change in our capital structure or a corporate transaction, the compensation committee or the board of directors will make substitutions or adjustments that it deems appropriate and equitable to the securities available under the 2009 Incentive Plan and outstanding awards, the exercise or other prices of securities subject to outstanding awards and other terms and conditions of outstanding awards, such as cancellation of outstanding awards in exchange for payments of cash and/or property or substitution of stock of another company for shares of our common stock subject to outstanding awards. The compensation committee will also make appropriate adjustments and modifications in the terms of any outstanding awards to reflect, or related to, any such events, adjustments, substitutions or changes, including modifications of performance goals and changes in the length of performance periods.
Subject to particular limitations specified in the 2010 Plan, the board of directors may amend or terminate the 2010 Plan, and the compensation committee may amend awards outstanding under the 2010 Plan. The 2010 Plan will continue in effect until all shares of the common stock available under the 2010 Plan are delivered and all restrictions on those shares have lapsed, unless the 2010 Plan is terminated earlier by the board of directors. No awards may be granted under the 2010 Plan on or after the tenth anniversary of the date of this offering.
232
Table of Contents
Certain relationships and related party transactions
The following is a description of transactions since July 11, 2007 in which we have been a participant, in which the amount involved exceeded or will exceed $120,000 and in which any of our directors, executive officers, beneficial holders of more than 5% of our capital stock, immediate family members or entities affiliated with them, had or will have a direct or indirect material interest.
We have not included a description of related party transactions prior to July 11, 2007 because the related party transactions that took place prior to this date involved our predecessor company and its affiliates, and we do not believe this information is meaningful to investors.
Relationship with JBS S.A.
Controlling interest
Prior to completion of this offering, JBS S.A. will hold up to a direct 25% interest in us, and the remaining interest in us will be held by JBS S.A. indirectly through the selling stockholder. After completion of this offering, the selling stockholder will own approximately % of the outstanding shares of our common stock, or %, if the underwriters exercise their over-allotment option in full. The selling stockholder is not subject to any contractual obligation to retain its controlling interest in us, except that the selling stockholder has agreed, subject to exceptions described in “Underwriting”, not to sell or otherwise dispose of any of our shares of common stock for a period of 180 days after the date of this prospectus without the prior written consent of the representatives of the underwriters. Any shares of common stock issued pursuant to the underwriters’ over-allotment option will increase the total number of shares outstanding after this offering.
As our controlling stockholder after this offering, JBS S.A., through the selling stockholder, will continue to exercise significant influence over our business policies and affairs, including the composition of our board of directors and any action requiring the approval of our stockholders. See “Risk factors—We will be a “controlled company” within the meaning of the NYSE rules, and, as a result, will rely on exemptions from certain corporate governance requirements that provide protection to stockholders of other companies” and “—We are controlled by JBS S.A., which is a publicly traded company in Brazil, whose interest in our business may be different than yours.”
We received capital contributions from our parent of $450.0 million during the fifty-two weeks ended December 28, 2008, $50 million was used to fund operations and $400.0 million was used to repay debt.
In the subsection entitled “Business—Description of business segments—Beef segment—Global exports,” we describe the reasons why we do not believe JBS S.A. is currently a significant competitor of our Beef segment.
Guarantee of JBS S.A. debt
We, together with our subsidiaries, JBS USA, LLC and Swift Beef Company, guarantee on an unsecured basis, $300.0 million of the 10.5% notes due 2016 issued by JBS S.A. as a result of a covenant contained in the indenture governing these notes. Additional subsidiaries of JBS USA Holdings, Inc. may be required to guarantee these notes of JBS S.A. See “External sources of liquidity and description of indebtedness—Guarantee of 10.50% senior notes due 2016 of JBS S.A.”
233
Table of Contents
Our ability to use JBS S.A.’s brokerage account in Brazil
We and JBS S.A. are party to a financial agreement pursuant to which JBS S.A. granted us the ability to use one of JBS S.A.’s brokerage accounts in Brazil, enabling us to take a currency position in a market we cannot reasonably access from the United States in a timely manner. There is no provision under the agreement that requires JBS S.A. or us to segregate the funds in the brokerage accounts. All of the funds in the brokerage accounts are funds of JBS S.A. Under the agreement, the outstanding amounts of the intercompany loan agreements executed between JBS S.A. and us (see below) will be increased to reflect any losses and will be offset by any gains. In case of loss, the amounts of such loss shall be increased to the outstanding amounts of such intercompany loans. Between October 31, 2008 and November 30, 2008, JBS S.A. reduced the principal and accrued interest under the intercompany loans by approximately $92.6 million as a result of a derivative gain realized on foreign currency positions in Brazil. In addition, on May 31, 2009, JBS S.A. reduced the principal and accrued interest under the intercompany loans by approximately $48.3 million as a result of a derivative gain realized on foreign currency positions in Brazil.
JBS S.A. purchase and sale agreement
On December 21, 2009, we and JBS S.A. entered into a purchase and sale agreement pursuant to which we agreed to issue and sell 20-25% of our common stock to JBS S.A. for an aggregate purchase price of $2.0 billion. The percentage of shares of our common stock to be issued and sold will be equal to $2.0 billion divided by our equity valuation in U.S. dollars based on the number of shares outstanding immediately prior to this offering, but calculated on the basis of the price per share in this offering, multiplied by 100. As a result of this purchase and sale agreement, JBS S.A. will hold a 20-25% interest in us, and the remaining interest in us will be held by JBS S.A. indirectly through the selling stockholder.
Intercompany loans owed by JBS USA Holdings, Inc. to a subsidiary of JBS S.A.
As of March 29, 2009, we owed an aggregate of $658.6 million under various intercompany loans from JBS S.A., which were subsequently assigned to JBS HU Liquidity Management LLC (Hungary), a wholly owned, indirect subsidiary of JBS S.A. The proceeds of these intercompany loans were used to fund our operations and the Tasman Acquisition and the JBS Packerland Acquisition. On April 27, 2009, these intercompany loan agreements were consolidated into one loan agreement, and the maturity dates of the principal of the intercompany loans was extended to April 18, 2019, and the interest rate was changed to 12% per annum. The net proceeds of the offering and sale of our 11.625% senior unsecured notes due 2014 (other than $100.0 million) were applied to the repayment of accrued interest and a portion of the principal on these intercompany loans. As of September 27, 2009, we owed an aggregate principal amount of $89.1 million under the consolidated intercompany loan agreement. In addition, we entered into an additional intercompany term loan agreement in the aggregate principal amount of $6.0 million under the same terms as the consolidated intercompany loan agreement. For tax reasons, we do not intend to prepay these intercompany loans prior to their stated maturity.
Arrangements with J&F Oklahoma
Cattle supply and feeding agreement. Five Rivers is party to a cattle supply and feeding agreement with our unconsolidated affiliate J&F Oklahoma Holdings Inc., or J&F Oklahoma. J&F Oklahoma is a wholly owned subsidiary of J&F Participações S.A., which is owned in equal shares
234
Table of Contents
by the six children of José Batista Sobrinho (the founder of JBS S.A.) and Mr. Sobrinho. Pursuant to the agreement, Five Rivers feeds and takes care of cattle owned by J&F Oklahoma. J&F Oklahoma pays Five Rivers for the cost of feed and medicine at cost plus a yardage fee on a per head per day basis. The pricing terms of this agreement are consistent with other suppliers who deliver cattle on a similar scale. Beginning on June 23, 2009 or such earlier date on which Five Rivers’ feedlots are at least 85% full of cattle and ending on October 23, 2011, J&F Oklahoma agrees to maintain sufficient cattle on Five Rivers’ feedlots so that such feedlots are at least 85% full of cattle at all times. The agreement commenced on October 23, 2008 and continues until the last of the cattle on Five Rivers’ feedlots as of October 23, 2011 are shipped to J&F Oklahoma, a packer or another third party.
Cattle purchase and sale agreement. JBS USA, LLC is party to a cattle purchase and sale agreement with J&F Oklahoma. Under this agreement, J&F Oklahoma agrees to sell to JBS USA, LLC, and JBS USA, LLC agrees to purchase from J&F Oklahoma, at least 500,000 cattle during each year from 2009 through 2011. The price paid by JBS USA, LLC is determined pursuant to JBS USA, LLC’s pricing grid as in effect on the date of delivery. The grid used for J&F Oklahoma is identical to the grid used for unrelated third parties. If the cattle sold by J&F Oklahoma in a quarter result in a breakeven loss (selling price below accumulated cost to acquire the feeder animal and fatten it to delivered weight), then JBS USA, LLC will reimburse 40% of the average per head breakeven loss incurred by J&F Oklahoma on up to 125,000 head delivered to JBS USA, LLC in that quarter. If the cattle sold by J&F Oklahoma in a quarter result in a breakeven gain (selling price above the accumulated cost to acquire the feeder animal and fatten it to delivered weight), then JBS USA, LLC will receive from J&F Oklahoma an amount of cash equal to 40% of that per head gain on up to 125,000 head delivered to JBS USA, LLC in that quarter.
Guarantee of J&F Oklahoma revolving credit facility. J&F Oklahoma has a $600.0 million secured revolving credit facility with a commercial bank. Its parent company, J&F Participacoes S.A., has entered into a keepwell agreement with J&F Oklahoma whereby it will make contributions to J&F Oklahoma if J&F Oklahoma is not in compliance with its financial covenants under this credit facility. If J&F Oklahoma defaults on its obligations under this credit facility and such default is not cured by J&F Participações S.A. under the keepwell agreement, Five Rivers is obligated to pay up to $250.0 million of the obligations under this credit facility. This credit facility is available for revolving loans and letters of credit. Borrowings under this credit facility accrue interest at a per annum rate of LIBOR plus 2.25% or base rate plus 1.00%, and interest is payable at least quarterly. Commitment fees of 0.45% per annum accrue on unused commitments. This credit facility matures on October 7, 2011. This credit facility and the guarantees thereof are secured by the assets of J&F Oklahoma and, in the case of Five Rivers, they are secured by and limited to the lesser of $250 million or the net assets of Five Rivers, including loans made pursuant to the credit facility discussed below. This credit facility is used to finance the procurement of cattle by J&F Oklahoma, which are then fed in the Five Rivers feedlots pursuant to the cattle supply and feeding agreement described above. The finished cattle are sold to JBS USA, LLC pursuant to the cattle purchase and sale agreement described above.
Credit facility to J&F Oklahoma. Five Rivers is party to an agreement with J&F Oklahoma, pursuant to which Five Rivers has agreed to loan up to $200.0 million in revolving loans to J&F Oklahoma. The loans are used by J&F Oklahoma to acquire feeder animals which are placed in Five Rivers feedlots for finishing. Borrowings accrue interest at a per annum rate of LIBOR plus 2.25% or base rate plus 1.00%, and interest is payable at least quarterly. This credit facility matures on October 7, 2011. During the period from October 23, 2008 (when Five Rivers was
235
Table of Contents
acquired) through December 28, 2008, average borrowings were approximately $131.0 million, and total interest accrued was approximately $0.7 million and was recognized as interest income on the statement of operations. As of September 27, 2009, the aggregate outstanding balance of the loan was $174.1 million, including accrued interest of $41,093.
See Note 10 to our consolidated financial statements for a description of how we account for our transactions with J&F Oklahoma.
Other related party transactions
We enter into transactions in the normal course of business with affiliates of JBS S.A. The following table presents the impact of these transactions on our condensed consolidated statements of operations for the thirteen and thirty-nine weeks ended September 28, 2008 and September 27, 2009:
| Thirteen weeks ended | Thirty-nine weeks ended | |||||||||||
| in thousands | September 28, 2008 | September 27, 2009 | September 28, 2008 | September 27, 2009 | ||||||||
Sales to: | ||||||||||||
JBS S.A. affiliates (meat products)(1) | $ | 3,830 | $ | 4,285 | $ | 9,415 | $ | 7,198 | ||||
JBS S.A. (meat products)(1) | 967 | 566 | 1,062 | 2,814 | ||||||||
JBS S.A. (gain from foreign currency forward contract)(2) | — | — | — | 48,290 | ||||||||
J&F Oklahoma (cattle hotelling services)(1) | — | 158,988 | — | 423,697 | ||||||||
JBS Global UK (meat products)(1) | 3,595 | 4,167 | 14,050 | 9,018 | ||||||||
Total sales to related parties | $ | 8,392 | $ | 168,006 | $ | 24,527 | $ | 491,017 | ||||
Other income: | ||||||||||||
Rental income from executives(3) | $ | — | $ | — | $ | 26 | $ | — | ||||
Interest income(4) | — | 1,915 | — | 5,081 | ||||||||
Total other income | $ | — | $ | 1,915 | $ | 26 | $ | 5,081 | ||||
Purchases from:(1) | ||||||||||||
JBS S.A. affiliates (meat purchases) | $ | 34 | $ | — | $ | 903 | $ | — | ||||
JBS S.A. (meat purchases) | — | — | — | 727 | ||||||||
J&F Oklahoma (cattle purchases) | — | 401,072 | — | 711,798 | ||||||||
Total purchases from related parties | $ | 34 | $ | 401,072 | $ | 903 | $ | 712,525 | ||||
| (1) | These sales and purchases primarily consist of (a) sales and purchases of beef and other cattle by-products to JBS S.A. and its affiliates in transactions at prevailing market prices, (b) payments from J&F Oklahoma for cattle hotelling services pursuant to the cattle supply and feeding agreement described above under “—Arrangements with J&F Oklahoma—Cattle supply and feeding agreement” and (c) purchases of cattle from J&F Oklahoma pursuant to the cattle purchase and sale agreement described above under “—Arrangements with J&F Oklahoma—Cattle purchase and sale agreement.” JBS Global UK is the JBS S.A. affiliate engaged in trading transactions. |
| (2) | JBS S.A. and its subsidiaries take a global perspective to managing our collective and individual exposures to currency risks. As part of this strategy, we and JBS S.A. are party to an agreement pursuant to which JBS S.A. enters into foreign currency contracts with us covering BrazilianReais, enabling us to take a currency position in a market we cannot reasonably access from the United States in a timely manner. Under the agreement, the outstanding balance of the intercompany loan agreements executed between JBS S.A. and us will be increased to reflect any losses on positions taken by us and will be reduced by any gains on positions taken by us. On May 31, 2009 we realized a $48.3 million gain on foreign currency contract with JBS S.A., and, accordingly, we reduced the intercompany loans in the same amount. |
236
Table of Contents
| (3) | Rental income from executives relates to real property that we leased to two of our executive officers in the thirty-nine weeks ended September 28, 2008. |
| (4) | Interest income represents interest paid by J&F Oklahoma to Five Rivers on the revolving loans described above under “—Arrangements with J&F Oklahoma—Credit facility to J&F Oklahoma.” |
The following table presents the impact of these transactions on our condensed consolidated balance sheets as of December 28, 2008 and September 27, 2009:
| in thousands | As of December 28, | As of September 27, | ||||||
Balance sheet: | ||||||||
Current: | ||||||||
JBS S.A. affiliates(1) | $ | 8,763 | $ | 1,544 | ||||
JBS S.A.(1) | 1,562 | 709 | ||||||
J&F Oklahoma(2) | 10,450 | 49,540 | ||||||
Payable to J&F Oklahoma(3) | (972 | ) | (11,272 | ) | ||||
Employees and executives(4) | 25 | 810 | ||||||
Total current receivable from related parties | $ | 19,828 | $ | 41,331 | ||||
Non-current: | ||||||||
J&F Oklahoma(5) | $ | 89 | $ | 174,081 | ||||
Total non-current receivables from related parties | $ | 89 | $ | 174,081 | ||||
| (1) | Represents receivables related to our sales of beef and other cattle by-products described above. JBS Global UK is the JBS S.A. affiliate engaged in trading transactions. These receivables are generally settled within 30 days. |
| (2) | Represents receivables related to cattle hotelling services provided by Five Rivers to J&F Oklahoma pursuant to the cattle supply and feeding agreement described above under “—Arrangements with J&F Oklahoma—Cattle supply and feeding agreement.” |
| (3) | Represents payables to J&F Oklahoma as of December 28, 2008 including $0.6 million of expense reimbursements to J&F Oklahoma and $0.4 million of margin settlements. The payables to J&F Oklahoma as of September 27, 2009 are for rebates owed to J&F Oklahoma under the cattle purchase and sale agreement. See “Certain relationships and related party transactions—Arrangements with J&F Oklahoma—Cattle purchase and sale agreement.” |
| (4) | Represents amounts receivable pursuant to loans to our executive officers. The receivable as of December 28, 2008 relates to a loan to Mr. Wesley Batista, our chief executive officer, that was repaid in January 2009. The receivable as of September 27, 2009 represents (1) a forgivable loan in the amount of $0.2 million to Robert Daubenspeck, one of our executive officers, evidenced by a promissory note dated April 24, 2009 that bears interest at 5.25% annually, and (2) a promissory note in the amount of $0.6 million to Mr. Wesley Batista, our chief executive officer, that bears interest at 5.25% annually. Mr. Wesley Batista has repaid his loan. |
| (5) | Represents amounts receivable from J&F Oklahoma pursuant to the revolving loans described above under “—Arrangements with J&F Oklahoma—Credit facility to J&F Oklahoma.” These amounts are payable on October 24, 2011. |
Pilgrim’s Pride custom slaughter agreement
We are party to a custom slaughter agreement with PPC pursuant to which we provide custom slaughter services on hogs raised by PPC. This agreement was entered into on an arm’s-length basis prior to the execution of the PPC stock purchase agreement.
Policies and procedures for related party transactions
Our audit committee is expected to review and approve in advance any related party transaction. All of our directors, officers and employees will be required to report to the audit committee any related party transaction prior to entering into the transaction. See “Management—Committees of the board of directors—Audit committee.”
It is our intention to ensure that all future transactions between us and our officers, directors and principal stockholders and their affiliates are approved by the audit committee of our board of directors, and are on terms no less favorable to us than those that we could obtain from unaffiliated third parties.
237
Table of Contents
Principal and selling stockholder
Before this offering, all of the outstanding shares of our common stock were owned beneficially and of record by JBS Hungary Holdings Kft., the selling stockholder and a wholly owned, indirect subsidiary of JBS S.A. The following table sets forth information regarding beneficial ownership of our common stock as of September 27, 2009, and as adjusted to reflect the shares of common stock to be issued and sold in this offering assuming no exercise of the underwriters’ and the Brazilian underwriters’ option to purchase additional shares, by:
| • | each person or group of affiliated persons known by us to be the beneficial owner of more than 5% of our common stock; |
| • | each of our named executive officers; |
| • | each of our directors; |
| • | all executive officers and directors as a group; and |
| • | our selling stockholder. |
Beneficial ownership in this table is determined in accordance with the rules of the SEC and does not necessarily indicate beneficial ownership for any other purpose. Under these rules, the number of shares of common stock deemed outstanding includes shares issuable upon exercise of options held by the respective person or group that may be exercised within 60 days after September 27, 2009. For purposes of calculating each person’s or group’s percentage ownership, stock options exercisable within 60 days after September 27, 2009 are included for that person or group but not the stock options of any other person or group. This table does not reflect any shares of common stock that our directors and executive officers may purchase in this offering, including through the directed share program described in “Underwriting”.
Percentage of beneficial ownership is based on 100 shares of common stock outstanding as of September 27, 2009 (without giving effect to the stock split to occur immediately prior to completion of this offering) and shares of common stock outstanding after completion of this offering.
Unless otherwise indicated and subject to applicable community property laws, to our knowledge, each stockholder named in the following table possesses sole voting and investment power over the shares listed, except for those jointly owned with that person’s spouse. Beneficial ownership representing less than 1% is denoted with an asterisk (*).
238
Table of Contents
The address of each director and executive officer shown in the table below is c/o JBS USA Holdings, Inc., 1770 Promontory Circle, Greeley, Colorado 80634.
| Name and address of beneficial owner | Shares of common stock beneficially owned before this offering | Number of being | Shares of common stock beneficially owned after this offering | Percent of class beneficially owned assuming exercise of the underwriters’ over- allotment option | ||||||||
| Number | Percentage | Number | Percentage | |||||||||
Principal stockholder | ||||||||||||
JBS S.A.(1) | 100 | 100% | % | % | ||||||||
Directors and named executive officers | % | % | ||||||||||
Wesley Mendonça Batista(1) | 100 | 100% | % | % | ||||||||
Joesley Mendonça Batista(1) | 100 | 100% | % | % | ||||||||
José Batista Júnior(1) | 100 | 100% | % | % | ||||||||
André Nogueira de Souza | — | * | % | % | ||||||||
Iain Mars | — | * | % | % | ||||||||
Martin J. Dooley | — | * | % | % | ||||||||
H. Brent Eastwood | — | * | % | % | ||||||||
All directors and executive officers as a group | 100 | 100% | % | % | ||||||||
| (1) | We are a subsidiary of JBS Hungary Holdings Kft., the selling stockholder and a wholly owned, indirect subsidiary of JBS S.A. JBS S.A. is ultimately controlled by the Batista family, which is comprised of José Batista Sobrinho, the founder of JBS S.A., Flora Mendonça Batista, and their six children, José Batista Júnior, Valéria Batista Mendonça Ramos, Vanessa Mendonça Batista, Wesley Mendonça Batista, Joesley Mendonça Batista and Vivianne Mendonça Batista. The Batista family indirectly owns 100.0% of the issued and outstanding shares of J&F Participações S.A., a Brazilian corporation which owns 44.0% of the outstanding capital of JBS S.A., and, except for Mr. José Batista Sobrinho and Mrs. Flora Mendonça Batista, directly owns 100% of the equity interests in ZMF Fundo de Investimento em Participações, a Brazilian investment fund which owns 6.1% of the outstanding capital of JBS S.A. Wesley Mendonça Batista, Joesley Mendonça Batista and José Batista Júnior are members of our board of directors. Through J&F Participações S.A. and ZMF Fundo de Investimento em Participações, Wesley Mendonça Batista, Joesley Mendonça Batista and José Batista Júnior are members of the Batista family and each beneficially own all shares of our common stock through their controlling interest in JBS S.A. |
239
Table of Contents
The following table sets forth the principal holders of JBS S.A.’s outstanding common shares and their respective shareholding, as of September 27, 2009, without giving effect to JBS S.A.’s Bertin transaction described below:
| As of September 27, 2009 | ||||||
| Shareholders | Address | Number of Shares | Percentage | |||
J&F Participações S.A.(a) | Av. Brigadeiro Faria Lima, 2,391, 2nd Floor 01452-000, São Paulo, SP Brazil | 632,781,603 | 44.0% | |||
ZMF Fundo de Investimento em Participações(b) | Praia de Botafogo, 501, 5th Floor Rio de Janeiro, RJ Brazil | 87,903,348 | 6.1% | |||
PROT FIP(c) | Ave. Presidente Wilson, 231 11th Floor Rio de Janeiro, RJ Brazil | 205,365,101 | 14.3% | |||
BNDESPAR(d) | Av. República de Chile, 100 20031-917, Rio de Janeiro, RJ Brazil | 186,891,800 | 13.0% | |||
Other public minority shareholders (as a group) | 281,146,974 | 19.6% | ||||
Treasury shares | 43,990,100 | 3.1% | ||||
Total | 1,438,078,926 | 100.0% | ||||
| (a) | J&F Participações S.A. is a Brazilian corporation which owns 44.0% of the total capital of JBS S.A. The members of the Batista family (José Batista Sobrinho and Flora Mendonça Batista, and their six children José Batista Júnior, Valéria Batista Mendonça Ramos, Vanessa Mendonça Batista, Wesley Mendonça Batista, Joesley Mendonça Batista and Vivianne Mendonça Batista) indirectly, through several holding companies, own 100.0% of the issued and outstanding shares of J&F Participações S.A. |
| (b) | ZMF Fundo de Investimento em Participações is a Brazilian investment fund which owns 6.1% of the total capital of JBS S.A. The Batista family (except for Mr. José Batista Sobrinho and Mrs. Flora Mendonça Batista) owns 100% of the equity interests in ZMF Fundo de Investimento em Participações. |
| (c) | PROT Fundo de Investimento em Participações is a Brazilian equity investment fund and an affiliate of Banco Nacional de Desenvolvimento Econômico e Social—BNDES. |
| (d) | BNDES Participações S.A.—BNDESPAR, is a subsidiary of Banco Nacional de Desenvolvimento Econômico e Social—BNDES, Brazil’s national development bank. BNDESPAR invests, and owns equity interests, in Brazilian companies, including JBS S.A. |
There are no current arrangements which will result in a change of control.
BNDESPAR transaction
JBS S.A./BNDESPAR investment agreement
On December 22, 2009, BNDES Participações S.A.—BNDESPAR, or BNDESPAR, J&F Participações S.A., or J&F, ZMF Fundo de Investimento em Participações, or ZMF JBS S.A. and us, as an intervening party, entered into an investment agreement, or the JBS S.A./BNDESPAR investment agreement. Pursuant to the terms of the JBS S.A./BNDESPAR investment agreement, BNDESPAR has agreed to subscribe for and purchase up to the entire principal amount of Debentures (as defined below) issued by JBS S.A. for $2.0 billion.
The terms of the JBS S.A./BNDESPAR investment agreement provide that each shareholder of JBS S.A. (other than shareholders of JBS S.A. that are U.S. persons as defined under the Securities Act, who will not be entitled to exercise their preemptive rights to subscribe for Debentures) shall have 30 days from the first business day after the date of publication of the minutes of JBS S.A.’s shareholders’ meeting approving the issuance of the Debentures to exercise its preemptive
240
Table of Contents
rights and subscribe for the Debentures on a pro rata basis based on each shareholders’ equity interests in JBS S.A. In addition, pursuant to the terms of the JBS S.A./BNDESPAR investment agreement, J&F and ZMF shall assign their respective preemptive rights to acquire Debentures to BNDESPAR within two business days of JBS S.A.’s shareholders’ meeting approving the issuance of the Debentures. BNDESPAR’s obligation to purchase the Debentures is subject to a number of conditions (including that we enter into a registration rights agreement with BNDESPAR) and will expire on May 1, 2010 if the conditions are not satisfied.
JBS S.A. is required to, among other things, use the net proceeds from the offering of debentures to capitalize our company, including to fund the $800 million purchase price for our interest in PPC pursuant to Proposed PPC Acquisition.
Under the JBS S.A./BNDESPAR investment agreement, (1) JBS S.A. is required to register a Brazilian depositary receipt, or BDR, program with the CVM, and the underlying common stock must be of the same class of stock being offering in this offering and (2) we are required to maintain our registration with the CVM and register our shares with the SEC. We expect to establish a BDR program within 30 days after announcement of the completion of this offering to enable satisfaction of these requirements.
The JBS S.A./BNDESPAR investment agreement also provides, among other requirements, that (1) the parties shall use their best efforts to terminate the JBS S.A. investment and shareholders’ agreement described below under “JBS S.A. investment and shareholders’ agreements,” (2) BNDESPAR shall use its best efforts to terminate the shareholders agreement entered into between BNDESPAR and the controlling shareholders of Bertin S.A. in April 2008 and (3) BNDESPAR shall enter into a lock-up agreement with the underwriters.
JBS S.A. debentures instrument
On December 22, 2009, JBS S.A., our indirect parent company, agreed to issue a series of convertible debentures to BNDESPAR and other existing shareholders of JBS S.A. in a transaction exempt from registration under the Securities Act pursuant to Regulation S thereunder. The debentures are expected to be issued on December 29, 2009 and will not be transferable by their terms. These debentures are mandatorily exchangeable into our common stock in the form of BDRs upon the occurrence of a Liquidity Event (as defined below). The terms of the debentures provide that up to 2,000,000 debentures will be issued. BNDESPAR has agreed to subscribe for and purchase up to the entire principal amount of the debentures offered for $2.0 billion. Following this offering and assuming compliance with other conditions, the total outstanding debentures will be mandatorily exchanged for an aggregate percentage of shares of our outstanding common stock in the form of BDRs representing $2.0 billion, divided by our equity valuation in U.S. dollars based on the number of shares outstanding immediately prior to this offering but calculated on the basis of the price per share in this offering, multiplied by 100. Based on the midpoint of the expected price range of $ to $ per share and an offering size of shares in this offering, the 2,000,000 debentures in the aggregate would be mandatorily exchanged for shares representing % of our common stock representing an exchange ratio of one share of our common stock for debentures. We refer to these debentures as the “Debentures.”
If a Liquidity Event occurs on or prior to December 31, 2010, the Debentures will be mandatorily exchanged for our shares in the form of BDRs unless JBS S.A. extends the Liquidity Event deadline
241
Table of Contents
until December 31, 2011 by paying a 15% cash premium in excess of the price of the outstanding Debentures. If a Liquidity Event does not occur prior to the deadline, the Debentures will be mandatorily converted into shares of JBS S.A.’s common stock, as described below.
A Liquidity Event is defined as any event in which (1) we have registered our common stock with the SEC and received at least U.S.$1.5 billion in gross proceeds from an offering that has at least a 50% primary component, including proceeds from any follow-on offering, (2) such common stock is listed on the New York Stock Exchange or NASDAQ, (3) BDRs representing such common stock are listed on the BOVESPA and we are registered with the CVM, (4) we have one class of stock and (5) the offering of such shares results in a minimum free float of 15% of our equity (excluding the Debentures).
Prior to the conversion or exchange of the Debentures, the holders of the Debentures will not be entitled to receive any interest or dividend payments on the Debentures. Upon the conversion, exchange or redemption of the Debentures, the holders of the Debentures will receive any dividend or other distribution declared by us prior to such conversion, exchange or redemption, which we must hold reserved until time of conversion.
Each shareholder of JBS S.A. (other than U.S. persons as defined under the Securities Act) will have the right to subscribe for the Debentures on apro ratabasis based on its equity interests in JBS S.A.
Following the mandatory exchange, the BDRs will be held by a custodian on behalf of the holders, including BNDESPAR, until the date that is 195 days after the completion of this offering and will not be transferable during that period.
The Debentures may be converted into shares of JBS S.A.’s common stock prior to a Liquidity Event if any of the following occurs:
| • | a payment default that is not cured for 10 days or any other default not cured for 30 days; |
| • | JBS S.A. or we voluntarily file for bankruptcy; |
| • | JBS S.A. or we dissolve or liquidate; |
| • | JBS S.A. exits the “Novo Mercado” segment of the BOVESPA; |
| • | JBS S.A. or we merge into another company, except if the resulting company is controlled by JBS S.A.; or |
| • | the Proposed PPC Acquisition does not close prior to May 1, 2010. |
JBS S.A./BNDESPAR shareholders’ agreement
On December 22, 2009, BNDESPAR, J&F, and ZMF, entered into a shareholders’ agreement with JBS S.A. as intervening and consenting party, or the JBS S.A./BNDESPAR shareholders’ agreement. Pursuant to the terms of the JBS S.A./BNDESPAR shareholders’ agreement, BNDESPAR is granted veto rights with respect to the following matters:
| • | the incurrence of debt by JBS S.A. or any company controlled by JBS S.A., including us, or the controlled companies, if JBS S.A.’spro formaconsolidated net debt/EBITDA ratio exceeds 5.5:1.0 (other than refinancing debt); |
242
Table of Contents
| • | the payment of any dividend, interest or any other distribution by JBS S.A. to shareholders if JBS S.A.’s pro forma consolidated net debt/EBITDA ratio exceeds 4.0:1.0, or the debt management limit; |
| • | any capital reduction of JBS S.A. or any controlled company (including us) if such transaction would cause JBS S.A.’s pro forma consolidated net debt/EBITDA ratio to exceed the debt management limit; provided that BNDESPAR’s approval of any capital reduction will not be required in connection with controlled companies that are 99% or more held by JBS S.A., or exempted subsidiaries; |
| • | any voluntary filing of bankruptcy by JBS S.A. or us; |
| • | any dissolution or liquidation by JBS S.A. or us or any other controlled company, except for exempted subsidiaries; |
| • | any reduction in JBS S.A.’s mandatory dividend under Brazilian law; |
| • | any amendment to JBS S.A.’s by laws which would: (i) cause its fiscal council to no longer be permanent; (ii) substantially change JBS S.A. business; or (iii) conflict with the JBS S.A./BNDES shareholders’ agreement; |
| • | any merger, acquisition, spin-off, amalgamation, share swap, transfer of subscription rights, reorganization or any other similar transaction by any of JBS S.A. or any of the controlled companies (including us), except for the exempted subsidiaries; |
| • | any affiliate transaction that individually or in the aggregate for any period of 12 months would amount to more than R$100 million; |
| • | incurrence of any lien or granting of a security interest in JBS S.A.’s or any of the controlled companies’ assets, which would total more than 10% of JBS S.A.’s total assets (individually or in the aggregate for a period of 12 months); |
| • | approval of the annual budget of JBS S.A. and/or the controlled companies if the budgeted expenses would imply a net debt/EBITDA ratio above the debt management limit; |
| • | the making of any capital investment not contemplated in the annual budget approved by JBS S.A.’s board of directors in an amount that would cause the debt management limit to be surpassed; |
| • | the cancellation of JBS S.A. or our registry with the CVM, the de-listing of the shares of JBS S.A. from the BOVESPA or the deregistering of our shares under the Securities Exchange Act of 1934, as amended; |
| • | the creation of any additional class of our stock with different voting or economic rights, including preferred stock; |
| • | any acquisition by JBS S.A. or any controlled company of (i) holdings of shares of another company not contemplated by the business plan or annual budget approved by JBS S.A.’s board of directors or (ii) non-current assets, in the event that such acquisition would cause the debt management limit to be surpassed; and |
| • | creation of liens, mortgages, pledges, etc. by JBS S.A. or any of its controlled companies, including us, to guarantee third party obligations, except for obligations of controlled companies individually in an amount less than R$200 million. |
243
Table of Contents
The board of directors of JBS S.A. will consist of seven members, of which BNDESPAR will have the right to designate one member and the right to designate two members as long as it owns not less than 20% of the total voting and share capital of JBS S.A. In addition, JBS S.A. will have a fiscal council that will consist of at least three members, one of which will be designated by BNDESPAR.
The JBS S.A./BNDESPAR shareholders’ agreement will expire on December 31, 2014, which shall be automatically renewed for one five-year term if on such date BNDESPAR owns not less than 15% of the total voting and share capital of JBS S.A.
Registration rights agreement
We expect to enter into a registration rights agreement with BNDESPAR, or the registration rights agreement, pursuant to which BNDESPAR will be granted registration rights with respect to certain of our common shares, which we refer to as registrable shares.
Demand registration rights.Beginning 180 days after the date of this prospectus, subject to certain limitations, BNDESPAR will be entitled from time to request that we file a registration statement under the Securities Act for the resale of all or a part of registrable shares. Subject to certain limitations, we are only obligated to effect six registrations in response to these demand registration rights of BNDESPAR. Under certain conditions and subject to certain limitations, we may delay the filing or effectiveness of such registration statement.
Piggyback registration rights.If, after this offering, we propose to register or offer shares of our common stock of the same class as the registrable shares, subject to certain exceptions and limitations, BNDESPAR will be entitled to notice of such registration or offering and to include registrable shares in such registration or offering. The underwriters of any underwritten offering have the right to limit the number of registrable shares registered by BNDESPAR, subject to certain limitations.
Form S-3 registration rights.Subject to certain limitations, BNDESPAR will be entitled to request that we effect a registration on Form S-3 under the Securities Act at any time when we are eligible to use Form S-3 to register our common shares. Subject to certain exceptions, we are only obligated to effect four Form S-3 registrations in response to these Form S-3 registration rights of BNDESPAR. Under certain conditions and subject to certain limitations, we may delay the filing or effectiveness of such Form S-3 registration statement.
We generally must pay all expenses and fees (other than underwriting discounts or commissions, any stock transfer taxes in connection with the resale of registrable shares, and fees and expenses of advisors of any underwriter or other distributor) related to any registration effected pursuant to the exercise of these registration rights.
244
Table of Contents
JBS S.A. investment and shareholders’ agreements
On March 18, 2008, BNDES Participações S.A., or BNDESPAR, PROT—Fundo de Investimento em Participações, or PROT, J&F Participações S.A., or J&F, and ZMF Fundo de Investimento em Participações, or ZMF, entered into an investment agreement with JBS S.A. as intervening and consenting party, or the JBS investment agreement. Pursuant to the JBS investment agreement, BNDESPAR, PROT, J&F and ZMF agreed to make capital contributions to JBS S.A. in the amount of up to R$2,550.0 million. The terms of the investment agreement also required PROT, J&F and ZMF to enter into a shareholders’ agreement to govern their relationship as shareholders of JBS S.A. Under the terms of the shareholders’ agreement, each of the parties has agreed, among other things, that without the prior approval of PROT, J&F and ZMF will not exercise their power to vote to:
| • | modify the bylaws of JBS S.A. to make the permanent audit committee of JBS S.A. non-permanent; |
| • | modify the bylaws of JBS S.A. to remove the provisions regarding the disclosure and availability of related party contracts, shareholders’ agreements or stock option plans; |
| • | restrict in any way PROT’s right to elect and maintain one member on the board of directors for as long as PROT holds greater than 10% of the capital stock of JBS S.A.; and |
| • | incur additional indebtedness in the event Net Debt/EBITDA would be greater than a specified level. |
JBS S.A. purchase and sale agreement
On December 21, 2009, we and JBS S.A. entered into a purchase and sale agreement pursuant to which we agreed to issue and sell 20-25% of our common stock to JBS S.A. for an aggregate purchase price of $2.0 billion. The percentage of shares of our common stock to be issued and sold will be equal to $2.0 billion divided by our equity valuation in U.S. dollars based on the number of shares outstanding immediately prior to this offering, but calculated on the basis of the price per share in this offering, multiplied by 100. As a result of this purchase and sale agreement, JBS S.A. will hold a 20-25% interest in us, and the remaining interest in us will be held by JBS S.A. indirectly through the selling stockholder.
JBS S.A./Bertin transaction
On September 16, 2009, J&F Participações and ZMF Fundo de Investimento em Participações, the controlling shareholders of JBS S.A., entered into an association agreement with the controlling shareholders of Bertin S.A., a Brazilian company that is one of the largest exporters of beef and other cattle by-products in Latin America. Pursuant to the terms of the association agreement: (1) the controlling shareholders of JBS S.A. have agreed to contribute their shares of JBS S.A. owned, directly or indirectly, by them in exchange for shares to be issued by a newly formed holding company; and (2) the controlling shareholders of Bertin S.A. have agreed to contribute all of their shares representing 73.1% of Bertin S.A. in exchange for shares to be issued by this newly formed holding company. The parties are currently analyzing the optimal corporate structure to be used to consummate this transaction. We refer to this transaction as the Bertin transaction.
245
Table of Contents
General
Upon the closing of this offering, our authorized capital stock will consist of shares of common stock, par value $0.01 per share, and shares of undesignated preferred stock, par value $0.01 per share. Immediately following the completion of this offering, an aggregate of shares of common stock will be issued and outstanding and no shares of preferred stock will be issued and outstanding. As of the date of this prospectus, JBS S.A. will hold a 20-25% interest in us, and the remaining interest in us will be held by JBS S.A. indirectly through JBS Hungary Holdings Kft., the selling stockholder. All outstanding shares of our common stock will be legally issued, fully paid and non-assessable.
The following description of the material provisions of our capital stock and our amended and restated certificate of incorporation, amended and restated bylaws and other agreements with and among our stockholders is only a summary, does not purport to be complete and is qualified by applicable law and the full provisions of our amended and restated certificate of incorporation, amended and restated bylaws and other agreements. You should refer to our amended and restated certificate of incorporation, amended and restated bylaws and related agreements as in effect upon the closing of this offering, which will be included as exhibits to the registration statement of which this prospectus is a part.
Common stock
Voting. The holders of our common stock are entitled to one vote for each outstanding share of common stock owned by that stockholder on every matter properly submitted to the stockholders for their vote. Stockholders are not entitled to vote cumulatively for the election of directors.
Dividend rights. Subject to the dividend rights of the holders of any outstanding series of preferred stock, holders of our common stock are entitled to receive ratably such dividends and other distributions of cash or any other right or property as may be declared by our board of directors out of our assets or funds legally available for such dividends or distributions. See “Dividend policy.”
Liquidation rights. In the event of any voluntary or involuntary liquidation, dissolution or winding up of our affairs, holders of our common stock are entitled to share ratably in our assets that are legally available for distribution to stockholders after payment of liabilities. If we have any preferred stock outstanding at such time, holders of the preferred stock may be entitled to distribution and/or liquidation preferences. In either such case, we must pay the applicable distribution to the holders of our preferred stock before we may pay distributions to the holders of our common stock.
Undesignated preferred stock
Our amended and restated certificate of incorporation will authorize our board of directors, subject to limitations prescribed by law, to issue up to shares of undesignated preferred stock in one or more series without further stockholder approval. The board will have discretion to determine the rights, preferences, privileges and restrictions of, including, without limitation, voting rights, dividend rights, conversion rights, redemption privileges and liquidation preferences of, and to fix the number of shares of, each series of our preferred stock.
246
Table of Contents
Anti-takeover effects of Delaware law
Upon the completion of this offering, we will be subject to Section 203 of the Delaware General Corporation Law, or Section 203. In general, Section 203 prohibits a Delaware corporation from engaging in any business combination with any interested stockholder for a period of three years following the date that the stockholder became an interested stockholder, unless:
| • | prior to that date, the board of directors of the corporation approved either the business combination or the transaction that resulted in the stockholder becoming an interested stockholder; |
| • | upon consummation of the transaction that resulted in the stockholder becoming an interested stockholder, the interested stockholder owned at least 85% of the voting stock of the corporation outstanding at the time the transaction commenced, excluding for purposes of determining the number of shares outstanding those shares owned by persons who are directors and also officers and by excluding employee stock plans in which employee participants do not have the right to determine confidentially whether shares held subject to the plan will be tendered in a tender or exchange offer; or |
| • | on or subsequent to that date, the business combination is approved by the board of directors of the corporation and authorized at an annual or special meeting of stockholders, and not by written consent, by the affirmative vote of at least 66 2/3% of the outstanding voting stock that is not owned by the interested stockholder. |
In general, Section 203 defines an “interested stockholder” as any entity or person beneficially owning 15% or more of the outstanding voting stock of the corporation and any entity or person affiliated with or controlling or controlled by such entity or person. Section 203 defines “business combination” to include: (1) any merger or consolidation involving the corporation and the interested stockholder; (2) any sale, transfer, pledge or other disposition of 10% or more of the assets of the corporation involving the interested stockholder; (3) subject to certain exceptions, any transaction that results in the issuance or transfer by the corporation of any stock of the corporation to the interested stockholder; (4) any transaction involving the corporation that has the effect of increasing the proportionate share of the stock of any class or series of the corporation beneficially owned by the interested stockholder; or (5) the receipt by the interested stockholder of the benefit of any loans, advances, guarantees, pledges or other financial benefits provided by or through the corporation.
A Delaware corporation may opt out of Section 203 either by an express provision in its original certificate of incorporation or in an amendment to its certificate of incorporation or bylaws approved by its stockholders. We have not opted out, and do not currently intend to opt out, of this provision. The statute could prohibit or delay mergers or other takeover or change of control attempts and, accordingly, may discourage attempts to acquire us.
Anti-takeover effects of our amended and restated certificate of incorporation and bylaw provisions
Our amended and restated certificate of incorporation and amended and restated bylaws will, upon the closing of this offering, contain some provisions that may be deemed to have an anti-takeover effect and may delay, defer or prevent a tender offer or takeover attempt that a stockholder might deem to be in the stockholder’s best interest. The existence of these provisions
247
Table of Contents
could limit the price that investors might be willing to pay in the future for shares of our common stock. These provisions include:
Board composition and filling vacancies. We will have a classified board of directors. See “Management—Board composition after this offering.” Accordingly, it will take at least two annual meetings of stockholders to elect a majority of the board of directors given our classified board. As a result, it may discourage third-party proxy contests, tender offers or attempts to obtain control of us.
Our amended and restated bylaws will provide that, subject to the rights, if any, of holders of preferred stock, directors may be removed only for cause by the affirmative vote of the holders of a majority of the voting power of our outstanding shares of common stock entitled to vote. Furthermore, any vacancy on our board of directors, however occurring, including a vacancy resulting from an increase in the size of our board, may only be filled by the affirmative vote of a majority of our directors then in office, even if less than a quorum.
Special meetings of stockholders. Our amended and restated certificate of incorporation and amended and restated bylaws will provide that a special meeting of stockholders may be called only by the chairman of the board of directors or pursuant to a resolution adopted by the affirmative vote of the majority of the total number of directors then in office. Notwithstanding the foregoing, for so long as JBS S.A. or any of its subsidiaries owns at least 50% of our outstanding shares of common stock, JBS S.A. or such subsidiary shall have the right to call a special meeting of stockholders.
Supermajority voting. In order to effect certain amendments to our amended and restated certificate of incorporation, our amended and restated certificate of incorporation will require first the approval of a majority of our board of directors pursuant to a resolution adopted by the directors then in office, in accordance with our amended and restated bylaws, and thereafter the approval by the holders of at least 66 2/3% of our then outstanding shares of common stock. Subject to the provisions of our amended and restated certificate of incorporation, our amended and restated bylaws will expressly authorize our board of directors to make, alter or repeal our bylaws without further stockholder action. Our amended and restated bylaws may also be amended by the holders of 66 2/3% of our then outstanding shares of common stock.
No stockholder action by written consent. Our amended and restated certificate of incorporation and amended and restated bylaws will provide that an action required or permitted to be taken at any annual or special meeting of our stockholders may only be taken at a duly called annual or special meeting of stockholders. This provision prevents stockholders from initiating or effecting any action by written consent, and thereby taking actions opposed by the board. Notwithstanding the foregoing, for so long as JBS S.A. or any of its subsidiaries owns at least 50% of our outstanding shares of common stock, our stockholders will be permitted to take action by written consent.
Requirements for advance notification of stockholder nominations and proposals. Our amended and restated bylaws will contain advance notice procedures with respect to stockholder proposals and the nomination of candidates for election as directors.
Undesignated preferred stock. The authorization of undesignated preferred stock will make it possible for our board of directors to issue preferred stock with voting or other rights or preferences that could impede the success of any attempt to change control of our company.
248
Table of Contents
The foregoing provisions of our amended and restated certificate of incorporation and our amended and restated bylaws could discourage potential acquisition proposals and could delay or prevent a change in control. These provisions are intended to enhance the likelihood of continuity and stability in the composition of the board of directors and in the policies formulated by the board of directors and to discourage certain types of transactions that may involve an actual or threatened change of control. These provisions are designed to reduce our vulnerability to an unsolicited acquisition proposal. The provisions also are intended to discourage certain tactics that may be used in proxy fights. However, such provisions could have the effect of discouraging others from making tender offers for our shares and, as a consequence, they also may inhibit fluctuations in the market price of our common stock that could result from actual or rumored takeover attempts. Such provisions also may have the effect of preventing changes in our management.
Limitations of director liability and indemnification of directors, officers and employees
As permitted by Delaware law, provisions in our amended and restated certificate of incorporation and amended and restated bylaws that will be in effect at the closing of this offering will limit or eliminate the personal liability of our directors. Consequently, directors will not be personally liable to us or our stockholders for monetary damages or breach of fiduciary duty as a director, except for liability for:
| • | any breach of the director’s duty of loyalty to us or our stockholders; |
| • | any act or omission not in good faith or that involves intentional misconduct or a knowing violation of law; |
| • | any unlawful payments related to dividends or unlawful stock repurchases, redemptions or other distributions; or |
| • | any transaction from which the director derived an improper personal benefit. |
These limitations of liability do not alter director liability under the federal securities laws and do not affect the availability of equitable remedies, such as an injunction or rescission.
Our amended and restated certificate of incorporation and amended and restated bylaws that will be in effect upon the closing of this offering will also require us to indemnify our directors and officers to the fullest extent permitted by Delaware law and, prior to the completion of this offering, we intend to enter into indemnification agreements with each of our directors and officers.
These provisions may discourage stockholders from bringing a lawsuit against our directors for breach of their fiduciary duty. These provisions may also have the effect of reducing the likelihood of derivative litigation against directors and officers, even though such an action, if successful, might otherwise benefit us and our stockholders. Furthermore, a stockholder’s investment may be adversely affected to the extent we pay the costs of settlement and damage awards against directors and officers pursuant to these indemnification provisions. We believe that these provisions, the indemnification agreements and the insurance are necessary to attract and retain talented and experienced directors and officers.
249
Table of Contents
At present, there is no pending litigation or proceeding involving any of our directors or officers where indemnification will be required or permitted. We are not aware of any threatened litigation or proceeding that might result in a claim for such indemnification.
New York Stock Exchange
We intend to apply to have our common stock listed on The New York Stock Exchange under the symbol “JBS.”
Transfer agent and registrar
We expect that the transfer agent and registrar for our shares of common stock will be .
250
Table of Contents
Shares eligible for future sale
Prior to this offering, there has not been any public market for our common stock, and we make no prediction as to the effect, if any, that market sales of shares of common stock or the availability of shares of common stock for sale will have on the market price of our common stock prevailing from time to time. Nevertheless, sales of substantial amounts of common stock in the public market, or the perception that these sales could occur, could adversely affect the market price of common stock and could impair our future ability to raise capital through the sale of equity securities.
Upon the completion of this offering, we will have an aggregate of shares of common stock outstanding, assuming no exercise of the underwriters’ and the Brazilian underwriters’ over-allotment option, or an aggregate of shares of common stock outstanding, assuming full exercise of the underwriters’ over-allotment option. Of the outstanding shares, all of the shares sold in this offering, including any additional shares sold upon exercise of the underwriters’ and Brazilian underwriters’ option to purchase additional shares, will be freely tradable, except that any shares purchased by “affiliates” (as that term is defined in Rule 144 under the Securities Act) may only be sold in compliance with the limitations described below. The remaining shares of common stock outstanding after this offering will be deemed “restricted securities” as defined in Rule 144. Restricted securities may be sold in the public market only if registered or if they qualify for an exemption from registration under Rule 144 or Rule 701, promulgated under the Securities Act, which rules are summarized below. Subject to the lock-up agreements described below, shares held by our affiliates that are not restricted securities may be sold subject to compliance with Rule 144 of the Securities Act without regard to the prescribed one-year holding period under Rule 144.
Rule 144
In general, under Rule 144 as currently in effect, once we have been subject to public company reporting requirements for at least 90 days, a person who is not deemed to have been one of our affiliates for purposes of the Securities Act at any time during the 90 days preceding a sale and who has beneficially owned the shares proposed to be sold for at least six months, including the holding period of any prior owner other than our affiliates, is entitled to sell those shares without complying with the manner of sale, volume limitation or notice provisions of Rule 144, subject to compliance with the public information requirements of Rule 144. If such a person has beneficially owned the shares proposed to be sold for at least one year, including the holding period of any prior owner other than our affiliates, then that person is entitled to sell those shares without complying with any of the requirements of Rule 144.
In general, under Rule 144, as currently in effect, our affiliates or persons selling shares on behalf of our affiliates are entitled to sell upon expiration of the lock-up agreements described below, within any three-month period beginning 90 days after the date of this prospectus, a number of shares that does not exceed the greater of:
| (i) | 1% of the number of shares of common stock then outstanding, which will equal approximately shares immediately after this offering; or |
| (ii) | the average weekly trading volume of the common stock during the four calendar weeks preceding the filing of a notice on Form 144 with respect to that sale. |
251
Table of Contents
Sales under Rule 144 by our affiliates or persons selling shares on behalf of our affiliates are also subject to certain manner of sale provisions and notice requirements and to the availability of current public information about us.
Rule 701
Rule 701 generally allows a stockholder who purchased shares of our common stock pursuant to a written compensatory plan or contract and who is not deemed to have been an affiliate of our company during the immediately preceding 90 days to sell these shares in reliance upon Rule 144, but without being required to comply with the public information, holding period, volume limitation or notice provisions of Rule 144. Rule 701 also permits affiliates of our company to sell their Rule 701 shares under Rule 144 without complying with the holding period requirements of Rule 144. All holders of Rule 701 shares, however, are required to wait until 90 days after the date of this prospectus before selling those shares pursuant to Rule 701.
Directed share program
At our request, the underwriters have reserved up to % of the shares of common stock for sale at the initial public offering price to persons who are directors, officers or employees, or who are otherwise associated with us, through a directed share program. The sales will be made by through a directed share program. The number of shares of common stock available for sale to the general public will be reduced by the number of directed shares purchased by participants in the program. We do not know if these persons will choose to purchase all or any portion of these reserved shares, but any purchases they do make will reduce the number of shares available to the general public. These persons must commit to purchase by a.m. on the day following the date of this prospectus. Any reserved shares not so purchased will be offered by the underwriters to the general public on the same terms as the other shares. Except for certain of our officers and directors who have entered into lock-up agreements as contemplated under “Lock-up agreements” below , each person buying shares through the directed share program has agreed that, for a period of calendar days from the date of this prospectus, he or she will not, without the prior written consent of , offer, pledge, announce the intention to sell, sell, contract to sell, sell any option or contract to purchase, purchase any option or contract to sell, grant any option, right or warrant to purchase or otherwise transfer or dispose of, directly or indirectly, any shares of our common stock or any securities convertible into our or exchangeable for our common stock, enter into any swap or other agreement that transfers, in whole or in part, any of the economic consequences of ownership of our common stock, or make any demand for or exercise any right with respect to the registration of any shares or any security convertible into or exercisable or exchangeable for shares of common stock. For officers and directors purchasing shares of common stock through the directed share program, the lock-up agreements contemplated under “Lock-up agreements” below shall govern with respect to their purchases.
252
Table of Contents
Lock-up agreements
We, BNDESPAR, the selling stockholder and our executive officers and directors have agreed with the underwriters prior to the commencement of this offering that we and each of these persons or entities, with limited exceptions, for a period of 180 days after the date of this prospectus, may not, without the prior written consent of the representatives, among other things:
| (1) | offer, pledge, announce the intention to sell, grant any option, right or warrant to purchase, or otherwise transfer or dispose of, directly or indirectly, any shares of our common stock (including, without limitation, BDRs representing such shares, common stock or BDRs that may be deemed to be beneficially owned by such directors, executive officers, managers and members in accordance with the rules and regulations of the SEC and securities which may be issued upon exercise of a stock option or warrant), or |
| (2) | enter into any swap or other agreement that transfers, in whole or in part, any of the economic consequences of ownership of our common stock, including BDRs representing such shares, |
whether any such transaction described in bullet points (1) or (2) above is to be settled by delivery of common stock or such other securities, in cash or otherwise. The 180-day restricted period described above will be extended if during the last 17 days of the 180-day restricted period we issue an earnings release or material news or a material event relating to us occurs or if prior to the expiration of the 180-day restricted period, we announce that we will release earnings results during the 16-day period beginning on the last day of the 180-day period, in which case the restrictions described above will continue to apply until the expiration of the 18-day period beginning on the issuance of the earnings release or the occurrence of the material news or material event, as applicable, unless the representatives waive, in writing, such extension.
Conversion of reorganized PPC common stock into our common stock
In the event we complete this offering or any other initial public offering of our common stock and the offered shares are listed on a national securities exchange, then, at any time during an exchange window falling within the period commencing on the date of the closing of this offering or such other offering and ending two years and 30 days from the Proposed PPC Acquisition Closing Date, we will have the right to deliver written notice of the mandatory exchange of all the reorganized PPC common stock, or the Mandatory Exchange Transaction, to the reorganized PPC at its principal place of business. Upon delivery to the reorganized PPC of notice of the Mandatory Exchange Transaction, each share of the reorganized PPC common stock held by stockholders other than us will automatically, without any further action on behalf of the reorganized PPC or any of those holders, be exchanged for a number of duly authorized, validly issued, fully paid and non-assessable shares of our common stock equal to the exchange offer ratio. See “The Proposed PPC Acquisition—Conversion of reorganized PPC common stock into our common stock.” Pursuant to section 1145(a) of the Bankruptcy Code, shares of our common stock issued in connection with such conversion of the reorganization PPC common stock and will be exempt from registration under the Securities Act and will be freely tradable by non-affiliates.
253
Table of Contents
Exchange of JBS S.A. debentures for shares of our common stock
On December 22, 2009, JBS S.A., our indirect parent company, agreed to issue a series of exchangeable debentures in a transaction exempt from registration under the Securities Act pursuant to Regulation S thereunder. The debentures are expected to be issued on December 29, 2009 and will not be transferable by their terms. These debentures are mandatorily exchangeable into our common stock in the form of BDRs following this offering under certain conditions. The terms of the debentures provide that 2,000,000 debentures will be issued. BNDESPAR has agreed to subscribe for and purchase up to the entire principal amount of the debentures offered for $2 billion. Following this offering and assuming compliance with other conditions, the 2,000,000 outstanding debentures will be mandatorily exchanged for an aggregate percentage of shares of our outstanding common stock in the form of BDRs equal to $2 billion divided by our equity valuation in U.S. dollars based on the number of shares outstanding immediately prior to this offering, but calculated on the basis of the price per share in this offering, multiplied by 100. Under this agreement, the number of shares of our common stock represented by the BDRs will not represent more than 20-25% of our common stock. Based on the midpoint of the expected price range of $ to $ per share and an offering size of shares in this offering, the 2,000,000 debentures in the aggregate would be mandatorily exchanged for shares representing approximately % of our common stock. The shares of our common stock to be delivered upon this mandatory exchange will be delivered by JBS S.A.
When common stock is initially issued in the form of BDRs upon the mandatory exchange of the Debentures, the BDRs will be “restricted securities” as defined in Rule 144. However, the BDRs will be held by a custodian on behalf of the holders of the Debentures, including BNDESPAR, until the date that is 195 days after the completion of this offering and will not be transferable during that period. Following the expiration of that period, those BDRs that are held by non-affiliates will be freely tradable under Rule 144.
Even after expiration of the 195-day period described above, the BDRs to be received by BNDESPAR will not be freely tradable and will be transferable only (1) pursuant to Rule 144, subject to the volume limitations, manner of sale provisions and notice requirements described under “—Rule 144” above, (2) pursuant to another applicable exemption from registration under the Securities Act or (3) pursuant to an effective registration statement under the Securities Act. We will agree to grant BNDESPAR the registration rights described under “Principal and selling stockholder—Registration rights agreement.”
254
Table of Contents
Certain material United States federal income and estate tax considerations for non-U.S. holders
The following is a general discussion of material U.S. federal income and estate tax considerations for a non-U.S. holder (as defined below) regarding the acquisition, ownership and disposition of shares of our common stock as of the date hereof. This discussion only applies to non-U.S. holders who purchase and hold our common stock as a capital asset for U.S. federal income tax purposes (generally property held for investment). This discussion does not describe all of the tax consequences that may be relevant to a non-U.S. holder in light of its particular circumstances.
For purposes of this discussion, a “non-U.S. holder” is any beneficial owner of 5% or less of shares of our common stock that is not, for U.S. federal income tax purposes:
| • | an individual who is a citizen or resident of the United States; |
| • | a corporation, or other entity treated as a corporation for U.S. federal income tax purposes, that is created or organized in or under the laws of the United States, any state thereof or the District of Columbia; |
| • | a partnership or other entity taxable as a partnership for U.S. federal income tax purposes; |
| • | an estate, the income of which is subject to U.S. federal income tax regardless of its source; or |
| • | a trust, if (1) a court within the United States is able to exercise primary supervision over the administration of the trust and one or more United States persons have the authority to control all substantial decisions of the trust or (2) it has a valid election in effect under applicable Treasury regulations to be treated as a United States person. |
This discussion is based upon provisions of the Internal Revenue Code of 1986, as amended, or the Code, and Treasury regulations, rulings and judicial decisions as of the date hereof. These authorities may change, perhaps retroactively, which could result in U.S. federal income and estate tax consequences different from those summarized below. This discussion does not address all aspects of U.S. federal income and estate taxes and does not describe any foreign, state, local or other tax considerations that may be relevant to non-U.S. holders in light of their particular circumstances. In addition, this discussion does not describe the U.S. federal income and estate tax consequences applicable to a non-U.S. holder who is subject to special treatment under U.S. federal income tax laws (including a United States expatriate, a “controlled foreign corporation,” a “passive foreign investment company,” a corporation that accumulates earnings to avoid U.S. federal income tax, a foreign tax-exempt organization, a financial institution, a broker or dealer in securities, an insurance company, a regulated investment company, a real estate investment trust, a person who holds our common stock as part of a hedging or conversion transaction or as part of a short-sale or straddle, a former U.S. citizen or resident or a pass-through entity or an investor in a pass-through entity). We cannot assure you that a change in law will not significantly alter the tax considerations that we describe in this discussion.
If a partnership holds shares of our common stock, the tax treatment of a partner will generally depend upon the status of the partner and the activities of the partnership. Any partner of a partnership holding shares of our common stock should consult its own tax advisors.
255
Table of Contents
You should consult your tax advisor in determining the tax consequences to you of purchasing, owning and disposing of our common stock, including the application to your particular situation of the U.S. federal income and estate tax considerations discussed below, as well as the application of state, local, foreign or other tax laws.
Dividends
In general, any distributions we make to you with respect to your shares of common stock that constitute dividends for U.S. federal income tax purposes will be subject to U.S. withholding tax at a rate of 30% of the gross amount, unless you are eligible for a reduced rate of withholding tax under an applicable income tax treaty and (a) you provide an Internal Revenue Service, or IRS, Form W-8BEN (or the appropriate successor form) to us or our paying agent certifying under penalty of perjury that you are not a United States person as defined under the Code and you are entitled to benefits under the treaty or (b) you satisfy the relevant certification requirements of applicable Treasury regulations, if our common stock is held through certain foreign intermediaries. Special certification and other requirements apply to certain non-U.S. holders that are pass-through entities rather than corporations or individuals. A distribution will constitute a dividend for U.S. federal income tax purposes to the extent of our current or accumulated earnings and profits as determined under the U.S. federal income tax principles. Any distribution not constituting a dividend will be treated first as reducing your basis in your shares of common stock and, to the extent it exceeds your basis, as capital gain.
Dividends we pay to you that are effectively connected with your conduct of a trade or business within the United States (and, if certain income tax treaties apply, are attributable to a U.S. permanent establishment maintained by you) generally will not be subject to U.S. withholding tax if you provide us or our paying agent with a duly completed and executed IRS Form W-8ECI, or successor form. Instead, such dividends generally will be subject to U.S. federal income tax, net of certain deductions, at the same graduated individual or corporate rates applicable to a United States person as defined under the Code. In addition, if you are a corporation, effectively connected income may also be subject to a “branch profits tax” at a rate of 30% (or such lower rate as may be specified by an applicable income tax treaty). A non-U.S. holder of shares of our common stock eligible for a reduced rate of U.S. withholding tax pursuant to an income tax treaty may obtain a refund of any excess amounts withheld by filing an appropriate claim for refund with the IRS.
Gain on sale or other disposition of common stock
In general, a non-U.S. holder will not be subject to U.S. federal income tax on any gain realized upon the sale or other disposition of shares of our common stock unless:
| • | the gain is effectively connected with a trade or business carried on by the non-U.S. holder within the United States and, if required by an applicable income tax treaty, the gain is attributable to a permanent establishment of the non-U.S. holder maintained in the United States, in which case a non-U.S. holder will be subject to U.S. federal income tax on any gain realized upon the sale or other disposition on a net income basis, in the same manner as if the non-U.S. holder were a resident of the United States (and, possibly, the non-U.S. holder will be subject to additional branch profits tax discussed above in the case of a non-U.S. holder that is a corporation); |
256
Table of Contents
| • | the non-U.S. holder is an individual and is present in the United States for 183 days or more in the taxable year of disposition and certain other requirements are met, in which case a non-U.S. holder will be subject to a flat 30% tax on any gain realized upon the sale or other disposition, which tax may be offset by U.S. source capital losses (even though the individual is not considered a resident of the United States); or |
| • | the non-U.S. holder owns more than 5% of shares of our common stock and we are or have been a United States real property holding corporation for U.S. federal income tax purposes at any time within the shorter of the five-year period preceding the disposition and the non-U.S. holder’s holding period. |
Federal estate taxes
Common stock owned or treated as owned by an individual who is not a citizen or resident (as defined for U.S. federal estate tax purposes) of the United States at the time of his or her death will be included in the individual’s gross estate for U.S. federal estate tax purposes, and therefore may be subject to U.S. federal estate tax, unless an applicable tax treaty provides otherwise.
Backup withholding, information reporting and other reporting requirements
Generally, we must report annually to the IRS, and to each non-U.S holder, the amount of dividends paid to such non-U.S. holder, the name and address of the recipient, and the amount, if any, of tax withheld with respect to such dividends, regardless of whether withholding was required. Copies of these information returns may also be made available to the tax authorities in the country in which the non-U.S. holder resides under the provisions of an applicable tax treaty. A non-U.S. holder may have to comply with certification procedures to establish that the holder is not a United States person as defined under the Code in order to avoid additional information reporting and backup withholding tax requirements, which may apply to dividends that we pay and the proceeds of a sale of our common stock within the United States or conducted through certain U.S.-related financial intermediaries. The certification procedures required to claim a reduced rate of withholding under a treaty will satisfy the certification requirements necessary to avoid the backup withholding tax as well.
Any amounts withheld under the backup withholding rules may be allowed as a refund or a credit against a non-U.S. holder’s U.S. federal income tax liability, provided the required information is furnished to the IRS.
Proposed legislation—Tax Extenders Act of 2009
Federal legislation was recently passed by the House of Representatives that would limit the ability of non-U.S. holders to claim relief from U.S. federal withholding tax in respect of dividends paid on our common stock, if such holders hold the common stock through a “foreign financial institution”, unless the foreign financial institution enters into an agreement with the IRS under which it agrees to comply with certain reporting and verification obligations with respect to its U.S. accounts. Similar legislation has been introduced in the Senate. The proposed legislation would also limit the ability of a “non-financial foreign entity” to claim relief from U.S. federal withholding tax in respect of dividends paid to such non-financial foreign entity unless the non-financial foreign entity has provided certain documentation about its beneficial owners
257
Table of Contents
to the withholding agent. A non-U.S. holder generally would be permitted to claim a refund to the extent any tax withheld exceeded the holder’s actual tax liability. The proposed legislation has not yet been enacted and it is unclear whether, and in what form, any legislation will be enacted. Non-U.S. holders are encouraged to consult their tax advisers regarding the possible implications of the proposed legislation on their investment in respect of our common stock.
The foregoing discussion of certain material U.S. federal income and estate tax considerations is not tax advice. Accordingly, each prospective non-U.S. holder of shares of our common stock should consult his, her or its own tax advisor with respect to the federal, state, local and foreign tax consequences of the acquisition, ownership and disposition of common stock.
258
Table of Contents
We and the selling stockholder are offering shares of common stock through a number of underwriters. J.P. Morgan Securities Inc., Merrill Lynch, Pierce, Fenner & Smith Incorporated, Morgan Stanley & Co. Incorporated and BMO Capital Markets Corp. are acting as the representatives of the underwriters and as joint bookrunners for the offering. We, JBS S.A. and the selling stockholder have entered into an underwriting agreement with the underwriters. Subject to the terms and conditions of the underwriting agreement, we and the selling stockholder have agreed to sell to the underwriters, and each underwriter has agreed to purchase, at the public offering price less the underwriting discount set forth on the cover page of this prospectus, the number of shares of our common stock listed next to its name in the following table.
| Name | Number of shares | |
J.P. Morgan Securities Inc. | ||
Merrill Lynch, Pierce, Fenner & Smith Incorporated | ||
Morgan Stanley & Co. Incorporated | ||
BMO Capital Markets Corp. | ||
Deutsche Bank Securities Inc. | ||
Rabo Securities USA, Inc. | ||
Wells Fargo Securities, LLC | ||
ING Financial Markets LLC | ||
Santander Investment Securities, Inc. | ||
Stephens Inc. | ||
Bradesco BBI | ||
Total | ||
The underwriters are committed to purchase all the common stock offered by us and the selling stockholder if they purchase any shares of common stock (other than those shares of common stock covered by their option to purchase additional shares as described below). The underwriting agreement also provides that if an underwriter defaults, the purchase commitments of non-defaulting underwriters may also be increased or the offering may be terminated. The underwriting agreement also provides that the obligations of the underwriters are subject to certain conditions precedent, including the absence of any material adverse change in our business and the receipt of certain certificates, opinions and letters from us, our counsel and our independent auditors.
The underwriters propose to offer the shares of common stock directly to the public at the initial public offering price set forth on the cover page of this prospectus and to certain dealers at that price less a concession not in excess of $ per share. Any such dealers may resell shares to certain other brokers or dealers at a discount of up to $ per share from the initial public offering price. After the initial public offering of the shares of common stock, the underwriters may change the offering price and other selling terms. The representatives have advised us that the underwriters do not intend to confirm discretionary sales in excess of 5% of the common stock offered in the offering.
The underwriters have an option to buy up to additional shares of common stock from us to cover sales of shares by the underwriters which exceed the number of shares specified in the table above. The underwriters have 30 days from the date of this prospectus to exercise this over-
259
Table of Contents
allotment option. If any additional shares of common stock are purchased, the underwriters will offer the additional shares on the same terms as those on which the shares are being offered.
The underwriting fee is equal to the public offering price per share of common stock less the amount paid by the underwriters to us and the selling stockholder per share of common stock. The underwriting fee in connection with the offering is $ per share. The following table shows the per share and total underwriting discount to be paid to the underwriters by us and the selling stockholder assuming both no exercise and full exercise of the underwriters’ option to purchase additional shares.
Underwriting discount:
| Paid by us | Paid by the selling stockholder | |||||||||||
| Without over- allotment exercise | With full over- allotment exercise | Without over- allotment exercise | With full over- allotment exercise | |||||||||
Per share | $ | $ | $ | $ | ||||||||
Total | $ | $ | $ | $ | ||||||||
We estimate that the total expenses of the offering, including registration, filing and listing fees, printing fees and legal and accounting expenses, but excluding the underwriting discount, will be approximately $ , which includes expenses of $ incurred by the underwriters that we have agreed to reimburse.
The offering of our shares of common stock is made for delivery when and if accepted by the underwriters and subject to prior sale and to withdrawal, cancellation or modification of this offering without notice. The underwriters reserve the right to reject an order for the purchase of shares in whole or part.
A prospectus in electronic format may be made available on the websites maintained by one or more underwriters, or selling group members, if any, participating in the offering. The underwriters may agree to allocate a number of shares to selling group members for sale to their online brokerage account holders. Internet distributions will be allocated by the representatives to underwriters and selling group members that may make Internet distributions on the same basis as other allocations. In addition, the underwriters may sell shares to securities dealers who resell shares to online brokerage account holders. The information on any such website is not part of this prospectus.
We, BNDESPAR, JBS S.A., the selling stockholder and our executive officers and directors have agreed with the underwriters prior to the commencement of this offering that we and each of these persons or entities, with limited exceptions, for a period of 180 days after the date of this prospectus, may not, without the prior written consent of the representatives, among other things:
| (1) | offer, pledge, announce the intention to sell, grant any option, right or warrant to purchase, or otherwise transfer or dispose of, directly or indirectly, any shares of our common stock (including, without limitation, BDRs representing such shares, common stock or BDRs that may be deemed to be beneficially owned by such directors, executive officers, managers and members in accordance with the rules and regulations of the SEC and securities which may be issued upon exercise of a stock option or warrant), or |
| (2) | enter into any swap or other agreement that transfers, in whole or in part, any of the economic consequences of ownership of our common stock, including BDRs representing such shares, |
260
Table of Contents
whether any such transaction described in bullet points (1) or (2) above is to be settled by delivery of common stock or such other securities, in cash or otherwise. The 180-day restricted period described above will be extended if during the last 17 days of the 180-day restricted period we issue an earnings release or material news or a material event relating to us occurs or if prior to the expiration of the 180-day restricted period, we announce that we will release earnings results during the 16-day period beginning on the last day of the 180-day period, in which case the restrictions described above will continue to apply until the expiration of the 18-day period beginning on the issuance of the earnings release or the occurrence of the material news or material event, as applicable, unless the representatives waive, in writing, such extension.
The representatives have no current intent or arrangement to release any of the shares subject to the lock-up agreements prior to the expiration of the 180-day lock-up period. There is no contractually specified condition for the waiver of lock-up restrictions, and any waiver is at the discretion of the representatives.
There are no specific criteria for the waiver of lock-up restrictions, and the representatives cannot in advance determine the circumstances under which a waiver might be granted. Any waiver will depend on the facts and circumstances existing at the time. Among the factors that the representatives may consider in deciding whether to release shares may include the length of time before the lock-up expires, the number of shares involved, the reason for the requested release, market conditions, the trading price of our common stock, historical trading volumes of our common stock, and whether the person seeking the release is an officer, director or affiliate of our company. The representatives will not consider their own positions in our securities, if any, in determining whether to consent to a waiver of a lock-up agreement.
We, JBS S.A. and the selling stockholder have agreed to indemnify the underwriters against certain liabilities, including liabilities under the Securities Act.
We expect to apply to have our common stock approved for listing on The New York Stock Exchange under the symbol “JBS.”
In connection with the offering, the underwriters may engage in stabilizing transactions, which involves making bids for, purchasing and selling shares of common stock in the open market for the purpose of preventing or retarding a decline in the market price of the common stock while the offering is in progress. These stabilizing transactions may include making short sales of the common stock, which involve the sale by the underwriters of a greater number of shares of common stock than they are required to purchase in the offering, and purchasing shares of common stock on the open market to cover positions created by short sales. Short sales may be “covered” shorts, which are short positions in an amount not greater than the underwriters’ over-allotment option referred to above, or may be “naked” shorts, which are short positions in excess of that amount. The underwriters may close out any covered short position either by exercising their over-allotment option, in whole or in part, or by purchasing shares in the open market. In making this determination, the underwriters will consider, among other things, the price of shares available for purchase in the open market compared to the price at which the underwriters may purchase shares through the over-allotment option. A naked short position is more likely to be created if the underwriters are concerned that there may be downward pressure on the price of the common stock in the open market that could adversely affect investors who purchase in the offering. To the extent that the underwriters create a naked short position, they will purchase shares in the open market to cover the position.
261
Table of Contents
The underwriters have advised us that, pursuant to Regulation M under the Exchange Act, they may also engage in other activities that stabilize, maintain or otherwise affect the price of the common stock, including the imposition of penalty bids. This means that if the representatives of the underwriters purchase common stock in the open market in stabilizing transactions or to cover short sales, the representatives can require the underwriters that sold those shares as part of the offering to repay the underwriting discount received by them.
These activities may have the effect of raising or maintaining the market price of the common stock or preventing or retarding a decline in the market price of the common stock, and, as a result, the price of the common stock may be higher than the price that otherwise might exist in the open market. If the underwriters commence these activities, they may discontinue them at any time. The underwriters may carry out these transactions on The New York Stock Exchange, in the over-the-counter market or otherwise.
At our request, the underwriters have reserved for sale as part of the offering, at the initial offering price, up to shares, or approximately of the total number of shares offered in this prospectus, for our employees and directors, selected business associates and certain related persons. If purchased by these persons, these shares will be subject to a -day lock-up restriction. The number of shares of common stock available for sale to the general public will be reduced to the extent such persons purchase such reserved shares. Any reserved shares which are not so purchased will be offered by the underwriters to the general public on the same basis as the other shares offered in this prospectus.
Prior to the offering, there has been no public market for our common stock. The initial public offering price will be determined by negotiations between us and the underwriters. In determining the initial public offering price of the common stock, we and the underwriters considered a number of factors including:
| • | the information set forth in this prospectus and otherwise available to the underwriters; |
| • | our prospects and the history and prospects for the industry in which we compete; |
| • | an assessment of our management; |
| • | our prospects for future earnings; |
| • | the general condition of the securities markets, and the initial public offering market in particular, at the time of the offering; |
| • | the recent market prices of, and demand for, publicly traded common stock of generally comparable companies; and |
| • | other factors deemed relevant by the underwriters, the selling stockholder and us. |
Neither we, the selling stockholder nor the underwriters can assure investors that an active trading market will develop for our common stock, or that the shares will trade in the public market at or above the initial public offering price.
In relation to each Member State of the European Economic Area which has implemented the Prospectus Directive (each, a “Relevant Member State”), with effect from and including the date on which the Prospectus Directive is implemented in that Relevant Member State (the “Relevant Implementation Date”), no offer of shares of our common stock to the public in that Relevant Member State may be made prior to the publication of a prospectus in relation to our common stock which has been approved by the competent authority in that Relevant Member State or,
262
Table of Contents
where appropriate, approved in another Relevant Member State and notified to the competent authority in that Relevant Member State, all in accordance with the Prospectus Directive, except that, with effect from and including the Relevant Implementation Date, an offer of our common stock may be made to the public in that Relevant Member State at any time:
| • | to legal entities which are authorized or regulated to operate in the financial markets or, if not so authorized or regulated, whose corporate purpose is solely to invest in securities; |
| • | to any legal entity which has two or more of (1) an average of at least 250 employees during the last financial year; (2) a total balance sheet of more than€43,000,000 and (3) an annual net turnover of more than€50,000,000, as shown in its last annual or consolidated accounts; or |
| • | in any other circumstances which do not require the publication by the issuer of a prospectus pursuant to Article 3 of the Prospectus Directive. |
Each purchaser of shares of common stock described in this prospectus located within a relevant member state will be deemed to have represented, acknowledged and agreed that it is a “qualified investor” within the meaning of Article 2(1)(e) of the Prospectus Directive.
For the purposes of this provision, the expression an “offer of shares to the public” in relation to any common stock in any Relevant Member State means the communication in any form and by any means of sufficient information on the terms of the offer and the shares of common stock to be offered so as to enable an investor to decide to purchase or subscribe the shares of common stock, as the same may be varied in that Relevant Member State by any measure implementing the Prospectus Directive in that Relevant Member State, and the expression “Prospectus Directive” means Directive 2003/71/EC and includes any relevant implementing measure in each Relevant Member State.
This prospectus is only being distributed to, and is only directed at, persons in the United Kingdom that are qualified investors within the meaning of Article 2(1)(e) of the Prospectus Directive (“Qualified Investors”) that are also (i) investment professionals falling within Article 19(5) of the Financial Services and Markets Act 2000 (Financial Promotion) Order 2005 (the “Order”) or (ii) high net worth entities, and other persons to whom it may lawfully be communicated, falling within Article 49(2)(a) to (d) of the Order (all such persons together being referred to as “relevant persons”). This prospectus and its contents are confidential and should not be distributed, published or reproduced (in whole or in part) or disclosed by recipients to any other persons in the United Kingdom. Any person in the United Kingdom that is not a relevant person should not act or rely on this document or any of its contents.
Notice to prospective investors In Switzerland
We have not and will not register with the Swiss Financial Market Supervisory Authority (FINMA) as a foreign collective investment scheme pursuant to Article 119 of the Federal Act on Collective Investment Scheme of 23 June 2006, as amended (CISA), and accordingly the shares being offered pursuant to this prospectus have not and will not be approved, and may not be licenseable, with FINMA. Therefore, the shares have not been authorized for distribution by FINMA as a foreign collective investment scheme pursuant to Article 119 CISA and the shares offered hereby may not be offered to the public (as this term is defined in Article 3 CISA) in or from Switzerland. The shares may solely be offered to “qualified investors,” as this term is defined in Article 10 CISA, and in the circumstances set out in Article 3 of the Ordinance on Collective Investment Scheme of
263
Table of Contents
22 November 2006, as amended (CISO), such that there is no public offer. Investors, however, do not benefit from protection under CISA or CISO or supervision by FINMA. This prospectus and any other materials relating to the shares are strictly personal and confidential to each offeree and do not constitute an offer to any other person. This prospectus may only be used by those qualified investors to whom it has been handed out in connection with the offer described herein and may neither directly or indirectly be distributed or made available to any person or entity other than its recipients. It may not be used in connection with any other offer and shall in particular not be copied and/or distributed to the public in Switzerland or from Switzerland. This prospectus does not constitute an issue prospectus as that term is understood pursuant to Article 652a and/or 1156 of the Swiss Federal Code of Obligations. We have not applied for a listing of the shares on the SIX Swiss Exchange or any other regulated securities market in Switzerland, and consequently, the information presented in this prospectus does not necessarily comply with the information standards set out in the listing rules of the SIX Swiss Exchange and corresponding prospectus schemes annexed to the listing rules of the SIX Swiss Exchange.
Notice to prospective investors in the Dubai International Financial Centre
This document relates to an exempt offer in accordance with the Offered Securities Rules of the Dubai Financial Services Authority. This document is intended for distribution only to persons of a type specified in those rules. It must not be delivered to, or relied on by, any other person. The Dubai Financial Services Authority has no responsibility for reviewing or verifying any documents in connection with exempt offers. The Dubai Financial Services Authority has not approved this document nor taken steps to verify the information set out in it, and has no responsibility for it. The shares of common stock which are the subject of the offering contemplated by this prospectus may be illiquid and/or subject to restrictions on their resale. Prospective purchasers of the common stock offered in the offering should conduct their own due diligence on the shares. If you do not understand the contents of this document you should consult an authorized financial adviser.
Relationships with the underwriters
The international underwriters and their affiliates have provided in the past to us and our affiliates, including the selling stockholder, and may provide from time to time in the future certain commercial banking, financial advisory, investment banking and other services for us and such affiliates in the ordinary course of their business, for which they have received and may continue to receive customary fees and commissions. Affiliates of J.P. Morgan Securities Inc., Merrill Lynch, Pierce, Fenner & Smith Incorporated, BMO Capital Markets Corp. and Rabo Securities USA, Inc. are lenders under our senior secured revolving credit facility. In addition, J.P. Morgan Securities Inc., Banc of America Securities LLC (an affiliate of Merrill Lynch, Pierce, Fenner & Smith Incorporated), BMO Capital Markets Corp., ING Financial Markets LLC and Rabo Securities USA, Inc. were initial purchasers of the 11.625% senior unsecured notes due 2014 that were issued in April 2009 by our wholly owned subsidiaries JBS USA, LLC and JBS Finance, Inc., and J.P. Morgan Securities Inc. was an initial purchaser of JBS S.A.’s 10.5% senior notes due 2016. Affiliates of BMO Capital Markets Corp., Morgan Stanley & Co. Incorporated, Rabo Securities USA, Inc. and ING Financial Markets LLC are expected to be joint lead arrangers of, and lenders under, the Exit Facility with PPC. Wells Fargo Bank and affiliates of Rabo Securities USA, Inc. and ING Financial Markets LLC are lenders under the revolving credit facility for J&F Oklahoma. Santander Investment Securities Inc. and Bradesco BBI or their respective affiliates were underwriters for JBS S.A.’s initial public offering in Brazil.
264
Table of Contents
In addition, from time to time, the underwriters and their affiliates may effect transactions for their own account or the account of customers, and hold on behalf of themselves or its customers, long or short positions in our debt or equity securities or loans, and may do so in the future.
265
Table of Contents
The validity of the shares of common stock offered hereby and certain other matters of United States law will be passed upon for us by White & Case LLP. Certain matters of United States law in connection with this offering will be passed upon for the underwriters by Simpson Thacher & Bartlett LLP. Certain matters of Brazilian law in connection with this offering will be passed upon for us by Pinheiro Neto Advogados. Certain matters of Brazilian law in connection with this offering will be passed upon for the underwriters by Mattos Filho, Veiga Filho, Marrey Jr. e Quiroga Advogados.
Our consolidated financial statements as of and for the year ended December 28, 2008, have been audited by BDO Seidman, LLP, as stated in their report included elsewhere in this prospectus and have been so included in reliance upon the report of such firm given upon their authority as experts in accounting and auditing.
The consolidated financial statements as of and for (1) the 173 days from July 11, 2007 through December 30, 2007, (2) the 198 days from December 25, 2006 through July 10, 2007, and (3) the year ended December 24, 2006, included in this prospectus and elsewhere in the registration statement have been so included in reliance upon the report of Grant Thornton LLP, independent registered public accountants, upon the authority of said firm as experts in giving said reports.
The consolidated financial statements of JBS Packerland Inc. (formerly known as Smithfield Beef Group, Inc.) as of and for the year ended April 27, 2008, appearing in this prospectus and in the registration statement, have been audited by Ernst & Young LLP, independent registered public accounting firm, as set forth in their report thereon appearing elsewhere herein and are included in reliance upon such report given on the authority of said firm as experts in accounting and auditing.
The financial statements of Five Rivers Ranch Cattle Feeding LLC as of and for the year ended March 31, 2008, included in this prospectus have been audited by Deloitte & Touche LLP, an independent registered public accounting firm, as stated in their report appearing elsewhere in this prospectus. Such financial statements are included in reliance upon the report of such firm given upon their authority as experts in accounting and auditing.
Our condensed consolidated financial statements as of September 27, 2009 and for the thirty-nine weeks ended September 27, 2009 and September 28, 2008 have been reviewed by BDO Seidman, LLP as stated in their report included elsewhere in this prospectus. This report is not considered a “report” or “part” of the prospectus within the meaning of Sections 7 and 11 of the Securities Act of 1933, and Section 11 liability under that Act does not extend to such report.
The consolidated financial statements of Pilgrim’s Pride Corporation as of September 26, 2009 and September 27, 2008, and for each of the three years in the period ended September 26, 2009, appearing in the registration statement of which this prospectus is a part have been audited by Ernst & Young LLP, independent registered public accounting firm, as set forth in their report thereon (which contains an explanatory paragraph describing conditions that raise substantial doubt about PPC’s ability to continue as a going concern as described in Note A to such consolidated financial statements) appearing elsewhere herein, and are included in reliance upon such report given on the authority of said firm as experts in accounting and auditing.
266
Table of Contents
Where you can find more information
We have filed with the SEC a registration statement on Form S-1 under the Securities Act with respect to the shares of common stock we are offering. The registration statement, including the attached exhibits and schedule, contains additional relevant information about us and our common stock. This prospectus does not contain all of the information set forth in the registration statement and the exhibits and schedule thereto. The rules and regulations of the SEC allow us to omit from this prospectus certain information included in the registration statement. When we complete this offering, we will be required to file annual, quarterly and special reports, proxy statements and other information with the SEC. These reports, proxy and information statements will be available free of charge on our website.
For further information about us and our common stock, you may inspect a copy of the registration statement and the exhibits and schedule to the registration statement without charge at the offices of the SEC at 100 F Street, N.E., Washington, D.C. 20549. You may obtain copies of all or any part of the registration statement from the Public Reference Section of the SEC, 100 F Street, N.E., Washington, D.C. 20549 upon the payment of the prescribed fees. You may obtain information on the operation of the Public Reference Room by calling the SEC at 1-800-SEC-0330. The SEC maintains a website at www.sec.gov that contains reports, proxy and information statements and other information regarding registrants like us that file electronically with the SEC. You can also inspect our registration statement on this website.
267
Table of Contents
Index to consolidated financial statements
| JBS USA Holdings, Inc. | ||
| F-3 | ||
Condensed Consolidated Balance Sheets as of December 28, 2008 and September 27, 2009 | F-4 | |
F-5 | ||
F-6 | ||
F-7 | ||
| F-8 | ||
| JBS USA Holdings, Inc. | ||
| F-57 | ||
| F-58 | ||
Consolidated Statement of Operations for the Fifty-two weeks ended December 28, 2008 | F-59 | |
Consolidated Statement of Cash Flows for the Fifty-two weeks ended December 28, 2008 | F-60 | |
Consolidated Statement of Stockholder’s Equity for the Fifty-two weeks ended December 28, 2008 | F-61 | |
| F-62 | ||
| JBS USA Holdings, Inc. | ||
| F-104 | ||
Consolidated Balance Sheets as of December 24, 2006, July 10, 2007 and December 30, 2007 | F-105 | |
F-106 | ||
F-107 | ||
F-108 | ||
| F-109 | ||
| JBS Packerland, Inc. (formerly known as Smithfield Beef Group, Inc.) | ||
| F-152 | ||
| F-153 | ||
Consolidated Statement of Operations for the Year ended April 27, 2008 | F-154 | |
Consolidated Statement of Changes in Stockholder’s Equity for the Year ended April 27, 2008 | F-155 | |
Consolidated Statement of Cash Flows for the Year ended April 27, 2008 | F-156 | |
| F-157 | ||
| Five Rivers Ranch Cattle Feeding LLC | ||
| F-172 | ||
| F-173 | ||
| F-174 | ||
F-1
Table of Contents
F-2
Table of Contents
 | 700 North Pearl, Suite 2000 Dallas, Texas 75201 Telephone: 214-969-7007 Fax: 214-953-0722 | |||||
Report of Independent Certified Public Accountants
Board of Directors
JBS USA Holdings, Inc.
1770 Promontory Circle
Greeley, CO 80634
We have reviewed the accompanying condensed consolidated balance sheet of JBS USA Holdings, Inc. and subsidiaries as of September 27, 2009, and the related condensed consolidated statements of operations for the thirteen and thirty-nine weeks ended September 28, 2008 and September 27, 2009 and stockholder’s equity and cash flows for the thirty-nine weeks ended September 28, 2008 and September 27, 2009. These interim financial statements are the responsibility of JBS USA Holdings, Inc. management.
We conducted our reviews in accordance with the standards of the Public Company Accounting Oversight Board (United States). A review of interim financial information consists principally of applying analytical procedures and making inquiries of persons responsible for financial and accounting matters. It is substantially less in scope than an audit conducted in accordance with the standards of the Public Company Accounting Oversight Board, the objective of which is the expression of an opinion regarding the financial statements taken as a whole. Accordingly, we do not express such an opinion.
Based on our reviews, we are not aware of any material modifications that should be made to the accompanying condensed consolidated financial statements in order for them to be in conformity with accounting principles generally accepted in the United States of America.
We have previously audited, in accordance with the standards of the Public Company Accounting Oversight Board, the consolidated balance sheet of JBS USA Holdings, Inc. as of December 28, 2008, and the related consolidated statements of operations, stockholder’s equity, and cash flows for the year then ended (presented elsewhere), and in our report dated July 21, 2009, we expressed an unqualified opinion on those consolidated financial statements. In our opinion, the information set forth in the accompanying condensed consolidated balance sheet as of December 28, 2008 is fairly stated in all material respects in relation to the consolidated balance sheet from which it has been derived.
Dallas, Texas
October 30, 2009
F-3
Table of Contents
An indirect subsidiary of JBS S.A.
Condensed consolidated balance sheets
(dollars in thousands, except per share data)
| December 28, 2008 | (Unaudited) September 27, 2009 | ||||||
| Assets | |||||||
Current assets: | |||||||
Cash and cash equivalents | $ | 254,785 | $ | 105,740 | |||
Accounts receivable, net of allowance for doubtful accounts of $4,142 and $2,746, respectively | 568,185 | 554,555 | |||||
Accounts receivable from related parties (see Note 10) | 20,800 | 52,603 | |||||
Inventories, net | 658,287 | 679,251 | |||||
Deferred income taxes, net | 5,405 | 5,242 | |||||
Other current assets | 76,234 | 158,641 | |||||
Total current assets | 1,583,696 | 1,556,032 | |||||
Property, plant, and equipment, net | 1,229,316 | 1,232,756 | |||||
Goodwill | 147,855 | 229,971 | |||||
Other intangibles, net | 304,967 | 267,107 | |||||
Notes receivable (see Note 10) | 1,630 | 175,318 | |||||
Deferred income taxes, net | 15,500 | 22,922 | |||||
Other assets | 32,607 | 41,776 | |||||
Total assets | $ | 3,315,571 | $ | 3,525,882 | |||
Liabilities and stockholder’s equity | |||||||
Current liabilities: | |||||||
Short-term debt | $ | 67,012 | $ | 29,955 | |||
Current portion of long-term debt | 4,499 | 4,461 | |||||
Current portion of deferred revenue | 38,219 | 18,574 | |||||
Accounts payable | 191,725 | 203,629 | |||||
Accounts payable to related parties (see Note 10) | 972 | 11,272 | |||||
Book overdraft. | 160,532 | 129,108 | |||||
Deferred income taxes, net | 8,587 | 10,923 | |||||
Accrued liabilities. | 283,069 | 384,780 | |||||
Total current liabilities | 754,615 | 792,702 | |||||
Long-term debt, excluding current portion (see Note 7) | 806,808 | 787,952 | |||||
Deferred revenue, excluding current portion | 163,064 | 150,375 | |||||
Deferred income taxes, net. | 150,670 | 142,859 | |||||
Other non-current liabilities | 52,164 | 75,356 | |||||
Total liabilities | 1,927,321 | 1,949,244 | |||||
Commitments and contingencies (see Note 12) | |||||||
Stockholder’s equity: | |||||||
Common stock: par value $.01 per share, 500,000,000 authorized, 100 shares issued and outstanding | — | — | |||||
Additional paid-in capital | 1,400,159 | 1,400,159 | |||||
Retained earnings | 49,512 | 165,477 | |||||
Accumulated other comprehensive income (loss) | (61,421 | ) | 11,002 | ||||
Total stockholder’s equity. | 1,388,250 | 1,576,638 | |||||
Total liabilities and stockholder’s equity | $ | 3,315,571 | $ | 3,525,882 | |||
The accompanying notes are an integral part of these condensed consolidated financial statements.
F-4
Table of Contents
An indirect subsidiary of JBS S.A.
Condensed consolidated statements of operations
(dollars in thousands, except per share data)
| (Unaudited) Thirteen weeks ended | (Unaudited) Thirty-nine weeks ended | |||||||||||||||
| September 28, 2008 | September 27, 2009 | September 28, 2008 | September 27, 2009 | |||||||||||||
Gross sales (see Note 10) | $ | 3,366,719 | $ | 3,394,371 | $ | 9,017,959 | $ | 10,049,867 | ||||||||
Less deductions from sales | (13,077 | ) | (9,951 | ) | (45,704 | ) | (38,713 | ) | ||||||||
Net sales | 3,353,642 | 3,384,420 | 8,972,255 | 10,011,154 | ||||||||||||
Cost of goods sold (see Note 10) | 3,154,625 | 3,257,698 | 8,612,590 | 9,673,675 | ||||||||||||
Gross profit | 199,017 | 126,722 | 359,665 | 337,479 | ||||||||||||
Selling, general, and administrative expenses | 32,469 | 39,200 | 98,296 | 158,440 | ||||||||||||
Foreign currency transaction (gains) losses | 42,758 | (16,283 | ) | 17,572 | (60,867 | ) | ||||||||||
Other income, net (see Note 10) | (3,456 | ) | (1,537 | ) | (9,775 | ) | (3,629 | ) | ||||||||
Gain on sales of property, plant, and equipment | (128 | ) | (14 | ) | (233 | ) | (181 | ) | ||||||||
Interest expense, net (see Note 10) | 8,872 | 28,090 | 23,287 | 69,515 | ||||||||||||
Income before income tax expense | 118,502 | 77,266 | 230,518 | 174,201 | ||||||||||||
Income tax expense | 34,554 | 25,696 | 74,267 | 58,236 | ||||||||||||
Net income | $ | 83,948 | $ | 51,570 | $ | 156,251 | $ | 115,965 | ||||||||
Income per common share: | ||||||||||||||||
Basic | $ | 839,480.00 | $ | 515,700.00 | $ | 1,562,510.00 | $ | 1,159,650.00 | ||||||||
Diluted | $ | 839,480.00 | $ | 515,700.00 | $ | 1,562,510.00 | $ | 1,159,650.00 | ||||||||
Weighted average common shares: | ||||||||||||||||
Basic | 100 | 100 | 100 | 100 | ||||||||||||
Diluted | 100 | 100 | 100 | 100 | ||||||||||||
The accompanying notes are an integral part of these condensed consolidated financial statements.
F-5
Table of Contents
An indirect subsidiary of JBS S.A.
Condensed consolidated statements of cash flows
(dollars in thousands)
| (Unaudited) Thirty-nine weeks ended | ||||||||
September 28, 2008 | September 27, 2009 | |||||||
Cash flows from operating activities: | ||||||||
Net income | $ | 156,251 | $ | 115,965 | ||||
Adjustments to reconcile net income to net cash provided by operating activities: | ||||||||
Depreciation | 52,684 | 84,812 | ||||||
Amortization of intangibles | 11,068 | 30,900 | ||||||
Amortization of debt issuance costs and accretion of discount | 1,064 | 7,846 | ||||||
Gain on sales of property, plant, and equipment | (233 | ) | (181 | ) | ||||
Deferred income taxes | 57,937 | 32,406 | ||||||
Foreign currency transaction (gains) losses | 17,572 | (109,157 | ) | |||||
Change in operating assets and liabilities: | ||||||||
Restricted cash | 31,479 | — | ||||||
Accounts receivable, net | (135,363 | ) | 2,936 | |||||
Inventories | (149,167 | ) | 9,448 | |||||
Other current assets | (35,890 | ) | (72,377 | ) | ||||
Accounts payable and accrued liabilities | 43,281 | 95,176 | ||||||
Non-current assets | (514 | ) | 2,342 | |||||
Non-current liabilities | (489 | ) | (10,509 | ) | ||||
Net cash provided by operating activities | 49,680 | 189,607 | ||||||
Cash flows from investing activities: | ||||||||
Purchases of property, plant, and equipment | (68,404 | ) | (108,150 | ) | ||||
Proceeds from sales of property, plant, and equipment | 415 | 936 | ||||||
Purchases of bonds | — | (6,000 | ) | |||||
Proceeds from sale of non-operating real property | 2,537 | — | ||||||
Purchase of acquired business, net of cash acquired | (107,728 | ) | — | |||||
Issuance of notes receivable and other | — | (173,992 | ) | |||||
Net cash used in investing activities | (173,180 | ) | (287,206 | ) | ||||
Cash flows from financing activities: | ||||||||
Net payments under revolving credit facility | (14,030 | ) | (157,986 | ) | ||||
Payments of short-term debt | (750,000 | ) | (373 | ) | ||||
Proceeds from debt issuance | 500,000 | 651,322 | ||||||
Payments of long-term debt and capital lease obligations | (2,098 | ) | (523,793 | ) | ||||
Cash paid for debt issuance | — | (4,783 | ) | |||||
Change in book overdraft | 8,628 | (31,424 | ) | |||||
Return of cash deposit | — | 11,915 | ||||||
Capital contributions | 450,000 | — | ||||||
Net cash provided by (used in) financing activities | 192,500 | (55,122 | ) | |||||
Effect of exchange rate changes on cash | 231 | 3,676 | ||||||
Net change in cash and cash equivalents | 69,231 | (149,045 | ) | |||||
Cash and cash equivalents, beginning of period | 198,883 | 254,785 | ||||||
Cash and cash equivalents, end of period | $ | 268,114 | $ | 105,740 | ||||
Non-cash investing and financing activities: | ||||||||
Construction in progress under deemed capital lease (see Note 4) | $ | 8,793 | $ | 7,533 | ||||
Reduction in long-term debt (see Note 7) | $ | — | $ | 43,922 | ||||
Supplemental information: | ||||||||
Cash paid for interest | $ | 5,047 | $ | 52,348 | ||||
Cash paid for income taxes | $ | 3,463 | $ | 6,266 | ||||
Debt assumed from Tasman Acquisition | $ | 52,137 | $ | — | ||||
The accompanying notes are an integral part of these condensed consolidated financial statements.
F-6
Table of Contents
An indirect subsidiary of JBS S.A.
Condensed consolidated statements of stockholder’s equity
(dollars in thousands)
Common issued/ outstanding | Common stock | Additional paid-in capital | Retained earnings (accumulated deficit) | Accumulated other comprehensive income (loss) | Total stockholder’s equity | |||||||||||||||
Balance at December 30, 2007 | 100 | $ | — | $ | 950,159 | $ | (111,592 | ) | $ | 251 | $ | 838,818 | ||||||||
Capital contributions | — | — | 450,000 | — | — | 450,000 | ||||||||||||||
Comprehensive income (loss): | ||||||||||||||||||||
Net income | — | — | — | 156,251 | — | 156,251 | ||||||||||||||
Derivative financial instrument adjustment, net of tax of $56 | — | — | — | — | 390 | 390 | ||||||||||||||
Foreign currency translation adjustment | — | — | — | — | (18,563 | ) | (18,563 | ) | ||||||||||||
Total comprehensive income | 138,078 | |||||||||||||||||||
(Unaudited) Balance at September 28, 2008 | 100 | $ | — | $ | 1,400,159 | $ | 44,659 | $ | (17,922 | ) | $ | 1,426,896 | ||||||||
Common outstanding | Common stock | Additional paid-in capital | Retained earnings | Accumulated other comprehensive income (loss) | Total stockholder’s equity | |||||||||||||
Balance at December 28, 2008 | 100 | $ | — | $ | 1,400,159 | $ | 49,512 | $ | (61,421 | ) | $ | 1,388,250 | ||||||
Comprehensive income: | ||||||||||||||||||
Net income | — | — | — | 115,965 | — | 115,965 | ||||||||||||
Derivative financial instrument adjustment, net of tax of $162 | — | — | — | — | 212 | 212 | ||||||||||||
Foreign currency translation adjustment | — | — | — | — | 72,211 | 72,211 | ||||||||||||
Total comprehensive income | 188,388 | |||||||||||||||||
(Unaudited) Balance at September 27, 2009 | 100 | $ | — | $ | 1,400,159 | $ | 165,477 | $ | 11,002 | $ | 1,576,638 | |||||||
The accompanying notes are an integral part of these condensed consolidated financial statements.
F-7
Table of Contents
An indirect subsidiary of JBS S.A.
Notes to condensed consolidated financial statements
Note 1. Description of business
JBS USA Holdings, Inc. (“JBS USA Holdings” or the “Company”), formerly known as JBS USA, Inc. is a Delaware corporation. The operations of the Company and its subsidiaries constitute the operations of JBS USA Holdings as reported under generally accepted accounting principles in the United States of America (“GAAP”). JBS USA Holdings, Inc. is an indirect subsidiary of JBS S.A., a Brazilian company (“JBS S.A.” or “Parent”). The accompanying interim condensed consolidated financial statements have not been audited by an independent registered public accounting firm, but in the opinion of management, reflect all normal and recurring adjustments considered necessary for a fair presentation of the financial position and results of operations. The results of operations for the thirty-nine weeks ended September 27, 2009 are not necessarily indicative of results to be expected for the full year.
The accompanying unaudited condensed consolidated financial statements have been prepared in accordance with generally accepted accounting principles in the United States of America for interim financial information. In addition, the Company’s condensed consolidated financial statements and footnotes contained herein do not include all of the information and footnotes required by GAAP to be considered “complete financial statements”. Therefore, these unaudited condensed consolidated financial statements should be read in conjunction with the audited consolidated financial statements of the Company as of and for the fifty-two weeks ended December 28, 2008.
JBS USA Holdings processes, prepares, packages, and delivers fresh, further processed and value-added beef, pork and lamb products for sale to customers in the United States and in international markets. JBS USA Holdings sells its meat products to customers in the foodservice, international, further processor, and retail channels. The Company also produces and sells by-products that are derived from its meat processing operations, such as hides and variety meats, to customers in various industries.
JBS USA Holdings conducts its domestic beef and pork processing businesses through its wholly owned subsidiaries: Swift Beef Company (“Swift Beef”), Swift Pork Company (“Swift Pork”) and JBS Packerland (“JBS Packerland”), formerly known as Smithfield Beef Group and its Australian beef business through Swift Australia Pty. Ltd. (“Swift Australia”). The Company has two reportable segments comprised of Beef and Pork which, for the thirteen and thirty-nine weeks ended September 28, 2008, represented approximately 80% and 20% of net sales, respectively. For the thirteen and thirty-nine weeks ended September 27, 2009, Beef and Pork represented approximately 84% and 16% of net sales, respectively. The Company operates eight beef processing facilities, three pork processing facilities, one lamb slaughter facility, one value-added facility, and eleven feedlots in the United States and ten processing facilities and five feedlots in Australia. Three of the processing facilities in Australia process lamb, mutton and veal along with beef and a fourth processes only lamb, mutton and veal.
On July 11, 2007, JBS S.A. acquired the Company (the “Acquisition”). Concurrent with the closing of the Acquisition, the entity formerly known as Swift Foods Company was renamed JBS USA, Inc. During the third quarter of the 2008 fiscal year, this entity was renamed JBS USA Holdings, Inc.
F-8
Table of Contents
JBS USA Holdings, Inc.
An indirect subsidiary of JBS S.A.
Notes to condensed consolidated financial statements
The aggregate purchase price for the Acquisition was $1,470.6 million (including approximately $48.5 million of transaction costs). The Company also refinanced its debt, the debt of its subsidiaries, and the outstanding debt assumed in the Acquisition which collectively were paid off using proceeds from $750.0 million of various debt instruments (see Note 7) and additional equity contributions from JBS S.A. As a result of the Acquisition, the condensed consolidated financial statements of JBS USA Holdings provided herein reflect the acquisition being accounted for as a purchase in accordance withStatement of Financial Accounting Standards (“SFAS”) No. 141, Business Combinations and push down accounting was applied to the condensed consolidated financial statements in accordance with the guidance in Staff Accounting Bulletin (“SAB”) No. 5J.
Note 2. Acquisition of Tasman Group
On March 4, 2008, JBS Southern Australia Pty. Ltd. (“JBS Southern”), an indirect subsidiary of JBS USA Holdings entered into an agreement with Tasman Group Services, Pty. Ltd. (“Tasman Group”) to purchase substantially all of the assets of Tasman Group in an all cash transaction (“Tasman Acquisition”) and the purchase was completed on May 2, 2008. The assets acquired include six processing facilities and one feedlot located in Southern Australia. This acquisition provides additional capacity to continue to meet customer demand. The aggregate purchase price for the Tasman Acquisition was $116.9 million (including approximately $7.8 million of transaction costs). JBS Southern also assumed approximately $52.1 million of outstanding debt (see Note 7). The condensed consolidated financial statements of the Company provided herein reflect the Tasman Acquisition being accounted for as a purchase in accordance with SFAS No. 141. The results of JBS Southern are included in the Company’s Condensed Consolidated Statements of Operations from the date of acquisition.
The purchase price allocation is final based on the completion of the independent valuation of the assets and liabilities acquired. The allocation presented below reflects the fair value of the individual assets and liabilities as of May 2, 2008 (in thousands).
| Purchase price paid to previous shareholders | $109,191 | |||
Fees and direct expenses | 7,756 | |||
Total purchase price | $ | 116,947 | ||
Purchase price allocation: | ||||
Current assets and liabilities, net | $ | (22,283 | ) | |
Property, plant, and equipment | 147,881 | |||
Deferred income tax liability | (77 | ) | ||
Other non-current assets and liabilities, net | (8,574 | ) | ||
Total purchase price allocation | $ | 116,947 | ||
F-9
Table of Contents
JBS USA Holdings, Inc.
An indirect subsidiary of JBS S.A.
Notes to condensed consolidated financial statements
Note 3. Acquisition of Smithfield Beef Group & Five Rivers Cattle Feeding
On March 4, 2008, JBS S.A. and Smithfield Foods, Inc (“Smithfield Foods”) entered into a Stock Purchase Agreement (“Smithfield Agreement”). Pursuant to the Smithfield Agreement, JBS S.A. executed through the Company the acquisition of Smithfield Beef Group, Inc. (“Smithfield Beef”) for $569.4 million in cash (including $32.3 million of transaction related costs). The Company then contributed the funds to JBS USA, LLC (“JBS USA”), which finalized the acquisition of Smithfield Beef (“Smithfield Acquisition”). The purchase included 100% of Five Rivers Ranch Cattle Feeding LLC (“Five Rivers”), which was held by Smithfield Beef in a 50/50 joint venture with Continental Grain Company (“CGC,” formerly ContiGroup Companies, Inc.). On October 23, 2008, the acquisition of Smithfield Beef was completed. In conjunction with the closing of this purchase, Smithfield Beef was renamed JBS Packerland and Five Rivers was renamed JBS Five Rivers Cattle Feeding LLC (“JBS Five Rivers”). The assets acquired include four processing plants and eleven feedlots. This acquisition provides additional capacity to continue to meet customer demand.
The purchase excluded substantially all live cattle inventories held by Smithfield Beef and Five Rivers as of the closing date, together with its associated debt. The excluded live cattle were raised by JBS Five Rivers after closing for a negotiated fee.
The condensed consolidated financial statements of the Company provided herein reflect the Smithfield Acquisition being accounted for as a purchase in accordance with SFAS No. 141. The acquired goodwill is treated as non-deductible for tax purposes. The results of JBS Packerland and JBS Five Rivers are included in the Company’s Condensed Consolidated Statements of Operations from the date of acquisition.
The purchase price allocation is preliminary pending completion of independent valuations of identified tangible and intangible assets acquired and certain liabilities assumed, including, but not limited to deferred income taxes. As such, the allocation of purchase price presented below is preliminary and subject to change. The allocation presented below reflects the estimated fair value of the individual assets and liabilities as of October 23, 2008 (in thousands).
| Purchase price paid to previous shareholders | $ 537,068 | |||
Fees and direct expenses | 32,322 | |||
Total purchase price | $ | 569,390 | ||
Purchase price allocation: | ||||
Current assets and liabilities, net | $ | 47,097 | ||
Property, plant, and equipment | 314,306 | |||
Deferred income tax liability | (102,781 | ) | ||
Goodwill | 174,553 | |||
Intangible assets (see Note 4) | 131,044 | |||
Other non-current assets and liabilities, net | 5,171 | |||
Total purchase price allocation | $ | 569,390 | ||
F-10
Table of Contents
JBS USA Holdings, Inc.
An indirect subsidiary of JBS S.A.
Notes to condensed consolidated financial statements
Had the Smithfield Acquisition occurred at the beginning of fiscal 2008, the consolidated unaudited pro forma net sales, net income and net income per share would have been $4.4 billion, $109.6 million, and $1,096,080, respectively, for the thirteen weeks ended September 28, 2008. For the thirty-nine weeks ended September 28, 2008, the consolidated unaudited pro forma net sales, net income and net income per share would have been $11.8 billion, $220.4 million, and $2,204,080, respectively.
Note 4. Basis of presentation and accounting policies
Consolidation
The condensed consolidated financial statements include the accounts of the Company and its direct and indirect wholly-owned subsidiaries. All intercompany transactions have been eliminated.
Use of estimates
The condensed consolidated financial statements have been prepared in conformity with GAAP using management’s best estimates and judgments. These estimates and judgments affect the reported amounts of assets and liabilities and disclosure of the contingent assets and liabilities at the date of the financial statements. The estimates and judgments will also affect the reported amounts for certain revenues and expenses during the reporting period. Actual results could differ materially from these estimates and judgments. Significant estimates made by the Company include the allowance for doubtful accounts, reserves related to inventory obsolescence or valuation, insurance accruals, and income tax accruals.
Fiscal year
The Company’s fiscal year consists of 52 or 53 weeks, ending on the last Sunday in December. The condensed consolidated financial statements have been prepared for the thirteen and thirty-nine weeks ended September 28, 2008 and September 27, 2009.
Cash and cash equivalents
The Company considers all highly liquid investments with an original maturity of three months or less to be cash equivalents. The carrying value of these assets approximates their fair market value. Financial instruments which potentially subject JBS USA Holdings to concentration of credit risk consist principally of cash and temporary cash investments. At times, cash balances held at financial institutions were in excess of Federal Deposit Insurance Corporation insurance limits. JBS USA Holdings places its temporary cash investments with high quality financial institutions. The Company believes no significant credit risk exists with respect to these cash investments.
F-11
Table of Contents
JBS USA Holdings, Inc.
An indirect subsidiary of JBS S.A.
Notes to condensed consolidated financial statements
Accounts receivable and allowance for doubtful accounts
The Company has a diversified customer base which includes some customers who are located in foreign countries. The Company controls credit risk related to accounts receivable through credit worthiness reviews, credit limits, letters of credit, and monitoring procedures.
The Company evaluates the collectability of its accounts receivable based on a general analysis of past due receivables, and a specific analysis of certain customers which management believes will be unable to meet their financial obligations due to economic conditions, industry-specific conditions, historic or anticipated performance, and other relevant circumstances. The Company continuously performs credit evaluations and reviews of its customer base. The Company will provide an allowance for an account when collectability is not reasonably assured.
The Company adheres to customary industry terms of net seven days. The Company considers all domestic accounts over 14 days as past due and all international accounts over 30 days as past due. Activity in the allowance for doubtful accounts for the thirty-nine weeks is as follows (in thousands):
| September 28, 2008 | September 27, 2009 | |||||||
Balance, beginning of period | $ | 1,389 | $ | 4,142 | ||||
Fair value of allowance on acquired business | 113 | — | ||||||
Change to bad debt provision | 691 | (370 | ) | |||||
Change to purchase accounting allowance for doubtful accounts | — | (729 | ) | |||||
Write offs, net of recoveries | 1 | (335 | ) | |||||
Effect of exchange rates | (25 | ) | 38 | |||||
Balance, end of period | $ | 2,169 | $ | 2,746 | ||||
The $0.7 million of change to purchase accounting allowance for doubtful accounts represents the resolution of a receivable which had been fully reserved on the opening balance sheet of the Smithfield Acquisition at October 23, 2008.
F-12
Table of Contents
JBS USA Holdings, Inc.
An indirect subsidiary of JBS S.A.
Notes to condensed consolidated financial statements
Inventories
Inventories consist primarily of product, livestock, and supplies. Product inventories are considered commodities and are primarily valued based on quoted commodity prices, which approximate net realizable value less cost to complete. Due to a lack of equivalent commodity market data, Australian product inventories are valued based on the lower of cost or net realizable value less cost to sell. Livestock inventories are valued on the basis of the lower of first-in, first-out cost or market. Costs capitalized into livestock inventory include the cost of feeder livestock, direct materials, supplies, and feed. Cattle and hogs are reclassified from livestock to work in progress at time of slaughter. Supply inventories are carried at historical cost. The components of inventories are as follows (in thousands):
| December 28, 2008 | September 27, 2009 | |||||
Livestock | $ | 106,288 | $ | 109,292 | ||
Product inventories: | ||||||
Raw material | 16,599 | 10,557 | ||||
Work in progress | 53,115 | 56,344 | ||||
Finished goods | 395,686 | 414,095 | ||||
Supplies | 86,599 | 88,963 | ||||
| $ | 658,287 | $ | 679,251 | |||
Other current assets
Other current assets include prepaid expenses which are amortized over the period the Company expects to receive the benefit.
Property, plant and equipment
Property, plant and equipment was recorded at fair value at the respective dates of the Acquisition, the Tasman Acquisition and the Smithfield Acquisition. Subsequent additions are recorded at cost. Depreciation and amortization is recorded using the straight-line method over the estimated useful lives of the assets as follows:
| Furniture, fixtures, office equipment and other | 5 to 7 years | |
Machinery and equipment | 5 to 15 years | |
Buildings and improvements | 15 to 40 years | |
Leasehold improvements | shorter of useful life or the lease term | |
The costs of developing internal-use software are capitalized and amortized when placed in service over the expected useful life of the software. Major renewals and improvements that extend the useful life of the asset are capitalized while maintenance and repairs are expensed as incurred. The Company accounts for planned major maintenance activities as they are incurred in accordance with ASC 360-10-25-5 in the Assets—Property, Plant, and Equipment topic(Prior
F-13
Table of Contents
JBS USA Holdings, Inc.
An indirect subsidiary of JBS S.A.
Notes to condensed consolidated financial statements
authoritative literature: AUG Air-1: Accounting for Planned Major Maintenance Activities). Upon the sale or retirement of assets, the cost and related accumulated depreciation or amortization are eliminated from the respective accounts and any resulting gains or losses are reflected in earnings. Interest charges incurred during the construction of assets are capitalized as one of the elements of cost and are amortized over the assets’ estimated useful lives. Interest charges capitalized were $0.2 million and $0.6 million for the thirteen and thirty-nine weeks ended September 28, 2008, respectively. Interest charges capitalized were $0.2 million and $0.9 million during the thirteen and thirty-nine weeks ended September 27, 2009, respectively. Assets held under capital lease are classified in property, plant, and equipment and amortized over the lease term. Capital lease amortization is included in depreciation expense. As of September 27, 2009, the Company had $16.9 million in commitments outstanding for capital projects, including $8.5 million related to the Installment Bond Purchase Agreement, as discussed in Other Assets.
In accordance with ASC 360 in the Assets—Property, Plant, and Equipment topic(Prior authoritative literature: SFAS No. 144, Accounting for the Impairment or Disposal of Long-Lived Assets), the Company assesses the recoverability of long-lived assets whenever events or changes in circumstances indicate the carrying amount of an asset may not be recoverable. When future undiscounted cash flows of assets are estimated to be insufficient to recover their related carrying value, the Company compares the asset’s estimated future cash flows, discounted to present value using a risk-adjusted discount rate, to its current carrying value and records a provision for impairment as appropriate.
Property, plant, and equipment, net are comprised of the following (in thousands):
| December 28, 2008 | September 27, 2009 | |||||||
Land | $ | 143,253 | $ | 180,400 | ||||
Buildings, machinery, and equipment | 1,022,324 | 1,062,613 | ||||||
Property and equipment under capital lease | 17,339 | 17,205 | ||||||
Furniture, fixtures, office equipment, and other | 38,867 | 43,086 | ||||||
Construction in progress | 88,732 | 100,075 | ||||||
| 1,310,515 | 1,403,379 | |||||||
Less accumulated depreciation and amortization | (81,199 | ) | (170,623 | ) | ||||
| $ | 1,229,316 | $ | 1,232,756 | |||||
Accumulated depreciation includes accumulated amortization on capitalized leases of approximately $3.1 million and $4.7 million as of December 28, 2008 and September 27, 2009, respectively. Depreciation and capital lease amortization expense in cost of goods sold in the Condensed Consolidated Statements of Operations were $15.6 million and $43.4 million for the thirteen and thirty-nine weeks ended September 28, 2008, respectively. Depreciation and capital lease amortization expense in cost of goods sold in the Condensed Consolidated Statements of Operations were $26.9 million and $79.0 million for the thirteen and thirty-nine weeks ended September 27, 2009, respectively. Depreciation and capital lease amortization expense in selling, general, and administrative expenses in the Condensed Consolidated Statements of Operations
F-14
Table of Contents
JBS USA Holdings, Inc.
An indirect subsidiary of JBS S.A.
Notes to condensed consolidated financial statements
were $2.1 million and $9.3 million for the thirteen and thirty-nine weeks ended September 28, 2008, respectively. Depreciation and capital lease amortization expense in selling, general, and administrative expenses in the Condensed Consolidated Statements of Operations were $1.4 million and $5.8 million for the thirteen and thirty-nine weeks ended September 27, 2009, respectively.
JBS USA Holdings monitors certain asset retirement obligations in connection with its operations. These obligations relate to clean-up, removal or replacement activities and related costs for “in-place” exposures only when those exposures are moved or modified, such as during renovations of its facilities. These in-place exposures include asbestos, refrigerants, wastewater, oil, lubricants and other contaminants common in manufacturing environments. Under existing regulations, JBS USA Holdings is not required to remove these exposures and there are no plans to undertake a renovation that would require removal of the asbestos, nor the remediation of the other in-place exposures at this time. The facilities are expected to be maintained and repaired by activities that will not result in the removal or disruption of these in-place exposures. As a result, there is an indeterminate settlement date for these asset retirement obligations because the range of time over which JBS USA Holdings may incur these liabilities is unknown and cannot be reasonably estimated. Therefore, JBS USA Holdings cannot reasonably estimate and has not recorded the fair value of the potential liability.
Other assets
Prior to the Acquisition, Swift Beef entered into an Installment Bond Purchase Agreement (the “Purchase Agreement”) with the City of Cactus, Texas (the “City”) effective as of May 15, 2007. Under the Purchase Agreement, Swift Beef agreed to purchase up to $26.5 million of the City of Cactus, Texas Sewer System Revenue Improvement and Refunding Bonds, Taxable Series 2007 to be issued by the City (the “Bonds”). The Bonds are being issued by the City to finance improvements to its sewer system (the “System”) which is utilized by Swift Beef’s processing plant located in Cactus, Texas (the “Plant”) as well as other industrial users and the citizens of the community of Cactus. Swift Beef will purchase the Bonds in installments upon receipt of Bond installment requests from the City as the System improvements are completed through an anticipated completion date of June 2010. The interest rate on the Bonds is six-month LIBOR plus 350 basis points, or 4.76% at September 27, 2009. The Bonds mature on June 1, 2032 and are subject to annual mandatory sinking fund redemption beginning on June 1, 2011. The principal and interest on the Bonds will be paid by the City from the net revenues of the System. At September 27, 2009, Swift Beef held $18.0 million of the Bonds, which fall within Level 3 of the fair value hierarchy in accordance with ASC 820 in the Broad Transactions—Fair Value Measurements and Disclosures topic(Prior authoritative literature: SFAS No. 157,Fair Value Measurements).
On May 21, 2007, in connection with the purchase of the Bonds, Swift Beef entered into a Water & Wastewater Services Agreement (the “Wastewater Agreement”) with the City under which the City will provide water and wastewater services for the Plant at the rates set forth in the Wastewater Agreement. Swift Beef’s payments for the City’s treatment of wastewater from the Plant will include a capacity charge in the amount required to be paid by the City to pay the principal and interest on the Bonds.
F-15
Table of Contents
JBS USA Holdings, Inc.
An indirect subsidiary of JBS S.A.
Notes to condensed consolidated financial statements
The Company has evaluated the impact of ASC 840-10-15 in the Broad Transactions—Leases topic(Prior authoritative literature: FASB Emerging Issues Task Force (“EITF”) No. 01-08,Determining Whether an Arrangement Contains a Lease), as well as ASC 840-40-05-5 in the Broad Transactions—Leases topic(Prior authoritative literature: EITF No. 97-10, The Effect of Lessee Involvement in AssetConstruction), and has determined that it will be required to reflect the wastewater treatment facility as a capital asset (similar to a capital leased asset) as it will be the primary user of the wastewater facility based on projections of throughput volume. As the City spends funds to construct the facility, the Company will record construction in progress and the related construction financing. At December 28, 2008, $9.8 million and $8.8 million had been recognized as construction in progress and construction financing by the Company, respectively. At September 27, 2009, $17.9 million and $16.3 million had been recognized as construction in progress and construction financing by the Company, respectively.
Debt issuance costs
In conjunction with the Acquisition, the Company capitalized $1.8 million of fees that are included in other assets. JBS USA Holdings expensed $0.3 million of these costs during the thirty-nine weeks ended September 28, 2008. These costs were amortized as interest expense using the straight line method over the life of the agreement. The amount under the related loan agreement was repaid in full during fiscal year ended December 28, 2008 (see Note 7).
On November 5, 2008, JBS USA entered into a $400.0 million secured revolving credit facility (see Note 7). JBS USA capitalized $14.3 million in debt issuance costs which are included in other assets. The debt issuance costs associated with this facility are being amortized using the straight-line method over the life of the agreement and are reflected in interest expense. During the thirteen and thirty-nine weeks ended September 27, 2009, JBS USA amortized $1.2 million and $3.4 million, respectively.
On April 27, 2009, JBS USA issued $700.0 million of senior unsecured notes due 2014 (see Note 7). JBS USA capitalized $4.0 million in debt issuance costs which are included in other assets. The debt issuance costs associated with these notes are being amortized using the straight-line method over the life of the agreement and are reflected in interest expense. During the thirteen and thirty-nine weeks ended September 27, 2009, JBS USA amortized $0.2 million and $0.3 million, respectively.
Goodwill and other intangibles
Goodwill and other intangible assets with indefinite lives are not amortized but are tested for impairment at least on an annual basis or more frequently if impairment indicators arise, as required by ASC 350-20-35 in the Assets—Intangibles—Goodwill and Other topic(Prior authoritative literature: SFAS No. 142, Goodwill and Other Intangible Assets). Identifiable intangible assets with definite lives are amortized over their estimated useful lives.
Goodwill represents the excess of the aggregate purchase price over the fair value of the net identifiable assets acquired in a purchase business combination. The goodwill impairment test is
F-16
Table of Contents
JBS USA Holdings, Inc.
An indirect subsidiary of JBS S.A.
Notes to condensed consolidated financial statements
a two-step test. Under the first step, the fair value of the reporting unit is compared with its carrying value (including goodwill). If the fair value of the reporting unit is less than its carrying value, an indication of goodwill impairment exists for the reporting unit and the enterprise must perform step two of the impairment test. Under step two, an impairment loss is recognized for any excess of the carrying amount of the reporting unit’s goodwill over the implied fair value of that goodwill. The implied fair value of goodwill is determined by allocating the fair value of the reporting unit in a manner similar to a purchase price allocation, in accordance with ASC 805 in the Broad Transactions—Business Combinations topic(Prior authoritative literature: SFAS No. 141 and SFAS No. 141(R)) as discussed in Adoption of New Accounting Pronouncements. The residual fair value after this allocation is the implied fair value of the reporting unit goodwill. The Company estimates the fair value of its reporting units using a discounted cash flow analysis.
The following is a rollforward of goodwill by segment for the thirty-nine weeks ended September 27, 2009 (in thousands):
| December 28, 2008 | Adjustments | Translation gain | September 27, 2009 | |||||||||
Beef | $ | 133,825 | $ | 79,649 | $ | 2,467 | $ | 215,941 | ||||
Pork | 14,030 | — | — | 14,030 | ||||||||
Total | $ | 147,855 | $ | 79,649 | $ | 2,467 | $ | 229,971 | ||||
The adjustments to goodwill are a result of the change in purchase price allocation for the Smithfield Acquisition.
Other intangibles consist of the following (in thousands):
| December 28, 2008 | ||||||||||||||
| Initial gross carrying amount | Adjustments | Accumulated amortization | Net carrying amount | |||||||||||
Amortizing: | ||||||||||||||
Customer relationships | $ | 129,000 | $ | 69,000 | $ | (18,104 | ) | $ | 179,896 | |||||
Customer contracts | 15,400 | 6,078 | (2,004 | ) | 19,474 | |||||||||
Patents | 5,200 | (2,300 | ) | (282 | ) | 2,618 | ||||||||
Rental contract | 3,507 | — | (573 | ) | 2,934 | |||||||||
Deferred revenue | 1,483 | — | (459 | ) | 1,024 | |||||||||
Mineral rights | 742 | — | (65 | ) | 677 | |||||||||
Subtotal amortizing intangibles | 155,332 | 72,778 | (21,487 | ) | 206,623 | |||||||||
Non-amortizing: | ||||||||||||||
Trademark | 33,300 | 50,800 | — | 84,100 | ||||||||||
Water rights | 2,100 | 12,144 | — | 14,244 | ||||||||||
Subtotal non-amortizing intangibles | 35,400 | 62,944 | — | 98,344 | ||||||||||
Total other intangibles | $ | 190,732 | $ | 135,722 | $ | (21,487 | ) | $ | 304,967 | |||||
F-17
Table of Contents
JBS USA Holdings, Inc.
An indirect subsidiary of JBS S.A.
Notes to condensed consolidated financial statements
The adjustments to other intangibles result primarily from the establishment of intangibles related to the Smithfield Acquisition (see Note 3), and the impairment of $2.3 million of a patent that has no future use.
| September 27, 2009 | ||||||||||||||
| Initial gross carrying amount | Adjustments | Accumulated amortization | Net carrying amount | |||||||||||
Amortizing: | ||||||||||||||
Customer relationships | $ | 198,000 | $ | 30,500 | $ | (34,889 | ) | $ | 193,611 | |||||
Customer contracts | 21,478 | (21,478 | ) | — | — | |||||||||
Patents | 2,900 | — | (425 | ) | 2,475 | |||||||||
Rental contract | 3,507 | — | (865 | ) | 2,642 | |||||||||
Deferred revenue | 1,483 | — | (693 | ) | 790 | |||||||||
Mineral rights | 742 | — | (97 | ) | 645 | |||||||||
Subtotal amortizing intangibles | 228,110 | 9,022 | (36,969 | ) | 200,163 | |||||||||
Non-amortizing: | ||||||||||||||
Trademark | 84,100 | (31,400 | ) | — | 52,700 | |||||||||
Water rights | 14,244 | — | — | 14,244 | ||||||||||
Subtotal non-amortizing intangibles | 98,344 | (31,400 | ) | — | 66,944 | |||||||||
Total other intangibles | $ | 326,454 | $ | (22,378 | ) | $ | (36,969 | ) | $ | 267,107 | ||||
The adjustments to other intangibles for the thirty-nine weeks ended September 27, 2009 result from a revised valuation report related to the Smithfield Acquisition (see Note 3), as well as the impairment of a customer contract that has no future value.
The customer relationships resulting from the Acquisition are amortized on an accelerated basis over 12 years. The customer relationships resulting from the Smithfield Acquisition are amortized on an accelerated basis over 18 years. The lives represent management’s estimates of the period of expected economic benefit and annual customer profitability. Patents consist of exclusive marketing rights and are being amortized over the life of the related agreements on a straight line basis, which range from 6 to 20 years. Amortization expense was $5.0 million and $11.1 million for the thirteen and thirty-nine weeks ended September 28, 2008, respectively. Amortization expense was $5.6 million and $30.9 million for the thirteen and thirty-nine weeks ended September 27, 2009, respectively.
Based on amortizing intangible assets recognized in JBS USA Holdings Condensed Consolidated Balance Sheet as of September 27, 2009, the amortization expense for each of the next five years is estimated as follows (in thousands):
| For the fiscal years ending December: | |||
2009 (remaining) | $ | 5,603 | |
2010 | 22,907 | ||
2011 | 21,956 | ||
2012 | 20,410 | ||
2013 | 18,191 | ||
F-18
Table of Contents
JBS USA Holdings, Inc.
An indirect subsidiary of JBS S.A.
Notes to condensed consolidated financial statements
Book overdraft
The majority of JBS USA Holdings bank accounts are zero balance accounts where cash needs are funded as checks are presented for payment by the holder. Checks issued pending clearance that result in overdraft balances for accounting purposes are classified as current liabilities, and the change in the related balance is reflected in financing activities on the Condensed Consolidated Statements of Cash Flows.
Insurance
JBS USA Holdings is self-insured for employee medical and dental benefits and purchases insurance policies with deductibles for certain losses relating to worker’s compensation, casualty, and property. The Company has purchased stop-loss coverage in order to limit its exposure to any significant levels of certain claims. Self-insured losses are accrued based upon periodic assessments of estimated settlements for known and anticipated claims, any resulting adjustments to previously recorded reserves are reflected in current period earnings. JBS USA Holdings has recorded a prepaid asset with an offsetting liability to reflect the amounts estimated as due for insured claims incurred and accrued, but not yet paid to the claimant by the third party insurance company in accordance with ASC 860 in the Broad Transactions—Transfers and Servicing topic(Prior authoritative literature: SFAS No. 140, Accounting for Transfers and Servicing of Financial Assets and Extinguishments of Liabilities).
Environmental expenditures and remediation liabilities
Environmental expenditures that relate to current or future operations and which improve operational capabilities are capitalized at time of incurrence. Expenditures that relate to an existing or prior condition caused by past operations, and which do not contribute to current or future revenue generation, are expensed. Liabilities are recorded when environmental assessments and/or remediation efforts are probable and the costs can be reasonably estimated.
Foreign currency
For each operation, the local currency of the location’s jurisdiction is the functional currency. Translation into US dollars is performed for assets and liabilities at the exchange rates as of the balance sheet date. Income and expense accounts are translated at average exchange rates for the period. Adjustments resulting from the translation are reflected as a separate component of accumulated other comprehensive income (loss). The balance of foreign currency translation adjustment in accumulated other comprehensive income (loss) at December 28, 2008 and September 27, 2009 was $(61.1) million and $11.2 million, respectively. Transaction gains and losses on US dollar denominated revolving intercompany borrowings between the Australian subsidiaries and the US parent are recorded in earnings.
Income taxes
JBS USA Holdings calculates its interim income tax provision in accordance with ASC 270 in the Presentation—Interim Reporting topic (Prior authoritative literature: Accounting Principles Board
F-19
Table of Contents
JBS USA Holdings, Inc.
An indirect subsidiary of JBS S.A.
Notes to condensed consolidated financial statements
Opinion No. 28, Interim Financial Reporting), and ASC 740-270 in the Expenses—Income Taxes topic (Prior authoritative literature: Accounting for Income Taxes in Interim Periods (“FIN 18”)). The income tax expense recognized primarily relates to foreign taxes, US federal taxes and other state and local tax expenses in the US. In accordance with ASC 740-10-30-7 in the Expenses—Income Taxes topic (Prior authoritative literature: Financial Accounting Standards Board (“FASB”) Interpretation No. 48,Accounting for Uncertainty in Income Taxes (“FIN 48”)), the Company recognizes the effect of income tax positions only if those positions are more likely than not of being sustained. Recognized income tax positions are measured at the largest amount that is greater than 50% likely of being realized. Changes in recognition or measurement are reflected in the period in which the change in judgment occurs. JBS USA Holdings recognizes both interest and penalties related to uncertain tax positions as part of the income tax provision.
Fair value of financial instruments
The carrying amounts of JBS USA Holdings’ financial instruments: cash and cash equivalents, short-term trade receivables, and payables, approximate their fair values due to the short-term nature of the instruments. Existing long-term debt was recorded at fair value as of the date of the Acquisition and the Company believes this approximates its fair value at September 27, 2009. Long-term debt incurred since the Acquisition, except for the senior unsecured notes due 2014, was recorded at fair value at the date of incurrence which is considered to be fair value at September 27, 2009 due to the proximity of the balance sheet date to the issuance of the debt and its variable interest rate (see Note 7). The senior unsecured notes due 2014 had a book value of $655.4 million, net of unaccreted discount, and a fair value, based on market quotes, of $750.8 million at September 27, 2009.
Revenue recognition
The Company’s revenue recognition policies are based on the guidance in Staff Accounting Bulletin (“SAB”) No. 104,Revenue Recognition in Financial Statements. Revenue on product sales is recognized when title and risk of loss are transferred to customers (upon delivery based on the terms of sale), when the price is fixed or determinable, and when collectability is reasonably assured, and persuasive evidence of an arrangement exists. The Company recognizes sales net of applicable provisions for discounts, returns and allowances, which are accrued as product is invoiced to customers who participate in such programs based on contract terms and historical and current purchasing patterns.
Advertising costs
Advertising costs are expensed as incurred. Advertising costs were $1.3 million and $4.0 million for the thirteen and thirty-nine weeks ended September 28, 2008, respectively. Advertising costs were $1.0 million and $3.7 million for the thirteen and thirty-nine weeks ended September 27, 2009, respectively.
F-20
Table of Contents
JBS USA Holdings, Inc.
An indirect subsidiary of JBS S.A.
Notes to condensed consolidated financial statements
Research and development
The Company incurs costs related to developing new beef and pork products. These costs include developing improved packaging, manufacturing, flavor enhancing, and improving consumer friendliness of meat products. The costs of these research and development activities are less than 1% of total consolidated net sales for the thirteen and thirty-nine weeks ended September 28, 2008 and September 27, 2009 and are expensed as incurred.
Shipping costs
The Company passes through shipping costs related to finished goods which are reimbursed by customers and reported in net sales while an offsetting expense is included in cost of goods sold.
Comprehensive income
Comprehensive income consists of net income, foreign currency translation (net of tax), and adjustments from derivative financial instruments (net of tax).
Net income per share
The Company presents dual computations of net income (loss) per common share. The basic computation is based on weighted average common shares outstanding during the period. The diluted computation reflects the same calculation as the basic computation as the Company does not have potentially dilutive common stock equivalents.
Derivatives and hedging activities
JBS USA Holdings accounts for its derivatives and hedging activities in accordance with ASC 815 in the Broad Transactions—Derivative and Hedging topic (Prior authoritative literature: SFAS No. 133,Accounting for Derivative Financial Instruments and Hedging Activities). The Company uses derivatives (e.g., futures and options) for the purpose of mitigating its exposure to changes in commodity prices and foreign currency exchange rates and to assist JBS S.A. in its risk management activities, as discussed in Note 10. The fair value of each derivative is recognized in the Condensed Consolidated Balance Sheets within current assets or current liabilities. Changes in the fair value of derivatives are recognized immediately in the Condensed Consolidated Statements of Operations for derivatives that do not qualify for hedge accounting. For derivatives designated as a hedge and used to hedge an existing asset or liability, both the derivative and hedged item are recognized at fair value within the Condensed Consolidated Balance Sheets with the changes in both of these fair values being recognized immediately in the Condensed Consolidated Statements of Operations. For derivatives designated as a hedge and used to hedge an anticipated transaction, changes in the fair value of the derivatives are deferred in the Condensed Consolidated Balance Sheets within accumulated other comprehensive income (loss) to the extent the hedge is effective in mitigating the exposure to the related anticipated transaction. Any ineffectiveness is recognized immediately in the Condensed Consolidated Statements of Operations. Amounts deferred within accumulated other comprehensive income (loss) are recognized in the Condensed Consolidated Statements of Operations upon the completion of the related underlying transaction.
F-21
Table of Contents
JBS USA Holdings, Inc.
An indirect subsidiary of JBS S.A.
Notes to condensed consolidated financial statements
Gains and losses from energy and livestock derivatives related to purchases are recognized in the Condensed Consolidated Statements of Operations as a component of cost of goods sold upon change in fair value. While management believes these instruments help mitigate various market risks, they are not designated and accounted for as hedges under ASC 815 as a result of the extensive recordkeeping requirements of this statement. Gains and losses from foreign currency derivatives and livestock derivatives related to future sales and related to JBS S.A.’s risk management activities are recognized in the Condensed Consolidated Statements of Operations as a component of net sales or as a component of accumulated other comprehensive income (loss) upon change in fair value.
Adoption of new accounting pronouncements
In May 2009, the FASB issued ASC 855 in the Broad Transactions—Subsequent Events topic (Prior authoritative literature: FAS 165, Subsequent Events), which enhances guidance in regards to disclosing subsequent events and their impact on the financial statements. The Company adopted ASC 855 on June 15, 2009. The adoption did not have a material impact on the Company’s financial position, results of operations, or cash flow.
In April 2009, the FASB issued ASC 820-10-65-4 in the Broad Transactions—Fair Value Measurements and Disclosure topic (Prior authoritative literature: FASB Staff Position “FSP”) No. 157-4), which relates to determining fair values when there is no active market or where the price inputs being used represents distressed sales. The ASC 820-10-65-4 provides additional guidance for estimating fair value when the volume and level of activity for the asset or liability have significantly decreased. The Company adopted ASC 820-10-65-4 on June 15, 2009. The adoption did not have a material impact on the Company’s financial position, results of operations, or cash flows.
In April 2009, the FASB issued the ASC 825-10-65 in the Broad Transactions—Financial Instruments topic (Prior authoritative literature: FSP No. 107-1), which requires disclosures regarding fair value of financial instruments for interim reporting periods of publically traded companies as well as in annual financial statements. The Company adopted ASC 825-10-65 at the beginning of the current fiscal year. The adoption did not have a material impact on the Company’s financial position, results of operations, or cash flows.
In March 2008, the FASB issued ASC 815-10-65-1 in the Broad Transactions—Derivatives and Hedging topic (Prior authoritative literature: SFAS No. 161,Disclosures about Derivative Instruments and Hedging Activities—an amendment of FASB Statement No. 133), which provides for enhanced disclosures about the use of derivatives and their impact on a Company’s financial position and results of operations. JBS USA Holdings adopted ASC 815-10-65-1 at the beginning of the current fiscal year. The adoption did not have a material impact on the Company’s financial position, results of operations, or cash flows (see Note 6).
In February 2008, the FASB issued ASC 820-10-15-1A in the Broad Transactions—Fair Value Measurements and Disclosure topic (Prior authoritative literature: FSP No. 157-2), which defers the effective date of ASC 820, for nonfinancial assets and nonfinancial liabilities, except for items that are recognized or disclosed at fair value in an entity’s financial statements on a recurring
F-22
Table of Contents
JBS USA Holdings, Inc.
An indirect subsidiary of JBS S.A.
Notes to condensed consolidated financial statements
basis, at least annually. The Company adopted ASC 820-10-15-1A as of December 29, 2008. The adoption did not have a material impact on the Company’s financial position, results of operations, or cash flows.
In December 2007, the FASB issued ASC 805 in the Broad Transactions—Business Combinations topic (Prior authoritative literature: SFAS No. 141(R), Business Combinations). ASC 805 is intended to provide greater consistency in the accounting and reporting of business combinations. ASC 805 requires the acquiring entity in a business combination to recognize all assets acquired and liabilities assumed in the transaction and any non-controlling interest in the acquiree at the acquisition date, measured at fair value at that date. This includes the measurement of the acquirer’s shares issued as consideration in a business combination, the recognition of contingent consideration, the accounting for pre-acquisition gains and loss contingencies, the recognition of capitalized in–process research and development, the accounting for acquisition related restructuring cost accruals, the treatment of acquisition related transaction costs and the recognition of changes in the acquirer’s income tax valuation allowance and deferred income taxes. One significant change in this statement is the requirement to expense direct costs of the transaction, which under existing standards are included in the purchase price of the acquired company. This statement also established disclosure requirements to enable the evaluation of the nature and financial effect of the business combination. Also effective, as a requirement of the statement, after December 31, 2008 any adjustments to uncertain tax positions from business combinations consummated prior to December 31, 2008 will no longer be recorded as an adjustment to goodwill, but will be reported in income. ASC 805 is effective for business combinations for which the acquisition date is on or after the beginning of the first annual reporting period beginning on or after December 15, 2008; therefore, we will adopt ASC 805 for business combinations entered into beginning in fiscal year 2009.
In June 2009, the FASB issued SFAS No. 168,The FASB Accounting Standards Codification and the Hierarchy of Generally Accepted Accounting Principles(“SFAS No. 168”). SFAS No. 168 establishes the Codification as the source of authoritative GAAP recognized by the FASB to be applied by non-governmental entities and is effective for financial statements issued for periods ending after September 15, 2009. The Company adopted SFAS No. 168 as of September 15, 2009. The adoption did not have a material impact on the Company’s financial position, results of operations, or cash flows.
Recently issued accounting pronouncements
In June 2009, the FASB issued SFAS No. 167,Amendments to FASB Interpretation No. 46(R)(“SFAS No. 167”). SFAS No. 167 provides for enhanced financial reporting by enterprises involved with variable interest entities and is effective for fiscal years beginning after November 15, 2009. The Company does not believe the adoption of SFAS No. 167 will have a material impact on our financial position, results of operations, and cash flows.
F-23
Table of Contents
JBS USA Holdings, Inc.
An indirect subsidiary of JBS S.A.
Notes to condensed consolidated financial statements
Note 5. Accrued liabilities
Accrued liabilities consist of the following (in thousands):
| December 28, 2008 | September 27, 2009 | |||||
Salaries | $ | 74,528 | $ | 87,604 | ||
Self insurance reserves | 24,265 | 32,098 | ||||
Taxes | 15,825 | 37,599 | ||||
Freight | 38,645 | 40,041 | ||||
Interest | 19,672 | 39,541 | ||||
Other | 110,134 | 147,897 | ||||
Total | $ | 283,069 | $ | 384,780 | ||
Other accrued liabilities consist of items that are individually less than 5% of total current liabilities.
Note 6. Derivative financial instruments
The Company adopted ASC 820 in the Broad Transactions—Fair Value Measurements and Disclosure topic (Prior authoritative literature: SFAS No. 157, Fair Value Measurement), which defines fair value, establishes a framework for measuring fair value and requires additional disclosures about fair value measurements. The framework that is set forth in this standard is applicable to the fair value measurement where it is permitted or required under other accounting pronouncements.
ASC 820 defines fair value as the exit price, which is the price that would be received to sell an asset or paid to transfer a liability in a transaction between market participants at the measurement date. ASC 820 establishes a three-tier fair value hierarchy that prioritizes inputs to valuation techniques used for fair value measurement.
| • | Level 1 consists of observable market data in an active market for identical assets or liabilities. |
| • | Level 2 consists of observable market data, other than that included in Level 1, that is either directly or indirectly observable. |
| • | Level 3 consists of unobservable market data. The input may reflect the assumptions of the Company, not a market participant, if there is little available market data and the Company’s own assumptions are considered by management to be the best available information. |
In the case of multiple inputs being used in fair value measurement, the lowest level input that is significant to the fair value measurement represents the level in the fair value hierarchy in which the fair value measurement is reported.
The adoption of ASC 820 has not resulted in any significant changes to the methodologies used for fair value measurement. The Company uses derivatives for the purpose of mitigating exposure to market risk, such as changes in commodity prices and foreign currency exchange rates. The
F-24
Table of Contents
JBS USA Holdings, Inc.
An indirect subsidiary of JBS S.A.
Notes to condensed consolidated financial statements
Company uses exchange-traded futures and options to hedge livestock commodities. The Company uses foreign currency positions, which are actively quoted by an independent financial institution, to mitigate the risk of foreign currency fluctuations in the markets in which it conducts business and to assist JBS S.A. in its risk management activities, as discussed in Note 10.
The fair value of derivative assets is recognized within other current assets while the fair value of derivative liabilities is recognized within accrued liabilities. The fair value measurements that are performed on a recurring basis fall within Level 1 of the fair value hierarchy. The amounts are as follows (in thousands):
| Level 1 | ||||||
| December 28, 2008 | September 27, 2009 | |||||
Assets: | ||||||
Commodity derivatives | $ | 42,087 | $ | 18,193 | ||
Foreign currency rate derivatives | 12,002 | 6,138 | ||||
Total Assets | $ | 54,089 | $ | 24,331 | ||
Liabilities: | ||||||
Commodity derivatives | $ | 16,392 | $ | 8,414 | ||
Foreign currency rate derivatives | 592 | 45,429 | ||||
Total Liabilities | $ | 16,984 | $ | 53,843 | ||
The Company utilizes various raw materials in its operations, including cattle, hogs, and energy, such as natural gas, electricity, and diesel fuel, which are all considered commodities. The Company considers these raw materials generally available from a number of different sources and believes it can obtain them to meet its requirements. These commodities are subject to price fluctuations and related price risk due to factors beyond our control, such as economic and political conditions, supply and demand, weather, governmental regulation, and other circumstances. Generally, the Company purchases derivatives in an attempt to mitigate price risk related to its anticipated consumption of commodity inputs for periods up to 12 months. The Company may enter into longer-term derivatives on particular commodities if deemed appropriate. As of September 27, 2009, the Company had derivative positions in place covering 2.7% and 6.6% of anticipated cattle and hog needs, respectively, through December 2010.
The following table presents the impact of derivative instruments on the Condensed Consolidated Statements of Operations for the thirteen and thirty-nine weeks ended September 28, 2008 and September 27, 2009 (in thousands):
| Amount of gain (loss) recognized in income | |||||||||||||||
| Thirteen weeks ended | Thirty-nine weeks ended | ||||||||||||||
| Derivatives not designated as hedging instruments | Location of gain (loss) recognized in income | September 28, 2008 | September 27, 2009 | September 28, 2008 | September 27, 2009 | ||||||||||
Commodity contracts | Net Sales | $ | 13,475 | $ | 8,211 | $ | 33,918 | $ | 19,805 | ||||||
Foreign exchange contracts | Net Sales | 22,379 | (2,322 | ) | 22,116 | 42,580 | |||||||||
Commodity contracts | Cost of Goods Sold | 35,810 | 8,115 | 36,859 | 94,697 | ||||||||||
Total derivative gain, net | $ | 71,664 | $ | 14,004 | $ | 92,893 | $ | 157,082 | |||||||
F-25
Table of Contents
JBS USA Holdings, Inc.
An indirect subsidiary of JBS S.A.
Notes to condensed consolidated financial statements
The balance of deferred derivative adjustments in accumulated other comprehensive income (loss), net of taxes at December 28, 2008 and September 27, 2009 were $(0.4) million and $(0.2) million, respectively. The Company anticipates these amounts will be transferred out of accumulated other comprehensive income (loss) and recognized in earnings over the next 12 months.
Note 7. Long-term debt and loan agreements
JBS USA Holdings and its direct and indirect subsidiaries have entered into various debt agreements in order to provide liquidity to operate the business on a go forward basis and, through the loans payable to JBS S.A. to fund the Smithfield Acquisition. As of December 28, 2008 and September 27, 2009, debt outstanding consisted of the following (in thousands):
| December 28, 2008 | September 27, 2009 | |||||
Short-term debt: | ||||||
Secured credit facilities | $ | 36,186 | $ | 29,955 | ||
Unsecured credit facilities | 30,826 | — | ||||
Total short-term debt | 67,012 | 29,955 | ||||
Current portion of long-term debt: | ||||||
Installment note payable | 1,264 | 928 | ||||
Capital lease obligations | 3,235 | 3,533 | ||||
Total current portion of long-term debt | 4,499 | 4,461 | ||||
Long-term debt: | ||||||
Loan payable to JBS S.A., due 2014 | 658,588 | 89,079 | ||||
Loan payable to JBS S.A., due 2019 | — | 6,000 | ||||
Senior unsecured notes due 2014, net of unaccreted discount | — | 655,441 | ||||
Installment note payable | 10,025 | 8,626 | ||||
Senior credit facilities | 114,673 | — | ||||
Capital lease obligations | 23,522 | 28,806 | ||||
Long-term debt, less current portion | 806,808 | 787,952 | ||||
Total debt | $ | 878,319 | $ | 822,368 | ||
The aggregate minimum principal maturities of debt for each of the five fiscal years and thereafter following September 27, 2009, are as follows (in thousands):
| For the fiscal years ending December | Minimum principal maturities | |||
2009 (remaining) | $ | 30,772 | ||
2010 | 4,328 | |||
2011 | 3,812 | |||
2012 | 3,207 | |||
2013 | 8,990 | |||
Thereafter | 815,818 | |||
Total Minimum principal maturities | 866,927 | |||
Less: Amount representing bond discount, net of accretion | (44,559 | ) | ||
Total debt | $ | 822,368 | ||
F-26
Table of Contents
JBS USA Holdings, Inc.
An indirect subsidiary of JBS S.A.
Notes to condensed consolidated financial statements
As of September 27, 2009, JBS USA Holdings had approximately $39.5 million of secured debt outstanding and approximately $72.4 million of outstanding letters of credit. The availability under our revolving credit facilities was $361.2 million as of September 27, 2009.
A summary of the components of interest expense, net is presented below (in thousands):
| Thirteen weeks ended | Thirty-nine weeks ended | |||||||||||||||
| September 28, 2008 | September 27, 2009 | September 28, 2008 | September 27, 2009 | |||||||||||||
Interest on: | ||||||||||||||||
Unsecured bank loans (approximately, 4.0% and 5.0%) | $ | 122 | $ | — | $ | 12,089 | $ | — | ||||||||
Unsecured credit facility (approximately, 8.6%, 3.4%, 8.6% and 4.6%) | 1,504 | — | 2,797 | 42 | ||||||||||||
Secured credit facility (US) (approximately, 5.4% and 4.4%) | — | 927 | — | 3,863 | ||||||||||||
Secured credit facility (AU) (approximately, 4.4% and 4.8%) | — | 264 | — | 946 | ||||||||||||
Senior unsecured notes due 2014 (11.625%) | — | 20,569 | — | 34,810 | ||||||||||||
Accretion of original issue discount | — | 2,434 | — | 4,119 | ||||||||||||
Debt issuance cost amortization | 106 | 1,346 | 1,064 | 3,727 | ||||||||||||
Loans payable to JBS S.A. (approximately, 5.9%, 12.0%, 5.9% and 7.7%) | 7,268 | 2,884 | 8,535 | 22,037 | ||||||||||||
Capital lease interest | 460 | 344 | 1,108 | 1,102 | ||||||||||||
Bank fees | 97 | 369 | 302 | 1,109 | ||||||||||||
Other miscellaneous interest charges (i) | 651 | 1,495 | 1,125 | 4,832 | ||||||||||||
Less: | ||||||||||||||||
Capitalized interest | (237 | ) | (223 | ) | (584 | ) | (884 | ) | ||||||||
Interest income | (1,099 | ) | (2,319 | ) | (3,149 | ) | (6,188 | ) | ||||||||
Total interest expense, net | $ | 8,872 | $ | 28,090 | $ | 23,287 | $ | 69,515 | ||||||||
| (i) | Includes installment notes interest expense of $0.1 million and $0.4 million for the thirteen and thirty-nine weeks ended September 28, 2008, respectively, and $50 thousand and $0.2 million for the thirteen and thirty-nine weeks ended September 27, 2009, respectively. |
Description of indebtedness
Senior Credit Facilities—On November 5, 2008, JBS USA, a wholly owned subsidiary of JBS USA Holdings, entered into a senior secured revolving credit facility (the “Credit Agreement”) that allows borrowings up to $400.0 million, and terminates on November 5, 2011. Up to $75.0 million of the Credit Agreement is available for the issuance of letters of credit. At September 27, 2009, $39.2 million of the availability was used towards letters of credit. Borrowings that are index rate loans will bear interest at the prime rate plus a margin of 2.25% and the all-in rate as of September 27, 2009 was 5.5%. Upon approval by the lender, LIBOR rate loans may be taken for one, two, or three month terms, (or six months at the discretion of the Agent) at LIBOR plus a margin of 3.25%. There were no borrowings at September 27, 2009.
F-27
Table of Contents
JBS USA Holdings, Inc.
An indirect subsidiary of JBS S.A.
Notes to condensed consolidated financial statements
Availability. Availability under the Credit Agreement is subject to a borrowing base. The borrowing base is based on certain of JBS USA domestic wholly owned subsidiaries’ assets as described below, with the exclusion of JBS Five Rivers. The borrowing base consists of percentages of eligible accounts receivable, inventory, and supplies less certain eligibility and availability reserves. As of September 27, 2009, borrowing availability was $267.9 million.
Security and Guarantees. Borrowings made by JBS USA are guaranteed by JBS S.A., JBS USA Holdings and all domestic subsidiaries except JBS Five Rivers, and are collateralized by a first priority perfected lien and interest in accounts receivable, finished goods and supply inventories.
Covenants. The Credit Agreement contains customary representations and warranties and a springing financial covenant that requires a minimum fixed charge coverage ratio of not less than 1.15 to 1.00. This ratio is only applicable if borrowing availability falls below the minimum threshold, which is the greater of 20% of the aggregate commitments or $70.0 million. The Credit Agreement also contains negative covenants that limit the ability of JBS USA and its subsidiaries to, among other things:
| • | have capital expenditures greater than $175.0 million per year; |
| • | incur additional indebtedness; |
| • | create liens on property, revenue, or assets; |
| • | make certain loans or investments; |
| • | sell or dispose of assets; |
| • | pay certain dividends and other restricted payments; |
| • | prepay or cancel certain indebtedness; |
| • | dissolve, consolidate, merge, or acquire the business or assets of other entities; |
| • | enter into joint ventures other than certain permitted joint ventures or create certain other subsidiaries; |
| • | enter into new lines of business; |
| • | enter into certain transactions with affiliates and certain permitted joint ventures; |
| • | agree to restrictions on the ability of the subsidiaries to make dividends; |
| • | agree to enter into negative pledges in favor of any other creditor; and |
| • | enter into sale/leaseback transactions and operating leases. |
The Credit Agreement also contains customary events of default, including failure to perform or observe terms, covenants or agreements included in the Credit Agreement, payment of defaults on other indebtedness, defaults on other indebtedness if the effect is to permit acceleration,
F-28
Table of Contents
JBS USA Holdings, Inc.
An indirect subsidiary of JBS S.A.
Notes to condensed consolidated financial statements
entry of unsatisfied judgments or orders against a loan party or its subsidiaries, failure of any collateral document to create or maintain a priority lien, and certain events related to bankruptcy and insolvency or environmental matters. If an event of default occurs the lenders may, among other things, terminate their commitments, declare all outstanding borrowings to be immediately due and payable together with accrued interest and fees and exercise remedies under the collateral documents relating to the Credit Agreement. At September 27, 2009, JBS USA was in compliance with all covenants.
On April 27, 2009, the Credit Agreement was amended to allow the execution of the $700 million senior unsecured notes due 2014 described below. Under the amendment, the existing limitation on distributions between JBS USA and JBS USA Holdings was amended to allow for the proceeds of the senior unsecured notes due 2014 offering, less transaction expenses and $100.0 million retained by JBS USA to be remitted to JBS USA Holdings as a one time distribution. Also, the unused line fee was increased from 37.5 basis points to 50.0 basis points.
On August 13, 2009, the Credit Agreement was amended to eliminate JBS USA’s obligation to report daily mark-to-market summary of inventory market values to the administrative agent.
On September 11, 2009, the Credit Agreement was amended to permit JBS USA Holdings to acquire Pilgrims Pride Corporation (“PPC”), and permit a potential 12 month bridge loan of up to $900.0 million as a possible financing option for the acquisition (see Note 15). Furthermore, the amendment modified the change of control definition so that JBS S.A. is required to own more than 50% rather than 100% of the capital stock of JBS USA Holdings. In addition, the amendment excludes capital expenditures that are financed with initial public offering proceeds from the fixed charge coverage ratio covenant calculation and any capital expenditures and acquisitions that are financed with such proceeds are not subject to the respective covenant limitations in the Credit Agreement. Finally, the aggregate amount of permitted capital leases was increased from $25.0 million to $50.0 million.
Installment note payable—The installment note payable relates to the Company’s financing of a capital investment. The note bears interest at LIBOR. The rate as of September 27, 2009 was 0.25% plus a fixed margin of 1.75% per annum with payments due on the first of each month. The note matures on August 1, 2013.
Unsecured credit facility—Swift Australia entered into an Australian dollar (“A$”) denominated A$120.0 million unsecured credit facility on February 26, 2008 to fund working capital and letter of credit requirements. Under this facility A$80.0 million can be borrowed for cash needs and A$40.0 million is available to fund letters of credit. Borrowings are made at the cash advance rate (BBSY) plus a margin of 0.975% plus commitment fee of 0.10%. The all-in rate as of September 27, 2009 was 4.30%. The credit facility contains certain financial covenants which require Swift Australia to maintain pre-determined ratio levels related to interest coverage, debt coverage and tangible net worth. As of September 27, 2009, Swift Australia is in compliance with all covenants, has no amounts outstanding and has $33.2 million utilized under the letter of credit facility. This facility terminated on October 1, 2009. The A$40.0 million letter of credit
F-29
Table of Contents
JBS USA Holdings, Inc.
An indirect subsidiary of JBS S.A.
Notes to condensed consolidated financial statements
portion of this facility was extended to November 1, 2009 and terminated on that date. As of September 27, 2009, Swift Australia had $69.5 million available to borrow.
Secured credit/ multi-option bridge facility—JBS Southern entered into an Australian dollar (“A$”) denominated A$80.0 million secured multi-option bridge facility on May 2, 2008 to fund working capital and letter of credit requirements. JBS Southern property and plant assets secure this bridge facility. Under this facility A$65.0 million can be borrowed for cash needs and to fund letters of credit. The remaining A$15.0 million is used for working capital needs. Borrowings are made at the BBSY plus a margin of 2.0% (including a commitment fee of 1.40%). The all-in rate as of September 27, 2009 was 5.22%. The multi-option bridge facility contains covenants and obligations which require JBS Southern to comply. As of September 27, 2009, JBS Southern is in compliance with all covenants and has $29.9 million outstanding. This facility originally had a fixed term and was set to expire on December 31, 2008. The facility was extended until March 31, 2009, further extended until June 30, 2009, further extended until September 30, 2009, further extended until October 31, 2009 and is now due to expire on January 31, 2010. As of September 27, 2009, JBS Southern had $23.8 million available to borrow (See Note 16).
11.625% senior unsecured notes due 2014—JBS USA Holdings’ wholly owned subsidiaries JBS USA and JBS USA Finance, Inc. issued 11.625% notes due 2014 in an aggregate principal amount of $700.0 million on April 27, 2009. These notes are guaranteed by JBS USA Holdings, JBS S.A., JBS Hungary Holdings Kft., and each of the US restricted subsidiaries that guarantee the Credit Agreement (subject to certain exceptions). Interest on these notes accrues at a rate of 11.625% per annum and is payable semi-annually in arrears on May 1 and November 1 of each year, beginning on November 1, 2009. The principal amount of these notes are payable in full on May 1, 2014. The original issue discount of approximately $48.7 million will be accreted over the life of the notes.
Covenants. The indenture for the 11.625% senior unsecured notes due 2014, contains customary negative covenants that limit JBS USA and its restricted subsidiaries’ ability to, among other things:
| • | incur additional indebtedness, based on net debt to EBITDA ratio; |
| • | incur liens; |
| • | sell or dispose of assets; |
| • | pay dividends or make certain payments to our shareholders; |
| • | permit restrictions on dividends and other restricted payments by its restricted subsidiaries; |
| • | enter into related party transactions; |
| • | enter into sale/leaseback transactions; and |
| • | undergo changes of control without making an offer to purchase the notes. |
F-30
Table of Contents
JBS USA Holdings, Inc.
An indirect subsidiary of JBS S.A.
Notes to condensed consolidated financial statements
Events of default. The indenture also contains customary events of default, including failure to perform or observe terms, covenants or other agreements in the indenture, defaults on other indebtedness if the effect is to permit acceleration, failure to make a payment on other indebtedness waived or extended within the applicable grace period, entry of unsatisfied judgments or orders against the issuer or its subsidiaries, and certain events related to bankruptcy and insolvency matters. If an event of default occurs, the trustee or the holders of at least 25% in aggregate principal amount of the notes then outstanding may declare such principal and accrued interest on the notes to be immediately due and payable.
Dividend Restrictions—Certain covenants of indebtedness and debt guarantee terms include restrictions on our ability to pay dividends. As of December 28, 2008 and September 27, 2009, the Company had $20.6 million and $87.4 million, respectively, of retained earnings available to pay dividends.
The following four loan agreements sum to the $750.0 million described as debt related to the Acquisition (see Note 1). As indicated below, as of September 27, 2009, there were no outstanding balances with respect to these four loan agreements.
$250 million loan agreement—In connection with the Acquisition, JBS USA Holdings entered into a one year unsecured loan agreement with interest payable semi-annually based on six month LIBOR plus a margin of 1.50% with a maturity date of June 30, 2008. The loan agreement contained customary representations and warranties. The loan agreement was guaranteed by JBS S.A. On February 22, 2008, this debt was repaid by the Company using cash received from its Parent which has been reflected as an additional capital contribution.
$150 million loan agreement—In connection with the Acquisition, JBS USA Holdings entered into a one year unsecured loan agreement with interest payable semi-annually based on six month LIBOR plus a margin of 0.75%. The loan matured on June 30, 2008. The loan agreement contained customary representations, warranties and covenants. The loan agreement was guaranteed by JBS. On February 27, 2008 this debt was repaid by the Company using cash received from its Parent, which has been reflected as an additional capital contribution.
$250 million credit agreement—In connection with the Acquisition, JBS USA Holdings entered into a one year unsecured credit agreement with interest payable quarterly based on three month LIBOR plus a margin of 0.75%. The agreement matured on July 7, 2008. The credit agreement contained customary representations, warranties and negative covenants. There were no maintenance financial covenants but the agreement contained an incurrence Consolidated Net Indebtedness to EBITDA ratio of 3.75 to 1.00 prior to December 31, 2007 and 3.60 to 1.00 commencing on January 1, 2008 and ending on the maturity date. The credit agreement was guaranteed by JBS S.A. On July 3, 2008 this credit agreement was repaid with funds loaned to us by JBS S.A.
$100 million loan agreement—In connection with the Acquisition, JBS USA Holdings entered into a one year unsecured loan agreement. The original 182 day loan agreement with interest payable at maturity based on six month LIBOR plus a margin of 0.8% matured on January 7,
F-31
Table of Contents
JBS USA Holdings, Inc.
An indirect subsidiary of JBS S.A.
Notes to condensed consolidated financial statements
2008. On January 3, 2008, an extension and modification agreement was signed changing the maturity date to July 7, 2008 and increasing the margin to 1.50%. The loan agreement contained customary representations, warranties and covenants. The loan agreement was guaranteed by JBS S.A. On July 7, 2008 this loan agreement was repaid with funds loaned to us by JBS S.A.
The five various intercompany loans issued in 2008 described below from JBS S.A., were subsequently assigned to JBS HU Liquidity Management LLC (“Hungary”), a wholly owned, indirect subsidiary of JBS S.A. which is organized in the country of Hungary. Between October 31, 2008 and November 30, 2008, JBS S.A. reduced the principal and accrued interest by approximately $92.6 million as a result of a derivative gain realized on foreign currency positions in Brazil. On April 27, 2009, in connection with the issuance of the 11.625% senior unsecured notes by JBS USA, these intercompany loan agreements were consolidated into one loan agreement, and the maturity date was extended to April 18, 2019, and the interest rate was changed from approximately 6.5% to 12% per annum. The net proceeds of the offering of the 11.625% senior unsecured notes due 2014 (other than $100.0 million) were used to repay accrued interest and a portion of the principal on these intercompany loans. In addition, on May 31, 2009, JBS S.A. reduced the principal and accrued interest by approximately $48.3 million as a result of a derivative gain realized on foreign currency positions in Brazil. As of September 27, 2009, JBS S.A. USA Holdings owed an aggregate principal amount of approximately $89.1 million under the consolidated intercompany loan agreement.
$100 million loan payable to JBS HU Liquidity—On April 28, 2008, the Company entered into an unsecured loan agreement with its parent, JBS S.A., for $100.0 million with a maturity date of April 28, 2011. The funds received from this loan were used to fund the Tasman Acquisition (see Note 2). On March 27, 2009, this loan was assigned to Hungary.
$25 million loan payable to JBS HU Liquidity—On May 5, 2008, the Company entered into an unsecured loan agreement with JBS S.A. for $25.0 million with a maturity date of May 5, 2011. The funds received were used to fund operations. On March 27, 2009, this loan was assigned to Hungary.
$25 million loan payable to JBS HU Liquidity—On June 10, 2008, the Company entered into an unsecured loan agreement with JBS S.A. for $25.0 million with a maturity date of June 10, 2011. The funds received from this loan were used to fund operations. On March 27, 2009, this loan was assigned to Hungary.
$350 million loan payable to JBS HU Liquidity—On June 30 2008, the Company entered into an unsecured loan agreement with JBS S.A. totaling $350.0 million with a maturity date of June 30, 2011. The funds received were used to pay outstanding unsecured bank debt. On March 27, 2009, this loan was assigned to Hungary.
$250 million loan payable to JBS HU Liquidity—On October 21, 2008, the Company entered into an unsecured loan agreement with JBS S.A. for $250.0 million with a maturity date of October 21, 2011. The funds received were used for the Smithfield Acquisition (see Note 3). On March 27, 2009, this loan was assigned to Hungary.
F-32
Table of Contents
JBS USA Holdings, Inc.
An indirect subsidiary of JBS S.A.
Notes to condensed consolidated financial statements
$6 million loan payable to JBS HU Liquidity—On May 20, 2009, the Company entered into an unsecured loan agreement with Hungary for $6.0 million with a maturity date of May 20, 2019. The proceeds were used to repay a portion of the consolidated intercompany note referenced above. The loan agreement has a stated interest rate of 12% with interest payable semi-annually.
Capital and Operating Leases—JBS USA Holdings and certain of its subsidiaries lease the corporate headquarters in Greeley, Colorado under capital lease; six distribution facilities located in New Jersey, Florida, Nebraska, Arizona, Colorado and Texas; marketing liaison offices in South Korea, Japan, Mexico, China, and Taiwan; its distribution centers and warehouses in Australia; and a variety of equipment under operating lease agreements that expire in various years between 2009 and 2015. Future minimum lease payments at September 27, 2009, under capital and non-cancelable operating leases with terms exceeding one year are as follows (in thousands):
| Capitalized lease obligations | Noncancellable operating obligations | ||||||
2009 (remaining) | $ | 914 | $ | 12,093 | |||
2010 | 4,580 | 25,491 | |||||
2011 | 3,802 | 20,807 | |||||
2012 | 2,977 | 12,721 | |||||
2013 | 2,874 | 10,042 | |||||
Thereafter | 20,966 | 30,121 | |||||
Net minimum lease payments | 36,113 | $ | 111,275 | ||||
Less: Amount representing interest | (3,774 | ) | |||||
Present value of net minimum lease payments | $ | 32,339 | |||||
Rent expense associated with operating leases was $6.2 million and $16.7 million for the thirteen and thirty-nine weeks ended September 28, 2008, respectively. Rent expense associated with operating leases was $9.0 million and $29.6 million for the thirteen and thirty-nine weeks ended September 27, 2009, respectively.
Note 8. Defined contribution plans
Defined Contribution Plans
The Company sponsors three tax-qualified employee savings and retirement plans (the “401(k) Plans”) covering its US based employees, both union and non-union. Pursuant to the 401(k) Plans related to the beef and pork operations, excluding JBS Five Rivers, eligible employees may elect to reduce their current compensation by up to the lesser of 75% of their annual compensation or the statutorily prescribed annual limit and have the amount of such reduction contributed to the 401(k) Plans. The 401(k) Plans provide for additional matching contributions by the Company, based on specific terms contained in the 401(k) Plans. On July 8, 2008, the Company amended its 401(k) Plans by eliminating the immediate vesting and instituting a five year vesting schedule for
F-33
Table of Contents
JBS USA Holdings, Inc.
An indirect subsidiary of JBS S.A.
Notes to condensed consolidated financial statements
all non-production employees and reducing the maximum Company match to an effective 2% from the former rate of 5%. The trustee of the 401(k) Plans, at the direction of each participant, invests the assets of the 401(k) Plans in participant designated investment options. The 401(k) Plans are intended to qualify under Section 401 of the Internal Revenue Code. The Company’s expenses related to the matching provisions of the 401(k) Plans totaled approximately $1.3 million and $4.9 million for the thirteen and thirty-nine weeks ended September 28, 2008, respectively. The Company’s expenses related to the matching provisions of the 401(k) Plans totaled approximately $1.3 million and $3.9 million for the thirteen and thirty-nine weeks ended September 27, 2009, respectively. One of the Company’s facilities participates in a multi-employer pension plan. The Company’s contributions to this plan, which are included in cost of goods sold in the Condensed Consolidated Statements of Operations, were $73 thousand and $0.2 million for the thirteen and thirty-nine weeks ended September 28, 2008, respectively, and $62 thousand and $0.2 million for the thirteen and thirty-nine weeks ended September 27, 2009, respectively. The Company also made contributions totaling $14 thousand and $41 thousand for the thirteen and thirty-nine weeks ended September 28, 2008, respectively, and $15 thousand and $57 thousand for the thirteen and thirty-nine weeks ended September 27, 2009, respectively, to a multi-employer pension related to former employees at the former Nampa, Idaho plant pursuant to a settlement agreement. As these payments are made, they are recorded as a reduction of the pre-acquisition contingency.
Participants of JBS Five Rivers (“Five Rivers 401(k) Plan”) participants can contribute up to 50% of pretax compensation, as defined in the Plan. Participants may also contribute amounts representing distributions from other qualified defined benefit or contribution plans. For the plan year ended December 31, 2008 the plan adopted safe harbor provisions in order to satisfy certain non-discrimination testing requirements of the Internal Revenue Code. For the plan year ended December 31, 2008 the Company made safe harbor contributions equal to the sum of the 1) 100% of the participant’s deferrals that do not exceed 3% of his or her compensation and 2) 50% of the participant’s deferrals that exceed 3% of his or her compensation but do not exceed 5% of his or her compensation. Additional amounts may be contributed at the discretion of the Company’s Board of Directors. No such discretionary contributions were made for the plan year ended December 31, 2008 nor for the period January 1, 2009 through September 30, 2009. The Company’s expenses related to the matching provisions of the Five Rivers 401(k) Plans totaled approximately $61 thousand and $0.2 million for the thirteen and thirty-nine weeks ended September 27, 2009, respectively. Participants are immediately vested in their own contributions plus actual earnings thereon. Participants also immediately vest in Company matching contributions. Additional discretionary contributions are subject to a five-year vesting schedule based on years of service (see Note 15).
Employees of Swift Australia do not in the Company’s 401(k) Plans. Under Australian law, Swift Australia contributes a percentage of employee compensation to a Superannuation fund. This contribution approximates 9% of employee cash compensation as required under the Australian “Superannuation Act of 1997”. As the funds are administered by a third party, once this contribution is made to the Superannuation fund, Swift Australia has no obligation for payments
F-34
Table of Contents
JBS USA Holdings, Inc.
An indirect subsidiary of JBS S.A.
Notes to condensed consolidated financial statements
to participants or oversight of the fund. The Company’s expenses related to contributions to this fund totaled $5.0 million and $12.4 million for the thirteen and thirty-nine weeks ended September 28, 2008, respectively. The Company’s expenses related to contributions to this fund totaled $5.8 million and $14.5 million for the thirteen and thirty-nine weeks ended September 27, 2009, respectively.
Note 9. Deferred revenue
On October 22, 2008, the Company received a deposit in cash from a customer of $175.0 million for the customer to secure an exclusive right to collect a certain by-product of the beef fabrication process in all of our US beef plants. This agreement was formalized in writing as the Raw Material Supply agreement (“Supply Agreement”) on February 27, 2008. The customer advance payment was recorded as deferred revenue. As the by-product is delivered to the customer over the term of the agreement, the deferred revenue is recognized as revenue in the Condensed Consolidated Statements of Operations. To provide the customer with security, in the unlikely event the Company was to default on its commitment, the payment is evidenced by the Supply Agreement which bears interest at 2 month LIBOR plus 200 basis points. In the event of default, the Supply Agreement provides for a conversion into shares of common stock of JBS USA Holdings based on a formula stipulated in the Supply Agreement. Assuming default had occurred on September 27, 2009, the conversion right under the Supply Agreement would have equaled 11.47% of the outstanding common stock, or 11.47 shares. The Supply Agreement contains affirmative and negative covenants which requires the Company to among other things: maintain defined market share; maintain certain tangible net worth levels; and comply in all material respects with the Supply Agreement. The unamortized balance at September 27, 2009 was approximately $160.6 million.
F-35
Table of Contents
JBS USA Holdings, Inc.
An indirect subsidiary of JBS S.A.
Notes to condensed consolidated financial statements
Note 10. Related party transactions
JBS USA Holdings enters into transactions in the normal course of business with employees of JBS USA Holdings and affiliates of JBS S.A. other than those related party transactions disclosed in Note 7 to the condensed consolidated financial statements, the following table presents the impact of these transactions on the Condensed Consolidated Statements of Operations for the thirteen and thirty-nine weeks ended September 28, 2008 and September 27, 2009 (in thousands):
| Thirteen weeks ended | Thirty-nine weeks ended | |||||||||||
| September 28, 2008 | September 27, 2009 | September 28, 2008 | September 27, 2009 | |||||||||
Sales to: | ||||||||||||
JBS S.A. Affiliates (i) (meat products) | $ | 3,830 | $ | 4,285 | $ | 9,415 | $ | 7,198 | ||||
JBS S.A. (meat products) | 967 | 566 | 1,062 | 2,814 | ||||||||
JBS S.A. (gain from foreign currency contract) (ii) | — | — | — | 48,290 | ||||||||
J&F (cattle hoteling) | — | 158,988 | — | 423,697 | ||||||||
JBS Global UK (meat products) | 3,595 | 4,167 | 14,050 | 9,018 | ||||||||
Total sales to related parties | $ | 8,392 | $ | 168,006 | $ | 24,527 | $ | 491,017 | ||||
Other Income: | ||||||||||||
Rental income from executives | $ | — | $ | — | $ | 26 | $ | — | ||||
Interest income (iii) | — | 1,915 | — | 5,081 | ||||||||
Total other income | $ | — | $ | 1,915 | $ | 26 | $ | 5,081 | ||||
Purchases from: | ||||||||||||
JBS S.A. Affiliates (i) (meat products) | $ | 34 | $ | — | $ | 903 | $ | — | ||||
JBS S.A. (meat products) | — | — | — | 727 | ||||||||
J&F (cattle) | — | 401,072 | — | 711,798 | ||||||||
Total purchases from related parties | $ | 34 | $ | 401,072 | $ | 903 | $ | 712,525 | ||||
| (i) | JBS S.A. subsidiaries, excluding JBS USA Holdings and its subsidiaries. |
| (ii) | JBS S.A. and its subsidiaries take a global perspective to managing our collective and individual exposures to currency risks. As part of our strategy, JBS USA Holdings and JBS S.A. are party to an agreement pursuant to which JBS S.A. enters into foreign currency contracts with us covering Brazilian Reais, enabling us to assist JBS S.A. in its risk management activities. Under the agreement, the outstanding balance of the intercompany loan agreement executed between JBS S.A. and us will be increased to reflect any losses on positions taken by JBS USA Holdings and will be reduced by any gains on positions taken by JBS USA Holdings. On May 31, 2009 we realized a $48.3 million gain on foreign currency contract with JBS S.A., and, accordingly, the Company reduced the intercompany loans in the same amount. |
| (iii) | Interest income represents interest paid by J&F Oklahoma Holdings, Inc. (“J&F”), an unconsolidated affiliate, to JBS Five Rivers on the credit facility to J&F described below. |
F-36
Table of Contents
JBS USA Holdings, Inc.
An indirect subsidiary of JBS S.A.
Notes to condensed consolidated financial statements
The following table presents the impact of these transactions on our Condensed Consolidated Balance Sheets as of December 28, 2008 and September 27, 2009 (in thousands):
December 28, 2008 | September 27, 2009 | |||||||
Balance sheet: | ||||||||
Current: | ||||||||
JBS S.A. Affiliates (i) | $ | 8,763 | $ | 1,544 | ||||
JBS S.A. (i) | 1,562 | 709 | ||||||
J&F (i) | 10,450 | 49,540 | ||||||
Payable to J&F (ii) | (972 | ) | (11,272 | ) | ||||
Employees and executives (iii), (iv) | 25 | 810 | ||||||
Total current receivable from related parties | 19,828 | 41,331 | ||||||
Non-current: | ||||||||
J&F (v) | 89 | 174,081 | ||||||
Total net amounts owed to JBS USA Holdings | $ | 19,917 | $ | 215,412 | ||||
| (i) | Repayment is expected within 30 days or less. |
| (ii) | The payable to J&F as of December 28, 2008 includes $0.6 million of expense reimbursements to J&F and $0.4 million of margin settlements. The payable to J&F as of September 27, 2009 is for rebates. |
| (iii) | On April 24, 2009, the Company issued a forgivable promissory note in the amount of $0.2 million to an officer of the Company. The note bears interest at 5.25% and will be forgiven in four equal installments on the anniversary date of the loan as long as the executive continues to be an employee. If the employee is terminated for cause, the entire note balance plus accrued interest will be due and payable on the termination date. |
| (iv) | On July 28, 2009, the Company issued a promissory note in the amount of $0.6 million to an executive officer of the Company. The note bears interest at 5.25% annually. A one time payment, including principal plus interest, is due on or before July 23, 2010. |
| (v) | Repayment is due upon request on or after October 24, 2011. |
JBS USA Holdings received capital contributions from its parent of $450.0 million during the fifty-two weeks ended December 28, 2008, of which $50.0 million was used to fund operations and $400.0 million was used to repay debt. During the fifty-two weeks ended December 28, 2008, the Company entered into various intercompany loans with JBS S.A. These were contributed to JBS USA and used to fund operations and complete the Tasman Acquisition and Smithfield Acquisition (see Notes 2, 3, and 7).
Guarantees—JBS S.A. has notes payable outstanding of approximately $300.0 million at September 27, 2009 that are due in 2016 (“2016 Notes”). The indenture governing the 2016 Notes requires any significant subsidiary (any subsidiary constituting at least 20% of JBS S.A.’s total assets or annual gross revenues, as shown on the latest financial statements of JBS S.A.) to guarantee all of JBS S.A.’s obligations under the 2016 Notes. The 2016 Notes are guaranteed by JBS Hungary Holdings Kft. (a wholly owned, indirect subsidiary of JBS S.A.), the Company and its subsidiaries, JBS USA and Swift Beef Company. Additional subsidiaries of JBS S.A. (including our subsidiaries) may be required to guarantee the 2016 Notes in the future.
F-37
Table of Contents
JBS USA Holdings, Inc.
An indirect subsidiary of JBS S.A.
Notes to condensed consolidated financial statements
Covenants. The indentures for the 2016 Notes contain customary negative covenants that limit the ability of JBS S.A. and its subsidiaries (including us) to, among other things:
| • | incur additional indebtedness; |
| • | incur liens; |
| • | sell or dispose of assets; |
| • | pay dividends or make certain payments to JBS S.A.’s shareholders; |
| • | permit restrictions on dividends and other restricted payments by its subsidiaries; |
| • | enter into related party transactions; |
| • | enter into sale/leaseback transactions; and |
| • | undergo changes of control without making an offer to purchase the notes. |
Events of default. The indentures for the 2016 Notes also contain customary events of default, including for failure to perform or observe terms, covenants or other agreements in the indenture, defaults on other indebtedness if the effect is to permit acceleration, failure to make a payment on other indebtedness waived or extended within the applicable grace period, entry of unsatisfied judgments or orders against the issuer or its subsidiaries, and certain events related to bankruptcy and insolvency matters. If an event of default occurs, the trustee or the holders of at least 25% in aggregate principal amount of the notes then outstanding may declare such principal and accrued interest on the notes to be immediately due and payable.
Cattle supply and feeding agreement—JBS Five Rivers is party to a cattle supply and feeding agreement with J&F. JBS Five Rivers feeds and takes care of cattle owned by J&F. J&F pays JBS Five Rivers for the cost of feed and medicine at cost plus a yardage fee on a per head per day basis. Beginning on June 23, 2009 or such earlier date on which JBS Five Rivers’ feed yards are at least 85% full of cattle and ending on October 23, 2011, J&F has agreed to maintain sufficient cattle on JBS Five Rivers’ feed yards so that such feed yards are at least 85% full of cattle at all times. The agreement commenced on October 23, 2008 and continues until the last of the cattle on JBS Five Rivers’ feed yards as of October 23, 2011 are shipped to J&F, a packer or another third party.
Cattle purchase and sale agreement—On October 7, 2008 JBS USA became party to a cattle purchase and sale agreement with J&F. Under this agreement, J&F agreed to sell to JBS USA, and JBS USA has agreed to purchase from J&F, at least 500,000 cattle during each year from 2009 through 2011. Cattle delivered from J&F for the thirteen and thirty-nine weeks ended September 27, 2009 were approximately 351,000 and 644,000, respectively. The price paid by JBS USA is determined pursuant to JBS USA’s pricing grid in effect on the date of delivery. The grid used for J&F is identical to the grid used for unrelated third parties. If the cattle sold by J&F in a quarter result in a breakeven loss (selling price below accumulated cost to acquire the feeder animal and fatten it to delivered weight) then JBS USA will reimburse 40% of the average per head breakeven loss incurred by J&F, limited up to 125,000 head delivered to JBS USA in that
F-38
Table of Contents
JBS USA Holdings, Inc.
An indirect subsidiary of JBS S.A.
Notes to condensed consolidated financial statements
quarter. If the cattle sold by J&F in a quarter result in a breakeven gain (selling price above the accumulated cost to acquire the feeder animal and fatten it to delivered weight), then JBS USA will receive from J&F an amount of cash equal to 40% of that per head gain, limited up to 125,000 head delivered to JBS USA in that quarter.
Guarantee of J&F’s revolving credit facility—J&F has a $600.0 million secured revolving credit facility with a commercial bank. Its parent company has entered into a keep-well agreement with its subsidiary (J&F) whereby it will make contributions to J&F if J&F is not in compliance with its financial covenants under this credit facility. If J&F defaults on its obligations under the credit facility and such default is not cured by its parent under the keep-well agreement, JBS Five Rivers is obligated for up to $250.0 million of guaranteed borrowings plus certain other obligations and costs under this credit facility. J&F was in compliance with its financial covenants under this credit facility as of September 27, 2009. This credit facility and the guarantee thereof are secured solely by the assets of J&F and the net assets of JBS Five Rivers. This credit facility matures on October 7, 2011. This credit facility is used to acquire cattle which are then fed in the JBS Five Rivers feed yards pursuant to the cattle supply and feeding agreement described above. The finished cattle are sold to JBS USA under the cattle purchase and sale agreement discussed above.
Credit facility to J&F—JBS Five Rivers is party to an agreement with J&F pursuant to which JBS Five Rivers has agreed to loan up to $200.0 million in revolving loans to J&F. The loans are used by J&F to acquire feeder animals which are placed in JBS Five Rivers feed yards for finishing. Borrowings accrue interest at a per annum rate of LIBOR plus 2.25% or base rate plus 1.0% and interest is payable at least quarterly. The interest rate at September 27, 2009 was 4.25%. This credit facility matures on October 7, 2011. During the thirty-nine weeks ended September 27, 2009, average borrowings were approximately $158.3 million.
Variable interest entities—As of September 27, 2009, the Company holds variable interests in J&F, which is considered a variable interest entity under ASC 810-10-15, in the Broad Transactions—Consolidation topic (Prior authoritative literature: FASB Interpretation No. 46(R),Consolidation of Variable Interest Entities). The Company has determined that it is not the primary beneficiary of J&F but has significant variable interests in the entity. The Company’s significant variable interests are listed below and discussed further above:
| • | JBS Five Rivers has agreed to provide up to $200.0 million in loans to J&F; |
| • | JBS Five Rivers’ guarantee of up to $250.0 million of J&F’s borrowings under its revolving credit facility plus certain other obligations and costs, which is secured by and limited to the net assets of JBS Five Rivers; and |
| • | JBS USA’s rights and obligations under the cattle purchase and sale agreement. |
The Company’s maximum exposure to loss related to these variable interests is limited to the lesser of the net assets of JBS Five Rivers (including loans made to J&F) or $250.0 million plus certain other obligations and costs. As of September 27, 2009, the carrying value of JBS Five Rivers’ net assets is $376.1 million. Potential losses under the terms of the cattle purchase and sale agreement depend on future market conditions.
F-39
Table of Contents
JBS USA Holdings, Inc.
An indirect subsidiary of JBS S.A.
Notes to condensed consolidated financial statements
Note 11. Income taxes
The pre-tax income (loss) on which the provision for income taxes was computed is as follows (in thousands):
| Thirteen weeks ended | Thirty-nine weeks ended | ||||||||||||
| September 28, 2008 | September 27, 2009 | September 28, 2008 | September 27, 2009 | ||||||||||
Domestic | $ | 132,208 | $ | 64,716 | $ | 184,459 | $ | 107,414 | |||||
Foreign | (13,706 | ) | 12,550 | 46,059 | 66,787 | ||||||||
Total | $ | 118,502 | $ | 77,266 | $ | 230,518 | $ | 174,201 | |||||
Income tax expense includes the following current and deferred provisions (in thousands):
| Thirteen weeks ended | Thirty-nine weeks ended | |||||||||||||
| September 28, 2008 | September 27, 2009 | September 28, 2008 | September 27, 2009 | |||||||||||
Current provision: | ||||||||||||||
Federal | $ | 2,651 | $ | (7,292 | ) | $ | 2,651 | $ | 2,042 | |||||
State | 729 | 1,855 | 1,370 | 3,634 | ||||||||||
Foreign | (4,837 | ) | 5,696 | 12,309 | 20,154 | |||||||||
Total current tax expense | (1,457 | ) | 259 | 16,330 | 25,830 | |||||||||
Deferred provision: | ||||||||||||||
Federal | 29,253 | 22,646 | 51,143 | 29,615 | ||||||||||
State | 6,758 | 2,791 | 6,794 | 2,791 | ||||||||||
Foreign | — | — | — | — | ||||||||||
Total deferred tax expense | 36,011 | 25,437 | 57,937 | 32,406 | ||||||||||
Total income tax expense | $ | 34,554 | $ | 25,696 | $ | 74,267 | $ | 58,236 | ||||||
Temporary differences that gave rise to a significant portion of the deferred tax assets (liabilities) include federal and state net operating loss carryforwards, foreign capital loss carryforwards, foreign exchange gain and depreciable and amortizable assets.
The total amount of the deferred tax assets (liabilities) are as follows (in thousands):
| December 28, 2008 | September 27, 2009 | |||||||
Total deferred tax liability | $ | (305,915 | ) | $ | (267,972 | ) | ||
Total deferred tax asset | 210,389 | 185,180 | ||||||
Valuation allowance | (42,826 | ) | (42,826 | ) | ||||
Net deferred tax assets | 167,563 | 142,354 | ||||||
Net deferred tax liability | $ | (138,352 | ) | $ | (125,618 | ) | ||
F-40
Table of Contents
JBS USA Holdings, Inc.
An indirect subsidiary of JBS S.A.
Notes to condensed consolidated financial statements
At December 28, 2008, JBS USA Holdings recorded deferred tax assets of $141.0 million for loss carryforwards expiring in the years 2009 through 2029. In addition, JBS USA Holdings has $14.3 million of tax credits of which $10.3 million will expire in the years 2009 through 2028 and $4.0 million will carryforward indefinitely.
Section 382 of the Internal Revenue Code of 1986, as amended, imposes an annual limit on the ability of a corporation that undergoes an “ownership change” to use its net operating losses to reduce its tax liability. JBS USA Holdings experienced an ownership change in January of 2007 and July of 2007. JBS USA Holdings believes that its net operating losses exceed the Section 382 limitation in the amount of $14 million.
The valuation allowance as of December 28, 2008 and September 27, 2009 was primarily related to loss and credit carryforwards that, in the judgment of management, will not be realized. Subsequently recognized tax benefits relating to the valuation allowance for deferred tax assets as of December 28, 2008 and September 27, 2009 will be allocated to income tax expense, pursuant to ASC 805-740-25 in the Broad Transactions—Business Combinations topic.
JBS USA Holdings deems all of its foreign investments to be permanent in nature and does not provide for taxes on permanently reinvested earnings. It is not practicable to determine the amount of incremental taxes that might arise if these earnings were to be remitted.
JBS USA Holdings follows the provisions ASC 740-10-25-16, in the Expenses—Income Taxes topic (Prior authoritative literature: FASB Interpretation No. 48,Accounting for Uncertainty in Income Taxes). JBS USA Holdings’ unrecognized tax benefits are $8.1 million, the recognition of which would not have a material impact on the effective tax rate.
A reconciliation of the beginning and ending amount of unrecognized tax benefits is as follows (in thousands):
Balance at December 28, 2008 | $8,100 | ||
Additions based on tax positions related to the current period | — | ||
Additions for tax positions of prior years | — | ||
Reductions for tax positions of prior years | — | ||
Settlements | (40 | ) | |
Balance at September 27, 2009 | $8,060 | ||
JBS USA Holdings recognizes both interest and penalties related to uncertain tax positions as part of the income tax provision. As of December 28, 2008, accrued interest and penalties were $5 thousand. As of September 27, 2009, accrued interest and penalty amounts related to uncertain tax positions were reduced to zero as a result of a settlement. The unrecognized tax benefit and related penalty and interest balances at September 27, 2009 are not expected to change within the next twelve months.
JBS USA Holdings files income tax returns in the U.S. and in various states and foreign countries. JBS USA Holdings has been audited for US Federal income tax purposes through the May 2004 tax year. No other major jurisdictions where JBS USA Holdings operates has been under audit.
F-41
Table of Contents
JBS USA Holdings, Inc.
An indirect subsidiary of JBS S.A.
Notes to condensed consolidated financial statements
Note 12. Commitments and contingencies
Swift Beef was a defendant in a lawsuit entitled United States of America, ex rel, Ali Bahrani v. ConAgra, Inc., ConAgra Foods, Inc., ConAgra Hide Division, ConAgra Beef Company and Monfort, Inc., filed in the United States District Court for the District of Colorado in May 2000 by the relator on behalf of the United States of America and himself for alleged violations of the False Claims Act. Under the False Claims Act, a private litigant, termed the “relator,” may file a civil action on the United States government’s behalf against another party for violation of the statute, which, if proven, would entitle the relator to recover a portion of any amounts recovered by the government. The lawsuit alleged that the defendants violated the False Claims Act by forging and/or improperly altering USDA export certificates used from 1991 to 2002 to export beef, pork, poultry and bovine hides to foreign countries. The lawsuit sought to recover three times the actual damages allegedly sustained by the government, plus per-violation civil penalties.
On December 30, 2004, the United States District Court granted the defendants’ motions for summary judgment on all claims. The United States Court of Appeals for the Tenth Circuit reversed the summary judgment on October 12, 2006 and remanded the case to the trial court for further proceedings consistent with the court’s opinion. Defendants filed a Motion for Rehearing En Banc on October 26, 2006. On May 10, 2007, the Tenth Circuit denied that motion.
Issues in the case were bifurcated and two separate jury trials were held, the first trial centering on beef certificates was held from April 28, 2008 to April 29, 2008 and the second trial centering on bovine hide certificates was held from March 9, 2009 to March 19, 2009. Following the April trial, a verdict with respect to the beef certificates was returned ruling in favor of the Company on all counts. Following the March trial, a verdict with respect to the bovine hide certificates was returned ruling in favor of Company on 99.5% of the claims. Specifically, Company prevailed with respect to approximately 995 bovine hide certificates and the relator prevailed with respect to only 5 certificates. Based on the False Claims Act, this verdict resulted in a judgment against the Company of $28 thousand. The court ordered that each party pay its own attorneys’ fees and costs. Plaintiff alleged that because they prevailed on 0.5% of their claims, they were entitled to the payment of their attorneys’ fees and costs, estimated at $3.0 million. In July 2009, the court denied the Company’s motion for attorney’s fees and granted Bahrani attorney’s fees in the amount of $9 thousand. Thereafter Plaintiff appealed the court’s rulings on both the hide certificates issue and the attorneys’ fees issue. The parties await final adjudication of these issues, which is expected within the next 12 months.
The Company is also a party to a number of other lawsuits and claims arising out of the operation of its businesses. Management believes the ultimate resolution of such matters should not have a material adverse effect on the Company’s financial condition, results of operations, or liquidity. Attorney fees are expensed as incurred.
F-42
Table of Contents
JBS USA Holdings, Inc.
An indirect subsidiary of JBS S.A.
Notes to condensed consolidated financial statements
Commitments
JBS USA Holdings enters into purchase agreements for livestock which require the purchase of either minimum quantities or the total production of the facility over a specified period of time. At September 27, 2009, the Company had commitments to purchase 26.1 million hogs through 2014 and approximately 2.2 million cattle over the next twelve months. As the final price paid cannot be determined until after delivery, the Company has estimated market prices based on Chicago Mercantile Exchange traded futures contracts and applied those to either the minimum quantities required per the contract or management’s estimates of livestock to be purchased under certain contracts to determine its estimated commitments for the purchase of livestock, which are as follows (in thousands):
| Estimated livestock purchase commitments for fiscal years ending December: | |||
2009 (remaining) | $ | 2,591,720 | |
2010 | 982,004 | ||
2011 | 756,642 | ||
2012 | 680,824 | ||
2013 | 464,692 | ||
Thereafter | 107,858 | ||
Through use of these contracts, the Company purchased approximately 29% and 68% of its cattle and hog slaughter needs, respectively, during the thirteen and thirty-nine weeks ended September 27, 2009.
Note 13. Business segments
JBS USA Holdings is organized into two operating segments, which are also the Company’s reportable segments: Beef and Pork. In the Beef segment, we conduct our domestic and international beef processing business, including the beef operations we acquired in the Smithfield Acquisition in 2008 and the beef, lamb, and sheep operations we acquired in the Tasman Acquisition in 2008. In the Pork segment, we conduct our domestic pork and lamb processing business. Segment operating performance is evaluated by the Chief Operating Decision Maker (“CODM”), as defined in ASC Section 280, in the Presentation—Segment Reporting topic (Prior authoritative literature: SFAS No. 131,Disclosure about Segments of an Enterprise and Related Information), based on Earnings Before Interest, Taxes, Depreciation, and Amortization (“EBITDA”). EBITDA is not intended to represent cash from operations as defined by GAAP and should not be considered as an alternative to cash flow or operating income as measured by GAAP. JBS USA Holdings believes EBITDA provides useful information about operating performance, leverage, and liquidity. The accounting policies of the segments are consistent with those described in Note 4. All inter-segment sales and transfers are eliminated in consolidation.
On November 5, 2008, the Company entered into a new Credit Agreement (see Note 7). The definition of EBITDA contained in that agreement requires EBITDA to be calculated as net income adding back taxes, depreciation, amortization and interest and excluding certain non-cash items
F-43
Table of Contents
JBS USA Holdings, Inc.
An indirect subsidiary of JBS S.A.
Notes to condensed consolidated financial statements
and gain (loss) on sale of fixed assets which affect net income. The Company has changed its definition of EBITDA to align with the definition contained in that agreement and as such the amounts below reflect the new definition.
Beef—The majority of Beef’s revenues are generated from US and Australian sales of fresh meat, which include chuck cuts, rib cuts, loin cuts, round cuts, thin meats, ground beef, and other products. In addition, Beef also sells beef by-products to the variety meat, feed processing, fertilizer, automotive, and pet food industries. Furthermore, Australia’s Foods Division produces value-added meat products including toppings for pizzas. On May 2, 2008, JBS Southern completed the Tasman Acquisition, after which it operated six processing facilities and one feedlot which are reported in the Beef segment (see Note 2). On October 23, 2008, the Company completed the Smithfield Acquisition adding four plants and eleven feedlots which are reported in the Beef segment (see Note 3).
Pork—A significant portion of Pork’s revenues are generated from the sale of products predominantly to retailers of fresh pork including trimmed cuts such as loins, roasts, chops, butts, picnics, and ribs. Other pork products, including hams, bellies, and trimmings are sold predominantly to further processors who, in turn, manufacture bacon, sausage, and deli and luncheon meats. The remaining sales are derived from by-products and from further-processed, higher-margin products. The lamb slaughter facility is included in Pork and accounts for less than 1% of total net sales.
Corporate and Other—Includes certain revenues, expenses, and assets not directly attributable to the primary segments, as well as eliminations resulting from the consolidation process.
F-44
Table of Contents
JBS USA Holdings, Inc.
An indirect subsidiary of JBS S.A.
Notes to condensed consolidated financial statements
| Thirteen weeks ended | Thirty-nine weeks ended | |||||||||||||||
| September 28, 2008 | September 27, 2009 | September 28, 2008 | September 27, 2009 | |||||||||||||
| (in thousands) | (in thousands) | (in thousands) | (in thousands) | |||||||||||||
Net sales | ||||||||||||||||
Beef | $ | 2,686,121 | $ | 2,843,355 | $ | 7,169,178 | $ | 8,415,311 | ||||||||
Pork | 682,158 | 559,282 | 1,837,586 | 1,639,365 | ||||||||||||
Corporate and other | (14,637 | ) | (18,217 | ) | (34,509 | ) | (43,522 | ) | ||||||||
Total | $ | 3,353,642 | $ | 3,384,420 | $ | 8,972,255 | $ | 10,011,154 | ||||||||
Depreciation and amortization | ||||||||||||||||
Beef | $ | 16,200 | $ | 27,135 | $ | 46,735 | $ | 89,429 | ||||||||
Pork | 6,479 | 6,761 | 17,017 | 26,283 | ||||||||||||
Total | $ | 22,679 | $ | 33,896 | $ | 63,752 | $ | 115,712 | ||||||||
EBITDA | ||||||||||||||||
Beef | $ | 140,076 | $ | 108,413 | $ | 246,776 | $ | 272,642 | ||||||||
Pork | 52,607 | 15,320 | 88,120 | 47,520 | ||||||||||||
Corporate (1) | — | (778 | ) | — | (21,782 | ) | ||||||||||
Total | 192,683 | 122,955 | 334,896 | 298,380 | ||||||||||||
Depreciation and amortization | (22,679 | ) | (33,896 | ) | (63,752 | ) | (115,712 | ) | ||||||||
Interest expense, net | (8,872 | ) | (28,090 | ) | (23,287 | ) | (69,515 | ) | ||||||||
Foreign currency transaction gains (losses) | (42,758 | ) | 16,283 | (17,572 | ) | 60,867 | ||||||||||
Gain on sales of property, plant and equipment | 128 | 14 | 233 | 181 | ||||||||||||
Income before income tax expense | 118,502 | 77,266 | 230,518 | 174,201 | ||||||||||||
Income tax expense | (34,554 | ) | (25,696 | ) | (74,267 | ) | (58,236 | ) | ||||||||
Net income | $ | 83,948 | $ | 51,570 | $ | 156,251 | $ | 115,965 | ||||||||
| (1) | On February 18, 2009, an agreement was reached with the sellers of National Beef whereby JBS USA Holdings terminated the acquisition process of National Beef effective February 23, 2009. All related litigation with the Department of Justice was terminated. As a result of the agreement, JBS USA Holdings reimbursed the seller’s shareholders a total of $19.9 million as full and final settlement of any and all liabilities related to the potential acquisition. This payment including related legal costs is reflected in the Corporate and other segment for the thirty-nine weeks ended September 27, 2009. Also included are legal expenses incurred for the pending PPC Agreement (see Note 15). |
Capital expenditures by segment (in thousands):
| Thirteen weeks ended | Thirty-nine weeks ended | |||||||||||
| September 28, 2008 | September 27, 2009 | September 28, 2008 | September 27, 2009 | |||||||||
Capital expenditures | ||||||||||||
Beef | $ | 26,021 | $ | 35,918 | $ | 49,076 | $ | 90,523 | ||||
Pork | 9,565 | 4,036 | 19,328 | 17,627 | ||||||||
Total | $ | 35,586 | $ | 39,954 | $ | 68,404 | $ | 108,150 | ||||
F-45
Table of Contents
JBS USA Holdings, Inc.
An indirect subsidiary of JBS S.A.
Notes to condensed consolidated financial statements
Sales by geographical area based on the location of the facility recognizing the sale (in thousands):
| Thirteen weeks ended | Thirty-nine weeks ended | |||||||||||
September 28, 2008 | September 27, 2009 | September 28, 2008 | September 27, 2009 | |||||||||
Net sales | ||||||||||||
United States | $ | 2,832,994 | $ | 2,807,327 | $ | 7,594,526 | $ | 8,504,486 | ||||
Australia | 520,648 | 577,093 | 1,377,729 | 1,506,668 | ||||||||
Total | $ | 3,353,642 | $ | 3,384,420 | $ | 8,972,255 | $ | 10,011,154 | ||||
Sales to unaffiliated customers by location of customer (in thousands):
| Thirteen weeks ended | Thirty-nine weeks ended | |||||||||||
September 28, 2008 | September 27, 2009 | September 28, 2008 | September 27, 2009 | |||||||||
United States | $ | 2,303,545 | $ | 2,447,398 | $ | 6,154,212 | $ | 7,562,785 | ||||
Japan | 225,063 | 232,560 | 601,605 | 593,774 | ||||||||
Australia | 135,059 | 163,391 | 448,000 | 427,646 | ||||||||
Mexico | 158,251 | 86,338 | 419,371 | 270,075 | ||||||||
Korea | 64,271 | 64,749 | 203,634 | 204,186 | ||||||||
Other | 467,453 | 389,984 | 1,145,433 | 952,688 | ||||||||
Total | $ | 3,353,642 | $ | 3,384,420 | $ | 8,972,255 | $ | 10,011,154 | ||||
No single customer or supplier accounted for more than 5% of net sales or cost of goods sold during the thirteen and thirty-nine weeks ended September 28, 2008 and September 27, 2009, respectively.
Total assets by segments (in thousands):
| December 28, 2008 | September 27, 2009 | ||||||
Total assets | |||||||
Beef | $ | 2,909,176 | $ | 3,025,904 | |||
Pork | 458,725 | 434,541 | |||||
Corporate and other | (52,330 | ) | 65,437 | ||||
Total | $ | 3,315,571 | $ | 3,525,882 | |||
Long-lived tangible assets by location of assets (in thousands):
| December 28, 2008 | September 27, 2009 | |||||
Long-lived assets: | ||||||
United States | $ | 906,044 | $ | 994,940 | ||
Australia | 360,400 | 463,900 | ||||
Other | 83 | 97 | ||||
Total | $ | 1,266,527 | $ | 1,458,937 | ||
F-46
Table of Contents
JBS USA Holdings, Inc.
An indirect subsidiary of JBS S.A.
Notes to condensed consolidated financial statements
Long-lived assets consist of (1) property, plant, and equipment, net of depreciation, (2) notes receivable, (3) deferred income tax assets, and (4) other assets less debt issuance costs of $12.5 million and $13.8 million as of December 28, 2008 and September 27, 2009, respectively.
Note 14. Supplemental guarantor information
JBS USA Holdings’ income and cash flow is generated by its subsidiaries. As a result, funds necessary to meet the Company’s debt service obligations, including its obligations as Guarantor under the senior unsecured notes due 2014 of its subsidiary JBS USA (see Note 7) are provided in large part by distributions or advances from its subsidiaries. Under certain circumstances, contractual and legal restrictions, as well as JBS USA Holdings’ financial condition and operating requirements and those of certain domestic subsidiaries could limit the Company’s ability to obtain cash for the purpose of meeting its debt service obligations including the payment of principal and interest on the senior unsecured notes due 2014.
The following condensed consolidating financial statements set forth JBS USA Holdings’ Condensed Consolidating Balance Sheets as of December 28, 2008 and September 27, 2009, Condensed Consolidating Statements of Operations for the thirteen and thirty-nine weeks ended September 28, 2008 and September 27, 2009 and Condensed Consolidating Statements of Cash Flows for the thirty-nine weeks ended September 28, 2008 and September 27, 2009. Effective with the date of issuance, JBS USA’s senior unsecured notes due 2014 have been guaranteed by JBS USA Holdings (the “Parent Guarantor”), JBS USA (the “Issuer”) and each of JBS USA Holdings’ domestic subsidiaries (the “Subsidiary Guarantors”), excluding JBS Five Rivers. The financial information is presented under the following column headings: Parent Guarantor, Issuer, Subsidiary Guarantors, and “Subsidiary Non-Guarantors”. Subsidiary Non-Guarantors include the foreign subsidiaries of JBS USA Holdings, which include Swift Refrigerated Foods S.A. de C.V., Kabushiki Kaisha SAC Japan, Swift Australia Pty. Ltd, and the domestic subsidiary, JBS Five Rivers. For purposes of this supplemental presentation, investments in JBS USA Holdings’ subsidiaries are accounted for using the equity method. Accordingly, entries necessary to consolidate the Parent Guarantor, the Issuer, and all of its subsidiaries are reflected in the eliminations column. Separate complete financial statements of the Issuer and the Subsidiary Guarantors would not provide additional material information that would be useful in assessing the financial composition of the Issuer or the Subsidiary Guarantors.
All of the Subsidiary Guarantors are wholly-owned subsidiaries of JBS USA and their guarantees are full and unconditional, and joint and several. There are no provisions in the indentures governing the senior unsecured notes due 2014 or other existing agreements that would prevent holders of guaranteed obligations from taking immediate action against the Parent Guarantor or any Subsidiary Guarantor in the event of default. The ability of the Subsidiary Guarantors to pay dividends or make loans or other payments to JBS USA Holdings depends on their earnings, capital requirements, and general financial condition. The Parent Guarantor is a holding company with no operations of its own, and its assets consist of financing costs associated with, and the member’s interest of, JBS USA. Consequently, its ability to pay amounts under its guarantee depends on the earnings and cash flows of JBS USA and its subsidiaries and the ability of these entities to pay dividends or advance funds to the Parent Guarantor.
F-47
Table of Contents
JBS USA Holdings, Inc.
An indirect subsidiary of JBS S.A.
Notes to condensed consolidated financial statements
Condensed consolidating balance sheet
December 28, 2008
(in thousands)
| JBS USA Holdings parent guarantor | JBS USA, issuer | Subsidiary guarantors | Subsidiary guarantors | Eliminations/ adjustments | Total | ||||||||||||||
Assets | |||||||||||||||||||
Current assets: | |||||||||||||||||||
Cash and cash equivalents | $ | 36 | $ | 32,096 | $ | 4,372 | $ | 218,281 | $ | — | $ | 254,785 | |||||||
Accounts receivables, net | — | 100,752 | 404,446 | 181,324 | (97,537 | ) | 588,985 | ||||||||||||
Net intercompany receivables | — | 898,384 | — | 21,786 | (920,170 | ) | — | ||||||||||||
Inventories, net | — | — | 449,983 | 208,304 | — | 658,287 | |||||||||||||
Deferred income taxes, net | — | — | 14,544 | 21 | (9,160 | ) | 5,405 | ||||||||||||
Other current assets | 373 | 12,417 | 87,384 | 14,972 | (38,912 | ) | 76,234 | ||||||||||||
Total current assets | 409 | 1,043,649 | 960,729 | 644,688 | (1,065,779 | ) | 1,583,696 | ||||||||||||
Property, plant and equipment, net | — | — | 810,684 | 418,632 | — | 1,229,316 | |||||||||||||
Notes receivable | — | — | 1,541 | 89 | — | 1,630 | |||||||||||||
Other assets | 11,640 | 104,661 | 432,888 | 66,344 | (114,604 | ) | 500,929 | ||||||||||||
Net investment in and advances to subsidiaries | 2,322,622 | 1,410,127 | — | — | (3,732,749 | ) | — | ||||||||||||
Total assets | $ | 2,334,671 | $ | 2,558,437 | $ | 2,205,842 | $ | 1,129,753 | $ | (4,913,132 | ) | $ | 3,315,571 | ||||||
Liabilities and stockholder’s equity | |||||||||||||||||||
Current liabilities: | |||||||||||||||||||
Short-term debt | $ | — | $ | — | $ | — | $ | 67,012 | $ | — | $ | 67,012 | |||||||
Current portion of long-term debt | — | 920 | 2,028 | 1,551 | — | 4,499 | |||||||||||||
Current portion of deferred revenue | 10,400 | 302 | 24,916 | 2,601 | — | 38,219 | |||||||||||||
Net intercompany payables | — | — | 920,170 | — | (920,170 | ) | — | ||||||||||||
Accounts payable | 96,291 | — | 112,354 | 81,397 | (97,345 | ) | 192,697 | ||||||||||||
Book overdraft | — | 8,377 | 134,878 | 17,277 | — | 160,532 | |||||||||||||
Deferred income taxes, net | 1,182 | 7,977 | — | 8,587 | (9,159 | ) | 8,587 | ||||||||||||
Accrued liabilities | 17,366 | 81,246 | 157,353 | 66,209 | (39,105 | ) | 283,069 | ||||||||||||
Total current liabilities | 125,239 | 98,822 | 1,351,699 | 244,634 | (1,065,779 | ) | 754,615 | ||||||||||||
Long-term debt, excluding current portion | 658,588 | 123,968 | 21,960 | 2,292 | — | 806,808 | |||||||||||||
Deferred revenue, excluding current portion | 162,594 | 8 | 462 | — | — | 163,064 | |||||||||||||
Deferred income taxes, net | — | — | 263,890 | 1,384 | (114,604 | ) | 150,670 | ||||||||||||
Other non-current liabilities | — | 13,017 | 17,656 | 21,491 | — | 52,164 | |||||||||||||
Total liabilities | 946,421 | 235,815 | 1,655,667 | 269,801 | (1,180,383 | ) | 1,927,321 | ||||||||||||
Total stockholder’s equity | 1,388,250 | 2,322,622 | 550,175 | 859,952 | (3,732,749 | ) | 1,388,250 | ||||||||||||
Total liabilities and stockholder’s equity | $ | 2,334,671 | $ | 2,558,437 | $ | 2,205,842 | $ | 1,129,753 | $ | (4,913,132 | ) | $ | 3,315,571 | ||||||
F-48
Table of Contents
JBS USA Holdings, Inc.
An indirect subsidiary of JBS S.A.
Notes to condensed consolidated financial statements
Condensed consolidating balance sheet
September 27, 2009
(in thousands)
| JBS USA Holdings parent guarantor | JBS USA, issuer | Subsidiary guarantors | Subsidiary non- guarantors | Eliminations/ adjustments | Total | |||||||||||||||
Assets | ||||||||||||||||||||
Current assets: | ||||||||||||||||||||
Cash and cash equivalents | $ | 85 | $ | 45,650 | $ | 6,272 | $ | 53,733 | $ | — | $ | 105,740 | ||||||||
Accounts receivables, net | — | 247,325 | 396,542 | 202,178 | (238,887 | ) | 607,158 | |||||||||||||
Net intercompany receivables | — | 714,039 | (756,933 | ) | 42,894 | — | — | |||||||||||||
Inventories, net | — | — | 423,815 | 255,436 | — | 679,251 | ||||||||||||||
Deferred income taxes, net | — | — | 14,380 | 21 | (9,159 | ) | 5,242 | |||||||||||||
Other current assets | 14,563 | 122,499 | 63,458 | 8,598 | (50,477 | ) | 158,641 | |||||||||||||
Total current assets | 14,648 | 1,129,513 | 147,534 | 562,860 | (298,523 | ) | 1,556,032 | |||||||||||||
Property, plant and equipment, net | — | — | 691,701 | 541,055 | — | 1,232,756 | ||||||||||||||
Notes receivable | — | 895,000 | 1,237 | 174,081 | (895,000 | ) | 175,318 | |||||||||||||
Other assets | 16,883 | 68,871 | 458,255 | 99,965 | (82,198 | ) | 561,776 | |||||||||||||
Net investment in and advances to subsidiaries | 1,989,392 | 736,175 | — | — | (2,725,567 | ) | — | |||||||||||||
Total assets | $ | 2,020,923 | $ | 2,829,559 | $ | 1,298,727 | $ | 1,377,961 | $ | (4,001,288 | ) | $ | 3,525,882 | |||||||
Liabilities and stockholder’s equity | ||||||||||||||||||||
Current liabilities: | ||||||||||||||||||||
Short-term debt | $ | — | $ | — | $ | — | $ | 29,955 | $ | — | $ | 29,955 | ||||||||
Current portion of long-term debt | — | 920 | 1,615 | 1,926 | — | 4,461 | ||||||||||||||
Current portion of deferred revenue | 10,400 | 87 | 843 | 7,244 | — | 18,574 | ||||||||||||||
Accounts payable | 184,590 | 8 | 86,829 | 128,064 | (184,590 | ) | 214,901 | |||||||||||||
Book overdraft | — | 5,507 | 110,849 | 12,752 | — | 129,108 | ||||||||||||||
Deferred income taxes, net | 1,182 | 7,977 | — | 10,923 | (9,159 | ) | 10,923 | |||||||||||||
Accrued liabilities | 2,821 | 125,621 | 247,476 | 113,636 | (104,774 | ) | 384,780 | |||||||||||||
Total current liabilities | 198,993 | 140,120 | 447,612 | 304,500 | (298,523 | ) | 792,702 | |||||||||||||
Long-term debt, excluding current portion | 95,079 | 664,046 | 922,442 | 1,385 | (895,000 | ) | 787,952 | |||||||||||||
Deferred revenue, excluding current portion | 150,213 | — | 162 | — | — | 150,375 | ||||||||||||||
Deferred income taxes, net | — | — | 208,458 | 16,599 | (82,198 | ) | 142,859 | |||||||||||||
Other non-current liabilities | — | 36,001 | 12,461 | 26,894 | — | 75,356 | ||||||||||||||
Total liabilities | 444,285 | 840,167 | 1,591,135 | 349,378 | (1,275,721 | ) | 1,949,244 | |||||||||||||
Total stockholder’s equity | 1,576,638 | 1,989,392 | (292,408 | ) | 1,028,583 | (2,725,567 | ) | 1,576,638 | ||||||||||||
Total liabilities and stockholder’s equity | $ | 2,020,923 | $ | 2,829,559 | $ | 1,298,727 | $ | 1,377,961 | $ | (4,001,288 | ) | $ | 3,525,882 | |||||||
F-49
Table of Contents
JBS USA Holdings, Inc.
An indirect subsidiary of JBS S.A.
Notes to condensed consolidated financial statements
Condensed consolidating statements of operations
Thirteen weeks ended September 28, 2008
(in thousands)
| JBS USA Holdings parent guarantor | JBS USA, issuer | Subsidiary guarantors | Subsidiary guarantors | Eliminations/ adjustments | Total | ||||||||||||||||||
Net sales | $ | — | $ | — | $ | 2,726,452 | $ | 627,190 | $ | — | $ | 3,353,642 | |||||||||||
Cost of goods sold | — | — | 2,565,007 | 589,618 | — | 3,154,625 | |||||||||||||||||
Gross profit | — | — | 161,445 | 37,572 | — | 199,017 | |||||||||||||||||
Selling, general and administrative expenses | — | — | 25,898 | 6,571 | — | 32,469 | |||||||||||||||||
Foreign currency transaction losses | — | — | 31 | 42,727 | — | 42,758 | |||||||||||||||||
Other income, net | — | — | (2,242 | ) | (1,214 | ) | — | (3,456 | ) | ||||||||||||||
Loss (gain) on sales of property, plant and equipment | — | — | (165 | ) | 37 | — | (128 | ) | |||||||||||||||
Interest expense (income), net | 7,410 | — | (401 | ) | 1,863 | — | 8,872 | ||||||||||||||||
Income (loss) before income taxes | (7,410 | ) | — | 138,324 | (12,412 | ) | — | 118,502 | |||||||||||||||
Income tax expense (benefit) | 6,436 | — | 33,543 | (5,425 | ) | — | 34,554 | ||||||||||||||||
Income (loss) before equity in earnings of consolidated subsidiaries | (13,846 | ) | — | 104,781 | (6,987 | ) | — | 83,948 | |||||||||||||||
Equity in earnings of consolidated subsidiaries | 97,794 | 97,794 | — | — | (195,588 | ) | — | ||||||||||||||||
Net income (loss) | $ | 83,948 | $ | 97,794 | $ | 104,781 | $ | (6,987 | ) | $ | (195,588 | ) | $ | 83,948 | |||||||||
F-50
Table of Contents
JBS USA Holdings, Inc.
An indirect subsidiary of JBS S.A.
Notes to condensed consolidated financial statements
Condensed consolidating statements of operations
Thirteen weeks ended September 27, 2009
(in thousands)
| JBS USA Holdings parent guarantor | JBS USA, Issuer | Subsidiary guarantors | Subsidiary guarantors | Eliminations/ adjustments | Total | ||||||||||||||||||
Net sales | $ | — | $ | — | $ | 2,700,013 | $ | 684,407 | $ | — | $ | 3,384,420 | |||||||||||
Cost of goods sold | — | — | 2,582,816 | 674,882 | — | 3,257,698 | |||||||||||||||||
Gross profit | — | — | 117,197 | 9,525 | — | 126,722 | |||||||||||||||||
Selling, general and administrative expenses | 778 | — | 29,177 | 9,245 | — | 39,200 | |||||||||||||||||
Foreign currency transaction gains | — | — | (1 | ) | (16,282 | ) | — | (16,283 | ) | ||||||||||||||
Other income, net | — | — | (817 | ) | (720 | ) | — | (1,537 | ) | ||||||||||||||
Loss (gain) on sales of property, plant and equipment | — | — | (61 | ) | 47 | — | (14 | ) | |||||||||||||||
Interest expense (income), net | 3,915 | — | 25,577 | (1,402 | ) | — | 28,090 | ||||||||||||||||
Income (loss) before income taxes | (4,693 | ) | — | 63,322 | 18,637 | — | 77,266 | ||||||||||||||||
Income tax expense (benefit) | (2,345 | ) | — | 21,439 | 6,602 | — | 25,696 | ||||||||||||||||
Income (loss) before equity in earnings of consolidated subsidiaries | (2,348 | ) | — | 41,883 | 12,035 | — | 51,570 | ||||||||||||||||
Equity in earnings of consolidated subsidiaries | 53,918 | 53,918 | — | — | (107,836 | ) | — | ||||||||||||||||
Net income | $ | 51,570 | $ | 53,918 | $ | 41,883 | $ | 12,035 | $ | (107,836 | ) | $ | 51,570 | ||||||||||
F-51
Table of Contents
JBS USA Holdings, Inc.
An indirect subsidiary of JBS S.A.
Notes to condensed consolidated financial statements
Condensed consolidating statements of operations
Thirty-nine weeks ended September 28, 2008
(in thousands)
JBS USA Holdings | JBS USA, issuer | Subsidiary guarantors | Subsidiary non- guarantors | Eliminations/ adjustments | Total | ||||||||||||||||||
Net sales | $ | — | $ | — | $ | 7,289,253 | $ | 1,683,002 | $ | — | $ | 8,972,255 | |||||||||||
Cost of goods sold | — | 7,014,784 | 1,597,806 | — | 8,612,590 | ||||||||||||||||||
Gross profit | — | — | 274,469 | 85,196 | — | 359,665 | |||||||||||||||||
Selling, general and administrative expenses | — | — | 81,419 | 16,877 | — | 98,296 | |||||||||||||||||
Foreign currency transaction losses | — | — | 23 | 17,549 | — | 17,572 | |||||||||||||||||
Other income, net | — | — | (7,900 | ) | (1,875 | ) | — | (9,775 | ) | ||||||||||||||
Loss (gain) on sales of property, plant and equipment | — | — | (425 | ) | 192 | — | (233 | ) | |||||||||||||||
Interest expense (income), net | 21,557 | — | (899 | ) | 2,629 | — | 23,287 | ||||||||||||||||
Income (loss) before income taxes | (21,557 | ) | — | 202,251 | 49,824 | — | 230,518 | ||||||||||||||||
Income tax expense | 625 | — | 64,112 | 9,530 | — | 74,267 | |||||||||||||||||
Income (loss) before equity in earnings of consolidated subsidiaries | (22,182 | ) | — | 138,139 | 40,294 | — | 156,251 | ||||||||||||||||
Equity in earnings of consolidated subsidiaries | 178,433 | 178,433 | — | — | (356,866 | ) | — | ||||||||||||||||
Net income | $ | 156,251 | $ | 178,433 | $ | 138,139 | $ | 40,294 | $ | (356,866 | ) | $ | 156,251 | ||||||||||
F-52
Table of Contents
JBS USA Holdings, Inc.
An indirect subsidiary of JBS S.A.
Notes to condensed consolidated financial statements
Condensed consolidating statements of operations
Thirty-nine weeks ended September 27, 2009
(in thousands)
| JBS USA Holdings parent guarantor | JBS USA, issuer | Subsidiary guarantors | Subsidiary guarantors | Eliminations/ adjustments | Total | ||||||||||||||||||
Net sales | $ | — | $ | — | $ | 8,138,749 | $ | 1,872,405 | $ | — | $ | 10,011,154 | |||||||||||
Cost of goods sold | — | — | 7,849,647 | 1,824,028 | — | 9,673,675 | |||||||||||||||||
Gross profit | — | — | 289,102 | 48,377 | — | 337,479 | |||||||||||||||||
Selling, general and administrative expenses | 21,782 | — | 108,591 | 28,067 | — | 158,440 | |||||||||||||||||
Foreign currency transaction gains | — | — | (83 | ) | (60,784 | ) | — | (60,867 | ) | ||||||||||||||
Other income, net | — | — | (1,972 | ) | (1,657 | ) | — | (3,629 | ) | ||||||||||||||
Loss (gain) on sales of property, plant and equipment | — | — | (370 | ) | 189 | — | (181 | ) | |||||||||||||||
Interest expense (income), net | 25,868 | — | 46,950 | (3,303 | ) | — | 69,515 | ||||||||||||||||
Income (loss) before income taxes | (47,650 | ) | — | 135,986 | 85,865 | — | 174,201 | ||||||||||||||||
Income tax expense (benefit) | (18,134 | ) | — | 51,974 | 24,396 | — | 58,236 | ||||||||||||||||
Income (loss) before equity in earnings of consolidated subsidiaries | (29,516 | ) | — | 84,012 | 61,469 | — | 115,965 | ||||||||||||||||
Equity in earnings of consolidated subsidiaries | 145,481 | 145,481 | — | — | (290,962 | ) | — | ||||||||||||||||
Net income | $ | 115,965 | $ | 145,481 | $ | 84,012 | $ | 61,469 | $ | (290,962 | ) | $ | 115,965 | ||||||||||
F-53
Table of Contents
JBS USA Holdings, Inc.
An indirect subsidiary of JBS S.A.
Notes to condensed consolidated financial statements
Condensed consolidating statement of cash flows
Thirty-nine weeks ended September 28, 2008
(in thousands)
| JBS USA Holdings parent guarantor | JBS USA, issuer | Subsidiary guarantors | Subsidiary guarantors | Eliminations/ adjustments | Total | |||||||||||||||||||
Net cash provided by (used in) operating activities | $ | (29,985 | ) | $ | (136 | ) | $ | (7,424 | ) | $ | 87,225 | $ | — | $ | 49,680 | |||||||||
Cash flows from investing activities: | — | |||||||||||||||||||||||
Purchases of property, plant and equipment | — | — | (47,668 | ) | (20,736 | ) | — | (68,404 | ) | |||||||||||||||
Proceeds from sales of property, plant and equipment | — | — | 292 | 123 | — | 415 | ||||||||||||||||||
Proceeds from sale of non-operating real property | — | — | 2,537 | — | — | 2,537 | ||||||||||||||||||
Investment activity with subsidiaries | (170,015 | ) | (102,838 | ) | — | — | 272,853 | — | ||||||||||||||||
Costs associated with acquisition by parent, net of cash acquired | — | — | — | (107,728 | ) | — | (107,728 | ) | ||||||||||||||||
Net cash used in investing activities | (170,015 | ) | (102,838 | ) | (44,839 | ) | (128,341 | ) | 272,853 | (173,180 | ) | |||||||||||||
Cash flows from financing activities: | ||||||||||||||||||||||||
Net payments of revolving credit facility | — | — | — | (14,030 | ) | — | (14,030 | ) | ||||||||||||||||
Payments of short-term debt | (750,000 | ) | — | — | — | — | (750,000 | ) | ||||||||||||||||
Proceeds from debt issuance | 500,000 | — | — | — | — | 500,000 | ||||||||||||||||||
Payments of long-term debt and capital lease obligations | — | (467 | ) | (995 | ) | (636 | ) | — | (2,098 | ) | ||||||||||||||
Change in book overdraft | — | (5,218 | ) | 13,846 | — | — | 8,628 | |||||||||||||||||
Capital contributions | 450,000 | 200,000 | — | 102,838 | (302,838 | ) | 450,000 | |||||||||||||||||
Dividend to parent | — | (29,985 | ) | — | — | 29,985 | — | |||||||||||||||||
Net investments and advances (distributions) | — | (18,941 | ) | 38,585 | (19,644 | ) | — | — | ||||||||||||||||
Net cash provided by financing activities | 200,000 | 145,389 | 51,436 | 68,528 | (272,853 | ) | 192,500 | |||||||||||||||||
Effect of exchange rate changes on cash | — | — | — | 231 | — | 231 | ||||||||||||||||||
Net change in cash and cash equivalents | — | 42,415 | (827 | ) | 27,643 | — | 69,231 | |||||||||||||||||
Cash and cash equivalents, beginning of period | 36 | 184,012 | 2,048 | 12,787 | — | 198,883 | ||||||||||||||||||
Cash and cash equivalents, end of period | $ | 36 | $ | 226,427 | $ | 1,221 | $ | 40,430 | $ | — | $ | 268,114 | ||||||||||||
F-54
Table of Contents
JBS USA Holdings, Inc.
An indirect subsidiary of JBS S.A.
Notes to condensed consolidated financial statements
Statement of cash flows
Thirty-nine weeks ended September 27, 2009
(in thousands)
| JBS USA Holdings parent guarantor | JBS USA, issuer | Subsidiary guarantors | Subsidiary guarantors | Eliminations/ adjustments | Total | ||||||||||||||||||
Net cash provided by (used in) operating activities | $ | (31,377 | ) | $ | (86,810 | ) | $ | 187,593 | $ | 120,201 | $ | — | $ | 189,607 | |||||||||
Cash flows from investing activities: | |||||||||||||||||||||||
Purchases of property, plant and equipment | — | — | (63,682 | ) | (44,468 | ) | — | (108,150 | ) | ||||||||||||||
Proceeds from sales of property, plant, and equipment | — | — | 797 | 139 | — | 936 | |||||||||||||||||
Purchases of bonds | — | — | (6,000 | ) | — | — | (6,000 | ) | |||||||||||||||
Issuance of notes receivable and other | — | — | — | (173,992 | ) | — | (173,992 | ) | |||||||||||||||
Net cash used in investing activities | — | — | (68,885 | ) | (218,321 | ) | — | (287,206 | ) | ||||||||||||||
Cash flows from financing activities: | |||||||||||||||||||||||
Net payments of revolving credit facility | — | (114,673 | ) | — | (43,313 | ) | — | (157,986 | ) | ||||||||||||||
Payments of short-term debt | — | — | (257 | ) | (116 | ) | — | (373 | ) | ||||||||||||||
Proceeds from debt issuance | — | 651,322 | — | — | — | 651,322 | |||||||||||||||||
Payments of long term debt and capital lease obligations | (519,597 | ) | (690 | ) | (2,216 | ) | (1,290 | ) | — | (523,793 | ) | ||||||||||||
Cash paid for debt issuance | — | (4,783 | ) | — | — | — | (4,783 | ) | |||||||||||||||
Change in book overdraft | — | (2,871 | ) | (24,027 | ) | (4,526 | ) | — | (31,424 | ) | |||||||||||||
Return of cash deposit | — | 11,915 | — | — | — | 11,915 | |||||||||||||||||
Distribution to parent | 551,023 | (551,023 | ) | — | — | — | — | ||||||||||||||||
Net investments and advances (distributions) | — | 111,167 | (90,308 | ) | (20,859 | ) | — | — | |||||||||||||||
Net cash provided by (used in) financing activities | 31,426 | 100,364 | (116,808 | ) | (70,104 | ) | — | (55,122 | ) | ||||||||||||||
Effect of exchange rate changes on cash | — | — | — | 3,676 | — | 3,676 | |||||||||||||||||
Net change in cash and cash equivalents | 49 | 13,554 | 1,900 | (164,548 | ) | — | (149,045 | ) | |||||||||||||||
Cash and cash equivalents, beginning of period | 36 | 32,096 | 4,372 | 218,281 | — | 254,785 | |||||||||||||||||
Cash and cash equivalents, end of period | $ | 85 | $ | 45,650 | $ | 6,272 | $ | 53,733 | $ | — | $ | 105,740 | |||||||||||
F-55
Table of Contents
JBS USA Holdings, Inc.
An indirect subsidiary of JBS S.A.
Notes to condensed consolidated financial statements
Note 15. Pending acquisition
On September 16, 2009, JBS USA Holdings and Pilgrim’s Pride Corporation (“PPC”) entered into a stock purchase agreement (“PPC Agreement”). Pursuant to the PPC Agreement, JBS USA Holdings will purchase 64% of PPC for $800.0 million. The PPC Agreement may be terminated under certain circumstances, including mutual written consent of both PPC and JBS USA Holdings. The PPC Agreement also remains subject to approval by the US Bankruptcy Court for the Northern District of Texas. The costs incurred in conjunction with the PPC Agreement were $0.8 million for the thirteen and thirty-nine weeks ended September 27, 2009.
Note 16. Subsequent events
On September 28, 2009, a distribution of $0.3 million was paid to JBS USA Holdings by JBS USA to enable JBS USA Holdings to pay legal fees associated with the pending acquisition of PPC (see Note 15).
On September 29, 2009 the Company announced the intent to merge the Five Rivers 401 (K) Plan into the existing JBS USA Plans for union and non-union employees described above effective January 1, 2010 (see Note 8).
Between October 1, 2009 and October 6, 2009, JBS USA purchased $2.0 million of the City of Cactus Bonds (see Note 4).
On October 26, 2009, JBS USA extended to Swift Australia a loan in the amount of $37.0 million. While this loan will eliminate on consolidation, this loan is denominated in USD, but reported by our Australian subsidiary. The loan will generate foreign currency transaction gains or losses depending on fluctuations in the period end AUD to USD exchange rate.
On November 30, 2009, JBS USA, LLC extended the secured credit/multi-option bridge facility to expire on January 31, 2010. In addition to the extension, the commitment fee of 1.4% will be replaced with 2.25% per annum, effective on December 1, 2009 (See Note 7).
In December 2009, JBS USA, LLC and Marox GmbH (a Vion group company) entered into an agreement to purchase 100% of the shares in Tatiara Meat Company for $27.5 million subject to a working capital adjustment. The agreement remains subject to conclusion of the due diligence process and approval by the Australian Competition and Consumer Commission.
On December 23, 2009, JBS USA Holdings, Inc. announced its intention to issue 33 1/3 new shares of its common stock to JBS S.A. in consideration of $2.0 billion.
We have evaluated all subsequent events through October 30, 2009, the date the condensed consolidated financial statements were issued and December 23, 2009, the date they were re-issued in connection with the filing of Amendment 2 of the Company’s Registration Statement on Form S-1.
F-56
Table of Contents
| 700 North Pearl, Suite 2000 Dallas, Texas 75201 Telephone: 214-969-7007 Fax: 214-953-0722 | |||
JBS USA Holdings, Inc.
Greeley, Colorado
We have audited the accompanying consolidated balance sheet of JBS USA Holdings, Inc. as of December 28, 2008 and the related consolidated statements of operations, stockholder’s equity, and cash flows for the year then ended. These financial statements are the responsibility of the Company’s management. Our responsibility is to express an opinion on these financial statements based on our audit.
We conducted our audit in accordance with the auditing standards of the Public Company Accounting Oversight Board (United States). Those standards require that we plan and perform the audit to obtain reasonable assurance about whether the financial statements are free of material misstatement. An audit includes consideration of internal control over financial reporting as a basis for designing audit procedures that are appropriate in the circumstances, but not for the purpose of expressing an opinion on the effectiveness of the Company’s internal control over financial reporting. Accordingly, we express no such opinion. An audit also includes examining, on a test basis, evidence supporting the amounts and disclosures in the financial statements, assessing the accounting principles used and significant estimates made by management, as well as evaluating the overall financial statement presentation. We believe that our audit provides a reasonable basis for our opinion.
In our opinion, the consolidated financial statements referred to above present fairly, in all material respects, the financial position of JBS USA Holdings, Inc. at December 28, 2008, and the results of its operations and its cash flows for the year then ended in conformity with accounting principles generally accepted in the United States of America.
/S/ BDO SEIDMAN, LLP
Dallas, Texas
July 21, 2009
F-57
Table of Contents
An indirect subsidiary of JBS S.A.
Consolidated balance sheet
December 28, 2008
(dollars in thousands, except per share data)
Assets | ||||
Current assets: | ||||
Cash and cash equivalents | $ | 254,785 | ||
Accounts receivable, net of allowance for doubtful accounts of $4,142 | 568,185 | |||
Accounts receivable—related parties | 20,800 | |||
Inventories, net | 658,287 | |||
Deferred income taxes, net | 5,405 | |||
Other current assets | 76,234 | |||
Total current assets | 1,583,696 | |||
Property, plant, and equipment, net | 1,229,316 | |||
Goodwill | 147,855 | |||
Other intangibles, net | 304,967 | |||
Notes Receivable | 1,630 | |||
Deferred income taxes, net | 15,500 | |||
Other assets | 32,607 | |||
Total assets | $ | 3,315,571 | ||
Liabilities and stockholder’s equity | ||||
Current liabilities: | ||||
Short-term debt | $ | 67,012 | ||
Current portion of long-term debt | 4,499 | |||
Current portion of deferred revenue | 38,219 | |||
Accounts payable | 192,697 | |||
Book overdraft | 160,532 | |||
Deferred income taxes, net | 8,587 | |||
Accrued liabilities | 283,069 | |||
Total current liabilities | 754,615 | |||
Long-term debt, excluding current portion (see Note 8) | 806,808 | |||
Deferred revenue | 163,064 | |||
Deferred income taxes, net | 150,670 | |||
Other non-current liabilities | 52,164 | |||
Total liabilities | 1,927,321 | |||
Commitments and contingencies (see Note 13) | ||||
Stockholder’s equity: | ||||
Common stock: par value $.01 per share, 500,000,000 authorized, 100 shares issued and outstanding | — | |||
Additional paid-in capital | 1,400,159 | |||
Retained earnings | 49,512 | |||
Accumulated other comprehensive loss | (61,421 | ) | ||
Total stockholder’s equity | 1,388,250 | |||
Total liabilities and stockholder’s equity | $ | 3,315,571 | ||
The accompanying notes are an integral part of these consolidated financial statements.
F-58
Table of Contents
An indirect subsidiary of JBS S.A.
Consolidated statement of operations
For the fifty-two weeks ended December 28, 2008
(dollars in thousands, except per share data )
Gross sales (see Note 11) | $ | 12,424,274 | ||
Less deductions from sales | (61,993 | ) | ||
Net sales | 12,362,281 | |||
Cost of goods sold (see Note 11) | 11,917,777 | |||
Gross profit | 444,504 | |||
Selling, general, and administrative expenses | 148,785 | |||
Foreign currency transaction losses | 75,995 | |||
Other income, net | (10,107 | ) | ||
Loss on sales of property, plant, and equipment | 1,082 | |||
Interest expense, net | 36,358 | |||
Income before income tax expense | 192,391 | |||
Income tax expense | 31,287 | |||
Net income | $ | 161,104 | ||
Income per common share: | ||||
Basic | $ | 1,611,040.00 | ||
Diluted | $ | 1,611,040.00 | ||
Weighted average common shares: | ||||
Basic | 100 | |||
Diluted | 100 | |||
The accompanying notes are an integral part of these consolidated financial statements.
F-59
Table of Contents
An indirect subsidiary of JBS S.A.
Consolidated statement of cash flows
for the fifty-two weeks ended
December 28, 2008
(dollars in thousands)
| Cash flows from operating activities: | ||||
Net income | $ | 161,104 | ||
Adjustments to reconcile net income to net cash provided by operating activities: | ||||
Depreciation | 75,756 | |||
Amortization of intangibles | 16,618 | |||
Amortization of debt issuance costs | 1,815 | |||
Loss on sale of property, plant, and equipment | 1,082 | |||
Deferred income taxes | 5,686 | |||
Foreign currency transaction gains | (13,065 | ) | ||
Change in operating assets and liabilities, net of impact of acquisitions: | ||||
Restricted cash | 31,479 | |||
Accounts receivable, net | (74,445 | ) | ||
Inventories | (89,677 | ) | ||
Other current assets | (24,900 | ) | ||
Accounts payable and accrued liabilities | 15,928 | |||
Non-current assets | (1,513 | ) | ||
Non-current liabilities | 1,279 | |||
Deferred revenue | 175,000 | |||
Net cash provided by operating activities | 282,147 | |||
Cash flows from investing activities: | ||||
Purchases of property, plant, and equipment | (118,320 | ) | ||
Proceeds from sales of property, plant, and equipment | 530 | |||
Purchases of bonds | (1,000 | ) | ||
Proceeds from sale of non-operating real property | 2,537 | |||
Issuance of notes receivable and other | (89 | ) | ||
Purchase of acquired businesses, net of cash acquired | (667,397 | ) | ||
Net cash used in investing activities | (783,739 | ) | ||
Cash flows from financing activities: | ||||
Net borrowings under revolving credit facility | 127,926 | |||
Proceeds from debt issuance | 750,000 | |||
Payments of short-term debt | (750,106 | ) | ||
Payments of long-term debt and capital lease obligations | (3,577 | ) | ||
Change in book overdraft | 10,251 | |||
Capital contributions | 450,000 | |||
Cash paid for debt issuance | (13,229 | ) | ||
Net cash provided by financing activities | 571,265 | |||
Effect of exchange rate changes on cash | (13,771 | ) | ||
Net change in cash and cash equivalents | 55,902 | |||
Cash and cash equivalents, beginning of period | 198,883 | |||
Cash and cash equivalents, end of period | $ | 254,785 | ||
Non-cash investing and financing activities: | ||||
Construction in process under deemed capital lease (see Note 5) | $ | 9,166 | ||
Reduction of long-term debt (see Note 8) | $ | 90,910 | ||
Debt assumed from Tasman acquisition | $ | 52,137 | ||
Supplemental information: | ||||
Cash paid for interest | $ | 34,895 | ||
Cash paid for income taxes | $ | 11,735 | ||
The accompanying notes are an integral part of these consolidated financial statements.
F-60
Table of Contents
An indirect subsidiary of JBS S.A.
Consolidated statement of stockholder’s equity
For the fifty-two weeks ended December 28, 2008
(dollars in thousands)
Common outstanding | Common stock | Additional paid-in | Retained (accumulated | Accumulated comprehensive Income (loss) | Total stockholder’s equity | |||||||||||||||
Balance at December 30, 2007 | 100 | $ | — | $ | 950,159 | $ | (111,592 | ) | $ | 251 | $ | 838,818 | ||||||||
Capital contributions | — | — | 450,000 | — | — | 450,000 | ||||||||||||||
Comprehensive income (loss): | ||||||||||||||||||||
Net income | — | — | — | 161,104 | — | 161,104 | ||||||||||||||
Derivative financial instrument adjustment, net of tax of $39 | — | — | — | — | 55 | 55 | ||||||||||||||
Foreign currency translation adjustment | — | — | — | — | (61,727 | ) | (61,727 | ) | ||||||||||||
Total comprehensive income | 99,432 | |||||||||||||||||||
Balance at December 28, 2008 | 100 | $ | — | $ | 1,400,159 | $ | 49,512 | $ | (61,421 | ) | $ | 1,388,250 | ||||||||
The accompanying notes are an integral part of these consolidated financial statements.
F-61
Table of Contents
An indirect subsidiary of JBS S.A.
Notes to consolidated financial statements
December 28, 2008
Note 1. Description of business
JBS USA Holdings, Inc. (“JBS USA Holdings” or the “Company”), formerly known as JBS USA, Inc. is a Delaware corporation. On December 29, 2008, JBS USA, was renamed JBS USA, LLC and converted from a C corporation to a limited liability company. The operations of the Company and its subsidiaries constitute the operations of JBS USA Holdings as reported under general accepted accounting principles in the United States of America (“GAAP”). JBS USA Holdings, Inc. owns 100% of the issued and outstanding capital stock of JBS USA. JBS USA Holdings, Inc. is an indirect subsidiary of JBS S.A., a Brazilian company (“JBS”).
JBS USA Holdings processes, prepares, packages, and delivers fresh, further processed and value-added beef, pork and lamb products for sale to customers in the United States and in international markets. JBS USA Holdings sells its meat products to customers in the foodservice, international, further processor, and retail channels. The Company also produces and sells by-products that are derived from its meat processing operations, such as hides and variety meats, to customers in various industries.
JBS USA Holdings conducts its domestic beef and pork processing businesses through its wholly owned subsidiaries: Swift Beef Company (“Swift Beef”), Swift Pork Company (“Swift Pork”) and JBS Packerland (“JBS Packerland”), formerly known as Smithfield Beef Group and its Australian beef business through Swift Australia Pty. Ltd. (“Swift Australia”). The Company has two reportable segments comprised of Beef and Pork which, for the fifty-two weeks ended December 28, 2008, represented approximately 80.6% and 19.4% of net sales, respectively. The Company operates eight beef processing facilities, three pork processing facilities, one lamb slaughter facility, one value-added facility, and eleven feedlots in the United States and ten processing facilities and five feedlots in Australia. Three of the processing facilities in Australia process lamb, mutton and veal along with beef and a fourth processes only lamb, mutton and veal.
Note 2. Acquisition and refinancing of Swift Foods Company
On July 11, 2007, JBS S.A. acquired the Company (the “Acquisition”). Concurrent with the closing of the Acquisition, the entity formerly known as Swift Foods Company was renamed JBS USA, Inc. During the third quarter of the current fiscal year, this entity was renamed JBS USA Holdings, Inc. The aggregate purchase price for the Acquisition was $1,470.6 million (including approximately $48.5 million of transaction costs). The Company also refinanced its debt, the debt of its subsidiaries, and the outstanding debt assumed in the Acquisition which collectively were paid off using proceeds from $750.0 million of various debt instruments (see Note 8) and additional equity contributions from JBS S.A. As a result of the Acquisition, the consolidated financial statements of JBS USA Holdings provided herein reflect the acquisition being accounted for as a purchase in accordance with Statement of Financial Accounting Standard (“SFAS”) No. 141,Business Combinations (“SFAS No. 141”) and push down accounting was applied in accordance with the guidance in Staff Accounting Bulletin (“SAB”) No. 54 to the consolidated financial statements.
F-62
Table of Contents
JBS USA Holdings, Inc.
An indirect subsidiary of JBS S.A.
Notes to consolidated financial statements
December 28, 2008
Note 3. Acquisition of Tasman Group
On March 4, 2008, JBS Southern Australia Pty. Ltd (“JBS Southern”), an indirect subsidiary of JBS USA Holdings entered into an agreement with Tasman Group Services, Pty. Ltd. (“Tasman Group”) to purchase substantially all of the assets of Tasman Group in an all cash transaction (“Tasman Acquisition”) and the purchase was completed on May 2, 2008. The assets acquired include six processing facilities and one feedlot located in Southern Australia. This acquisition provides additional capacity to continue to meet customer demand. The aggregate purchase price for the Tasman Acquisition was $117.3 million (including approximately $8.6 million of transaction costs), as shown below. JBS Southern also assumed approximately $52.1 million of outstanding debt (see Note 8). The consolidated financial statements of the Company provided herein reflect the Tasman Acquisition being accounted for as a purchase in accordance with SFAS No. 141. The results of the Tasman Group are included in the Company’s Consolidated Statement of Operations from the date of acquisition.
The purchase price allocation is preliminary pending completion of independent valuations of assets and liabilities acquired in the area of identified intangibles and certain liabilities including, but not limited to deferred income taxes. As such, the allocation of purchase price presented below is preliminary and subject to change. The allocation presented below reflects the estimated fair value of the individual assets and liabilities as of May 2, 2008 (in thousands).
| Purchase price paid to previous shareholders | $108,786 | |||
Fees and direct expenses | 8,555 | |||
Total purchase price | $ | 117,341 | ||
Purchase price allocation: | ||||
Current assets and liabilities, net | $ | (27,942 | ) | |
Property, plant, and equipment | 157,396 | |||
Deferred income tax liability | (3,539 | ) | ||
Goodwill | — | |||
Other noncurrent assets and liabilities, net | (8,574 | ) | ||
Total purchase price allocation | $ | 117,341 | ||
Note 4. Acquisition of Smithfield Beef Group & Five Rivers Cattle Feeding
On March 4, 2008, JBS S.A. and Smithfield Foods, Inc (“Smithfield Foods”) entered into a Stock Purchase Agreement (“Smithfield Agreement”). Pursuant to the Smithfield Agreement, JBS S.A. executed through the Company the acquisition of Smithfield Beef Group, Inc. (“Smithfield Beef”) for $563.2 million in cash (including $26.1 million of transaction related costs). The Company then contributed the funds to JBS USA, Inc. (“JBS USA”) which finalized the acquisition in Smithfield Beef (“Smithfield Acquisition”). The purchase included 100% of Five Rivers Ranch Cattle Feeding
F-63
Table of Contents
JBS USA Holdings, Inc.
An indirect subsidiary of JBS S.A.
Notes to consolidated financial statements
December 28, 2008
LLC (“Five Rivers”), which was held by Smithfield Beef in a 50/50 joint venture with Continental Grain Company (“CGC,” formerly ContiGroup Companies, Inc.). On October 23, 2008, the acquisition of Smithfield Beef was completed. In conjunction with the closing of this purchase Smithfield Beef was renamed JBS Packerland and Five Rivers was renamed JBS Five Rivers Cattle Feeding LLC (“JBS Five Rivers”). The assets acquired include four processing plants and eleven feedlots. This acquisition provides additional capacity to continue to meet customer demand.
The purchase excluded substantially all live cattle inventories held by Smithfield Beef and Five Rivers as of the closing date, together with the associated debt. The excluded live cattle were raised by JBS Five Rivers after closing for a negotiated fee.
The consolidated financial statements of the Company provided herein reflect the Smithfield acquisition being accounted for as a purchase in accordance with SFAS No. 141. The acquired goodwill is treated as non-deductible for tax purposes. The results of JBS Packerland and JBS Five Rivers are included in the Company’s Consolidated Statement of Operations from the date of acquisition.
The purchase price allocation is preliminary pending completion of independent valuations of assets and liabilities acquired including, but not limited to deferred income taxes. As such, the allocation of purchase price presented below is preliminary and subject to change. The allocation presented below reflects the estimated fair value of the individual assets and liabilities as of October 23, 2008 (in thousands).
| Purchase price paid to previous shareholders | $ 537,068 | |||
Fees and direct expenses | 26,134 | |||
Total purchase price | $ | 563,202 | ||
Purchase price allocation: | ||||
Current assets and liabilities, net | $ | 44,146 | ||
Property, plant, and equipment | 423,955 | |||
Deferred income tax liability | (142,997 | ) | ||
Goodwill | 94,904 | |||
Intangible assets (see Note 5) | 138,023 | |||
Other noncurrent assets and liabilities, net | 5,171 | |||
Total purchase price allocation | $ | 563,202 | ||
Had the Smithfield Acquisition occurred at the beginning of fiscal 2008, consolidated unaudited pro forma net sales, net income and net income per share would have been $15.4 billion, $222.3 million and $2,222,960.00 respectively.
F-64
Table of Contents
JBS USA Holdings, Inc.
An indirect subsidiary of JBS S.A.
Notes to consolidated financial statements
December 28, 2008
Note 5. Basis of presentation and accounting policies
Consolidation
The consolidated financial statements include the accounts of the Company and its direct and indirect wholly-owned subsidiaries. All intercompany transactions have been eliminated.
Use of estimates
The consolidated financial statements have been prepared in conformity with GAAP using management’s best estimates and judgments. These estimates and judgments affect the reported amounts of assets and liabilities and disclosure of the contingent assets and liabilities at the date of the financial statements. The estimates and judgments will also affect the reported amounts for certain revenues and expenses during the reporting period. Actual results could differ materially from these estimates and judgments. Significant estimates made by the Company include the allowance for doubtful accounts, reserves related to inventory obsolescence or valuation, insurance accruals, and income tax accruals.
Fiscal year
The Company’s fiscal year consists of 52 or 53 weeks, ending on the last Sunday in December. The consolidated financial statements have been prepared for the fifty-two weeks ended December 28, 2008.
Cash and cash equivalents
The Company considers all highly liquid investments with an original maturity of three months or less to be cash equivalents. The carrying value of these assets approximates their fair market value. Financial instruments which potentially subject JBS USA Holdings to concentration of credit risk consist principally of cash and temporary cash investments. At times, cash balances held at financial institutions were in excess of Federal Deposit Insurance Corporation insurance limits. JBS USA Holdings places its temporary cash investments with high quality financial institutions. The Company believes no significant credit risk exists with respect to these cash investments.
Accounts receivable and allowance for doubtful accounts
The Company has a diversified customer base which includes some customers who are located in foreign countries. The Company controls credit risk related to accounts receivable through credit worthiness reviews, credit limits, letters of credit, and monitoring procedures.
The Company evaluates the collectability of its accounts receivable based on a general analysis of past due receivables, and a specific analysis of certain customers which management believes will
F-65
Table of Contents
JBS USA Holdings, Inc.
An indirect subsidiary of JBS S.A.
Notes to consolidated financial statements
December 28, 2008
be unable to meet their financial obligations due to economic conditions, industry-specific conditions, historic or anticipated performance, and other relevant circumstances. The Company continuously performs credit evaluations and reviews of its customer base. The Company will provide an allowance for an account when collectability is not reasonably assured.
The Company adheres to customary industry terms of net seven days. The Company considers all domestic accounts over 14 days as past due and all international accounts over 30 days past due. Activity in the allowance for doubtful accounts is as follows (in thousands):
| Balance at December 30, 2007 | $1,389 | |||
Fair value of allowance on acquired business | 1,714 | |||
Bad debt provision | 1,470 | |||
Write-offs, net of recoveries | (375 | ) | ||
Effect of exchange rates | (56 | ) | ||
Balance at December 28, 2008 | $ | 4,142 | ||
Inventories
Inventories consist primarily of product, livestock, and supplies. Product inventories are considered commodities and are primarily valued based on quoted commodity prices, which approximate net realizable value less cost to complete. Due to a lack of equivalent commodity market data Australian product inventories are valued based on the lower of cost or net realizable value less cost to sell. Livestock inventories are valued on the basis of the lower of first-in, first-out cost or market. Costs capitalized into livestock inventory include cost of feeder livestock, direct materials, supplies, and feed. Cattle and hogs are reclassified from livestock to work in progress at time of slaughter. Supply inventories are carried at historical cost. The components of inventories are as follows (in thousands):
| December 28, 2008 | |||
Livestock | $ | 106,288 | |
Product inventories: | |||
Raw material | 16,599 | ||
Work in progress | 53,115 | ||
Finished goods | 395,686 | ||
Supplies | 86,599 | ||
| $ | 658,287 | ||
Other current assets
Other current assets include prepaid expenses which are amortized over the period the Company expects to receive the benefit.
F-66
Table of Contents
JBS USA Holdings, Inc.
An indirect subsidiary of JBS S.A.
Notes to consolidated financial statements
December 28, 2008
Property, plant and equipment
Property, plant and equipment was recorded at fair value at the respective dates of the Acquisition, the Tasman Acquisition and the Smithfield Acquisition. Subsequent additions are recorded at cost. Depreciation and amortization is recorded using the straight-line method over the estimated useful lives of the assets as follows:
| Furniture, fixtures, office equipment and other | 5 to 7 years | |
Machinery and equipment | 5 to 15 years | |
Buildings and improvements | 15 to 40 years | |
Leasehold improvements | shorter of useful life or the lease term | |
The costs of developing internal-use software are capitalized and amortized when placed in service over the expected useful life of the software. Major renewals and improvements that extend the useful life of the asset are capitalized while maintenance and repairs are expensed as incurred. The Company accounts for planned major maintenance activities as they are incurred in accordance with the guidance in the Financial Accounting Standards Board, (“FASB”) Staff Position (“FSP”) AUG Air-1:Accounting for Planned Major Maintenance Activities. Upon the sale or retirement of assets, the cost and related accumulated depreciation or amortization are eliminated from the respective accounts and any resulting gains or losses are reflected in earnings. Interest charges incurred during the construction of assets are capitalized as one of the elements of cost and are amortized over the assets’ estimated useful lives. Interest charges capitalized were $1.0 million during the fifty-two weeks ended December 28, 2008. Assets held under capital lease are classified in property, plant, and equipment and amortized over the lease term. Capital lease amortization is included in depreciation expense. As of December 28, 2008, the Company had $28.5 million in commitments outstanding for capital projects, including $14.5 million related to the Installment Bond Purchase Agreement, as discussed in Other Assets.
In accordance with SFAS No. 144,Accounting for the Impairment or Disposal of Long-Lived Assets, the Company assesses the recoverability of long-lived assets whenever events or changes in circumstances indicate the carrying amount of an asset may not be recoverable. When future undiscounted cash flows of assets are estimated to be insufficient to recover their related carrying value, the Company compares the asset’s estimated future cash flows, discounted to present value using a risk-adjusted discount rate, to its current carrying value and records a provision for impairment as appropriate.
F-67
Table of Contents
JBS USA Holdings, Inc.
An indirect subsidiary of JBS S.A.
Notes to consolidated financial statements
December 28, 2008
Property, plant, and equipment, net are comprised of the following (in thousands):
| December 28, 2008 | ||||
Land | $ | 143,253 | ||
Buildings, machinery, and equipment | 1,022,324 | |||
Property and equipment under capital lease | 17,339 | |||
Furniture, fixtures, office equipment, and other | 38,867 | |||
Construction in progress | 88,732 | |||
| 1,310,515 | ||||
Less accumulated depreciation and amortization | (81,199 | ) | ||
| $ | 1,229,316 | |||
Accumulated depreciation includes accumulated amortization on capitalized leases of approximately $3.1 million as of December 28, 2008. For the fifty-two weeks ended December 28, 2008, the Company recognized $64.6 million and $27.8 million of depreciation and capital lease amortization expense in cost of goods sold and selling, general, and administrative expenses in the Consolidated Statement of Operations, respectively.
JBS USA Holdings monitors certain asset retirement obligations in connection with its operations. These obligations relate to clean-up, removal or replacement activities and related costs for “in-place” exposures only when those exposures are moved or modified, such as during renovations of its facilities. These in-place exposures include asbestos, refrigerants, wastewater, oil, lubricants and other contaminants common in manufacturing environments. Under existing regulations, JBS USA Holdings is not required to remove these exposures and there are no plans or expectations of plans to undertake a renovation that would require removal of the asbestos, nor the remediation of the other in-place exposures at this time. The facilities are expected to be maintained and repaired by activities that will not result in the removal or disruption of these in-place exposures. As a result, there is an indeterminate settlement date for these asset retirement obligations because the range of time over which JBS USA Holdings may incur these liabilities is unknown and cannot be reasonably estimated. Therefore, JBS USA Holdings cannot reasonably estimate and has not recorded the fair value of the potential liability.
Other assets
Prior to the Acquisition, Swift Beef entered into an Installment Bond Purchase Agreement (the “Purchase Agreement”) with the City of Cactus, Texas (the “City”) effective as of May 15, 2007. Under the Purchase Agreement, Swift Beef agreed to purchase up to $26.5 million of the City of Cactus, Texas Sewer System Revenue Improvement and Refunding Bonds, Taxable Series 2007 to be issued by the City (the “Bonds”) . The Bonds are being issued by the City to finance improvements to its sewer system (the “System”) which is utilized by Swift Beef’s processing
F-68
Table of Contents
JBS USA Holdings, Inc.
An indirect subsidiary of JBS S.A.
Notes to consolidated financial statements
December 28, 2008
plant located in Cactus, Texas (the “Plant”) as well as other industrial users and the citizens of the community of Cactus. Swift Beef will purchase the Bonds in installments upon receipt of Bond installment requests from the City as the System improvements are completed through an anticipated completion date of June 2010. The interest rate on the Bonds is six-month LIBOR plus 350 basis points, or 6.04% at December 28, 2008. The Bonds mature on June 1, 2032 and are subject to annual mandatory sinking fund redemption beginning on June 1, 2011. The principal and interest on the Bonds will be paid by the City from the net revenues of the System. At December 28, 2008, Swift Beef held $12.0 million of the Bonds, which fall within Level 3 of the value hierarchy in accordance with SFAS No. 157,Fair Value Measurements (“SFAS No. 157”).
On May 21, 2007, in connection with the purchase of the Bonds, Swift Beef entered into a Water & Wastewater Services Agreement (the “Wastewater Agreement”) with the City under which the City will provide water and wastewater services for the Plant at the rates set forth in the Wastewater Agreement. Swift Beef’s payments for the City’s treatment of wastewater from the Plant will include a capacity charge in the amount required to be paid by the City to pay the principal of, and interest on the Bonds.
The Company has evaluated the impact of the FASB Emerging Issues Task Force (“EITF”) No. 01-08,Determining Whether an Arrangement Contains a Lease, as well as EITF No. 97-10,The Effect of Lessee Involvement in Asset Construction, and has determined that it will be required to reflect the wastewater treatment facility as a capital asset (similar to a capital leased asset) as it will be the primary user of the wastewater facility based on projections of throughput volume. As the City spends funds to construct the facility, the Company will record construction in process and the related construction financing. At December 28, 2008, $9.8 million and $8.8 million had been recognized as construction in process and construction financing by the Company, respectively.
Debt issuance costs
Costs related to the issuance of debt are capitalized and amortized using the straight-line method to interest expense over the period the debt is outstanding.
In conjunction with the Acquisition, $1.8 million of fees were capitalized and included in other assets. JBS USA Holdings expensed $0.9 million of these costs during the fifty-two weeks ended December 28, 2008 as the amount under the related loan agreement was repaid in full (see Note 8).
On November 5, 2008, JBS USA entered into a $400.0 million revolving credit facility (see Note 8). The debt issuance cost associated with this facility is being amortized using the straight-line method over the life of the agreement as interest expense. During the fifty-two weeks ended December 28,2008 JBS USA amortized $0.8 million.
F-69
Table of Contents
JBS USA Holdings, Inc.
An indirect subsidiary of JBS S.A.
Notes to consolidated financial statements
December 28, 2008
Goodwill and other intangibles
Goodwill and other intangible assets with indefinite lives are not amortized but are tested for impairment at least on an annual basis or more frequently if impairment indicators arise, as required by SFAS No. 142,Goodwill and Other Intangible Assets. Identifiable intangible assets with definite lives are amortized over their estimated useful lives.
Goodwill represents the excess of the aggregate purchase price over the fair value of the net identifiable assets acquired in a purchase business combination. The goodwill impairment test is a two-step test. Under the first step, the fair value of the reporting unit is compared with its carrying value (including goodwill). If the fair value of the reporting unit is less than its carrying value, an indication of goodwill impairment exists for the reporting unit and the enterprise must perform step two of the impairment test. Under step two, an impairment loss is recognized for any excess of the carrying amount of the reporting unit’s goodwill over the implied fair value of that goodwill. The implied fair value of goodwill is determined by allocating the fair value of the reporting unit in a manner similar to a purchase price allocation, in accordance with SFAS No. 141,Business Combination,and after December 15, 2008 in accordance with SFAS No. 141R as discussed inRecently Issued Accounting Pronouncements. The residual fair value after this allocation is the implied fair value of the reporting unit goodwill. The Company estimates the fair value of its reporting units using a discounted cash flow analysis.
The following is a rollforward of goodwill by segment for the fifty-two weeks ended December 28, 2008 (in thousands):
| December 30, 2007 | Adjustments | Translation gain | December 28, 2008 | |||||||||||
Beef | $ | 52,565 | $ | 83,826 | $ | (2,566 | ) | $ | 133,825 | |||||
Pork | 43,780 | (29,750 | ) | — | 14,030 | |||||||||
Total | $ | 96,345 | $ | 54,076 | $ | (2,566 | ) | $ | 147,855 | |||||
The adjustments to goodwill are primarily related to the goodwill generated from the Smithfield Acquisition of $94.9 million (see Note 4) coupled with the release of the valuation allowance on deferred tax assets from the Acquisition of $42.9 million (see Note 12).
F-70
Table of Contents
JBS USA Holdings, Inc.
An indirect subsidiary of JBS S.A.
Notes to consolidated financial statements
December 28, 2008
Other identifiable intangible assets consist of the following (in thousands):
| Initial gross carrying amount | Adjustments | Accumulated amortization | Net carrying amount | |||||||||||
Amortizing: | ||||||||||||||
Customer relationships | $ | 129,000 | $ | 69,000 | $ | (18,104 | ) | $ | 179,896 | |||||
Customer contracts | 15,400 | 6,078 | (2,004 | ) | 19,474 | |||||||||
Patents | 5,200 | (2,300 | ) | (282 | ) | 2,618 | ||||||||
Rental contract | 3,507 | — | (573 | ) | 2,934 | |||||||||
Deferred revenue | 1,483 | — | (459 | ) | 1,024 | |||||||||
Mineral rights | 742 | — | (65 | ) | 677 | |||||||||
Subtotal amortizing intangibles | 155,332 | 72,778 | (21,487 | ) | 206,623 | |||||||||
Non-amortizing: | ||||||||||||||
Trademark | 33,300 | 50,800 | — | 84,100 | ||||||||||
Water rights | 2,100 | 12,144 | — | 14,244 | ||||||||||
Subtotal non-amortizing intangibles | 35,400 | 62,944 | — | 98,344 | ||||||||||
Total other intangibles | $ | 190,732 | $ | 135,722 | $ | (21,487 | ) | $ | 304,967 | |||||
The adjustments to other intangibles result primarily from the establishment of intangibles related to the Smithfield Acquisition (see Note 4) and the impairment of $2.3 million relating to a patent that has no future use.
The customer relationship intangible and customer contract intangible resulting from the Acquisition are amortized on an accelerated basis over 12 and 7 years respectively. The customer relationship and customer contract intangibles resulting from the Smithfield Acquisition are amortized on an accelerated basis over 21 and 10 years, respectively. These represent management’s estimates of the period of expected economic benefit and annual customer profitability. Patents consist of exclusive marketing rights and are being amortized over the life of the related agreements on a straight line basis, which range from 6 to 20 years. For the fifty-two weeks ended December 28, 2008, the Company recognized $16.6 million of amortization expense.
F-71
Table of Contents
JBS USA Holdings, Inc.
An indirect subsidiary of JBS S.A.
Notes to consolidated financial statements
December 28, 2008
Based on amortizing assets recognized in JBS USA Holdings’ balance sheet as of December 28, 2008, the amortization expense for each of the next five years is estimated as follows (in thousands):
For fiscal years ending December (in thousands): | |||
2009 | $ | 20,502 | |
2010 | 19,879 | ||
2011 | 18,964 | ||
2012 | 17,400 | ||
2013 | 15,299 | ||
Book Overdraft
The majority of JBS USA Holdings bank accounts are zero balance accounts where cash needs are funded as checks are presented for payment by the holder. Checks issued pending clearance that result in overdraft balances for accounting purposes are classified as current liabilities, and the change in the related balance is reflected in financing activities on the Consolidated Statement of Cash Flows.
Insurance
JBS USA Holdings is self-insured for employee medical and dental benefits and purchases insurance policies with deductibles for certain losses relating to worker’s compensation and general liability claims. The Company has purchased stop-loss coverage in order to limit its exposure to any significant levels of certain claims. Self-insured losses are accrued based upon periodic assessments of estimated settlements for known and anticipated claims, any resulting adjustments to previously recorded reserves are reflected in current period earnings. JBS USA Holdings has recorded a prepaid asset with an offsetting liability to reflect the amounts estimated as due for insured claims incurred and accrued but not yet paid to the claimant by the third party insurance company in accordance with SFAS No. 140Accounting for Transfers and Servicing of Financial Assets and Extinguishments of Liabilities.
Environmental expenditures and remediation liabilities
Environmental expenditures that relate to current or future operations and which improve operational capabilities are capitalized at time of incurrence. Expenditures that relate to an existing or prior condition caused by past operations, and which do not contribute to current or future revenue generation, are expensed. Liabilities are recorded when environmental assessments and/or remediation efforts are probable and the costs can be reasonably estimated.
F-72
Table of Contents
JBS USA Holdings, Inc.
An indirect subsidiary of JBS S.A.
Notes to consolidated financial statements
December 28, 2008
Foreign currency
For foreign operations, the local currency is the functional currency. Translation into US dollars is performed for assets and liabilities at the exchange rates as of the balance sheet date. Income and expense accounts are translated at average exchange rates for the period. Adjustments resulting from the translation are reflected as a separate component of other comprehensive income (loss). The balance of foreign currency translation adjustment in accumulated other comprehensive income at December 28, 2008 was a cumulative loss of $(61.1) million. Transaction gains and losses on US dollar denominated revolving intercompany borrowings between the Australian subsidiaries and the US parent are recorded in earnings.
Income taxes
Income taxes are accounted for under the asset and liability method. Deferred tax assets and liabilities are recognized for the future tax consequences attributable to differences between the financial statement carrying amounts of existing assets and liabilities and their respective tax bases and operating loss and tax credit carryforwards. JBS USA allocates current and deferred taxes as if it were a separate taxpayer. Deferred tax assets and liabilities are measured using enacted tax rates expected to apply to taxable income in the years in which those temporary differences are expected to be recovered or settled. The effect on deferred tax assets and liabilities of a change in tax rates is recognized in income in the period that includes the enactment date. Beginning with the adoption of FASB Interpretation No. 48Accounting for Uncertainty in Income Taxes (“FIN 48”), as of May 28, 2007, the Company recognizes the effect of income tax positions only if those positions are more likely than not of being sustained. Recognized income tax positions are measured at the largest amount that is greater than 50% likely of being realized. Changes in recognition or measurement are reflected in the period in which the change in judgment occurs. Prior to the adoption of FIN 48, the Company recognized the effect of income tax positions only if such positions were probable of being sustained. JBS USA Holdings recognizes both interest and penalties related to uncertain tax positions as part of the income tax provision.
Fair value of financial instruments
The carrying amounts of JBS USA Holdings’ cash and cash equivalents, short-term trade receivables, and payables, approximate their fair values due to the short-term nature of the instruments. Existing long-term debt was recorded at fair value as of the date of the Acquisition (see Note 2) and the Company believes this approximates its fair value at December 28, 2008. Long-term debt incurred since the Acquisition was recorded at fair value at the date of incurrence and is considered to be fair value at December 28, 2008 due to the proximity of the balance sheet date to the issuance of the debt and its variable interest rate (see Note 8).
F-73
Table of Contents
JBS USA Holdings, Inc.
An indirect subsidiary of JBS S.A.
Notes to consolidated financial statements
December 28, 2008
Revenue recognition
The Company’s revenue recognition policies are based on the guidance in Staff Accounting Bulletin (“SAB”) No. 104,Revenue Recognition in Financial Statements. Revenue on product sales is recognized when title and risk of loss are transferred to customers (upon delivery based on the terms of sale), when the price is fixed or determinable, and when collectability is reasonably assured, and pervasive evidence of an arrangement exists. The Company recognizes sales net of applicable provisions for discounts, returns and allowances, which are accrued as product is invoiced to customers who participate in such programs based on contract terms and historical and current purchasing patterns.
Advertising costs
Advertising costs are expensed as incurred. Advertising costs were $5.6 million for the fifty-two weeks ended December 28, 2008.
Research and development
The Company incurs costs related to developing new beef and pork products. These costs include developing improved packaging, manufacturing, flavor enhancing, and improving consumer friendliness of meat products. The costs of these research and development activities are less than 1% of total consolidated net sales for the fifty-two weeks ended December 28, 2008 and are expensed as incurred.
Shipping costs
Pass-through finished goods delivery costs reimbursed by customers are reported in net sales while an offsetting expense is included in cost of goods sold.
Comprehensive income
Comprehensive income consists of net income, foreign currency translation, and adjustments from derivative financial instruments.
Net income per share
The Company presents dual computations of net income (loss) per common share. The basic computation is based on weighted average common shares outstanding during the period. The diluted computation reflects the same calculation as the basic computation as the Company does not have potentially dilutive common stock equivalents.
F-74
Table of Contents
JBS USA Holdings, Inc.
An indirect subsidiary of JBS S.A.
Notes to consolidated financial statements
December 28, 2008
Derivatives and hedging activities
JBS USA Holdings accounts for its derivatives and hedging activities in accordance with SFAS No. 133,Accounting for Derivative Financial Instruments and Hedging Activities,(“SFAS No. 133”), and its related amendment, SFAS No. 138,Accounting for Certain Derivative Instruments and Certain Hedging Activities. The Company uses derivatives (e.g., futures and options) for the purpose of mitigating exposure to changes in commodity prices and foreign currency exchange rates and to assist JBS S.A. in its risk management activities, as discussed in Note 11. The fair value of each derivative is recognized in the Consolidated Balance Sheet within current assets or current liabilities. Changes in the fair value of derivatives are recognized immediately in the Consolidated Statement of Operations for derivatives that do not qualify for hedge accounting. For derivatives designated as a hedge and used to hedge an existing asset or liability, both the derivative and hedged item are recognized at fair value within the Consolidated Balance Sheet with the changes in both of these fair values being recognized immediately in the Consolidated Statement of Operations. For derivatives designated as a hedge and used to hedge an anticipated transaction, changes in the fair value of the derivatives are deferred in the Consolidated Balance Sheet within accumulated other comprehensive income (loss) to the extent the hedge is effective in mitigating the exposure to the related anticipated transaction. Any ineffectiveness is recognized immediately in the Consolidated Statement of Operations. Amounts deferred within accumulated other comprehensive income (loss) are recognized in the Consolidated Statement of Operations upon the completion of the related underlying transaction.
Gains and losses from energy and livestock derivatives related to purchases are recognized in the Consolidated Statement of Operations as a component of cost of goods sold upon change in fair value. While management believes these instruments help mitigate various market risks, they are not designated and accounted for as hedges under SFAS No. 133 as a result of the extensive recordkeeping requirements of this statement. Gains and losses from foreign currency derivatives and livestock derivatives related to future sales and related to JBS S.A.’s risk management activities are recognized in the Consolidated Statement of Operations as a component of net sales or as a component of accumulated other comprehensive income (loss) upon change in fair value.
Recently issued accounting pronouncements
In March 2008, the FASB issued SFAS No. 161,Disclosures about Derivative Instruments and Hedging Activities (“SFAS No. 161”), which provides for enhanced disclosures about the use of derivatives and their impact on a Company’s financial position and results of operations. This statement is effective for JBS USA Holdings for fiscal year 2009. The Company does not expect the adoption of SFAS No. 161 to have a material impact on its financial position, results of operations, or cash flows.
In December 2007, the FASB issued SFAS No. 141(R),Business Combinations (“SFAS No. 141(R)”). SFAS No. 141(R) is intended to provide greater consistency in the accounting and reporting of
F-75
Table of Contents
JBS USA Holdings, Inc.
An indirect subsidiary of JBS S.A.
Notes to consolidated financial statements
December 28, 2008
business combinations. SFAS No. 141(R) requires the acquiring entity in a business combination to recognize all assets acquired and liabilities assumed in the transaction and any non-controlling interest in the acquiree at the acquisition date, measured at fair value at that date. This includes the measurement of the acquirer’s shares issued as consideration in a business combination, the recognition of contingent consideration, the accounting for pre-acquisition gains and loss contingencies, the recognition of capitalized in–process research and development, the accounting for acquisition related restructuring cost accruals, the treatment of acquisition related transaction costs and the recognition of changes in the acquirer’s income tax valuation allowance and deferred taxes. One significant change in this statement is the requirement to expense direct costs of the transaction, which under existing standards are included in the purchase price of the acquired company. This statement also established disclosure requirements to enable the evaluation of the nature and financial effect of the business combination. SFAS No. 141(R) is effective for business combinations consummated after December 31, 2008. Also effective, as a requirement of the statement, after December 31, 2008 any adjustments to uncertain tax positions from business combinations consummated prior to December 31, 2008 will no longer be recorded as an adjustment to goodwill, but will be reported in income. During the thirteen weeks ended December 28, 2008, the Company expensed $1.9 million of cost previously capitalized related to the pending acquisition of National Beef Packing Company (“National Beef”) as the transaction did not close prior to December 15, 2008.
In September 2006, the FASB issued SFAS No. 157,Fair Value Measurements. The provisions of SFAS No. 157 define fair value, establish a framework for measuring fair value in generally accepted accounting principles and expand disclosures about fair value measurements. The provisions of SFAS No. 157 are effective for fiscal years beginning after November 15, 2007, with the exception of nonfinancial assets and liabilities that are not currently recognized or disclosed at fair value in the financial statements on a recurring basis, for which SFAS No. 157 is effective for fiscal years beginning after November 15, 2008. Our adoption of SFAS 157 No. on January 1, 2008 did not have a significant effect on our consolidated financial position, results of operations, or cash flows.
In June 2009, the FASB issued SFAS No. 167,Amendments to FASB Interpretation No. 46(R) (“SFAS No. 167”). SFAS No. 167 provides for enhanced financial reporting by enterprises involved with variable interest entities and is effective for fiscal years beginning after November 15, 2009. We do not believe the adoption of SFAS No. 167 will have a material impact on our financial position, results of operations, and cash flows.
F-76
Table of Contents
JBS USA Holdings, Inc.
An indirect subsidiary of JBS S.A.
Notes to consolidated financial statements
December 28, 2008
Note 6. Accrued liabilities
Accrued liabilities consist of the following (in thousands):
| December 28, 2008 | |||
Salaries | $ | 74,528 | |
Self insurance reserves | 24,265 | ||
Taxes | 15,825 | ||
Freight | 38,645 | ||
Interest | 19,672 | ||
Other | 110,134 | ||
Total | $ | 283,069 | |
Other accrued liabilities consist of items that are individually less than 5% of total current liabilities.
Note 7. Derivative financial instruments
The Company adopted SFAS No. 157, which defines fair value, establishes a framework for measuring fair value and requires additional disclosures about fair value measurements. The framework set forth in this standard is applicable to the fair value measurement where it is permitted or required under other accounting pronouncements.
SFAS No. 157 defines fair value as the exit price, which is the price that would be received to sell an asset or paid to transfer a liability in a transaction between market participants at the measurement date. SFAS No. 157 establishes a three-tier fair value hierarchy that prioritizes inputs to valuation techniques used for fair value measurement.
| • | Level 1 consists of observable market data in an active market for identical assets or liabilities. |
| • | Level 2 consists of market data, other than that included in Level 1, that is either directly or indirectly observable. |
| • | Level 3 consists of unobservable market data. The input may reflect the assumptions of the Company, not a market participant, if there is little available market data and the Company’s own assumptions are considered by management to be the best available information. |
In the case of multiple inputs being used in fair value measurement, the lowest level input that is significant to the fair value measurement represents the level in the fair value hierarchy in which the fair value measurement is reported.
The adoption of SFAS No. 157 has not resulted in any significant changes to the methodologies used for fair value measurement. The Company uses derivatives for the purpose of mitigating
F-77
Table of Contents
JBS USA Holdings, Inc.
An indirect subsidiary of JBS S.A.
Notes to consolidated financial statements
December 28, 2008
exposure to market risk, such as changes in commodity prices and foreign currency exchange rates. The Company uses exchange-traded futures and options to hedge livestock commodities. The Company uses foreign currency positions, which are actively quoted by an independent financial institution, to mitigate the risk of foreign currency fluctuations in the markets in which it conducts business and to assist JBS S.A. in its risk management activities, as discussed in Note 11.
The fair value of derivative assets is recognized within other current assets while the fair value of derivative liabilities is recognized within accrued liabilities. The fair value measurements that are performed on a recurring basis fall within the level 1 of the fair value hierarchy. The amounts are as follows (in thousands):
| Level 1 | |||
| December 28, 2008 | |||
Assets: | |||
Commodity derivatives | $ | 42,087 | |
Foreign currency rate derivatives | 12,002 | ||
Total Assets | $ | 54,089 | |
Liabilities: | |||
Commodity derivatives | $ | 16,392 | |
Foreign currency rate derivatives | 592 | ||
Total Liabilities | $ | 16,984 | |
The Company utilizes various raw materials in its operations, including cattle, hogs, and energy, such as natural gas, electricity, and diesel fuel, which are all considered commodities. The Company considers these raw materials generally available from a number of different sources and believes it can obtain them to meet its requirements. These commodities are subject to price fluctuations and related price risk due to factors beyond its control, such as economic and political conditions, supply and demand, weather, governmental regulation, and other circumstances. Generally, the Company purchases derivatives in an attempt to mitigate price risk related to its anticipated consumption of commodity inputs for periods of up to 12 months. The Company may enter into longer-term derivatives on particular commodities if deemed appropriate. As of December 28, 2008, the Company had derivative positions in place covering less than 1% and 11% of anticipated cattle and hog needs, respectively, through December 2009.
As of December 28, 2008, the net deferred amount of derivative loss recognized in accumulated other comprehensive income was $(0.4) million, net of tax. The Company anticipates these amounts will be transferred out of accumulated other comprehensive income and recognized within earnings over the next 12 months.
F-78
Table of Contents
JBS USA Holdings, Inc.
An indirect subsidiary of JBS S.A.
Notes to consolidated financial statements
December 28, 2008
Note 8. Long-term debt and loan agreements
JBS USA Holdings and its direct and indirect subsidiaries have entered into various debt agreements in order to provide liquidity to operate the business on a go forward basis and through loans payable to JBS S.A. to fund the Acquisition, the Tasman Acquisition, and the Smithfield Acquisition. As of December 28, 2008, debt outstanding consisted of the following (in thousands):
| Short-term debt: | |||
Secured credit facilities | $ | 36,186 | |
Unsecured credit facilities | 30,826 | ||
Total short-term debt | 67,012 | ||
Current portion of long-debt: | |||
Installment note payable | 1,264 | ||
Capital lease obligations | 3,235 | ||
Total current portion of long-term debt | 4,499 | ||
Long-term debt: | |||
Loans payable to JBS S.A. | 658,588 | ||
Installment note payable | 10,025 | ||
Senior credit facilities | 114,673 | ||
Capital lease obligations | 23,522 | ||
Long-term debt, less current portion | 806,808 | ||
Total debt | $ | 878,319 | |
The aggregate minimum principal maturities of debt for each of the five fiscal years and thereafter following December 28, 2008, are as follows (in thousands):
| For the fiscal years ending December | Minimum maturities | ||
2009 | $ | 71,807 | |
2010 | 662,866 | ||
2011 | 118,263 | ||
2012 | 3,185 | ||
2013 | 8,990 | ||
Thereafter | 13,208 | ||
Total minimum principal maturities | $ | 878,319 | |
F-79
Table of Contents
JBS USA Holdings, Inc.
An indirect subsidiary of JBS S.A.
Notes to consolidated financial statements
December 28, 2008
As of December 28, 2008, JBS USA Holdings had approximately $161.8 million of secured debt outstanding and approximately $20.9 million of outstanding letters of credit. The availability under our revolving credit facilities was $311.7 million as of December 28, 2008.
A summary of the components of interest expense, net is presented below (in thousands):
| For the fifty-two weeks ended December 28, 2008 | ||||
Interest on: | ||||
Unsecured bank loans | $ | 13,781 | ||
Unsecured credit facility | 104 | |||
Loans payable to JBS S.A. | 19,038 | |||
Capital lease interest | 1,487 | |||
Bank fees | 493 | |||
Other miscellaneous interest charges (i) | 2,220 | |||
Debt issuance cost amortization | 2,306 | |||
Secured credit facility | 2,796 | |||
Less: | ||||
Capitalized interest | (976 | ) | ||
Interest income | (4,891 | ) | ||
Total interest expense, net | $ | 36,358 | ||
| (i) | Includes installment note interest expense of $0.53 million. |
Description of indebtedness
Senior credit facilities—On November 5, 2008, JBS USA entered into a secured revolving credit facility (the “Credit Agreement”) that allows borrowings up to $400 million, and terminates on November 5, 2011. Up to $75.0 million of the Credit Agreement is available for the issuance of letters of credit. At December 28, 2008, no portion of the availability was used towards letters of credit. Borrowings that are index rate loans will bear interest at the prime rate plus a margin of 2.25% (5.50% at December 28, 2008). At December 28, 2008, the borrowings totaled $114.7 million. Upon approval by the lender, LIBOR rate loans may be taken for one, two, or three month terms, (or six months at the discretion of the Agent) at LIBOR plus a margin of 3.25% (4.66% at December 28, 2008).
Availability. Availability under the Credit Agreement is subject to a borrowing base. The borrowing base is based on certain of JBS USA domestic wholly owned subsidiaries’ assets as described below, with the exclusion of JBS Five Rivers. The borrowing base consists of percentages of eligible accounts receivable, inventory, and supplies and less certain eligibility and availability reserves. As of December 28, 2008, borrowing availability was $281.8 million.
F-80
Table of Contents
JBS USA Holdings, Inc.
An indirect subsidiary of JBS S.A.
Notes to consolidated financial statements
December 28, 2008
Security and guarantees. Borrowings made by JBS USA are guaranteed by JBS S.A., JBS USA Holdings and all domestic subsidiaries except JBS Five Rivers and are collateralized by a first priority perfected lien and interest in accounts receivable, inventory, and supplies.
Covenants. The Credit Agreement contains customary representations and warranties and a springing financial covenant that requires a minimum fixed charge coverage ratio of not less than 1.15 to 1.00. This ratio is only applicable if borrowing availability falls below the minimum threshold which is the greater of 20% of the aggregate commitments or $70.0 million. The Credit Agreement also contains negative covenants that limit the ability of JBS USA and its subsidiaries to, among other things:
| • | have capital expenditures greater than $175.0 million per year; |
| • | incur additional indebtedness; |
| • | create liens on property, revenue, or assets; |
| • | make certain loans or investments; |
| • | sell or dispose of assets; |
| • | pay certain dividends and other restricted payments; |
| • | prepay or cancel certain indebtedness; |
| • | dissolve, consolidate, merge, or acquire the business or assets of other entities; |
| • | enter into joint ventures other than certain permitted joint ventures or create certain other subsidiaries; |
| • | enter into new lines of business; |
| • | enter into certain transactions with affiliates and certain permitted joint ventures; |
| • | agree to restrictions on the ability of the subsidiaries to make dividends; |
| • | agree to enter into negative pledges in favor of any other creditor; and |
| • | enter into sale/leaseback transactions and operating leases. |
The Credit Agreement also contains customary events of default, including failure to perform or observe terms, covenants or agreements included in the Credit Agreement, payment of defaults on other indebtedness, defaults on other indebtedness if the effect is to permit acceleration, entry of unsatisfied judgments or orders against a loan party or its subsidiaries, failure of any collateral document to create or maintain a priority lien, and certain events related to bankruptcy and insolvency or environmental matters. If an event of default occurs the lenders may, among other things, terminate their commitments, declare all outstanding borrowings to
F-81
Table of Contents
JBS USA Holdings, Inc.
An indirect subsidiary of JBS S.A.
Notes to consolidated financial statements
December 28, 2008
be immediately due and payable together with accrued interest, and fees and exercise remedies under the collateral documents relating to the Credit Agreement. At December 28, 2008, JBS USA was in compliance with all covenants.
Installment note payable—The installment note payable relates to the Company’s financing of a capital investment. The note bears interest at LIBOR, the rate as of December 28, 2008 was 2.46% plus a fixed margin of 1.75% per annum with payments due on the first of each month and matures on August 1, 2013.
Unsecured credit facility—Swift Australia entered into an Australian dollar (“A$”) denominated A$120.0 million unsecured credit facility on February 26, 2008 to fund working capital and letter of credit requirements. Under this facility A$80.0 million can be borrowed for cash needs and A$40.0 million is available to fund letters of credit. Borrowings are made at the cash advance rate (BBSY) plus a margin of 0.975% plus commitment fee of 0.10%. The all-in rate as of December 28, 2008 was 5.5%. The credit facility contains certain financial covenants which require Swift Australia to maintain pre-determined ratio levels related to interest coverage, debt coverage and tangible net worth. As of December 28, 2008, Swift Australia is in compliance with all covenants and has USD $30.8 million outstanding and $20.9 million utilized under the letter of credit facility.
Secured credit/ multi-option bridge facility—JBS Southern entered into an Australian dollar (“A$”) denominated $80 million secured multi-option bridge facility on May 2, 2008 to fund working capital and letter of credit requirements. JBS Southern property and plant assets secure this bridge facility. Under this facility A$65.0 million can be borrowed for cash needs and to fund letters of credit. The remaining A$15.0 million is used for working capital needs. Borrowings are made at the BBSY plus a margin of 2.0% (including a commitment fee of $1.40%). The all-in rate as of December 28, 2008 was 6.4%. The multi-option bridge facility contains covenants and obligations which require JBS Southern to comply. As of December 28, 2008, JBS Southern is in compliance with all covenants and has $36.2 million outstanding. This facility has a fixed term and expired on December 31, 2008 (See Note 16).
The following four loan agreements sum to the $750.0 million described as debt related to the Acquisition (see Note 2). As indicated below, as of December 28, 2008, there were no outstanding balances with respect to these four loan agreements.
$250 million loan agreement—In connection with the Acquisition, JBS USA Holdings entered into a one year unsecured loan agreement with interest payable semi-annually based on six month LIBOR plus a margin of 1.50% with a maturity date of June 30, 2008. The loan agreement contained customary representations and warranties. The loan agreement was guaranteed by JBS S.A. On February 22, 2008, this debt was repaid by the Company using cash received from its Parent, which has been reflected as an additional capital contribution.
F-82
Table of Contents
JBS USA Holdings, Inc.
An indirect subsidiary of JBS S.A.
Notes to consolidated financial statements
December 28, 2008
$150 million loan agreement—In connection with the Acquisition, JBS USA Holdings entered into a one year unsecured loan agreement with interest payable semi-annually based on six month LIBOR plus a margin of 0.75%. The loan matured on June 30, 2008. The loan agreement contained customary representations, warranties and covenants. The loan agreement was guaranteed by JBS S.A. On February 27, 2008 this debt was repaid by the Company using cash received from its Parent, which has been reflected as an additional capital contribution.
$250 million credit agreement—In connection with the Acquisition, JBS USA Holdings entered into a one year unsecured credit agreement with interest payable quarterly based on three month LIBOR plus a margin of 0.75%. The agreement matured on July 7, 2008. The credit agreement contained customary representations, warranties and negative covenants. There were no maintenance financial covenants but the agreement contained an incurrence Consolidated Net Indebtedness to EBITDA ratio of 3.75 to 1.00 prior to December 31, 2007 and 3.60 to 1.00 commencing on January 1, 2008 and ending on the maturity date. The credit agreement was guaranteed by JBS S.A. On July 3, 2008 this credit agreement was repaid with funds loaned to us by JBS S.A.
$100 million loan agreement—In connection with the Acquisition, JBS USA Holdings entered into a one year unsecured loan agreement. The original 182 day loan agreement with interest payable at maturity based on six month LIBOR plus a margin of 0.8% matured on January 7, 2008. On January 3, 2008, an extension and modification agreement was signed changing the maturity date to July 7, 2008 and increasing the margin to 1.50%. The loan agreement contained customary representations, warranties and covenants. The loan agreement was guaranteed by JBS S.A. On July 7, 2008 this loan agreement was repaid with funds loaned to us by JBS S.A.
The five loan agreements listed below sum to $750.0 million and are reflected in the line item “Loans Payable to JBS S.A.” in the table at the beginning of this footnote. Between October 31, 2008 and November 30, 2008, JBS S.A. reduced the principal and accrued interest by approximately $92.6 million as a result of a derivative gain realized on foreign currency positions in Brazil on the loan agreements discussed above.
$100 million loan payable to JBS S.A.—On April 28, 2008, the Company entered into an unsecured loan agreement with its parent, JBS S.A., for $100.0 million with a maturity date of April 28, 2011. Interest payments are due semi-annually at a rate of six month LIBOR plus a margin of 3.0%, the rate as of December 28, 2008 was 6.03%; however the parties have reached an agreement to defer the 2008 interest payment. The funds received from this loan were used to fund Tasman Acquisition (see Note 3).
$25 million loan payable to JBS S.A.—On May 5, 2008, the Company entered into an unsecured loan agreement with JBS for $25.0 million with a maturity date of May 5, 2009. Interest payments are due semi-annually at a rate of six month LIBOR plus a margin of 3%, the rate of as of December 28, 2008 was 6.15%; however the parties have reached an agreement to defer the 2008 interest payment. The funds received were used to fund operations.
F-83
Table of Contents
JBS USA Holdings, Inc.
An indirect subsidiary of JBS S.A.
Notes to consolidated financial statements
December 28, 2008
$25 million loan payable to JBS S.A.—On June 10, 2008, the Company entered into an unsecured loan agreement with JBS for $25.0 million with a maturity date of June 10, 2011. Interest payments are due semi-annually at a rate of six month LIBOR plus a margin of 3%, the rate as of December 28, 2008 was 5.94%; however the parties have reached an agreement to defer the 2008 interest payment. The funds received from this loan were used to fund operations.
$350 million loan payable to JBS S.A.—On June 30 2008, the Company entered into an unsecured loan agreement with JBS totaling $350.0 million with a maturity date of June 30, 2011. Interest payments are due semi-annually at a rate of six month LIBOR plus a margin of 3%, for $250 million the rate as of December 28, 2008 was 6.12% and for $100 million the rate as of December 28, 2008 was 6.13%. The funds received were used to pay outstanding unsecured bank debt.
$250 million loan payable to JBS S.A.—On October 21, 2008, the Company entered into an unsecured loan agreement with JBS S.A. for $250.0 million with a maturity date of October 21, 2011. Interest payments are due semi-annually at a rate of six month LIBOR plus a margin of 3%. As of December 28, 2008 this rate was 4.13%. The funds received were used for the acquisition of Smithfield Beef (see Note 4).
See Note 16 regarding subsequent event issuance of $700 million 11.625% senior unsecured notes by a subsidiary in April 2009.
Dividend Restrictions—Certain covenants of our indebtedness and debt guarantee terms include restrictions on our ability to pay dividends. As of December 28, 2008 the Company had $20.6 million of retained earnings available to pay dividends.
F-84
Table of Contents
JBS USA Holdings, Inc.
An indirect subsidiary of JBS S.A.
Notes to consolidated financial statements
December 28, 2008
Capital and operating leases—JBS USA Holdings and certain of its subsidiaries lease the corporate headquarters in Greeley, Colorado under capital lease; six distribution facilities located in New Jersey, Florida, Nebraska, Arizona, Colorado and Texas; marketing liaison offices in the US, Korea, Japan, Mexico, China, and Taiwan; its distribution centers and warehouses in Australia; and a variety of equipment under operating lease agreements that expire in various years between 2008 and 2019. Future minimum lease payments at December 28, 2008, under capital and non-cancelable operating leases with terms exceeding one year are as follows (in thousands):
Capitalized lease obligations | Noncancellable operating obligations | ||||||
For the fiscal years ending December | |||||||
2009 | $ | 4,639 | $ | 17,431 | |||
2010 | 4,166 | 13,426 | |||||
2011 | 3,571 | 11,016 | |||||
2012 | 2,955 | 4,850 | |||||
2013 | 2,874 | 4,054 | |||||
Thereafter | 13,432 | 5,113 | |||||
Net minimum lease payments | 31,637 | $ | 55,890 | ||||
Less: Amount representing interest | (4,880 | ) | |||||
Present value of net minimum lease payments | $ | 26,757 | |||||
Rent expense associated with operating leases was $23.2 million for the fifty-two weeks ended December 28, 2008.
Note 9. Defined contribution plans
Defined contribution plans
The Company sponsors three tax-qualified employee savings and retirement plans (the “401(k) Plans”) covering its US based employees, both union and non-union. Pursuant to the 401(k) Plans related to the beef and pork operations, excluding JBS Five rivers, eligible employees may elect to reduce their current compensation by up to the lesser of 75% of their annual compensation or the statutorily prescribed annual limit and have the amount of such reduction contributed to the 401(k) Plans. The 401(k) Plans provide for additional matching contributions by the Company, based on specific terms contained in the 401(k) Plans. On July 8, 2008, the Company amended its 401(k) Plans described above by eliminating the immediate vesting and instituting a five year vesting schedule for all non-production employees and reducing the maximum Company match to an effective 2% from the former rate of 5%. The trustee of the 401(k) Plans, at the direction of each participant, invests the assets of the 401(k) Plans in participant designated investment options. The 401(k) Plans are intended to qualify under Section 401 of the Internal Revenue Code. The Company’s expenses related to the matching provisions of the 401(k) Plans totaled
F-85
Table of Contents
JBS USA Holdings, Inc.
An indirect subsidiary of JBS S.A.
Notes to consolidated financial statements
December 28, 2008
approximately $6.3 million for the fifty-two weeks ended December 28, 2008. One of the Company’s facilities participates in a multi-employer pension plan. The Company’s contributions to this plan, which are included in cost of goods sold in the Consolidated Statement of Operations, were $0.3 million for the fifty-two weeks ended December 28, 2008. The Company also made contributions totaling $0.6 million for the fifty-two weeks ended December 28, 2008, to a multiemployer pension related to former employees at the former Nampa, Idaho plant pursuant to a settlement agreement. As these payments are made, they are recorded as a reduction of a liability recognized when recording the Acquisition.
Participants in the JBS Five Rivers 401(k) Plan (“JBS Five Rivers 401(k) Plan”) can contribute up to 50% of pretax compensation, as defined in the Plan. Participants may also contribute amounts representing distributions from other qualified defined benefit or contribution plans. For the plan year ended December 31, 2008 the plan adopted safe harbor provisions in order to satisfy certain non-discrimination testing requirements of the Internal Revenue Code. For the plan year ended December 31, 2008 the Company made safe harbor contributions equal to the sum of 1) 100% of the participant’s deferrals that do not exceed 3% of his or her compensation and 2) 50% of the participant’s deferrals that exceed 3% of his or her compensation but do not exceed 5% of his or her compensation. Additional amounts may be contributed at the discretion of the Company’s Board of Directors. No such discretionary contributions were made for the plan year ended December 31, 2008. The Company’s expenses related to the matching provisions of the 401(k) Plans totaled approximately $12 thousand for the fifty-two weeks ended December 28, 2008. Participants are immediately vested in their own contributions plus actual earnings thereon. Participants also immediately vest in Company matching contributions. Additional discretionary contributions are subject to a five-year vesting schedule based on years of service.
Employees of Swift Australia do not participate in the Company’s 401(k) Plans. Under Australian law, Swift Australia contributes a percentage of employee compensation to a superannuation fund. This contribution approximates 9% of employee cash compensation as required under the Australian “Superannuation Act of 1997”. As the funds are administered by a third party, once this contribution is made to the Superannuation fund, Swift Australia has no obligation for payments to participants or oversight of the fund. The Company’s expenses related to contributions to this fund totaled $16.6 million for the fifty-two weeks ended December 28, 2008.
Note 10. Deferred revenue
On October 22, 2008 we received a deposit in cash from a customer of $175.0 million for the customer to secure an exclusive right to collect a certain byproduct of the beef fabrication process in all of our US beef plants. This agreement was formalized in writing as the Raw Material Supply agreement (“Supply Agreement”) on February 27, 2008. The customer advance payment was recorded as deferred revenue. As by-product is delivered to the customer over the term of the agreement, the deferred revenue is recognized as revenue in the Consolidated Statement of
F-86
Table of Contents
JBS USA Holdings, Inc.
An indirect subsidiary of JBS S.A.
Notes to consolidated financial statements
December 28, 2008
Operations. To provide the customer with security, in the unlikely event the Company was to default on its commitment, the payment is evidenced by the Supply Agreement which bears interest at 2 month LIBOR plus 200 basis points. In the event of default the Supply Agreement provides for a conversion into shares of common stock of JBS USA Holdings based on a formula stipulated in the Supply Agreement. Assuming default had occurred on December 28, 2008 the conversion rights under the Supply Agreement would have equaled 11.65% of the outstanding common stock, or 11.65 shares. The Supply Agreement also contains affirmative and negative covenants which require the Company to among other things: maintain defined market share; maintain certain tangible net worth levels; and comply in all material respects with the Supply Agreement. The unamortized balance at December 28, 2008 was approximately $173.5 million.
Note 11. Related party transactions
JBS USA Holdings enters into transactions in the normal course of business with employees of JBS USA Holdings and affiliates of JBS S.A. Other than those related party transactions in Note 8, the following table presents the impact of these transactions on the Consolidated Statements of Operations for the fifty-two weeks ended December 28, 2008 (in thousands):
For the fifty-two weeks ended December 28, 2008 | |||
Sales to: | |||
JBS S.A. Affiliates (i) (meat products) | $ | 13,032 | |
JBS S. A. (meat products) (i) | 2,372 | ||
JBS S.A. (gain from foreign currency contract) (ii) | 92,593 | ||
J&F (cattle hotelling) (i) | 19,578 | ||
JBS Global UK (meat products) (i) | 20,331 | ||
Total sales to related parties | $ | 147,906 | |
Other Income: | |||
Rental income from executives (iii) | $ | 26 | |
Interest income (iv) | 663 | ||
Total other income | $ | 686 | |
Purchases from: | |||
JBS S.A. Affiliates (i) | $ | 902 | |
J&F (cattle) | 11 | ||
Total purchases from related parties | $ | 913 | |
| (i) | JBS S.A. subsidiaries, excluding JBS USA Holdings and its subsidiaries. |
| (ii) | JBS S.A. and its subsidiaries take a global perspective to managing our collective and individual exposures to currency risks. As part of this strategy, JBS USA Holdings and JBS S.A. are party to an agreement pursuant to which JBS S.A. enters into foreign currency contracts with us covering Brazilian Reais enabling us to assist JBS S.A. in its risk management activities. Under the agreement, the outstanding balance of the intercompany loan agreements executed between JBS S.A. and us (see below) will be increased to reflect any losses on positions taken by JBS USA Holdings and will be offset by any gains on positions taken by JBS USA Holdings. JBS USA Holdings realized gains totaling $92.6 million on foreign currency contracts with JBS S.A. and accordingly, JBS USA Holdings reduced the intercompany loans by the same amount. |
F-87
Table of Contents
JBS USA Holdings, Inc.
An indirect subsidiary of JBS S.A.
Notes to consolidated financial statements
December 28, 2008
| (iii) | Rental income from executives relates to real property that we leased to two of our executive officers during the fifty-two weeks ended December 28, 2008. |
| (iv) | Interest income represents interest paid by J&F Oklahoma Holdings, Inc. (“J&F”), an unconsolidated affiliate, to JBS Five Rivers on the credit facility to J&F described below |
The following table presents the amounts owed by JBS S.A. and its affiliates to JBS USA Holdings (in thousands):
December 28, 2008 | |||
Balance sheet: | |||
Current: | |||
JBS S.A. Affiliates (meat products) | $ | 8,763 | |
JBS S.A (meat products) | 1,562 | ||
J&F (i) (cattle hotelling) | 10,450 | ||
Employees and executives (v) | 25 | ||
Total current receivable from related parties | $ | 20,800 | |
Non-current: | |||
J&F (notes receivable) | 89 | ||
Total non-current receivable from related parties | $ | 89 | |
Total amounts owed to JBS USA Holdings | $ | 20,889 | |
| (v) | The Company had a $25 thousand receivable from an executive officer at December 28, 2008 (see Note 16). |
JBS USA Holdings guarantees, on an unsecured basis, $300.0 million of 10.5% notes due 2016 issued by its parent, JBS S.A. JBS USA Holdings meets the definition of a significant subsidiary contained in the indentures and therefore the board of directors of JBS USA Holdings approved the guarantee.
JBS USA Holdings received capital contributions from its parent of $450.0 million during the fifty-two weeks ended December 28, 2008, of which $50.0 million was used to fund operations and $400.0 million was used to repay debt.
Guarantees—JBS S.A. has notes payable outstanding of approximately $300.0 million at December 28, 2008 that are due in 2016 (“2016 Notes”). The indenture governing the 2016 Notes requires any significant subsidiary (any subsidiary constituting at least 20% of JBS S.A.’s total assets or annual gross revenues, as shown on the latest financial statements of JBS S.A.) to guarantee all of JBS S.A.’s obligations under the 2016 Notes. The 2016 Notes are guaranteed by JBS Hungary Holdings Kft. (a wholly owned, indirect subsidiary of JBS S.A.), the Company and its subsidiaries, JBS USA and Swift Beef Company. Additional subsidiaries of JBS S.A. (including our subsidiaries) may be required to guarantee the 2016 Notes in the future.
Covenants. The indentures for the 2016 Notes contain customary negative covenants that limit the ability of JBS S.A. and its subsidiaries (including us) to, among other things:
| • | incur additional indebtedness; |
| • | incur liens; |
F-88
Table of Contents
JBS USA Holdings, Inc.
An indirect subsidiary of JBS S.A.
Notes to consolidated financial statements
December 28, 2008
| • | sell or dispose of assets; |
| • | pay dividends or make certain payments to JBS S.A.’s shareholders; |
| • | permit restrictions on dividends and other restricted payments by its subsidiaries; |
| • | enter into related party transactions; |
| • | enter into sale/leaseback transactions; and |
| • | undergo changes of control without making an offer to purchase the notes. |
Events of default. The indentures for the 2016 Notes also contain customary events of default, including for failure to perform or observe terms, covenants or other agreements in the indenture, defaults on other indebtedness if the effect is to permit acceleration, failure to make a payment on other indebtedness waived or extended within the applicable grace period, entry of unsatisfied judgments or orders against the issuer or its subsidiaries, and certain events related to bankruptcy and insolvency matters. If an event of default occurs, the trustee or the holders of at least 25% in aggregate principal amount of the notes then outstanding may declare such principal and accrued interest on the notes to be immediately due and payable.
Cattle supply and feeding agreement—JBS Five Rivers is party to a cattle supply and feeding agreement with J&F. JBS Five Rivers feeds and takes care of cattle owned by the J&F. J&F pays JBS Five Rivers for the cost of feed and medicine at cost plus a yardage fee on a per head per day basis. Beginning on June 23, 2009 or such earlier date on which JBS Five Rivers’ feed yards are at least 85% full of cattle and ending on October 23, 2011, J&F has agreed to maintain sufficient cattle on in JBS Five Rivers’ feed yards so that such feed yards are at least 85% full of cattle at all times. The agreement commenced on October 23, 2008 and continues until the last of the cattle on in JBS Five Rivers’ feed yards as of October 23, 2011 are shipped to J&F, a packer or another third party.
Cattle purchase and sale agreement—On October 7, 2008 JBS USA became party to a cattle purchase and sale agreement with J&F. Under this agreement, J&F agreed to sell to JBS USA and JBS USA has agreed to purchase from J&F, at least 500,000 cattle during each year from 2009 through 2011. The price paid by JBS USA is determined pursuant to JBS USA’s pricing grid in effect on the date of delivery. The grid used for J&F is identical to the grid used for unrelated third parties. If the cattle sold by J&F in a quarter result in a breakeven loss (selling price below accumulated cost to acquire the feeder animal and fatten it to delivered weight) then JBS USA will reimburse 40% of the average per head breakeven loss incurred by J&F, limited up to 125,000 head delivered to JBS USA in that quarter. If the cattle sold by J&F in a quarter result in a breakeven gain (selling price above the accumulated cost to acquire the feeder animal and fatten it to delivered weight), then JBS USA will receive from J&F an amount of cash equal to 40% of that per head gain, limited up to 125,000 head delivered to JBS USA in that quarter. There were no payments under the loss/profit sharing provisions of this agreement in fiscal 2008.
F-89
Table of Contents
JBS USA Holdings, Inc.
An indirect subsidiary of JBS S.A.
Notes to consolidated financial statements
December 28, 2008
Guarantee of J&F’s revolving credit facility—J&F has a $600.0 million secured revolving credit facility with a commercial bank. Its parent company has entered into a keep-well agreement with its subsidiary (J&F) whereby it will make contributions to J&F if J&F is not in compliance with its financial covenants under this credit facility. If J&F defaults on its obligations under the credit facility and such default is not cured by its parent under the keep-well agreement, JBS Five Rivers is obligated for up to $250.0 million of guaranteed borrowings plus certain other obligations and costs under this credit facility. J&F was in compliance with the financial covenants under this credit facility as of December 28, 2008. This credit facility and the guarantee thereof are secured solely by the assets of J&F and the net assets of JBS Five Rivers. This credit facility matures on October 7, 2011. This credit facility is used to acquire cattle which are then fed in the JBS Five Rivers feed yards pursuant to the cattle supply and feeding agreement described above. The finished cattle are sold to JBS USA under the cattle purchase and sale agreement discussed above.
Credit facility to J&F—JBS Five Rivers is party to an agreement with J&F pursuant to which JBS Five Rivers has agreed to loan up to $200.0 million in revolving loans to J&F. The loans are used by J&F to acquire feeder animals which are placed in JBS Five Rivers feed yards for finishing. Borrowings accrue interest at a per annum rate of LIBOR plus 2.25% or base rate plus 1.0% and interest is payable at least quarterly. The interest rate as December 28, 2008 was 4.25%. This credit facility matures October 7, 2011. During the period October 23, 2008 (when JBS Five Rivers was acquired) through December 28, 2008, average borrowings were approximately $131.0 million.
Variable interest entities—As of December 28, 2008 the Company holds variable interests in J&F, which is considered a variable interest entity under FASB Interpretation No. 46(R),Consolidation of Variable Interest Entities. The Company has determined that it is not the primary beneficiary of J&F but has significant variable interests in the entity. The Company’s significant variable interests are listed below and discussed further above:
| • | JBS Five Rivers has agreed to provide up to $200.0 million in loans to J&F; |
| • | JBS Five Rivers’ guarantee of up to $250.0 million of J&F’s borrowings under its revolving credit facility plus certain other obligations and costs, which is secured by and limited to the net assets of JBS Five Rivers; and |
| • | JBS USA’s rights and obligations under the cattle purchase and sale agreement. |
The Company’s maximum exposure to loss related to these variable interests is limited to the lesser of the net assets of JBS Five Rivers (including loans made to J&F), or $250.0 million plus certain other obligations and costs. As of December 28, 2008, the carrying value of JBS Five Rivers’ net assets is $332.1 million. Potential losses under the terms of the cattle purchase and sale agreement depend on future market conditions.
F-90
Table of Contents
JBS USA Holdings, Inc.
An indirect subsidiary of JBS S.A.
Notes to consolidated financial statements
December 28, 2008
Note 12. Income taxes
The pre-tax income (loss) on which the provision for income taxes was computed is as follows (in thousands):
| For the fifty-two weeks ended December 28, 2008 | ||||
Domestic | $ | 199,555 | ||
Foreign | (7,164 | ) | ||
Total | $ | 192,391 | ||
Income tax expense (benefit) includes the following current and deferred provisions (in thousands):
| For the fifty-two weeks ended December 28, 2008 | ||||
Current provision: | ||||
Federal | $ | 3,024 | ||
State | 3,159 | |||
Foreign | 19,418 | |||
Total current tax expense | 25,601 | |||
Deferred provision: | ||||
Federal | 23,886 | |||
State | 6,369 | |||
Foreign | (24,569 | ) | ||
Total deferred tax expense. | 5,686 | |||
Total income tax expense | $ | 31,287 | ||
F-91
Table of Contents
JBS USA Holdings, Inc.
An indirect subsidiary of JBS S.A.
Notes to consolidated financial statements
December 28, 2008
The principal differences between the effective income tax rate, and the US statutory federal income tax rate, were as follows:
| For the fifty-two weeks ended December 28, 2008 | |||
Expected tax rate | 35.0% | ||
State income taxes (net of federal benefit) | 3.3 | ||
Change in the valuation allowance | (18.7 | ) | |
Other, net | (3.3 | ) | |
Effective tax rate | 16.3% | ||
Temporary differences that gave rise to a significant portion of deferred tax assets (liabilities) were as follows (in thousands):
| December 28, 2008 | ||||
Inventory | $ | (10,874 | ) | |
Depreciation and amortization | (283,598 | ) | ||
Derivatives | (2,786 | ) | ||
All other current | (7,716 | ) | ||
All other long-term | (941 | ) | ||
Gross deferred tax liability | (305,915 | ) | ||
Accounts receivable reserve | 2,026 | |||
Inventory | 4,509 | |||
Interest | 557 | |||
Accrued liabilities | 16,625 | |||
Deferred revenue | 329 | |||
Loss carryforwards | 141,025 | |||
Tax credit carryforwards | 14,322 | |||
Derivatives | 225 | |||
All other long-term | 30,771 | |||
Total deferred tax asset | 210,389 | |||
Valuation allowance | (42,826 | ) | ||
Net deferred tax assets | 167,563 | |||
Net deferred tax liability | $ | (138,352 | ) | |
At December 28, 2008, JBS USA Holdings has recorded deferred tax assets of $141.0 million for loss carryforwards expiring in the years 2009 through 2029. In addition, JBS USA Holdings has
F-92
Table of Contents
JBS USA Holdings, Inc.
An indirect subsidiary of JBS S.A.
Notes to consolidated financial statements
December 28, 2008
$14.3 million of tax credits of which $10.3 million will expire in the years 2009 through 2028 and $4.0 million will carryforward indefinitely.
Section 382 of the Internal Revenue Code of 1986, as amended, imposes an annual limit on the ability of a corporation that undergoes an “ownership change” to use its net operating losses to reduce its tax liability. JBS USA Holdings experienced an ownership change in January of 2007 and July of 2007. JBS USA Holdings believes that its net operating losses exceed the Section 382 limitation in the amount of $14 million.
The valuation allowance for deferred tax assets as of December 31, 2007 was $127 million. The net change in the total valuation allowance was a decrease of $84 million in 2008. The valuation allowance as of December 28, 2008 of $43 million is primarily related to loss and credit carryforwards that in the judgment of management, are not more likely than not to be realized.
The current year valuation allowance decrease was due to a reassessment of the need for a valuation allowance based on the Company’s 2008 fiscal year earnings and the expected reversal of existing net taxable temporary differences. A portion of the valuation allowance reversed related to acquired deferred tax assets related to the JBS acquisition. This portion was recorded against goodwill in accordance with SFAS No. 141. The remaining portion was recorded as an additional tax benefit.
In assessing the realizability of deferred tax assets, management considers whether it is more likely than not that some portion or all of the deferred tax assets will not be realized. The ultimate realization of deferred tax assets is dependent upon the generation of future taxable income during the periods in which those temporary differences become deductible. Management considers the scheduled reversal of deferred tax liabilities (including the impact of available carryback and carryforward periods), projected future taxable income, and tax-planning strategies in making this assessment.
Subsequently recognized tax benefits relating to the valuation allowance for deferred tax assets as of December 28, 2008 will be allocated to income tax expense pursuant to FAS No. 141R.
JBS USA Holdings deems all of its foreign investments to be permanent in nature and does not provide for taxes on permanently reinvested earnings. It is not practicable to determine the amount of incremental taxes that might arise were these earnings to be remitted.
JBS USA Holdings follows the provisions of FASB Interpretation No. 48,Accounting for Uncertainty in Income Taxes (“FIN 48”). JBS USA’s unrecognized tax benefits are $8.1 million, the recognition of which would not have a material impact on the effective rate.
F-93
Table of Contents
F-94
A reconciliation of the beginning and ending amount of unrecognized tax benefits is as follows (in thousands):
| Balance at December 30, 2007 | $8,300 | |||
Additions based on tax positions related to the current period | — | |||
Additions for tax positions of prior years | — | |||
Reductions for tax positions of prior years | — | |||
Settlements | (200 | ) | ||
Balance at December 28, 2008 | $ | 8,100 | ||
JBS USA Holdings recognizes both interest and penalties related to uncertain tax positions as part of the income tax provision. As of December 30, 2007, accrued interest and penalties were $187 thousand. As of the year ended December 28, 2008, interest and penalty amounts related to uncertain tax positions were reduced to $5 thousand as a result of a reduction in the amount recorded as uncertain tax positions. The unrecognized tax benefit and related penalty and interest balances at December 28, 2008 are expected to decrease by $35 thousand within the next twelve months.
JBS USA Holdings files income tax returns in the U.S. and in various states and foreign countries. JBS USA Holdings is no longer subject to audit for US Federal income tax purposes for years prior to 2004. In other major jurisdictions where JBS USA Holdings operates, it is generally no longer subject to income tax examinations by tax authorities for years before 2002.
Note 13. Commitments and contingencies
On July 1, 2002, a lawsuit entitled Herman Schumacher et al v. Tyson Fresh Meats, Inc., et al was filed against a predecessor company, Tyson Foods, Inc., Excel Company, and Farmland National Beef Packing Company, L.P. in the United States District Court for the District of South Dakota seeking certification of a class of all persons who sold cattle to the defendants for cash, or on a basis affected by the cash price for cattle, during the period from April 2, 2001 through May 11, 2001 and for some period up to two weeks thereafter. The complaint alleges that the defendants, in violation of the Packers and Stockyards Act of 1921, knowingly used, without correction or disclosure, incorrect and misleading boxed beef price information generated by the USDA to purchase cattle offered for sale by the plaintiffs at a price substantially lower than was justified by the actual and correct price of boxed beef during this period. On April 12, 2006, the jury returned a verdict against three of the four defendants, including a $2.3 million verdict against Swift Beef.
On February 15, 2007, a judgment was entered on the verdict by the court and on March 12, 2007 Swift Beef Company filed a notice of appeal. Nevertheless, a liability for the amount of the verdict was recorded during the final thirteen weeks of Smithfield Beef’s fiscal year ended
JBS USA Holdings, Inc.
An indirect subsidiary of JBS S.A.
Notes to consolidated financial statements
December 28, 2008
Table of Contents
JBS USA Holdings, Inc.
An indirect subsidiary of JBS S.A.
Notes to consolidated financial statements
December 28, 2008
May 28, 2006. ConAgra Foods will indemnify Swift & Company against any judgments for monetary damages or settlements arising out of this litigation or any future litigation arising from the same facts to the extent such damages together with any other indemnifiable claims under the acquisition agreement entered into the purchase of Swift Foods from ConAgra Foods, Inc. in 2002 exceed a minimum threshold of $7.5 million. On January 29, 2008, Swift Beef was notified that the appeals court ruled in favor of the defendants on all counts. Swift Beef is now seeking the recovery of a portion of the legal fees it expended in this matter. As the claimants rights to appeal expired during the third quarter ended December 28, 2008 the reversal of the previously accrued trial court verdict amount was recorded as an adjustment to the Acquisition, not as a reduction of expenses on the Consolidated Statement of Operations.
Swift Beef is a defendant in a lawsuit entitled United States of America, ex rel, Ali Bahrani v. ConAgra, Inc., ConAgra Foods, Inc., ConAgra Hide Division, ConAgra Beef Company and Monfort, Inc., filed in the United States District Court for the District of Colorado in May 2000 by the relator on behalf of the United States of America and himself for alleged violations of the False Claims Act. Under the False Claims Act, a private litigant, termed the “relator,” may file a civil action on the United States government’s behalf against another party for violation of the statute, which, if proven, would entitle the relator to recover a portion of any amounts recovered by the government. The lawsuit alleges that the defendants violated the False Claims Act by forging and/or improperly altering USDA export certificates used from 1991 to 2002 to export beef, pork, poultry and bovine hides to foreign countries. The lawsuit seeks to recover three times the actual damages allegedly sustained by the government, plus per-violation civil penalties.
On December 30, 2004, the United States District Court granted the defendants’ motions for summary judgment on all claims. The United States Court of Appeals for the Tenth Circuit reversed the summary judgment on October 12, 2006 and remanded the case to the trial court for further proceedings consistent with the court’s opinion. Defendants filed a Motion for Rehearing En Banc on October 26, 2006. On May 10, 2007, the Tenth Circuit denied that motion.
The case is now before the trial court. Issues in the case have been bifurcated. From April 28, 2008, to April 29, 2008 a jury trial was held on key significant issues. On May 1, 2008, a verdict was returned ruling in favor of the Company on all counts. If the verdict is not overturned on appeal the Relator’s claims will be greatly limited and the issues in the case will be focused solely on bovine hides. This result significantly reduces the Company’s possible liability from the original lawsuit. Swift Beef is unable to estimate what liability, if any, it may have in connection with this lawsuit or to reasonably estimate the amount or range of any loss that may result from this lawsuit at this time. In accordance with SFAS No. 5,Accounting for Contingencies, Swift Beef has not established a loss accrual for this claim. Pursuant to the acquisition agreement by which Swift Foods separated from ConAgra Foods in 2002, Swift Foods Company agreed to indemnify ConAgra Foods against all direct liabilities and damages relating to this lawsuit, including the costs and expenses of defending the lawsuit.
F-95
Table of Contents
JBS USA Holdings, Inc.
An indirect subsidiary of JBS S.A.
Notes to consolidated financial statements
December 28, 2008
The Company is also a party to a number of other lawsuits and claims arising out of the operation of its businesses. Management believes the ultimate resolution of such matters should not have a material adverse effect on the Company’s financial condition, results of operations, or liquidity. Attorney fees are expensed as incurred.
Commitments
JBS USA Holdings enters into purchase agreements for livestock which require the purchase of either minimum quantities or the total production of the facility over a specified period of time. At December 28, 2008, the Company had commitments to purchase 33 million hogs through 2014 and approximately 29% or approximately 2.2 million of our estimated cattle needs through short-term contracts. As the final price paid cannot be determined until after delivery, the Company has estimated market prices based on Chicago Mercantile Exchange traded futures contracts and applied those to either the minimum quantities required per the contract or management’s estimates of livestock to be purchased under certain contracts to determine its estimated commitments for the purchase of livestock, which are as follows (in thousands):
| Estimated livestock purchase commitments for fiscal year ending: | |||
2009 | $ | 3,395,206 | |
2010 | 1,035,072 | ||
2011 | 862,430 | ||
2012 | 710,159 | ||
2013 | 483,723 | ||
Thereafter | 99,087 | ||
Through use of these contracts, the Company purchased approximately 70% of its hog slaughter needs during the fifty-two weeks ended December 28, 2008.
Note 14. Business segments
JBS USA Holdings is organized into two operating segments, which are also the Company’s reportable segments: Beef and Pork. In the Beef segment, we conduct our domestic and international beef processing business, including the beef operations we acquired in the Smithfield Acquisition in 2008 and the beef, lamb, and sheep operations we acquired in the Tasman Acquisition in 2008. In the Pork segment, we conduct our domestic pork and lamb processing business. Segment operating performance is evaluated by the Chief Operating Decision Maker (“CODM”), as defined in SFAS No. 131,Disclosure about Segments of an Enterprise and Related Information, based on Earnings before Interest, Taxes, Depreciation, and Amortization (“EBITDA”). EBITDA is not intended to represent cash from operations as defined by GAAP and should not be considered as an alternative to cash flow or operating income as measured by GAAP. JBS USA Holdings believes EBITDA provides useful information about
F-96
Table of Contents
JBS USA Holdings, Inc.
An indirect subsidiary of JBS S.A.
Notes to consolidated financial statements
December 28, 2008
operating performance, leverage, and liquidity. The accounting policies of the segments are consistent with those described in Note 5. All intersegment sales and transfers are eliminated in consolidation.
On November 5, 2008, the Company entered into a new senior secured revolving credit facility (see Note 8). The definition of EBITDA contained in that agreement requires EBITDA to be calculated as net income adding back taxes, depreciation, amortization and interest and excluding certain non-cash items and gain (loss) on sale of fixed assets which affect net income. The Company has changed its definition of EBITDA to align with the definition contained in that agreement and as such the amounts below reflect the new definition.
Beef—The majority of Beef’s revenues are generated from US and Australian sales of fresh meat, which include chuck cuts, rib cuts, loin cuts, round cuts, thin meats, ground beef, and other products. In addition, Swift Beef also sells beef by-products to the variety meat, feed processing, fertilizer, automotive and pet food industries. Furthermore, Australia’s Foods Division produces value-added meat products including toppings for pizzas. On May 2, 2008, JBS Southern completed the Tasman Acquisition after which it operated six processing facilities and one feedlot which are reported in the Beef segment (see Note 3). On October 23, 2008, the Company completed the Smithfield Acquisition adding four plants and eleven feedlots which are reported in the Beef segment (see Note 4).
Pork—A significant portion of Pork’s revenues are generated from the sale of products predominantly to retailers of fresh pork including trimmed cuts such as loins, roasts, chops, butts, picnics, and ribs. Other pork products, including hams, bellies, and trimmings are sold predominantly to further processors who, in turn, manufacture bacon, sausage, and deli and luncheon meats. The remaining sales are derived from by-products and from further-processed, higher-margin products. The lamb slaughter facility is included in Pork and accounts for less than 1% of total net sales.
F-97
Table of Contents
JBS USA Holdings, Inc.
An indirect subsidiary of JBS S.A.
Notes to consolidated financial statements
December 28, 2008
Corporate and other—Includes certain revenues, expenses, and assets not directly attributable to the primary segments, as well as eliminations resulting from the consolidation process.
| (in thousands) | For the fifty-two | |||
Net sales | ||||
Beef | $ | 9,975,510 | ||
Pork | 2,438,049 | |||
Corporate and other. | (51,278 | ) | ||
Total | $ | 12,362,281 | ||
Depreciation and amortization | ||||
Beef | $ | 68,721 | ||
Pork | 23,653 | |||
Total | $ | 92,374 | ||
EBITDA | ||||
Beef | $ | 284,527 | ||
Pork | 113,673 | |||
Total | 398,200 | |||
Depreciation and amortization | (92,374 | ) | ||
Interest expense, net | (36,358 | ) | ||
Foreign currency transaction losses | (75,995 | ) | ||
Loss on sales of property, plant and equipment | (1,082 | ) | ||
Income before income tax expense | $ | 192,391 | ||
Income tax expense | 31,287 | |||
Net income | $ | 161,104 | ||
Capital expenditures | ||||
Beef | $ | 89,237 | ||
Pork | 29,083 | |||
Total | $ | 118,320 | ||
F-98
Table of Contents
JBS USA Holdings, Inc.
An indirect subsidiary of JBS S.A.
Notes to consolidated financial statements
December 28, 2008
Sales by geographical area based on the location of the facility recognizing the sale (in thousands):
For the fifty-two 2008 | |||
Net sales | |||
United States | $ | 10,561,484 | |
Australia | 1,800,797 | ||
Total | $ | 12,362,281 | |
Sales to unaffiliated customers by location of customer (in thousands):
The fifty-two 2008 | |||
United States | $ | 8,789,407 | |
Japan | 792,678 | ||
Australia | 511,031 | ||
Mexico | 521,085 | ||
Korea | 296,679 | ||
Other | 1,451,401 | ||
Total | $ | 12,362,281 | |
No single customer or supplier accounted for more than 10% of net sales or cost of goods sold, respectively, during the fifty-two weeks ended December 28, 2008.
Total assets by segment (in thousands):
| December 28, 2008 | ||||
Total assets | ||||
Beef | $ | 2,909,176 | ||
Pork | 458,725 | |||
Corporate and other | (52,330 | ) | ||
Total | $ | 3,315,571 | ||
F-99
Table of Contents
JBS USA Holdings, Inc.
An indirect subsidiary of JBS S.A.
Notes to consolidated financial statements
December 28, 2008
Long-lived tangible assets by location of assets (in thousands):
December 28, 2008 | |||
Long-lived assets: | |||
United States | $ | 906,044 | |
Australia | 360,400 | ||
Other | 83 | ||
Total | $ | 1,266,527 | |
Long-lived assets consist of property, plant, and equipment, net of depreciation, and other assets less debt issuance costs, net, of $12.5 million as of December 28, 2008.
Note 15. Terminated acquisition
On February 29, 2008, JBS USA Holdings entered into an agreement with National Beef to acquire all of the outstanding membership interests for a combination of approximately $465.0 million cash, $95.0 million in JBS S.A. common stock (the purchase price) and the assumption of debt.
On October 20, 2008, the United States Department of Justice (“DOJ”) filed an injunction to stop the Company’s planned acquisition of National Beef.
On February 18, 2009 an agreement was reached with the sellers of National Beef whereby JBS USA Holdings will terminate the acquisition process of National Beef. All related litigation with the DOJ will also be terminated. As a result of the agreement JBS USA Holdings has agreed to reimburse the seller’s shareholders a total $19.9 million as full and final settlement of any and all liabilities related to the potential acquisition.
Note 16. Subsequent events
On December 29, 2008, JBS USA, Inc., was renamed JBS USA, LLC. and converted from a C corporation to a limited liability company.
On January 12, 2009, the Company received $25 thousand; including principal plus interest from an executive officer (see Note 11).
On January 27, 2009, the Company reached agreement with Smithfield Foods for final settlement of the working capital component of the purchase price pursuant to the Stock Purchase Agreement. The settlement calls for a payment of $4.5 million from Smithfield Foods to the Company as full and final settlement of the working capital delivered at October 23, 2008. The Company recorded the settlement as a reduction of purchase price upon receipt.
F-100
Table of Contents
JBS USA Holdings, Inc.
An indirect subsidiary of JBS S.A.
Notes to consolidated financial statements
December 28, 2008
On March 27, 2009, JBS S.A. assigned its five separate intercompany notes with JBS USA Holdings to JBS HU Liquidity Management LLC, a subsidiary of JBS S.A., which is organized in the country of Hungary.
On April 27, 2009, JBS USA Holdings refinanced its five separate intercompany notes with JBS HU Liquidity Management LLC into one note with a stated interest rate of 12% and a 10 year maturity (see Note 8).
On April 27, 2009 the Credit Agreement was amended to allow the execution of the senior unsecured note offering of JBS USA described below. Under the amendment, the existing limitation on distributions between JBS USA and JBS USA Holdings was amended to allow for the proceeds of the senior unsecured bond offering, less transaction expenses and $100.0 million retained by JBS USA to be remitted to JBS USA Holdings as a one time distribution. Also, the unused line fee was increased from 37.5 basis points to 50 basis points.
On April 27, 2009, JBS USA issued $700.0 million of senior unsecured notes. Interest on these notes accrues at a rate of 11.625% per annum and is payable semi-annually in arrears on May 1 and November 1 of each year, beginning on November 1, 2009. The principal amount of these notes is payable in full on May 1, 2014. The proceeds net of expenses were $650.8 million and were used to repay $100.0 million on the Credit Agreement and the balance was used to repay intercompany debt and accrued interest owed to JBS S.A. These notes are guaranteed by JBS S.A., us, JBS Hungary Holdings Kft. (a wholly owned, indirect subsidiary of JBS S.A.), and each of our U.S. restricted subsidiaries that guarantee our senior secured revolving facility (subject to certain exceptions).
Covenants. The indenture for the 11.625% senior unsecured notes due 2014 contains customary negative covenants that limit our and our restricted subsidiaries’ ability to, among other things:
| • | incur additional indebtedness based on net debt to EBITDA ratio; |
| • | incur liens; |
| • | sell or dispose of assets; |
| • | pay dividends or make certain payments to our shareholders; |
| • | permit restrictions on dividends and other restricted payments by its restricted subsidiaries; |
| • | enter into related party transactions; |
| • | enter into sale/leaseback transactions; and |
| • | undergo changes of control without making an offer to purchase the notes. |
Events of default. The indenture also contains customary events of default, including failure to perform or observe terms, covenants or other agreements in the indenture, defaults on other indebtedness if the effect is to permit acceleration, failure to make a payment on other indebtedness waived or extended within the applicable grace period, entry of unsatisfied judgments or orders against the issuer or its subsidiaries, and certain
F-101
Table of Contents
JBS USA Holdings, Inc.
An indirect subsidiary of JBS S.A.
Notes to consolidated financial statements
December 28, 2008
events related to bankruptcy and insolvency matters. If an event of default occurs, the trustee or the holders of at least 25% in aggregate principal amount of the notes then outstanding may declare such principal and accrued interest on the notes to be immediately due and payable.
Beginning in mid-April 2009 the world press began publicizing the occurrence of regionalized influenza outbreaks which were linked on a preliminary basis to a hybrid avian/swine/human virus. As a result commencing on April 14, 2009 several foreign countries including Russia, Thailand, Ukraine, Communist China, and the Philippines closed their borders to some or all pork produced in the affected states in the USA or other affected regions in the world. The company is not able to assess whether or when the influenza outbreak might lessen or whether or when additional countries might impose restrictions on the importation of pork products from the USA, nor whether or when the existing import bans might be lifted.
On April 24, 2009, the Company issued a forgivable promissory note in the amount of $0.2 million to an officer of the Company. The note bears interest at 5.25% and will be forgiven in four equal installments on the anniversary date of the loan as long as the executive continues to be an employee. If the employee is terminated for cause the entire note balance plus accrued interest will be due and payable on the termination date.
Unaudited
On July 22, 2009, JBS USA Holdings Inc. filed a registration statement on Form S-1 with the U.S. Securities and Exchange Commission, related to an offering of equity securities. Since the equity offering is subject to normal regulatory review and market conditions, the Company is not able to assess the potential impact at this time.
On July 22, 2009, a distribution of $200.0 thousand was made from JBS USA LLC to JBS USA Holdings to enable JBS USA Holdings to pay the fees associated with the registration statement described above.
On July 28, 2009, the Company issued a promissory note in the amount of $570.0 thousand to an executive officer of the Company. The note bears interest at 5.25% annually. A one time payment, including principal plus interest, is due on or before July 23, 2010.
On September 16, 2009, JBS USA Holdings and Pilgrim’s Pride Corporation (“PPC”) entered into a stock purchase agreement (“PPC Agreement”). Pursuant to the PPC Agreement, JBS USA Holdings will purchase 64% of PPC for $800.0 million. The PPC Agreement may be terminated under certain circumstances, including mutual written consent of both PPC and JBS USA Holdings. The PPC agreement also remains subject to approval by the US Bankruptcy Court for the Northern District of Texas. On September 28, 2009, a distribution of $0.3 million was paid to JBS USA Holdings by JBS USA to enable JBS USA Holdings to pay legal fees associated with the acquisition of PPC.
F-102
Table of Contents
JBS USA Holdings, Inc.
An indirect subsidiary of JBS S.A.
Notes to consolidated financial statements
December 28, 2008
On September 29, 2009 the Company announced the intent to merge the Five Rivers Plan into the existing JBS USA Plans for union and non-union employees described above effective January 1, 2010 (see Note 8).
Between October 1, 2009 and October 6, 2009, JBS USA purchased $2.0 million of the City of Cactus Bonds (see Note 4).
On October 27, 2009, the Company funded its Australian subsidiary with a U.S.$37.0 million intercompany loan from JBS USA, LLC to JBS Swift Australia Pty Ltd. to allow them to cash collateralize their letters of credit.
On November 30, 2009, JBS USA, LLC extended the secured credit/multi-option bridge facility to expire on January 31, 2010. In addition to the extension, the commitment fee of 1.4% will be replaced with 2.25% per annum, effective on December 1, 2009 (See Note 7).
In December 2009, JBS USA, LLC and Marox GmbH (a Vion group company) entered into an agreement to purchase 100% of the shares in Tatiara Meat Company for $27.5 million subject to a working capital adjustment. The agreement remains subject to conclusion of the due diligence process and approval by the Australian Competition and Consumer Commission.
On December 23, 2009, JBS USA Holdings, Inc. announced its intention to issue 33 1/3 new shares of its common stock to JBS S.A. in consideration of $2.0 billion.
We have evaluated all subsequent events through July 21, 2009, the date the consolidated financial statements were issued and December 23, 2009, the date they were re-issued in connection with the filing of Amendment 2 of the Company’s Registration Statement on Form S-1.
F-103
Table of Contents

Audit· Tax· Advisory |
Grant Thornton LLP |
200 S 6th Street, Suite 500 |
Minneapolis, MN 55402-1459 |
T 612.332.0001 |
F 612.332.8361 |
www.GrantThornton.com |
Report of independent certified public accountants
Board of Directors
JBS USA Holdings, Inc. (formerly Swift Foods Company):
We have audited the accompanying consolidated balance sheets of JBS USA Holdings, Inc. (formerly Swift Foods Company) and subsidiaries (the Company) as of December 24, 2006 and July 10, 2007 and the related consolidated statements of operations, stockholders’ equity, and cash flows for the fiscal year ended December 24, 2006 and the 198 days ended July 10, 2007 (Predecessor) and the consolidated balance sheet as of December 30, 2007 and the related consolidated statements of operations, stockholder’s equity, and cash flows for the 173 days ended December 30, 2007 (Successor). These financial statements are the responsibility of the Company’s management. Our responsibility is to express an opinion on these financial statements based on our audits.
We conducted our audits in accordance with auditing standards of the Public Company Oversight Board (United States). Those standards require that we plan and perform the audits to obtain reasonable assurance about whether the financial statements are free of material misstatement. An audit includes consideration of internal control over financial reporting as a basis for designing audit procedures that are appropriate in the circumstances, but not for the purpose of expressing an opinion on the effectiveness of the Company’s internal control over financial reporting. Accordingly, we express no such opinion. An audit also includes examining, on a test basis, evidence supporting the amounts and disclosures in the financial statements, assessing the accounting principles used and significant estimates made by management, as well as evaluating the overall financial statement presentation. We believe that our audits provide a reasonable basis for our opinion.
In our opinion, the consolidated financial statements referred to above present fairly, in all material respects, the financial position of JBS USA Holdings, Inc. and subsidiaries as of December 24, 2006 and July 10, 2007 and the results of their operations and cash flows for the fiscal year ended December 24, 2006 and the 198 days ended July 10, 2007 (Predecessor) and as of December 30, 2007 and the results of their operations and cash flows for the 173 days ended December 30, 2007 (Successor) in conformity with accounting principles generally accepted in the United States of America.

Minneapolis, Minnesota
July 1, 2009
F-104
Table of Contents
A wholly owned subsidiary of JBS S.A.
Consolidated balance sheets
(dollars in thousands)
| Predecessor | Successor | ||||||||||
| December 24, 2006 | July 10, 2007 | December 30, 2007 | |||||||||
Assets | |||||||||||
Current assets: | |||||||||||
Cash and cash equivalents | $ 83,420 | $ 44,673 | $ 198,883 | ||||||||
Restricted cash | — | — | 30,014 | ||||||||
Accounts receivable, net of allowance for doubtful accounts of $1,030, $1,466 and $1,389, respectively | 334,341 | 365,642 | 417,375 | ||||||||
Inventories | 457,829 | 487,598 | 466,756 | ||||||||
Deferred income taxes, net | 11,149 | 7,784 | 4,493 | ||||||||
Other current assets | 34,864 | 48,629 | 35,492 | ||||||||
Total current assets | 921,603 | 954,326 | 1,153,013 | ||||||||
Property, plant, and equipment, net | 487,427 | 505,172 | 708,056 | ||||||||
Goodwill | 6,811 | — | 96,345 | ||||||||
Other intangibles, net | 103,993 | 92,606 | 185,573 | ||||||||
Deferred income taxes, net | — | — | 5,434 | ||||||||
Other assets | 18,763 | 26,246 | 17,394 | ||||||||
Total assets | $1,538,597 | $1,578,350 | $2,165,815 | ||||||||
Liabilities and stockholders’ equity |
| ||||||||||
Current liabilities: | |||||||||||
Short-term debt | $ — | $ — | $ 776,287 | ||||||||
Current portion of long-term debt | 1,950 | 1,937 | 1,998 | ||||||||
Accounts payable | 179,939 | 122,821 | 179,650 | ||||||||
Book overdraft | 73,314 | 70,639 | 92,289 | ||||||||
Deferred income taxes, net | 6,696 | 9,323 | 12,885 | ||||||||
Accrued liabilities | 194,932 | 234,681 | 186,494 | ||||||||
Total current liabilities | 456,831 | 439,401 | 1,249,603 | ||||||||
Long-term debt, excluding current portion | 1,065,553 | 1,201,975 | 32,433 | ||||||||
Deferred income taxes, net | 38,914 | 23,878 | 19,688 | ||||||||
Other non-current liabilities | 17,389 | 11,914 | 25,273 | ||||||||
Total liabilities | 1,578,687 | 1,677,168 | 1,326,997 | ||||||||
Commitments and contingencies (see Note 10) | |||||||||||
Stockholders’ equity (deficit): | |||||||||||
Common stock: par value $.01 per share, shares authorized, issued and outstanding of 221,359,000, 221,359,000 and 100, respectively | 2,212 | 2,212 | — | ||||||||
Additional paid-in capital | 49,552 | 50,741 | 950,159 | ||||||||
Treasury stock at cost, 1,784,584 shares at December 24, 2006 and July 10, 2007 | (1,814 | ) | (1,814 | ) | — | ||||||
Accumulated deficit | (143,946 | ) | (226,611 | ) | (111,592 | ) | |||||
Accumulated other comprehensive income | 53,906 | 76,654 | 251 | ||||||||
Total stockholders’ equity (deficit) | (40,090 | ) | (98,818 | ) | 838,818 | ||||||
Total liabilities and stockholders’ equity | $1,538,597 | $1,578,350 | $2,165,815 | ||||||||
The accompanying notes are an integral part of this financial statement.
F-105
Table of Contents
A wholly owned subsidiary of JBS S.A.
Consolidated statements of operations
(dollars in thousands)
| Predecessor | Successor | ||||||||||
| Fiscal year ended December 24, 2006 | 198 days ended July 10, 2007 | 173 days ended December 30, 2007 | |||||||||
Gross sales | $9,747,029 | $5,000,046 | $5,014,381 | ||||||||
Less deductions from sales | (55,597 | ) | (29,422 | ) | (25,397 | ) | |||||
Net sales | 9,691,432 | 4,970,624 | 4,988,984 | ||||||||
Cost of goods sold | 9,574,715 | 4,920,594 | 5,013,084 | ||||||||
Gross profit (loss) | 116,717 | 50,030 | (24,100 | ) | |||||||
Selling, general, and administrative expenses | 158,783 | 92,333 | 60,727 | ||||||||
Foreign currency transaction gains | (463 | ) | (527 | ) | (5,201 | ) | |||||
Other income, net | (4,937 | ) | (3,821 | ) | (3,581 | ) | |||||
(Gain) loss on sales of property, plant, and equipment | (666 | ) | (2,946 | ) | 182 | ||||||
Interest expense, net | 118,754 | 66,383 | 34,340 | ||||||||
Loss before income tax expense | (154,754 | ) | (101,392 | ) | (110,567 | ) | |||||
Income tax (benefit) expense | (37,348 | ) | (18,380 | ) | 1,025 | ||||||
Net loss | $ (117,406 | ) | $ (83,012 | ) | $ (111,592 | ) | |||||
The accompanying notes are an integral part of this financial statement.
F-106
Table of Contents
A wholly owned subsidiary of JBS S.A.
Consolidated statements of cash flows
(dollars in thousands)
| Predecessor | Successor | ||||||||||||
| Fiscal year ended December 24, 2006 | 198 days ended July 10, 2007 | 173 days ended December 30, 2007 | |||||||||||
Cash flows from operating activities: | |||||||||||||
Net loss | $(117,406 | ) | $(83,012 | ) | $(111,592 | ) | |||||||
Adjustments to reconcile net loss to net cash provided by (used in) operating activities: | |||||||||||||
Depreciation | 73,611 | 38,904 | 30,085 | ||||||||||
Amortization of intangibles | 11,023 | 5,934 | 5,159 | ||||||||||
Goodwill impairment charge | 4,488 | — | — | ||||||||||
Amortization of debt issuance costs | 9,991 | 6,226 | 883 | ||||||||||
PIK interest (Seller Note, Convertible Senior Note and Senior Notes due 2010) | 37,994 | 21,333 | — | ||||||||||
(Gain) loss on sales of property, plant and equipment | (666 | ) | (2,946 | ) | 182 | ||||||||
Deferred income taxes | (38,324 | ) | (22,078 | ) | (177 | ) | |||||||
Stock based compensation | 853 | 1,189 | — | ||||||||||
Foreign currency transaction gains on intercompany note | — | — | (4,457 | ) | |||||||||
Other non-cash | (279 | ) | — | — | |||||||||
Change in assets and liabilities, net of impact of acquisition: | |||||||||||||
Restricted cash | — | — | (30,014 | ) | |||||||||
Accounts receivable, net | 46,613 | (24,781 | ) | (57,625 | ) | ||||||||
Inventories | 47,919 | (10,327 | ) | 32,851 | |||||||||
Other current assets | 9,202 | 3,979 | 19,414 | ||||||||||
Accounts payable and accrued liabilities | (18,080 | ) | (45,009 | ) | 7,171 | ||||||||
Noncurrent assets | 884 | (73 | ) | 336 | |||||||||
Net cash flows provided by (used in) operating activities | 67,823 | (110,661 | ) | (107,784 | ) | ||||||||
Cash flows from investing activities: | |||||||||||||
Purchases of property, plant and equipment | (47,294 | ) | (33,700 | ) | (33,461 | ) | |||||||
Proceeds from disposal of NonFed Plants | 29,648 | — | — | ||||||||||
Proceeds from sales of property, plant, and equipment | 5,607 | 5,203 | 379 | ||||||||||
Proceeds from sales of water rights | — | 2,872 | — | ||||||||||
Investment in bonds | — | (11,000 | ) | — | |||||||||
Purchase of nonoperating real property | — | — | (2,629 | ) | |||||||||
Notes receivable and other | 116 | 8,848 | — | ||||||||||
Costs associated with acquisition by parent, net of cash acquired $44,673 | — | — | (3,698 | ) | |||||||||
Net cash flows used in investing activities | (11,923 | ) | (27,777 | ) | (39,409 | ) | |||||||
Cash flows from financing activities: | |||||||||||||
Net borrowings (payments) of revolver | (7,779 | ) | 104,316 | — | |||||||||
Net payments of short-term debt | — | — | (296,550 | ) | |||||||||
Proceeds from debt issuance | — | — | 750,000 | ||||||||||
Payments of debt | (2,653 | ) | (1,149 | ) | (851,736 | ) | |||||||
Change in overdraft balances | (15,265 | ) | (2,675 | ) | 21,650 | ||||||||
Investment from parent | — | — | 950,159 | ||||||||||
Repurchase of common stock | (250 | ) | — | — | |||||||||
Payment to previous shareholders in conjunction with acquisition by parent | — | — | (225,000 | ) | |||||||||
Debt issuance costs | — | — | (1,812 | ) | |||||||||
Net cash flows provided by (used in) financing activities | (25,947 | ) | 100,492 | 346,711 | |||||||||
Effect of exchange rate changes on cash | 1,403 | (801 | ) | (635 | ) | ||||||||
Net change in cash and cash equivalents | 31,356 | (38,747 | ) | 198,883 | |||||||||
Cash and cash equivalents, beginning of period | 52,064 | 83,420 | — | ||||||||||
Cash and cash equivalents, end of period | $ 83,420 | $ 44,673 | $ 198,883 | ||||||||||
Non-cash investing and financing activities: | |||||||||||||
Construction in process under deemed capital lease | $ — | $ 7,559 | $ 664 | ||||||||||
Supplemental information: | |||||||||||||
Cash paid for interest | $ 74,887 | $ 45,707 | $ 26,270 | ||||||||||
Cash paid/(received) for income taxes | $ 4,317 | $ (3,150 | ) | $ 1,022 | |||||||||
The accompanying notes are an integral part of this financial statement.
F-107
Table of Contents
A wholly owned subsidiary of JBS S.A.
Consolidated statements of stockholders’ equity
(dollars in thousands)
| Common stock issued | Treasury shares | Common stock | Additional paid-in capital | Treasury stock | Accumulated deficit | Accumulated other comprehensive income | Total stockholders’ equity | ||||||||||||||
Predecessor | |||||||||||||||||||||
Balance at December 25, 2005 | 221,359,000 | (1,537,151 | ) | $2,212 | $ 48,699 | $(1,564 | ) | $ (26,540 | ) | $39,775 | $ 62,582 | ||||||||||
Repurchase of common stock | — | (247,433 | ) | — | — | (250 | ) | — | — | (250 | ) | ||||||||||
Stock based compensation | — | — | — | 853 | — | — | — | 853 | |||||||||||||
Comprehensive loss: | |||||||||||||||||||||
Net loss | — | — | — | — | — | (117,406 | ) | — | (117,406 | ) | |||||||||||
Derivative adjustment, net of tax of $1,169 | — | — | — | — | — | — | (1,267 | ) | (1,267 | ) | |||||||||||
Foreign currency translation adjustment | — | — | — | — | — | — | 15,398 | 15,398 | |||||||||||||
Total comprehensive loss | (103,275 | ) | |||||||||||||||||||
Balance at December 24, 2006 | 221,359,000 | (1,784,584 | ) | 2,212 | 49,552 | (1,814 | ) | (143,946 | ) | 53,906 | (40,090 | ) | |||||||||
Stock based compensation | — | — | — | 1,189 | — | — | — | 1,189 | |||||||||||||
Cumulative effect of adoption of FIN 48 | — | — | — | — | — | 347 | — | 347 | |||||||||||||
Comprehensive loss: | |||||||||||||||||||||
Net loss | — | — | — | — | — | (83,012 | ) | — | (83,012 | ) | |||||||||||
Derivative adjustment, net of tax of $217 | — | — | — | — | — | — | 1,959 | 1,959 | |||||||||||||
Foreign currency translation adjustment | — | — | — | — | — | — | 20,789 | 20,789 | |||||||||||||
Total comprehensive loss | (60,264 | ) | |||||||||||||||||||
Balance at July 10, 2007 | 221,359,000 | (1,784,584 | ) | $2,212 | $ 50,741 | $(1,814 | ) | $(226,611 | ) | $76,654 | $ (98,818 | ) | |||||||||
Successor | |||||||||||||||||||||
Investment from parent | 100 | — | $ — | $950,159 | $ — | $ — | $ — | $950,159 | |||||||||||||
Comprehensive loss: | |||||||||||||||||||||
Net loss | — | — | — | — | — | (111,592 | ) | — | (111,592 | ) | |||||||||||
Derivative adjustment, net of tax of $186 | — | — | — | — | — | — | (422 | ) | (422 | ) | |||||||||||
Foreign currency translation adjustment | — | — | — | — | — | — | 673 | 673 | |||||||||||||
Total comprehensive loss | (111,341 | ) | |||||||||||||||||||
Balance at December 30, 2007 | 100 | — | $ — | $950,159 | $ — | $(111,592 | ) | $ 251 | $838,818 | ||||||||||||
The accompanying notes are an integral part of this financial statement.
F-108
Table of Contents
A wholly owned subsidiary of JBS S.A.
Notes to consolidated financial statements
Note 1. Description of business
JBS USA Holdings, Inc. (“JBS USA Holdings” or the “Company” or “we”), formerly known as Swift Foods Company (“Swift Foods”) and JBS USA, Inc., is a Delaware corporation and a wholly owned subsidiary of JBS S.A., a Brazilian company (“JBS”). JBS USA Holdings owns all of JBS USA, Inc. (“JBS USA”) which is the operating entity (See Note 12). JBS USA and its subsidiaries constitute the operations of JBS USA Holdings as reported under accounting principles generally accepted in the United States of America (“GAAP”).
JBS USA is the leading beef processor and one of the leading pork processing companies in the world. The Company processes, prepares, packages, and delivers fresh, further processed and value-added beef, pork and lamb products for sale to customers in the United States and in international markets. The Company also provides services to its customers designed to help them develop more sophisticated and profitable sales programs. JBS USA sells its meat products to customers in the foodservice, international, further processor, and retail distribution channels. The Company also produces and sells by-products that are derived from its meat processing operations, such as hides and variety meats, to customers in various industries.
JBS USA conducts its domestic beef and pork processing businesses through Swift Beef Company (“Swift Beef”) and Swift Pork Company (“Swift Pork”) and its Australian beef business through Swift Australia Pty. Ltd. (“Swift Australia”). The Company has two reportable segments comprised of Beef and Pork which, for the fiscal year ended December 24, 2006, the 198 days ended July 10, 2007 and the 173 days ended December 30, 2007, represented approximately 78.1% and 21.9%, 75.5% and 24.5% and 78.9% and 21.1% of net sales, respectively. During the periods covered by these financial statements, the Company operated four beef processing facilities, three pork processing facilities, one lamb slaughter facility, and one value-added facility in the United States and four beef processing facilities and four feedlots in Australia (See Note 12).
Note 2. Acquisition and refinancing of JBS USA Holdings, Inc.
On July 11, 2007, JBS acquired Swift Foods (the “Acquisition”). Concurrent with the closing of the Acquisition, the entity formerly known as Swift Foods was renamed JBS USA, Inc. and later renamed JBS USA Holdings, Inc. The aggregate purchase price for the Acquisition was $1,470.6 million (including approximately $48.5 million of transaction costs), as shown below. JBS USA Holdings also refinanced its debt and the outstanding debt assumed at the date of the Acquisition was paid off using proceeds from $750 million of various debt instruments and additional equity contributions from JBS (See Note 6). As a result of the Acquisition, the financial statements of JBS USA Holdings reflect the acquisition being accounted for as a purchase in accordance with Statement of Financial Accounting Standard (“SFAS”) No. 141,Business Combinations (“SFAS No. 141”).
The purchase price allocation is based on an independent valuation of assets and liabilities acquired. The allocation presented below reflects the preliminary fair value of the individual
F-109
Table of Contents
JBS USA Holdings, Inc.
A wholly owned subsidiary of JBS S.A.
Notes to consolidated financial statements
assets and liabilities of JBS USA Holdings as of July 11, 2007 (in thousands). Subsequent to the completion of the December 2007 balance sheet the preliminary purchase price allocation was finalized in September 2008 (See Note 12).
| Purchase price paid to previous shareholders | $ 225,000 | |||
Debt assumed including accrued interest of $22,872 | 1,197,124 | |||
Fees and direct expenses | 48,490 | |||
Total purchase price | $ | 1,470,614 | ||
Preliminary purchase price allocation: | ||||
Current assets and liabilities | $ | 583,833 | ||
Property, plant, and equipment | 693,672 | |||
Identified intangibles | 190,732 | |||
Deferred tax liability | (110 | ) | ||
Goodwill | 97,194 | |||
Other noncurrent assets and liabilities, net | (94,707 | ) | ||
Total purchase price allocation | $ | 1,470,614 | ||
The debt refinancing in conjunction with the acquisition was financed in part using the following sources (in thousands):
| Loan Agreements due June 30, 2008 | $400,000 | ||
Credit Agreement due July 6, 2008 | 250,000 | ||
Loan Agreement due July 7, 2008 | 100,000 | ||
| $ | 750,000 | ||
The impact of the Acquisition on the financial statements of JBS USA Holdings was the identification of intangible assets, adjustment of assets and liabilities to fair value, and an equity investment from its parent and payoff of certain outstanding debt. Although certain of the outstanding debt of JBS USA Holdings was paid off or refinanced in conjunction with the Acquisition and replaced with an equity investment from its parent, the parent does have debt outstanding and JBS USA Holdings could be called upon to provide funding to meet debt service requirements.
Note 3. Basis of presentation and accounting policies
Consolidation
The consolidated financial statements include the accounts of JBS USA Holdings and its direct and indirect wholly-owned subsidiaries. All intercompany transactions have been eliminated.
F-110
Table of Contents
JBS USA Holdings, Inc.
A wholly owned subsidiary of JBS S.A.
Notes to consolidated financial statements
Use of estimates
The consolidated financial statements have been prepared in conformity with GAAP using management’s best estimates and judgments where appropriate. These estimates and judgments affect the reported amounts of assets and liabilities and disclosure of the contingent assets and liabilities at the date of the financial statements. The estimates and judgments will also affect the reported amounts for certain revenues and expenses during the reporting period. Actual results could differ materially from these estimates and judgments. Significant estimates made by the Company include the allowance for doubtful accounts, reserves related to inventory obsolescence or valuation, insurance accruals, and tax accruals.
Restricted cash
JBS USA Holdings has outstanding letters of credit, supporting current liabilities, which are collateralized by cash. As this cash is not available for operations and is not considered highly liquid it is classified as restricted cash.
Cash and cash equivalents
JBS USA Holdings considers all highly liquid investments with an original maturity of three months or less when purchased to be cash equivalents. The carrying value of these assets approximates the fair market value. Financial instruments which potentially subject JBS USA Holdings to concentration of credit risk consist principally of cash and temporary cash investments. At times, cash balances held at financial institutions were in excess of Federal Deposit Insurance Corporation insurance limits. JBS USA Holdings places its temporary cash investments with high quality financial institutions. JBS USA Holdings believes no significant concentration of credit risk exists with respect to these cash investments.
Investment in auction rate securities
During the 173 days ended December 30, 2007, JBS USA Holdings invested in auction rate securities based on its cash needs and available cash balances. As of December 30, 2007 the Company held no investments in auction rate securities. The Company considered these investments to be available-for-sale in accordance with SFAS No. 115,Accounting for Certain Investments in Debt and Equity Securities, and, as such, the cash flows associated with these investments have been reflected in investing activities. Realized gains recorded in interest income for the period July 11 through December 30, 2007 totaled $2.7 million.
Accounts receivable and allowance for doubtful accounts
The Company has a diversified customer base which includes some customers who are located in foreign countries. The Company controls credit risk related to accounts receivable through credit worthiness reviews, credit limits, letters of credit, and monitoring procedures.
F-111
Table of Contents
JBS USA Holdings, Inc.
A wholly owned subsidiary of JBS S.A.
Notes to consolidated financial statements
The Company evaluates the collectability of its accounts receivable based on a general analysis of past due receivables, and a specific analysis of certain customers which management believes will be unable to meet their financial obligations due to economic conditions, industry-specific conditions, historic or anticipated performance, and other relevant circumstances. The Company continuously performs credit evaluations and reviews of its customer base. The Company will write-off an account when collectability is not reasonably assured. The Company believes this process effectively mitigates its exposure to bad debt write-offs; however, if circumstances related to changes in the economy, industry, or customer conditions change, the Company may need to subsequently adjust the allowance for doubtful accounts.
The Company adheres to customary industry terms of net seven days. The Company considers all domestic accounts over 14 days as past due and all international accounts over 30 days past due. Activity in the allowance for doubtful accounts is as follows (in thousands):
| Predecessor | Successor | ||||||||||
| Fiscal year ended December 24, 2006 | 198 days ended July 10, 2007 | 173 days ended December 30, 2007 | |||||||||
Balance, beginning of period | $1,701 | $1,030 | $1,466 | ||||||||
Bad debt provision (decrease) | (793 | ) | 512 | (115 | ) | ||||||
Write-offs, net of recoveries | 122 | (76 | ) | 36 | |||||||
Effect of exchange rates | — | — | 2 | ||||||||
Balance, end of period | $1,030 | $1,466 | $1,389 | ||||||||
Inventories
Inventories consist primarily of product, livestock, and supplies. Product inventories are considered commodities and are primarily valued based on quoted commodity prices. Australian product inventories are valued based on the lower of cost or net realizable value. Livestock inventories are valued on the basis of the lower of first-in, first-out cost or market. Costs capitalized into livestock inventory include cost of feeder livestock, direct materials, supplies, and feed. Cattle, hogs, and lamb are reclassified from livestock to work in process at time of slaughter. Supply inventories are carried at historical cost. The components of inventories, net of reserves, are as follows (in thousands):
| Predecessor | Successor | |||||||
| December 24, 2006 | July 10, 2007 | December 30, 2007 | ||||||
Livestock | $105,033 | $122,853 | $96,851 | |||||
Product inventories: | ||||||||
Work in progress | 29,561 | 43,671 | 37,127 | |||||
Finished goods | 277,433 | 277,348 | 292,157 | |||||
Supplies | 45,802 | 43,726 | 40,621 | |||||
| $457,829 | $487,598 | $466,756 | ||||||
F-112
Table of Contents
JBS USA Holdings, Inc.
A wholly owned subsidiary of JBS S.A.
Notes to consolidated financial statements
Other Current Assets
Other current assets include prepaid expenses which are amortized over the period the Company expects to receive the benefit.
Property, plant and equipment
Property, plant and equipment was recorded at cost and was adjusted to fair value at the date of the Acquisition. Subsequent additions are recorded at cost. Depreciation is recorded using the straight-line method over the estimated useful lives of the assets as follows.
| Furniture, fixtures, office equipment and other | 5 to 7 years | |
Machinery and equipment | 5 to 15 years | |
Buildings and improvements | 15 to 40 years | |
Leasehold improvements | shorter of useful life or the lease term | |
The costs of developing internal-use software are capitalized and amortized when placed in service over the expected useful life of the software. Major renewals and improvements are capitalized while maintenance and repairs are expensed as incurred. The Company has historically and currently accounts for planned major maintenance activities as they are incurred. Upon the sale or retirement of assets, the cost and related accumulated depreciation or amortization are eliminated from the respective accounts and any resulting gains or losses are reflected in earnings. Applicable interest charges incurred during the construction of assets are capitalized as one of the elements of cost and are amortized over the assets’ estimated useful lives. During the fiscal year ended December 24, 2006, the 198 days ended July 10, 2007 and the 173 days ended December 30, 2007, JBS USA Holdings capitalized $0.3 million, $0.4 million and $0.4 million of interest charges, respectively. Assets held under capital lease are classified in property, plant, and equipment and amortized over the lease term. Lease amortization is included in depreciation expense. As of December 24, 2006, July 10, 2007 and December 30, 2007, JBS USA Holdings had $3.7 million, $6.1 million and $6.8 million in commitments outstanding for capital projects, respectively. At December 30, 2007, the Company also had a commitment to purchase $15.5 million of bonds, as discussed in other assets.
JBS USA Holdings assesses the recoverability of long-lived assets whenever events or changes in circumstances indicate the carrying amount of an asset may not be recoverable. When future undiscounted cash flows of assets are estimated to be insufficient to recover their related carrying value, the Company compares the asset’s future cash flows, discounted to present value using a risk-adjusted discount rate, to its current carrying value and records a provision for impairment as appropriate.
F-113
Table of Contents
JBS USA Holdings, Inc.
A wholly owned subsidiary of JBS S.A.
Notes to consolidated financial statements
Property, plant, and equipment, net are comprised of the following (in thousands):
| Predecessor | Successor | ||||||||||
| December 24, 2006 | July 10, 2007 | December 30, 2007 | |||||||||
Land | $ 54,058 | $ 58,580 | $ 59,832 | ||||||||
Buildings, machinery, and equipment | 628,844 | 657,681 | 596,954 | ||||||||
Property and equipment under capital lease | 21,130 | 20,893 | 16,776 | ||||||||
Furniture, fixtures, office equipment, and other | 55,259 | 58,269 | 32,527 | ||||||||
Construction in progress | 18,473 | 41,477 | 30,915 | ||||||||
| 777,764 | 836,900 | 737,004 | |||||||||
Less accumulated depreciation | (290,337 | ) | (331,728 | ) | (28,948 | ) | |||||
| $ 487,427 | $ 505,172 | $708,056 | |||||||||
Accumulated depreciation includes accumulated amortization on capitalized leases of approximately $7.1 million, $7.8 million and $0.9 million as of December 24, 2006, July 10, 2007 and December 30, 2007, respectively. For the fiscal year ended December 24, 2006, the Company recognized $63.9 million and $9.7 million of depreciation expense in cost of goods sold and selling, general, and administrative expenses in the statement of operations, respectively. For the 198 days ended July 10, 2007, the Company recognized $33.8 million and $5.2 million of depreciation expense in cost of goods sold and selling, general, and administrative expenses in the statement of operations, respectively. For the 173 days ended December 30, 2007, the Company recognized $23.9 million and $6.2 million of depreciation expense in cost of goods sold and selling, general, and administrative expenses in the statement of operations, respectively.
JBS USA Holdings monitors certain asset retirement obligations in connection with its operations. These obligations relate to clean-up, removal or replacement activities and related costs for “in-place” exposures only when those exposures are moved or modified, such as during renovations of its facilities. These in-place exposures include asbestos, refrigerants, wastewater, oil, lubricants and other contaminants common in manufacturing environments. Under existing regulations, JBS USA Holdings is not required to remove these exposures and there are no plans or expectations of plans to undertake a renovation that would require removal of the asbestos nor remediation of the other in place exposures at this time. The facilities are expected to be maintained and repaired by activities that will not result in the removal or disruption of these in place exposures. As a result, there is an indeterminate settlement date for these asset retirement obligations because the range of time over which JBS USA Holdings may incur these liabilities is unknown and cannot be estimated. Therefore, JBS USA Holdings cannot reasonably estimate the fair value of the potential liability.
F-114
Table of Contents
JBS USA Holdings, Inc.
A wholly owned subsidiary of JBS S.A.
Notes to consolidated financial statements
Other Assets
Other assets at December 24, 2006 include notes receivable totaling $7.6 million, from the City of Cactus, Texas (the “City”). In December 2002, Swift Beef loaned $2.3 million to the City for use by the City to secure acreage for the construction of the City’s new wastewater treatment plant. JBS USA Holdings owns a beef processing facility, as well as a wet blue hide processing facility which will be served by the new treatment plant. The loan was for an original two-year term and accrued interest at 6%. The loan was amended in December 2004 to extend the maturity for up to one year and was extended for an additional year in December 2005 and again for an additional year in December 2006. An additional loan was made by Swift Beef to the City in the amount of $3.5 million in January 2005 to secure additional acreage and was amended in December 2005 and again in December 2006 to extend the maturity for up to one year. A final loan in the amount of $1.8 million was made to the City to secure final acreage in September 2005 and was amended in September 2006 to extend the maturity for up to one year. In March 2007, the maturity dates of the notes receivable were amended to be on the demand of Swift Beef to the extent that debt securities have been issued by the City in amounts sufficient to repay the loans but in no event later than December 31, 2012. Interest income on the notes is recognized as an offset to interest expense and is payable upon maturity of the notes. In August 2006, the State of Texas approved the issuance of a wastewater treatment permit which was issued on November 9, 2006.
Effective May 15, 2007, Swift Beef entered into an Installment Bond Purchase Agreement (the “Purchase Agreement”) with the City. Under the Purchase Agreement, Swift Beef agreed to purchase up to $26.5 million of the “City of Cactus, Texas Sewer System Revenue Improvement and Refunding Bonds, Taxable Series 2007” to be issued by the City (the “Bonds”) . The Bonds are being issued by the City to finance improvements to its sewer system (the “System”) which is utilized by Swift Beef’s processing plant located in Cactus, Texas (the “Plant”) as well as other industrial users and the citizens of the community of Cactus. Swift Beef will purchase the Bonds in installments upon receipt of Bond installment requests from the City as the System improvements are completed through an anticipated completion date of June 2010. The interest rate on the Bonds is the six-month LIBOR plus 350 basis points. The Bonds mature on June 1, 2032 and are subject to annual mandatory sinking fund redemption beginning on June 1, 2011. The principal and interest on the Bonds will be paid by the City from the net revenues of the System. At December 30, 2007, $8.2 million had been recognized as construction in process and construction financing by the Company. At the date of the Acquisition and at December 30, 2007, Swift Beef held $11.0 million of the Bonds.
On May 21, 2007, in connection with the purchase of the Bonds, Swift Beef entered into a Water & Wastewater Services Agreement (the “Wastewater Agreement”) with the City under which the City will provide water and wastewater services for the Plant at the rates set forth in the Wastewater Agreement. Swift Beef’s payments for the City’s treatment of wastewater from the Plant will include a capacity charge in the amount required to be paid by the City to pay the principal of, and interest on, the Bonds.
F-115
Table of Contents
JBS USA Holdings, Inc.
A wholly owned subsidiary of JBS S.A.
Notes to consolidated financial statements
On June 1, 2007, Swift Beef purchased the initial installment of Bonds in the amount of $11.0 million. The City repaid the former notes receivable of $7.6 million and accrued interest totaling $1.3 million on June 1, 2007.
The Company has evaluated the impact of EITF No. 01-08,Determining Whether an Arrangement Contains a Lease, as well as EITF No. 97-10,The Effect of Lessee Involvement in Asset Construction, and has determined that it will be required to reflect the wastewater treatment facility as a capital asset (similar to a capital leased asset) as it will be the primary user of the wastewater facility based on projections of volume of throughput. As the City spends funds to construct the facility, the Company will record construction in process and the related construction financing. Construction in progress and construction financing by the Company at July 10, 2007 and December 30, 2007 was $7.6 million and $8.2 million, respectively.
Debt issuance costs
Costs related to the issuance of debt are capitalized and amortized to interest expense over the period the debt is outstanding. Amortization of debt issuance costs for the fiscal year ended December 24, 2006, the 198 days ended July 10, 2007 and the 173 days ended December 30, 2007 was $10.0 million, $6.2 million and $0.9 million, respectively.
In addition the Company recognized $12.7 million in interest expense for the period ended December 30, 2007 for debt not issued.
Goodwill and other intangible assets
Goodwill and other intangible assets with indefinite lives are not amortized and are tested for impairment at least on an annual basis or more frequently if impairment indicators arise, as required by SFAS No. 142,Goodwill and Other Intangible Assets (“SFAS No. 142”). Identifiable intangible assets with definite lives are amortized over their estimated useful lives. On an annual basis, JBS USA Holdings performs testing for impairment using a fair-value based approach and, if there is impairment, the carrying amount of goodwill and other non-amortizing intangible assets are written down to the implied fair value. Before the Acquisition, the Company’s annual impairment testing date was in May and was subsequently changed to December in May 2008. Goodwill resulting from the preliminary purchase price allocation from the Acquisition totaled $97.2 million (See Note 12).
For the fiscal year ended December 24, 2006, the Company completed its annual impairment testing of goodwill and identifiable intangible assets with indefinite lives in May 2006. As a result of this testing, the Company recorded an impairment charge totaling $4.5 million related to the goodwill of its Beef segment in the cost of goods sold line in the Statement of Operations.
During the 198 day period ended July 10, 2007, the Company recorded an adjustment to goodwill of $6.8 million related to the reversal of tax reserves which were established as part of the predecessor original 2002 purchase accounting transaction. Under EITF 93-7, the reversal of
F-116
Table of Contents
JBS USA Holdings, Inc.
A wholly owned subsidiary of JBS S.A.
Notes to consolidated financial statements
tax contingencies related to purchase accounting are recognized as reductions of book goodwill when it is determined that the original reserve is no longer needed.
The table below shows a roll forward of goodwill by segment for the periods ended December 24, 2006, July 10, 2007 and December 30, 2007 (in thousands). The “other” category included in the roll forward is comprised of translation and other adjustments made to goodwill.
Predecessor
| December 25, 2005 | Additions | Impairments | Other | December 24, 2006 | |||||||
Beef | $ 4,318 | $— | $(4,488 | ) | $170 | $ — | |||||
Pork | 6,811 | — | — | — | 6,811 | ||||||
Total | $11,129 | $— | $(4,488 | ) | $170 | $6,811 | |||||
| December 24, 2006 | Additions | Impairments | Other | July 10, 2007 | |||||||
Beef | $ — | $— | $— | $ — | $— | ||||||
Pork | 6,811 | — | — | (6,811 | ) | — | |||||
Total | $6,811 | $— | $— | $(6,811 | ) | $— | |||||
Successor
July 11, 2007 | Additions | Impairments | Other | December 30, 2007 | |||||||
Beef | $— | $53,414 | $— | $(849 | ) | $52,565 | |||||
Pork | — | 43,780 | — | — | 43,780 | ||||||
Total | $— | $97,194 | $— | $(849 | ) | $96,345 | |||||
Other identifiable intangible assets as of December 24, 2006, July 10, 2007 and December 30, 2007 are as follows (in thousands):
| Predecessor | ||||||||||
| December 24, 2006 | ||||||||||
| Gross carrying amount | Accumulated amortization | Net carrying amount | ||||||||
Amortizing: | ||||||||||
Patents | $ | 3,429 | $ | (1,696 | ) | $ | 1,733 | |||
Customer relationships | 124,640 | (36,861 | ) | 87,779 | ||||||
Mineral rights | 810 | (95 | ) | 715 | ||||||
Subtotal amortizing intangibles | 128,879 | (38,652 | ) | 90,227 | ||||||
Non-amortizing: | ||||||||||
Water rights | 3,628 | — | 3,628 | |||||||
Trademark | 10,138 | — | 10,138 | |||||||
Subtotal non-amortizing intangibles | 13,766 | — | 13,766 | |||||||
Total intangibles | $ | 142,645 | $ | (38,652) | $ | 103,993 | ||||
F-117
Table of Contents
JBS USA Holdings, Inc.
A wholly owned subsidiary of JBS S.A.
Notes to consolidated financial statements
| Predecessor | ||||||||||
| July 10, 2007 | ||||||||||
| Gross carrying amount | Adjustments | Accumulated amortization | Net carrying amount | |||||||
Patents | $ 3,429 | $ — | $ (1,904 | ) | $ 1,525 | |||||
Customer relationships | 129,366 | (5,640 | ) | (43,783 | ) | 79,943 | ||||
Mineral rights | 813 | — | (115 | ) | 698 | |||||
Subtotal amortizing intangibles | 133,608 | (5,640 | ) | (45,802 | ) | 82,166 | ||||
Non-amortizing: | ||||||||||
Water rights | 3,628 | (3,326 | ) | — | 302 | |||||
Trademarks | 10,138 | — | — | 10,138 | ||||||
Subtotal non-amortizing intangibles | 13,766 | (3,326 | ) | — | 10,440 | |||||
Total intangibles | $147,374 | $(8,966 | ) | $(45,802 | ) | $92,606 | ||||
Patents consist of exclusive marketing rights and are being amortized over the life of the related agreements, which range from 10 to 16 years. The Customer relationship intangible is being amortized on an accelerated basis over its expected useful life of 20 years representing management’s estimate of the period of expected economic benefit. Mineral rights are being amortized over its expected useful life of 20 years. For the fiscal year ended December 24, 2006 and the 198 days ended July 10, 2007, JBS USA Holdings, Inc. recognized $11.0 million and $5.9 million of amortization expense, respectively.
As part of the EITF 93-7 tax adjustment discussed above, the Company also recorded an adjustment of $5.6 million to reverse tax reserves established in the 2002 purchase accounting transaction.
F-118
Table of Contents
JBS USA Holdings, Inc.
A wholly owned subsidiary of JBS S.A.
Notes to consolidated financial statements
The adjustment to non-amortizing intangibles reflects the sale of water rights at a carrying value of $3.3 million during the period ended July 10, 2007.
| Successor | |||||||
| December 30, 2007 | |||||||
| Gross carrying amount | Accumulated amortization | Net carrying amount | |||||
Amortizing: | |||||||
Customer relationships | $129,000 | $(4,137 | ) | $124,863 | |||
Customer contracts | 15,400 | (441 | ) | 14,959 | |||
Patents | 5,200 | (227 | ) | 4,973 | |||
Rental contract | 3,507 | (185 | ) | 3,322 | |||
Deferred revenue | 1,483 | (148 | ) | 1,335 | |||
Mineral rights | 742 | (21 | ) | 721 | |||
Subtotal amortizing intangibles | 155,332 | (5,159 | ) | 150,173 | |||
Non-amortizing: | |||||||
Trademark | 33,300 | — | 33,300 | ||||
Water rights | 2,100 | — | 2,100 | ||||
Subtotal non-amortizing intangibles | 35,400 | — | 35,400 | ||||
Total intangibles | $190,732 | $(5,159 | ) | $185,573 | |||
The customer relationship intangible and customer contract intangible are amortized on an accelerated basis over 12 and 7 years respectively, representing management’s estimate of the period of expected economic benefit and yearly customer profitability.
Patents consist of exclusive marketing rights and are being amortized over the life of the related agreements, which range from 6 to 20 years. For the 173 days ended December 30, 2007, JBS USA Holdings, Inc. recognized $5.2 million of amortization expense. Based on amortizing assets recognized as of December 30, 2007, amortization expense for each of the next five years is estimated as follows (in thousands):
| Estimated amortization expense for fiscal years ending (in thousands): | |||
2008 | $ | 16,126 | |
2009 | 19,857 | ||
2010 | 19,232 | ||
2011 | 18,317 | ||
2012 | 16,740 | ||
Overdraft balances
The majority of JBS USA Holdings bank accounts are zero balance accounts where cash needs are funded as checks are presented for payment by the holder. Checks issued pending clearance
F-119
Table of Contents
JBS USA Holdings, Inc.
A wholly owned subsidiary of JBS S.A.
Notes to consolidated financial statements
result in overdraft balances for accounting purposes and the change in the related balance is reflected in financing activities on the statement of cash flows.
Self-insurance
JBS USA Holdings is self-insured for employee medical and dental benefits and purchases insurance policies with deductibles for certain losses relating to worker’s compensation and general liability. The Company has purchased stop-loss coverage in order to limit its exposure to any significant levels of certain claims. Self-insured losses are accrued based upon periodic third party actuarial reports of the aggregate uninsured claims incurred using actuarial assumptions accepted in the insurance industry and the Company’s historical experience rates. JBS USA Holdings has recorded a prepaid asset with an offsetting liability to reflect the amounts estimated as due for claims incurred and accrued but not yet paid to the claimant by the third party insurance company in accordance with SFAS No. 140,Accounting for Transfers and Servicing of Financial Assets and Extinguishments of Liabilities.
Environmental expenditures and remediation liabilities
Environmental expenditures that relate to current or future operations and which improve operational capabilities are capitalized at time of incurrence. Expenditures that relate to an existing or prior condition caused by past operations, and which do not contribute to current or future revenue generation, are expensed. Liabilities are recorded when environmental assessments and/or remedial efforts are probable and the costs can be reasonably estimated.
Foreign currency translation
For foreign operations, the local currency is the functional currency. Translation into US dollars is performed for assets and liabilities at the exchange rates as of the balance sheet date. Income and expense accounts are translated at average exchange rates for the period. Adjustments resulting from the translation are reflected as a separate component of other comprehensive income. Translation gains and losses on US dollar denominated revolving intercompany borrowings between the Australian subsidiaries and the US parent are recorded in earnings. Translation gains and losses on US dollar denominated intercompany borrowings between the Australian subsidiary and the US parent and which are deemed to be part of the investment in the subsidiary are recorded in other comprehensive income. The balance of foreign currency translation, net of tax in other comprehensive income at December 24, 2006, July 10, 2007 and December 30, 2007 was $55.3 million, $76.1 million and $0.7 million, respectively.
Income taxes
Income taxes are accounted for under the asset and liability method. Deferred tax assets and liabilities are recognized for the future tax consequences attributable to differences between the
F-120
Table of Contents
JBS USA Holdings, Inc.
A wholly owned subsidiary of JBS S.A.
Notes to consolidated financial statements
financial statement carrying amounts of existing assets and liabilities and their respective tax bases and operating loss and tax credit carryforwards. Deferred tax assets and liabilities are measured using enacted tax rates expected to apply to taxable income in the years in which those temporary differences are expected to be recovered or settled. The effect on deferred tax assets and liabilities of a change in tax rates is recognized in income in the period that includes the enactment date. Beginning with the adoption of FASB Interpretation No. 48Accounting for Uncertainty in Income Taxes (“FIN 48”) as of December 25, 2006, the Company recognizes the effect of income tax positions only if those positions are more likely than not of being sustained. Recognized income tax positions are measured at the largest amount that is greater than 50% likely of being realized. Changes in recognition or measurement are reflected in the period in which the change in judgment occurs. JBS USA Holdings has a pre-acquisition tax year ending in May and its post-acquisition tax year ending in December.
Fair value of financial instruments
The carrying amounts of JBS USA Holdings’ financial instruments, including cash and cash equivalents, short-term trade receivables, and payables, approximate their fair values due to the short-term nature of the instruments. Long-term debt, including the $750 million of unsecured loans, installment notes payable and capital lease obligations, were recorded at fair value at the time of the Acquisition (See Note 2) and JBS USA Holdings believes this approximates its fair value at December 30, 2007 subject to adjustments for any payments.
Revenue recognition
The Company’s revenue recognition policies are based on the guidance in Staff Accounting Bulletin (“SAB”) No. 104,Revenue Recognition in Financial Statements. Revenue on product sales is recognized when title and risk of loss are transferred to customers (upon delivery based on the terms of sale), when the price is fixed or determinable, and when collectibility is reasonably assured. The Company recognizes sales net of applicable provisions for discounts, returns and allowances which are accrued as product is invoiced to customers who participate in such programs based on contract terms and historical and current purchasing patterns.
Advertising costs
Advertising costs are expensed as incurred. Advertising costs for the fiscal year ended December 24, 2006, the 198 days ended July 10, 2007 and the 173 days ended December 30, 2007 were $7.6 million, $2.9 million and $2.2 million, respectively.
Research and development
The Company incurs costs related to developing new beef and pork products. These costs include developing improved packaging, manufacturing, flavor enhancing, and improving consumer friendliness of meat products. The costs of these research and development activities are less than 1% of total consolidated annual sales and are expensed as incurred.
F-121
Table of Contents
JBS USA Holdings, Inc.
A wholly owned subsidiary of JBS S.A.
Notes to consolidated financial statements
Shipping costs
Pass-through finished goods delivery costs reimbursed by customers are reported in net sales while an offsetting expense is included in cost of goods sold.
Comprehensive income
Comprehensive income consists of net income, foreign currency translation, and derivative adjustments. JBS USA Holdings deems all of its foreign investments to be permanent in nature and does not provide for taxes on permanently reinvested earnings or on currency translation adjustments arising from converting the investment in a foreign currency to US dollars. It is not practical to determine the amount of incremental taxes that might arise were these foreign earnings to be remitted.
Facility closure
In August 2005, the Company closed its Nampa, Idaho non-fed cattle processing facility. The closure was due to continued difficulty of sourcing older non-fed cattle for slaughter in the Northwestern US and the uncertainty surrounding the opening of the Canadian border to the importation of livestock older than 30 months of age. On May 26, 2006, the Company completed the sale of the idled Nampa facility as well as the operating Omaha, Nebraska non-fed cattle processing facility. Due to significant continuing involvement with the non-fed processing facilities through a raw material supply agreement, the operating results related to these plants for all periods presented have been reflected in continuing operations.
Derivatives and hedging activities
JBS USA Holdings accounts for its derivatives and hedging activities in accordance with SFAS No. 133,Accounting for Derivative Financial Instruments and Hedging Activities,(“SFAS No. 133”), and its related amendment, SFAS No. 138,Accounting for Certain Derivative Instruments and Certain Hedging Activities. The Company uses derivatives (e.g., futures and options) for the purpose of mitigating exposure to changes in commodity prices and foreign currency exchange rates. The fair value of each derivative is recognized in the balance sheet within current assets or current liabilities. Changes in the fair value of derivatives are recognized immediately in the statement of operations for derivatives that do not qualify for hedge accounting. For derivatives designated as a hedge and used to hedge an existing asset or liability, both the derivative and hedged item are recognized at fair value within the balance sheet with the changes in both of these fair values being recognized immediately in the statement of operations. For derivatives designated as a hedge and used to hedge an anticipated transaction, changes in the fair value of the derivatives are deferred in the balance sheet within accumulated other comprehensive income to the extent the hedge is effective in mitigating the exposure to the related anticipated transaction. Any ineffectiveness is recognized immediately in the statement of operations. Amounts deferred within accumulated other comprehensive income are recognized in the statement of operations upon the completion of the related underlying transaction.
F-122
Table of Contents
JBS USA Holdings, Inc.
A wholly owned subsidiary of JBS S.A.
Notes to consolidated financial statements
Adoption of new accounting pronouncements
In March 2008, the FASB issued SFAS No. 161,Disclosures about Derivative Instruments and Hedging Activities (“SFAS No. 161”), which provides for enhanced disclosures about the use of derivatives and their impact on a Company’s financial position and results of operations. The Company adopted SFAS No. 161 on the first day of their 2008 calendar year and the adoption of the standard did not have a material impact on its financial position, results of operations, or cash flows.
In December 2007, the FASB issued SFAS No. 141(R)Business Combinations (“SFAS No. 141(R)”). SFAS No. 141(R) is intended to provide greater consistency in the accounting and reporting of business combinations. SFAS 141(R) requires the acquiring entity in a business combination to recognize all assets acquired and liabilities assumed in the transaction and any non-controlling interest in the acquiree at the acquisition date, measured at fair value at that date. This includes the measurement of the acquirer’s shares issued as consideration in a business combination, the recognition of contingent consideration, the accounting for pre-acquisition gains and loss contingencies, the recognition of capitalized in-process research and development, the accounting for acquisition related restructuring cost accruals, the treatment of acquisition related transaction costs and the recognition of changes in the acquirer’s income tax valuation allowance and deferred taxes. One significant change in this statement is the requirement to expense direct costs of the transaction, which under existing standards are included in the purchase price of the acquired company. This statement also established disclosure requirements to enable the evaluation of the nature and financial effect of the business combination. SFAS No. 141(R) is effective for business combinations consummated after December 31, 2008. Also effective, as a requirement of the statement, after December 31, 2008 any adjustments to uncertain tax positions from business combinations consummated prior to December 31, 2008 will no longer be recorded as an adjustment to goodwill, but will be reported in income. During the thirteen weeks ended December 28, 2008, the Company expensed $1.9 million of cost previously capitalized related to the pending acquisition of National Beef Packing Company (“National Beef”) as the transaction did not close prior to December 15, 2008.
In September 2006, the FASB issued SFAS No. 157,Fair Value Measurements (“SFAS No. 157”). This statement provides a single definition of fair value, a framework for measuring fair value, and expanded disclosures concerning fair value. This Statement is effective for JBS USA Holdings for the fiscal year ending December 28, 2008. The adoption of SFAS No. 157 did not have a material impact on the Company’s financial position, results of operations, or cash flows.
F-123
Table of Contents
JBS USA Holdings, Inc.
A wholly owned subsidiary of JBS S.A.
Notes to consolidated financial statements
Note 4. Accrued liabilities
Accrued liabilities consist of the following (in thousands):
| Predecessor | Successor | |||||||
| December 24, 2006 | July 10, 2007 | December 30, 2007 | ||||||
Accrued self insurance reserves | $ 48,504 | $ 48,895 | $ 30,183 | |||||
Accrued salaries | 38,944 | 58,838 | 41,678 | |||||
Accrued taxes | 9,857 | 7,542 | 8,538 | |||||
Accrued freight | 22,027 | 21,781 | 23,863 | |||||
Accrued interest | 16,793 | 18,095 | 18,157 | |||||
Other | 58,807 | 79,530 | 64,075 | |||||
Total | $194,932 | $234,681 | $186,494 | |||||
Other accrued liabilities consist of items that are individually less than 5% of total current liabilities.
Note 5. Derivative financial instruments
The fair value of derivative assets is recognized within other current assets while the fair value of derivative liabilities is recognized within accrued liabilities. At December 24, 2006, July 10, 2007 and December 30, 2007, the fair value of derivatives recognized within other current assets was $5.8 million, $23.7 million and $13.9 million, respectively. At December 24, 2006, July 10, 2007 and December 30, 2007, the fair value of derivatives recognized within accrued liabilities was $3.9 million, $11.3 million and $1.4 million, respectively.
As of December 24, 2006, July 10, 2007 and December 30, 2007, the net deferred amount of derivative gains and losses recognized in accumulated other comprehensive income was $1.4 million, $0.6 million and $0.4 million net of tax, respectively. The Company anticipates these amounts will be transferred out of accumulated other comprehensive income and recognized within earnings over the 12 month period following each respective balance sheet date.
The Company utilizes various raw materials in its operations, including cattle, hogs, and energy, such as natural gas, electricity, and diesel fuel, which are all considered commodities. The Company considers these raw materials generally available from a number of different sources and believes it can obtain them to meet its requirements. These commodities are subject to price fluctuations and related price risk due to factors beyond its control, such as economic and political conditions, supply and demand, weather, governmental regulation, and other circumstances. Generally, the Company purchases derivatives in an attempt to mitigate price risk related to its anticipated consumption of commodity inputs for periods of up to 12 months. The Company may enter into longer-term derivatives on particular commodities if deemed appropriate. As of December 30, 2007, the Company had derivative positions in place covering approximately 1% of its anticipated need for livestock through December 2008.
F-124
Table of Contents
JBS USA Holdings, Inc.
A wholly owned subsidiary of JBS S.A.
Notes to consolidated financial statements
Note 6. Long-term debt and loan agreements
As of December 24, 2006, July 10, 2007 and December 30, 2007, debt consisted of the following (in thousands):
| Predecessor | Successor | |||||||
December 24, 2006 | July 10, 2007 | December 30, 2007 | ||||||
Short-term debt | ||||||||
Unsecured bank loans | $ — | $ — | $750,000 | |||||
Unsecured credit facility | — | — | 26,287 | |||||
Total short-term debt | — | — | 776,287 | |||||
Current portion of long-debt: | ||||||||
Installment notes payable | 468 | 468 | 619 | |||||
Capital lease obligations | 1,482 | 1,469 | 1,379 | |||||
Total current portion of long-term debt | 1,950 | 1,937 | 1,998 | |||||
Long-term debt: | ||||||||
Senior credit facility | 217,552 | 323,529 | — | |||||
Senior notes due 2009, including unamortized premium | 273,909 | 272,903 | — | |||||
Senior subordinated notes, including unamortized premium | 158,462 | 157,482 | — | |||||
Senior notes due 2010 | 117,809 | 124,916 | — | |||||
Convertible senior subordinated notes | 89,167 | 94,183 | — | |||||
Seller PIK Note, net of accretion discount | 182,086 | 195,971 | — | |||||
Installment notes payable | 10,910 | 10,637 | 10,291 | |||||
Capital lease obligations | 15,658 | 22,354 | 22,142 | |||||
Long-term debt, less current portion | 1,065,553 | 1,201,975 | 32,433 | |||||
Total debt | $1,067,503 | $1,203,912 | $810,718 | |||||
The aggregate minimum principal maturities of the long-term debt for each of the five fiscal years and thereafter following December 30, 2007, are as follows (in thousands):
| For the fiscal years ending December | Minimum maturities | ||
2008 | $ | 778,285 | |
2009 | 2,604 | ||
2010 | 2,541 | ||
2011 | 2,767 | ||
2012 | 3,098 | ||
Thereafter | 21,423 | ||
Total minimum principal maturities | $ | 810,718 | |
F-125
Table of Contents
JBS USA Holdings, Inc.
A wholly owned subsidiary of JBS S.A.
Notes to consolidated financial statements
As of December 30, 2007, we had approximately $34.4 million of secured debt outstanding and approximately $29.9 million of outstanding letters of credit.
A summary of the components of interest expense, net is presented below (in thousands):
| Predecessor | Successor | ||||||||||
Fiscal year ended December 24, 2006 | 198 days ended July 10, 2007 | 173 days ended December 30, 2007 | |||||||||
Interest on: | |||||||||||
Unsecured bank loans | $ — | $ — | $22,966 | ||||||||
Unsecured credit facility | — | — | 1,311 | ||||||||
Senior credit facility (approximately 7.18% and 7.47%)(i) | 22,799 | 12,288 | — | ||||||||
Senior notes due 2009 (10.125% rate) | 27,068 | 14,773 | 50 | ||||||||
Senior subordinated notes (12.50% rate) | 18,706 | 10,207 | 194 | ||||||||
Senior notes due 2010 (approximately 11.5%) | 13,182 | 7,646 | — | ||||||||
Convertible senior subordinated notes (approximately 11.25%) | 9,382 | 5,408 | — | ||||||||
Seller PIK Note | 15,772 | 9,236 | — | ||||||||
Amortization of deferred financing costs(ii) | 6,394 | 3,538 | — | ||||||||
Amortization of deferred financing costs(iii) | — | — | 883 | ||||||||
Accretion of original issue discount(iv) | 2,542 | 1,383 | — | ||||||||
Accretion of discount on Seller PIK note(v) | 7,802 | 5,289 | — | ||||||||
Amortization of premium(vi) | (6,747 | ) | (3,983 | ) | |||||||
Capital lease interest | 1,572 | 855 | 697 | ||||||||
Interest rate swap | 1,022 | 368 | 31 | ||||||||
Other miscellaneous interest | 561 | 524 | 404 | ||||||||
Bank fees | — | — | 731 | ||||||||
Debt issuance cost on debt not executed(viii) | — | — | 12,664 | ||||||||
Less: | |||||||||||
Capitalized interest | (304 | ) | (430 | ) | (420 | ) | |||||
Interest income | (997 | ) | (719 | ) | (5,171 | ) | |||||
Total interest expense, net | $118,754 | $66,383 | $34,340 | ||||||||
| (i) | Represents interest on the outstanding balance of the amount drawn on the revolving credit facility, plus a 0.375% commitment fee on the unused portion of the revolving credit facility and other fees associated with the revolving credit facility. |
F-126
Table of Contents
JBS USA Holdings, Inc.
A wholly owned subsidiary of JBS S.A.
Notes to consolidated financial statements
| (ii) | Represents amortization utilizing an average maturity of 7 years. |
| (iii) | Represents amortization over the life of the unsecured bank loans. |
| (iv) | Represents accretion of the original issue discount on the notes utilizing the effective interest method |
| (v) | Represents accretion of the discount on the Seller PIK Note calculated using the effective interest method. |
| (vi) | Represents amortization of premium associated with the increased fair value of debt recorded to the extent of the approximate 45% interest acquired in the Call Option using the effective interest method. |
| (vii) | Includes installment notes interest expense of $0.7 million, $0.5 million and $0.3 million for the fiscal year ended December 24, 2006, the 198 days ended July 10, 2007 and the 173 days ended December 30, 2007, respectively, the remainder is expense for other miscellaneous items. |
| (viii) | Fees incurred with debt refinancing intended as part of the Acquisition. The debt facilities associated with these fees were not consummated and therefore these fees were expensed immediately. |
Description of indebtedness
Predecessor
Senior credit facilities—On May 26, 2005, the Company entered into an Amended and Restated Credit Agreement (the “Amended Credit Agreement”) providing senior credit facilities which allowed borrowings up to $550.0 million, consisting entirely of a revolving credit facility of $550.0 million that was to terminate May 26, 2010. Up to $125.0 million of the revolving credit facility was available for the issuance of letters of credit or Australian bank guarantees and up to $65.0 million of the revolving credit facility was available for borrowings in Australian dollars by the Company’s Australian subsidiaries. US dollar denominated borrowings that were euro dollar rate loans would initially bear interest at rates of 1.75% per annum plus the applicable euro dollar rate, or (ii) base rate loans would initially bear interest at rates of 0.75% per annum plus the highest of Citibank’s base rate, the three-month certificate of deposit rate plus 0.5%, and the federal funds effective rate plus 0.5%. Australian dollar denominated borrowings that were (i) bill rate loans would initially bear interest at rates of 1.375% per annum plus the applicable bid rate for Australian bills for the applicable interest period or (ii) short-term loans would initially bear interest at rates of 1.375% per annum plus the Reserve Bank of Australia Official Cash Rate. The revolver balance under the Company’s Amended Credit Agreement included $195.0 million that was financed as a term loan under the Company’s original credit facility. Based on management’s review of cash flow expectations the Company classified all revolver borrowings as long-term as of December 24, 2006 and July 10, 2007. At the closing of the Acquisition on July 11, 2007 this debt was repaid.
Senior notes due 2009—On September 19, 2002, the Company purchased the original business from ConAgra Foods. As a result, the Company issued $268.0 million of its 10 1/8% senior notes due 2009. The senior notes were issued with original issue discount and generated gross proceeds to the Company of approximately $250.5 million. The senior notes were to mature on October 1, 2009. Interest was payable semi-annually in arrears on April 1 and October 1 of each year, commencing on April 1, 2003. On August 15, 2003, the Company completed an exchange offer in which it exchanged new notes that were registered under the Securities Act for the notes. The senior notes were guaranteed by the Company and all of the Company’s domestic subsidiaries. At the closing of the Acquisition on July 11, 2007 this debt was repaid.
F-127
Table of Contents
JBS USA Holdings, Inc.
A wholly owned subsidiary of JBS S.A.
Notes to consolidated financial statements
On July 16, 2003, the Company entered into a $100 million (notional) interest rate swap that converted a portion of the fixed rate 10 1/8% notes into a floating rate obligation. The swap, which had an original maturity of October 1, 2007, was utilized to achieve a target fixed/floating capital structure appropriate for the business. In connection with the exercise of the Call Option, the carrying value for the notes was adjusted to reflect 45% of the excess of fair value over book value resulting in a premium of $218 million being recorded. On July 13, 2007, the Company cancelled its interest rate swap for a payment of $1.1 million since the underlying debt was repaid at the closing of the Acquisition.
Senior subordinated notes—The Company issued to the former owner, ConAgra Foods (“Former Shareholder”), $150.0 million aggregate principal amount of its 12.5% senior subordinated notes due January 1, 2010. The Company completed an exchange of offer in which it exchanged new notes that were registered under the Securities Act of 1933 for Senior subordinated notes. ConAgra Foods subsequently sold all $150.0 million aggregate principal amount of the senior subordinated notes. Interest was payable semi-annually in arrears on April 1 and October 1 of each year, commencing on April 1, 2003. The senior subordinated notes were guaranteed by the Company and all of its domestic subsidiaries. At the closing of the Acquisition on July 11, 2007 this debt was repaid.
Senior notesdue 2010—On March 11, 2005, the Company issued $105.0 million of 11% senior notes due 2010. The notes were issued with original issue discount and generated gross proceeds to the Company of $104.7 million. The notes were to mature on March 11, 2010. Interest was payable semi-annually in arrears on May 1 and November 1 of each year commencing on November 1, 2005. Interest could have been paid in cash or as in kind and capitalized to the loan balance, or a combination thereof at the option of the Company. If interest was paid in kind and capitalized and not paid in cash on the semi-annual due dates, the interest rate increased to 12.0%. Interest capitalized to the original issuance amount was $13.0 million as of December 24, 2006 and $20.1 million as of July 10, 2007. Accretion of debt discount totaled $28 thousand for the 198 days ended July 10, 2007 and $52 thousand for the fiscal year ended December 24, 2006. The senior notes were guaranteed by the Company. At the closing of the Acquisition on July 11, 2007 this debt was repaid.
Convertible senior subordinated notes—On March 11, 2005, the Company issued $75.0 million of 10.25% convertible senior subordinated notes. The convertible notes were to mature on March 11, 2010. Interest was payable semi-annually in arrears on May 1 and November 1 each year commencing on November 1, 2005 at the rate of 10.25% per annum, if paid in cash, or 11.25% per annum, if paid in kind and capitalized. Interest capitalized to the original issuance amount was $14.2 million as of December 24, 2006 and $20.1 million as of July 10, 2007. At the closing of the Acquisition on July 11, 2007 this debt was repaid.
Seller PIK note—On September 19, 2002, the Company issued a $150 million promissory note to the Former Shareholder. The stated interest rate was an increasing rate from 8.0% to 10.0% over the 7.5 year life of the note. To record the note at fair value, it was discounted at an estimated market rate at September 19, 2002 of 14.95% resulting in a discount of $54.8 million. Accrued
F-128
Table of Contents
JBS USA Holdings, Inc.
A wholly owned subsidiary of JBS S.A.
Notes to consolidated financial statements
interest was capitalized to the note balance and both the face amount of the note and all accrued interest would have been payable on the due date March 19, 2010. In connection with the acquisition of the minority interest, the carrying value of the note was adjusted to reflect 45% of the excess of fair value over book value, resulting in a premium of $7.6 million. Accretion of debt discount was approximately $5.3 million for the 198 days ended July 10, 2007 and $7.8 million for the fiscal year ended December 24, 2006. Amortization of the premium discussed above was $0.6 million for the 198 days ended July 10, 2007 and $0.9 million for the fiscal year ended December 24, 2006. Accrued interest was capitalized to the note balance and both the face amount of the note and all accrued interest was to be payable on the due date in 2010. At the closing of the Acquisition on July 11, 2007 this debt was repaid.
Successor
Unsecured credit facility—On August 15, 2007 Swift Australia entered into an unsecured credit facility for Australian Dollar borrowings up to a maximum of AUD $70 million to fund working capital and letter of credit requirements. The initial 90 day term expired on November 17, 2007 and the facility was subsequently extended to February 29, 2008. This facility was replaced with a new agreement on February 26, 2008 when Swift Australia entered into an AUD $120 million unsecured credit facility of which AUD $80 million can be borrowed for cash needs and AUD $40 million is available to fund letters of credit (See Note 12). Borrowings are made at either the cash advance rate (BBSY) plus a margin of 0.35% or a market rate advance (RBA cash rate) plus a margin of 0.50%.
Unsecured bank loans
The following unsecured bank loans were all repaid between April 28, 2008 and June 30, 2008. These loans were repaid with additional paid in capital of $400 million and $350 million in intercompany notes payable (See Note 12).
$250 million loan agreement—In connection with the Acquisition, JBS USA entered into a one year unsecured loan agreement with interest payable semi-annually based on six month LIBOR plus a margin of 1.50%. The loan was to mature on June 30, 2008. The loan agreement contained customary representations and warranties. The loan agreement was guaranteed by JBS. S.A.
$150 million loan agreement—In connection with the Acquisition, JBS USA entered into a one year unsecured loan agreement with interest payable semi-annually based on six month LIBOR plus a margin of 0.75%. The loan was to mature on June 30, 2008. The loan agreement contained customary representations, warranties and covenants. The loan agreement was guaranteed by JBS. S.A.
$250 million credit agreement—In connection with the Acquisition, JBS USA entered into a one year unsecured credit agreement with interest payable quarterly based on three month LIBOR plus a margin of 0.75%. The agreement was to mature on July 7, 2008. The credit agreement contained customary representations, warranties and negative covenants. There were no
F-129
Table of Contents
JBS USA Holdings, Inc.
A wholly owned subsidiary of JBS S.A.
Notes to consolidated financial statements
maintenance financial covenants but the agreement contained an incurrence of Consolidated Net Indebtedness to EBITDA ratio of 3.75 to 1.00 prior to December 31, 2007 and 3.60 to 1.00 commencing on January 1, 2008 and ending on the maturity date. The credit agreement was guaranteed by JBS. S.A.
$100 million loan agreement—In connection with the Acquisition, JBS USA entered into a one year unsecured loan agreement. The original 182 day loan agreement with interest payable at maturity based on six month LIBOR plus a margin of 0.8%. The loan was to mature on January 7, 2008. On January 3, 2008, an extension and modification agreement was signed changing the maturity date to July 7, 2008 and increasing the margin to 1.5% (See Note 12). The loan agreement contained customary representations, warranties and covenants. The loan agreement was guaranteed by JBS S.A.
Secured debt
Installment notes payable—The installment note payable relates to the Company’s financing of a capital investment and was assumed at the Acquisition. The note bears interest at LIBOR plus a fixed margin of 1.75% per annum with payments due on the first of each month and matures on August 1, 2013.
Capital and operating leases—JBS USA Holdings and certain of its subsidiaries lease the corporate headquarters in Greeley, Colorado under capital lease; six distribution facilities located in New Jersey, Florida, Nebraska, Arizona, Colorado and Texas; marketing liaison offices in the US, Korea, Japan, Mexico, China, and Taiwan; its distribution centers and warehouses in Australia; and a variety of equipment under operating lease agreements that expire in various years between 2008 and 2019 which were assumed in the Acquisition. Future minimum lease payments at December 30, 2007, under capital and non-cancelable operating leases with terms exceeding one year are as follows (in thousands):
Capitalized lease obligations | Noncancellable operating lease obligations | ||||
For the fiscal years ending December | |||||
2008 | $ 2,573 | $11,924 | |||
2009 | 2,850 | 9,200 | |||
2010 | 2,644 | 5,334 | |||
2011 | 2,721 | 4,628 | |||
2012 | 2,874 | 2,732 | |||
Thereafter | 15,646 | 6,128 | |||
Net minimum lease payments | 29,308 | $39,946 | |||
Less: Amount representing interest | (5,787 | ) | |||
Present value of net minimum lease payments | $23,521 | ||||
F-130
Table of Contents
JBS USA Holdings, Inc.
A wholly owned subsidiary of JBS S.A.
Notes to consolidated financial statements
Rent expense associated with operating leases for the fiscal year ended December 24, 2006, the 198 days ended July 10, 2007 and the 173 days ended December 30, 2007, was $16.2 million, $9.6 million and $8.1 million, respectively.
Note 7. Stock option and defined contribution plans
Predecessor
Stock purchase plans
We had a stock purchase plan pursuant to which eligible employees and non-employees (including non-employee directors) of the Company and its subsidiaries could purchase shares of common stock of Swift Foods. A total of 4,657,095 shares of common stock of the predecessor were authorized for purchase at a price per share as determined by the board of directors on the date of purchase. As of July 10, 2007, certain members of Swift Foods’ management and non-employee directors held an aggregate of (i) 1,410,000 shares purchased under the 2002 stock purchase plan at a purchase price of $1.00 per share, (ii) 500,000 shares under the 2002 stock purchase plan at a purchase price of $1.01 per share and (iii) 286,940 shares purchased under the 2005 stock purchase plan at a purchase price of $1.32 per share. At July 10, 2007, there were 1,440,000 shares available for purchase under the 2002 stock purchase plan and 334,584 shares available for purchase under the 2005 stock purchase plan. Purchases under the 2002 plan were at the estimated fair market value of such shares on the date of purchase. Purchases under the 2005 plan were at less than fair market value in order to allow management to share in the economic benefit arising from the exercise of the Call Option. The Plan was terminated immediately prior to the closing of the Acquisition on July 11, 2007.
2002 Stock Option Plan
We adopted the Swift Foods Company 2002 Stock Option Plan (the “Option Plan”), pursuant to which options were granted at the sole discretion of the Board of Directors to the predecessor employees and eligible non-employees of Swift Foods or subsidiaries for the purchase of shares of common stock of Swift Foods. Due to acceleration of vesting of outstanding options and the termination of the Option Plan immediately prior to the closing of the Acquisition on July 11, 2007 the remaining unrecognized expense was recorded as a component of earnings prior to July 10, 2007.
Stock based compensation expense recognized in the statements of earnings was $0.9 million for the fiscal year ended December 24, 2006 and $1.2 million for the 198 days ended July 10, 2007.
Predecessor & Successor
Defined contribution plans
The Company sponsors two tax-qualified employee savings and retirement plans (the “401(k) Plans”) covering its US based employees, both union and non-union. Pursuant to the 401(k) Plans,
F-131
Table of Contents
JBS USA Holdings, Inc.
A wholly owned subsidiary of JBS S.A.
Notes to consolidated financial statements
eligible employees may elect to reduce their current compensation by up to the lesser of 75% of their annual compensation or the statutorily prescribed annual limit and have the amount of such reduction contributed to the 401(k) Plans. The 401(k) Plans provide for additional matching contributions by the Company, based on specific terms contained in the 401(k) Plans. On July 8, 2008 the Company amended its 401(k) Plans described above by eliminating the immediate vesting and instituting a five year vesting schedule for all non-production employees and reducing the maximum Company match to an effective 2% from the former rate of 5%. The trustee of the 401(k) Plans, at the direction of each participant, invests the assets of the 401(k) Plans in participant designated investment options. The 401(k) Plans are intended to qualify under Section 401 of the Internal Revenue Code. The Company’s expenses related to the matching provisions of the 401(k) Plans for the fiscal year ended December 24, 2006, the 198 days ended July 10, 2007 and the 173 days ended December 30, 2007 totaled approximately $7.1 million, $4.1 million and $3.3 million, respectively.
One of the Company’s facilities had participated in a multi-employer pension plan. The Company’s contributions to this plan, which are included in cost of goods sold in the statement of operations for the fiscal year ended December 24, 2006, the 198 days ended July 10, 2007 and the 173 days ended December 30, 2007, were $0.4 million, $0.1 million, and $0.1 million, respectively. The Company also made contributions for the 198 days ended July 10, 2007 and the 173 days ended December 30, 2007 totaling $26 thousand dollars for each period to a multiemployer pension related to former employees at the former Nampa, Idaho plant pursuant to a settlement agreement. The Company recognized $0.7 million of contribution expense in costs of goods sold for the fiscal year ended December 24, 2006. As the future payments are made they are recorded as a reduction of the pre-acquisition contingency established during the Acquisition. (See Note 2).
Employees of Swift Australia do not participate in the Company’s 401(k) Plans. Under Australian law, Swift Australia contributes a percentage of employee compensation to a superannuation fund. This contribution approximates 9% of employee cash compensation as required under the Australian “Superannuation Act of 1997”. As the funds are administered by a third party, once this contribution is made to the fund, Swift Australia has no obligation for payments to participants or oversight of the fund. The Company’s expenses related to contributions to this fund for the fiscal year ended December 24, 2006, the 198 days ended July 10, 2007 and the 173 days ended December 30, 2007 totaled $14.0 million, $7.1 million and $7.2 million, respectively.
Note 8. Related party transactions
JBS USA Holdings was formerly known as Swift Foods Company (“Swift Foods”). Swift Foods was acquired from ConAgra Foods in a two-step process, 54.7% on September 18, 2002 and 45.3% on September 23, 2004 (collectively “The Transaction”). Swift Foods majority shareholders were HM Capital Partners (“Hicks Muse”) and Booth Creek Investments (“Booth Creek”).
F-132
Table of Contents
JBS USA Holdings, Inc.
A wholly owned subsidiary of JBS S.A.
Notes to consolidated financial statements
Predecessor
Stockholders’ agreement—ConAgra Foods, Hicks Muse, other holders of Swift Foods common stock, and Swift Foods were parties to a Stockholders Agreement that included provisions regarding, among others, the election of directors, registration rights, restrictions on transfer, and other rights regarding sales of Swift Foods stock by Hicks Muse.
The Stockholders Agreement required the holders of Swift Foods common stock that were subject to the agreement, subject to certain conditions, to vote their shares in favor of the election to Swift Foods board of directors of five individuals as may be designated by Hicks Muse and its affiliates. Under the HMTF Rawhide Partnership Agreement, Hicks Muse had agreed to cause an individual designated by an affiliate of George N. Gillett, Jr., our then Chairman of the Board, to be included in the five individuals designated for election to Swift Foods board of directors by Hicks Muse for as long as Mr. Gillett or his affiliates continued to own at least 25% of the limited partnership interest in Rawhide owned by such parties at the closing of the Transaction.
Monitoring and oversight agreement—In connection with the Transaction, Swift Foods and certain of its direct and indirect subsidiaries entered into a ten-year agreement (the “Monitoring and Oversight Agreement”) with an affiliate of HM Capital Partners, LLC (formerly known as Hicks, Muse, Tate & Furst, Incorporated) pursuant to which Swift Foods, as the assignee of this agreement in November 2004, would pay Hicks Muse Partners an annual fee for ongoing oversight and monitoring services provided to it. The annual fee would be adjusted at the beginning of each fiscal year to an amount equal to the greater of (a) $2 million or (b) 1% of the budgeted consolidated annual EBITDA of Swift Foods and its subsidiaries. The annual fee would also be adjusted in the event that Swift Foods or any of its subsidiaries acquired another entity or business during the term of the agreement. This expense was paid in advance quarterly and $2.2 million and $1.3 million are included in selling, general, and administrative expense for the fiscal year ended December 24, 2006 and the 198 days ended July 10, 2007.
Swift Foods had agreed to indemnify Hicks Muse, its affiliates and their respective directors, officers, controlling persons, if any, agents, independent contractors, and employees from and against all claims, liabilities, damages, losses, and expenses arising out of or in connection with the services rendered by Hicks Muse pursuant to the Monitoring and Oversight Agreement. One of Swift Foods’ directors, Mr. Muse, was a limited partner of Hicks Muse and a director, officer, and stockholder of the general partner of Hicks Muse.
The Monitoring and Oversight Agreement made available the resources of Hicks Muse concerning a variety of financial and operational matters. Swift Foods believed the services that were to be provided by Hicks Muse could not otherwise be obtained by it without the addition of personnel or the engagement of outside professional advisors. In management’s opinion, the fees provided for under the Monitoring and Oversight Agreement reasonably reflected the benefits received by Swift Foods.
F-133
Table of Contents
JBS USA Holdings, Inc.
A wholly owned subsidiary of JBS S.A.
Notes to consolidated financial statements
Hicks Muse had agreed to pay to Gillett Greeley, LLC, an affiliate of George N. Gillett, Jr., the then Chairman of the Board, 25% of the annual fees payable to it under the Monitoring and Oversight Agreement pursuant to a consulting agreement between Hicks Muse and Booth Creek, which was ultimately controlled by Mr. Gillett. Booth Creek had agreed to provide consulting services to Hicks Muse.
Financial advisory agreement—In connection with the Transaction, Swift Foods and certain of its direct and indirect subsidiaries also entered into a ten-year agreement (the “Financial Advisory Agreement”) pursuant to which an affiliate of Hicks Muse received a cash financial advisory fee equal to $15.0 million upon the closing of the Transaction as compensation for its services as financial advisor for the Transaction. The Financial Advisory Agreement also provided for Hicks Muse to receive an expense reimbursement of $2.0 million upon the closing of the Transaction. These fees were included as part of the expenses of the Transaction. The expense reimbursement was agreed upon in the purchase agreement to reimburse Swift Foods’ chairman for normal due diligence costs incurred in evaluating and analyzing the acquisition. The agreement provided for a defined reimbursement of $2.0 million to cover due diligence expenses without having to provide Swift Foods with detailed expense records. These fees were included as part of the expenses of the Transaction.
Hicks Muse also was entitled to receive a fee equal to 1.5% of the transaction value for any subsequent transaction in which Swift Foods, as the assignee of the agreement in November, 2004, was involved that was consummated during the term of the Financial Advisory Agreement.
The Financial Advisory Agreement made available the investment banking, financial advisory, and other similar services of Hicks Muse. Swift Foods believed the services that were provided by Hicks Muse could not otherwise be obtained by it without the addition of personnel or the engagement of outside professional advisors. In management’s opinion, the fees provided for under the Financial Advisory Agreement reasonably reflect the benefits received by Swift Foods.
Swift Foods had agreed to indemnify Hicks Muse, its affiliates and their respective directors, officers, controlling persons, if any, agents, independent contractors and employees from and against all claims, liabilities, damages, losses and expenses arising out of or in connection with the services rendered by Hicks Muse pursuant to the Financial Advisory Agreement. One of Swift Foods’ directors, Mr. Muse, is a limited partner of Hicks Muse and a director, officer, and shareholder of the general partner of Hicks Muse Partners.
Hicks Muse had agreed to pay to Booth Creek, an affiliate of George N. Gillett, Jr., the Company’s then Chairman of the Board, 25% of the annual fees payable to it under the Financial Advisory Agreement. Booth Creek Management Company did not receive any portion of the $15.0 million cash financial advisory fee paid to Hicks Muse upon the closing of the Transaction. Hicks Muse paid to Gillett Greeley, LLC, an affiliate of George N. Gillett, Jr., all of the $2.0 million expense reimbursement described above.
Indemnification and release agreement—At the closing of the Transaction, Swift Foods and certain of its direct and indirect subsidiaries entered into an indemnification and release
F-134
Table of Contents
JBS USA Holdings, Inc.
A wholly owned subsidiary of JBS S.A.
Notes to consolidated financial statements
agreement with ConAgra Foods pursuant to which Swift Foods agreed to be bound by the post-closing indemnification obligations set forth in the purchase agreement and, following the closing, to release ConAgra Foods from all liabilities and actions for environmental costs or liabilities other than that which are set forth in the purchase agreement.
Tax Sharing Agreement—In connection with the closing of the Transaction, Swift Foods and certain of its direct and indirect subsidiaries entered into a tax sharing agreement assumed by Swift Foods in November 2004 pursuant to which the Company is obligated, among other things, to distribute to Swift Foods any taxes attributable to it and its subsidiaries and under which the Company will be indemnified for any taxes paid by it or its subsidiaries on behalf of any other member of Swift Foods’ consolidated tax group.
Contribution Agreement—In connection with the closing of the Transaction, Swift Foods, with its direct and indirect subsidiaries entered into a contribution agreement assumed by Swift Foods in November 2004 pursuant to which these entities will contribute or otherwise pay over, or cause any of their subsidiaries to contribute or otherwise pay over, to the Company any amounts they receive from ConAgra Foods or its affiliates pursuant to indemnification claims under the purchase agreement and any amounts obtained from other sources which are applied to offset any indemnification claims that the Company could otherwise make under the purchase agreement.
Indemnity Side Letter—In connection with the closing of the Transaction, ConAgra Foods agreed to reimburse the Company to the extent recall costs incurred after the Transaction exceed the accrual made for estimated recall costs pursuant to the purchase agreement relating to the Transaction, and the Company agreed to reimburse ConAgra Foods to the extent the accrual exceeds the recall costs. ConAgra Foods had further agreed to indemnify the Company for liabilities, costs, and expenses that it may incur with respect to third parties in connection with product liability claims or personal injury causes of action arising from the consumption of the products subject to the recall. The Company has a $1.6 million receivable from ConAgra Foods at December 24, 2006, July 10, 2007 and December 30, 2007 for reimbursement of amounts in excess of the accrual which represents additional claims from customers seeking reimbursement for recall related costs from the Company. The balance of the receivable was subsequently collected in 2008.
Transactions with affiliated companies
During the fiscal year ended December 24, 2006 and the 198 days ended July 10, 2007, the Company purchased $3.9 million and $2.5 million in cattle hides, respectively and $368 thousand and $334 thousand of commodity product from Coleman Natural Meats (“Coleman”), an independent meat packing company controlled by the then chairman of the Board of Swift Foods and its subsidiaries, respectively. In addition, it provided certain further processing capabilities to Coleman in the amount of $118 thousand for the fiscal year ended December 24, 2006. There were no amounts for the 198 days ended July 10, 2007 for these services.
F-135
Table of Contents
JBS USA Holdings, Inc.
A wholly owned subsidiary of JBS S.A.
Notes to consolidated financial statements
During the 198 days ended July 10, 2007, the Company paid commissions totaling $27 thousand to Swett & Crawford, an intermediary insurance broker owned by HMSC Investments, L.P., an affiliate of Hick Muse Partners, one of the Company’s then equity sponsors. The commissions were earned by Swett & Crawford for placing insurance coverage with third-party carriers at market rates.
Successor
JBS USA Holdings enters into transactions in the normal course of business with affiliates of JBS S.A. Sales to affiliated companies included in net sales on the statement of operations for the 173 days ended December, 2007 were $6.3 million. Amounts owed to JBS USA Holdings by affiliates as of December 30, 2007 totaled approximately $5.6 million.
For the 173 days ended December 30, 2007, the Company recorded $26 thousand of rental income related to real property leased to two of its executive officers. At December 30, 2007 the receivable balance related to this income was $26 thousand.
Indemnification and release agreement—A predecessor entity of JBS USA Holdings and certain of its direct and indirect subsidiaries entered into an indemnification and release agreement with ConAgra Foods pursuant to which JBS USA Holdings is bound by the post-closing indemnification obligations set forth in the purchase agreement and to release ConAgra Foods from all liabilities and actions for environmental costs or liabilities other than that which are set forth in the purchase agreement.
Guarantees—JBS S.A. has notes payable outstanding of approximately $300 million at December 30, 2007 that were issued in July 2006 and are due in 2016. The notes payable indenture requires each of JBS’s significant subsidiaries, at the time of issuance or any time in the future, to be a guarantor on the notes payable. The Company has determined that they meet the definition of a significant subsidiary and are a guarantor on those notes payable issued by JBS.
Note 9. Income taxes
The pre-tax loss on which the provision for income taxes was computed is as follows (in thousands):
| Predecessor | Successor | ||||||||||
| Fiscal year ended December 24, 2006 | 198 days ended July 10, 2007 | 173 days ended December 30, 2007 | |||||||||
Domestic | $(139,170 | ) | $ (66,499 | ) | $(112,074 | ) | |||||
Foreign | (15,584 | ) | (34,893 | ) | 1,507 | ||||||
Total | $(154,754 | ) | $(101,392 | ) | $(110,567 | ) | |||||
F-136
Table of Contents
JBS USA Holdings, Inc.
A wholly owned subsidiary of JBS S.A.
Notes to consolidated financial statements
Income tax expense (benefit) includes the following current and deferred provisions (in thousands):
| Predecessor | Successor | ||||||||||
| Fiscal year ended December 24, 2006 | 198 days ended July 10, 2007 | 173 days ended December 30, 2007 | |||||||||
Current provision: | |||||||||||
Federal | $ (132 | ) | $ (1,855 | ) | $ (2 | ) | |||||
State | 231 | 943 | 313 | ||||||||
Foreign | 877 | 4,610 | 891 | ||||||||
Total current tax expense | 976 | 3,698 | 1,202 | ||||||||
Deferred benefit: | |||||||||||
Federal | (26,000 | ) | (9,435 | ) | 92 | ||||||
State | (4,613 | ) | (1,170 | ) | (63 | ) | |||||
Foreign | (7,711 | ) | (11,473 | ) | (206 | ) | |||||
Total deferred tax benefit | (38,324 | ) | (22,078 | ) | (177 | ) | |||||
Total income tax (benefit) expense | $(37,348 | ) | $(18,380 | ) | $1,025 | ||||||
The principal differences between the effective income tax rate, and the US statutory federal income tax rate, were as follows:
| Predecessor | Successor | ||||||||||
| Fiscal year ended December 24, 2006 | 198 days ended July 10, 2007 | 173 days ended December 30, 2007 | |||||||||
Expected tax rate | 35.0% | 35.0% | 35.0% | ||||||||
State income taxes (net of federal benefit) | 4.1 | 3.5 | 5.0 | ||||||||
Non-deductible expense | (0.7 | ) | (1.0 | ) | — | ||||||
Benefit from export sales | 1.5 | — | — | ||||||||
Valuation allowance | (7.9 | ) | (29.0 | ) | (42.4 | ) | |||||
Unremitted earnings | (8.6 | ) | 7.2 | — | |||||||
Reclass of reserve | 0.4 | 2.4 | — | ||||||||
Other, net | 0.4 | 0.1 | 1.5 | ||||||||
Effective tax rate | 24.2% | 18.2% | (0.9)% | ||||||||
F-137
Table of Contents
JBS USA Holdings, Inc.
A wholly owned subsidiary of JBS S.A.
Notes to consolidated financial statements
Temporary differences that gave rise to a significant portion of deferred tax assets (liabilities) were as follows (in thousands):
| Predecessor | Successor | ||||||||||
| December 24, 2006 | July 10, 2007 | December 30, 2007 | |||||||||
Inventory | $(13,634 | ) | $(18,329 | ) | $(13,812 | ) | |||||
Derivatives | (21 | ) | (149 | ) | — | ||||||
Interest | — | — | (1,417 | ) | |||||||
Depreciation and amortization | (82,123 | ) | (58,590 | ) | (138,633 | ) | |||||
Undistributed earnings | (60,198 | ) | (78,125 | ) | — | ||||||
Long term debt discount | (14,791 | ) | (11,400 | ) | — | ||||||
All other current | (9,579 | ) | (6,348 | ) | (5,866 | ) | |||||
All other long-term | — | — | (75 | ) | |||||||
Gross deferred tax liability | (180,346 | ) | (172,941 | ) | (159,803 | ) | |||||
Accounts receivable reserve | 544 | 698 | 649 | ||||||||
Depreciation and amortization | 4,310 | 1,896 | 857 | ||||||||
Inventory | 488 | 572 | 33 | ||||||||
Long term debt premium | 12,409 | 9,294 | — | ||||||||
Interest | — | — | 13,379 | ||||||||
Accrued liabilities | 25,563 | 24,550 | 21,507 | ||||||||
Deferred revenue | — | 602 | 505 | ||||||||
Net operating loss/capital loss | 113,559 | 147,539 | 215,812 | ||||||||
Tax credit carryforwards | 4,827 | 6,197 | 6,775 | ||||||||
Derivatives | — | — | 148 | ||||||||
All other current | 317 | 587 | — | ||||||||
All other long-term | 2,618 | 7,594 | 4,468 | ||||||||
Total deferred tax asset | 164,635 | 199,529 | 264,133 | ||||||||
Valuation allowance | (18,750 | ) | (52,005 | ) | (126,976 | ) | |||||
Net deferred tax assets | 145,885 | 147,524 | 137,157 | ||||||||
Net deferred tax liability | $(34,461 | ) | $(25,417 | ) | $(22,646 | ) | |||||
Financial statement classification: | |||||||||||
Current deferred tax asset | $11,149 | $7,784 | $4,493 | ||||||||
Current deferred tax liability | (6,696 | ) | (9,323 | ) | (12,885 | ) | |||||
Long-term deferred tax asset | — | — | 5,434 | ||||||||
Long-term deferred tax liability | (38,914 | ) | (23,878 | ) | (19,688 | ) | |||||
Net deferred tax liability | $(34,461 | ) | $(25,417 | ) | $(22,646 | ) | |||||
F-138
Table of Contents
JBS USA Holdings, Inc.
A wholly owned subsidiary of JBS S.A.
Notes to consolidated financial statements
At December 24, 2006, July 10, 2007 and December 30, 2007, JBS USA Holdings has recorded net deferred tax assets of $109.4 million, $142.9 million and $192.8 million respectively for federal and state net operating loss carryforwards expiring in the years 2007 through 2028.
Section 382 of the Internal Revenue Code of 1986, as amended, imposes an annual limit on the ability of a corporation that undergoes an “ownership change” to use its net operating losses to reduce its tax liability. JBS USA Holdings experienced an ownership change in January of 2007 and July of 2007. JBS USA Holdings believes that its net operating losses exceed the Section 382 limitation in the amount of $14.0 million.
The valuation allowance for deferred tax assets as of December 24, 2006, July 10, 2007 and December 31, 2007 was $18.8 million, $52.0 million, and $127.0 million respectively. The net change in the total valuation allowance was an increase of $33.2 million and an increase of $75.0 million as of July 10, 2007 and December 30, 2007 respectively. The valuation allowance as of all dates presented was primarily related to loss and credit carryforwards that, in the judgment of management, are not more likely than not to be realized. In assessing the realizability of deferred tax assets, management considers whether it is more likely than not that some portion or all of the deferred tax assets will not be realized. The ultimate realization of deferred tax assets is dependent upon the generation of future taxable income during the periods in which those temporary differences become deductible. Management considers the scheduled reversal of deferred tax liabilities (including the impact of available carryback and carryforward periods), projected future taxable income, and tax-planning strategies in making this assessment.
Subsequently recognized tax benefits relating to the valuation allowance for deferred tax assets as of December 30, 2007 will be allocated to income tax expense pursuant to FAS 141(R). Prior to the adoption of FAS 141(R), $79.8 million of any subsequent tax benefits would be allocated to reduce goodwill related to the acquisition of JBS USA Holdings by JBS SA.
JBS USA Holdings (predecessor) has provided $60.2 million and $78.1 million for taxes on unremitted earnings of foreign subsidiaries. However as of December 24, 2006 and July 10, 2007, $57.1 million and $64.9 million, respectively, were considered indefinitely reinvested.
JBS USA Holdings (successor) deems all of its foreign investments to be permanent in nature and does not provide for taxes on permanently reinvested earnings. It is not practical to determine the amount of incremental taxes that might arise were these earnings to be remitted.
JBS USA Holdings adopted the provisions of Financial Accounting Standards Board Interpretation No. 48, Accounting for Uncertainty in Income Taxes (“FIN 48”), on December 25, 2006. Upon adoption of FIN 48, JBS USA Holdings recognized a $347 thousand increase in its retained earnings balance. After adoption of FIN 48, JBS USA Holding’s unrecognized tax benefits were $776 thousand, the recognition of which would have no net impact on the effective rate.
F-139
Table of Contents
JBS USA Holdings, Inc.
A wholly owned subsidiary of JBS S.A.
Notes to consolidated financial statements
A reconciliation of the beginning and ending amount of gross unrecognized tax benefits is as follows (in thousands):
| Balance at December 25, 2006 | $ 776 | ||
Additions based on tax positions related to the current period | — | ||
Additions for tax positions of prior years | — | ||
Reductions for lapses of statute of limitations | — | ||
Reductions for settlements | — | ||
Balance at July 10, 2007 | $ | 776 | |
Balance at Acquisition | $ | 8,286 | |
Additions based on tax positions related to the current period | 14 | ||
Additions for tax positions of prior years | — | ||
Reductions for lapses of statute of limitations | — | ||
Reductions for settlements | — | ||
Balance at December 30, 2007 | $ | 8,300 | |
JBS USA Holdings recognizes both interest and penalties related to uncertain tax positions as part of the income tax provision. Accrued interest and penalties were $161 thousand and $187 thousand as of July 10, 2007 and December 30, 2007 respectively.
JBS USA Holdings files income tax returns in the US and in various other states and foreign countries. JBS USA Holdings is no longer subject to audit for US Federal income tax purposes for years before 2004. In the other major jurisdictions where JBS USA Holdings operates, it is generally no longer subject to income tax examinations by tax authorities for years before 2002.
JBS USA Holdings and its subsidiaries have various income tax returns in the process of examination. The unrecognized tax benefit and related penalty and interest balances at December 30, 2007 are expected to decrease by $0.4 million within the next twelve months.
Note 10. Commitments and contingencies
On July 1, 2002, a lawsuit entitled Herman Schumacher et al v. Tyson Fresh Meats, Inc., et al was filed against a predecessor company, Tyson Foods, Inc., Excel Company, and Farmland National Beef Packing Company, L.P. in the United States District Court for the District of South Dakota seeking certification of a class of all persons who sold cattle to the defendants for cash, or on a basis affected by the cash price for cattle, during the period from April 2, 2001 through May 11, 2001 and for some period up to two weeks thereafter. The complaint alleges that the defendants, in violation of the Packers and Stockyards Act of 1921, knowingly used, without correction or disclosure, incorrect and misleading boxed beef price information generated by the USDA to purchase cattle offered for sale by the plaintiffs at a price substantially lower than was justified by the actual and correct price of boxed beef during this period. On April 12, 2006, the jury returned a verdict against three of the four defendants, including a $2.3 million verdict against Swift Beef. On February 15, 2007 a judgment was entered on the verdict by the court and
F-140
Table of Contents
JBS USA Holdings, Inc.
A wholly owned subsidiary of JBS S.A.
Notes to consolidated financial statements
on March 12, 2007 Swift Beef Company filed a notice of appeal. Although Swift Beef Company had begun the process of appealing this judgment, a liability for the amount of the verdict was recorded on May 28, 2006. ConAgra Foods will indemnify Swift & Company against any judgments for monetary damages or settlements arising out of this litigation or any future litigation arising from the same facts to the extent such damages together with any other indemnifiable claims under the acquisition agreement entered into the purchase of Swift Foods from ConAgra Foods, Inc. in 2002 exceed a minimum threshold of $7.5 million. On January 29, 2008 Swift Beef was notified that the appeals court ruled in favor of the defendants on all counts. Swift Beef is now seeking the recovery of a portion of the legal fees it expended in this matter. As the claimants rights to appeal expired during the third quarter ended December 28, 2008 the reversal of the previously accrued trial court verdict amount was recorded as an adjustment to the Acquisition, not as a reduction of expenses on the Consolidated Statement of Operations.
Swift Beef was a defendant in a lawsuit entitled United States of America, ex rel, Ali Bahrani v. ConAgra, Inc., ConAgra Foods, Inc., ConAgra Hide Division, ConAgra Beef Company and Monfort, Inc., filed in the United States District Court for the District of Colorado in May 2000 by the relator on behalf of the United States of America and himself for alleged violations of the False Claims Act. Under the False Claims Act, a private litigant, termed the “relator,” may file a civil action on the United States government’s behalf against another party for violation of the statute, which, if proven, would entitle the relator to recover a portion of any amounts recovered by the government. The lawsuit alleged that the defendants violated the False Claims Act by forging and/or improperly altering USDA export certificates used from 1991 to 2002 to export beef, pork, poultry and bovine hides to foreign countries. The lawsuit sought to recover three times the actual damages allegedly sustained by the government, plus per-violation civil penalties.
On December 30, 2004, the United States District Court granted the defendants’ motions for summary judgment on all claims. The United States Court of Appeals for the Tenth Circuit reversed the summary judgment on October 12, 2006 and remanded the case to the trial court for further proceedings consistent with the court’s opinion. Defendants filed a Motion for Rehearing En Banc on October 26, 2006. On May 10, 2007, the Tenth Circuit denied that motion.
Issues in the case were bifurcated and two separate jury trials were held, the first trial centering on beef certificates was held from April 28, 2008, to April 29, 2008 and the second trial centering on bovine hide certificates was held from March 9 to March 19, 2009. Following the April trial, a verdict with respect to the beef certificates was returned ruling in favor of the Company on all counts. Following the March trial, a verdict with respect to the bovine hide certificates was returned ruling in favor of Company on 99.5% of the claims. Specifically, Company prevailed with respect to approximately 995 bovine hide certificates and the relator prevailed with respect to only 5 certificates. Based on the False Claims Act, this verdict resulted in a judgment against Company of $28 thousand and the court ordered that each party pay its own attorneys’ fees and court costs. The relator timely issued a notice of appeal and entered a motion for attorneys’ fees and costs alleging that, because it prevailed on 0.5% of its claims, it was entitled to the payment
F-141
Table of Contents
JBS USA Holdings, Inc.
A wholly owned subsidiary of JBS S.A.
Notes to consolidated financial statements
of its attorneys’ fees and costs, estimated at $3 million. The Company has timely responded to the relator’s notice of appeal, filed a cross appeal, and responded to the relator’s motion for attorneys’ fees and costs. The parties await final adjudication of these issues, which could come as early as the third quarter, 2009.
The Company is also a party to a number of other lawsuits and claims arising out of the operation of its businesses. Management believes the ultimate resolution of such matters should not have a material adverse effect on the Company’s financial condition, results of operations, or liquidity. Attorney fees are expensed as incurred.
Commitments
JBS USA Holdings enters into purchase agreements for livestock which require the purchase of either minimum quantities or the total production of the facility over a specified period of time. At December 30, 2007, the Company had commitments to purchase 34.7 million hogs through 2014 and approximately 35% of cattle needs through short-term contracts. As the final price paid cannot be determined until after delivery, the Company has estimated market prices based on Chicago Mercantile Exchange traded futures contracts and applied those to either the minimum quantities required per the contract or management’s estimates of livestock to be purchased under certain contracts to determine its estimated commitments for the purchase of livestock, which are as follows (in thousands):
| Estimated livestock purchase commitments for fiscal year ended: | |||
2008 | $ | 3,167,672 | |
2009 | 1,010,143 | ||
2010 | 940,570 | ||
2011 | 609,332 | ||
2012 | 547,507 | ||
Thereafter | 439,003 | ||
Through use of these contracts, the Company purchased approximately 65% of its hog slaughter needs during the 173 days ended December 30, 2007.
Note 11. Business segments
JBS USA Holdings is organized into two operating segments, which are also the Company’s reportable segments: Beef and Pork. Segment operating performance is evaluated by the Chief Operating Decision Maker (“CODM”), as defined in SFAS No. 131,Disclosure about Segments of an Enterprise and Related Information, based on Earnings Before Interest, Taxes, Depreciation, and Amortization and interest and exclusion of certain non-cash items which affect net income (“EBITDA”). EBITDA is not intended to represent cash from operations as defined by GAAP and should not be considered as an alternative to cash flow or operating income as measured by GAAP. JBS USA Holdings believes EBITDA provides useful information about operating performance, leverage, and liquidity. The accounting policies of the segments are consistent with those described in Note 3. All intersegment sales and transfers are eliminated in consolidation.
F-142
Table of Contents
JBS USA Holdings, Inc.
A wholly owned subsidiary of JBS S.A.
Notes to consolidated financial statements
Beef—The majority of Swift Beef’s revenues are generated from the sale of fresh meat, which include chuck cuts, rib cuts, loin cuts, round cuts, thin meats, ground beef, and other products. In addition, Swift Beef also sells beef by-products to the variety meat, feed processing, fertilizer, automotive and pet food industries. Furthermore, Australian’s foods division produces value-added meat products including toppings for pizzas. The trading division in the US and Australia trades boxed meat products to brokers and retailers who resell those products to end customers.
In August 2005, the Company closed its Nampa, Idaho non-fed cattle processing facility. The closure was due to continued difficulty of sourcing older non-fed cattle for slaughter in the Northwestern US and the uncertainty surrounding the opening of the Canadian border to the importation of livestock older than 30 months of age. On May 26, 2006, the Company completed the sale of the idled Nampa facility as well as the operating Omaha, Nebraska non-fed cattle processing facility. Due to significant continuing involvement with the non-fed processing facilities through a raw material supply agreement, the operating results related to these plants for all periods presented have been reflected in continuing operations.
Pork—A significant portion of Swift Pork’s revenues are generated from the sale of products predominantly to retailers of fresh pork including trimmed cuts such as loins, roasts, chops, butts, picnics, and ribs. Other pork products, including hams, bellies, and trimmings are sold predominantly to further processors who, in turn, manufacture bacon, sausage, and deli and luncheon meats. The remaining sales are derived from by-products and from further-processed, higher-margin products. The lamb slaughter facility is included in Pork and accounts for less than 1% of total net sales.
F-143
Table of Contents
JBS USA Holdings, Inc.
A wholly owned subsidiary of JBS S.A.
Notes to consolidated financial statements
Corporate and other—Includes certain revenues, expenses, and assets not directly attributable to the primary segments, as well as eliminations resulting from the consolidation process.
| Predecessor | Successor | |||||||||||||
| Fiscal year ended December 24, 2006 | 198 days ended July 10, 2007 | 173 days ended December 30, 2007 | ||||||||||||
| (in thousands) | (in thousands) | (in thousands) | ||||||||||||
Net sales | ||||||||||||||
Beef | $ | 7,576,136 | $ | 3,757,295 | $ | 3,942,231 | ||||||||
Pork | 2,152,583 | 1,234,133 | 1,063,644 | |||||||||||
Corporate and other | (37,287 | ) | (20,804 | ) | (16,891 | ) | ||||||||
Total | $ | 9,691,432 | $ | 4,970,624 | $ | 4,988,984 | ||||||||
Depreciation, amortization, and goodwill impairment charges (i) | ||||||||||||||
Beef | $ | 65,443 | $ | 32,913 | $ | 25,627 | ||||||||
Pork | 23,679 | 11,925 | 9,617 | |||||||||||
Total | $ | 89,122 | $ | 44,838 | $ | 35,244 | ||||||||
EBITDA | ||||||||||||||
Beef | $ | (13,034 | ) | $ | (24,878 | ) | $ | (103,354 | ) | |||||
Pork | 65,027 | 31,234 | 57,352 | |||||||||||
Total | 51,993 | 6,356 | (46,002 | ) | ||||||||||
Depreciation, amortization, and goodwill impairment(i) | (89,122 | ) | (44,838 | ) | (35,244 | ) | ||||||||
Interest expense, net | (118,754 | ) | (66,383 | ) | (34,340 | ) | ||||||||
Foreign currency transaction gains | 463 | 527 | 5,201 | |||||||||||
Gain/(loss) on sales of property, plant and equipment | 666 | 2,946 | (182 | ) | ||||||||||
Loss before income tax expense | (154,754 | ) | (101,392 | ) | (110,567 | ) | ||||||||
Income tax benefit/(expense) | 37,348 | 18,380 | (1,025 | ) | ||||||||||
Net loss | $ | (117,406 | ) | $ | (83,012 | ) | $ | (111,592 | ) | |||||
| (i) | The fiscal year ended December 24, 2006 includes a goodwill impairment charge of $4.5 million related to the Beef segment. |
| Predecessor | Successor | ||||||||||
| Fiscal year ended December 24, 2006 | 198 days ended July 10, 2007 | 173 days ended December 30, 2007 | |||||||||
| (in thousands) | (in thousands) | (in thousands) | |||||||||
Capital expenditures | |||||||||||
Beef | $ | 39,304 | $ | 29,390 | $ | 28,129 | |||||
Pork | 7,990 | 4,310 | 5,332 | ||||||||
Total | $ | 47,294 | $ | 33,700 | $ | 33,461 | |||||
F-144
Table of Contents
JBS USA Holdings, Inc.
A wholly owned subsidiary of JBS S.A.
Notes to consolidated financial statements
Corporate and other—Includes certain assets not directly attributable to the primary segments as well as the parent companies’ investments in each operating subsidiary. Also includes eliminations resulting from the consolidation process.
Total assets by segment (in thousands):
| Predecessor | Successor | |||||||||
| December 24, 2006 | July 10, 2007 | December 30, 2007 | ||||||||
Total Assets | ||||||||||
Beef | $1,210,242 | $1,322,788 | $1,572,928 | |||||||
Pork | 338,940 | 289,408 | 487,160 | |||||||
Corporate and other | (10,585 | ) | (33,846 | ) | 105,727 | |||||
Total | $1,538,597 | $1,578,350 | $2,165,815 | |||||||
Sales by geographical area based on the location of the facility recognizing the sale (in thousands):
| Predecessor | Successor | |||||||
| Fiscal year ended December 24, 2006 | 198 days ended July 10, 2007 | 173 days ended December 30, 2007 | ||||||
Net sales | ||||||||
United States | $8,159,577 | $4,111,114 | $3,980,369 | |||||
Australia | 1,531,855 | 859,510 | 1,008,615 | |||||
Total | $9,691,432 | $4,970,624 | $4,988,984 | |||||
Sales to unaffiliated customers by location of customer (in thousands):
| Predecessor | Successor | ||||||||||
| Fiscal year ended December 24, 2006 | 198 days ended July 10, 2007 | 173 days ended December 30, 2007 | |||||||||
United States | $ | 7,499,398 | $ | 3,749,312 | $ | 3,520,268 | |||||
Japan | 682,773 | 373,372 | 365,759 | ||||||||
Mexico | 390,115 | 212,232 | 245,475 | ||||||||
Korea | 285,122 | 139,224 | 161,606 | ||||||||
Australia | 217,365 | 137,881 | 256,987 | ||||||||
Other | 616,659 | 358,603 | 438,889 | ||||||||
Total | $ | 9,691,432 | $ | 4,970,624 | $ | 4,988,984 | |||||
F-145
Table of Contents
JBS USA Holdings, Inc.
A wholly owned subsidiary of JBS S.A.
Notes to consolidated financial statements
Long-lived tangible assets by location of assets (in thousands):
| Predecessor | Successor | ||||||||||
| December 24, 2006 | July 10, 2007 | December 30, 2007 | |||||||||
Long-lived assets: | |||||||||||
United States | $ | 315,841 | $ | 332,274 | $ | 449,013 | |||||
Australia | 174,277 | 185,844 | 281,750 | ||||||||
Other | 113 | 106 | 121 | ||||||||
Total | $ | 490,231 | $ | 518,224 | $ | 730,884 | |||||
Long-lived assets consist of property, plant, and equipment, net of depreciation, and other assets less debt issuance costs. Long-lived assets by geographical area are based on location of facilities.
No single customer accounted for more than 10% of net sales in the fiscal year ended December 24, 2006, 198 days ended July 10, 2007, or 173 days ended December 30, 2007.
Note 12. Subsequent events
Acquisitions
The allocation presented below reflects the finalized fair value of the individual assets and liabilities as of July 11, 2007 (in thousands) for the purchase of JBS USA Holdings:
Purchase price paid to previous shareholders | $ 225,000 | ||||
Debt paid including accrued interest of $22,872 | 1,197,124 | ||||
Fees and direct expenses | 48,544 | ||||
Total purchase price | $1,470,668 | ||||
Preliminary purchase price allocation: | |||||
Current assets and liabilities | $583,643 | ||||
Property, plant, and equipment | 693,672 | ||||
Identified intangibles | 188,761 | ||||
Deferred tax asset | 56,537 | ||||
Goodwill | 42,762 | ||||
Other noncurrent assets and liabilities, net | (94,707 | ) | |||
Total purchase price allocation | $1,470,668 | ||||
On March 4, 2008, JBS Southern Australia Pty. Ltd (“JBS Southern”), an indirect subsidiary of JBS USA Holdings entered into an agreement with Tasman Group Services, Pty. Ltd. (“Tasman Group”) to purchase substantially all of the assets of Tasman Group in an all cash transaction (“Tasman Acquisition”) and the purchase was completed on May 2, 2008. The assets acquired include six processing facilities and one feedlot located in southern Australia. This acquisition provides additional capacity to continue to meet customer demand. The aggregate purchase
F-146
Table of Contents
JBS USA Holdings, Inc.
A wholly owned subsidiary of JBS S.A.
Notes to consolidated financial statements
price for the Tasman Acquisition was $117.3 million (including approximately $8.6 million of transaction costs). JBS Southern also assumed approximately $52.1 million of outstanding debt.
On March 4, 2008, JBS and Smithfield Foods, Inc (“Smithfield Foods”) entered into a Stock Purchase Agreement (“Smithfield Agreement”). Pursuant to the Smithfield Agreement, JBS purchased Smithfield Beef Group, Inc. (“Smithfield Beef”) for $563.2 million in cash (including $26.1 million of transaction related costs) and contributed its ownership in Smithfield Beef to JBS USA Holdings, Inc. (Smithfield Acquisition). JBS USA Holdings contributed its ownership in Smithfield Beef Group to JBS USA, Inc. (now known as JBS USA, LLC). The purchase included 100% of Five Rivers Ranch Cattle Feeding LLC (“Five Rivers”), which was held by Smithfield Beef in a 50/50 joint venture with Continental Grain Company (“CGC,” formerly ContiGroup Companies, Inc.). On October 23, 2008, the acquisition of Smithfield Beef was completed. In conjunction with the closing of this purchase Smithfield Beef was renamed JBS Packerland and Five Rivers was renamed JBS Five Rivers Cattle Feeding LLC (“JBS Five Rivers”). The assets acquired include four processing plants and eleven feedlots. This acquisition provides additional capacity to continue to meet customer demand.
The purchase excludes substantially all live cattle inventories held by Smithfield Beef and Five Rivers as of the closing date, together with its associated debt. The excluded live cattle will be raised by JBS Five Rivers after closing for a negotiated fee and then sold upon maturity at market-based prices. Proceeds from the sale of the excluded live cattle will be paid in cash to the Smithfield Foods/CGC joint venture or to Smithfield Foods, as appropriate. The parties to this agreement believe most of the live cattle inventories will be sold within six months following closing, with substantially all sold within 12 months of closing.
Five Rivers is party to a cattle supply and feeding agreement with an unconsolidated affiliate (“the unconsolidated affiliate”). Five Rivers feeds and takes care of cattle owned by the unconsolidated affiliate. The unconsolidated affiliate pays Five Rivers for the cost of feed and medicine at cost plus a yardage fee on a per head per day basis. Beginning on June 23, 2009 or such earlier date on which Five Rivers’ feed yards are at least 85% full of cattle and ending on October 23, 2011, the unconsolidated affiliate agrees to maintain sufficient cattle on Five Rivers’ feed yards so that such feed yards are at least 85% full of cattle at all times. The agreement commenced on October 23, 2008 and continues until the last of the cattle on Five Rivers’ feed yards as of October 23, 2011 are shipped to the unconsolidated affiliate, a packer or another third party.
On October 7, 2008 JBS USA, LLC became party to a cattle purchase and sale agreement with the unconsolidated affiliate. Under this agreement, the unconsolidated affiliate agrees to sell to JBS USA, LLC, and JBS USA, LLC agrees to purchase from the unconsolidated affiliate, at least 500,000 cattle during each year from 2009 through 2011. The price paid by JBS USA, LLC is determined pursuant to JBS USA, LLC’s pricing grid in effect on the date of delivery. The grid used for the unconsolidated affiliate is identical to the grid used for unrelated third parties. If the cattle sold by the unconsolidated affiliate in a quarter result in a breakeven loss (selling price below accumulated cost to acquire the feeder animal and fatten it to delivered weight) then JBS USA,
F-147
Table of Contents
JBS USA Holdings, Inc.
A wholly owned subsidiary of JBS S.A.
Notes to consolidated financial statements
LLC will reimburse 40% of the average per head breakeven loss incurred by the unconsolidated affiliate on up to 125,000 head delivered to JBS USA, LLC in that quarter. If the cattle sold by the unconsolidated affiliate in a quarter result in a breakeven gain (selling price above the accumulated cost to acquire the feeder animal and fatten it to delivered weight), then JBS USA, LLC will receive from the unconsolidated affiliate an amount of cash equal to 40% of that per head gain on up to 125,000 head delivered to JBS USA, LLC in that quarter. There were no payments under the loss/profit sharing provisions of this agreement for the thirteen weeks ended March 29, 2009.
The unconsolidated affiliate has a $600.0 million secured revolving credit facility with a commercial bank. Its parent company has entered into a keep-well agreement with its subsidiary (the unconsolidated affiliate) whereby it will make contributions to the unconsolidated affiliate if the unconsolidated affiliate is not in compliance with its financial covenants under this credit facility. If the unconsolidated affiliate defaults on its obligations under the credit facility and such default is not cured by its parent under the keep-well agreement, Five Rivers is obligated for up to $250.0 million of the obligations under this credit facility. This credit facility and the guarantee thereof are secured solely by the fixed assets of the unconsolidated affiliate and Five Rivers. This credit facility matures on October 7, 2011. This credit facility is used to acquire cattle which are then fed in the Five Rivers feed yards pursuant to the cattle supply and feeding agreement described above. The finished cattle are sold to JBS USA, LLC under the cattle purchase and sale agreement discussed above.
Five Rivers is party to an agreement with an unconsolidated affiliate pursuant to which Five Rivers has agreed to loan up to $200.0 million in revolving loans to the unconsolidated affiliate. The loans are used by the unconsolidated affiliate to acquire feeder animals which are placed in Five Rivers feed yards for finishing. Borrowings accrue interest at a per annum rate of LIBOR plus 2.25% or base rate plus 1.0% and interest is payable at least quarterly. This credit facility matures October 7, 2011. During the thirteen weeks ended March 29, 2009, average borrowings were approximately $149.0 million and total interest accrued was approximately $1.6 million which was recognized as interest income on the statement of operations.
On January 27, 2009, the Company reached agreement with Smithfield Foods for final settlement of the working capital component of the purchase price pursuant to the Stock Purchase Agreement. The settlement called for a payment of $4.5 million from Smithfield Foods to the Company as full and final settlement of the working capital delivered at October 23, 2008. The Company recorded the settlement as a reduction of purchase price upon receipt.
On February 18, 2009 an agreement was reached with the sellers of National Beef whereby JBS USA Holdings terminated the acquisition process of National Beef effective February 23, 2009. Related litigation with the DOJ was also terminated. As a result of the agreement, JBS USA Holdings, Inc. reimbursed the seller’s shareholders a total $19.9 million in February 2009 as full and final settlement of any and all liabilities related to the potential acquisition.
F-148
Table of Contents
JBS USA Holdings, Inc.
A wholly owned subsidiary of JBS S.A.
Notes to consolidated financial statements
Intercompany debt with JBS S.A.
On March 2, 2008, JBS S.A. contributed $400 million in additional paid in capital to repay a portion of the $750 million unsecured bank debt. On June 30, 2008, the Company entered into an unsecured loan agreement with JBS S.A. totaling $350 million with a maturity date of June 30, 2011. Interest payments are due semi-annually at a rate of six month LIBOR plus a margin of 3%.
On April 28, 2008, the Company entered into an unsecured loan agreement with its parent, JBS S.A. for $100 million with a maturity date of April 28, 2011. Interest payments are due semi-annually at a rate of six month LIBOR plus a margin of 3%. The funds received from this loan were used to fund the purchase of Tasman Group.
On May 5, 2008, the Company entered into an unsecured loan agreement with JBS S.A. for $25 million with a maturity date of May 5, 2009. Interest payments are due semi-annually at a rate of six month LIBOR plus a margin of 3%. The funds received were used to fund operations.
On June 30, 2008, the Company entered into an unsecured loan agreement with JBS S.A. for $25 million with a maturity date of June 10, 2009. Interest payments are due semi-annually at a rate of six month LIBOR plus a margin of 3%. The funds received were used to fund operations.
On October 20, 2008, the Company entered into an unsecured loan agreement with JBS S.A. for $250 million with a maturity date of October 21, 2011. Interest payments are due semi-annually at a rate of six month LIBOR plus a margin of 3%. The funds received were used in the acquisition of Smithfield Beef Group.
On April 27, 2009, JBS USA Holdings refinanced its five separate intercompany notes with JBS HU Liquidity Management LLC (“JBS HU”), a subsidiary of JBS S.A., which is organized in the country of Hungary, into one note with a stated interest rate of 12% and a 10 year maturity.
On May 6, 2009, the Company entered into an unsecured loan agreement with JBS HU for $6 million with a maturity date of May 6, 2019. Interest payments are due semi-annually at a rate of 12%. The funds received were used to repay a portion of the intercompany loans with JBS S.A.
Revolving credit facilities
On February 26, 2008, Swift Australia entered into an Australian dollar denominated $120 million unsecured credit facility to fund working capital and letter of credit requirements. Under this facility AUD $80 million can be borrowed for cash needs and AUD $40 million is available to fund letters of credit. Borrowings are made at the cash advance rate (BBSY) plus a margin of 0.98%. The credit facility contains certain financial covenants which require the Company to maintain predetermined ratio levels related to interest coverage, debt coverage and tangible net worth. This facility has an evergreen renewal term with review periods each June, commencing in 2009.
On November 5, 2008, JBS USA Holdings entered into a secured revolving loan credit agreement (the “Credit Agreement”) that allows borrowings up to $400.0 million, and terminates on November 5, 2011. Up to $75.0 million of the revolving credit facility is available for the issuance
F-149
Table of Contents
JBS USA Holdings, Inc.
A wholly owned subsidiary of JBS S.A.
Notes to consolidated financial statements
of letters of credit. Borrowings that are index rate loans will bear interest at the prime rate plus a margin of 2.25% while LIBOR rate loans will bear interest at the applicable LIBOR rate plus a margin of 3.25%. At December 28, 2008, the rates were 5.50% and 4.66%, respectively. Upon approval by the lender, LIBOR rate loans may be taken for one, two, or three month terms, (or six months at the discretion of the Agent).
On April 27, 2009 the Credit Agreement was amended to allow the execution of the senior unsecured note offering of JBS USA, LLC described below. Under the amendment, the existing limitation on distributions between JBS USA, LLC and JBS USA Holdings was amended to allow for the proceeds of the senior unsecured bond offering, less transaction expenses and $100 million retained by JBS USA, LLC to be remitted to JBS USA Holdings as a one time distribution. Also, the unused line fee was increased from 37.5 basis points to 50 basis points.
Debt offering
On April 27, 2009, JBS USA Holdings refinanced its five separate intercompany notes with JBS S.A. through JBS HU into one note with a stated interest rate of 12% and a 10 year maturity with a balance of $133 million at the reporting date.
On April 27, 2009, JBS USA, LLC, a wholly owned subsidiary, entered into a $700 million senior unsecured note offering bearing interest at 11.625% with interest payable semi-annually and a maturity of May 1, 2014. The proceeds net of expenses were $650.8 million and were used to repay $100 million on the Credit Agreement and the balance was used to repay intercompany debt and accrued interest owed to JBS HU.
Other
On October 14, 2008, the Company purchased $1 million in additional bonds from the City of Cactus, Texas (See Note 3).
On October 23, 2008, JBS USA Holdings issued a promissory note to a third party for approximately $173 million the proceeds of which were contributed to JBS USA, LLC. The promissory note bears interest at a rate of three-month LIBOR plus 2.0% per annum and matures on December 30, 2016.
The promissory note also contains events of default, including failure to perform or observe terms, covenants or other agreements in the promissory note, payment defaults on other indebtedness, defaults on other indebtedness if the effect is to permit acceleration, and entry of unsatisfied judgments of orders against JBS USA Holdings and its subsidiaries. If an event of default occurs and is continuing the payee may accelerate the note and declare all amounts due and payables or at the payee’s election, convert amounts owing under the promissory note into voting stock of JBS USA Holdings.
JBS USA Holdings is also party to a raw materials supply agreement with a customer, pursuant to which JBS USA Holdings has agreed that it and its affiliates will sell certain raw materials to such
F-150
Table of Contents
JBS USA Holdings, Inc.
A wholly owned subsidiary of JBS S.A.
Notes to consolidated financial statements
customer on an exclusive basis. To the extent that the customer is required to pay a premium under the supply agreement, an amount equal to such premium is required to be paid in respect of the note. Payments are applied toward accrued interest first and then principal. JBS USA to distribute to JBS USA Holdings payments received from this customer in respect of premium pursuant to the agreement to allow JBS USA Holdings to satisfy its obligations due under the promissory note in accordance with its terms. Amounts outstanding under the promissory note are recorded as long term liabilities in the financial statements of JBS USA Holdings and payments or other reductions in obligations are recoded as the realization of deferred revenue.
On December 29, 2008, JBS USA Holdings, Inc., was renamed JBS USA Holdings, LLC and converted from a C Corporation to a Limited Liability Company. As a result of the conversion in legal form, the outstanding share which was 100% owned by JBS USA Holdings, Inc was converted into a single member interest held by JBS USA Holdings, Inc.
Beginning in mid-April 2009 the world press began publicizing the occurrence of regionalized influenza outbreaks which were linked on a preliminary basis to a hybrid avian/swine/human virus. As a result commencing on April 14, 2009 several foreign countries including Russia, Thailand, Ukraine and Mainland China closed their borders to some or all pork produced in the affected states in the USA or other affected regions in the world. The company is not able to assess whether or when the influenza outbreak might lessen or whether or when additional countries might impose restrictions on the importation of pork products from the USA, nor whether or when the existing import bans might be lifted.
F-151
Table of Contents
Report of Independent Registered Public Accounting Firm
The Board of Directors and Shareholder
JBS Packerland, Inc.
We have audited the accompanying consolidated balance sheet of Smithfield Beef Group, Inc. (now known as JBS Packerland, Inc.) and subsidiaries as of April 27, 2008, and the related consolidated statements of operations, changes in stockholder’s equity, and cash flows for the year then ended. These financial statements are the responsibility of the Company’s management. Our responsibility is to express an opinion on these financial statements based on our audit. We did not audit the financial statements of Five Rivers Ranch Cattle Feeding LLC (a corporation in which the Company has a 50% interest). Those financial statements were audited by other auditors whose report has been furnished to us, and our opinion, insofar as it relates to the amounts included for Five Rivers Cattle Ranch Feeding LLC, is based on the report of the other auditors as explained in Note 5.
We conducted our audit in accordance with the standards of the Public Company Accounting Oversight Board (United States). Those standards require that we plan and perform the audit to obtain reasonable assurance about whether the financial statements are free of material misstatement. We were not engaged to perform an audit of the Company’s internal control over financial reporting. Our audit included consideration of internal control over financial reporting as a basis for designing audit procedures that are appropriate in the circumstances, but not for the purpose of expressing an opinion on the effectiveness of the Company’s internal control over financial reporting. Accordingly, we express no such opinion. An audit also includes examining, on a test basis, evidence supporting the amounts and disclosures in the financial statements, assessing the accounting principles used and significant estimates made by management, and evaluating the overall financial statement presentation. We believe that our audit provides a reasonable basis for our opinion.
In our opinion, based on our audit and the report of other auditors, the financial statements referred to above present fairly, in all material respects, the consolidated financial position of Smithfield Beef Group, Inc. and subsidiaries at April 27, 2008, and the consolidated results of their operations and their cash flows for the year then ended, in conformity with U.S. generally accepted accounting principles.
/s/ ERNST & YOUNG LLP
Milwaukee, WI
March 31, 2009
F-152
Table of Contents
Consolidated balance sheet
April 27, 2008
(dollars in thousands)
Assets | ||||
Current assets: | ||||
Cash | $ | 56 | ||
Accounts receivable, less allowances of $1,131 | 110,754 | |||
Inventories | 234,935 | |||
Deferred income taxes | 6,233 | |||
Prepaid expenses and other current assets | 10,314 | |||
Total current assets | 362,292 | |||
Property, plant and equipment, net | 143,889 | |||
Investment in Five Rivers Ranch Cattle Feeding LLC | 157,561 | |||
Investment in other joint ventures | 1,057 | |||
Goodwill | 115,921 | |||
Intangible assets | 4,252 | |||
Other assets | 6,019 | |||
| $ | 790,991 | |||
Liabilities and stockholder’s equity | ||||
Current liabilities: | ||||
Accounts payable | $ | 70,051 | ||
Accrued payroll and benefits | 19,661 | |||
Other accrued liabilities | 28,642 | |||
Current portion of long-term debt due third parties | 1,247 | |||
Total current liabilities | 119,601 | |||
Long-term debt due Smithfield Foods, Inc. | 503,741 | |||
Long-term debt due third parties | 736 | |||
Deferred income taxes | 20,359 | |||
Other long-term liabilities | 21,316 | |||
Commitments and contingencies | ||||
Stockholder’s equity: | ||||
Class A Common stock, $.01 par value; 15,000 shares authorized, 1,000 shares issued and outstanding | — | |||
Additional paid-in capital | 242,640 | |||
Accumulated deficit | (115,038 | ) | ||
Accumulated other comprehensive loss | (2,364 | ) | ||
Total stockholder’s equity | 125,238 | |||
| $ | 790,991 | |||
See accompanying notes.
F-153
Table of Contents
Consolidated statement of operations
For the year ended April 27, 2008
(Dollars in thousands)
Net sales | $2,909,214 | ||
Cost of sales | 2,802,848 | ||
Gross profit | 106,366 | ||
Operating costs and expenses: | |||
Selling, general and administrative expenses | 61,879 | ||
Corporate service fees from Smithfield Foods, Inc. | 16,180 | ||
Royalty fees to Smithfield Foods, Inc. | 4,953 | ||
Total operating costs and expenses | 83,012 | ||
Gain on sale of property, plant and equipment | 2,140 | ||
Income from operations | 25,494 | ||
Other income (expense): | |||
Interest income | 726 | ||
Interest expense: | |||
Smithfield Foods, Inc. | (41,486 | ) | |
Third parties | (278 | ) | |
Equity in income of Five Rivers Ranch Cattle Feeding LLC | 12,853 | ||
Equity in income of other joint ventures | 147 | ||
Loss before income taxes | (2,544 | ) | |
Provision for income taxes | 536 | ||
Net loss | $ (3,080 | ) | |
See accompanying notes.
F-154
Table of Contents
Consolidated statement of changes in stockholder’s equity
For the year ended April 27, 2008
(Dollars in thousands)
| Class a common stock | Additional Paid-in | Accumulated | Accumulated other comprehensive | Total Stockholder’s | |||||||||||
| Number of shares | Par value | ||||||||||||||
Balance at April 29, 2007 | 1,000 | $— | $242,640 | $(111,958 | ) | $(2,491 | ) | $128,191 | |||||||
Comprehensive loss | |||||||||||||||
Net loss | — | — | — | (3,080 | ) | — | (3,080 | ) | |||||||
Proportionate loss on derivatives held by Five Rivers Ranch Cattle Feeding LLC | — | — | — | — | 127 | 127 | |||||||||
Total comprehensive loss | (2,953 | ) | |||||||||||||
Balance at April 27, 2008 | 1,000 | $— | $242,640 | $(115,038 | ) | $(2,364 | ) | $125,238 | |||||||
See accompanying notes.
F-155
Table of Contents
Consolidated statement of cash flows
For the year ended April 27, 2008
(Dollars in thousands)
Operating activities | |||
Net loss | $(3,080 | ) | |
Adjustment to reconcile net loss to net cash provided by operating activities: | |||
Depreciation and amortization | 18,659 | ||
Gain on sale of property, plant and equipment | (2,140 | ) | |
Equity in income of Five Rivers Ranch Cattle Feeding, LLC | (12,853 | ) | |
Equity in income of other joint ventures | (147 | ) | |
Deferred income taxes | (303 | ) | |
Changes in operating assets and liabilities: | |||
Accounts receivable | (12,875 | ) | |
Inventories | 99,456 | ||
Prepaid expenses and other current assets | (1,423 | ) | |
Accounts payable | 1,202 | ||
Accrued liabilities | (171 | ) | |
Other noncurrent assets and liabilities | (7,079 | ) | |
Cash provided by operating activities | 79,246 | ||
Investing activities | |||
Additions to property, plant and equipment | (12,910 | ) | |
Proceeds from sale of property, plant and equipment | 5,961 | ||
Other | 42 | ||
Cash used in investing activities | (6,907 | ) | |
Financing activities | |||
Net payments under debt agreement with Smithfield Foods, Inc. | (76,178 | ) | |
Payments on debt due third parties | (1,105 | ) | |
Cash used in financing activities | (77,283 | ) | |
Decrease in cash | (4,944 | ) | |
Cash at beginning of the year | 5,000 | ||
Cash at the end of the year | $56 | ||
Supplemental disclosures of cash flow information | |||
Cash paid for interest to third parties | $269 | ||
See accompanying notes.
F-156
Table of Contents
Notes to consolidated financial statements
April 27, 2008
1. Description of the business
Basis of presentation
Smithfield Beef Group, Inc. (the Company or Smithfield Beef Group) now known as JBS Packerland, Inc., processes, prepares, packages and delivers fresh, further-processed and value-added beef products for sale to customers in the United States and international markets from four beef processing facilities. Smithfield Beef Group sells beef products to customers in the foodservice, international, further processor and retail distribution channels. Smithfield Beef Group also produces and sells by-products that are derived from its beef processing operations and variety meats to customers in various industries.
Sale of the company
On October 23, 2008, Smithfield Foods, Inc., (the owner of Smithfield Beef Group prior to this date) completed the sale of Smithfield Beef Group, to a wholly-owned subsidiary of JBS S.A., a company organized and existing under the laws of Brazil, for $565 million, net of postclosing adjustments. The sale included 100% of Five Rivers Ranch Cattle Feeding LLC (Five Rivers), a 50/50 joint venture with Continental Grain Company (CGC).
2. Significant accounting polices
Principles of consolidation
The consolidated financial statements include all wholly-owned subsidiaries. The Company’s investments in Five Rivers, Five Star Cattle Solutions, LLC and Mountain View Rendering Co. LLC are accounted for under the equity method. The Company has a 50% ownership in each of these entities. All intercompany transactions and balances have been eliminated.
The Company’s fiscal year consists of either 52 or 53 weeks, ending on the Sunday nearest April 30th. The Company’s fiscal year ended April 27, 2008, consisted of 52 weeks.
Employees
Certain hourly employees of the Company’s production facilities are represented by a variety of labor unions, with labor agreements having various expiration dates. The Company has one union contract expiring in fiscal 2009. Union employees represent approximately 42% of the total employees of the Company at April 27, 2008.
Use of estimates
The preparation of financial statements in conformity with accounting principles generally accepted in the United States requires management to make estimates and assumptions that affect the amounts reported in the financial statements and accompanying notes. Actual results could differ from those estimates.
F-157
Table of Contents
Smithfield Beef Group, Inc.
Notes to consolidated financial statements
Financial instruments
The carrying value of the Company’s financial instruments, including cash, accounts receivable, accounts payable and long-term debt at April 27, 2008, approximates fair value.
Accounts receivable
The Company has a diversified customer base, which includes customers located in foreign countries. The Company controls credit risk related to accounts receivable through credit appraisals, credit limits, letters of credit, and monitoring procedures. The Company evaluates the collectability of its accounts receivable balance based on a general analysis of past due receivables and a specific analysis of certain customers that management believes will be unable to meet their financial obligations due to economic conditions, industry-specific conditions, historical or anticipated performance, and other relevant circumstances. The Company continuously performs credit evaluations and reviews of its customer base. The Company believes this process effectively addresses its exposure to accounts receivable write-offs; however, if circumstances related to changes in the economy, industry, or customer conditions change, the Company may need to subsequently adjust the allowance for doubtful accounts. The Company adheres to normal industry collection terms of net seven days.
Inventories
Inventories consist primarily of product, live cattle, and manufacturing supplies. Product inventories are considered commodities and are valued based on quoted commodity prices, which approximate net realizable value less cost to complete and disposal costs. Product inventories are relieved from inventory utilizing the first-in, first-out method. Live cattle includes the purchase cost of the cattle, direct materials, supplies, and feed. Cattle are reclassified from live cattle to carcass inventory at time of slaughter. Manufacturing supplies are valued at the lower of first-in, first-out cost, average cost or market.
Property, plant and equipment, net
Property, plant and equipment is stated at cost, and is depreciated on a straight-line basis over the estimated useful lives of the assets as follows:
Buildings and improvements | 20 – 40 years | |
Machinery and equipment | 5 – 10 years | |
Automobiles and trucks | 3 – 5 years | |
Furniture and fixtures | 5 years | |
Computer hardware | 5 years | |
Leasehold improvements | Shorter of useful life or the lease term | |
Depreciation expense is included as either cost of sales or selling, general and administrative expenses, as appropriate, and totaled $17.9 million in fiscal 2008. Repairs and maintenance charges are expensed as incurred and totaled $20.1 million in fiscal 2008. Improvements that
F-158
Table of Contents
Smithfield Beef Group, Inc.
Notes to consolidated financial statements
materially extend the life of the asset are capitalized. Gains and losses from dispositions or retirements of property, plant and equipment are recognized in the period they occur. Interest is capitalized on property, plant and equipment during the construction period. There was no interest capitalized in fiscal 2008.
The Company periodically assesses the recoverability of long-lived assets, including property and equipment, in accordance with the provisions of Statement of Financial Accounting Standards (SFAS) No. 144,Accounting for the Impairment or Disposal of Long-Lived Assets. This statement requires that all long-lived assets be reviewed for impairment whenever events or changes in circumstances indicate the carrying amount of an asset may not be recoverable. Recoverability of assets to be held and used is measured by comparison of the carrying value of such assets to the undiscounted future cash flows expected to be generated by the assets. If the carrying value of an asset exceeds its estimated undiscounted future cash flows, an impairment provision is recognized to the extent that the carrying amount of the asset exceeds its fair value. Assets to be disposed of are reported at the lower of the carrying amount or the fair value of the asset, less costs of disposition. Management considers such factors as current results, trends and future prospects, current market value, and other economic and regulatory factors in performing these analyses. The Company determined that no long-lived assets were impaired as of April 27, 2008.
Goodwill and intangible assets
Goodwill represents the excess of the purchase price over the fair value of identifiable net assets of businesses acquired. Indefinite-lived intangible assets consist of tradenames.
Goodwill and indefinite-lived intangible assets are tested for impairment annually in the fourth quarter, or sooner if impairment indicators arise in accordance with SFAS No. 142,Goodwill and Other Intangible Assets. The fair value of indefinite-lived intangible assets is estimated based upon discounted future cash flow projections. In reviewing goodwill for impairment, potential impairment is identified by comparing the estimated fair value of a reporting unit to its carrying value. The fair value of a reporting unit is estimated by applying valuation multiples or estimating future discounted cash flows. The selection of multiples is dependent upon assumptions regarding future levels of operating performance as well as business trends, prospects and market and economic conditions. When estimating future discounted cash flows, the Company considers the assumptions that hypothetical marketplace participants would use in estimating future cash flows. In addition, where applicable, an appropriate discount rate is used, based on the Company’s cost of capital or location-specific economic factors. When the fair value is less than the carrying value of the net assets of a reporting unit, including goodwill, an impairment loss may be recognized. The Company has determined that goodwill and indefinite-lived assets were not impaired as of April 27, 2008.
Intangible assets with finite lives consist of patents, which are amortized over their estimated useful life of 15 years. Patents, net of accumulated amortization of $0.5 million, were $1.1 million at April 27, 2008. Patent amortization expense for the fiscal year ended April 27, 2008, totaled $0.1 million and is estimated to be approximately the same amount in each of the subsequent five years.
F-159
Table of Contents
Smithfield Beef Group, Inc.
Notes to consolidated financial statements
Investments
The Company records its share of earnings and losses from its equity method investments in “Equity in income (loss) of affiliates” in the accompanying consolidated statement of operations. The Company considers whether the fair values of any of the equity-method investments have declined below their carrying value whenever adverse events or changes in circumstances indicate that recorded values may not be recoverable. If the Company considers any such decline to be other than temporary, then a write-down of the investment would be recorded to its estimated fair value. The Company has determined that no write-downs were necessary as of April 27, 2008.
Income taxes
The Company is included in the consolidated U.S. federal income tax return of Smithfield Foods, Inc. A formal tax-sharing agreement between Smithfield Foods, Inc. and the Company does not exist. The benefit for income taxes in the accompanying consolidated statement of operations has been calculated as if a consolidated federal and appropriate state income tax returns had been filed separately by the Company. Deferred income taxes are provided on the differences in the book and tax basis of assets and liabilities at the statutory tax rates expected to be in effect when such temporary differences are expected to reverse. A valuation allowance is provided on the tax benefits otherwise associated with certain tax attributes unless it is considered more likely than not that the benefits will be realized. Smithfield Foods, Inc. pays domestic taxes on behalf of the Company and reflects the funding through an intercompany payable account.
The determination of the provision for income taxes requires significant judgment, the use of estimates, and the interpretation and application of complex tax laws. Significant judgment is required in assessing the timing and amounts of deductible and taxable items. Reserves are established when, despite the Company’s belief that its tax return positions are fully supportable, the Company believes that certain positions may be successfully challenged. When facts and circumstances change, these reserves are adjusted through the provision for income taxes.
In July 2006, the Financial Accounting Standards Board issued Interpretation No. 48,Accounting for Uncertainty in Income Taxes (FIN 48), which clarifies the accounting for income taxes by prescribing the minimum recognition threshold that a tax position is required to meet before being recognized in the financial statements. FIN 48 also provides guidance on derecognition, classification, interest and penalties, accounting in interim periods, disclosure and transition. The Company adopted FIN 48 effective April 30, 2007. The Company accrues interest and penalties related to unrecognized tax benefits as other noncurrent liabilities and recognizes the related expense as income tax expense.
Derivative financial instruments and hedging activities
The Company uses various raw materials, primarily live cattle and corn, which are actively traded on commodity exchanges. The Company hedges these commodities when it determines conditions are appropriate to mitigate these price risks. While such hedging may limit the
F-160
Table of Contents
Smithfield Beef Group, Inc.
Notes to consolidated financial statements
Company’s ability to participate in gains from favorable commodity fluctuations, it also tends to reduce the risk of loss from adverse changes in raw material prices. The Company attempts to closely match the commodity contract terms with the hedged item.
The Company accounts for derivative financial instruments in accordance with SFAS No. 133,Accounting for Derivative Instruments and Hedging Activities, which requires companies to recognize all of their derivative instruments as either assets or liabilities in the balance sheet at fair value. The accounting for changes in the fair value of a derivative instrument depends on whether it has been designated and qualifies as part of a hedging relationship and, further, on the type of hedging relationship. For those derivative instruments that are designated and qualify as hedging instruments, a company must designate the hedging instrument, based upon the exposure being hedged, as either a fair value hedge, cash flow hedge, or a hedge of a net investment in a foreign operation. Since none of the Company’s derivative instruments were designated as hedges in accordance with SFAS No. 133, the gain or loss related to the change in fair value for each derivative instrument is recognized in operations during the period of change. For the year ended April 27, 2008, the Company recognized a gain of $24.8 million, which is included in cost of sales in the accompanying consolidated statement of operations related to derivative financial instruments. As of April 27, 2008, the fair value of derivative financial instruments was $2.6 million and is included in prepaid expenses and other current assets in the accompanying consolidated balance sheet.
The Company records its proportionate share of the fair value of derivative financial instruments entered into by Five Rivers through other comprehensive loss as these derivative financial instruments are accounted for under hedge accounting.
Self-insurance programs
The Company is self-insured for certain levels of general and vehicle liability, property, workers’ compensation, product recall and healthcare coverage. The cost of these self-insurance programs is accrued based upon estimated settlements for known and anticipated claims. Any resulting adjustments to previously recorded reserves are reflected in operations.
Revenue recognition
The Company recognizes revenues from product sales when title passes upon delivery to its customers. Revenue is recorded at the invoice price for each product, net of estimated returns and sales incentives provided to customers. Sales incentives include various rebate and trade allowance programs with customers, primarily discounts and rebates based on achievement of specified volume or growth in volume levels.
Advertising and promotional costs
Advertising costs are expensed as incurred. Promotional sponsorship costs are expensed as the promotional events occur. Advertising and promotional costs totaled $2.2 million in fiscal 2008.
F-161
Table of Contents
Smithfield Beef Group, Inc.
Notes to consolidated financial statements
Shipping and handling costs
Shipping and handling costs charged to customers are included in net sales, and the related costs are included in cost of sales.
Segment reporting
The Company operates in one segment: the raising, processing and packaging of beef products for sale to customers in the United States and international markets.
Recent accounting pronouncements
In March 2008, the FASB issued SFAS No. 161,Disclosures about Derivative Instruments and Hedging Activities—an amendment of FASB Statement No. 133. SFAS No. 161 requires (1) qualitative disclosures about objectives for using derivatives by primary underlying risk exposure; (2) information about the volume of derivative activity; (3) tabular disclosures about the balance sheet location and gross fair value of derivative instruments, and income statement and other comprehensive income location and amounts of gains and losses on derivative instruments by contract type; and (4) disclosures about credit-risk-related contingent features in derivative agreements. SFAS No. 161 is effective for financial statements issued for fiscal years and interim periods beginning after November 15, 2008. Management believes the adoption of this pronouncement will not have a material impact on the Company’s consolidated financial statements.
In December 2007, the FASB issued SFAS No. 141R,Business Combinations (SFAS No. 141R). SFAS No. 141R establishes principles and disclosure requirements on how to recognize, measure and present the assets acquired, the liabilities assumed, any noncontrolling interests in the acquired company, and any goodwill recognized in a business combination. The objective of SFAS No. 141R is to improve the information included in financial reports about the nature and financial effects of business combinations. This statement is effective for business combinations with an acquisition date on or after the beginning of the first annual reporting period beginning on or after December 15, 2008. Management believes the adoption of this pronouncement will not have a material impact on the Company’s consolidated financial statements.
In December 2007, the FASB issued SFAS No. 160,Noncontrolling Interests in Consolidated Financial Statements—an amendment of ARB No. 51 (SFAS No. 160). SFAS No. 160 establishes accounting and reporting standards for a noncontrolling (minority) interest in a subsidiary and for the deconsolidation of a subsidiary. This statement clarifies that a noncontrolling interest in a subsidiary is an ownership interest in the consolidated entity and should be reported as equity in the consolidated financial statements, rather than as a liability or in the mezzanine section between liabilities and equity. SFAS No. 160 also requires consolidated net income to be reported at amounts that include the amounts attributable to both the parent and the noncontrolling interest. SFAS No. 160 is effective for fiscal years beginning on or after December 15, 2008. Management believes the adoption of this pronouncement will not have a material impact on the Company’s consolidated financial statements.
F-162
Table of Contents
Smithfield Beef Group, Inc.
Notes to consolidated financial statements
In September 2006, the FASB issued SFAS No. 157,Fair Value Measurements (SFAS No. 157). SFAS No. 157 defines fair value, establishes a framework for measuring fair value in accounting principles generally accepted in the United States, and expands disclosures about fair value measurements. It does not require any new fair value measurements. SFAS No. 157 is effective for fiscal years beginning after November 15, 2007, and interim periods within those fiscal years for financial assets and liabilities, and for fiscal years beginning after November 15, 2008, for nonfinancial assets and liabilities. Management believes the adoption of this pronouncement will not have a material impact on the Company’s consolidated financial statements.
In February 2007, the FASB issued SFAS No. 159,The Fair Value Option for Financial Assets and Financial Liabilities. SFAS No. 159 permits entities to choose to measure many financial instruments, and certain other items, at fair value. SFAS No. 159 applies to reporting periods beginning after November 15, 2007. Management believes the adoption of this pronouncement will not have a material impact on the Company’s consolidated financial statements.
3. Inventories
The components of inventories at April 27, 2008, net of reserves of $1.5 million, are as follows (in thousands):
Live cattle | $ | 146,325 | |
Product inventories: | |||
Fresh and packaged meats | 56,010 | ||
Carcass inventory | 15,238 | ||
Manufacturing supplies | 14,582 | ||
Other | 2,780 | ||
| $ | 234,935 | ||
The sale of the Smithfield Beef Group as discussed in Note 1, excluded substantially all live cattle inventories held by the Company and Five Rivers as of the transaction date. Live cattle owned by Five Rivers on the transaction date were transferred to a new 50/50 joint venture between Smithfield Foods, Inc. and CGC, while live cattle owned by Smithfield Beef Group on the transaction date were transferred to a subsidiary of Smithfield Foods, Inc. The excluded live cattle will be raised by JBS Packerland, Inc. for a negotiated fee and then sold at maturity at market-based prices. Proceeds from the sale of the excluded live cattle will be paid in cash to the Smithfield Foods, Inc./CGC joint venture or to Smithfield Foods, Inc., as appropriate. The live cattle inventories are expected to be sold within six months after the transaction date, with substantially all live cattle sold within 12 months after the transaction date.
F-163
Table of Contents
Smithfield Beef Group, Inc.
Notes to consolidated financial statements
4. Property, plant and equipment, net
Property, plant and equipment, net consist of the following at April 27, 2008 (in thousands):
Land | $ | 13,946 | ||
Buildings and improvements | 90,619 | |||
Machinery and equipment | 127,021 | |||
Automobiles and trucks | 5,629 | |||
Furniture and fixtures | 3,581 | |||
Computer hardware | 2,835 | |||
Leasehold improvements | 176 | |||
Construction in progress | 14,032 | |||
| 257,839 | ||||
Accumulated depreciation | (113,950 | ) | ||
| $ | 143,889 | |||
On December 21, 2007, the Company sold the land and buildings of its Showcase facility, located in Philadelphia, PA, for approximately $5.2 million. As a result of the sale, the Company recorded a gain of approximately $2.3 million. In addition, the Company paid approximately $5.8 million to exit its equipment lease agreement with a third party and purchase all the leased equipment.
The sale of the Smithfield Beef Group, as discussed in Note 1, excluded certain land and land improvements that totaled $9.2 million at April 27, 2008.
5. Investment in Five Rivers
In fiscal 2006, Smithfield Beef Group and CGC formed Five Rivers, a 50/50 joint venture. Five Rivers is a stand-alone operating company, independent from the Company and CGC, currently headquartered in Greeley, Colorado, with a total of ten feedlots located in Colorado, Idaho, Kansas, Oklahoma and Texas. Five Rivers sells cattle to multiple U.S. beef packing firms using a variety of marketing methods. Five Rivers has a fiscal year ended March 31, 2008, and was audited by other auditors.
For its 50% interest in Five Rivers, the Company has contributed cash of $106.3 million and net assets of $44.7 million. There currently exists a difference between the carrying amount of the Company’s investment in Five Rivers and the Company’s proportionate share of its underlying equity in the net assets of Five Rivers primarily due to the difference in the fair value of cash and net assets contributed by the Company in relation to its ownership interest in Five Rivers.
F-164
Table of Contents
Smithfield Beef Group, Inc.
Notes to consolidated financial statements
Following is a reconciliation of the investment in Five Rivers and equity in income of Five Rivers as of and for the year ended April 27, 2008, from the report of other auditors to the amounts included in the accompanying financial statements (in thousands):
50% interest in the net assets of Five Rivers at March 31, 2008 (per report of | $ | 157,385 | ||
Excess of the cost of investment over the amount of underlying equity in net assets of Five Rivers | 22,828 | |||
50% interest in the loss of Five Rivers for the month ended April 27, 2008 | (5,736 | ) | ||
50% interest in other comprehensive loss of Five Rivers for the month ended | (16,916 | ) | ||
Investment in Five Rivers at April 27, 2008 | $ | 157,561 | ||
Equity in income of Five Rivers for the year ended March 31, 2008 (per report of other auditors) | $ | 18,729 | ||
Less proportionate share of the income of Five Rivers for the month ended | (140 | ) | ||
Plus proportionate share of the loss of Five Rivers for the month ended | (5,736 | ) | ||
Equity in income of Five Rivers for the year ended April 27, 2008 | $ | 12,853 | ||
Five Rivers meets the definition of a significant subsidiary (per Regulation S-X) with respect to the Company. Condensed financial statements for Five Rivers as of March 31, 2008, and for the year ended March 31, 2008, are presented below (in thousands):
Current assets | $ | 647,245 | |
Noncurrent assets | 103,936 | ||
Current liabilities | 436,242 | ||
Noncurrent liabilities | 170 | ||
Revenues | $ | 1,657,103 | |
Costs and expenses | 1,593,731 | ||
Operating income | 63,372 | ||
Net income | 37,457 | ||
6. Other assets
Other assets consist of the following at April 27, 2008 (in thousands):
Other assets: | |||
Aircraft | $ | 2,065 | |
Deposit | 725 | ||
Tax benefit related to uncertain tax positions | 2,057 | ||
Computer software | 380 | ||
Other noncurrent assets | 792 | ||
| $ | 6,019 | ||
F-165
Table of Contents
Smithfield Beef Group, Inc.
Notes to consolidated financial statements
Other assets include the Company’s 25% ownership interest in an aircraft and a deposit with the Arizona Department of Water Resources for water rights related to its facility in Tolleson, Arizona. The ownership interest in the aircraft was purchased on December 31, 2004 for $2.6 million and is being depreciated over its useful life of 20 years. Amortization of capitalized computer software was $0.7 million in fiscal 2008.
7. Long-term debt
Long-term debt consists of the following at April 27, 2008 (in thousands):
Long-term debt due Smithfield Foods, Inc.: | |||
Debt due Smithfield Foods, Inc. | $ | 304,316 | |
Term notes due SFFC, Inc. | 199,425 | ||
| $ | 503,741 | ||
Other long-term debt due third parties: | |||
Note payable | $ | 989 | |
Other | 994 | ||
| 1,983 | |||
Less current portion | 1,247 | ||
| $ | 736 | ||
The Company had a lending arrangement with Smithfield Foods, Inc., under which Smithfield Foods, Inc. financed the working capital needs of the Company. Amounts outstanding under the facility bore interest at rates ranging between 4.5% and 7% as of April 27, 2008. The lending agreement did not have a stated maturity date nor did it contain any financial covenants. The debt with Smithfield Foods, Inc. has been classified as long term based on the intent of Smithfield Foods, Inc. for these amounts not to be repaid in the next fiscal year.
On January 1, 2007, the Company entered into a series of term notes with SFFC, Inc. (a wholly owned subsidiary of Smithfield Foods, Inc.) totaling $199.4 million. The term notes bear interest at 7.75% and are due December 31, 2016. The term notes do not contain any financial covenants.
In connection with the purchase of Murco, Inc., now known as JBS Plainwell, Inc., the Company issued a note payable (Note) to the former owner for $13.3 million. Principal and interest payments under the Note are due weekly, decreasing from $30,000 to $20,000 over the life of the Note. As the Note does not bear interest, the Company discounted the estimated future cash flows under the Note and adjusted the carrying value of the Note to $8.2 million at the purchase date, which approximated the fair value of the Note. The effective interest rate on the Note is 10% and the Note matures May 12, 2009.
F-166
Table of Contents
Smithfield Beef Group, Inc.
Notes to consolidated financial statements
8. Income taxes
Significant components of the provision for income taxes for the year ended April 27, 2008, are as follows (in thousands):
Current tax expense (benefit): | ||||
Federal | $ | (1,034 | ) | |
State | 1,873 | |||
| 839 | ||||
Deferred tax benefit: | ||||
Federal | (273 | ) | ||
State | (30 | ) | ||
| (303 | ) | |||
| $ | 536 | |||
A reconciliation of income tax benefit computed at the federal statutory rate to the provision for income taxes is as follows (in thousands):
Federal income tax benefit at statutory rate | $ | (890 | ) | |
State income taxes, net of federal tax benefit | 617 | |||
Manufacturer’s production deduction | (274 | ) | ||
Increase in uncertain tax positions, net | 944 | |||
Other | 139 | |||
| $ | 536 | |||
F-167
Table of Contents
Smithfield Beef Group, Inc.
Notes to consolidated financial statements
Deferred income taxes reflect the net tax effects of temporary differences between the carrying amounts of assets and liabilities for financial reporting purposes and the amounts for income tax reporting purposes. Significant components of the Company’s deferred income tax assets and liabilities as of April 27, 2008, are as follows (in thousands):
Deferred tax assets: | ||||
State net operating losses | $ | 9,486 | ||
Accrued liabilities | 9,124 | |||
Employee benefits | 865 | |||
Inventories | 514 | |||
Allowances | 924 | |||
Valuation allowance | (7,490 | ) | ||
Total deferred tax assets | 13,423 | |||
Deferred tax liabilities: | ||||
Property, plant and equipment | (19,621 | ) | ||
Investments | (4,878 | ) | ||
Intangible assets | (3,050 | ) | ||
Total deferred tax liabilities | (27,549 | ) | ||
Net deferred tax liabilities | $ | (14,126 | ) | |
Deferred tax assets and liabilities are recorded in the accompanying consolidated balance sheet as follows:
Current deferred tax assets | $ | 6,233 | ||
Noncurrent deferred tax liabilities | (20,359 | ) | ||
Total deferred tax assets | $ | (14,126 | ) | |
The Company had state net operating loss carryforwards of $189.7 million at April 27, 2008. A partial valuation allowance has been established against the state net operating loss carryforwards at April 27, 2008, as the Company does not believe it is more likely than not that the carryforward will be utilized in full prior to expiration. State net operating losses generally begin to expire 5 to 20 years after they are generated.
A reconciliation of the beginning and ending liability for uncertain tax positions is as follows (in thousands):
Balance as of April 30, 2007 | $ | 5,592 | ||
Additions for tax positions taken in the current year | 993 | |||
Additions for tax positions taken in prior years | 125 | |||
Settlements with taxing authorities | (2,310 | ) | ||
Lapse of statute of limitations | (174 | ) | ||
Balance as of April 27, 2008 | $ | 4,226 | ||
F-168
Table of Contents
Smithfield Beef Group, Inc.
Notes to consolidated financial statements
The Company operates in multiple taxing jurisdictions within the United States, and is subject to audits from various tax authorities. As of April 27, 2008, the liability for uncertain tax positions included $1.5 million of accrued interest and penalties. The Company recognized $0.5 million of interest expense in tax expense during fiscal 2008. As of April 27, 2008, the liability for uncertain tax positions included $3.7 million that, if recognized, would impact the effective tax rate.
9. Other accrued liabilities
Other accrued liabilities consist of the following at April 27, 2008 (in thousands):
Feed | $ | 12,108 | |
Self-insurance reserves | 3,000 | ||
Utilities | 2,898 | ||
Freight | 2,084 | ||
Customer programs | 1,120 | ||
Litigation-related matters | 935 | ||
Property taxes | 724 | ||
Legal and professional fees | 483 | ||
Other | 5,290 | ||
| $ | 28,642 | ||
10. Retirement plans
The Company sponsors three defined contribution plans, which cover the majority of full-time truck drivers, salaried and office personnel, and certain hourly plant employees under a multiple-employer plan administered by Smithfield Foods, Inc. Contributions under the plans are based on miles driven by certain truck drivers and on a percentage of salary or rate per hour for other personnel. Retirement benefits are based upon the amount allocated to each individual’s separate account and are fully funded. Total expense related to these plans were $1.5 million in fiscal 2008.
F-169
Table of Contents
Smithfield Beef Group, Inc.
Notes to consolidated financial statements
11. Commitments
The Company leases tractors, trailers, automobiles, railcars, buildings and equipment under operating lease agreements. Certain of the lease agreements contain renewal or purchase options as well as rental escalation clauses. The lessor assigned its rights under one of the building leases to Smithfield Foods, Inc. concurrent with the sale of Smithfield Beef Group. Future minimum rental payments for leases having initial or remaining noncancelable lease terms in excess of one year are presented below and reflect the assignment of the building lease to Smithfield Foods, Inc. (in thousands):
| Related-party | Third parties | Total | |||||||
Fiscal Year | |||||||||
2009 | $ | 780 | $ | 5,571 | $ | 6,351 | |||
2010 | 780 | 4,351 | 5,131 | ||||||
2011 | 780 | 3,946 | 4,726 | ||||||
2012 | 780 | 3,069 | 3,849 | ||||||
2013 | 780 | 2,116 | 2,896 | ||||||
Thereafter | 15,784 | 10,720 | 26,504 | ||||||
| $ | 19,684 | $ | 29,773 | $ | 49,457 | ||||
Total rental expense for operating leases was $10.2 million in fiscal 2008.
As of April 27, 2008, the Company had capital expenditure commitments of approximately $6.6 million. The Company also has purchase commitments with certain cattle producers that obligate the Company to purchase all of the cattle that these producers deliver. The Company has entered into commodity forward contracts that obligate the Company to purchase a fixed amount of cattle at fixed prices. As of April 27, 2008, the Company had $490.3 million of commodity forward contracts for the purchase of live cattle. As of April 27, 2008, the Company was also committed to purchase approximately $3.0 million of fixed forward corn contracts. The Company believes the risk of default or nonperformance on contracts with counterparties is not significant.
12. Related-party transactions
The Company has a trademark and license agreement with SF Investments, Inc. (a wholly owned subsidiary of Smithfield Foods, Inc.) for the right to use certain trademarks of Smithfield Foods, Inc. in connection with the sale of certain food products. The Company made royalty payments of $5.0 million during fiscal 2008 related to this agreement.
Through an informal agreement with its parent, Smithfield Foods, Inc., the Company was provided certain administrative services by Smithfield Foods, Inc. During fiscal 2008, the Company was charged $16.2 million under this arrangement.
F-170
Table of Contents
Smithfield Beef Group, Inc.
Notes to consolidated financial statements
13. Regulations and litigation
The Company is subject to various laws and regulations administered by federal, state and other government entities, including the Environmental Protection Agency (EPA) and corresponding state agencies, as well as the United States Department of Agriculture, the United States Food and Drug Administration, the United States Occupational Safety and Health Administration and similar agencies in foreign countries. The Company believes that it is in compliance with these laws and regulations in all material respects and that continued compliance with these laws and regulations will not have a material adverse effect on its financial position or results of operations or cash flows.
In February 2003, the EPA promulgated regulations under the Clean Water Act governing confined animal feeding operations (CAFOs). Among other things, these regulations impose obligations on CAFOs to manage animal waste in ways intended to reduce the impact on water quality. These new regulations were challenged in federal court by both industry and environmental groups. Although a 2005 decision by the court invalidated several provisions of the regulations, they remain largely intact.
From time to time and in the ordinary course of its business, the Company is named as a defendant in legal proceedings related to various issues, including worker’s compensation claims, tort claims and contractual disputes. While the resolution of such matters may have an impact on the Company’s financial results for the period in which they are resolved, the Company believes that the ultimate disposition of these matters will not, individually or in the aggregate, have a material adverse effect upon its business or consolidated financial statements.
F-171
Table of Contents
Report of independent registered public accounting firm
To the Board of Managers and Members of
Five Rivers Ranch Cattle Feeding LLC
Loveland, Colorado
We have audited the accompanying balance sheet of Five Rivers Ranch Cattle Feeding LLC (the “Company”) as of March 31, 2008, and the related statements of operations, members’ equity and comprehensive income (loss), and cash flows for the year then ended. These financial statements are the responsibility of the Company’s management. Our responsibility is to express an opinion on these financial statements based on our audit.
We conducted our audit in accordance with the standards of the Public Company Accounting Oversight Board (United States). Those standards require that we plan and perform the audit to obtain reasonable assurance about whether the financial statements are free of material misstatement. The Company is not required to have, nor were we engaged to perform, an audit of its internal control over financial reporting. Our audit included consideration of internal control over financial reporting as a basis for designing audit procedures that are appropriate in the circumstances, but not for the purpose of expressing an opinion on the effectiveness of the Company’s internal control over financial reporting. Accordingly, we express no such opinion. An audit also includes examining, on a test basis, evidence supporting the amounts and disclosures in the financial statements, assessing the accounting principles used and significant estimates made by management, as well as evaluating the overall financial statement presentation. We believe that our audit provides a reasonable basis for our opinion.
In our opinion, such financial statements present fairly, in all material respects, the financial position of the Company as of March 31, 2008, and the results of its operations and its cash flows for the year then ended, in conformity with accounting principles generally accepted in the United States of America.
/s/ Deloitte & Touche LLP
Denver, Colorado
May 30, 2008
F-172
Table of Contents
Five Rivers Ranch Cattle Feeding LLC
Balance sheet
as of March 31, 2008
(in thousands)
| 2008 | |||
Assets | |||
CURRENT ASSETS: | |||
Cash and cash equivalents | $ | 3 | |
Receivables | 13,667 | ||
Receivables—affiliates | 3,152 | ||
Inventory | 600,161 | ||
Advance deposits on cattle | 1,567 | ||
Derivative asset | 27,792 | ||
Prepaid expenses and other current assets | 903 | ||
Total current assets | 647,245 | ||
PROPERTY, PLANT, AND EQUIPMENT: | |||
Land and land improvements | 65,581 | ||
Buildings | 8,898 | ||
Machinery, equipment, and fixtures | 33,347 | ||
Capitalized software | 636 | ||
Construction-in-progress | 2,009 | ||
Total property, plant, and equipment | 110,471 | ||
Less accumulated depreciation | 22,132 | ||
Net property, plant, and equipment | 88,339 | ||
INTANGIBLE ASSETS | 12,144 | ||
OTHER ASSETS | 3,453 | ||
TOTAL | $ | 751,181 | |
Liabilities and Members’ Equity | |||
CURRENT LIABILITIES: | |||
Cash overdraft | $ | 11,171 | |
Borrowings on margin accounts | 10,012 | ||
Accounts payable | 9,156 | ||
Accrued liabilities | 5,197 | ||
Derivative liability | 5,406 | ||
Revolving line of credit | 395,300 | ||
Total current liabilities | 436,242 | ||
Deferred compensation | 170 | ||
Total liabilities | 436,412 | ||
COMMITMENTS AND CONTINGENCIES (Note 7) | |||
MEMBERS’ EQUITY: | |||
Members’ equity paid-in capital | 274,416 | ||
Accumulated other comprehensive income | 29,104 | ||
Retained earnings | 11,249 | ||
Total members’ equity | 314,769 | ||
TOTAL | $ | 751,181 | |
See notes to financial statements.
F-173
Table of Contents
Five Rivers Ranch Cattle Feeding LLC
Statement of operations
for the year ended March 31, 2008
(in thousands)
| 2008 | ||||
REVENUES: | ||||
Live cattle sales | $ | 1,537,178 | ||
Feedlot sales | 95,057 | |||
Other | 24,868 | |||
Total revenues | 1,657,103 | |||
COST AND EXPENSES: | ||||
Cost of sales | 1,578,635 | |||
General and administrative expenses | 15,179 | |||
Gain on disposal of assets | (83 | ) | ||
Total cost and expenses | 1,593,731 | |||
OPERATING INCOME | 63,372 | |||
OTHER (INCOME) EXPENSE: | ||||
Interest expense and other financing costs | 28,893 | |||
Interest and investment income | (1,095 | ) | ||
Loss on involuntary conversion of assets | 109 | |||
Other income | (190 | ) | ||
Gain on settlement | (1,802 | ) | ||
Total other expense—net | 25,915 | |||
NET INCOME | $ | 37,457 | ||
See notes to financial statements.
F-174
Table of Contents
Five Rivers Ranch Cattle Feeding LLC
Statement of members’ equity and comprehensive income (loss)
for the year ended March 31, 2008
(In thousands)
| Members’ Equity, Paid-In Capital | Comprehensive Income | Retained Earnings (Accumulated Deficit) | Accumulated Other Comprehensive Income (Loss) | Total | |||||||||||||
BALANCE—April 1, 2007 | $ | 274,416 | $ | (26,208 | ) | $ | (8,634 | ) | $ | 239,574 | |||||||
Comprehensive income: | |||||||||||||||||
Net income | $ | 37,457 | 37,457 | 37,457 | |||||||||||||
Other comprehensive income: | |||||||||||||||||
Net gain on cash flow hedges | 29,104 | ||||||||||||||||
Reclassification adjustment for losses included in net income | 8,634 | ||||||||||||||||
Other comprehensive income | 37,738 | 37,738 | 37,738 | ||||||||||||||
Comprehensive income | $ | 75,195 | |||||||||||||||
BALANCE—March 31, 2008 | $ | 274,416 | $ | 11,249 | $ | 29,104 | $ | 314,769 | |||||||||
See notes to financial statements.
F-175
Table of Contents
Five Rivers Ranch Cattle Feeding LLC
Statement of cash flows
For the year ended March 31, 2008
(in thousands)
| 2008 | ||||
CASH FLOWS FROM OPERATING ACTIVITIES: | ||||
Net income | $ | 37,457 | ||
Adjustments to reconcile net income to net cash used in operating activities: | ||||
Depreciation and amortization | 9,637 | |||
Gain on disposal of assets | (83 | ) | ||
Loss on involuntary conversion of assets | 109 | |||
Gain on involuntary conversion of assets | (1,200 | ) | ||
Equity in earnings of investee | (267 | ) | ||
Dividends received from investee | 375 | |||
Changes in operating assets and liabilities: | ||||
Cash overdraft | (3,192 | ) | ||
Inventory | (96,054 | ) | ||
Derivative instruments | 2,105 | |||
Receivables | (1,307 | ) | ||
Prepaid expenses and other assets | 19,973 | |||
Accounts payable, accrued liabilities, and deferred liabilities | 793 | |||
Net cash used in operating activities | (31,654 | ) | ||
CASH FLOWS FROM INVESTING ACTIVITIES: | ||||
Proceeds from sales of assets | 139 | |||
Insurance proceeds related to fixed assets | 1,200 | |||
Investment in unaffiliated company | (500 | ) | ||
Additions to property, plant, and equipment | (13,883 | ) | ||
Net cash used in investing activities | (13,044 | ) | ||
CASH FLOWS FROM FINANCING ACTIVITIES: | ||||
Net increase in revolving line of credit | 34,700 | |||
Equity contributions by Members | ||||
Net increase in borrowings on margin accounts with brokers | 10,012 | |||
Other | (17 | ) | ||
Net cash provided by financing activities | 44,695 | |||
NET DECREASE IN CASH AND CASH EQUIVALENTS | (3 | ) | ||
CASH AND CASH EQUIVALENTS—Beginning of period | 6 | |||
CASH AND CASH EQUIVALENTS—End of period | $ | 3 | ||
Cash paid during the period for interest | $ | 28,103 | ||
See notes to financial statements.
F-176
Table of Contents
Five Rivers Ranch Cattle Feeding LLC
Notes to financial statements
As of and for the year ended March 31, 2008
1. Nature of business
Business and Basis of Presentation—Five Rivers Ranch Cattle Feeding LLC (the “Company”) is a limited liability company organized on May 20, 2005, in the state of Delaware. Prior to May 20, 2005, the assets and liabilities of the Company were owned by ContiBeef LLC (“ContiBeef”), a wholly owned subsidiary of Continental Grain Company (“CGC”), and MF Cattle Feeding, Inc. (“MF”). ContiBeef is a wholly-owned subsidiary of Continental Grain Company, and MF is a wholly-owned subsidiary of Cattle Production Systems, Inc. (“CPS”), whose parent company is Smithfield Beef Group, Inc. (“Smithfield Beef”), which is a wholly-owned subsidiary of Smithfield Foods, Inc. On May 20, 2005, the operating assets and certain liabilities of ContiBeef and MF were transferred to the Company at net book value in exchange for equity interests in the Company. The Company is a 50/50 joint venture between ContiBeef and MF (the “Members”). The Members exercise joint control over the Company.
The Company is engaged in the raising of feeder cattle for the Company and for outside customers, and the sale of live cattle to meat packing companies (“packers”). The Company’s sales and cost of sales are significantly affected by market price fluctuations of its principal products sold and of its principal commodity inputs—feeder cattle and corn. Feedlot operations are located in Idaho, Texas, Colorado, Kansas, and Oklahoma.
The Company owns a 50% interest in Northern Colorado Feed, LLC, which is an unconsolidated subsidiary accounted for under the equity method. The contributed investment to Five Rivers was approximately $1 million, which is recorded within Other Assets in the balance sheets. The Company’s share of earnings in the investment for the year ended March 31, 2008 was approximately $267,000 and is recorded in interest and investment income in the statement of operations. During the year ended March 31, 2008, the Company received dividends of approximately $375,000.
During 2008 the Company began a strategic alliance with Southfork Solutions, Inc. (“Southfork”) which included the purchase of 500,000 shares of Southfork stock through a private placement. Southfork is in the process of developing animal identification technology in which Five Rivers’ locations are serving as test sites. This investment is accounted for under the cost method and carried a balance of $500,000 as of March 31, 2008 and is recorded within Other Assets in the balance sheet.
On March 5, 2008, Smithfield Foods, Inc. announced that it signed a definitive agreement to sell Smithfield Beef Group, Inc., including 100% of the ownership of Five Rivers, to JBS S.A. (“JBS”) Smithfield Foods and CGC entered into an agreement providing that, immediately before the closing of the JBS transaction, Smithfield Beef will acquire from CGC the 50% of Five Rivers that it does not presently own in return for 2.167 million shares of Smithfield common stock. Live cattle currently owned by Five Rivers will be transferred to a new 50/50 joint venture between Smithfield Foods and CGC. The excluded live cattle will be raised by JBS after closing for a negotiated fee and then sold at maturity at market-based prices. Proceeds from the sale of the excluded live cattle will be paid in cash to the Smithfield Foods/CGC joint venture.
F-177
Table of Contents
Five Rivers Ranch Cattle Feeding LLC
Notes to financial statements
2. Significant accounting policies
Revenue Recognition—The Company sells live cattle to packers located primarily in Colorado, Idaho, Nebraska, Kansas and Texas. Revenue is recognized when live cattle are shipped to customers, based on terms as set forth by The Packers and Stockyards Act of 1921. The Company records transactions based on lot by lot accounting, recognizing revenue as cattle are shipped or on delivery depending on the terms of the sale, and will adjust revenues to reflect the results of the grading process as reported to the Company by the packer. Risk of loss transfers to the packer upon shipment, unless the Company has hired the transporter for shipment, in which case risk of loss transfers at delivery. Hotel revenue charged to customers for cattle feeding and care is recognized on a daily basis and is recorded in feedlot sales in the statement of operations. Animal feed supplement sold to third parties is recognized when the product is delivered and is recorded in feedlot sales in the statement of operations.
Derivative Instruments—The Company enters into futures and option contracts for the purpose of hedging exposures to changes in commodity prices, primarily live cattle, feeder cattle, and corn. These contracts are accounted for as derivatives in accordance with Statement of Financial Accounting Standards (SFAS) No. 133,Accounting for Derivative Instruments and Hedging Activities, as amended. This statement requires the Company to record all derivatives on the balance sheet. The Company has reflected derivatives at fair value. Derivatives that are not accounted for as hedges must be adjusted to fair value through current earnings. For derivatives designated as cash flow hedges and used to hedge an anticipated transaction, changes in the fair value of the derivatives are deferred in the balance sheet in accumulated other comprehensive income (loss) to the extent the hedge is effective in mitigating the exposure to the related anticipated transaction. Any ineffectiveness associated with the hedge, along with gains and losses on derivatives not designated as hedges, are recognized immediately in the statement of operations within other revenues. Amounts deferred within accumulated other comprehensive income (loss) are recognized in the statement of operations within cost of sales upon the completion of the related hedged transaction.
Cash and Cash Equivalents—Cash equivalents are composed of all highly liquid investments with original maturities of three months or less. Book overdrafts are reclassified to current liabilities.
Margin Accounts—The Company maintains margin deposits with brokers as collateral on open positions in derivative instruments. These deposits are not included in the balance of cash and cash equivalents as the balances, when positive, are not able to be withdrawn by the Company at any time. When the Company’s derivative positions are in an asset position the Company is allowed to borrow against the margin accounts. As of March 31, 2008 the Company had net borrowings on margin accounts with brokers.
Inventories—Live cattle inventories and inventories of feed, silage, processing supplies, and medication are stated at the lower of cost (first-in, first-out) or market.
Property, Plant, and Equipment—Property, plant, and equipment are stated at cost. Depreciation of property, plant, and equipment is provided by the straight-line method over the estimated useful lives of 25 years for farm buildings, 10 to 30 years for land improvements and buildings,
F-178
Table of Contents
Five Rivers Ranch Cattle Feeding LLC
Notes to financial statements
and 2 to 12 years for machinery, equipment, furniture, and purchased software. Expenditures for maintenance and repairs are charged to expense as incurred. Depreciation expense for the year ended March 31, 2008 was $8.7 million.
Intangible Assets—The Company has recorded intangible assets in the form of water rights with indefinite lives at the Kuner and Gilcrest feedlots which were contributed to the Company by MF. This intangible asset is recorded at its carryover basis of $12.1 million. The Company’s annual impairment testing date coincides with its fiscal year-end. If an assessment indicates impairment, the impaired asset is written down to its fair value based on the best information available in accordance with SFAS 142,Goodwill and Other Intangible Assets. There were no impairments recorded for the year ended March 31, 2008.
Debt Issuance Costs—Debt issuance costs of $4.5 million are capitalized and are being amortized over the terms of the related loan agreements using the straight-line method. Accumulated amortization of the debt issuance costs was approximately $2.7 million at March 31, 2008.
Impairment of Long-Lived Assets—The Company continually evaluates the carrying value of its long-lived assets for events or changes in circumstances which may indicate that the carrying value may not be recoverable in accordance with SFAS 144,Accounting for the Impairment or Disposal of Long-Lived Assets.
Income Taxes—The Company is treated as a flow-through entity for income tax purposes and, therefore, the Company’s taxable income is included in the Members’ respective consolidated U.S. federal income tax returns. The Company is not allocated any current or deferred U.S. federal income expense (benefit) arising from the Company’s operations included in the Members’ results.
Self-Insurance Accruals—The Company is self-insured for expected losses under its workers compensation and automobile liability programs. Reserves recorded for workers compensation and automobile liability claims were $1,038,000 at March 31, 2008 based upon estimates of the ultimate costs to settle incurred claims, both reported and unreported.
Accounting Estimates—The preparation of financial statements in conformity with accounting principles generally accepted in the United States of America requires management to make estimates and assumptions that affect the reported amounts of assets and liabilities and disclosures of contingent assets and liabilities at the date of the financial statements and the reported amounts of revenues and expenses during the reporting period. Actual results could differ from those estimates.
Recent Accounting Pronouncements—In September, 2006, the Financial Accounting Standards Board (“FASB”) issued SFAS No. 157,Fair Value Measurements.This Statement defines fair value, establishes a framework for measuring fair value in generally accepted accounting principles (“GAAP”), and expands disclosures about fair value measurements. In developing this standard, the FASB considered the need for increased consistency and comparability in fair value measurements and for expanded disclosures about fair value measurements. The definition of fair value is the price that would be received to sell an asset or paid to transfer a liability in an
F-179
Table of Contents
Five Rivers Ranch Cattle Feeding LLC
Notes to financial statements
orderly transaction between market participants at the measurement date (exit price.) The emphasis on fair value is that it is a market-based measurement, and the statement clarifies that market participant assumptions include assumptions about risk, therefore, a measurement that does not include an adjustment for risk would not represent a fair value measurement if market participants would include one in pricing the related asset or liability. The guidance in this statement applies to derivatives and other financial instruments measured at fair value under Statement 133 at initial recognition and in all subsequent periods. This Statement is effective for financial statements issued for fiscal years beginning after November 15, 2007, and interim periods within those fiscal years. FASB Staff Position No. FAS 157-2,Effective Date of FASB Statement No. 157, issued in February 2008, defers the effective date of SFAS No. 157 for one year for certain nonfinancial assets and nonfinancial liabilities measured at fair value, except those that are recognized or disclosed at fair value in the financial statements on a regular basis. The Company is currently evaluating the effect that these Statements will have on the Company’s financial statements.
In February 2007 the FASB issued SFAS No. 159,The Fair Value Option for Financial Assets and Financial Liabilities. This Statement permits entities to choose to measure many financial instruments and certain other items at fair value with the associated unrealized gain/loss in earnings. The objective is to improve financial reporting by providing entities with the opportunity to mitigate volatility in reported earnings caused by measuring related financial assets and liabilities differently without having to apply complex hedge accounting provisions. This Statement is effective as of the beginning of an entity’s first fiscal year that begins after November 15, 2007. The Company is currently evaluating the effect that this Statement will have on the Company’s financial statements.
In March 2008, the FASB issued Statement No. 161,Disclosure about Derivative Instruments and Hedging Activities—an amendment to FASB Statement No. 133 (“SFAS 161”). The adoption of SFAS 161 is not expected to have an impact on the Company’s consolidated financial statements, other than additional disclosures. SFAS 161 expands annual disclosures about derivative and hedging activities that are intended to better convey the purpose of derivative use and the risks managed. SFAS 161 is effective for fiscal years and interim periods beginning after November 15, 2008.
In December 2007, the FASB issued Statement No. 160,Noncontrolling Interests in Consolidated Financial Statements—an amendment of ARB No. 51 (“SFAS 160”). As the Company owns 100% of its consolidated subsidiaries and it does not currently have any minority interests, the Company does not expect the adoption of SFAS 160 to have an impact on its consolidated financial statements. This statement amends ARB No. 51 and intends to improve the relevance, comparability, and transparency of the financial information that a reporting entity provides in its consolidated financial statements by establishing accounting and reporting standards of the portion of equity in a subsidiary not attributable, directly or indirectly, to a parent. SFAS 160 is effective for fiscal years beginning on or after December 15, 2008.
In December 2007, the FASB issued Statement No. 141R,Business Combinations (“SFAS 141R”). SFAS 141R may have an impact on the Company’s consolidated financial statements when
F-180
Table of Contents
Five Rivers Ranch Cattle Feeding LLC
Notes to financial statements
effective, but the nature and magnitude of the specific effects will depend upon the nature, terms and size of the acquisitions the Company consummates after the effective date. SFAS 141R establishes principles and requirements for how the acquirer of a business recognizes and measures in its financial statements the identifiable assets acquired, the liabilities assumed, and any noncontrolling interest in the acquiree. The statement also provides guidance for recognizing and measuring the goodwill acquired in business combinations and determines what information to disclose to enable users of the financial statement to evaluate the nature and financial effects of the business combination. SFAS 141R is effective for financial statements issued for fiscal years beginning after December 15, 2008.
In June 2006, the FASB issued FASB Interpretation No. 48 (FIN 48),Accounting for Uncertainty in Income Taxes. FIN 48 clarifies the accounting for uncertainty in income taxes recognized in an enterprise’s financial statements in accordance with FASB Statement No. 109,Accounting for Income Taxes. FIN 48 requires the evaluation of tax positions taken by the Company to determine whether it is “more-likely-than-not” that those tax positions will be ultimately sustained. A tax liability and expense must be recorded in respect of any tax position that, in Management’s judgment, will not be fully realized. In February 2008 the FASB issued FASB Staff Position No. FIN 48-2 which deferred the effective date for certain non-public enterprises to fiscal years beginning after December 31, 2007. The Company has evaluated the implications of FIN 48 and does not currently anticipate any impact to the Company’s financial statements. The Company will continue to monitor the Company’s tax positions prospectively for potential future impacts
3. Receivables
Receivables at March 31, 2008 were as follows (in thousands):
| 2008 | |||
Trade | $ | 13,584 | |
Affiliates | 3,152 | ||
Employee advances | 82 | ||
Other | 1 | ||
Total receivables | $ | 16,819 | |
4. Inventory
Inventory balances at March 31, 2008 were as follows (in thousands):
| 2008 | |||
Livestock | $ | 574,082 | |
Silage | 13,657 | ||
Feed | 10,356 | ||
Medication and other | 2,066 | ||
Total inventory | $ | 600,161 | |
F-181
Table of Contents
Five Rivers Ranch Cattle Feeding LLC
Notes to financial statements
5. Accrued liabilities
Accrued liabilities at March 31, 2008 were as follows (in thousands):
| 2008 | |||
Employee compensation, bonus, and benefits | $ | 2,820 | |
Reserve for workers compensation and automobile liability insurance | 1,038 | ||
Interest | 286 | ||
Other | 1,053 | ||
Total | $ | 5,197 | |
6. Debt
On May 20, 2005, the Company entered into a $550 million revolving credit agreement (the “facility”) with a maturity date of May 20, 2010. During April 2006, the line of credit was reduced by $25 million as provided for in the credit agreement. At March 31, 2008, the Company was utilizing $395.3 million of the facility, and had an outstanding letter of credit of $1.5 million leaving $128.2 million in unused line of credit with $116.8 million available to be borrowed by the Company according to the terms of the credit agreement. Borrowings under the facility bear interest at variable rates based on LIBOR (4.45% at March 31, 2008). The Company’s policy is to pay down the outstanding principal balance of the line of credit and to borrow additional amounts to finance working capital requirements. Accordingly, the Company classifies the debt as a current liability in the balance sheet. The credit agreement is collateralized by certain fixed assets, accounts receivable and inventories of the Company. Among other requirements, the Facility requires the Company to maintain certain financial ratios, minimum levels of net worth, and establish limitations on certain types of payments, including dividends, investments, and capital expenditures. The Company is in compliance with all covenants.
7. Commitments and contingencies
Operating Leases—The Company utilizes buildings and equipment which are leased under operating lease agreements, extending through March 2013. The following is a schedule of the future minimum obligations under the operating leases that have initial or remaining non-cancelable lease terms in excess of one year at March 31, 2008 (in thousands):
| Years Ending March 31 | |||
2009 | $ | 325 | |
2010 | 261 | ||
2011 | 211 | ||
2012 | 211 | ||
2013 | 189 | ||
Thereafter | 142 | ||
Total | $ | 1,339 | |
F-182
Table of Contents
Five Rivers Ranch Cattle Feeding LLC
Notes to financial statements
Rent expense under all operating leases was approximately $1.4 million for the year ended March 31, 2008. The initial term of the Loveland office lease is seven years with one five-year extension. There is also a separate lease for 2,254 square feet of adjoining office space that is currently being occupied by Five Star Cattle Systems, a MF subsidiary. The lease allows for 3% annual escalations, and includes the tenant’s pro rata share of operating expenses.
Legal Matters—As of March 31, 2008 there were no pending legal matters against the Company, however, the Company is a party to a proceeding currently pending with the Colorado Ground Water Commission (“GWC”) in which Pioneer Irrigation District and others have requested a modification of the boundaries of a designated ground water basin in which the Yuma feedyard of the Company is located. This case is scheduled for a three-week hearing in front of the GWC’s hearing office beginning on June 2, 2008. If the petitioners fully prevail the Company would be required to supply water to the North Fork to replace the withdrawals of ground water from wells serving the Yuma feedyard, or cease withdrawals from those wells. Replacement water would have to be secured. It is not possible to estimate the amount of potential loss at this time.
Loss on Involuntary Conversion of Assets—During February 2008, the Company wrote off a loader that was destroyed by fire at the Grant County Feedyard. An involuntary conversion loss of approximately $109,000 was recognized.
During March 2007, the Company wrote off a retention pond after routine inspections revealed active seeps on three of the four embankments. A loss of approximately $434,000 was recognized and the engineering firm and all parties relevant to the construction of the pond were notified that we intend to build a new pond and hold them responsible for the costs. On April 22, 2008, the Company filed a complaint in the United States District Court for the District of Kansas against KLA Environmental Services, Inc. and Stoppel Dirt, Inc. seeking damages.
8. Related party transactions
On May 20, 2005, the Company entered into the Conti Services Agreement whereby the Company would be provided certain services by ContiGroup Companies, Inc. for $1 million annually. Expenses for the year ended March 31, 2008 were $450,000. The Company also feeds cattle for CPS. At March 31, 2008 approximately 37,000 head were on feed for CPS. There was an outstanding receivable due the Company from CPS of $2.9 million at March 31, 2008, and revenue recognized during the year ended March 31, 2008 was $59.3 million. The Company permits employees and their relatives to enter into feeding agreements at the individual feedyards, with the consent of the feedyard General Managers and with Executive Management approval. For the year ended March 31, 2008 this activity totaled $1.5 million.
9. Significant customers
Outside customers accounted for approximately 10% of the total cattle on feed at the Company’s feedyards, at March 31, 2008. CPS was the largest single customer accounting for the majority of customer cattle on feed at March 31, 2008. Company cattle are committed under marketing
F-183
Table of Contents
Five Rivers Ranch Cattle Feeding LLC
Notes to financial statements
agreements to Swift and Company, Cargill Meat Solutions Corporation, and National Beef. During the year ended March 31, 2008, approximately 54% of company cattle were sold to Swift, 14% to Cargill, and 32% to National Beef.
10. Employee benefit plans
Defined Contribution Plans—Effective April 2006, the Company sponsored a defined contribution plan (401(k) Plan), administered by Vanguard. All employees may participate by contributing a portion of their annual earnings to the plan. The Company’s contributions are based on each participant’s level of contribution and cannot exceed the maximum allowable for tax purposes. Total contributions were approximately $571,000 for the year ended March 31, 2008.
Deferred Compensation Plans—The Company granted certain key members of Five Rivers’ management team participation in the Five Rivers Long-Term Incentive Plans, which covers the three years ending March 31, 2008, 2009 and 2010 (the 2008 Plan) and the three years ending March 31, 2007, 2008 and 2009 (the 2007 Plan). The performance measure for the plan is return on net assets (RONA), with a hurdle rate of 9% RONA and a target rate of 12.0% RONA. There is no cap for the bonus pool, but vesting occurs at a rate of 33.3% at the end of each fiscal year. The targets were not met for the 2007 plan, but the 2008 target was met, and there is an accrual of approximately $170,000 in long-term liabilities for this plan.
11. Derivative instruments and hedging activity
The Company is exposed to market risk, such as changes in commodity prices for its main raw materials—feeder cattle and corn, and its finished product—live cattle. The Company’s exposure to commodity price risk relates to raw material and finished product price fluctuations caused by supply conditions, weather, economic conditions, and other factors. To manage volatility associated with these exposures, the Company may enter into derivative transactions pursuant to established Company policies. Generally, the Company utilizes commodity futures and option contracts to reduce the volatility of commodity input prices on corn and feeder cattle and commodity prices on live cattle. Options are used to economically hedge a portion of the market risk, even though the Company has elected not to designate these positions as accounting hedges. The Company enters into futures and options transactions with established brokers.
The Company considers its use of derivative instruments to be an economic hedge against changing prices. At March 31, 2008 all open derivative contracts were recorded at fair value in accordance with SFAS No. 133. These contracts are recorded within current assets when the unrealized value is a gain and within current liabilities when the unrealized value is a loss. The Company designates contracts for the future purchase or sale of certain commodities as normal purchase normal sales and thus these contracts are not marked-to-market. The Company formally documents all relationships between hedging instruments and hedged items, as well as its risk management objectives and strategies for undertaking the hedge transactions. The Company links all hedges to forecasted transactions and assesses whether the derivatives that are used in hedging transactions are highly effective in offsetting changes in cash flows of hedged items, both at the inception of the hedge and on an ongoing basis.
F-184
Table of Contents
Five Rivers Ranch Cattle Feeding LLC
Notes to financial statements
Trading Activities—During 2008 the Company had the following derivative activities, which while economic hedges, were not accounted for as hedges and whose gains or losses are reflected in “Other revenues” on the Statement of Operations:
| • | Corn Purchases—As of March 31, 2008 the Company had open derivative contracts on 3.605 million bushels of corn to hedge or unwind pricing on future purchases at various feedyards. At March 31, 2008 these positions had a net unrealized loss of approximately $195,000. During the year ended March 31, 2008, the Company recorded $1.6 million in realized gains on these positions. |
| • | Feeder Cattle Purchases—As of March 31, 2008 the Company had open derivative contracts on 8.5 million pounds of feeder cattle to hedge purchases at various feedyards. At March 31, 2008 these positions carried an unrealized net gain of $168,000. During the year ended March 31, 2008 realized losses were approximately $295,000. |
| • | Live Cattle Sales—As of March 31, 2008 the Company had open derivative contracts on 230.92 million pounds of live cattle to hedge future sales at various feedyards. At March 31, 2008 these positions had net unrealized losses of approximately $4.8 million. During the year ended March 31, 2008, the Company recorded $14.9 million in realized gains on these positions. |
| • | Natural Gas Purchases—During the year ended March 31, 2008 there were no hedging activities relating to natural gas. |
| • | Soybean Meal Purchases—As of March 31, 2008 the Company had no open derivative contracts on soybean meal. Realized gains and losses during 2008 were immaterial. |
Hedging Activities—During the year ended March 31, 2008 the Company had the following derivatives which were appropriately designated and accounted for as hedges:
| • | Feeder Cattle Purchases—As of March 31, 2008, the Company had no open derivative contracts of feeder cattle. During the year ended March 31, 2008, the Company realized $1.9 million in losses on feeder cattle hedges. Of this, $2.0 million of losses have been recorded in cost of sales, and approximately $95,000 of gains have been recorded in other revenues due to ineffectiveness on these hedges. |
| • | Live Cattle Sales—As of March 31, 2008, the Company had open derivative contracts on 542.5 million pounds of live cattle to hedge future sales at various feedyards which are being accounted for as a cash flow hedge. These positions had an unrealized gain of $27.2 million which was recorded in AOCI. During the year ended March 31, 2008, the Company realized $37.4 million in gains on live cattle hedges. Of this, $1.9 million of gains are deferred in AOCI at year end, $29.1 million of gains have been recorded in cost of sales, and $6.4 million of gains have been recorded in other revenues due to ineffectiveness on these hedges. |
At March 31, 2008 there was $29.1 million recorded within accumulated other comprehensive income for deferred hedging gains to be recognized in fiscal year 2009. These gains will be
F-185
Table of Contents
Five Rivers Ranch Cattle Feeding LLC
Notes to financial statements
recorded as either effective or ineffective hedges as live cattle are marketed. The maximum length of time that the Company hedges its exposure to the variability in future cash flows is approximately 12 months.
12. Fair value of financial instruments
The fair value of the Company’s debt approximates market value as its line of credit bears interest at floating market rates based on LIBOR. Open derivative contracts are marked to market on a daily basis and are recorded in the balance sheet. For cash and cash equivalents, trade receivables, and accounts payable, the carrying amount is a reasonable estimate of fair value due to their term to maturity.
13. Gilcrest fire
On February 9, 2006, a fire occurred in the generator room which connects to the Motor Control Center for the Gilcrest Feedlot feed mill, which the Company has accounted for as an involuntary conversion. At March 31, 2007, approximately $1.2 million had been spent to replace and repair the capital assets destroyed by the fire, and the Company had received $500,000 in insurance proceeds. It is expected that the cost of all property damage will be recovered, less the $100,000 deductible. During 2007, an additional $1.0 million was spent for cleanup and to return the mill to operating capacity, including the costs of generator rental, fuel, installing new wiring, and hauling feed from the Kuner Feedlot. During 2008 the Company received a final settlement of $2.0 million in insurance proceeds.
* * * * * *
F-186
Table of Contents
Condensed consolidated balance sheet
(Unaudited)
July 27, 2008
(dollars in thousands)
| Assets | |||
Current assets: | |||
Cash | $ 99 | ||
Accounts receivable, less allowances of $2,139 | 117,836 | ||
Inventories | 202,412 | ||
Deferred income taxes | 6,233 | ||
Prepaid expenses and other current assets | 10,079 | ||
Total current assets | 336,659 | ||
Property, plant, and equipment, net | 142,889 | ||
Investment in Five Rivers Ranch Cattle Feeding LLC | 155,469 | ||
Investment in other joint ventures | 1,186 | ||
Goodwill | 115,921 | ||
Intangible assets | 4,227 | ||
Other assets | 5,948 | ||
| $762,299 | |||
Liabilities and stockholder’s equity | |||
Current liabilities: | |||
Accounts payable | $63,172 | ||
Accrued payroll and benefits | 20,390 | ||
Other accrued liabilities | 41,986 | ||
Current portion of long-term debt due third parties | 1,009 | ||
Total current liabilities | 126,557 | ||
Long-term debt due Smithfield Foods, Inc. | 456,649 | ||
Long-term debt due third parties | 734 | ||
Deferred income taxes | 20,359 | ||
Other long-term liabilities | 21,198 | ||
Commitments and contingencies | |||
Stockholder’s equity: | |||
Class A Common stock, $.01 par value, 15,000 shares authorized, 1,000 shares issued and outstanding | — | ||
Additional paid-in capital | 242,640 | ||
Accumulated deficit | (103,800 | ) | |
Accumulated other comprehensive loss | (2,038 | ) | |
Total stockholder’s equity | 136,802 | ||
| $762,299 | |||
See accompanying notes.
F-187
Table of Contents
Condensed consolidated statements of operations
(unaudited)
July 27, 2008
(dollars in thousands)
| Quarter ended | ||||||||
| July 27, 2008 | July 29, 2007 | |||||||
Net sales | $ | 819,717 | $ | 754,733 | ||||
Cost of sales | 763,734 | 735,259 | ||||||
Gross profit | 55,983 | 19,474 | ||||||
Operating costs and expenses: | ||||||||
Selling, general and administrative expenses | 20,165 | 15,387 | ||||||
Corporate service fees from Smithfield Foods, Inc. | 4,531 | 3,111 | ||||||
Royalty fees to Smithfield Foods, Inc. | 1,639 | 1,269 | ||||||
Total operating cost and expenses | 26,335 | 19,767 | ||||||
Income (loss) from operations | 29,648 | (293 | ) | |||||
Other income (expense): | ||||||||
Interest income | 89 | 206 | ||||||
Interest expense: | ||||||||
Smithfield Foods, Inc. | (9,784 | ) | (10,408 | ) | ||||
Third parties | (88 | ) | (206 | ) | ||||
Equity in income (loss) of Five Rivers Ranch Cattle Feeding LLC | (2,417 | ) | 5,031 | |||||
Equity in income of other joint ventures | 130 | 396 | ||||||
Income (loss) before income taxes | 17,578 | (5,274 | ) | |||||
Provision (benefit) for income taxes | 6,340 | (1,970 | ) | |||||
Net income (loss) | $ | 11,238 | $ | (3,304 | ) | |||
See accompanying notes.
F-188
Table of Contents
Condensed consolidated statements of cash flows
(unaudited)
July 27, 2008
(dollars in thousands)
| Quarter ended | ||||||||
| July 27, 2008 | July 29, 2007 | |||||||
Operating activities | ||||||||
Net income (loss) | $ | 11,238 | $ | (3,304 | ) | |||
Adjustment to reconcile net loss to net cash provided by (used in) operating activities: | ||||||||
Depreciation and amortization | 4,578 | 4,536 | ||||||
Gain on sale of equipment | — | (4 | ) | |||||
Equity in (income) loss of Five Rivers Ranch Cattle Feeding, LLC | 2,417 | (5,031 | ) | |||||
Equity in income of other joint ventures | (130 | ) | (396 | ) | ||||
Changes in operating assets and liabilities: | ||||||||
Accounts receivable | (7,082 | ) | (11,773 | ) | ||||
Inventories | 32,523 | 49,113 | ||||||
Prepaid expenses and other current assets | 235 | 1,650 | ||||||
Accounts payable | (6,879 | ) | (8,063 | ) | ||||
Accrued liabilities | 14,073 | 10,881 | ||||||
Other noncurrent assets and liabilities | (203 | ) | 40 | |||||
Cash provided by operating activities | 50,770 | 37,649 | ||||||
Investing activities | ||||||||
Additions to property, plant and equipment | (3,601 | ) | (2,992 | ) | ||||
Proceeds from sale of property, plant and equipment | — | 90 | ||||||
Other | 206 | 13 | ||||||
Cash used in investing activities | (3,395 | ) | (2,889 | ) | ||||
Financing activities | ||||||||
Net payments under debt agreement with Smithfield Foods, Inc. | (47,092 | ) | (36,231 | ) | ||||
Payments on debt due third parties | (240 | ) | (215 | ) | ||||
Cash used in financing activities | (47,332 | ) | (36,446 | ) | ||||
Increase (decrease) in cash | 43 | (1,686 | ) | |||||
Cash at beginning of period | 56 | 5,000 | ||||||
Cash at end of period | $ | 99 | $ | 3,314 | ||||
Supplemental disclosures of cash flow information | ||||||||
Cash paid for interest to third parties | $ | 46 | $ | 70 | ||||
See accompanying notes.
F-189
Table of Contents
Notes to condensed consolidated financial statements
(Unaudited)
July 27, 2008
1. Description of the business
Basis of presentation
Smithfield Beef Group, Inc. (the Company or Smithfield Beef Group) now known as JBS Packerland, Inc., processes, prepares, packages and delivers fresh, further-processed and value-added beef products for sale to customers in the United States and international markets from four beef processing facilities. Smithfield Beef Group sells beef products to customers in the foodservice, international, further processor and retail distribution channels. Smithfield Beef Group also produces and sells by-products that are derived from its beef processing operations and variety meats to customers in various industries.
Sale of the company
On October 23, 2008, Smithfield Foods, Inc., (the owner of Smithfield Beef Group prior to this date) completed the sale of Smithfield Beef Group, to a wholly-owned subsidiary of JBS S.A., a company organized and existing under the laws of Brazil, for $565 million, net of postclosing adjustments. The sale included 100% of Five Rivers Ranch Cattle Feeding LLC (Five Rivers), a 50/50 joint venture with Continental Grain Company (CGC).
The unaudited condensed consolidated financial statements of the Company included herein have been prepared in accordance with accounting principles generally accepted in the United States for interim financial information and pursuant to the rules and regulations of the Securities and Exchange Commission. Certain information and footnote disclosures normally included in financial statements prepared in accordance with accounting principles generally accepted in the United States have been condensed or omitted pursuant to such rules and regulation, although the Company believes that the disclosures are adequate to make the information presented not misleading. In the opinion of management, the condensed consolidated financial statements include all adjustments (consisting only of normal recurring adjustments) necessary for a fair statement of the results of operations for the interim periods. It is suggested that these condensed consolidated financial statements be read in conjunction with the audited consolidated financial statements of the Company, including the notes thereto for the year ended April 27, 2008, included elsewhere in this filing. The Company’s financial information included herein is not necessarily indicative of the financial position, results of operations and cash flows of the Company that may be expected in the future.
Principles of consolidation
The condensed consolidated financial statements include all wholly-owned subsidiaries. The Company’s investments in Five Rivers, Five Star Cattle Solutions, LLC and Mountain View Rendering Co. LLC are accounted for under the equity method. The Company has a 50% ownership in each of these entities. All intercompany transactions and balances have been eliminated.
F-190
Table of Contents
Smithfield Beef Group, Inc.
Notes to condensed consolidated financial statements
The Company’s fiscal year consists of 52 or 53 weeks, ending on the Sunday nearest April 30th. The quarters ended July 27, 2008 and July 29, 2007, each consisted of 13 weeks.
2. Other comprehensive loss
Other comprehensive loss includes the net income or loss of the Company plus the Company’s proportionate share of the fair value of derivative financial instruments entered into by Five Rivers, which are accounted for under hedge accounting. Other comprehensive income (loss) totaled $11.6 million and $(10.6) million for the quarters ended at July 27, 2008 and July 29, 2007, respectively.
3. Inventories
The components of inventories at July 27, 2008, net of reserves of $1.4 million, are as follows (in thousands):
Live cattle | $ | 106,751 | |
Product inventories: | |||
Fresh and packaged meats | 62,935 | ||
Carcass inventory | 14,679 | ||
Manufacturing supplies | 14,728 | ||
Other | 3,319 | ||
| $ | 202,412 | ||
The sale of the Smithfield Beef Group as discussed in Note 1, excluded substantially all live cattle inventories held by the Company and Five Rivers as of the transaction date. Live cattle owned by Five Rivers on the transaction date were transferred to a new 50/50 joint venture between Smithfield Foods, Inc. and CGC, while live cattle owned by Smithfield Beef Group on the transaction date were transferred to a subsidiary of Smithfield Foods, Inc. The excluded live cattle will be raised by JBS Packerland, Inc. for a negotiated fee and then sold at maturity at market-based prices. Proceeds from the sale of the excluded live cattle will be paid in cash to the Smithfield Foods, Inc./CGC joint venture or to Smithfield Foods, Inc., as appropriate. The live cattle inventories are expected to be sold within six months after the transaction date, with substantially all live cattle sold within 12 months after the transaction date.
F-191
Table of Contents
Smithfield Beef Group, Inc.
Notes to condensed consolidated financial statements
4. Property, plant and equipment, net
Property, plant and equipment, net consist of the following at July 27, 2008 (in thousands):
Land | $ 13,946 | ||
Buildings and improvements | 72,725 | ||
Machinery and equipment | 146,400 | ||
Automobiles and trucks | 5,784 | ||
Furniture and fixtures | 3,581 | ||
Computer hardware | 2,835 | ||
Leasehold improvements | 176 | ||
Construction in progress | 15,796 | ||
| 261,243 | |||
Accumulated depreciation | (118,354 | ) | |
| $ 142,889 | |||
The sale of the Smithfield Beef Group, as discussed in Note 1, excluded certain land and land improvements that totaled $9.6 million at July 27, 2008.
5. Investment in Five Rivers
In fiscal 2006, Smithfield Beef Group and CGC formed Five Rivers, a 50/50 joint venture. Five Rivers is a stand-alone operating company, independent from the Company and CGC, currently headquartered in Greeley, Colorado, with a total of ten feedlots located in Colorado, Idaho, Kansas, Oklahoma and Texas. Five Rivers sells cattle to multiple U.S. beef packing firms using a variety of marketing methods. Five Rivers has a fiscal year ended March 31 and fiscal quarters ended June 30, September 30, and December 31.
Five Rivers meets the definition of a significant subsidiary (per Regulation S-X) with respect to the Company. Condensed statements of operations for Five Rivers are presented below:
| Quarter Ended | |||||
| June 30, 2008 | June 30, 2007 | ||||
Net sales | $363,688 | $304,100 | |||
Cost and expenses | 380,263 | 288,339 | |||
Operating income (loss) | (16,575 | ) | 15,761 | ||
Net income (loss) | (20,933 | ) | 9,479 | ||
F-192
Table of Contents
Smithfield Beef Group, Inc.
Notes to condensed consolidated financial statements
6. Other assets
Other assets consists of the following at July 27, 2008 (in thousands):
Other assets: | ||
Aircraft | $2,032 | |
Deposit | 725 | |
Tax benefit related to uncertain tax positions | 2,156 | |
Computer software | 285 | |
Other noncurrent assets | 750 | |
| $5,948 | ||
7. Long-term debt
Long-term debt consists of the following at July 27, 2008 (in thousands):
Long-term debt due Smithfield Foods Inc.: | |||
Debt due Smithfield Foods, Inc. | $ | 257,224 | |
Term notes due SFFC, Inc. | 199,425 | ||
| $ | 456,649 | ||
Other long-term debt due third parties: | |||
Note payable | $ | 751 | |
Other | 992 | ||
| 1,743 | |||
Less current portion | 1,009 | ||
| $ | 734 | ||
The Company had a lending arrangement with Smithfield Foods, Inc. under which Smithfield Foods, Inc. finances the working capital needs of the Company. Amounts outstanding under the facility bore interest at rates ranging between 4.2% and 7% as of July 27, 2008. The lending arrangement did not have a stated maturity date nor did it contain any financial covenants. The debt with Smithfield Foods, Inc. has been classified as long term based on the intent of Smithfield Foods, Inc. for these amounts not to be repaid in the next fiscal year.
On January 1, 2007, the Company entered into a series of term notes with SFFC, Inc. (a wholly owned subsidiary of Smithfield Foods, Inc.) totaling $199.4 million. The term notes bear interest at 7.75% and are due December 31, 2016. The term notes do not contain any financial covenants.
In connection with the purchase of Murco Inc., now known as JBS Plainwell, Inc., the Company issued a note payable (Note) to the former owner for $13.3 million. Principal and interest payments under the Note are due weekly, decreasing from $30,000 to $20,000 over the life of the Note. As the Note does not bear interest, the Company discounted the estimated future cash flows under the Note and adjusted the carrying value of the Note to $8.2 million at the purchase date, which approximated the fair value of the Note. The effective interest rate on the Note is 10% and the Note matures May 12, 2009.
F-193
Table of Contents
Smithfield Beef Group, Inc.
Notes to condensed consolidated financial statements
8. Income taxes
The provision (benefit) for income taxes for the fiscal quarters ended July 27, 2008 and July 29, 2007, are based on an estimated income tax rate for the respective full fiscal year. The estimated annual effective income tax rate is determined excluding the effect of significant unusual items or items that are reported net of their related tax effects. The tax effect of significant unusual items is reflected in the period in which they occur.
A reconciliation of the beginning and ending liability for uncertain tax positions is as follows (in thousands):
Balance as of April 28, 2008 | $ | 4,226 | |
Additions for tax positions taken in prior years | 124 | ||
Balance as of July 27, 2008 | $ | 4,350 | |
The Company operates in multiple taxing jurisdictions within the United States, and is subject to audits from various tax authorities. As of July 27, 2008, the liability for uncertain tax positions included $1.5 million of accrued interest. The Company recognized $49,000 and $66,000 of interest expense in tax expense during the quarters ended July 27, 2008 and July 29, 2007, respectively. As of July 27, 2008, the liability for uncertain tax positions included $3.7 million that, if recognized, would impact the effective tax rate.
9. Other accrued liabilities
Other accrued liabilities consist of the following at July 27, 2008 (in thousands):
Feed | $11,520 | |
Derivative financial instruments | 10,829 | |
Self-insurance reserves | 3,000 | |
Utilities | 2,739 | |
Freight | 2,434 | |
Customer programs | 1,220 | |
Litigation-related matters | 1,535 | |
Property taxes | 1,123 | |
Legal and professional fees | 623 | |
Other | 6,963 | |
| $41,986 | ||
10. Related-party transactions
The Company has a trademark and license agreement with SF Investments, Inc. (a wholly owned subsidiary of Smithfield Foods, Inc.) for the right to use certain trademarks of Smithfield Foods, Inc. in connection with the sale of certain food products. The Company made royalty payments related to this agreement of $1.6 million and $1.3 million during the quarters ended July 27, 2008 and July 29, 2007, respectively.
Through an informal agreement with its parent, Smithfield Foods, Inc., the Company was provided certain administrative services by Smithfield Foods, Inc. Under this arrangement, the Company was charged $4.5 million and $3.1 million during the quarters ended July 27, 2008 and July 29, 2007, respectively.
F-194
Table of Contents
Smithfield Beef Group, Inc.
Notes to condensed consolidated financial statements
11. Regulations and litigation
The Company is subject to various laws and regulations administered by federal, state and other government entities, including the Environmental Protection Agency (EPA) and corresponding state agencies, as well as the United States Department of Agriculture, the United States Food and Drug Administration, the United States Occupational Safety and Health Administration and similar agencies in foreign countries. The Company believes that it is in compliance with these laws and regulations in all material respects and that continued compliance with these laws and regulations will not have a material adverse effect on its financial position or results of operations or cash flows.
In February 2003, the EPA promulgated regulations under the Clean Water Act governing confined animal feeding operations (CAFOs). Among other things, these regulations impose obligations on CAFOs to manage animal waste in ways intended to reduce the impact on water quality. These new regulations were challenged in federal court by both industry and environmental groups. Although a 2005 decision by the court invalidated several provisions of the regulations, they remain largely intact.
From time to time and in the ordinary course of its business, the Company is named as a defendant in legal proceedings related to various issues, including worker’s compensation claims, tort claims and contractual disputes. While the resolution of such matters may have an impact on the Company’s financial results for the period in which they are resolved, the Company believes that the ultimate disposition of these matters will not, individually or in the aggregate, have a material adverse effect upon its business or consolidated financial statements.
12. Fair value measurements
The Company adopted Statement of Financial Accounting Standards (SFAS) No. 157,Fair Value Measurements, on April 28, 2008. SFAS No. 157 defines fair value as the price that would be received to sell an asset or paid to transfer a liability in an orderly transaction between market participants at the measurement date. SFAS No. 157 establishes a three-level fair value hierarchy that prioritizes the inputs used to measure fair value. The fair value hierarchy gives the highest priority to quoted market prices (Level 1) and the lowest priority to unobservable inputs (Level 3). The three levels of inputs used to measure fair value are as follows:
| • | Level 1—Quoted prices in active markets for identical assets or liabilities accessible by the reporting entity. |
| • | Level 2—Observable inputs other than quoted prices included in Level 1, such as quoted prices for similar assets and liabilities in active markets; quoted prices for identical or similar assets and liabilities in markets that are not active; or other inputs that are observable or can be corroborated by observable market data. |
| • | Level 3—Unobservable for an asset or liability. Unobservable inputs should only be used to the extent observable inputs are not available. |
The Company’s derivative financial instruments as of July 27, 2008, were measured at fair value based on Level 1 inputs.
F-195
Table of Contents
Five Rivers Ranch Cattle Feeding LLC
Balance sheets
(in thousands)
| (Unaudited) | |||||||
| September 30, 2008 | March 31, 2008 | ||||||
Assets | |||||||
Current assets | |||||||
Cash | $ | 4 | $ | 3 | |||
Accounts receivable | 13,612 | 16,819 | |||||
Inventories | 631,885 | 600,161 | |||||
Prepaid expenses | 2,986 | 2,470 | |||||
Derivative financial instruments | 13,951 | 27,792 | |||||
Total current assets | 662,438 | 647,245 | |||||
Property, plant and equipment, net | 88,875 | 88,339 | |||||
Water rights | 12,144 | 12,144 | |||||
Deferred financing costs, net | 3,359 | 2,291 | |||||
Other investments | 1,695 | 1,162 | |||||
Total assets | $ | 768,511 | $ | 751,181 | |||
Liabilities and Members’ Equity | |||||||
Current liabilities | |||||||
Note payable | $ | 444,100 | $ | 395,300 | |||
Borrowings on margin accounts | 7,154 | 10,012 | |||||
Bank overdraft | 18,935 | 11,171 | |||||
Accounts payable | 20,791 | 9,156 | |||||
Accrued expenses | 4,502 | 5,197 | |||||
Derivative financial instruments | 3,310 | 5,406 | |||||
Total current liabilities | 498,792 | 436,242 | |||||
Deferred compensation | 170 | 170 | |||||
Total liabilities | 498,962 | 436,412 | |||||
Commitments | |||||||
Members’ equity | |||||||
Members’ equity | 274,416 | 274,416 | |||||
Retained earnings (accumulated deficit) | (21,700 | ) | 11,249 | ||||
Accumulated other comprehensive income | 16,833 | 29,104 | |||||
Total members’ equity | 269,549 | 314,769 | |||||
Total liabilities and members’ equity | $ | 768,511 | $ | 751,181 | |||
The accompanying notes are an integral part of these financial statements.
F-196
Table of Contents
Five Rivers Ranch Cattle Feeding LLC
Statements of operations
(in thousands)
| (Unaudited) Six Months Ended September 30, | ||||||
| 2008 | 2007 | |||||
Revenues | $850,947 | $769,843 | ||||
Cost of revenues | 864,019 | 718,588 | ||||
Gross profit (loss) | (13,072 | ) | 51,255 | |||
Operating expenses | ||||||
Selling, general and administrative expenses | 6,762 | 7,289 | ||||
Depreciation and amortization expense | 4,607 | 4,292 | ||||
Total operating expenses | 11,369 | 11,581 | ||||
Income (loss) from operations | (24,441 | ) | 39,674 | |||
Other income (expenses) | ||||||
Interest income | 161 | 479 | ||||
Earnings from unconsolidated affiliate | 65 | 142 | ||||
Other income | 117 | 1,916 | ||||
Interest expense | (8,851 | ) | (15,428 | ) | ||
Total other expense, net | (8,508 | ) | (12,891 | ) | ||
Net income (loss) | $ (32,949 | ) | $ 26,783 | |||
The accompanying notes are an integral part of these financial statements.
F-197
Table of Contents
Five Rivers Ranch Cattle Feeding LLC
Statements of members’ equity
Six months ended September 30, 2008 and 2007
(Unaudited)
(in thousands)
Members’ Equity | Retained Earnings (Accumulated Deficit) | Accumulated Other Comprehensive Income (Loss) | Total | ||||||||
Six months ended September 30, 2007 | |||||||||||
Balance, March 31, 2007 | $274,416 | $(26,208 | ) | $(8,634 | ) | $239,574 | |||||
Comprehensive income: | |||||||||||
Net income | — | 26,783 | — | 26,783 | |||||||
Net gain on cash flow hedges | — | — | (9,870 | ) | (9,870 | ) | |||||
Reclassification adjustment for losses included in net income | — | — | 8,634 | 8,634 | |||||||
Comprehensive income | 25,547 | ||||||||||
Balance, September 30, 2007 | $274,416 | $575 | $(9,870 | ) | $265,121 | ||||||
Six months ended September 30, 2008 | |||||||||||
Balance, March 31, 2008 | $274,416 | $11,249 | $29,104 | $314,769 | |||||||
Comprehensive loss: | |||||||||||
Net loss | — | (32,949 | ) | — | (32,949 | ) | |||||
Net gain on cash flow hedges | — | — | 16,833 | 16,833 | |||||||
Reclassification adjustment for gains included in net loss | — | — | (29,104 | ) | (29,104 | ) | |||||
Comprehensive loss | (45,220 | ) | |||||||||
Balance, September 30, 2008 | $274,416 | $(21,700 | ) | $16,833 | $269,549 | ||||||
The accompanying notes are an integral part of these financial statements.
F-198
Table of Contents
Five Rivers Ranch Cattle Feeding LLC
Statements of cash flows
(in thousands)
| (Unaudited) Six Months Ended September 30, | ||||||||
| 2008 | 2007 | |||||||
Cash flows from operating activities: | ||||||||
Net income (loss) | $ | (32,949 | ) | $ | 26,783 | |||
Adjustments to reconcile net income (loss) to net cash used by operating activities: | ||||||||
Depreciation and amortization | 4,607 | 4,292 | ||||||
Amortization of deferred financing costs | 455 | 455 | ||||||
Equity in earnings of unconsolidated affiliate | (65 | ) | (142 | ) | ||||
Change in derivative fair value | (526 | ) | (10,122 | ) | ||||
Change in operating assets and liabilities: | ||||||||
Accounts receivable | 3,207 | (3,847 | ) | |||||
Inventories | (31,724 | ) | (140,759 | ) | ||||
Prepaid expenses | (450 | ) | (1,194 | ) | ||||
Other assets | — | 250 | ||||||
Accounts payable | 10,939 | 20,343 | ||||||
Net cash used in operating activities | (46,506 | ) | (103,941 | ) | ||||
Cash flows from investing activity: | ||||||||
Purchase of property, plant and equipment | (5,199 | ) | (7,561 | ) | ||||
Investment in Southfork Solutions, Inc. | (100 | ) | (120 | ) | ||||
Net cash used in investing activities | (5,299 | ) | (7,681 | ) | ||||
Cash flows from financing activities: | ||||||||
Capitalized debt fees | (1,903 | ) | — | |||||
Bank overdraft | 7,764 | 12,018 | ||||||
Proceeds from note payable, net | 48,800 | 99,600 | ||||||
Borrowings on margin account, net | (2,858 | ) | — | |||||
Net cash provided by investing activities | 51,803 | 111,618 | ||||||
Decrease in cash | (2 | ) | (4 | ) | ||||
Cash at beginning of period | 6 | 6 | ||||||
Cash at end of period | $ | 4 | $ | 2 | ||||
Cash paid for interest | $ | 8,429 | $ | 11,086 | ||||
The accompanying notes are an integral part of these financial statements.
F-199
Table of Contents
Five Rivers Ranch Cattle Feeding LLC
Unaudited notes to financial statements
1. Organization and nature of operation
Five Rivers Ranch Cattle Feeding LLC (“the Company”) is a limited liability company organized on May 20, 2005, in the state of Delaware. The Company is a 50/50 joint venture between ContiBeef LLC (“ContiBeef”) and MF Cattle Feeding, Inc. (“MF”) (the “Members”). The Members exercise joint control over the Company. ContiBeef is a wholly-owned subsidiary of Continental Grain Company, and MF is a wholly-owned subsidiary of Cattle Production Systems, Inc. whose parent company is Smithfield Beef Group, Inc. (“Smithfield Beef”), which is a wholly-owned subsidiary of Smithfield Foods, Inc. On May 20, 2005, the operating assets and certain liabilities of ContiBeef and MF were transferred to the Company at net book value in exchange for equity interests in the Company.
The Company was engaged in raising feeder cattle for itself and for outside customers, and then ultimately selling the cattle to meat packing companies (“packers”). Feedlot operations are located in Idaho, Texas, Colorado, Kansas, and Oklahoma.
2. Summary of significant accounting policies
Interim Periods and Basis of Presentation—The Company’s fiscal year-end is on March 31st. The information included in these financial statements reflects all adjustments which are, in the opinion of management, necessary for a fair presentation of the Company’s financial position and results of operations for the interim periods presented. Balance sheet amounts are as of September 30, 2008 and March 31, 2008 and operating result amounts are for the six months ended September 30, 2008 and 2007, and include all normal and recurring adjustments that we considered necessary for the fair summarized presentation of our financial position and operating results. Revenues, expenses, assets and liabilities can vary during each quarter of the year. Therefore, the results and trends in these interim financial statements may not necessarily be indicative of the operating results for the full fiscal year.
Accounts Receivable—Accounts receivable are primarily from feedlot customers for their share of feed, medicine, and other supplies for the care of those cattle and billed to the feedlot customer every month. Based on past history and the ability to collect final feed bills from the packers upon shipment of the finished cattle, the Company has no history of bad debt. Accordingly, at September 30, 2008 and March 31, 2008, an allowance for doubtful accounts was not required.
Inventories—Inventories of livestock, feed, silage, processing supplies, and medication are stated at the lower of cost (first-in, first-out or “FIFO”) or market. Farm inventory is stated a lower of cost (FIFO) or market and includes seeds and other costs related to the production of the next season’s crops. Parts, medication and other inventories are stated at average cost.
Property, Plant and Equipment—Property, plant and equipment was stated at cost. Depreciation is computed using the straight-line method over the estimated useful lives of 25 years for farm buildings, 10 to 30 years for land improvements and buildings, and 2 to 12 years for machinery, equipment, furniture, and purchased software. Maintenance and repairs are expensed as incurred, while betterments and expenditures that materially improve or extend the life of an asset are capitalized. Upon retirement or sale of an asset, its cost and related accumulated
F-200
Table of Contents
Five Rivers Ranch Cattle Feeding LLC
Unaudited notes to financial statements
depreciation are removed from the respective asset account and any resulting gain or loss is reflected in the statement of operations in the period realized. The costs of developing internal-use software are capitalized and amortized when placed in service over the expected useful life of the software. Major renewals and improvements that extend the useful life of the asset are capitalized while maintenance and repairs are expensed as incurred. The Company has historically and currently accounts for planned major maintenance activities as they are incurred in accordance with the guidance in the Financial Accounting Standards Board (“FASB”) FASB Staff Position (“FSP”) AUG Air-1:“Accounting for Planned Major Maintenance Activities.” The applicable interest charges incurred during the construction of assets if material are capitalized. In accordance with Statement of Financial Accounting Standard (“SFAS”) No. 144,“Accounting for the Impairment or Disposal of Long-Lived Assets,” the Company assesses the recoverability of long-lived assets whenever events or changes in circumstances indicate the carrying amount of an asset may not be recoverable. When future undiscounted cash flows of assets are estimated to be insufficient to recover their related carrying value, the Company compares the asset’s estimated future cash flows, discounted to present value using a risk-adjusted discount rate, to its current carrying value and records a provision for impairment as appropriate.
Depreciation and amortization expense for the six months ended September 30, 2008 and September 30, 2007 totaled $4.6 million and $4.3 million, respectively.
Deferred Financing Costs—Debt financing costs totaling $4.5 million were capitalized and are being amortized over the terms of the related loan agreements using the straight-line method. Accumulated amortization of the debt financing costs was $3.1 million at September 30, 2008 and $2.7 million at March 31, 2008, respectively.
Bank Overdraft—The majority of the Company’s bank accounts are zero balance accounts where cash needs are funded as checks are presented for payment by the holder. Checks issued pending clearance that result in overdraft balances for accounting purposes are included in the change in the related balance and are reflected as a financing activity on the statement of cash flows.
Self-Insurance Accruals—The Company is self-insured for employee medical and dental benefits and purchases insurance policies with deductibles for certain losses relating to worker’s compensation and general liability. The Company has purchased stop-loss coverage in order to limit its exposure to any significant levels of certain claims. Self-insured losses are accrued based upon periodic third party actuarial reports of the aggregate uninsured claims incurred using actuarial assumptions accepted in the insurance industry and the Company’s historical experience rates. The Company has recorded a prepaid asset with an offsetting liability to reflect the amounts estimated as due for claims incurred and accrued but not yet paid to the claimant by the third party insurance company in accordance with SFAS No. 140,“Accounting for Transfers and Servicing of Financial Assets and Extinguishments of Liabilities.”
Derivatives and Hedging Activities—The Company accounts for its derivatives and hedging activities in accordance with SFAS No. 133, “Accounting for Derivative Financial Instruments and Hedging Activities,”(“SFAS No. 133”), and its related amendment, SFAS No. 138,“Accounting for Certain Derivative Instruments and Certain Hedging Activities.” The Company uses derivatives
F-201
Table of Contents
Five Rivers Ranch Cattle Feeding LLC
Unaudited notes to financial statements
(e.g., futures and options) for the purpose of mitigating exposure to changes in commodity prices. The fair value of each derivative is recognized in the balance sheet within current assets or current liabilities. Changes in the fair value of derivatives are recognized immediately in the statements of operations.
Income Taxes—The Company is treated as a flow-through entity for income tax purposes and, therefore, the Company’s taxable income is included in the Members’ respective consolidated U.S. federal income tax returns. The Company is not allocated any current or deferred U.S. federal income expense (benefit) arising from the Company’s operations included in the Members’ results.
Revenue Recognition—The Company sells live cattle to packers located primarily in the Plains states. Revenue is generally recognized when live cattle are shipped to customers, based on terms as set forth by The Packers and Stockyards Act of 1921. The Company records transactions based on lot by lot accounting, generally recognizing revenue as cattle are shipped or on delivery depending on the terms of the sale, and will adjust revenues to reflect the results of the grading process as reported to the Company by the packer. The risk of loss transfers to the packer upon shipment, unless the Company has hired the transporter for shipment, in which case risk of loss transfers at delivery. Hotel revenue charged to customers for cattle feeding and care is recognized on a daily basis and is recorded in feedlot sales in the statements of operations. Animal feed supplement sold to third parties is recognized when the product is delivered and is recorded in feedlot sales in the statement of operations.
Advertising Costs—Advertising costs are expensed as incurred. Advertising costs were $67 thousand and $99 thousand for the six months ended September 30, 2008 and 2007, respectively.
Use of Estimates—The preparation of financial statements in conformity with accounting principles generally accepted in the United States of America, requires the Company to make estimates and assumptions that affect certain reported amounts of assets and liabilities, the disclosure of contingent assets and liabilities at the date of the financial statements and the reported amounts of revenues and expenses during the reporting period. In preparing these financial statements, the Company has made its best estimates and judgments of certain amounts included in the financial statements, giving due consideration to materiality. Changes in the estimates and assumptions used by the Company could have significant impact on the Company’s financial results. Actual results could differ from those estimates. Significant estimates with regard to these financial statements include the estimate of asset useful lives and insurance accruals.
Concentration of Business and Credit Risk—Substantially all of the Company’s business is on a credit basis. The Company extends credit to cattle feeding customers based on the fact that cattle are held in our feedyards, shipped directly to packers, and the packers will deduct final feedbills from any proceeds due to the customer. The demand for the Company’s product and service is dependent upon the general economy, cost of feeder cattle, live cattle, corn and other feedstocks, weather, and other factors that may affect the pricing of food commodities.
F-202
Table of Contents
Five Rivers Ranch Cattle Feeding LLC
Unaudited notes to financial statements
Fair Value of Financial Instruments—The carrying amounts of the Company’s financial instruments, including cash, trade receivables, and payables, approximate their fair values due to the short-term nature of the instruments. The fair value of the Company’s debt approximates market value as its line of credit bears interest at floating market rates based on LIBOR. Open derivative contracts are traded on the Chicago Mercantile Exchange and are marked to market on a daily basis and are recorded in the balance sheet.
Recent Accounting Pronouncements—In March 2008, the FASB issued SFAS No. 161,“Disclosures about Derivative Instruments and Hedging Activities.”SFAS No. 161 provides for enhanced disclosures about the use of derivatives and their impact on a Company’s financial position and results of operations. This statement is effective for the Company’s fiscal year 2009. The Company does not expect the adoption of SFAS No. 161 to have a material impact on its financial position, results of operations, or cash flows.
In December 2007, the FASB issued SFAS No. 141(R)“Business Combinations.” SFAS No. 141(R) requires the acquiring entity in a business combination to recognize all assets acquired and liabilities assumed in the transaction and any non-controlling interest in the acquiree at the acquisition date, measured at fair value at that date. This includes the measurement of the acquirer’s shares issued as consideration in a business combination, the recognition of contingent consideration, the accounting for pre-acquisition gains and loss contingencies, the recognition of capitalized in–process research and development, the accounting for acquisition related restructuring cost accruals, the treatment of acquisition related transaction costs and the recognition of changes in the acquirer’s income tax valuation allowance and deferred taxes. One significant change in this statement is the requirement to expense direct costs of the transaction, which under existing standards are included in the purchase price of the acquired company. This statement also established disclosure requirements to enable the evaluation of the nature and financial effect of the business combination. SFAS No. 141(R) is effective for business combinations consummated after December 31, 2008. The statement also requires that any adjustments to uncertain tax positions from business combinations consummated prior to December 31, 2008 no longer be recorded as an adjustment to goodwill, but be reported in income.
3. Accounts receivable
Accounts receivable at September 30, 2008 and March 31, 2008, were as follows (in thousands):
| September 30, 2008 | March 31, 2008 | |||||
Trade | $ | 13,547 | $ | 16,736 | ||
Employee advances | 65 | 83 | ||||
Total accounts receivables | $ | 13,612 | $ | 16,819 | ||
F-203
Table of Contents
Five Rivers Ranch Cattle Feeding LLC
Unaudited notes to financial statements
4. Inventories
Inventory balances at September 30, 2008 and March 31, 2008, were as follows (in thousands):
| September 30, 2008 | March 31, 2008 | |||||
Livestock | $ | 591,972 | $ | 574,082 | ||
Silage | 20,415 | 13,657 | ||||
Planting seeds and supplies | 444 | 365 | ||||
Parts | 740 | 718 | ||||
Feed | 17,032 | 10,356 | ||||
Medication and other | 1,282 | 983 | ||||
Total inventory | $ | 631,885 | $ | 600,161 | ||
5. Property, plant and equipment
Property, plant and equipment at September 30, 2008 and March 31, 2008 were as follows (in thousands):
| September 30, 2008 | March 31, 2008 | |||||||
Land and improvements | $ | 66,995 | $ | 65,580 | ||||
Buildings | 9,045 | 8,898 | ||||||
Machinery, equipment and fixtures | 35,878 | 33,348 | ||||||
Capitalized software | 636 | 636 | ||||||
Construction-in-progress | 2,888 | 2,009 | ||||||
| 115,442 | 110,471 | |||||||
Accumulated depreciation | (26,567 | ) | (22,132 | ) | ||||
Total property and equipment, net | $ | 88,875 | $ | 88,339 | ||||
6. Water rights
The Company has recorded intangible assets in the form of water rights with indefinite lives at the Kuner and Gilcrest feedlots. This intangible asset is recorded at its carryover basis of $12.1 million. The Company’s annual impairment testing date coincides with its fiscal year-end. If an assessment indicates impairment, the impaired asset is written down to its fair value based on the best information available in accordance with SFAS 142, “Goodwill and Other Intangible Assets.” There were no impairments recorded as of September 30, 2008 and March 31, 2008.
F-204
Table of Contents
Five Rivers Ranch Cattle Feeding LLC
Unaudited notes to financial statements
7. Other investments
Investments at September 30, 2008 and March 31, 2008 are as follows (in thousands):
| September 30, 2008 | March 31, 2008 | |||||
50% interest—Northern Colorado Feed, LLC | $ | 1,085 | $ | 1,033 | ||
500,000 common shares—Southfork Solutions, Inc. | 600 | 500 | ||||
Membership | 10 | 10 | ||||
Total other investments | $ | 1,695 | $ | 1,543 | ||
Northern Colorado Feed, LLC—The Company owns a 50% interest in Northern Colorado Feed, LLC, which is an unconsolidated affiliate accounted for under the equity method. Investments in entities in which we lack control but have the ability to exercise significant influence over operating and financial policies are accounted for on the equity method. Under the equity method, the investment, originally recorded at cost, (fair value at date of acquisition) is adjusted to recognize our share of the net earnings or losses of the affiliate as they occur. The Company’s share of earnings in the investment for the six months ended September 30, 2008 and 2007 totaled $67 thousand and $142 thousand, respectively.
Southfork Solutions, Inc.—The Company considers their investment in Southfork Solutions available-for-sale as defined in SFAS No. 115.“Accounting for Certain Investments in Debt and Equity Securities.” Accordingly, this investment is considered an available for sale security recorded at fair value. Fair value was estimated using valuation methodologies based on available and observable market information. Such valuation methodologies include reviewing the value ascribed to the most recent financing proposal by Southfork Solutions and reviewing their underlying financial performance. Southfork Solutions is a privately held company that is developing technology for animal identification and tracking purposes.
Membership—The Company has a membership with Feeders’ Advantage LLC, a Idaho limited liability corporation which is 50% owned by MWI Veterinary Supply Co., a wholly owned subsidiary of MWI Veterinary Supply, Inc. The remaining 50% is owned by various members, each paying $10 thousand for membership. As a requirement of membership, each member is required to purchase all of its veterinary supplies from MWI Veterinary Supply.
8. Accrued liabilities
Accrued liabilities at September 30, 2008 and March 31, 2008, were as follows (in thousands):
| September 30, 2008 | March 31, 2008 | |||||
Employee compensation, bonus and benefits | $ | 1,509 | $ | 2,820 | ||
Reserve for workers compensation and automobile liability insurance | 1,441 | 1,038 | ||||
Interest | — | 286 | ||||
Other | 1,552 | 1,053 | ||||
Total accrued liabilities | $ | 4,502 | $ | 5,197 | ||
F-205
Table of Contents
Five Rivers Ranch Cattle Feeding LLC
Unaudited notes to financial statements
9. Note payable
The Company entered into a $550 million revolving credit agreement (the “Facility”) with a maturity date of May 20, 2010. During April 2006, the line of credit was reduced by $25 million as provided for in the credit agreement. At September 30, 2008, the Company was utilizing $444.1 million of the Facility, and had an outstanding letter of credit of $1.5 million leaving $79.4 million in unused line of credit with $31.1 million available to be borrowed by the Company according to the terms of the credit agreement. At March 31, 2008, the Company was utilizing $395.3 million of the Facility, and had an outstanding letter of credit of approximately $1.5 million leaving $128.24 million in unused line of credit with $116.8 million available to be borrowed by the Company according to the terms of the credit agreement. Borrowings under the Facility bear interest at variable rates based on LIBOR. The Company’s policy is to pay down the outstanding principal balance of the line of credit and to borrow additional amounts to finance working capital requirements. Accordingly, the Company classifies the debt as a current liability in the balance sheet. The credit agreement is collateralized by certain fixed assets, accounts receivable and inventories of the Company. Among other requirements, the Facility requires the Company to maintain certain financial ratios, minimum levels of net worth, and establish limitations on certain types of payments, including dividends, investments, and capital expenditures. The Company is in compliance with all covenants.
10. Commitments
The Company utilizes in its operations buildings and equipment which are leased under operating lease agreements, extending through March 2013. The following is a schedule of the future minimum obligations under the operating leases that have initial or remaining non-cancelable lease terms in excess of one year at September 30, 2008 (in thousands):
| Periods ending September 30 | Amount | ||
2008 | $ | 329 | |
2009 | 218 | ||
2010 | 202 | ||
2011 | 206 | ||
2012 | 211 | ||
Thereafter | 165 | ||
Total | $ | 1,331 | |
Rent expense under all operating leases was approximately $.7 million and $.7 million for the six months ended September 30, 2008 and 2007, respectively. The initial term of the Loveland office lease is seven years with one five-year extension. There is also a separate lease for 2,254 square feet of adjoining office space that is currently being occupied by Five Star Cattle Systems, a MF Cattle Feeding, Inc. subsidiary. The lease allows for 3% annual escalations, and includes the tenant’s pro rata share of operating expenses.
F-206
Table of Contents
Five Rivers Ranch Cattle Feeding LLC
Unaudited notes to financial statements
11. Related party transactions
The Company has an agreement with ContiBeef whereby ContiBeef would provide certain services by ContiGroup Companies, Inc. for $1 million annually. Expenses for the six months ended September 30, 2008 and 2007 were $265 thousand and $390 thousand, respectively.
12. Significant customers
Outside customers accounted for 3% and 16% of the total cattle on feed at the Company’s feedyards for the six months ended September 30, 2008 and 2007, respectively.
13. Employee benefit plans
The Company sponsored a defined contribution plan 401(k) Plan, administered by The Vanguard Group. All employees may participate by contributing a portion of their annual earnings to the plan. The Company’s contributions are based on each participant’s level of contribution and cannot exceed the maximum allowable for tax purposes. Total contributions were approximately $105 thousand and $86 thousand for the six month period ended September 30, 2008 and 2007, respectively.
14. Derivative instruments and hedging activity
The Company is exposed to market risk, such as changes in commodity prices for its main raw materials—feeder cattle and corn, and its finished product—live cattle. The Company’s exposure to commodity price risk relates to raw material and finished product price fluctuations caused by supply conditions, weather, economic conditions, and other factors. To manage volatility associated with these exposures, the Company may enter into derivative transactions pursuant to established Company policies. Generally, the Company utilizes commodity futures and option contracts to reduce the volatility of commodity input prices on corn and feeder cattle and commodity prices on live cattle.
Options are used to economically hedge a portion of the market risk, even though the Company has elected not to designate these positions as accounting hedges. The Company enters into futures and options transactions with established brokers.
The Company considers its use of derivative instruments to be an economic hedge against changing prices. At September 30, 2008 and March 31, 2008, all open derivative contracts were recorded at fair value in accordance with SFAS No. 133. These contracts are recorded within current assets when the unrealized value is a gain and within current liabilities when the unrealized value is a loss. The Company designates contracts for the future purchase or sale of certain commodities as normal purchase normal sales and thus these contracts are not marked-to-market. The Company formally documents all relationships between hedging instruments and hedged items, as well as its risk management objectives and strategies for undertaking the hedge transactions. The Company links all hedges to forecasted transactions and
F-207
Table of Contents
Five Rivers Ranch Cattle Feeding LLC
Unaudited notes to financial statements
assesses whether the derivatives that are used in hedging transactions are highly effective in offsetting changes in cash flows of hedged items, both at the inception of the hedge and on an ongoing basis.
Trading Activities—During the six months ended September 30, 2008 and 2007, the Company had the following derivative activities, which while economic hedges, were not accounted for as hedges and whose gains or losses are reflected in “Other revenues” on the Statements of Operations:
| • | Corn Purchases—As of September 30, 2008 and 2007, the Company had open derivative contracts on 700 thousand and 11.5 million bushels of corn, respectively, to hedge or unwind pricing on future purchases at various feedyards. At September 30, 2008 and 2007, these positions had unrealized losses totaling $557 thousand and $224 thousand, respectively. During the six months ended September 30, 2008, the Company recorded $474 thousand in realized gains on these positions. During the six months ended September 30, 2007, the Company recorded $14 thousand in realized losses on these positions. |
| • | Feeder Cattle Purchases—As of September 30, 2008, the Company had open derivative contracts on 300,000 pounds of feeder cattle to hedge purchases at various feedyards which carried an unrealized loss of $8 thousand. At September 30, 2007, there were no open positions on feeder cattle that were not designated as accounting hedges, and realized losses totaling $418 thousand were recorded for the six months then ended. |
| • | Live Cattle Sales—As of September 30, 2008 and 2007, the Company had open derivative contracts on 220.4 million and 166.7 million pounds of live cattle, respectively, to hedge future sales at various feedyards. At September 30, 2008 and 2007, these positions had net unrealized losses totaling $2.3 million and $4.3 million, respectively. During the six months ended September 30, 2008 and 2007, the Company recorded realized gains on these positions of $10.8 million and $10.9 million, respectively. |
| • | Natural Gas Purchases—During the six months ended September 30, 2008, the Company recorded $23 thousand in unrealized losses on natural gas contracts to hedge future purchases at various feedyards. As of September 30, 2007, there were no open derivative contracts on natural gas. |
| • | Soybean Meal Purchases—During the six months ended September 30, 2007, the Company recorded $96 thousand in realized gains on soybean meal. There was no soybean meal derivative contracts traded for the period ended September 30, 2008. |
Hedging Activities—During the six months ended September 30, 2008 and 2007, the Company had the following derivatives which were appropriately designated and accounted for as hedges:
| • | Feeder Cattle Purchases—As of September 30, 2008 and 2007, the Company had no open derivative contracts on feeder cattle. For the six months ended September 30, 2007, the Company recorded $229 thousand in realized gains on feeder cattle hedges which have been recorded in other income due to ineffectiveness of these hedges. |
F-208
Table of Contents
Five Rivers Ranch Cattle Feeding LLC
Unaudited notes to financial statements
| • | Live Cattle Sales—As of September 30, 2008, the Company had open derivative contracts on 164.6 million pounds of live cattle to hedge future sales at various feedyards which are being accounted for as cash flow hedges. These positions had unrealized gains totaling $13.5 million and realized gains totaling $3.3 million which were recorded in accumulated other comprehensive loss. During the six months ended September 30, 2008, the Company realized $13.0 million in losses on live cattle hedges. Of this, $3.7 million of losses have been recorded in cost of sales, and $9.3 million of losses have been recorded in other income due to ineffectiveness of these hedges. |
As of September 30, 2007, the Company had open derivative contracts on 182 million pounds of live cattle to hedge future sales at various feedyards which were being accounted for as cash flow hedges. These positions had unrealized losses totaling $8.7 million and realized losses totaling $1.3 million which were recorded in accumulated other comprehensive income. During the six months ended September 30, 2007, the Company realized $3 million in gains on live cattle hedges. Of this, $600 thousand of gains have been recorded in cost of sales, and $2.4 million in gains have been recorded in other income due to ineffectiveness on these hedges.
15. Disclosures about fair value of financial instruments
The Company adopted SFAS No. 157,“Fair Value Measurements.” SFAS No. 157 defines fair value, establishes a framework for measuring fair value and requires additional disclosures about fair value measurements. The criterion that is set forth in this standard is applicable to the fair value measurement where it is permitted or required under other accounting pronouncements. SFAS No. 157 defines fair value as the exit price, which is the price that would be received to sell an asset or paid to transfer a liability in a transaction between market participants at the measurement date. SFAS No. 157 establishes a three-tier fair value hierarchy that prioritizes inputs to valuation techniques used for fair value measurement.
| • | Level 1 consists of observable market data in an active market for identical assets or liabilities. |
| • | Level 2 consists of observable market data, other than that included in Level 1, that is either directly or indirectly observable. |
| • | Level 3 consists of unobservable market data. The input may reflect the assumptions of the Company, not a market participant, if there is little available market data and the Company’s own assumptions are considered by management to be the best available information. |
In the case of multiple inputs being used in fair value measurement, the lowest level input that is significant to the fair value measurement represents the level in the fair value hierarchy in which the fair value measurement is reported. The adoption of SFAS No. 157 has not resulted in any significant changes to the methodologies used for fair value measurement. The Company uses derivatives for the purpose of mitigating exposure to market risk in commodity prices. The Company uses exchange-traded futures and options to hedge grain and natural gas commodities.
F-209
Table of Contents
Five Rivers Ranch Cattle Feeding LLC
Unaudited notes to financial statements
The fair value of derivative assets and liabilities are reflected on the balance sheet totaling $13.9 million and $3.3 million, respectively. The fair value measurements are performed on a recurring basis and the level of the fair value hierarchy in which they fall are as follows at September 30, 2008 (in thousands):
| Level 1 | September 30, 2008 | ||
Assets: | |||
Commodity derivatives—total fair value | $ | 13,951 | |
Liabilities: | |||
Commodity derivatives—total fair value | $ | 3,310 | |
16. Subsequent events
On October 23, 2008, Smithfield Foods acquired from Continental Grain Company its 50% ownership interest in the Company and simultaneously on that date JBS USA, Inc. effectively acquired 100% ownership interest in the Company in a transaction accounted for as a purchase. The livestock inventory was retained by Smithfield Foods and Continental Grain Company. The nature of operations of the Company was modified so that in periods following the change of control, the Company will provide cattle feeding services only and will not sell cattle except on behalf of the cattle owners. As a result of this change, certain accounting policies including derivative trading activities were changed by the successor company.
F-210
Table of Contents
Report of Independent Registered Public Accounting Firm
The Board of Directors and Stockholders
Pilgrim’s Pride Corporation
We have audited the accompanying consolidated balance sheets of Pilgrim’s Pride Corporation (the “Company”) as of September 26, 2009 and September 27, 2008, and the related consolidated statements of operations, stockholders’ equity, and cash flows for each of the three years in the period ended September 26, 2009. These financial statements are the responsibility of the Company’s management. Our responsibility is to express an opinion on these financial statements based on our audits.
We conducted our audits in accordance with the standards of the Public Company Accounting Oversight Board (United States). Those standards require that we plan and perform the audit to obtain reasonable assurance about whether the financial statements are free of material misstatement. An audit includes examining, on a test basis, evidence supporting the amounts and disclosures in the financial statements. An audit also includes assessing the accounting principles used and significant estimates made by management, as well as evaluating the overall financial statement presentation. We believe that our audits provide a reasonable basis for our opinion.
In our opinion, the financial statements referred to above present fairly, in all material respects, the consolidated financial position of Pilgrim’s Pride Corporation at September 26, 2009 and September 27, 2008, and the consolidated results of its operations and its cash flows for each of the three years in the period ended September 26, 2009, in conformity with U.S. generally accepted accounting principles.
The accompanying financial statements have been prepared assuming that Pilgrim’s Pride Corporation will continue as a going concern. As more fully described in Note A, the Company filed for reorganization under Chapter 11 of the United States Bankruptcy Code on December 1, 2008. This, and the other business environment factors discussed, raise substantial doubt about the Company’s ability to continue as a going concern. Management’s plans in regard to this matter are also described in Note A. The accompanying consolidated financial statements do not include any adjustments to reflect the possible future effects on the recoverability and classification of assets or the amounts and classification of liabilities that may result from the outcome of this uncertainty.
As discussed in Note N to the consolidated financial statements, Pilgrim’s Pride Corporation adopted guidance originally issued in FASB Interpretation No. 48, “Accounting for Uncertainty in Income Taxes - an interpretation of FASB Statement No. 109” (codified in FASB Accounting Standards Codification Topic 740 “Income Taxes”), effective September 30, 2007.
/s/ ERNST & YOUNG LLP
Dallas, Texas
November 20, 2009
F-211
Table of Contents
debtor and debtor-in-possession as of December 1, 2008
Pilgrim’s Pride Corporation
| (In thousands, except shares and per share data) | September 26, 2009 | September 27, 2008 | ||||||
Assets | ||||||||
Current assets: | ||||||||
Cash and cash equivalents | $ | 220,029 | $ | 61,553 | ||||
Investment in available-for-sale securities | 5,302 | 10,439 | ||||||
Trade accounts and other receivables, less allowance for doubtful accounts | 316,953 | 144,156 | ||||||
Inventories | 763,869 | 1,036,163 | ||||||
Income taxes receivable | 15,028 | 21,656 | ||||||
Current deferred tax assets | — | 54,312 | ||||||
Prepaid expenses and other current assets | 45,013 | 88,922 | ||||||
Assets of discontinued business | — | 33,519 | ||||||
Total current assets | 1,366,194 | 1,450,720 | ||||||
Investment in available-for-sale securities | 57,314 | 55,854 | ||||||
Deferred tax assets | 16,732 | — | ||||||
Other assets | 63,609 | 51,768 | ||||||
Identified intangible assets, net | 57,179 | 67,363 | ||||||
Property, plant and equipment, net | 1,499,476 | 1,673,004 | ||||||
| $ | 3,060,504 | $ | 3,298,709 | |||||
Liabilities and stockholders’ equity | ||||||||
Liabilities not subject to compromise: | ||||||||
Current liabilities: | ||||||||
Accounts payable | $ | 182,173 | $ | 378,887 | ||||
Accrued expenses | 309,259 | 448,823 | ||||||
Current deferred tax liabilities | 16,732 | — | ||||||
Current maturities of long-term debt | — | 1,874,469 | ||||||
Liabilities of discontinued business | — | 10,783 | ||||||
Total current liabilities | 508,164 | 2,712,962 | ||||||
Long-term debt, less current maturities | 41,062 | 67,514 | ||||||
Deferred tax liabilities | 22,213 | 80,755 | ||||||
Other long-term liabilities | 104,984 | 85,737 | ||||||
Total liabilities not subject to compromise | 676,423 | 2,946,968 | ||||||
Liabilities subject to compromise | 2,233,161 | — | ||||||
Commitments and contingencies | ||||||||
Stockholders’ equity: | ||||||||
Preferred stock, $.01 par value, 5,000,000 shares authorized; no shares issued | — | — | ||||||
Common stock, $.01 par value, 160,000,000 shares authorized; 77,141,389 shares issued and outstanding at year end 2009; 74,055,733 shares issued and outstanding at year end 2008 | 771 | 740 | ||||||
Additional paid-in capital | 646,793 | 646,922 | ||||||
Accumulated deficit | (469,407 | ) | (317,082 | ) | ||||
Accumulated other comprehensive income (loss) | (27,237 | ) | 21,161 | |||||
Total stockholders’ equity | 150,920 | 351,741 | ||||||
| $ | 3,060,504 | $ | 3,298,709 | |||||
The accompanying notes are an integral part of these Consolidated Financial Statements.
F-212
Table of Contents
Consolidated statements of operations
debtor and debtor-in-possession as of December 1, 2008
Pilgrim’s Pride Corporation
| Three Years Ended September 26, 2009 | ||||||||||||
| (In thousands, except per share data) | 2009 | 2008 | 2007 | |||||||||
Net sales | $ | 7,088,055 | $ | 8,518,757 | $ | 7,498,612 | ||||||
Costs and expenses: | ||||||||||||
Cost of sales | 6,705,157 | 8,654,262 | 6,905,882 | |||||||||
Asset impairment and other operational restructuring charges | 12,464 | 27,990 | — | |||||||||
Gross profit (loss) | 370,434 | (163,495 | ) | 592,730 | ||||||||
Selling, general and administrative expenses | 301,120 | 376,599 | 355,539 | |||||||||
Goodwill impairment | — | 501,446 | — | |||||||||
Administrative restructuring charges, net | 1,987 | 16,156 | — | |||||||||
Total costs and expenses | 7,020,728 | 9,576,453 | 7,261,421 | |||||||||
Operating income (loss) | 67,327 | (1,057,696 | ) | 237,191 | ||||||||
Other expenses (income): | ||||||||||||
Interest expense | 161,929 | 134,220 | 123,183 | |||||||||
Interest income | (4,386 | ) | (2,593 | ) | (4,641 | ) | ||||||
Loss on early extinguishment of debt | — | — | 26,463 | |||||||||
Miscellaneous, net | (3,724 | ) | (2,230 | ) | (6,649 | ) | ||||||
| 153,819 | 129,397 | 138,356 | ||||||||||
Income (loss) from continuing operations before reorganization items and income taxes | (86,492 | ) | (1,187,093 | ) | 98,835 | |||||||
Reorganization items, net | 87,275 | — | — | |||||||||
Income (loss) from continuing operations before income taxes | (173,767 | ) | (1,187,093 | ) | 98,835 | |||||||
Income tax expense (benefit) | (21,586 | ) | (194,921 | ) | 47,319 | |||||||
Income (loss) from continuing operations | (152,181 | ) | (992,172 | ) | 51,516 | |||||||
Income (loss) from discontinued business, net of tax | 599 | (6,409 | ) | (4,499 | ) | |||||||
Net income (loss) | $ | (151,582 | ) | $ | (998,581 | ) | $ | 47,017 | ||||
Net income (loss) per common share—basic and diluted: | ||||||||||||
Continuing operations | $ | (2.06 | ) | $ | (14.31 | ) | $ | 0.77 | ||||
Discontinued business | 0.01 | (0.09 | ) | (0.06 | ) | |||||||
Net income (loss) | $ | (2.05 | ) | $ | (14.40 | ) | $ | 0.71 | ||||
The accompanying notes are an integral part of these Consolidated Financial Statements.
F-213
Table of Contents
Consolidated statements of stockholders’ equity
debtor and debtor-in-possession as of December 1, 2008
Pilgrim’s Pride Corporation
| (In thousands, except shares and per share data) | Common Stock | Additional Paid-In Capital | Accumulated Earnings (Deficit) | Accumulated Other Comprehensive Income (Loss) | Total | ||||||||||||||||
| Shares | Value | ||||||||||||||||||||
Balance at September 30, 2006 | 66,555,733 | $ | 665 | $ | 469,779 | $ | 646,750 | $ | 134 | $ | 1,117,328 | ||||||||||
Net income | 47,017 | 47,017 | |||||||||||||||||||
Other comprehensive income | 13,868 | 13,868 | |||||||||||||||||||
Total comprehensive income | 60,885 | ||||||||||||||||||||
Cash dividends declared ($.09 per share) | (5,992 | ) | (5,992 | ) | |||||||||||||||||
Balance at September 29, 2007 | 66,555,733 | 665 | 469,779 | 687,775 | 14,002 | 1,172,221 | |||||||||||||||
Net loss | (998,581 | ) | (998,581 | ) | |||||||||||||||||
Other comprehensive income | 7,159 | 7,159 | |||||||||||||||||||
Total comprehensive loss | (991,422 | ) | |||||||||||||||||||
Sale of common stock | 7,500,000 | 75 | 177,143 | 177,218 | |||||||||||||||||
Cash dividends declared ($.09 per share) | (6,328 | ) | (6,328 | ) | |||||||||||||||||
Other | 52 | 52 | |||||||||||||||||||
Balance at September 27, 2008 | 74,055,733 | 740 | 646,922 | (317,082 | ) | 21,161 | 351,741 | ||||||||||||||
Net loss | (151,582 | ) | (151,582 | ) | |||||||||||||||||
Other comprehensive loss | (48,398 | ) | (48,398 | ) | |||||||||||||||||
Total comprehensive loss | (199,980 | ) | |||||||||||||||||||
Issuance of restricted common stock | 3,085,656 | 31 | (31 | ) | |||||||||||||||||
Other | (98 | ) | (743 | ) | (841 | ) | |||||||||||||||
Balance at September 26, 2009 | 77,141,389 | $ | 771 | $ | 646,793 | $ | (469,407 | ) | $ | (27,237 | ) | $ | 150,920 | ||||||||
The accompanying notes are an integral part of these Consolidated Financial Statements.
F-214
Table of Contents
Consolidated statements of cash flows
debtor and debtor-in-possession as of December 1, 2008
Pilgrim’s Pride Corporation
| Three Years Ended September 26, 2009 | ||||||||||||
| (In thousands) | 2009 | 2008 | 2007 | |||||||||
Cash flows from operating activities: | ||||||||||||
Net income (loss) | $ | (151,582 | ) | $ | (998,581 | ) | $ | 47,017 | ||||
Adjustments to reconcile net income (loss) to cash provided by (used in) operating activities | ||||||||||||
Depreciation and amortization | 236,005 | 240,305 | 204,903 | |||||||||
Non-cash loss on early extinguishment of debt | — | — | 9,543 | |||||||||
Tangible asset impairment | 5,409 | 13,184 | — | |||||||||
Goodwill impairment | — | 501,446 | — | |||||||||
Gain on property disposals | (26,353 | ) | (14,850 | ) | (446 | ) | ||||||
Deferred income taxes | (21,478 | ) | (195,944 | ) | 83,884 | |||||||
Changes in operating assets and liabilities, net of the effect of business acquired | ||||||||||||
Accounts and other receivables | (173,915 | ) | (19,864 | ) | 247,217 | |||||||
Income taxes payable/receivable | (2,269 | ) | (1,552 | ) | 5,570 | |||||||
Inventories | 284,678 | (103,937 | ) | (129,645 | ) | |||||||
Prepaid expenses and other current assets | 24,036 | (23,392 | ) | (2,981 | ) | |||||||
Accounts payable and accrued expenses | (101,255 | ) | (71,293 | ) | (5,097 | ) | ||||||
Other, net | 1,730 | (6,374 | ) | 3,999 | ||||||||
Cash provided by (used in) operating activities | 75,006 | (680,852 | ) | 463,964 | ||||||||
Cash flows from investing activities: | ||||||||||||
Acquisitions of property, plant and equipment | (88,193 | ) | (152,501 | ) | (172,323 | ) | ||||||
Change in restricted cash and cash equivalents | (10,072 | ) | — | — | ||||||||
Purchase of investment securities | (19,958 | ) | (38,043 | ) | (125,045 | ) | ||||||
Proceeds from sale or maturity of investment securities | 18,946 | 27,545 | 208,676 | |||||||||
Business acquisition, net of cash acquired | — | — | (1,102,069 | ) | ||||||||
Proceeds from property disposals | 85,736 | 41,367 | 6,286 | |||||||||
Cash used in investing activities | (13,541 | ) | (121,632 | ) | (1,184,475 | ) | ||||||
Cash flows from financing activities: | ||||||||||||
Proceeds from notes payable to banks | 430,817 | — | — | |||||||||
Repayments on notes payable to banks | (430,817 | ) | — | — | ||||||||
Proceeds from long-term debt | 833,424 | 2,264,912 | 1,981,255 | |||||||||
Payments on long-term debt | (719,762 | ) | (1,646,028 | ) | (1,368,700 | ) | ||||||
Changes in cash management obligations | (11,172 | ) | 13,558 | 39,231 | ||||||||
Sale of common stock | — | 177,218 | — | |||||||||
Cash dividends paid | — | (6,328 | ) | (5,992 | ) | |||||||
Other, net | (1,337 | ) | (5,589 | ) | (15,565 | ) | ||||||
Cash provided by financing activities | 101,153 | 797,743 | 630,229 | |||||||||
Effect of exchange rate changes on cash and cash equivalents | (4,142 | ) | 126 | 46 | ||||||||
Increase (decrease) in cash and cash equivalents | 158,476 | (4,615 | ) | (90,236 | ) | |||||||
Cash and cash equivalents, beginning of year | 61,553 | 66,168 | 156,404 | |||||||||
Cash and cash equivalents, end of year | $ | 220,029 | $ | 61,553 | $ | 66,168 | ||||||
Supplemental Disclosure Information: | ||||||||||||
Cash paid during the year for: | ||||||||||||
Interest (net of amount capitalized) | $ | 79,689 | $ | 142,339 | $ | 104,394 | ||||||
Income taxes paid | $ | 11,228 | $ | 6,411 | $ | 11,164 | ||||||
The accompanying notes are an integral part of these Consolidated Financial Statements.
F-215
Table of Contents
Notes to consolidated financial statements
Note A—business and chapter 11 proceedings
Business
Pilgrim’s Pride Corporation (referred to herein as “the Company,” “we,” “us,” “our,” or similar terms) is one of the largest chicken companies in the United States (“US”), Mexico and Puerto Rico. Our fresh chicken retail line is sold in the southeastern, central, southwestern and western regions of the US, throughout Puerto Rico, and in the northern and central regions of Mexico. Our prepared-foods products meet the needs of some of the largest customers in the food service industry across the US. Additionally, the Company exports commodity chicken products to approximately 90 countries. As a vertically integrated company, we control every phase of the production of our products. We operate feed mills, hatcheries, processing plants and distribution centers in 14 US states, Puerto Rico and Mexico.
Our fresh chicken products consist of refrigerated (non-frozen) whole or cut-up chicken, either pre-marinated or non-marinated, and pre-packaged chicken in various combinations of freshly refrigerated, whole chickens and chicken parts. Our prepared chicken products include portion-controlled breast fillets, tenderloins and strips, delicatessen products, salads, formed nuggets and patties and bone-in chicken parts. These products are sold either refrigerated or frozen and may be fully cooked, partially cooked or raw. In addition, these products are breaded or non-breaded and either pre-marinated or non-marinated.
We reported a net loss of $151.6 million, or $2.05 per common share, for 2009, which included gross profit of $370.4 million. As of September 26, 2009, the Company’s accumulated deficit totaled $469.4 million. During 2009, the Company generated $75.0 million of cash from operations. At September 26, 2009, we had cash and cash equivalents totaling $220.0 million.
In September 2008, the Company entered into agreements with its lenders to temporarily waive the fixed-charge coverage ratio covenant under its credit facilities. The lenders agreed to continue to provide liquidity under the credit facilities during the thirty-day period ended October 28, 2008. On October 27, 2008, the Company entered into further agreements with its lenders to temporarily waive the fixed-charge coverage ratio and leverage ratio covenants under its credit facilities. The lenders agreed to continue to provide liquidity under the credit facilities during the thirty-day period ended November 26, 2008. On that same day, the Company also announced its intention to exercise its 30-day grace period in making a $25.7 million interest payment due on November 3, 2008, under its 8 3/8% senior subordinated notes and its 7 5/8% senior notes. On November 17, 2008, the Company exercised its 30-day grace period in making a $0.3 million interest payment due on November 17, 2008, under its 9 1/4% senior subordinated notes. On November 26, 2008, the Company entered into further agreements with its lenders to extend the temporary waivers until December 1, 2008.
Chapter 11 bankruptcy filings
On December 1, 2008 (the “Petition Date”), Pilgrim’s Pride Corporation and six of its subsidiaries (collectively, the “Debtors”) filed voluntary petitions for relief under Chapter 11 of Title 11 of the United States Code (the “Bankruptcy Code”) in the United States Bankruptcy Court for the Northern District of Texas, Fort Worth Division (the “Bankruptcy Court”). The cases are being jointly administered under Case No. 08-45664. The Company’s subsidiaries in Mexico and certain
F-216
Table of Contents
subsidiaries in the United States (“US”) were not included in the filing (the “Non-filing Subsidiaries”) and continue to operate outside of the Chapter 11 process.
Subject to certain exceptions under the Bankruptcy Code, the Debtors’ Chapter 11 filing automatically enjoined, or stayed, the continuation of any judicial or administrative proceedings or other actions against the Debtors or their property to recover on, collect or secure a claim arising prior to the Petition Date. Accordingly, most creditor actions to obtain possession of property from the Debtors, or to create, perfect or enforce any lien against the property of the Debtors, or to collect on monies owed or otherwise exercise rights or remedies with respect to a pre-petition claim are enjoined unless and until the Bankruptcy Court lifts the automatic stay.
Upon the filing of the Chapter 11 petitions, certain of our debt obligations became automatically and immediately due and payable, subject to an automatic stay of any action to collect, assert, or recover a claim against the Company and the application of applicable bankruptcy law. As a result, the accompanying Consolidated Balance Sheet as of September 27, 2008, included reclassifications of $1,872.1 million to reflect as current certain long-term debt under the Company’s credit facilities that was accelerated. Because of the bankruptcy petition, most of the Company’s pre-petition long-term debt is included inLiabilities subject to compromise at September 26, 2009. The Company classifies pre-petition liabilities subject to compromise as a long-term liability because management does not believe the Company will use existing current assets or create additional current liabilities to fund these obligations.
Effective December 1, 2008, the New York Stock Exchange (“NYSE”) delisted our common stock as a result of the Company’s filing of its Chapter 11 petition. Our common stock is now quoted on the Pink Sheets Electronic Quotation Service under the ticker symbol “PGPDQ.PK.” The Company has applied with the NYSE to list its common stock upon its exit from bankruptcy under its prior ticker symbol “PPC.”
On February 11, 2009, the Bankruptcy Court issued an order granting the Company’s motion to impose certain restrictions on trading in shares of the Company’s common stock in order to preserve valuable tax attributes. This order established notification procedures and certain restrictions on transfers of common stock or options to purchase the common stock of the Company. The trading restrictions apply retroactively to January 17, 2009, the date the motion was filed, to investors beneficially owning at least 4.75% of the outstanding shares of common stock of the Company. For these purposes, beneficial ownership of stock is determined in accordance with special US tax rules that, among other things, apply constructive ownership concepts and treat holders acting together as a single holder. In addition, in the future, the Company may request that the Bankruptcy Court impose certain trading restrictions on certain debt of, and claims against, the Company.
Chapter 11 process
The Debtors are currently operating as “debtors-in-possession” under the jurisdiction of the Bankruptcy Court and in accordance with the applicable provisions of the Bankruptcy Code and orders of the Bankruptcy Court. In general, as debtors-in-possession, we are authorized under Chapter 11 to continue to operate as an ongoing business, but may not engage in transactions outside the ordinary course of business without the prior approval of the Bankruptcy Court.
On December 2, 2008, the Bankruptcy Court granted interim approval authorizing the Company and certain of its subsidiaries consisting of PPC Transportation Company, PFS Distribution
F-217
Table of Contents
Company, PPC Marketing, Ltd., and Pilgrim’s Pride Corporation of West Virginia, Inc. (collectively, the “US Subsidiaries”), and To-Ricos, Ltd. and To-Ricos Distribution, Ltd. (collectively with the US Subsidiaries, the “Subsidiaries”) to enter into a Post-Petition Credit Agreement (the “Initial DIP Credit Agreement”) among the Company, as borrower, the US Subsidiaries, as guarantors, Bank of Montreal, as agent (the “DIP Agent”), and the lenders party thereto. On December 2, 2008, the Company, the US Subsidiaries and the other parties entered into the Initial DIP Credit Agreement, subject to final approval of the Bankruptcy Court. On December 30, 2008, the Bankruptcy Court granted final approval authorizing the Company and the Subsidiaries to enter into an Amended and Restated Post-Petition Credit Agreement dated December 31, 2008, as amended (the “DIP Credit Agreement”), among the Company, as borrower, the Subsidiaries, as guarantors, the DIP Agent, and the lenders party thereto.
The DIP Credit Agreement currently provides for an aggregate commitment of up to $350 million, which permits borrowings on a revolving basis. The commitment includes a $25 million sub-limit for swingline loans and a $20 million sub-limit for letters of credit. Outstanding borrowings under the DIP Credit Agreement bear interest at a per annum rate equal to 8.0% plus the greatest of (i) the prime rate as established by the DIP Agent from time to time, (ii) the average federal funds rate plus 0.5%, or (iii) the LIBOR rate plus 1.0%, payable monthly. The weighted average interest rate for 2009 was 11.25%. The loans under the Initial DIP Credit Agreement were used to repurchase all receivables sold under the Company’s Amended and Restated Receivables Purchase Agreement dated September 26, 2008, as amended (the “RPA”). Loans under the DIP Credit Agreement were also used to fund the working capital requirements of the Company and its subsidiaries according to a budget as approved by the required lenders under the DIP Credit Agreement. For additional information on the RPA, see Note H—Trade Accounts and Other Receivables.
Actual borrowings by the Company under the DIP Credit Agreement are subject to a borrowing base, which is a formula based on certain eligible inventory and eligible receivables. The borrowing base formula is reduced by (i) pre-petition obligations under the Fourth Amended and Restated Secured Credit Agreement dated as of February 8, 2007, among the Company and certain of its subsidiaries, Bank of Montreal, as administrative agent, and the lenders parties thereto, as amended (the “Pre-Petition BMO Facility”), (ii) administrative and professional expenses incurred in connection with the bankruptcy proceedings and (iii) the amount owed by the Company and the Subsidiaries to any person on account of the purchase price of agricultural products or services (including poultry and livestock) if that person is entitled to any grower’s or producer’s lien or other security arrangement. The borrowing base is also limited to 2.22 times the formula amount of total eligible receivables. The DIP Credit Agreement provides that the Company may not incur capital expenditures in excess of $150 million. The Company must also meet minimum monthly levels of EBITDAR. Under the DIP Credit Agreement, “EBITDAR” means, generally, net income before interest, taxes, depreciation, amortization, writedowns of goodwill and other intangibles, asset impairment charges, certain restructuring and closure costs and other specified costs, charges, losses and gains. The DIP Credit Agreement also provides for certain other covenants, various representations and warranties, and events of default that are customary for transactions of this nature. As of September 26, 2009, the applicable borrowing base and the amount available for borrowings under the DIP Credit Agreement were both $329.2 million as there were no outstanding borrowings under the Credit Agreement.
The principal amount of outstanding loans under the DIP Credit Agreement, together with accrued and unpaid interest thereon, are payable in full at maturity on December 1, 2009, subject
F-218
Table of Contents
to extension for an additional six months with the approval of all lenders thereunder. The Company has requested a two-month extension. All obligations under the DIP Credit Agreement are unconditionally guaranteed by the Subsidiaries and are secured by a first priority priming lien on substantially all of the assets of the Company and the Subsidiaries, subject to specified permitted liens in the DIP Credit Agreement.
Under the terms of the DIP Credit Agreement and applicable bankruptcy law, the Company may not pay dividends on the common stock while it is in bankruptcy. The DIP Credit Agreement allows the Company to provide additional advances to the Non-filing Subsidiaries of up to approximately $30 million in excess of the net amount of such advances on the petition date. Management believes that all of the Non-filing Subsidiaries, including the Company’s Mexican subsidiaries, will continue to be able to operate within this limitation.
For additional information on the DIP Credit Agreement, see Note M—Notes Payable and Long-Term Debt.
Shortly after the Petition Date, the Debtors began notifying all known current or potential creditors of the Chapter 11 filing. Subject to certain exceptions under the Bankruptcy Code, the Debtors’ Chapter 11 filing automatically enjoined, or stayed, the continuation of any judicial or administrative proceedings or other actions against the Debtors or their property to recover on, collect or secure a claim arising prior to the Petition Date. Accordingly, most creditor actions to obtain possession of property from the Debtors, or to create, perfect or enforce any lien against the property of the Debtors, or to collect on monies owed or otherwise exercise rights or remedies with respect to a pre-petition claim are enjoined unless and until the Bankruptcy Court lifts the automatic stay. Vendors are being paid for goods furnished and services provided after the Petition Date in the ordinary course of business. Further, the Bankruptcy Court approved payment of certain of the Debtors’ pre-petition obligations, including, among other things, employee wages, salaries and benefits, and the Bankruptcy Court has approved the payment of vendors and other providers who provided goods or services in the ordinary course of the Debtors’ businesses that were ordered pre-petition but received from and after the Petition Date and other business-related payments necessary to maintain the operation of our businesses.
The Debtors retained, subject to Bankruptcy Court approval, legal and financial professionals to advise the Debtors on the bankruptcy proceedings and certain other “ordinary course” professionals. From time to time, the Debtors may seek Bankruptcy Court approval for the retention of additional professionals.
Also, as permitted by the Bankruptcy Code, the United States Trustee for the Northern District of Texas (the “US Trustee”) appointed an official committee of unsecured creditors (the “Creditors’ Committee”). The Creditors’ Committee and its legal representatives have a right to be heard on all matters that come before the Bankruptcy Court with respect to the Debtors. In addition, on April 30, 2009, the Bankruptcy Court ordered the US Trustee to appoint an official committee of equity holders (the “Equity Committee”) to represent the interests of Pilgrim’s Pride’s equity holders in the Debtors’ bankruptcy cases.
Under Section 365 and other relevant sections of the Bankruptcy Code, we may assume, assume and assign, or reject certain executory contracts and unexpired leases, including, without limitation, leases of real property and equipment, subject to the approval of the Bankruptcy Court and certain other conditions. Any description of an executory contract or unexpired lease in this report, including where applicable our express termination rights or a quantification of
F-219
Table of Contents
our obligations, must be read in conjunction with, and is qualified by, any overriding rejection rights we have under Section 365 of the Bankruptcy Code. The Debtors expect to file a list of executory contracts that are being assumed no later than November 20, 2009, unless the deadline for equity holders to vote on the Proposed Plan is extended, in which event the deadline to file the list of executory contracts to be assumed may be extended.
Proposed plan of reorganization and acquisition
In order for the Debtors to successfully exit Chapter 11, the Bankruptcy Court must first confirm a plan of reorganization with respect to the Debtors that satisfies the requirements of the Bankruptcy Code. To be confirmed, a plan of reorganization would, among other things, need to resolve the Debtors’ pre-petition obligations, set forth the revised capital structure of the newly reorganized entity and provide for corporate governance subsequent to exit from bankruptcy.
Under the priority scheme established by the Bankruptcy Code, unless creditors agree otherwise, pre-petition liabilities and post-petition liabilities must generally be satisfied in full before stockholders would be entitled to receive any distribution or retain any property under a plan of reorganization. The ultimate recovery to creditors and/or stockholders, if any, will not be determined until confirmation of a plan or plans of reorganization. No assurance can be given as to what values, if any, will be ascribed in the Chapter 11 cases to each of these constituencies or what types or amounts of distributions, if any, they would receive. A plan of reorganization could result in holders of our liabilities and/or securities, including our common stock, receiving no distribution on account of their interests and cancellation of their holdings. Because of such possibilities, the value of our liabilities and securities, including our common stock, is highly speculative. Appropriate caution should be exercised with respect to existing and future investments in any of the liabilities and/or securities of the Debtors. At this time there is no assurance we will be able to restructure as a going concern or successfully obtain confirmation of and implement a plan of reorganization.
The proposed plan
On September 17, 2009, the Debtors filed their Joint Plan of Reorganization Under Chapter 11 of the Bankruptcy Code with the Bankruptcy Court, along with the Disclosure Statement for the Debtors’ Joint Plan of Reorganization under Chapter 11 of the Bankruptcy Code (as amended and supplemented, the “Disclosure Statement”). On November 11, 2009, the Debtors filed an Amended Joint Plan of Reorganization Under Chapter 11 of the Bankruptcy Code (As Modified) with the Bankruptcy Court (as amended and supplemented, the “Proposed Plan”) which altered the treatment of unsecured note holders to provide that unsecured note holders may take a cash option rather than have their notes reinstated. The Proposed Plan provides that all unsecured creditors of the Debtors are unimpaired pursuant to Section 1124 of the Bankruptcy Code. Accordingly, the votes of unsecured creditors on the Proposed Plan are not being solicited as they will be deemed to have accepted the Proposed Plan. The Proposed Plan further provides for a reorganization of the Debtors’ businesses as a going concern. The Proposed Plan is premised on (i) a transaction with JBS USA Holdings, Inc. (the “Plan Sponsor” or “JBS USA”) whereby, pursuant to the SPA (defined below), the Plan Sponsor will purchase approximately 64% of the common stock of the reorganized Company (“Reorganized PPC”) in exchange for $800 million in cash, to be used by the Debtors to, among other things, fund distributions to holders of allowed claims under the Proposed Plan, and (ii) the Debtors entering into a new credit facility having an aggregate commitment of up to $1,750 million (as described below, the “Exit Credit Facility”). If
F-220
Table of Contents
the Proposed Plan is confirmed and becomes effective, the Company will adopt and file an Amended and Restated Certificate of Incorporation (the “Restated Certificate of Incorporation”) and will adopt Amended and Restated Corporate Bylaws (the “Restated Bylaws”).
The Proposed Plan will not become effective until certain conditions are satisfied or waived, including: (i) entry of an order by the Bankruptcy Court confirming the Proposed Plan, (ii) all actions, documents and agreements necessary to implement the Proposed Plan having been effected or executed, (iii) satisfaction or waiver of the conditions precedent to the SPA (including access of the Debtors to funding under the Exit Credit Facility), other than those which are to be satisfied at the closing of the transactions contemplated by the SPA (as defined below), (iv) the Debtors having access to the cash contributed by the Plan Sponsor, and (v) specified claims of the Debtors’ secured lenders having been paid in full pursuant to the Proposed Plan.
On September 29, 2009, the Bankruptcy Court approved a motion to further extend the period during which the Debtors have the exclusive right to file a plan of reorganization and the period during which the Debtors can obtain the necessary acceptances of the plan of reorganization, during which time competing plans may not be filed, through and including December 31, 2009, and March 1, 2010, respectively. If necessary, we may file one or more motions to request further extensions of these time periods. On October 22, 2009, we received approval from the Bankruptcy Court to begin soliciting stockholder acceptance of the Proposed Plan.
Section 1128(a) of the Bankruptcy Code requires the Bankruptcy Court, after appropriate notice, to hold a hearing on confirmation of a plan of reorganization. The confirmation hearing on the Proposed Plan is scheduled for December 8, 2009. The confirmation hearing may be adjourned from time to time by the Bankruptcy Court without further notice except for an announcement of the adjourned date made at the confirmation hearing or any subsequent adjourned confirmation hearing. There can be no assurance at this time that the Proposed Plan will be confirmed by the Bankruptcy Court or that any such plan will be implemented successfully.
If the Proposed Plan is confirmed and the transactions contemplated thereby are consummated, all holders of claims will be paid in full, unless otherwise agreed by the applicable holder. Holders of equity interests immediately prior to the effectiveness of the Proposed Plan would collectively be issued 36% of the common stock of Reorganized PPC.
The proposed acquisition
On September 16, 2009, we entered into a stock purchase agreement with the Plan Sponsor (the “SPA”). As discussed above, upon consummation of the transactions contemplated by the SPA, the Plan Sponsor will purchase 64% of the total issued and outstanding common stock of Reorganized PPC (the “Proposed Acquisition”) in exchange for aggregate consideration of $800 million in cash, to be used by the Debtors, among other things, to fund distributions under the Proposed Plan.
The Proposed Acquisition is subject to approval by the Bankruptcy Court of (i) the Proposed Plan and the Disclosure Statement, and (ii) the SPA. In addition, the obligations of the Company and the Plan Sponsor under the SPA are subject to the satisfaction of customary conditions to closing, including, without limitation, the execution and delivery of definitive documentation, receipt of certain regulatory approvals and governmental filings and the expiration or termination of applicable waiting periods, material compliance with the covenants by the parties, the representations and warranties under the SPA being true and correct (subject to certain
F-221
Table of Contents
materiality qualifiers), the absence of a material adverse change with respect to us since the date of the SPA and the payment of certain fees and expenses. In addition, the obligations of JBS USA under the SPA are conditioned on access of the Debtors to funding under the Exit Credit Facility. The obligations of JBS USA under the SPA, including JBS USA’s payment of the $800 million purchase price in exchange for 64% of the total issued and outstanding common stock of Reorganized PPC have no other financing conditions.
On October 14, 2009, the Company and the Plan Sponsor received notice from the Federal Trade Commission Bureau of Competition and the US Department of Justice of early termination of the waiting period under the Hart-Scott-Rodino Antitrust Improvements Act of 1976. The Proposed Acquisition remains subject to receipt of certain other regulatory approvals.
On September 17, 2009, we filed a motion with the Bankruptcy Court seeking entry of an order approving certain provisions of the SPA. On October 7, 2009, the Bankruptcy Court granted the motion and approved certain provisions of the SPA. We also sought approval of the remaining portions of the SPA as part of the approval of the Proposed Plan.
In connection with the closing of the Proposed Acquisition, the Company will enter into a stockholders agreement with JBS USA (the “Stockholders Agreement”) and will adopt and file the Restated Certificate of Incorporation. The Stockholders Agreement and the Restated Certificate of Incorporation will govern the constitution of the Company’s board of directors and the selection of its members. The Stockholders Agreement, among other things, will also restrict the ability of JBS USA to purchase shares of the common stock of Reorganized PPC, require the approval of the Company’s stockholders with respect to specified amendments to the Restated Certificate of Incorporation and Restated Bylaws and require JBS USA to use commercially reasonable efforts to maintain the listing of the common stock of Reorganized PPC on a national securities exchange. Among other rights, the Restated Certificate of Incorporation provides that, if JBS USA completes an initial public offering of its common stock, then, JBS USA has the right to exchange all of the outstanding common stock of Reorganized PPC for JBS USA common stock. For a period beginning upon the completion of such offering and ending two years and 30 days after the effective date of the Proposed Plan, JBS USA may exercise this exchange right during limited exchange windows in each fiscal quarter beginning six trading days after both Reorganized PPC and JBS USA have made their respective periodic reports or earnings releases for the preceding quarter or year, as applicable, and ending on the last day of the fiscal quarter during which the report or release was made. The number of shares of JBS USA common stock to be issued in exchange for the Reorganized PPC common stock will be dependent upon the relative average volume-weighted daily trading prices per share of the common stock of Reorganized PPC and the JBS USA common stock during the period immediately preceding the time JBS USA exercises its exchange right.
Exit credit facility
Upon exiting from bankruptcy, the Company and certain of its subsidiaries, consisting of To-Ricos, Ltd. and To-Ricos Distribution, Ltd. (collectively, the “To-Ricos Borrowers”), expect to enter into the Exit Credit Facility that provides for an aggregate commitment of up to $1,750 million consisting of (i) a revolving loan commitment of at least $600 million, (ii) a term loan A commitment of up to $375 million and (iii) a term loan B commitment of up to $775 million. The revolving loan commitment will mature in 2012. Term A loans, which cannot exceed $375 million in the aggregate, will mature in 2012. Term B loans, which cannot exceed $775 million in the
F-222
Table of Contents
aggregate, will mature in 2014. CoBank ACB will serve as administrative agent (“Exit Facility Agent”) on behalf of the lenders under the Exit Credit Facility. The Company has received non-binding mandate letters from the potential lenders party to the Exit Credit Facility.
The Term A loans mature three years from the effective date of the Exit Credit Facility and must be repaid in 12 equal quarterly principal installments of $12.5 million beginning on April 15, 2010, with the final installment due on the maturity date for the Term A loans. The Term B loans mature five years from the effective date of the Exit Credit Facility and must be repaid in 16 equal quarterly principal installments of $12.5 million beginning on April 15, 2011, with the final installment due on the maturity date for the Term B loans. Additionally, following the end of each fiscal year, a portion of our cash flow must be used to repay outstanding principal amounts under the Term A and Term B loans. Covenants in the Exit Credit Facility will also require us to use the proceeds we receive from certain asset sales and specified debt or equity issuances and upon the occurrence of other events to repay outstanding borrowings under the Exit Credit Facility.
The Exit Credit Facility includes a $50 million sub-limit for swingline loans and a $200 million sub-limit for letters of credit. Outstanding borrowings under the revolving loan commitment will bear interest at a per annum rate equal to 3.50% plus the greater of (i) the US prime rate as published by theWall Street Journal, (ii) the average federal funds rate plus 0.5%, and (iii) the one-month LIBOR rate plus 1.0%, in the case of alternate base rate loans, or 4.50% plus the one, two, three or six month LIBOR rate adjusted by the applicable statutory reserve, in the case of Eurodollar loans. Outstanding Term A and Term B-1 loans will bear interest at a per annum rate equal to 4.00% plus greater of (i) the U.S. prime rate, as published by the Wall Street Journal, (ii) the average federal funds rate plus 0.5%, and (iii) the one month LIBOR rate plus 1.0%, in the case of alternate base rate loans, or 5.00%, plus the one, two, three or six month LIBOR Rate adjusted by the applicable statutory reserve, in the case of Eurodollar loans. Outstanding Term B-2 loans will bear interest at a per annum rate equal to 9.00%. Commitment fees charged on the revolving commitments under the Exit Credit Facility will accrue at a per annum rate equal to 1.00%.
The proceeds of the borrowings under the Exit Credit Facility will be used to (i) repay outstanding secured and unsecured indebtedness of the Company and (ii) pay fees, costs and expenses related to and contemplated by the Exit Credit Facility and the Proposed Plan. In addition, proceeds of the borrowings under the revolving loan commitment will be used to finance the general corporate purposes of the borrowers (including capital expenditures, permitted acquisitions and principal and interest under the Exit Credit Facility).
Actual borrowings by the Company under the Exit Credit Facility will be subject to a borrowing base, which is a formula based on certain eligible inventory, eligible receivables and restricted cash under the control of the Exit Facility Agent. The borrowing base formula will be reduced by the sum of (i) inventory reserves, (ii) rent and collateral access reserves, and (iii) any amount more than 15 days past due that is owed by the Company or its subsidiaries to any person on account of the purchase price of agricultural products or services (including poultry and livestock) if that person is entitled to any grower’s or producer’s lien or other security arrangement. Revolving loan availability under the borrowing base also will be limited to an aggregate of $25 million with respect to the To-Ricos Borrowers.
The Exit Credit Facility will provide that the Company may not incur capital expenditures in excess of $225 million in fiscal year 2010, $275 million in fiscal year 2011 and $350 million per
F-223
Table of Contents
fiscal year thereafter. The Company must also maintain a minimum fixed charge coverage ratio and a minimum level of tangible net worth and may not exceed a maximum leverage ratio. The Exit Credit Facility will contain various covenants that may adversely affect our ability to, among other things, incur additional indebtedness, incur liens, pay dividends or make certain restricted payments, consummate certain asset sales, enter into certain transactions with JBS USA and our other affiliates, merge, consolidate and/or sell or dispose of all or substantially all of our assets.
All obligations under the Exit Credit Facility will be unconditionally guaranteed by certain of the Company’s subsidiaries and will be secured by a first priority lien on (i) the domestic (including Puerto Rico) accounts and inventory of the Company and its subsidiaries, (ii) 100% of the equity interests in the To-Ricos Borrowers and the Company’s domestic subsidiaries and 65% of the equity interests in the Company’s direct foreign subsidiaries, (iii) substantially all of the personal property and intangibles of the Company, the To-Ricos Borrowers and the guarantor subsidiaries, and (iv) substantially all of the real estate and fixed assets of the Company and the subsidiary guarantors.
The Exit Credit Facility will allow the Company to provide additional advances to its subsidiaries in an amount equal to the net amount of such advances in effect on the date of the Exit Credit Facility plus $30 million. Management believes that all of the Company’s subsidiaries, including the Company’s Mexican subsidiaries, will be able to operate within this limitation.
The Proposed Plan contemplates that the notes under the Company’s outstanding indentures will be reinstated unless and to the extent a holder of the notes elects to receive a cash payment equal to the principal amounts of the notes plus unpaid interest that had accrued pre-petition with interest accruing on such interest at the default contract rate through the effective date of the Proposed Plan and the unpaid post-petition interest at the non-default contract rate through the effective date. To the extent the holders of these notes elect reinstatement, then the amount of the term loan commitments under the Exit Credit Facility will be reduced on a dollar-for-dollar and pro rata basis.
Going concern matters
The accompanying Consolidated Financial Statements have been prepared assuming that the Company will continue as a going concern. However, there is substantial doubt about the Company’s ability to continue as a going concern based on the factors previously discussed. The Consolidated Financial Statements do not include any adjustments related to the recoverability and classification of recorded assets or the amounts and classification of liabilities or any other adjustments that might be necessary should the Company be unable to continue as a going concern. The Consolidated Financial Statements do not purport to reflect or provide for the consequences of our Chapter 11 proceedings. In particular, the financial statements do not purport to show (i) as to assets, their realizable value on a liquidation basis or their availability to satisfy liabilities; (ii) as to pre-petition liabilities, the amounts that may be allowed for claims or contingencies, or the status and priority thereof; (iii) as to shareowners’ equity accounts, the effect of any changes that may be made in our capitalization; or (iv) as to operations, the effect of any changes that may be made to our business. The Company’s ability to continue as a going concern is dependent upon, among other things, the ability of the Company to return to historic levels of profitability and, in the near term, restructure its obligations in a manner that allows it to obtain confirmation of a plan of reorganization by the Bankruptcy Court.
F-224
Table of Contents
Financial reporting considerations
The Company applied ASC (defined below) 852 in preparing the Consolidated Financial Statements. ASC 852 requires that the financial statements, for periods subsequent to the Chapter 11 filing, distinguish transactions and events that are directly associated with the reorganization from the ongoing operations of the business. Accordingly, certain expenses (including professional fees), realized gains and losses and provisions for losses that are realized or incurred in the bankruptcy proceedings are recorded inReorganization items, net on the accompanying Consolidated Statements of Operations. In addition, pre-petition obligations that may be impacted by the bankruptcy reorganization process have been classified on the Consolidated Balance Sheet at September 26, 2009, inLiabilities subject to compromise. These liabilities are reported at the amounts expected to be allowed by the Bankruptcy Court, even if they may be settled for lesser amounts.
The Debtors’ reorganization items for 2009 consisted of the following (in thousands):
Professional fees directly related to reorganization(a) | $ | 34,831 | ||
DIP Credit Agreement related expenses | 11,375 | |||
Net gain on asset disposals(b) | (15,850 | ) | ||
Other(c) | 56,919 | |||
Reorganization items, net | $ | 87,275 | ||
| (a) | Professional fees directly related to the reorganization include post-petition fees associated with advisors to the Debtors, the statutory committee of unsecured creditors and certain secured creditors. Professional fees are estimated by the Debtors and will be reconciled to actual invoices when received. |
| (b) | Net gain on asset disposals includes (i) a gain recognized on the sale of the Farmerville, Louisiana, processing facility, (ii) a gain recognized on the sale of undeveloped land in Camp County, Texas, and (iii) a loss recognized on the sale of the Company’s interest in a hog farming joint venture. |
| (c) | Other expenses includes (i) severance, grower pay, live flock impairment, inventory disposal costs, equipment relocation costs and other shutdown costs related to the closed processing facilities in Douglas, Georgia; El Dorado, Arkansas; Farmerville, Louisiana; Franconia, Pennsylvania; Dalton, Georgia; Athens, Georgia; and Athens, Alabama, (ii) severance costs related to the closed distribution center in Houston, Texas, the February 2009 Operations management reduction-in-force (“RIF”) action, the April 2009 non-production employee RIF action, and reduced or consolidated production at various facilities throughout the US, (iii) asset impairment costs related to the closed processing facility in Dalton, Georgia, and (iv) fees associated with the termination of the RPA on December 3, 2008. |
In May 2009, the Company sold its closed processing complex and certain inventories in Farmerville, Louisiana, for $72.3 million. The Company recognized a gain of $15.0 million on this transaction that is included inReorganization items, net on its Consolidated Statement of Operations. In June 2009, the Company disposed of its interest in a hog farming joint venture and wrote off outstanding receivables due from that joint venture. The Company recognized a loss on these transactions of $2.8 million that is included inReorganization items, net on its Consolidated Statement of Operations. In July 2009, the Company sold undeveloped land in Camp County, Texas, for $4.9 million. The Company recognized a gain of $3.5 million on this transaction that is included inReorganization items, net on its Consolidated Statement of Operations.
Net cash paid for reorganization items in 2009 totaled $51.7 million. This represented payment of professional fees directly related to the reorganization totaling $25.4 million, payment of DIP Credit Agreement related expenses totaling $11.4 million, severance payments of $8.6 million, payment of facility closure costs totaling $5.6 million and payment of fees associated with the termination of the RPA totaling $0.7 million.
F-225
Table of Contents
For additional information on costs related to (i) the closures of our facilities in Douglas, Georgia; El Dorado, Arkansas; Farmerville, Louisiana; Franconia, Pennsylvania; Dalton, Georgia; Athens, Georgia; and Athens, Alabama, and (ii) severance costs related to the closed distribution center in Houston, Texas, the February 2009 Operations management RIF action, the April 2009 non-production employee RIF action and reduced or consolidated production at various facilities throughout the US, see Note F—Restructuring Activities.
Liabilities subject to compromise refers to both secured and unsecured obligations that will be accounted for under a plan of reorganization. Generally, actions to enforce or otherwise effect payment of pre-Chapter 11 liabilities are stayed. ASC 852 requires pre-petition liabilities that are subject to compromise to be reported at the amounts expected to be allowed, even if they may be settled for lesser amounts. These liabilities represent the estimated amount expected to be allowed on known or potential claims to be resolved through the Chapter 11 process, and remain subject to future adjustments arising from negotiated settlements, actions of the Bankruptcy Court, rejection of executory contracts and unexpired leases, the determination as to the value of collateral securing the claims, proofs of claim, or other events. Liabilities subject to compromise also include certain items that may be assumed under the plan of reorganization, and as such, may be subsequently reclassified to liabilities not subject to compromise. As some uncertainty will continue to exist until the Bankruptcy Court confirms a plan of reorganization, the Company has included its secured and unsecured debt in liabilities subject to compromise. However, should the Proposed Plan be confirmed, these liabilities will not be compromised. At hearings held in December 2008, the Bankruptcy Court granted final approval of many of the Debtors’ “first day” motions covering, among other things, human capital obligations, supplier relations, insurance, customer relations, business operations, certain tax matters, cash management, utilities, case management and retention of professionals. Obligations associated with these matters are not classified as liabilities subject to compromise.
Because the Bankruptcy Court has not confirmed the Proposed Plan or finally determined which claims will be allowed or disallowed and, under the Proposed Plan, the secured and unsecured debt of the Company will not be compromised if the Proposed Plan is confirmed by the Bankruptcy Court, the Company has not adjusted its deferred financing costs related to secured and unsecured debt as a valuation of the allowed claim. Deferred financing costs of $19.1 million are included inOther Assets at September 26, 2009. The Company may be required to expense these amounts or a portion thereof as reorganization items if the Bankruptcy Court ultimately definitively determines that a portion of the debt is not an allowed claim. The Company also expects to expense these amounts in the first quarter of 2010 if it executes the Exit Credit Facility.
The Debtors have rejected certain pre-petition executory contracts and unexpired leases with respect to the Debtors’ operations with the approval of the Bankruptcy Court and may reject additional ones in the future. Damages resulting from rejection of executory contracts and unexpired leases are generally treated as general unsecured claims and will be classified as liabilities subject to compromise. Holders of pre-petition claims were required to file proofs of claims by the “general bar date” of June 1, 2009. A bar date is the date by which certain claims against the Debtors must be filed if the claimants wish to receive any distribution in the Chapter 11 cases. Creditors were notified of the general bar date and the requirement to file a proof of claim with the Bankruptcy Court. Differences between liability amounts estimated by the Debtors and claims filed by creditors are being investigated and, if necessary, the Bankruptcy Court will make a final determination of the allowable amount. Currently, the aggregate amount of claims filed by creditors exceeds the aggregate amount of claims recognized and estimated by
F-226
Table of Contents
the Debtors. Management believes the aggregate amount of claims presently recognized by the Debtors will ultimately not materially vary from the aggregate amount of claims allowed by the Bankruptcy Court. The determination of how liabilities will ultimately be treated cannot be made until the Bankruptcy Court approves a Chapter 11 plan of reorganization. Accordingly, the ultimate amount or treatment of such liabilities is not determinable at this time.
Liabilities subject to compromise consisted of the following:
| (In thousands) | September 26, 2009 | ||
Accounts payable | $ | 85,250 | |
Accrued expenses | 139,319 | ||
Secured long-term debt | 1,347,036 | ||
Unsecured long-term debt | 656,996 | ||
Other long-term liabilities | 4,560 | ||
Total liabilities subject to compromise | $ | 2,233,161 | |
Liabilities subject to compromise includes trade accounts payable related to pre-petition purchases, all of which were not paid. As a result, the Company’s cash flows from operations were favorably affected by the stay of payment related to these accounts payable.
While operating as debtors-in-possession under Chapter 11 of the Bankruptcy Code, the Debtors may sell or otherwise dispose of or liquidate assets or settle liabilities, subject to the approval of the Bankruptcy Court or otherwise as permitted in the ordinary course of business, in amounts other than those reflected in the Consolidated Financial Statements. Moreover, a plan of reorganization could materially change the amounts and classifications in the historical Consolidated Financial Statements.
F-227
Table of Contents
Condensed combined financial information of debtors
The following unaudited condensed combined financial information is presented for the Debtors as of September 26, 2009 or for the year then ended (in thousands):
Balance sheet information: | ||||
Receivables from affiliates | $ | 113,302 | ||
Other current assets | 1,091,354 | |||
Identified intangible assets | 57,179 | |||
Investment in subsidiaries | 325,856 | |||
Property, plant and equipment, net | 1,378,918 | |||
Other assets | 85,744 | |||
Total assets | $ | 3,052,353 | ||
Current liabilities | $ | 401,651 | ||
Long-term liabilities | 254,410 | |||
Liabilities not subject to compromise | 656,061 | |||
Liabilities subject to compromise | 2,233,161 | |||
Total liabilities | 2,889,222 | |||
Stockholders’ equity | 163,131 | |||
Total liabilities and stockholders’ equity | $ | 3,052,353 | ||
Statement of operations information: | ||||
Net sales | $ | 6,454,958 | ||
Gross profit | 306,614 | |||
Operating income | 28,470 | |||
Reorganization items | 84,363 | |||
Income from equity affiliates | 26,879 | |||
Net loss | (151,582 | ) | ||
Statement of cash flows information: | ||||
Cash used in operating activities | $ | 158,798 | ||
Cash used in investing activities | (11,540 | ) | ||
Cash provided by financing activities | (6,250 | ) | ||
Note B—Summary of significant accounting policies
Principles of consolidation
The consolidated financial statements include the accounts of Pilgrim’s Pride Corporation and its majority owned subsidiaries. We eliminate all significant affiliate accounts and transactions upon consolidation.
The Company reports on the basis of a 52/53-week year that ends on the Saturday closest to September 30. As a result, 2009, 2008, and 2007 each had 52 weeks.
The Company re-measures the financial statements of its Mexico subsidiaries as if the US dollar were the functional currency. Accordingly, we translate assets and liabilities, other than non-monetary assets, of the Mexico subsidiaries at current exchange rates. We translate non-monetary assets using the historical exchange rate in effect on the date of each asset’s acquisition. We translate income and expenses at average exchange rates in effect during the
F-228
Table of Contents
period. Currency exchange gains or losses are included in the line itemMiscellaneous, net in the Consolidated Statements of Operations.
Financial Accounting Standards Board (“FASB”) Accounting Standards Codification (“ASC” or “Codification”)
On September 26, 2009, the Company adopted Statement of Financial Accounting Standards No. 168,The FASB Accounting Standards CodificationTMAnd The Hierarchy Of Generally Accepted Accounting Principles. The Codification became the source of authoritative generally accepted accounting principles (“GAAP”) recognized by the FASB to be applied by nongovernmental entities. Rules and interpretive releases of the SEC under authority of federal securities laws are also sources of authoritative GAAP for SEC registrants. The Codification supersedes all existing non-SEC accounting and reporting standards. All other non-grandfathered non-SEC accounting literature not included in the Codification is non-authoritative. GAAP is not intended to be changed as a result of this statement, but will change the way the guidance is organized and presented. The Company has implemented the Codification in the consolidated financial statements by providing references to the ASC topics.
Accounting adjustments and reclassifications
We have made certain reclassifications to the 2008 and 2007 Consolidated Financial Statements with no impact to reported net income (loss) in order to conform to the 2009 presentation.
Revenue recognition
Revenue is recognized upon shipment and transfer of ownership of the product to the customer and is recorded net of estimated incentive offerings including special pricing agreements, promotions and other volume-based incentives. Revisions to these estimates are charged back to net sales in the period in which the facts that give rise to the revision become known.
Shipping and handling costs
Costs associated with the products shipped to customers are recognized in cost of sales.
Cash equivalents
The Company considers highly liquid investments with a maturity of three months or less when purchased to be cash equivalents.
Current and long-term investments
The Company’s current and long-term investments consist primarily of investment-grade debt and equity securities, bond and equity mutual funds, and insurance contracts. The investment-grade debt and equity securities as well as the bond and equity mutual funds are classified as available-for-sale. These securities are recorded at fair value, and unrealized holding gains and losses are recorded, net of tax, as a separate component of accumulated other comprehensive income. Debt securities with remaining maturities of less than one year and those identified by management at the time of purchase for funding operations in less than one year are classified as current. Debt securities with remaining maturities greater than one year that management has not identified at the time of purchase for funding operations in less than one year are classified
F-229
Table of Contents
as long-term. All equity securities are classified as long-term. Unrealized losses are charged against net earnings when a decline in fair value is determined to be other than temporary. Management reviews several factors to determine whether a loss is other than temporary, such as the length of time a security is in an unrealized loss position, the extent to which fair value is less than amortized cost, the impact of changing interest rates in the short and long term, and the Company’s intent and ability to hold the security for a period of time sufficient to allow for any anticipated recovery in fair value. The Company determines the cost of each security sold and each amount reclassified out of accumulated other comprehensive income into earnings using the specific identification method. Purchases and sales are recorded on a trade date basis. The insurance contracts are held in the Company’s deferred compensation trusts. They are recorded at fair value with the gains and losses resulting from changes in fair value immediately recognized in earnings.
Investments in joint ventures and entities in which the Company has an ownership interest greater than 50% and exercises control over the venture are consolidated in the Consolidated Financial Statements. Minority interests in the years presented, amounts of which are not material, are included in the line itemOther Long-Term Liabilities in the Consolidated Balance Sheets. Investments in joint ventures and entities in which the Company has an ownership interest between 20% and 50% and exercises significant influence are accounted for using the equity method. The Company owns a 49% interest in Merit Provisions LLC (“Merit”) that it consolidates because the Company provided financial support to the entity that owns a 51% interest in Merit. The operations of Merit are not significant to the Company as a whole at this time. The Company invests from time to time in ventures in which its ownership interest is less than 20% and over which it does not exercise significant influence. Such investments are accounted for under the cost method. The fair values for investments not traded on a quoted exchange are estimated based upon the historical performance of the ventures, the ventures’ forecasted financial performance and management’s evaluation of the ventures’ viability and business models. To the extent the book value of an investment exceeds its assessed fair value, the Company will record an appropriate impairment charge. Thus, the carrying value of the Company’s investments approximates fair value.
Accounts receivable
The Company records accounts receivable upon shipment and transfer of ownership of its products to customers. We record an allowance for doubtful accounts, reducing our receivables balance to an amount we estimate is collectible from our customers. Estimates used in determining the allowance for doubtful accounts are based on historical collection experience, current trends, aging of accounts receivable, and periodic credit evaluations of our customers’ financial condition. We write off accounts receivable when it becomes apparent, based upon age or customer circumstances, that such amounts will not be collected. Generally, the Company does not require collateral for its accounts receivable.
Inventories
Live poultry inventories are stated at the lower of cost or market and breeder hens at the lower of cost, less accumulated amortization, or market. The costs associated with breeder hens are accumulated up to the production stage and amortized over the productive lives using the unit-of-production method. Finished poultry products, feed, eggs and other inventories are stated at the lower of cost (average) or market.
F-230
Table of Contents
We record valuations and adjustments for our inventory and for estimated obsolescence at or equal to the difference between the cost of inventory and the estimated market value based upon known conditions affecting the inventory’s obsolescence, including significantly aged products, discontinued product lines, or damaged or obsolete products. We allocate meat costs between our various finished poultry products based on a by-product costing technique that reduces the cost of the whole bird by estimated yields and amounts to be recovered for certain by-product parts, primarily including leg quarters, wings, tenders and offal, which are carried in inventory at the estimated recovery amounts, with the remaining amount being reflected as our breast meat cost.
Generally, the Company performs an evaluation of whether any lower-of-cost-or-market adjustments are required at the segment level based on a number of factors, including (i) pools of related inventory, (ii) product age, condition and continuation or discontinuation, (iii) estimated market selling prices and (iv) expected distribution channels. If actual market conditions or other factors are less favorable than those projected by management, additional inventory adjustments may be required.
Property, plant and equipment
Property, plant and equipment are stated at cost, and repair and maintenance costs are expensed as incurred. Depreciation is computed using the straight-line method over the estimated useful lives of these assets. Estimated useful lives for building, machinery and equipment are 5 years to 33 years and for automobiles and trucks are 3 years to 10 years. The charge to income resulting from amortization of assets recorded under capital leases is included with depreciation expense.
The Company recognizes impairment charges on long-lived assets used in operations when events and circumstances indicate that the assets may be impaired and the undiscounted cash flows estimated to be generated by those assets are less than the carrying amount of those assets. The impairment charge is determined based upon the amount the net book value of the assets exceeds their fair market value. In making these determinations, the Company utilizes certain assumptions, including, but not limited to (i) future cash flows estimates expected to be generated by these assets, which are based on additional assumptions such as asset utilization, remaining length of service and estimated salvage values; (ii) estimated fair market value of the assets; and (iii) determinations with respect to the lowest level of cash flows relevant to the respective impairment test, generally groupings of related operational facilities.
Given the interdependency of the Company’s individual facilities during the production process, which operate as a vertically integrated network, and the fact that the Company does not price transfers of inventory between its vertically integrated facilities at market prices, it evaluates impairment of assets held and used at the country level (i.e., the US and Mexico) within each segment. Management believes this is the lowest level of identifiable cash flows for its assets that are held and used in production activities. At the present time, the Company’s forecasts indicate that it can recover the carrying value of its assets based on the projected cash flows of the operations. A key assumption in management’s forecast is that the Company’s sales volumes will return to historical margins as supply and demand between commodities and chicken and other animal-based proteins become more balanced. However, the exact timing of the return to historical margins is not certain, and if the return to historical margins is delayed, impairment charges could become necessary in the future.
F-231
Table of Contents
Goodwill and other intangible assets
Our intangible assets consist of goodwill and assets subject to amortization such as trade names, customer relationships and non-compete agreements. We calculate amortization of those assets that are subject to amortization on a straight-line basis over the estimated useful lives of the related assets. The useful lives range from three years for trade names and non-compete agreements to thirteen years for customer relationships.
We evaluate goodwill for impairment annually or at other times if events have occurred or circumstances exist that indicate the carrying value of goodwill may no longer be recoverable. We compare the fair value of each reporting unit to its carrying value. We determine the fair value using a weighted average of results derived from both the income approach and the market approach. Under the income approach, we calculate the fair value of a reporting unit based on the present value of estimated future cash flows. Under the market approach, we calculate the fair value of a reporting unit based on the market values of key competitors. If the fair value of the reporting unit exceeds the carrying value of the net assets including goodwill assigned to that unit, goodwill is not impaired. If the carrying value of the reporting unit’s net assets including goodwill exceeds the fair value of the reporting unit, then we determine the implied fair value of the reporting unit’s goodwill. If the carrying value of a reporting unit’s goodwill exceeds its implied fair value, then an impairment of goodwill has occurred and we recognize an impairment loss for the difference between the carrying amount and the implied fair value of goodwill as a component of operating income.
We review intangible assets subject to amortization for impairment whenever an event or change in circumstances indicates the carrying values of the assets may not be recoverable. We test intangible assets subject to amortization for impairment and estimate their fair values using the same assumptions and techniques we employ on property, plant and equipment.
Litigation and contingent liabilities
The Company is subject to lawsuits, investigations and other claims related to employment, environmental, product, and other matters. The Company is required to assess the likelihood of any adverse judgments or outcomes, as well as potential ranges of probable losses, to these matters. The Company estimates the amount of reserves required, including anticipated cost of defense, if any, for these contingencies when losses are determined to be probable and after considerable analysis of each individual issue. With respect to our environmental remediation obligations, the accrual for environmental remediation liabilities is measured on an undiscounted basis. These reserves may change in the future due to changes in the Company’s assumptions, the effectiveness of strategies, or other factors beyond the Company’s control.
Accrued self insurance
Insurance expense for casualty claims and employee-related health care benefits are estimated using historical and current experience and actuarial estimates. Stop-loss coverage is maintained with third-party insurers to limit the Company’s total exposure. Certain categories of claim liabilities are actuarially determined. The assumption used to arrive at periodic expenses is reviewed regularly by management. However, actual expenses could differ from these estimates and could result in adjustments to be recognized.
F-232
Table of Contents
Income taxes
The provision for income taxes has been determined using the asset and liability approach of accounting for income taxes. Under this approach, deferred income taxes reflect the net tax effect of temporary differences between the book and tax bases of recorded assets and liabilities, net operating losses and tax credit carry forwards. The amount of deferred tax on these temporary differences is determined using the tax rates expected to apply to the period when the asset is realized or the liability is settled, as applicable, based on the tax rates and laws in the respective tax jurisdiction enacted as of the balance sheet date.
The Company reviews its deferred tax assets for recoverability and establishes a valuation allowance based on historical taxable income, potential for carry back of tax losses, projected future taxable income, applicable tax strategies, and the expected timing of the reversals of existing temporary differences. A valuation allowance is provided when it is more likely than not that some or all of the deferred tax assets will not be realized. Valuation allowances have been established primarily for US federal and state net operating loss carry forwards and Mexico net operating loss carry forwards. See Note N—Income Taxes to the Consolidated Financial Statements.
Taxes are provided for foreign subsidiaries based on the assumption that their earnings will be indefinitely reinvested. As such, US deferred income taxes have not been provided on these earnings. If such earnings were not considered indefinitely reinvested, certain deferred foreign and US income taxes would be provided.
On September 30, 2007, the Company adopted guidance under ASC 740 that provides a recognition threshold and measurement criteria for the financial statement recognition of a tax benefit taken or expected to be taken in a tax return. Tax benefits are recognized only when it is more likely than not, based on the technical merits, that the benefits will be sustained on examination. Tax benefits that meet the more-likely-than-not recognition threshold are measured using a probability weighting of the largest amount of tax benefit that is greater than 50% likely of being realized upon settlement. Whether the more-likely-than-not recognition threshold is met for a particular tax benefit is a matter of judgment based on the individual facts and circumstances evaluated in light of all available evidence as of the balance sheet date. See Note N—Income Taxes to the Consolidated Financial Statements.
Pension and other postretirement benefits
Our pension and other postretirement benefit costs and obligations are dependent on the various actuarial assumptions used in calculating such amounts. These assumptions relate to discount rates, salary growth, long-term return on plan assets, health care cost trend rates and other factors. We base the discount rate assumptions on current investment yields on high-quality corporate long-term bonds. The salary growth assumptions reflect our long-term actual experience and future or near-term outlook. We determine the long-term return on plan assets based on historical portfolio results and management’s expectation of the future economic environment. Our health care cost trend assumptions are developed based on historical cost data, the near-term outlook and an assessment of likely long-term trends. Actual results that differ from our assumptions are accumulated and, if in excess of the lesser of 10% of the projected benefit obligation or the fair market value of plan assets, amortized over the estimated future working life of the plan participants.
F-233
Table of Contents
Operating leases
Rent expense for operating leases is recorded on a straight-line basis over the lease term unless the lease contains an escalation clause which is not fixed and determinable. The lease term begins when we have the right to control the use of the leased property, which is typically before rent payments are due under the terms of the lease. If a lease has a fixed and determinable escalation clause, the difference between rent expense and rent paid is recorded as deferred rent and is included in the Consolidated Balance Sheets. Rent for operating leases that do not have an escalation clause or where escalation is based on an inflation index is expensed over the lease term as it is payable.
Derivative financial instruments
The Company has historically attempted to mitigate certain financial exposures, including commodity purchase exposures and interest rate risk, through a program of risk management that included the use of derivative financial instruments. We recognize all derivative financial instruments in the Consolidated Balance Sheets at fair value. At September 27, 2008, the Company recorded a liability for futures contracts with an aggregate fair value of $18.0 million executed to manage the price risk on 19.1 million bushels of corn and 0.3 million tons of soybean meal. We discontinued the use of derivative financial instruments in October 2008.
We elected not to designate derivative financial instruments executed to mitigate commodity purchase exposures as hedges of forecasted transactions or of the variability of cash flows to be received or paid related to recognized assets or liabilities (“cash flow hedges”). Therefore, we recognized changes in the fair value of these derivative financial instruments immediately in earnings. Gains or losses related to these derivative financial instruments are included in the line itemCost of sales in the Consolidated Statements of Operations. The Company recognized $21.1 million and $38.3 million in losses related to changes in the fair value of its derivative financial instruments during 2009 and 2008, respectively.
Net income (loss) per common share
Net income (loss) per common share is based on the weighted average number of shares of common stock outstanding during the year. The weighted average number of shares outstanding (basic and diluted) included herein were 74,055,733, 69,337,326 and 66,555,733 shares in 2009, 2008 and 2007, respectively. The Company did not include any common stock equivalents in the fully diluted computation for 2009; the common stock equivalents would have been antidilutive because of the Company’s net loss in that year. The Company did not have any common stock equivalents in 2008 or 2007.
Use of estimates
The preparation of financial statements in conformity with accounting principles generally accepted in the US requires management to make estimates and assumptions that affect the reported amounts of assets and liabilities and disclosure of contingent assets and liabilities at the date of the financial statements and the reported amounts of revenues and expenses during the reporting period. Actual results could differ from those estimates. We make significant estimates in regard to receivables collectability; inventory valuation; realization of deferred tax assets; valuation of long-lived assets, including goodwill; valuation of contingent liabilities, liabilities subject to compromise and self insurance liabilities; valuation of pension and other postretirement benefits obligations; and valuation of acquired businesses.
F-234
Table of Contents
Subsequent events
The Company has evaluated subsequent events through the issuance of these financial statements, which occurred on November 20, 2009.
Recently adopted accounting pronouncements
On September 28, 2008, the Company adopted guidance under ASC 820-10 for financial assets and liabilities and nonfinancial assets and liabilities that are recognized or disclosed at fair value in the financial statements on a recurring basis. The Company will not adopt the subject guidance under ASC 820-10 until September 27, 2009 for nonfinancial assets and liabilities that are not recognized or disclosed at fair value in the financial statements on a recurring basis. The subject guidance under ASC 820-10 clarifies the definition of fair value and the methods used to measure fair value. It also expands disclosures about fair value measurements. The adoption of the subject guidance under ASC 820-10 did not have a material impact on the Company’s consolidated financial statements. See Note G—Financial Instruments for expanded disclosures about the fair value measurements used for the Company’s financial assets and liabilities and nonfinancial assets and liabilities that are recognized or disclosed at fair value in the financial statements on a recurring basis.
Effective March 29, 2009, the Company adopted guidance under ASC 855-10 that establishes general standards of accounting for and disclosure of events that occur after the balance sheet date but before financial statements are issued or are available to be issued. The adoption of the subject guidance under ASC 855-10 did not have a material impact on the Company’s consolidated financial statements. See “Subsequent Events” above for additional information regarding the subsequent events date used for this report.
Accounting pronouncements issued but not yet adopted
In December 2007, the FASB issued guidance under ASC 805 that establishes principles and requirements for how the acquirer (i) recognizes and measures in its financial statements the identifiable assets acquired, the liabilities assumed, and any noncontrolling interest in the acquiree, (ii) recognizes and measures the goodwill acquired in the business combination or a gain from a bargain purchase, and (iii) determines what information to disclose to enable users of the financial statements to evaluate the nature and financial effects of the business combination. It also requires an acquirer to recognize as expense most transaction and restructuring costs as incurred, rather than include such items in the cost of the acquired entity. For the Company, the subject guidance under ASC 805 will apply prospectively to business combinations for which the acquisition date is on or after September 27, 2009. The Company will evaluate the impact of the subject guidance under ASC 805 on any potential future business combinations that may occur on or after the effective date.
In December 2007, the FASB issued guidance under ASC 810-10 that establishes standards for how a reporting entity (i) identifies, labels and presents in its consolidated statement of financial position the ownership interests in subsidiaries held by parties other than itself, (ii) identifies and presents on the face of its consolidated statement of operations the amount of consolidated net income attributable to itself and to the noncontrolling interest, (iii) accounts for changes in its ownership interest while it retains a controlling financial interest in a subsidiary, (iv) initially measures any retained noncontrolling equity investment in a subsidiary that is deconsolidated, and (v) discloses other information about its interests and the interests of the noncontrolling
F-235
Table of Contents
owners. For the Company, the subject guidance under ASC 810-10 will apply prospectively effective September 27, 2009. The Company should also apply retroactively the presentation and disclosure requirements of the subject guidance under ASC 810-10 for all periods presented at that time. The Company does not expect the adoption of the subject guidance under ASC 810-10 will have a material impact on its consolidated financial statements.
In April 2008, the FASB issued guidance under both ASC 275-10 and ASC 350-30 that amends the factors an entity should consider in developing renewal or extension assumptions used in determining the useful life of recognized intangible assets. For the Company, the subject guidance under ASC 275-10 and ASC 350-30 will apply prospectively to intangible assets acquired on or after September 27, 2009. The Company does not expect the adoption of the subject guidance under ASC 275-10 or ASC 350-30 will have a material impact on its consolidated financial statements.
In December 2008, the FASB issued guidance under ASC 715-20 that provides guidance on an employer’s disclosures about plan assets of a defined benefit pension or other postretirement plan, including disclosures about investment policies and strategies, categories of plan assets, fair value measurements of plan assets and significant concentrations of risk. For the Company, the subject guidance under ASC 715-20 will apply to the Company’s postretirement benefit plan assets effective September 27, 2009. The Company does not expect the adoption of the subject guidance under ASC 715-20 will have a material impact on its consolidated financial statements.
Note C—Market risks and concentrations
The Company’s financial instruments that are exposed to concentrations of credit risk consist primarily of cash equivalents, investment securities and trade accounts receivable. The Company’s cash equivalents and investment securities are high-quality debt and equity securities placed with major banks and financial institutions. The Company’s trade accounts receivable are generally unsecured. Credit evaluations are performed on all significant customers and updated as circumstances dictate. Concentrations of credit risk with respect to trade accounts receivable are limited due to the large number of customers and their dispersion across geographic areas. With the exception of one customer that accounts for approximately 13% of trade accounts and other receivables at September 26, 2009, and approximately 12% of net sales for 2009 primarily related to our chicken segment, the Company does not believe it has significant concentrations of credit risk in its trade accounts receivable.
At September 26, 2009, approximately 31% of the Company’s employees were covered under collective bargaining agreements. Approximately 254 employees covered under collective bargaining agreements are covered under agreements that expired in 2009 and have yet to be renegotiated or will expire in 2010. We have not experienced any work stoppage at any location in over five years. We believe our relations with our employees are satisfactory. At any given time, we will be in some stage of contract negotiation with various collective bargaining units.
Note D—Business acquisition
On December 27, 2006, we acquired 45,343,812 shares, representing 88.9% of shares outstanding, of Gold Kist Inc. (“Gold Kist”) common stock through a tender offer. We subsequently acquired all remaining Gold Kist shares and, on January 9, 2007, Gold Kist became a wholly owned subsidiary of the Company. Gold Kist, based in Atlanta, Georgia, was the third largest chicken company in the United States, accounting for more than nine percent of chicken
F-236
Table of Contents
produced in the United States in recent years. Gold Kist operated a fully-integrated chicken production business that included live production, processing, marketing and distribution.
For financial reporting purposes, we have not included the operating results and cash flows of Gold Kist in our consolidated financial statements for the period from December 27, 2006, through December 30, 2006. The operating results and cash flows of Gold Kist from December 27, 2006, through December 30, 2006 were not material. We have included the acquired assets and assumed liabilities in our balance sheet using an allocation of the purchase price based on an appraisal received from a third-party valuation specialist.
The following summarizes the purchase price for Gold Kist at December 27, 2006 (in thousands):
Purchase of 50,146,368 shares at $21.00 per share | $ | 1,053,074 | |
Premium paid on retirement of debt | 22,208 | ||
Retirement of share-based compensation awards | 25,677 | ||
Transaction costs and fees | 37,740 | ||
Total purchase price | $ | 1,138,699 | |
We retired the Gold Kist 10 1/4% Senior Notes due 2014 with a book value of $128.5 million at a cost of $149.8 million plus accrued interest and the Gold Kist Subordinated Capital Certificates of Interest at par plus accrued interest and a premium of one year’s interest. We also paid acquisition transaction costs and funded change in control payments to certain Gold Kist employees. This acquisition was initially funded by (i) $780.0 million borrowed under our revolving-term secured credit facility and (ii) $450.0 million borrowed under our $450.0 million Senior Unsecured Term Loan Agreement (“Bridge Loan”). For additional information, see Note M—Short-Term Notes Payable and Long-Term Debt.
In connection with the acquisition, we elected to freeze certain of the Gold Kist benefit plans with the intent to ultimately terminate them. We recorded a purchase price adjustment of $65.6 million to increase the benefit plans liability to the $82.5 million estimated cost of these plan terminations. We do not anticipate any material net periodic benefit costs (income) related to these plans in the future. Additionally, we conformed Gold Kist’s accounting policies to our accounting policies and provided for deferred income taxes on all related purchase adjustments.
The following summarizes our estimates of the fair value of the assets acquired and liabilities assumed at the date of acquisition (in thousands):
Current assets | $ | 418,583 | |
Property, plant and equipment | 674,444 | ||
Goodwill | 499,669 | ||
Intangible assets | 64,500 | ||
Other assets | 65,597 | ||
Total assets acquired | 1,722,793 | ||
Current liabilities | 269,619 | ||
Long-term debt, less current maturities | 140,674 | ||
Deferred income taxes | 93,509 | ||
Other long-term liabilities | 80,292 | ||
Total liabilities assumed | 584,094 | ||
Total purchase price | $ | 1,138,699 | |
F-237
Table of Contents
Goodwill and other intangible assets reflected above were determined to meet the criteria for recognition apart from tangible assets acquired and liabilities assumed. Intangible assets related to the acquisition consisted of the following at December 27, 2006:
| Estimated fair value | Amortization period | ||||
| (In millions) | (In years) | ||||
Intangible assets subject to amortization: | |||||
Customer relationships | $ | 51,000 | 13.0 | ||
Trade name | 13,200 | 3.0 | |||
Non-compete agreements | 300 | 3.0 | |||
Total intangible assets subject to amortization | 64,500 | ||||
Goodwill | 499,669 | ||||
Total intangible assets | $ | 564,169 | |||
Weighted average amortization period | 10.9 | ||||
Goodwill, which was recognized in the Company’s chicken segment, represented the purchase price in excess of the value assigned to identifiable tangible and intangible assets. We elected to acquire Gold Kist at a price that resulted in the recognition of goodwill because we believed the following strategic and financial benefits were present:
| • | The combined company would be positioned as the world’s leading chicken producer and that position would provide us with enhanced abilities to (i) compete more efficiently and provide even better customer service, (ii) expand our geographic reach and customer base, (iii) further pursue value-added and prepared chicken opportunities and (iv) offer long-term growth opportunities for our stockholders, employees, and growers. |
| • | The combined company would be better positioned to compete in the industry both internationally and in the US as additional consolidation occurred. |
As discussed in Note J—Intangible Assets, because of the deterioration in the chicken industry subsequent to the acquisition, the Company determined that this goodwill was fully impaired at September 27, 2008.
The amortizable intangible assets were determined by us to have finite lives. The useful life for the customer relationships intangible asset we recognized was based on our forecasts of customer turnover. The useful life for the trade name intangible asset we recognized was based on the estimated length of our use of the Gold Kist trade name while it is phased out and replaced with the Pilgrim’s Pride trade name. The useful life of the non-compete agreements intangible asset we recognized was based on the remaining life of the agreements. We amortize these intangible assets over their remaining useful lives on a straight-line basis. Annual amortization expense for these intangible assets was $8.4 million, $8.4 million and $6.3 million in 2009, 2008 and 2007, respectively. We expect to recognize annual amortization expense of $5.1 million in 2010, $3.9 million in each year from 2011 through 2019, and $1.0 million in 2020.
F-238
Table of Contents
The following unaudited pro forma financial information has been presented as if the acquisition had occurred at the beginning of each period presented (in thousands, except shares and per share data):
2007 Pro forma | |||
Net sales | $ | 8,026,422 | |
Depreciation and amortization | $ | 228,539 | |
Operating income (loss) | $ | 206,640 | |
Interest expense, net | $ | 144,354 | |
Income (loss) from continuing operations before taxes | $ | 43,900 | |
Income (loss) from continuing operations | $ | 17,331 | |
Net income (loss) | $ | 12,832 | |
Income (loss) from continuing operations per common share | $ | 0.26 | |
Net income (loss) per common share | $ | 0.19 | |
Weighted average shares outstanding | 66,555,733 | ||
Note E—Discontinued business
The Company sold certain assets of its turkey business for $18.6 million and recorded a gain of $1.5 million ($0.9 million, net of tax) during the second quarter of 2008. This business was composed of substantially our entire former turkey segment. The results of this business are included in the line itemIncome from operation of discontinued business, net of tax in the Consolidated Statements of Operations for all periods presented.
For a period of time, we continued to generate operating results and cash flows associated with our discontinued turkey business. These activities were transitional in nature. We entered into a short-term co-pack agreement with the acquirer of the discontinued turkey business under which they processed turkeys for sale to our customers through the end of 2008. We had no remaining turkey inventories as of September 26, 2009, and did not recognize operating results related to our discontinued turkey business after the second quarter of 2009.
Neither our continued involvement in the distribution and sale of these turkeys or the co-pack agreement conferred upon us the ability to influence the operating and/or financial policies of the turkey business under its new ownership.
No debt was assumed by the acquirer of the discontinued turkey business or required to be repaid as a result of the disposal transaction. We elected to allocate to the discontinued turkey operation other consolidated interest that was not directly attributable to or related to other operations of the Company based on the ratio of net assets to be sold or discontinued to the sum of the total net assets of the Company plus consolidated debt. Interest allocated to the discontinued business totaled $1.4 million and $2.6 million in 2008 and 2007, respectively. We did not allocate interest to the discontinued business in 2009.
F-239
Table of Contents
The following amounts related to our turkey business have been segregated from continuing operations and included in the line itemsIncome (loss) from operation of discontinued business, net of tax andGain on sale of discontinued business, net of tax in the Consolidated Statements of Operations:
| (In thousands) | 2009 | 2008 | 2007 | ||||||||
Net sales | $ | 25,788 | $ | 86,261 | $ | 99,987 | |||||
Income (loss) from operation of discontinued business before income taxes | $ | 962 | $ | (11,746 | ) | $ | (7,228 | ) | |||
Income tax expense (benefit) | 363 | (4,434 | ) | (2,729 | ) | ||||||
Income (loss) from operation of discontinued business, net of tax | $ | 599 | $ | (7,312 | ) | $ | (4,499 | ) | |||
Gain on sale of discontinued business before income taxes | $ | — | $ | 1,450 | $ | — | |||||
Income tax expense | — | 547 | — | ||||||||
Gain on sale of discontinued business, net of tax | $ | — | $ | 903 | $ | — | |||||
There are no assets or liabilities related to our discontinued turkey business as of September 26, 2009. The following assets and liabilities related to our discontinued turkey business have been segregated and included in the line itemsAssets of discontinued business andLiabilities of discontinued business, as appropriate, in the Consolidated Balance Sheets as of September 27, 2008 (in thousands):
Trade accounts and other receivables, less allowance for doubtful accounts | $ | 5,881 | |
Inventories | 27,638 | ||
Assets of discontinued business | $ | 33,519 | |
Accounts payable | $ | 7,737 | |
Accrued expenses | 3,046 | ||
Liabilities of discontinued business | $ | 10,783 | |
Note F—Restructuring activities
In 2008 and 2009, the Company completed the following restructuring activities:
| • | Closed processing facilities or complexes in Dalton, Georgia; Douglas, Georgia; El Dorado, Arkansas; Franconia, Pennsylvania; Clinton, Arkansas; Bossier City, Louisiana; and Siler City, North Carolina, |
| • | Sold a closed processing complex in Farmerville, Louisiana, |
| • | Announced the October 2009 closures of processing facilities in Athens, Alabama, and Athens, Georgia, |
| • | Sold closed distribution centers in Cincinnati, Ohio; Plant City, Florida; El Paso, Texas, and Pompano Beach, Florida, |
| • | Closed distribution centers in Houston, Texas; Oskaloosa, Iowa; Jackson, Mississippi, and Nashville, Tennessee, |
F-240
Table of Contents
| • | Reduced its workforce by approximately 440 non-production positions, including the resignations of the former Chief Executive Officer and former Chief Operating Officer, |
| • | Closed an administrative office building in Duluth, Georgia, in June 2008, and |
| • | Reduced or consolidated production at various other facilities throughout the US. |
Significant actions that occurred from the second quarter of 2009 through the fourth quarter of 2009 were approved by the Bankruptcy Court, when required under the Bankruptcy Code, as part of the Company’s reorganization efforts. Significant actions that occurred from the second quarter of 2008 through the first quarter of 2009 were approved by the Company’s Board of Directors as part of a plan intended to curtail losses amid record-high costs for corn, soybean meal and other feed ingredients and an oversupply of chicken in the US. These actions began in March 2008 and were completed in June 2009. These restructuring activities eliminated approximately 10,500 positions.
Results of operations for 2009 and 2008 included restructuring charges totaling $30.5 million and $16.2 million, respectively, related to these actions. All of these restructuring charges, with the exception of certain lease continuation costs, have resulted in cash expenditures or will result in cash expenditures within one year. Results of operations for 2009 also included adjustments totaling $9.2 million that reduced the accrued costs. These adjustments included the elimination of accrued severance costs in excess of actual severance costs incurred during 2009, the assumption of the Duluth, Georgia, lease obligation by an outside party during the second quarter of 2009, the elimination of accrued other restructuring costs in excess of actual other restructuring costs incurred for several of the 2008 restructuring actions during the second quarter of 2009 and the elimination of accrued other restructuring costs in excess of actual other restructuring costs incurred for the Douglas, Georgia, reorganization action during the third quarter of 2009.
The following table sets forth restructuring activity that occurred during 2008 and 2009:
| (In thousands) | Accrued lease | Accrued severance and employee retention | Accrued other restructuring costs | Restructuring inventory reserves | Total | |||||||||||||||
September 29, 2007 | $ | — | $ | — | $ | — | $ | — | $ | — | ||||||||||
Accruals | 4,778 | 4,000 | 7,378 | 2,021 | 18,177 | |||||||||||||||
Payment / Disposal | (312 | ) | (1,306 | ) | (1,727 | ) | (806 | ) | (4,151 | ) | ||||||||||
Adjustments | — | — | — | (3 | ) | (3 | ) | |||||||||||||
September 27, 2008 | 4,466 | 2,694 | 5,651 | 1,212 | 14,023 | |||||||||||||||
Accruals | — | 17,830 | 7,667 | 5,029 | 30,526 | |||||||||||||||
Payment / Disposal | (622 | ) | (12,876 | ) | (2,753 | ) | (4,775 | ) | (21,026 | ) | ||||||||||
Adjustments | (2,202 | ) | (4,305 | ) | (2,454 | ) | (212 | ) | (9,173 | ) | ||||||||||
September 26, 2009 | $ | 1,642 | $ | 3,343 | $ | 8,111 | $ | 1,254 | $ | 14,350 | ||||||||||
Costs incurred in the second, third and fourth quarters of 2009 were primarily classified as reorganization items. Consistent with the Company’s previous practice and because management believes costs incurred in 2008 and the first quarter of 2009 were related to ceasing production at previously announced facilities and not directly related to the Company’s ongoing production, they are classified as a component of operating income (loss) below gross profit.
F-241
Table of Contents
The Company recognized losses totaling $12.5 million in 2009 related to sales of unneeded broiler eggs and live flock depletion. In 2008, the Company recognized losses totaling $13.9 million related to sales of unneeded broiler eggs. These losses were recognized as components of gross profit (loss).
The Company recognized impairment charges totaling $5.4 million in 2009 to reduce the carrying amounts of certain property, plant and equipment located at a facility closed in 2009 to their estimated fair values. These costs were classified as reorganization items. The Company recognized impairment charges totaling $13.1 million in 2008 to reduce the carrying amounts of certain property, plant, equipment and other assets located at or related to facilities closed in 2008 to their estimated fair values. Consistent with our previous practice and because management believes the realization of the carrying amounts of the affected assets was directly related to the Company’s production activities, the charges were reported as a component of gross profit (loss).
We continue to review and evaluate various restructuring and other alternatives to streamline our operations, improve efficiencies and reduce costs. Such initiatives may include selling assets, idling facilities, consolidating operations and functions, relocating or reducing production and voluntary and involuntary employee separation programs. Any such actions may require us to obtain the pre-approval of our lenders under our DIP Credit Agreement and the Bankruptcy Court. In addition, such actions will subject the Company to additional short-term costs, which may include facility shutdown costs, asset impairment charges, lease commitment costs, employee retention and severance costs and other closing costs.
Note G—financial instruments
The asset (liability) amounts recorded in the Consolidated Balance Sheet (carrying amounts) and the estimated fair values of financial instruments at September 26, 2009, consisted of the following:
| (In thousands) | Carrying amount | Fair value | Reference | |||||||
Cash and cash equivalents | $ | 220,029 | $ | 220,029 | ||||||
Trade accounts and other receivables | 316,953 | 316,953 | Note H | |||||||
Investments in available-for-sale securities | 62,616 | 62,616 | ||||||||
Long-term restricted cash and cash equivalents(a) | 10,072 | 10,072 | ||||||||
Accounts payable and accrued expenses | (491,432 | ) | (491,432 | ) | Note L | |||||
Public debt obligations | (656,996 | ) | (717,206 | ) | Note M | |||||
Non-public credit facilities | (1,388,098 | ) | (b) | Note M | ||||||
| (a) | Long-term restricted cash and cash equivalents collateralize self-insurance obligations and are included inOther assets on the Consolidated Balance Sheet. |
| (b) | Management expects that the fair value of our non-public credit facilities has decreased below the aggregate face value of those facilities, but cannot reliably estimate the aggregate fair value at this time as a result of our Chapter 11 bankruptcy filing. |
The carrying amounts of our cash and cash equivalents, restricted cash and cash equivalents, accounts receivable, accounts payable and certain other liabilities approximate their fair values due to their relatively short maturities. The Company adjusts its investments to fair value based on quoted market prices in active markets for identical investments, quoted market prices in active markets for similar investments with inputs that are observable for the subject investment or unobservable inputs such as discounted cash flow models or valuations.
F-242
Table of Contents
The following is a summary of our cash equivalents and current and long-term investments in available-for-sale securities:
| September 26, 2009 | September 27, 2008 | |||||||||||
| (In thousands) | Amortized cost | Fair value | Amortized cost | Fair value | ||||||||
Cash equivalents: | ||||||||||||
Fixed income securities | $ | 3,414 | $ | 3,562 | $ | — | $ | — | ||||
Equity securities | 11 | 11 | 12 | 12 | ||||||||
Other | 35,617 | 35,617 | 36,912 | 36,912 | ||||||||
Current investments: | ||||||||||||
Fixed income securities | $ | 5,174 | $ | 5,302 | $ | 9,798 | $ | 9,835 | ||||
Other | — | — | 604 | 604 | ||||||||
Long-term investments: | ||||||||||||
Fixed income securities | $ | 46,843 | $ | 49,477 | $ | 44,041 | $ | 44,882 | ||||
Equity securities | 6,595 | 6,769 | 10,986 | 9,775 | ||||||||
Other | 1,300 | 1,068 | 1,300 | 1,197 | ||||||||
Maturities for the Company’s investments in fixed income securities as of September 26, 2009, were as follows:
| (In thousands) | Fair value | Percent | |||
Matures in less than one year | $ | 8,864 | 15.1% | ||
Matures between one and two years | 12,473 | 21.4% | |||
Matures between two and five years | 33,808 | 58.0% | |||
Matures in excess of five years | 3,196 | 5.5% | |||
| $ | 58,341 | 100.0% | |||
The cost of each security sold and the amount reclassified out of accumulated other comprehensive income into earnings is determined on a specific identification basis.
The Company and certain retirement plans that it sponsors invest in a variety of financial instruments. In response to the continued turbulence in global financial markets, we have analyzed our portfolios of investments and, to the best of our knowledge, none of our investments, including money market funds units, commercial paper and municipal securities, have been downgraded because of this turbulence, and neither we nor any fund in which we participate hold significant amounts of structured investment vehicles, auction rate securities, collateralized debt obligations, credit derivatives, hedge funds investments, fund of funds investments or perpetual preferred securities. Certain postretirement funds in which the Company participates hold significant amounts of mortgage-backed securities. However, none of the mortgages collateralizing these securities are considered subprime.
Certain investments are held in trust as compensating balance arrangements for our insurance liability and are classified as long-term based on a maturity date greater than one year from the balance sheet date and management’s intention not to use such assets in the next twelve months.
Effective September 28, 2008, the Company adopted guidance under ASC 815 that establishes a framework for measuring fair value and required enhanced disclosures about fair value
F-243
Table of Contents
measurements. The subject guidance under ASC 815 clarifies that fair value is an exit price, representing the amount that would be received to sell an asset or paid to transfer a liability in an orderly transaction between market participants. The subject guidance under ASC 815 also requires disclosure about how fair value was determined for assets and liabilities and established a hierarchy for which these assets and liabilities must be grouped, based on significant levels of inputs as follows:
| Level 1 | Quoted prices in active markets for identical assets or liabilities; | |
| Level 2 | Quoted prices in active markets for similar assets and liabilities and inputs that are observable for the asset or liability; or | |
| Level 3 | Unobservable inputs, such as discounted cash flow models or valuations. | |
The determination of where assets and liabilities fall within this hierarchy is based upon the lowest level of input that is significant to the fair value measurement.
As of September 26, 2009, the Company held certain items that are required to be measured at fair value on a recurring basis. These included cash and cash equivalents, short-term investments in available-for-sale securities and long-term investments in available-for-sale securities. Cash equivalents consist of short-term, highly liquid, income-producing investments such as money market funds and other funds that have maturities of 90 days or less which are traded in active markets. Short-term investments in available-for-sale securities consist of short-term, highly liquid, income-producing investments such as municipal debt securities that have maturities of greater than 90 days but less than one year. Long-term investments in available-for-sale securities consist of income-producing investments such as municipal debt securities, corporate debt securities, equity securities and fund-of-funds units that have maturities of greater than one year.
The following items are measured at fair value on a recurring basis at September 26, 2009:
| (In thousands) | Level 1 | Level 2 | Level 3 | Total | ||||||||
Cash equivalents | $ | 33,063 | $ | 6,127 | $ | — | $ | 39,190 | ||||
Short-term investments in available-for-sale securities | — | 5,302 | — | 5,302 | ||||||||
Long-term investments in available-for-sale securities | 6,769 | 49,477 | 1,068 | 57,314 | ||||||||
Long-term restricted cash and cash equivalents | 10,072 | — | — | 10,072 | ||||||||
The following table presents the Company’s activity for assets measured at fair value on a recurring basis using significant unobservable (Level 3) inputs for 2009:
| (In thousands) | Fund of funds | Auction rate securities | Total | |||||||||
Balance at September 27, 2008 | $ | 1,197 | $ | 3,850 | $ | 5,047 | ||||||
Sale of securities | — | (3,850 | ) | (3,850 | ) | |||||||
Included in other comprehensive income | (129 | ) | — | (129 | ) | |||||||
Balance at September 26, 2009 | $ | 1,068 | $ | — | $ | 1,068 | ||||||
F-244
Table of Contents
Note H—Trade accounts and other receivables
Trade accounts and other receivables, less allowance for doubtful accounts, consisted of the following:
| (In thousands) | September 26, 2009 | September 27, 2008 | ||||||
Trade accounts receivable | $ | 307,523 | $ | 135,003 | ||||
Other receivables | 14,245 | 13,854 | ||||||
| 321,768 | 148,857 | |||||||
Allowance for doubtful accounts | (4,815 | ) | (4,701 | ) | ||||
Receivables, net | $ | 316,953 | $ | 144,156 | ||||
In connection with the RPA, the Company sold, on a revolving basis, certain of its trade receivables to a special purpose entity (“SPE”) wholly owned by the Company, which in turn sold a percentage ownership interest to third parties. The SPE was a separate corporate entity and its assets were available first and foremost to satisfy the claims of its creditors. The outstanding amount of trade receivables sold at September 27, 2008, was $236.3 million. The gross proceeds resulting from the sales were included in cash flows from operating activities in the Consolidated Statements of Cash Flows. On December 3, 2008, the RPA was terminated and all receivables thereunder were repurchased with proceeds of borrowings under the DIP Credit Agreement. The loss recognized on the sold receivables during 2009 and 2008 was not material.
Note I—Inventories
Inventories consisted of the following:
| (In thousands) | September 27, 2008 | September 27, 2008 | ||||
Chicken: | ||||||
Live chicken and hens | $ | 287,858 | $ | 385,511 | ||
Feed and eggs | 206,137 | 265,959 | ||||
Finished chicken products | 249,732 | 365,123 | ||||
Total chicken inventories | 743,727 | 1,016,593 | ||||
Other products: | ||||||
Commercial feed, table eggs, retail farm store and other | $ | 16,927 | $ | 13,358 | ||
Distribution inventories (other than chicken products) | 3,215 | 6,212 | ||||
Total other products inventories | 20,142 | 19,570 | ||||
Total inventories | $ | 763,869 | $ | 1,036,163 | ||
Inventories did not include a lower-of-cost-or-market allowance at September 26, 2009. Inventories included a lower-of-cost-or-market allowance of $26.6 million at September 27, 2008. The loss recognized on the application of the rule of lower-of-cost-or-market valuation in 2008 was also $26.6 million.
F-245
Table of Contents
Note J—Intangible assets
Identified intangible assets
Identified intangible assets consisted of the following:
| (In thousands) | Useful life (years) | Original cost | Accumulated amortization | Carrying amount | ||||||||
September 26, 2009: | ||||||||||||
Trade names | 3–15 | $ | 39,271 | $ | (22,328 | ) | $ | 16,943 | ||||
Customer relationships | 13 | 51,000 | (10,789 | ) | 40,211 | |||||||
Non-compete agreements | 3 | 300 | (275 | ) | 25 | |||||||
Total intangible assets | $ | 90,571 | $ | (33,392 | ) | $ | 57,179 | |||||
September 27, 2008: | ||||||||||||
Trade names | $ | 39,271 | $ | (16,168 | ) | $ | 23,103 | |||||
Customer relationships | 51,000 | (6,865 | ) | 44,135 | ||||||||
Non-compete agreements | 300 | (175 | ) | 125 | ||||||||
Total identified intangible assets | $ | 90,571 | $ | (23,208 | ) | $ | 67,363 | |||||
We recognized amortization expense of $10.2 million, $10.2 million and $8.1 million in 2009, 2008 and 2007, respectively.
We expect to recognize amortization expense associated with identified intangible assets of $6.8 million in 2010 and $5.7 million in each year from 2011 through 2014.
Goodwill
The Company evaluated goodwill as of September 27, 2008, because of the significant deterioration in the operating environment during the fourth quarter of 2008. The Company’s impairment test resulted in a noncash, pretax impairment charge of $501.4 million ($7.40 per share) related to a write-down of the goodwill reported in the Chicken segment. The goodwill was primarily related to the 2007 acquisition of Gold Kist. The charge is not tax deductible because the acquisition of Gold Kist was structured as a tax-free stock transaction. The impairment charge is included in the line itemGoodwill impairment in the Consolidated Statement of Operations for the year ended September 27, 2008.
Note K—Property, plant and equipment
Property, plant and equipment, net consisted of the following:
| (In thousands) | September 26, 2009 | September 27, 2008 | ||||||
Land | $ | 109,532 | $ | 111,567 | ||||
Buildings, machinery and equipment | 2,468,297 | 2,465,608 | ||||||
Autos and trucks | 57,556 | 64,272 | ||||||
Construction-in-progress | 74,943 | 74,307 | ||||||
Property, plant and equipment, gross | 2,710,328 | 2,715,754 | ||||||
Accumulated depreciation | (1,210,852 | ) | (1,042,750 | ) | ||||
Property, plant and equipment, net | $ | 1,499,476 | $ | 1,673,004 | ||||
F-246
Table of Contents
Assets sold
In May 2009, the Company sold its closed processing complex and certain inventories in Farmerville, Louisiana, for $72.3 million. The Company recognized a gain of $15.0 million on this transaction that is included inReorganization items, net on its Consolidated Statement of Operations. In June 2009, the Company sold its closed distribution center in Plant City, Florida, for $2.4 million. The Company recognized a loss of $0.4 million on this transaction that is included inSelling, general and administrative expenses on its Consolidated Statement of Operations. In July 2009, the Company sold undeveloped land in Camp County, Texas, for $4.9 million. The Company recognized a gain of $3.5 million on this transaction that is included inReorganization items, net on its Consolidated Statement of Operations.
Idled assets and assets held for sale
The Company closed its processing complexes in Douglas, Georgia; El Dorado, Arkansas; Franconia, Pennsylvania; and Dalton, Georgia, in the third quarter of 2009 and closed its processing complexes in Bossier City, Louisiana, and Clinton, Arkansas, in the first quarter of 2009. Although the Company has received bids on some of these assets, management has not deemed any of the bids submitted to be acceptable and is not certain whether any bids acceptable to the Company will be received in the future. Management is also not certain that the Board of Directors would determine that it would be in the best interest of the bankruptcy estate to divest of these assets. Management is therefore not certain that it can or will divest of these assets within one year and, accordingly, has not classified them as assets held for sale. The Company continues to depreciate these assets. The Company recognized impairment charges totaling $5.4 million during the third quarter of 2009 to reduce the carrying amounts of certain idled assets located at the closed processing complex in Dalton, Georgia. At September 26, 2009, the carrying amount of these idled assets was $104.0 million based on depreciable value of $182.7 million and accumulated depreciation of $78.7 million.
The Company currently classifies certain assets related to its closed distribution center in El Paso, Texas, as assets held for sale. At September 26, 2009, and September 27, 2008, the Company reported assets held for sale totaling $0.5 million and $17.4 million, respectively, inPrepaid expenses and other current assets on its Consolidated Balance Sheets.
The Company estimated the fair value of each of its assets held for sale, idled assets and assets in the process of being idled as of September 26, 2009. Most of these assets were valued at their highest and best use—as operating chicken processing facilities. A selected few of these assets were valued as empty facilities. Management does not believe that the aggregate carrying amount of the assets held for sale, idled assets or assets in the process of being idled are significantly impaired at the present time. However, should the carrying amounts of these assets consistently exceed future purchase offers received, if any, recognition of impairment charges could become necessary.
Asset impairment
In addition to the 2009 asset impairment charges related to idled assets that are discussed above, the Company recognized asset impairment charges totaling $10.2 million during 2008 to reduce the carrying amounts of certain property, plant and equipment located at the facilities discussed in Note E—Restructuring Activities to their estimated fair values.
F-247
Table of Contents
At the present time, the Company’s forecasts indicate that it can recover the carrying value of its operating assets, including its property, plant and equipment and identified intangible assets, based on the projected cash flows of the operations. A key assumption in management’s forecast is that the Company’s sales volumes will generate historical margins as supply and demand between commodities and chicken and other animal-based proteins become more balanced. However, the exact timing of the return to historical margins is not certain, and if the return to historical margins is delayed, impairment charges could become necessary in the future.
Depreciation
We recognized depreciation expense related to our continuing operations of $217.9 million, $224.4 million and $188.6 million in 2009, 2008 and 2007, respectively. We also recognized depreciation charges related to our discontinued turkey business of $0.7 million and $1.6 million in 2008 and 2007, respectively. We did not incur depreciation charges related to our discontinued turkey business in 2009.
Note L—Accrued expenses
Accrued expenses not subject to compromise consisted of the following components:
| (In thousands) | September 26, 2009 | September 27, 2008 | ||||
Compensation and benefits | $ | 107,850 | $ | 118,803 | ||
Interest and debt maintenance | 11,239 | 35,488 | ||||
Self insurance | 86,081 | 170,787 | ||||
Other | 104,089 | 123,745 | ||||
Total | $ | 309,259 | $ | 448,823 | ||
For information on accrued restructuring costs, see Note F—Restructuring Activities. For information on accrued expenses subject to compromise, see Note A—Chapter 11 Proceedings.
F-248
Table of Contents
Note M—Notes payable and long-term debt
Short-term notes payable and long-term debt consisted of the following components:
| (In thousands) | Maturity | September 26, 2009 | September 27, 2008 | |||||||
Short-term Notes payable: | ||||||||||
The DIP Credit Agreement with notes payable at 8.00% plus the greatest of the facility agent’s prime rate, the average federal funds rate plus 0.50%, or LIBOR plus 1.00% | 2009 | $ | — | $ | — | |||||
Long-term debt: | ||||||||||
Senior unsecured notes, at 7 5/8% | 2015 | $ | 400,000 | $ | 400,000 | |||||
Senior subordinated unsecured notes, at 8 3/8% | 2017 | 250,000 | 250,000 | |||||||
The Pre-petition BMO Facility with notes payable at LIBOR plus 1.25% to LIBOR plus 2.75% (the “Pre-Petition BMO Facility”) | 2013 | 218,936 | 181,900 | |||||||
The ING Credit Agreement (defined below) with notes payable at LIBOR plus 1.65% to LIBOR plus 3.125% | 2011 | 41,062 | 51,613 | |||||||
The Pre-petition CoBank Facility (defined below) with four notes payable at LIBOR plus a spread, one note payable at 7.34% and one note payable at 7.56% | 2016 | 1,126,398 | 1,035,250 | |||||||
Other | Various | 8,698 | 23,220 | |||||||
Long-term debt | 2,045,094 | 1,941,983 | ||||||||
Current maturities of long-term debt | — | (1,874,469 | ) | |||||||
Long-term debt subject to compromise | (2,004,032 | ) | — | |||||||
Long-term debt, less current maturities | $ | 41,062 | $ | 67,514 | ||||||
Debt obligations
DIP Credit Agreement. As previously discussed, on December 1, 2008, the Debtors filed voluntary petitions in the Bankruptcy Court seeking reorganization relief under the Bankruptcy Code. The filing of the Chapter 11 petitions constituted an event of default under certain of our debt obligations, and those debt obligations became automatically and immediately due and payable, subject to an automatic stay of any action to collect, assert, or recover a claim against the Company and the application of applicable bankruptcy law. As a result, the accompanying Consolidated Balance Sheet as of September 27, 2008, includes reclassifications of $1,872.1 million to reflect as current certain long-term debt under the Company’s credit facilities that, absent the stay, would have become automatically and immediately due and payable. Because of the bankruptcy petition, most of the Company’s pre-petition long-term debt is included inLiabilities subject to compromise at September 26, 2009. The Company classifies pre-petition liabilities subject to compromise as a long-term liability because management does not believe the Company will use existing current assets or create additional current liabilities to fund these obligations.
On December 2, 2008, the Bankruptcy Court granted interim approval authorizing the Company and the Subsidiaries to enter into the Initial DIP Credit Agreement with the DIP Agent and the
F-249
Table of Contents
lenders party thereto. On December 2, 2008, the Company, the US Subsidiaries and the other parties entered into the Initial DIP Credit Agreement, subject to final approval of the Bankruptcy Court. On December 30, 2008, the Bankruptcy Court granted final approval authorizing the Company and the Subsidiaries to enter into the DIP Credit Agreement.
The DIP Credit Agreement currently provides for an aggregate commitment of up to $350 million, which permits borrowings on a revolving basis. The commitment includes a $25 million sub-limit for swingline loans and a $20 million sub-limit for letters of credit. Outstanding borrowings under the DIP Credit Agreement bear interest at a per annum rate equal to 8.0% plus the greatest of (i) the prime rate as established by the DIP Agent from time to time, (ii) the average federal funds rate plus 0.5%, or (iii) the LIBOR rate plus 1.0%, payable monthly. The weighted average interest rate for 2009 was 11.25%. The loans under the Initial DIP Credit Agreement were used to repurchase all receivables sold under the Company’s RPA. Loans under the DIP Credit Agreement may be used to fund the working capital requirements of the Company and its subsidiaries according to a budget as approved by the required lenders under the DIP Credit Agreement. For additional information on the RPA, see Note H—Trade Accounts and Other Receivables.
Actual borrowings by the Company under the DIP Credit Agreement are subject to a borrowing base, which is a formula based on certain eligible inventory and eligible receivables. The borrowing base formula is reduced by (i) pre-petition obligations under the Pre-petition BMO Facility (ii) administrative and professional expenses incurred in connection with the bankruptcy proceedings, and (iii) the amount owed by the Company and the Subsidiaries to any person on account of the purchase price of agricultural products or services (including poultry and livestock) if that person is entitled to any grower’s or producer’s lien or other security arrangement. The borrowing base is also limited to 2.22 times the formula amount of total eligible receivables. The DIP Credit Agreement provides that the Company may not incur capital expenditures in excess of $150 million. The Company must also meet minimum monthly levels of EBITDAR. Under the DIP Credit Agreement, “EBITDAR” means, generally, earnings before interest, taxes, depreciation, amortization, and restructuring (writedowns of goodwill and other intangibles, asset impairment charges, certain restructuring and closure costs and other specified costs, charges, losses and gains). The DIP Credit Agreement also provides for certain other covenants, various representations and warranties, and events of default that are customary for transactions of this nature. As of September 26, 2009, the applicable borrowing base and the amount available for borrowings under the DIP Credit Agreement were both $329.2 million as there were no outstanding borrowings under the Credit Agreement.
The principal amount of outstanding loans under the DIP Credit Agreement, together with accrued and unpaid interest thereon, are payable in full at maturity on December 1, 2009, subject to extension for an additional six months with the approval of all lenders thereunder. The Company has requested a two-month extension. All obligations under the DIP Credit Agreement are unconditionally guaranteed by the Subsidiaries and are secured by a first priority priming lien on substantially all of the assets of the Company and the Subsidiaries, subject to specified permitted liens in the DIP Credit Agreement. Under the terms of the DIP Credit Agreement and applicable bankruptcy law, the Company may not pay dividends on the common stock while it is in bankruptcy.
Pre-petition CoBank Facility. In September 2006, the Company entered into an amended and restated revolver/term credit agreement with a maturity date of September 21, 2016 (the “Pre-petition CoBank Facility”). The Pre-petition CoBank Facility provided for an aggregate
F-250
Table of Contents
commitment of $1.172 billion consisting of (i) a $550 million revolving/term loan commitment and (ii) $622.4 million in various term loans. At September 26, 2009, the Company had $506.7 million outstanding under the revolver and $619.7 million outstanding in various term loans. The Pre-petition CoBank Facility is presently secured by certain fixed assets. The fixed rate term loans bear interest at rates ranging from 7.34% to 7.56%. The voluntary converted loans bear interest at rates ranging from LIBOR plus 1.0%-2.0%, depending upon the Company’s total debt to capitalization ratio. The floating rate term loans bear interest at LIBOR plus 1.50%-1.75% based on the ratio of the Company’s debt to EBITDA, as defined in the Pre-petition CoBank Facility credit agreement. The revolving/term loans provide for interest rates ranging from LIBOR plus 1.0%-2.0%, depending upon the Company’s total debt to capitalization ratio. Commitment fees charged on the unused balance of this facility range from 0.20% to 0.40%, depending upon the Company’s total debt to capitalization ratio. In connection with temporary amendments to certain of the financial covenants under the Pre-petition CoBank Facility on April 30, 2008, the interest rates were temporarily increased until September 26, 2009 to the following ranges: (i) voluntary converted loans: LIBOR plus 1.5%-3.0%; (ii) floating rate terms loans: LIBOR plus 2.00%-2.75%; and (iii) revolving term loans: LIBOR plus 1.5%-3.0%. In connection with these amendments, the commitment fees were temporarily increased for the same period to range from 0.275%-0.525%. As a result of the Company’s Chapter 11 filing, after December 1, 2008, interest will accrue at the default rate, which is two percentage points above the interest rate otherwise applicable under the Pre-petition CoBank Facility. One-half of the outstanding obligations under the Pre-petition CoBank Facility are guaranteed by Pilgrim Interests, Ltd., an entity affiliated with our Senior Chairman, Lonnie “Bo” Pilgrim. The filing of the bankruptcy petitions also constituted an event of default under Pre-petition CoBank Facility. As a result of such event of default, all obligations under Pre-petition CoBank Facility became automatically and immediately due and payable, subject to an automatic stay of any action to collect, assert, or recover a claim against the Company and the application of applicable bankruptcy law.
Pre-petition BMO Facility. In February 2007, the Company entered into the Pre-petition BMO Facility with credit commitment of up to $300 million and a final maturity date of February 18, 2013. The Pre-petition BMO Facility provides for interest rates ranging from LIBOR plus 0.75-1.75%, depending upon our total debt to capitalization ratio. The obligations under the Pre-petition BMO Facility are secured by domestic chicken inventories and receivables that were not sold pursuant to the RPA. Commitment fees charged on the unused balance of the Pre-petition BMO Facility range from 0.175% to 0.35%, depending upon the Company’s total debt to capitalization ratio. In connection with temporary amendments to certain of the financial covenants under the Pre-petition BMO Facility on April 30, 2008, the interest rates were temporarily increased until September 26, 2009 to range between LIBOR plus 1.25%-2.75%. In connection with these amendments, the commitment fees were temporarily increased for the same period to range from 0.25%-0.50%. As a result of the Company’s Chapter 11 filing, after December 1, 2008, interest will accrue at the default rate, which is two percentage points above the interest rate otherwise applicable under the Pre-petition BMO Facility. One-half of the outstanding obligations under the Pre-petition BMO Facility are guaranteed by Pilgrim Interests, Ltd., an entity affiliated with our Senior Chairman, Lonnie “Bo” Pilgrim. The filing of the bankruptcy petitions also constituted an event of default under Pre-petition BMO Facility. As a result of such event of default, all obligations under the Pre-petition BMO Facility became automatically and immediately due and payable, subject to an automatic stay of any action to collect, assert, or recover a claim against the Company and the application of applicable bankruptcy law.
F-251
Table of Contents
Mexico Revolving Credit Facility. On September 25, 2006, a subsidiary of the Company, Avícola Pilgrim’s Pride de México, S. de R.L. de C.V. (the “Mexico Borrower”), entered into a secured revolving credit agreement (the “ING Credit Agreement”) with ING Capital, LLC, as agent (the “Mexico Agent”) and the lenders party thereto (the “Mexico Lenders”). The ING Credit Agreement has a final maturity date of September 25, 2011 and a revolving commitment of 558 million Mexican pesos, a US dollar-equivalent 41.1 million at September 26, 2009. Outstanding amounts bear interest at rates ranging from the higher of the Prime Rate or Federal Funds Effective Rate plus 0.5%; LIBOR plus 1.65%-3.125%; or TIIE plus 1.05%-2.55% depending on the loan designation. Obligations under this agreement are secured by a security interest in and lien upon all capital stock and other equity interests of the Company’s Mexican subsidiaries (other than the Borrower). All the obligations of the Borrower are secured by unconditional guaranty by the Company. At September 26, 2009, $41.1 million was outstanding and no other funds were available for borrowing under this line. Borrowings are subject to “no material adverse effect” provisions.
On November 30, 2008, the Company and certain non-Debtor Mexico subsidiaries of the Company (the “Mexico Subsidiaries”) entered into a Waiver Agreement and Second Amendment to Credit Agreement (the “Waiver Agreement”) with the Mexico Agent and the Mexico Lenders. Under the Waiver Agreement, the Mexico Agent and the Mexico Lenders waived any default or event of default under the ING Credit Agreement resulting from the Company’s filing of its bankruptcy petition with the Bankruptcy Court. Pursuant to the Waiver Agreement, outstanding amounts under the ING Credit Agreement now bear interest at a rate per annum equal to: the LIBOR Rate, the Base Rate, or the TIIE Rate, as applicable, plus the Applicable Margin (as those terms are defined in the ING Credit Agreement). While the Company is operating under its petitions for reorganization relief, the Waiver Agreement provides for an Applicable Margin for LIBOR loans, Base Rate loans, and TIIE loans of 6.0%, 4.0%, and 5.8%, respectively. The Waiver Agreement further amended the ING Credit Agreement to require the Mexico Borrower to make a mandatory prepayment of the revolving loans, in an aggregate amount equal to 100% of the net cash proceeds received by any Mexico Subsidiary, as applicable, in excess of thresholds specified in the ING Credit Agreement (i) from the occurrence of certain asset sales by the Mexico Subsidiaries; (ii) from the occurrence of any casualty or other insured damage to, or any taking under power of eminent domain or by condemnation or similar proceedings of, any property or asset of any Mexico Subsidiary; or (iii) from the incurrence of certain indebtedness by a Mexico Subsidiary. Any such mandatory prepayments will permanently reduce the amount of the commitment under the ING Credit Agreement. In connection with the Waiver Agreement, the Mexico Subsidiaries pledged substantially all of their receivables, inventory, and equipment and certain fixed assets.
Senior and Subordinated Notes. On January 24, 2007, the Company closed on the sale of $400 million of 7 5/8% Senior Notes due 2015 and $250 million of 8 3/8% Senior Subordinated Notes due 2017, sold at par. Interest is payable on May 1 and November 1 of each year, beginning November 1, 2007. Prior to the Chapter 11 filings, the notes were subject to certain early redemption features. The proceeds from the sale of the notes, after underwriting discounts, were used to (i) retire the loans outstanding under the Company’s bridge loan agreement, (ii) repurchase $77.5 million of the Company’s 9 1/4% Senior Subordinated Notes due 2013 at a premium of $7.4 million plus accrued interest of $1.3 million and (iii) reduce outstanding revolving loans under the Pre-petition CoBank Facility. In January 2007, the Company had borrowed (i) $780 million under the Pre-petition CoBank Facility and (ii) $450 million under the bridge loan agreement to fund the Gold Kist acquisition. Loss on early extinguishment of debt
F-252
Table of Contents
recognized in 2007 includes the $7.4 million premium along with unamortized loan costs of $7.1 million related to the retirement of 9 1/4% Senior Subordinated Notes due 2013.
In September 2007, the Company redeemed all of its 9 5/8% Senior Notes due 2011 at a total cost of $307.5 million. To fund a portion of the aggregate redemption price, the Company sold $300 million of trade receivables under its RPA. Loss on early extinguishment of debt recognized in 2007 includes the $9.5 million premium along with unamortized loan costs of $2.5 million related to the retirement of these notes.
During 2009, the Company borrowed $616.7 million and repaid $525.6 million under the Pre-petition CoBank Facility, borrowed $216.8 million and repaid $179.7 million under the Pre-petition BMO Facility, borrowed and repaid $430.8 million under the DIP Credit Agreement and repaid $14.4 million under other facilities.
In September 2008, the Company notified its lenders that it expected to incur a significant loss in the fourth quarter of 2008 and entered into agreements with them to temporarily waive the fixed-charge coverage ratio covenant under its credit facilities. The lenders agreed to continue to provide liquidity under the credit facilities during the thirty-day period ended October 28, 2008. On October 27, 2008, the Company entered into further agreements with its lenders to temporarily waive the fixed-charge coverage ratio and leverage ratio covenants under its credit facilities. The lenders agreed to continue to provide liquidity under the credit facilities during the thirty-day period ended November 26, 2008. On November 26, 2008, the Company entered into further agreements with its lenders to extend the temporary waivers until December 1, 2008.
The filing of the bankruptcy petitions constituted an event of default under the Pre-petition BMO Facility and the Pre-petition CoBank Facility (together, the “Secured Debt”) as well as the 7 5/8% Senior Notes due 2015, the 8 3/8% Senior Subordinated Notes due 2017 and the 9 1/4% Senior Subordinated Notes due 2013 (together, the “Unsecured Debt”). The aggregate principal amount owed under these credit facilities and notes was approximately $2,002.3 million as of September 26, 2009. As a result of such event of default, all obligations under these credit facilities became automatically and immediately due and payable, subject to an automatic stay of any action to collect, assert, or recover a claim against the Company and the application of applicable bankruptcy law. As a result of the Company’s Chapter 11 filing, after December 1, 2008, the Company accrued interest incurred on the Secured Debt at the default rate, which is two percentage points above the interest rate otherwise applicable under the respective credit facilities. Upon a default, the agreements related to the Unsecured Debt call for the accrual of interest after December 1, 2008, at a default rate that is two percentage points above the interest rate otherwise applicable under the associated note agreements. The Company does not believe that it incurred a default under the terms of Unsecured Debt agreements and accordingly has elected to accrue interest incurred on the Unsecured Debt, for accounting purposes, at the interest rate otherwise applicable under the associated note agreements until such time, if any, that the Bankruptcy Court requires the payment of default interest incurred on the Unsecured Debt. Had the Company accrued interest incurred on the Unsecured Debt at the default rate, it would have recognized additional interest expense totaling $10.9 million in 2009.
Our loan agreements generally obligate us to reimburse the applicable lender for incremental increased costs due to a change in law that imposes (i) any reserve or special deposit requirement against assets of, deposits with or credit extended by such lender related to the loan, (ii) any tax, duty or other charge with respect to the loan (except standard income tax) or (iii) capital adequacy requirements. In addition, some of our loan agreements contain a withholding tax
F-253
Table of Contents
provision that requires us to pay additional amounts to the applicable lender or other financing party, generally if withholding taxes are imposed on such lender or other financing party as a result of a change in the applicable tax law. These increased cost and withholding tax provisions continue for the entire term of the applicable transaction, and there is no limitation on the maximum additional amounts we could be obligated to pay under such provisions.
Industrial revenue bonds
In June 1999, the Camp County Industrial Development Corporation issued $25 million of variable-rate environmental facilities revenue bonds supported by letters of credit obtained by us under our secured revolving credit facility expiring in 2013. Prior to our bankruptcy filing, the proceeds were available for the Company to draw from over the construction period in order to construct new sewage and solid waste disposal facilities at a poultry by-products plant in Camp County, Texas. The original proceeds from the issuance of the revenue bonds were held by the trustee of the bonds until we drew on the proceeds for the construction of the facility. We had not drawn on the proceeds or commenced construction of the facility prior to our bankruptcy filing. The filing of the bankruptcy petitions constituted an event of default under these bonds. As a result of the event of default, the trustee had the right to accelerate all obligations under the bonds such that they become immediately due and payable, subject to an automatic stay of any action to collect, assert, or recover a claim against the Company and the application of applicable bankruptcy law. In December 2008, the holders of the bonds tendered the bonds for remarketing, which was not successful. As a result, the trustee, on behalf of the holders of the bonds, drew upon the letters of credit supporting the bonds. The resulting reimbursement obligation was converted to borrowings under the secured revolving credit facility expiring in 2013 and secured by our domestic chicken inventories. On January 29, 2009, we obtained approval from the Bankruptcy Court to use the original proceeds of the bond offering held by the trustee to repay and cancel the revenue bonds. We received the proceeds of the bond offering from the trustee in March 2009 and immediately repaid and cancelled the revenue bonds.
Other disclosures
Most of our domestic inventories and domestic fixed assets are pledged as collateral on our long-term debt and credit facilities.
Assuming no amounts are accelerated, annual maturities of long-term debt for the five years subsequent to September 26, 2009 are: 2010—$2.4 million; 2011—$43.5 million; 2012—$2.2 million; 2013—$228.2 million; 2014—$2.3 million; and thereafter—$1,766.5 million.
Total interest expense was $161.9 million, $134.2 million and $123.2 million in 2009, 2008 and 2007, respectively. Interest related to new construction capitalized in 2009, 2008 and 2007 was $2.6 million, $5.3 million and $5.7 million, respectively.
The fair value of our public debt obligations at September 26, 2009, based upon quoted market prices for the issues, was approximately $717.2 million. Our public debt is currently trading at a premium. As of November 20, 2009, the most recent trades of our 7 5/8% Senior Unsecured Notes due 2015 and 8 3/8% Senior Subordinated Unsecured Notes due 2018 were executed at average prices of $111.67 per $100.00 par value and $111.08 per $100.00 par value, respectively. Management expects that the aggregate fair value of our non-public credit facilities has decreased below the aggregate face value of those facilities, but cannot reliably estimate the aggregate fair value at this time as a result of our Chapter 11 bankruptcy filing.
F-254
Table of Contents
Note N—Income taxes
Income (loss) from continuing operations before income taxes by jurisdiction is as follows:
| (In thousands) | 2009 | 2008 | 2007 | ||||||||
US | $ | (200,737 | ) | $ | (1,165,208 | ) | $ | 87,235 | |||
Foreign | 26,970 | (21,885 | ) | 11,600 | |||||||
Total | $ | (173,767 | ) | $ | (1,187,093 | ) | $ | 98,835 | |||
The components of income tax expense (benefit) are set forth below:
| (In thousands) | 2009 | 2008 | 2007 | |||||||||
Current: | ||||||||||||
Federal | $ | (320 | ) | $ | 925 | $ | (35,434 | ) | ||||
Foreign | 2,829 | (1,649 | ) | 1,573 | ||||||||
State and other | (2,617 | ) | 1,747 | (2,704 | ) | |||||||
Total current | (108 | ) | 1,023 | (36,565 | ) | |||||||
Deferred: | ||||||||||||
Federal | (21,025 | ) | (212,151 | ) | 73,285 | |||||||
Foreign | 1,199 | 35,277 | (1,637 | ) | ||||||||
State and other | (1,652 | ) | (19,070 | ) | 12,236 | |||||||
Total deferred | (21,478 | ) | (195,944 | ) | 83,884 | |||||||
| $ | (21,586 | ) | $ | (194,921 | ) | $ | 47,319 | |||||
The effective tax rate for continuing operations for 2009 was 12.4% compared to 16.4% for 2008. The effective tax rate for 2009 differed from 2008 primarily as a result of a decrease in reserves for unrecognized tax benefits offset by an increase in valuation allowance and the tax effect of permanent items.
The following table reconciles the statutory US federal income tax rate to the Company’s effective income tax rate:
| 2009 | 2008 | 2007 | |||||||
Federal income tax rate | 35.0% | 35.0% | 35.0% | ||||||
State tax rate, net | 2.0 | 2.2 | 2.6 | ||||||
Permanent items | (0.9 | ) | (0.8 | ) | 2.7 | ||||
Permanent items – reorganization costs | (8.5 | ) | — | — | |||||
Difference in US statutory tax rate and foreign country effective tax rate | 2.2 | (0.2 | ) | (0.7 | ) | ||||
Goodwill impairment | — | (14.8 | ) | — | |||||
Tax credits | 2.5 | 0.5 | (7.4 | ) | |||||
Currency related differences | — | — | 3.5 | ||||||
Change in reserve for unrecognized tax benefits | 14.6 | (0.2 | ) | 6.3 | |||||
Change in valuation allowance | (33.0 | ) | (6.0 | ) | — | ||||
Change in tax rate | — | — | 3.0 | ||||||
Other | (1.5 | ) | 0.7 | 2.9 | |||||
Total | 12.4% | 16.4% | 47.9% | ||||||
F-255
Table of Contents
Deferred income taxes reflect the net effects of temporary differences between the carrying amounts of assets and liabilities for financial reporting purposes and the amounts used for income tax purposes. Significant components of the Company’s deferred tax liabilities and assets are as follows:
| (In thousands) | 2009 | 2008 | ||||||
Deferred tax liabilities: | ||||||||
Property and equipment | $ | 153,341 | $ | 207,706 | ||||
Inventories | 81,012 | 84,261 | ||||||
Prior use of cash accounting | 13,549 | 15,243 | ||||||
Acquisition-related items | 12,967 | 13,832 | ||||||
Deferred foreign taxes | 40,808 | 30,361 | ||||||
Identified intangibles | 21,585 | 23,346 | ||||||
Other | — | 6,722 | ||||||
Total deferred tax liabilities | 323,262 | 381,471 | ||||||
Deferred tax assets: | ||||||||
Net operating losses | 296,677 | 212,421 | ||||||
Foreign net operating losses | 48,901 | 50,824 | ||||||
Credit carry forwards | 23,657 | 20,322 | ||||||
Expenses deductible in different years | 85,380 | 142,619 | ||||||
Other | 11,255 | — | ||||||
Subtotal | 465,870 | 426,186 | ||||||
Valuation allowance | (164,821 | ) | (71,158 | ) | ||||
Total deferred tax assets | 301,049 | 355,028 | ||||||
Net deferred tax liabilities | $ | 22,213 | $ | 26,443 | ||||
The Company maintains valuation allowances when it is more likely than not that all or a portion of a deferred tax asset will not be realized. Changes in valuation allowances from period to period are included in the tax provision in the period of change. We evaluate the recoverability of our deferred income tax assets by assessing the need for a valuation allowance on a quarterly basis. If we determine that it is more likely than not that our deferred income tax assets will be recovered, the valuation allowance will be reduced. Due to continued history of losses, the Company does not believe it has sufficient positive evidence to conclude that realization of its net deferred tax asset position at September 26, 2009, in the US and Mexico is more likely than not.
As of September 26, 2009, the Company had US federal net operating loss carry forwards of $796.6 million that will begin to expire in 2026 and state net operating loss carry forwards of $569.3 million that will begin to expire in 2010. The Company also had Mexico net operating loss carry forwards at September 26, 2009 approximating $174.6 million that will begin to expire in 2011.
As of September 26, 2009, the Company had $14.2 million of federal tax credit carry forwards that will begin to expire in 2027 and $9.5 million of state tax credit carry forwards that will begin to expire in 2009.
On November 6, 2009, the President signed H.R. 3548, which included a provision that will allow most business taxpayers to elect an increased carryback period for net operating losses incurred in 2008 or 2009. The effects of changes in tax law are taken into account during the interim period in which the law is enacted. The Company estimates its cumulative net operating losses
F-256
Table of Contents
related to 2008 and 2009 to be approximately $686.5 million. Of this amount, the Company estimates that up to approximately $528.2 million will be utilized under the expanded carryback provisions of H.R. 3548 to the applicable carryback years. Accordingly, the Company has filed a claim for a refund of approximately $162.0 million with the Internal Revenue Service under the provisions of H.R. 3548. No assurance can be made that the Company’s claim amount will be allowed in full. No assurance can be made as to the date by which the Internal Revenue Service will process and pay any such refund claim allowed.
As a result of enacting H.R. 3548 on November 6, 2009, it is reasonably possible that a material decrease to the US valuation allowance will occur within one year. The decrease in the US valuation allowance will approximate the tax effects of the amount of net operating loss carrybacks the Company expects to be realized. In addition, federal tax credits approximating $8.6 million will be carried forward and begin to expire in 2025.
The Company has not provided any deferred income taxes on the undistributed earnings of its Mexico subsidiaries based upon the determination that such earnings will be indefinitely reinvested. As of September 26, 2009, the cumulative undistributed earnings of these subsidiaries were approximately $60.9 million. If such earnings were not considered indefinitely reinvested, the Company estimates it would be subject to approximately $21.3 million of US federal income taxes before considering the availability of any US foreign tax credits.
On October 31, 2009 the Mexican Congress passed tax reform submitted by the Executive Branch. The new law will be effective January 1, 2010. The effects of changes in tax law are taken into account during the interim period in which the law is enacted. Under the provisions of the new law, the corporate tax rate will increase from 28% to 30% beginning in calendar year 2010. The rate will decrease from 30% to 29% in calendar year 2013 and to 28% in calendar year 2014. The impact of the tax rate increase for the fiscal year ended 2010 is not expected to be material. Beginning in calendar year 2010, the tax reform will also treat most consolidated income tax return benefits as temporary benefits on which deferred taxes must be paid once a five-year period has elapsed. For deferred taxes generated in calendar year 2006, the tax must be paid as follows: 25% in each of calendar year 2012 and calendar year 2013, 20% in calendar year 2014 and 15% in each of calendar year 2015 and calendar year 2016. Additionally, under the new bill, there are recapture rules that apply to separate company losses (post calendar year 1998) utilized in consolidation whereby the losses must be recaptured within five years instead of ten if the separate company does not generate income to offset the losses. The tax impact is impracticable to estimate at this time. However, the Company does not expect tax amounts payable under the new law to be materially different from deferred tax liability amounts currently recorded as of September 26, 2009.
In October 2007, Mexico’s legislative bodies enactedLa Ley del Impuesto Empresarial a Tasa Unica (“IETU”), a new minimum corporate tax that was assessed on companies doing business in Mexico beginning January 1, 2008. While the Company has determined that it does not anticipate paying any significant taxes under IETU, the new law did affect the Company’s tax planning strategies to fully realize its deferred tax assets under Mexico’s regular income tax. The Company has evaluated the impact of IETU on its Mexico operations, and because of the treatment of net operating losses under the new law, established a valuation allowance for net operating losses it believes do not meet the more likely than not realization criteria under ASC 740. This valuation allowance resulted in a $24.5 million charge to tax expense for fiscal year 2008.
F-257
Table of Contents
On September 30, 2007, the Company adopted guidance under ASC 740-10-25 that clarifies the accounting for income taxes by prescribing a minimum recognition threshold a tax benefit is required to meet before being recognized in the financial statements. ASC 740-10-25 also provides guidance on derecognition, measurement, classification, interest and penalties, accounting in interim periods, disclosure and transition. As a result of the implementation of the subject guidance under ASC 740-10-25, the Company increased deferred tax assets by $22.9 million and goodwill by $0.5 million. Unrecognized tax benefits at September 26, 2009, relate to various US jurisdictions.
A reconciliation of the beginning and ending amounts of unrecognized tax benefits is as follows:
| (In thousands) | 2009 | 2008 | ||||||
Unrecognized tax benefits, beginning of year | $ | 65,322 | $ | 58,557 | ||||
Increase as a result of tax positions taken during the current year | 926 | 3,716 | ||||||
Increase as a result of tax positions taken during prior years | 3,495 | 4,120 | ||||||
Decrease as a result of tax positions taken during prior years | (2,348 | ) | — | |||||
Decrease relating to settlements with taxing authorities | (44,737 | ) | (1,071 | ) | ||||
Unrecognized tax benefits, end of year | $ | 22,658 | $ | 65,322 | ||||
The increase in unrecognized tax benefits as a result of tax positions taken during the current and prior years relates to federal and state income tax positions which no longer meet the more-likely-than-not recognition threshold under ASC 740. The decrease in unrecognized tax benefits relating to settlements with taxing authorities represents amounts to which the Internal Revenue Service and the Appeals Division have effectively agreed in concluding the examination and appeals phase for tax years ended September 26, 2003 through September 30, 2006, and represent remeasurement and effective settlement of tax positions related to temporary differences.
Included in unrecognized tax benefits of $22.7 million at September 26, 2009, was $10.3 million of tax benefits that, if recognized, would reduce the Company’s effective tax rate.
The Company recognizes interest and penalties related to unrecognized tax benefits in its provision for income taxes. As of September 26, 2009, the Company had recorded a liability of $8.9 million for interest and penalties. This amount includes an increase of $1.5 million recognized for 2009 and a decrease related to settlements with taxing authorities of $7.6 million.
It is reasonably possible that a decrease in our liability for unrecognized tax benefits will occur within the next 12 months because of the Company’s potential exit from bankruptcy. An estimate of the reasonably possible range cannot be made at this time.
The Internal Revenue Service has concluded the examination and appeals phase for tax years ended September 26, 2003 through September 30, 2006. The Company continues to be under examination for Gold Kist, Inc. and Subsidiaries for the tax years June 30, 2004 through December 27, 2006. We expect to conclude the examination phase of this audit during 2010.
The Company operates in the United States (including multiple state jurisdictions), Puerto Rico and Mexico. With few exceptions, the Company is no longer subject to US federal, state or local income tax examinations for years prior to 2003 and is no longer subject to Mexico income tax examinations by taxing authorities for years prior to 2005.
F-258
Table of Contents
Note O—Comprehensive income (loss)
Comprehensive income (loss) consisted of the following:
| 2009 | 2008 | 2007 | ||||||||||
Net income (loss) | $ | (151,582 | ) | $ | (998,581 | ) | $ | 47,017 | ||||
Unrealized gain (loss) on investments in debt securities | 4,149 | (3,465 | ) | 535 | ||||||||
Gain (loss) on pension and other postretirement benefit plans | (51,266 | ) | 15,691 | 15,535 | ||||||||
Loss on cash flow hedges | (557 | ) | (557 | ) | 5,338 | |||||||
Tax effect | (724 | ) | (4,510 | ) | (7,540 | ) | ||||||
Comprehensive income (loss) | $ | (199,980 | ) | $ | (991,422 | ) | 60,885 | |||||
Accumulated other comprehensive income (loss) consisted of the following:
September 26, 2009 | September 27, 2008 | |||||||
Accumulated unrealized gain (loss) on investments in debt securities | $ | 2,089 | $ | (1,420 | ) | |||
Accumulated gain (loss) on pension and other postretirement benefit plans | (20,041 | ) | 31,225 | |||||
Accumulated gain on cash flow hedges | 4,224 | 4,781 | ||||||
Tax effect | (13,509 | ) | (13,425 | ) | ||||
Accumulated other comprehensive income (loss) | $ | (27,237 | ) | $ | 21,161 | |||
Note P—Common stock
As of September 26, 2009, we estimate that approximately 25.9 million shares of our common stock still carry twenty votes per share. We also estimate that 25.3 million shares of this common stock are beneficially owned by our Senior Chairman, Lonnie “Bo” Pilgrim, or certain affiliated entities.
In May 2008, the Company completed a public offering of 7.5 million shares of its common stock for total consideration of approximately $177.4 million. The Company used the net proceeds of the offering to reduce outstanding indebtedness under two of its revolving credit facilities and for general corporate purposes.
Effective December 1, 2008, the NYSE delisted our common stock as a result of the Company’s filing of its Chapter 11 petition. Our common stock is now quoted on the Pink Sheets Electronic Quotation Service under the ticker symbol “PGPDQ.PK.” The Company has applied with the NYSE to list its common stock upon its exit from bankruptcy under its prior ticker symbol “PPC.”
On January 27, 2009, the Company granted its new Chief Executive Officer 3,085,656 shares of the Company’s common stock, which vest upon achievement of certain performance targets and the confirmation of a plan of reorganization of the Company. The $1.8 million fair value of the shares as of the grant date was determined by multiplying the number of shares granted by the closing market price of the Company’s common stock on the grant date. At September 26, 2009, the intrinsic value of the shares was $21.8 million. In 2009, we did not recognize compensation expense related to this grant because of the performance conditions. We will recognize $1.8 million of compensation expense when certain performance targets are achieved and a plan of
F-259
Table of Contents
reorganization for the Company is confirmed by the Bankruptcy Court. Other than the grant to the Chief Executive Officer, as of September 26, 2009, the Company did not have any compensation plans (including individual compensation arrangements) under which equity securities of the Company are authorized for issuance by the Company.
Note Q—Pension and other postretirement benefits
Retirement plans
The Company maintains the following retirement plans for eligible employees:
| • | The Pilgrim’s Pride Retirement Savings Plan (the “RS Plan”), a Section 401(k) salary deferral plan, |
| • | The Pilgrim’s Pride Retirement Plan for Union Employees (the “Union Plan”), a defined benefit plan, |
| • | The Pilgrim’s Pride Retirement Plan for El Dorado Union Employees (the “El Dorado” Plan), a defined benefit plan, |
| • | The To-Ricos Employee Savings and Retirement Plan (the “To-Ricos Plan”), a Section 1165(e) salary deferral plan, and |
| • | The Pilgrim’s Pride Pension Plan for Legacy Gold Kist Employees (the “GK Pension Plan”), a defined benefit plan. |
The Company also maintains three postretirement plans for eligible Mexico employees as required by Mexico law that primarily cover termination benefits. Separate disclosure of the Mexican plan obligations is not considered material.
The RS Plan is maintained for certain eligible US employees. Under the RS Plan, eligible employees may voluntarily contribute a percentage of their compensation and there are various Company matching provisions. The Union Plan covers certain locations or work groups within the Company. The El Dorado Plan was spun off from the Union Plan effective January 1, 2008 and covers certain eligible locations or work groups within the Company. The To-Ricos Plan is maintained for certain eligible Puerto Rican employees. Under the To-Ricos Plan, eligible employees may voluntarily contribute a percentage of their compensation and there are various Company matching provisions. The GK Pension Plan covers certain eligible US employees who were employed at locations that Pilgrim’s Pride acquired in its acquisition of Gold Kist in 2007. Participation in the GK Pension Plan was frozen as of February 8, 2007, for all participants with the exception of terminated vested participants who are or may become permanently and totally disabled. The plan was frozen for that group as of March 31, 2007.
Under all of our retirement plans, the Company’s expenses were $10.1 million, $4.1 million, and $10.0 million in 2009, 2008 and 2007, respectively.
The Company used a year-end measurement date of September 26, 2009, for its pension and postretirement benefits plans. Certain disclosures are listed below; other disclosures are not material to the financial statements.
F-260
Table of Contents
Medical and life insurance plans
Pilgrim’s Pride assumed postretirement medical and life insurance obligations through its acquisition of Gold Kist in 2007. In January 2001, Gold Kist began to substantially curtail its programs for active employees. On July 1, 2003, Gold Kist terminated medical coverage for retirees age 65 and older, and only retired employees in the closed group between ages 55 and 65 could continue their coverage at rates above the average cost of the medical insurance plan for active employees. These retired employees will all reach the age of 65 by 2012 and liabilities of the postretirement medical plan will then end.
Benefit obligations and plan assets
The following tables provide reconciliations of the changes in the plans’ projected benefit obligations and fair value of assets as well as statements of the funded status, balance sheet reporting and economic assumptions for these plans.
| Pension benefits | Other benefits | |||||||||||||||
| (In thousands) | 2009 | 2008 | 2009 | 2008 | ||||||||||||
Change in projected benefit obligation: | ||||||||||||||||
Projected benefit obligation, beginning of year | $ | 127,354 | $ | 196,803 | $ | 1,893 | $ | 2,432 | ||||||||
Service cost | 672 | 1,246 | — | — | ||||||||||||
Interest cost | 8,899 | 9,576 | 135 | 132 | ||||||||||||
Plan participant contributions | 28 | 29 | 40 | 79 | ||||||||||||
Actuarial (gains)/losses | 43,362 | (56,589 | ) | 271 | (477 | ) | ||||||||||
Benefits paid | (8,991 | ) | (23,553 | ) | (162 | ) | (273 | ) | ||||||||
Other | (1,877 | ) | (158 | ) | — | — | ||||||||||
Projected benefit obligation, end of year | $ | 169,447 | $ | 127,354 | $ | 2,177 | $ | 1,893 | ||||||||
| Pension benefits | Other benefits | |||||||||||||||
| (In thousands) | 2009 | 2008 | 2009 | 2008 | ||||||||||||
Change in plan assets: | ||||||||||||||||
Fair value of plan assets, beginning of year | $ | 92,980 | $ | 138,024 | $ | — | $ | — | ||||||||
Actual return on plan assets | 587 | (24,063 | ) | — | — | |||||||||||
Contributions by employer | 1,111 | 2,543 | 122 | 194 | ||||||||||||
Plan participant contributions | 28 | 29 | 40 | 79 | ||||||||||||
Benefits paid | (8,991 | ) | (23,553 | ) | (162 | ) | (273 | ) | ||||||||
Other | (1,140 | ) | — | — | — | |||||||||||
Fair value of plan assets, end of year | $ | 84,575 | $ | 92,980 | $ | — | $ | — | ||||||||
| Pension benefits | Other benefits | |||||||||||||||
| (In thousands) | 2009 | 2008 | 2009 | 2008 | ||||||||||||
Funded status: | ||||||||||||||||
Funded status | $ | (84,872 | ) | $ | (34,374 | ) | $ | (2,177 | ) | $ | (1,893 | ) | ||||
Unrecognized prior service cost | 60 | 121 | — | — | ||||||||||||
Unrecognized net actuarial loss (gain) | 19,967 | (30,714 | ) | 14 | (670 | ) | ||||||||||
Accrued benefit cost | $ | (64,845 | ) | $ | (64,967 | ) | $ | (2,163 | ) | $ | (2,563 | ) | ||||
F-261
Table of Contents
| Pension benefits | Other benefits | |||||||||||||||
| (In thousands) | 2009 | 2008 | 2009 | 2008 | ||||||||||||
Amounts recognized in the balance sheets: | ||||||||||||||||
Accrued benefit cost (current) | $ | (14,143 | ) | $ | (13,596 | ) | $ | (171 | ) | $ | (203 | ) | ||||
Accrued benefit cost (long-term) | (70,729 | ) | (20,778 | ) | (2,006 | ) | (1,690 | ) | ||||||||
Long-term deferred income taxes | 7,560 | (11,549 | ) | 5 | (253 | ) | ||||||||||
Accumulated other comprehensive loss (income) | 12,467 | (19,044 | ) | 9 | (417 | ) | ||||||||||
Net amount recognized | $ | (64,845 | ) | $ | (64,967 | ) | $ | (2,163 | ) | $ | (2,563 | ) | ||||
The accumulated benefit obligation for all defined benefit plans was $169.4 million and $126.8 million at September 26, 2009, and September 27, 2008, respectively. All of the Company’s defined benefit plans had an accumulated benefit obligation in excess of plan assets at September 26, 2009, and September 27, 2008.
Net periodic benefit cost (income)
The following table provides the components of net periodic benefit cost (income) for the plans.
| Pension benefits | Other benefits | |||||||||||||||||||||
| (In thousands) | 2009 | 2008 | 2007 | 2009 | 2008 | 2007 | ||||||||||||||||
Service cost | $ | 672 | $ | 1,246 | $ | 2,029 | $ | — | $ | — | $ | — | ||||||||||
Interest cost | 8,899 | 9,576 | 8,455 | 135 | 132 | 103 | ||||||||||||||||
Estimated return on plan assets | (6,781 | ) | (10,200 | ) | (8,170 | ) | — | — | — | |||||||||||||
Settlement gain | — | (6,312 | ) | (2,327 | ) | (60 | ) | 153 | — | |||||||||||||
Amortization of prior service cost | 61 | 116 | — | — | — | — | ||||||||||||||||
Effect of special events | 410 | (158 | ) | — | — | — | — | |||||||||||||||
Amortization of net gain | (2,227 | ) | (125 | ) | — | (49 | ) | — | — | |||||||||||||
Net periodic benefit cost (income) | $ | 1,034 | $ | (5,857 | ) | $ | (13 | ) | $ | 26 | $ | 285 | $ | 103 | ||||||||
Economic assumptions
The following table presents the assumptions used in determining the benefit obligations and the net periodic benefit cost amounts.
| Pension benefits | Other benefits | |||||||
| 2009 | 2008 | 2009 | 2008 | |||||
Discount rate | 5.34% | 7.38% | 5.33% | 7.53% | ||||
Rate of increase in compensation levels | 3.00% | 3.00% | NA | NA | ||||
The decrease in discount rate resulted in increases in both pension benefit obligation and equity of $60.3 million.
F-262
Table of Contents
The following table presents the assumptions used in determining the net periodic benefit cost amounts.
| Pension benefits | Other benefits | |||||||||||
| 2009 | 2008 | 2007 | 2009 | 2008 | 2007 | |||||||
Weighted average assumption for net period cost for the year: | ||||||||||||
Discount rate | 7.42% | 5.08% | 5.06% | 7.53% | 5.87% | 5.50% | ||||||
Rate of increase in compensation levels | 3.00% | 3.00% | 3.00% | NA | NA | NA | ||||||
Expected return on plan assets | 7.77% | 7.77% | 7.75% | 7.75% | 7.75% | 7.75% | ||||||
Assumed health care cost trend rates: | ||||||||||||
Health care cost trend rate assumed for next year | NA | NA | NA | NA | 9.00% | 8.00% | ||||||
Rate to which the cost trend rate gradually declines | NA | NA | NA | NA | 6.00% | 5.00% | ||||||
Year that the rate will reach the rate at which it is assumed to remain | NA | NA | NA | NA | 2015 | 2014 | ||||||
The Company changed its approach in determining the discount rate from an annuity purchase rate approach to a yield curve approach. This change resulted in an increase in the discount rate from September 29, 2007, to September 27, 2008. The yield curve approach better mirrors the Company’s expectation that the termination of the GK Pension Plan and other benefit plans will not occur in the near future.
A one percentage-point change in the assumed health care cost trend rates would have an insignificant impact on 2009 expense and year-end liabilities.
Plan assets
The following table reflects the pension plans’ actual asset allocations.
| 2009 | 2008 | |||
Asset allocation: | ||||
Cash and money market funds | 1% | 1% | ||
Equity securities | 69% | 68% | ||
Debt securities | 30% | 31% | ||
Total assets | 100% | 100% | ||
Absent regulatory or statutory limitations, the target asset allocation for the investment of the assets for our ongoing pension plans is 30% in debt securities and 70% in equity securities. The plans only invest in debt and equity instruments for which there is a ready public market. We develop our expected long-term rate of return assumptions based on the historical rates of returns for equity and debt securities of the type in which our plans invest.
F-263
Table of Contents
Benefit payments
The following table reflects the benefits as of December 31, 2008, expected to be paid in each of the next five years and in the aggregate for the five years thereafter from our pension and other postretirement plans. Because our pension plans are primarily funded plans, the anticipated benefits with respect to these plans will come primarily from the trusts established for these plans. Because our other postretirement plans are unfunded, the anticipated benefits with respect to these plans will come from our own assets.
| (In thousands) | Pension benefits | Other benefits | ||||
Expected benefit payments for year: | ||||||
2010 | $ | 14,144 | $ | 171 | ||
2011 | 12,993 | 175 | ||||
2012 | 12,480 | 178 | ||||
2013 | 11,914 | 181 | ||||
2014 | 11,164 | 182 | ||||
2015—2019 | 51,674 | 899 | ||||
Total | $ | 114,369 | $ | 1,786 | ||
We anticipate contributing $4.8 million and $0.2 million to our pension and other postretirement plans, respectively, during 2010.
Unrecognized benefit amounts in accumulated other comprehensive income (loss)
The amounts in accumulated other comprehensive income (loss) that have not yet been recognized as components of net periodic benefits cost at September 26, 2009, and the changes in these amounts during 2009 are as follows.
| (In thousands) | Pension benefits | Other benefits | ||||||
Components of accumulated other comprehensive income (loss), before tax: | ||||||||
Net actuarial loss | $ | 19,967 | $ | 14 | ||||
Net prior service cost | 60 | — | ||||||
Total | $ | 20,027 | $ | 14 | ||||
| (In thousands) | Pension benefits | Other benefits | ||||||
Changes in accumulated other comprehensive income (loss), before tax: | ||||||||
Net actuarial gain, beginning of year | $ | (30,714 | ) | $ | (670 | ) | ||
Amortization | 2,227 | 49 | ||||||
Curtailment and settlement adjustments | (410 | ) | 60 | |||||
Actuarial loss | 43,362 | 270 | ||||||
Asset loss | 6,193 | — | ||||||
Other | (691 | ) | 305 | |||||
Net actuarial loss, end of year | $ | 19,967 | $ | 14 | ||||
Net prior service cost, beginning of year | $ | 121 | $ | — | ||||
Amortization | (61 | ) | — | |||||
Net prior service cost, end of year | $ | 60 | $ | — | ||||
F-264
Table of Contents
Note R—Derivative financial instruments
The Company historically purchased certain commodities, primarily corn and soybean meal, for use as ingredients in the feed it either sells commercially or consumes in its live operations. As a result, the Company’s operating results and cash flows are affected by changes in the price and availability of such feed ingredients. Prior to October 2008, the Company attempted to mitigate its exposure to these changes through a program of risk management that included the use of (i) contracts for the future delivery of commodities at fixed prices and (ii) derivative financial instruments such as exchange-traded futures and options. In October 2008, the Company suspended the use of derivative financial instruments in response to its current financial condition. It immediately settled all outstanding derivative financial instruments and recognized losses in that month totaling $18.4 million.
The Company has elected not to designate the derivative financial instruments it executes to mitigate its exposure to commodity price changes as cash flow hedges. The Company recognized $21.1 million and $38.3 million in losses related to changes in the fair value of these derivative financial instruments during 2009 and 2008, respectively. These losses are recorded in cost of sales. The impact of changes in the fair value of these derivative financial instruments in 2007 was immaterial. At September 26, 2009, the Company was not a party to any outstanding derivative financial instruments. At September 27, 2008, the Company recorded a liability for futures contracts with an aggregate fair value of $18.0 million executed to manage the price risk on 19.1 million bushels of corn and 0.3 million tons of soybean meal.
We occasionally execute derivative financial instruments to manage exposure to interest rate risk. In particular, we executed a Treasury lock instrument in 2007 to “lock in”, or secure, the Treasury rate that served as the basis for the pricing of a prospective public debt issue. A “treasury lock” is a synthetic forward sale of a US Treasury note or bond that is settled in cash based upon the difference between an agreed upon Treasury rate and the prevailing Treasury rate at settlement. We designated the lock instrument as a cash flow hedge and recognized changes in the fair value of the instrument in accumulated other comprehensive income until the prospective public debt issue occurred. Once the public debt was issued, we began recognizing the change in the fair value of the lock instrument as an adjustment to interest expense over the term of the related debt.
Note S—Related party transactions
Lonnie “Bo” Pilgrim, the Senior Chairman, and certain entities related to Mr. Pilgrim are, collectively, the major stockholder of the Company (the “Major Stockholder”).
Cash transactions with the Major Stockholder or related entities are summarized as follows:
| (In thousands) | 2009 | 2008 | 2007 | ||||||
Loan guaranty fees | $ | 1,473 | $ | 4,904 | $ | 3,592 | |||
Contract grower pay | 1,037 | 1,008 | 885 | ||||||
Lease payments on commercial egg property | 750 | 750 | 750 | ||||||
Other sales to Major Stockholder | 686 | 710 | 620 | ||||||
Lease payments and operating expenses on airplane | 68 | 456 | 507 | ||||||
F-265
Table of Contents
Pilgrim Interests, Ltd., an entity related to Lonnie “Bo” Pilgrim, guarantees a portion of the Company’s debt obligations. In consideration of such guarantees, the Company has paid Pilgrim Interests, Ltd. a quarterly fee equal to 0.25% of one-half of the average aggregate outstanding balance of such guaranteed debt. During 2009, 2008, and 2007, we paid $1.5 million, $4.9 million and $3.6 million, respectively, to Pilgrim Interests, Ltd. Pursuant to the terms of the DIP Credit Agreement, the Company may not pay any guarantee fees without the consent of the lenders party thereto. During 2009, the Company expensed loan guaranty fees totaling $7.1 million. At September 26, 2009, the Company classified accrued loan guaranty fees totaling $7.1 million asLiabilities subject to compromise.
The Company has executed chicken grower contracts involving farms owned by the Major Stockholder as well as a farm owned by one former officer and director that provide for the placement of Company-owned flocks on these farms during the grow-out phase of production. These contracts are on terms substantially the same as contracts executed by the Company with unaffiliated parties and can be terminated by either party upon completion of the grow-out phase for each flock. The aggregate amounts paid by the Company to the officers and directors party to these grower contracts were less than $2.0 million in each of the years 2009, 2008, and 2007.
The Company leases a commercial egg property including all of the ongoing costs of the operation from the Company’s Major Stockholder. The lease, which was executed in December 2000, runs for ten years with a monthly lease payment of $62,500.
The Major Stockholder owns both an egg laying operation and a chicken growing operation. At certain times during the year, the Major Stockholder may purchase live chickens and hens, and certain feed inventories during the grow-out phase for his flocks, from the Company and then sell the birds to the Company at maturity using a market-based formula in which the price is subject to a ceiling calculated at his cost plus two percent. The Company has not purchased chickens under this agreement since 2006.
The Company leased an airplane from its Major Stockholder under an operating lease agreement. The terms of the lease agreement required monthly payments of $33,000 plus operating expenses. The lease was terminated on November 18, 2008. Lease expense was $66,000 in 2009 and $396,000 for each of the years 2008 and 2007. Operating expenses were $1,500, $60,000 and $111,200 in 2009, 2008 and 2007, respectively.
The Company maintains depository accounts with a financial institution in which the Company’s Major Stockholder is also a major stockholder. Fees paid to this bank in 2009, 2008 and 2007 were insignificant. As of September 26, 2009, the Company had account balances at this financial institution of approximately $2.3 million.
The Major Stockholder has deposited $0.3 million with the Company as an advance on miscellaneous expenditures.
A son of the Major Stockholder sold commodity feed products and a limited amount of other services to the Company totaling approximately $0.4 million, $0.4 million and $0.6 million in 2009, 2008 and 2007, respectively. He also leases an insignificant amount of land from the Company.
F-266
Table of Contents
Note T—Commitments and contingencies
General
We are a party to many routine contracts in which we provide general indemnities in the normal course of business to third parties for various risks. Among other considerations, we have not recorded a liability for any of these indemnities as based upon the likelihood of payment, the fair value of such indemnities is immaterial.
Purchase obligations
The Company will sometimes enter into non-cancelable contracts to purchase capital equipment and certain commodities such as corn, soybean meal, cooking oil and natural gas. At September 26, 2009, the Company was party to outstanding purchase contracts totaling $91.6 million. Payments for purchases made under these contracts are due in less than one year.
Operating leases
The Consolidated Statements of Operations include rental expense for operating leases of approximately $68.4 million, $71.3 million and $67.3 million in 2009, 2008 and 2007, respectively. The Company’s future minimum lease commitments under non-cancelable operating leases are as follows: 2010—$39.8 million; 2011—$27.3 million; 2012—$15.6 million; 2013—$7.7 million; 2014—$1.4 million and thereafter—$0.1 million.
Certain of the Company’s operating leases include rent escalations. The Company includes the rent escalation in its minimum lease payments obligations and recognizes them as a component of rental expense on a straight-line basis over the minimum lease term.
The Company also maintains operating leases for various types of equipment, some of which contain residual value guarantees for the market value of assets at the end of the term of the lease. The terms of the lease maturities range from one to seven years. The maximum potential amount of the residual value guarantees is estimated to be approximately $10.6 million; however, the actual amount would be offset by any recoverable amount based on the fair market value of the underlying leased assets. No liability has been recorded related to this contingency as the likelihood of payments under these guarantees is not considered to be probable and the fair value of such guarantees is immaterial. The Company historically has not experienced significant payments under similar residual guarantees.
Financial instruments
At September 26, 2009, the Company was party to outstanding standby letters of credit totaling $65.9 million that affected the amount of funds available for borrowing under the secured revolving credit facility expiring in 2013. The Company was not a party to any outstanding letters of credit on that date that affected the amount of funds available for borrowing under the DIP Credit Agreement.
The Company’s loan agreements generally obligate the Company to reimburse the applicable lender for incremental increased costs due to a change in law that imposes (i) any reserve or special deposit requirement against assets of, deposits with or credit extended by such lender related to the loan, (ii) any tax, duty or other charge with respect to the loan (except standard income tax) or (iii) capital adequacy requirements. In addition, some of the Company’s loan
F-267
Table of Contents
agreements contain a withholding tax provision that requires the Company to pay additional amounts to the applicable lender or other financing party, generally if withholding taxes are imposed on such lender or other financing party as a result of a change in the applicable tax law. These increased cost and withholding tax provisions continue for the entire term of the applicable transaction, and there is no limitation on the maximum additional amounts the Company could be obligated to pay under such provisions. Any failure to pay amounts due under such provisions generally would trigger an event of default, and, in a secured financing transaction, would entitle the lender to foreclose upon the collateral to realize the amount due.
Litigation
The Company is subject to various legal proceedings and claims which arise in the ordinary course of business. In the Company’s opinion, it has made appropriate and adequate accruals for claims where necessary; however, the ultimate liability for these matters is uncertain, and if significantly different than the amounts accrued, the ultimate outcome could have a material effect on the financial condition or results of operations of the Company. See Item 3. “Legal Proceedings” for discussion of additional material proceedings.
On December 1, 2008, the Debtors filed voluntary petitions for relief under Chapter 11 of the Bankruptcy Code in the Bankruptcy Court. The cases are being jointly administered under Case No. 08-45664. The Debtors continue to operate their business as “debtors-in-possession” under the jurisdiction of the Bankruptcy Court and in accordance with the applicable provisions of the Bankruptcy Code and orders of the Bankruptcy Court. As of the date of the Chapter 11 filing, virtually all pending litigation against the Company (including the actions described below) is stayed as to the Company, and absent further order of the Bankruptcy Court, no party, subject to certain exceptions, may take any action, also subject to certain exceptions, to recover on pre-petition claims against the Debtors. At this time it is not possible to predict the outcome of the Chapter 11 filings or their effect on our business. Below is a summary of the most significant claims outstanding against the Company. The Company believes it has substantial defenses to the claims made and intends to vigorously defend these cases.
Among the claims presently pending are two identical claims brought against certain executive officers and employees of the Company and the Pilgrim’s Pride Compensation Committee seeking unspecified damages under section 502 of the Employee Retirement Income Security Act of 1974 (“ERISA”), 29 U.S.C. § 1132. Each of these actions was brought by individual participants in the Pilgrim’s Pride Stock Investment Plan, individually and on behalf of a putative class, alleging that the individual defendants breached fiduciary duties to plan participants and beneficiaries. Although the Company is not a named defendant in these actions, our bylaws require us to indemnify our current and former directors and officers from any liabilities and expenses incurred by them in connection with actions they took in good faith while serving as an officer or director. In these actions the plaintiffs assert claims in excess of $35.0 million. The likelihood of an unfavorable outcome or the amount or range of any possible loss to the Company cannot be determined at this time.
Also, among the claims presently pending against the Company are two identical claims seeking unspecified damages, each brought by a stockholder, individually and on behalf of a putative class, alleging violations of certain antifraud provisions of the Securities Exchange Act of 1934. The Company intends to defend vigorously against the merits of these actions. The likelihood of an unfavorable outcome or the amount or range of any possible loss to the Company cannot be determined at this time.
F-268
Table of Contents
Other claims presently pending against the Company are claims seeking unspecified damages brought by current and former employees seeking compensation for the time spent donning and doffing clothing and personal protective equipment. We are aware of an industry-wide investigation by the Wage and Hour Division of the US Department of Labor to ascertain compliance with various wage and hour issues, including the compensation of employees for the time spent on activities such as donning and doffing clothing and personal protective equipment. Further, two significant lawsuits are outstanding related to donning and doffing issues. Due, in part, to the government investigation and the recent US Supreme Court decision inIBP, Inc. v. Alvarez, it is possible that we may be subject to additional employee claims. The Company believes it has reached tentative settlements with its regulators and on the two principal lawsuits related to donning and doffing issues. Any settlements will have to be confirmed by the Bankruptcy Court. As a result, the Company reduced its litigation reserves in September 2009 based on the terms of the tentative settlements. Nonetheless, there can be no assurances that other similar claims may not be brought against the Company. Certain of these claims are in the process of being settled.
Other claims presently pending against the Company are claims seeking unspecified damages brought by current or former contract chicken growers who allege, along with other assertions, that the Company breached grower contracts, conspired with a competitor to depress grower pay and made false representations to induce the plaintiffs into building chicken farms and entering into chicken growing agreements with the Company. We deny any liability in these actions and intend to assert vigorous defenses to the litigation. Nonetheless, there can be no assurances that other similar claims may not be brought against the Company.
Another claim presently pending against the Company is a claim asserted by the City of Clinton, Arkansas, (the “City”) seeking approximately $28 million in damages relating to construction of and/or improvements to a wastewater facility to purify water discharged from a processing plant that the Company idled in 2009. The Company filed a motion to dismiss, which was granted by the federal district court in September 2009. Recently, the City requested to re-plead its claims. The court has not decided whether the City will be permitted to proceed with a lawsuit against the Company. We deny any liability to the City and intend to assert vigorous defenses should the City be allowed to proceed with a lawsuit against the Company. Nonetheless, there can be no assurances that other similar claims may not be brought against the Company.
US Immigration and Customs Enforcement (“ICE”) investigated allegations of identity theft within our workforce. With our cooperation, ICE arrested approximately 350 of our employees in 2008 believed to have engaged in identity theft at five of our facilities. ICE has also alleged that we may not have fully complied with certain regulations and that fines may be assessed against us. The Company continues to cooperate with the investigation and will vigorously defend itself against any claims brought against the Company; however, no assurances can be given that further enforcement efforts by governmental authorities against our employees or the Company (i) will not disrupt a portion of our workforce or our operations at one or more of our facilities, thereby negatively impacting our business or (ii) result in the assessment of fines against us that could have a material adverse effect on our financial position, results of operations or cash flows.
F-269
Table of Contents
Note U—Insurance proceeds
On July 21, 2008, a fire in the Mt. Pleasant, Texas, protein conversion plant (the “Mt. Pleasant Fire”) damaged a significant portion of the plant’s building, machinery and equipment. During 2009 and 2008, the Company received $37.0 million and $10.0 million, respectively, of proceeds that it recognized in cost of sales for insurance recovery related to business interruption costs. During 2009 and 2008, the Company received $5.0 million and $30.0 million respectively, of proceeds that it recognized in cost of sales for insurance recovery related to asset replacement costs.
Note V—Business segments
We operate in two reportable business segments as (i) a producer and seller of chicken products and (ii) a seller of other products.
Our chicken segment includes sales of chicken products we produce and purchase for resale in the US, Puerto Rico and Mexico. Our chicken segment conducts separate operations in the US, Puerto Rico and Mexico and is reported as two separate geographical areas. For segment reporting purposes, we include Puerto Rico with our US operations.
Our other products segment includes distribution of non-poultry products that are purchased from third parties and sold to independent grocers and quick service restaurants. Also included in this category are sales of table eggs, feed, protein products, live hogs and other items, some of which are produced or raised by the Company.
Corporate expenses are allocated to Mexico based upon various apportionment methods for specific expenditures incurred related thereto with the remaining amounts allocated to the US portions of the segments based on number of employees.
Assets associated with our corporate functions, included cash and cash equivalents and investments in available for sale securities are included in our chicken segment.
Selling, general and administrative expenses related to our distribution centers are allocated based on the proportion of net sales to the particular segment to which the product sales relate.
Depreciation and amortization, total assets and capital expenditures of our distribution centers are included in our chicken segment based on the primary focus of the centers.
F-270
Table of Contents
The following table presents certain information regarding our segments:
As of or for the year ended (In thousands) | September 26, 2009 | September 27, 2008 | September 29, 2007(a) | ||||||||
Net sales to customers: | |||||||||||
Chicken: | |||||||||||
United States | $ | 6,063,914 | $ | 7,077,047 | $ | 6,328,354 | |||||
Mexico | 487,785 | 543,583 | 488,466 | ||||||||
Subtotal | 6,551,699 | 7,620,630 | 6,816,820 | ||||||||
Other Products: | |||||||||||
United States | 505,738 | 863,495 | 661,115 | ||||||||
Mexico | 30,618 | 34,632 | 20,677 | ||||||||
Subtotal | 536,356 | 898,127 | 681,792 | ||||||||
Total | $ | 7,088,055 | $ | 8,518,757 | $ | 7,498,612 | |||||
Operating income (loss)(b): | |||||||||||
Chicken: | |||||||||||
United States | $ | 5,583 | $ | (604,685 | ) | $ | 192,447 | ||||
Mexico | 22,353 | (25,702 | ) | 13,116 | |||||||
Subtotal | 27,936 | (630,387 | ) | 205,563 | |||||||
Other Products: | |||||||||||
United States | 47,195 | 113,770 | 28,636 | ||||||||
Mexico | 6,647 | 4,513 | 2,992 | ||||||||
Subtotal | 53,842 | 118,283 | 31,628 | ||||||||
Goodwill impairment | — | (501,446 | ) | — | |||||||
Asset impairment and operational restructuring charges | (12,464 | ) | (27,990 | ) | — | ||||||
Administrative restructuring charges | (1,987 | ) | (16,156 | ) | — | ||||||
Total | $ | 67,327 | $ | (1,057,696 | ) | $ | 237,191 | ||||
Depreciation and amortization(b)(c)(d): | |||||||||||
Chicken: | |||||||||||
United States | $ | 210,333 | $ | 215,586 | $ | 183,808 | |||||
Mexico | 9,527 | 10,351 | 11,015 | ||||||||
Subtotal | 219,860 | 225,937 | 194,823 | ||||||||
Other Products: | |||||||||||
United States | 15,919 | 13,354 | 8,278 | ||||||||
Mexico | 226 | 244 | 215 | ||||||||
Subtotal | 16,145 | 13,598 | 8,493 | ||||||||
Total | $ | 236,005 | $ | 239,535 | $ | 203,316 | |||||
Total assets(e): | |||||||||||
Chicken: | |||||||||||
United States | $ | 2,542,818 | $ | 2,733,089 | $ | 3,247,812 | |||||
Mexico | 345,205 | 372,952 | 348,894 | ||||||||
Subtotal | 2,888,023 | 3,106,041 | 3,596,706 | ||||||||
Other Products: | |||||||||||
United States | 168,776 | 153,607 | 104,644 | ||||||||
Mexico | 3,705 | 5,542 | 4,120 | ||||||||
Subtotal | 172,481 | 159,149 | 108,764 | ||||||||
Total | $ | 3,060,504 | $ | 3,265,190 | $ | 3,705,470 | |||||
F-271
Table of Contents
As of or for the year ended (In thousands) | September 26, 2009 | September 27, 2008 | September 29, 2007(a) | ||||||
Acquisitions of property, plant and equipment (excluding business acquisition)(f): | |||||||||
Chicken: | |||||||||
United States | $ | 57,001 | $ | 148,811 | $ | 164,449 | |||
Mexico | 2,118 | 545 | 1,633 | ||||||
Subtotal | 59,119 | 149,356 | 166,082 | ||||||
Other Products: | |||||||||
United States | 29,074 | 2,815 | 5,699 | ||||||
Mexico | — | 330 | 40 | ||||||
Subtotal | 29,074 | 3,145 | 5,739 | ||||||
Total | $ | 88,193 | $ | 152,501 | $ | 171,821 | |||
| (a) | The Company acquired Gold Kist on December 27, 2006, for $1.139 billion. |
| (b) | Includes amortization of capitalized financing costs of approximately $6.8 million, $4.9 million and $6.6 million in 2009, 2008 and 2007, respectively. |
| (c) | Includes amortization of intangible assets of $10.2 million, $10.2 million and $8.1 million recognized in 2009, 2008 and 2007, respectively, related primarily to the Gold Kist and ConAgra Chicken acquisitions. |
| (d) | Excludes depreciation costs incurred by our discontinued turkey business of $0.7 million and $1.6 million during 2008 and 2007, respectively. The Company did not incur depreciation costs related to its discontinued turkey business in 2009. |
| (e) | Excludes total assets of our discontinued turkey business of $33.5 million and $68.8 million at September 27, 2008, and September 29, 2007, respectively. The Company’s discontinued turkey business did not own any assets at September 26, 2009. |
| (f) | Excludes acquisitions of property, plant and equipment by our discontinued turkey business of $0.5 million during 2007. The Company did not acquire property, plant and equipment for its discontinued turkey business during 2009 or 2008. |
The Company had one customer that represented 10% or more of annual net sales in 2009, 2008 and 2007.
The Company’s Mexico operations had net long-lived assets of $88.6 million, $97.2 million and $106.2 million at September 26, 2009, September 27, 2008, and September 29, 2007, respectively.
The Company’s Mexico operations had net assets of $143.1 million and $230.5 million at September 26, 2009, and September 27, 2008, respectively.
F-272
Table of Contents
Note W—Quarterly results (unaudited)
2009 (In thousands, except per share data) | First(a) | Second(b) | Third(c) | Fourth(d) | Year | |||||||||||||
Net sales | $ | 1,876,991 | $ | 1,698,102 | $ | 1,776,813 | $ | 1,736,149 | $ | 7,088,055 | ||||||||
Gross profit (loss) | (83,382 | ) | 97,724 | 183,414 | 172,678 | 370,434 | ||||||||||||
Operating income (loss) | (178,241 | ) | 20,280 | 108,596 | 116,692 | 67,327 | ||||||||||||
Income (loss) from continuing operations | (229,356 | ) | (58,790 | ) | 53,239 | 82,726 | (152,181 | ) | ||||||||||
Income (loss) from discontinued business | 574 | 25 | — | — | 599 | |||||||||||||
Net income (loss) | (228,782 | ) | (58,765 | ) | 53,239 | 82,726 | (151,582 | ) | ||||||||||
Per share amounts-basic: | ||||||||||||||||||
Continuing operations | $ | (3.10 | ) | $ | (0.79 | ) | $ | 0.72 | $ | 1.11 | $ | (2.06 | ) | |||||
Discontinued business | 0.01 | — | — | — | 0.01 | |||||||||||||
Net income (loss) | (3.09 | ) | (0.79 | ) | 0.72 | 1.11 | (2.05 | ) | ||||||||||
Per share amounts-diluted: | ||||||||||||||||||
Continuing operations | $ | (3.10 | ) | $ | (0.79 | ) | $ | 0.69 | $ | 1.07 | $ | (2.06 | ) | |||||
Discontinued operations | 0.01 | — | — | — | 0.01 | |||||||||||||
Net income (loss) | (3.09 | ) | (0.79 | ) | 0.69 | 1.07 | (2.05 | ) | ||||||||||
Number of days in quarter | 91 | 91 | 91 | 91 | 364 | |||||||||||||
| (a) | In the first quarter of 2009, the Company recognized post-petition reorganization charges of $13.3 million, pre-petition restructuring charges of $2.4 million, losses on derivative financial instruments of $21.4 million and Mt. Pleasant Fire insurance recoveries of $5.0 million. |
| (b) | In the second quarter of 2009, the Company recognized post-petition reorganization charges of $35.4 million, pre-petition restructuring credits of $0.4 million and Mt. Pleasant Fire insurance recoveries of $5.0 million. |
| (c) | In the third quarter of 2009, the Company recognized post-petition reorganization charges of $16.8 million and Mt. Pleasant Fire insurance recoveries of $15.0 million. |
| (d) | In the fourth quarter of 2009, the Company recognized post-petition reorganization charges of $21.8 million, restructuring charges of $12.5 million and Mt. Pleasant Fire insurance recoveries of $17.0 million. |
2008 (In thousands, except per share data) | First | Second(a) | Third(b) | Fourth(c) | Year | |||||||||||||||
Net sales | $ | 2,047,353 | $ | 2,100,794 | $ | 2,207,476 | $ | 2,163,134 | $ | 8,518,757 | ||||||||||
Gross profit | 105,103 | (35,401 | ) | 53,211 | (286,408 | ) | (163,495 | ) | ||||||||||||
Operating income (loss) | 670 | (143,629 | ) | (42,531 | ) | (872,206 | ) | (1,057,696 | ) | |||||||||||
Income (loss) from continuing operations | (33,166 | ) | (111,501 | ) | (48,344 | ) | (799,161 | ) | (992,172 | ) | ||||||||||
Income (loss) from discontinued business | 837 | 53 | (4,437 | ) | (2,862 | ) | (6,409 | ) | ||||||||||||
Net income (loss) | (32,329 | ) | (111,448 | ) | (52,781 | ) | (802,023 | ) | (998,581 | ) | ||||||||||
Per share amounts-basic and diluted: | ||||||||||||||||||||
Continuing operations | $ | (0.50 | ) | $ | (1.67 | ) | $ | (0.69 | ) | $ | (10.79 | ) | $ | (14.31 | ) | |||||
Discontinued business | 0.01 | — | (0.06 | ) | (0.04 | ) | (0.09 | ) | ||||||||||||
Net income (loss) | (0.49 | ) | (1.67 | ) | (0.75 | ) | (10.83 | ) | (14.40 | ) | ||||||||||
Dividends | 0.0225 | 0.0225 | 0.0225 | 0.0225 | 0.0900 | |||||||||||||||
Number of days in quarter | 91 | 91 | 91 | 91 | 364 | |||||||||||||||
| (a) | In the second quarter of 2008, the Company recognized restructuring charges of $17.7 million. |
| (b) | In the third quarter of 2008, the Company recognized gains on derivative financial instruments of $102.4 million. |
| (c) | In the fourth quarter of 2008, the Company recognized goodwill impairment of $501.4 million, losses on derivative financial instruments of $155.7 million, restructuring charges of $22.0 million, valuation allowances of $34.6 million and Mt. Pleasant Fire insurance recoveries of $35.0 million. |
F-273
Table of Contents
shares

Common stock
Prospectus
| J.P. Morgan | BofA Merrill Lynch | |
| Morgan Stanley | BMO Capital Markets | |||
| Deutsche Bank Securities | ||||
| Rabo Securities USA, Inc. | Wells Fargo Securities | |
| ING Wholesale | Santander | Stephens Inc. | ||
| Bradesco BBI | ||||
, 2010
You should rely only on the information contained in this prospectus. We have not authorized anyone to provide you with information different from that contained in this prospectus. We are offering to sell, and seeking offers to buy, common stock only in jurisdictions where offers and sales are permitted. The information contained in this prospectus is accurate only as of the date of this prospectus, regardless of the time of delivery of this prospectus or of any sale of our common stock.
No action is being taken in any jurisdiction outside the United States to permit a public offering of the common stock or possession or distribution of this prospectus in that jurisdiction. Persons who come into possession of this prospectus in jurisdictions outside the United States are required to inform themselves about and to observe any restrictions as to this offering and the distribution of this prospectus applicable to that jurisdiction.
Until , 2010, all dealers that buy, sell or trade in our common stock, whether or not participating in this offering, may be required to deliver a prospectus. This is in addition to the dealers’ obligation to deliver a prospectus when acting as underwriters and with respect to their unsold allotments or subscriptions.
Table of Contents
Part II
Information not required in the prospectus
Item 13. Other expenses of issuance and distribution.
The following table sets forth the expenses (other than underwriting compensation expected to be incurred) in connection with this offering. All of such amounts (except the SEC registration fee, FINRA filing fee and the NYSE listing fee) are estimated.
SEC registration fee | $111,600 | |
FINRA filing fee | 75,500 | |
NYSE listing fee | * | |
Printing and engraving expenses | * | |
Legal fees and expenses | * | |
Accounting fees and expenses | * | |
Blue Sky fees and expenses (including legal fees) | * | |
Transfer agent and registrar fees and expenses | * | |
Miscellaneous | * | |
Total | $ * | |
| * | To be completed by amendment. |
Item 14. Indemnification of directors and officers.
Upon completion of this offering, the Registrant’s amended and restated certificate of incorporation will contain provisions that eliminate, to the maximum extent permitted by the General Corporation Law of the State of Delaware, the personal liability of the Registrant’s directors and executive officers for monetary damages for breach of their fiduciary duties as directors or officers. The Registrant’s amended and restated certificate of incorporation and bylaws will provide that the Registrant must indemnify its directors and executive officers and may indemnify its employees and other agents to the fullest extent permitted by the General Corporation Law of the State of Delaware.
Sections 145 and 102(b)(7) of the General Corporation Law of the State of Delaware provide that a corporation may indemnify any person made a party to an action by reason of the fact that he or she was a director, executive officer, employee or agent of the corporation or is or was serving at the request of a corporation against expenses (including attorneys’ fees), judgments, fines and amounts paid in settlement actually and reasonably incurred by him or her in connection with such action if he or she acted in good faith and in a manner he or she reasonably believed to be in, or not opposed to, the best interests of the corporation and, with respect to any criminal action or proceeding, had no reasonable cause to believe his or her conduct was unlawful, except that, in the case of an action by or in right of the corporation, no indemnification may generally be made in respect of any claim as to which such person is adjudged to be liable to the corporation.
The Registrant has entered into indemnification agreements with its current directors and executive officers, in addition to the indemnification provided for in its amended and restated certificate of incorporation and bylaws, and intends to enter into indemnification agreements with any new directors and executive officers in the future.
The Registrant has purchased and intends to maintain insurance on behalf of each any person who is or was a director or officer of the Registrant against any loss arising from any claim
II-1
Table of Contents
asserted against him or her and incurred by him or her in any such capacity, subject to certain exclusions.
The Underwriting Agreement (see Exhibit 1.1 hereto) provides for indemnification by the underwriters of the Registrant, certain of its stockholders and its executive officers and directors, and by the Registrant of the underwriters, for certain liabilities, including liabilities arising under the Securities Act.
See also the undertakings set out in response to Item 17 herein.
Item 15. Recent sales of unregistered securities.
On April 27, 2009, in a transaction exempt from the registration requirements of the Securities Act of 1933, or the Securities Act, our wholly owned subsidiaries JBS USA, LLC and JBS USA Finance, Inc. issued 11.625% senior unsecured notes due 2014 in an aggregate principal amount of $700.0 million, which, after deducting initial purchaser discounts, commissions and expenses of approximately $49.2 million in respect of this offering, generated net proceeds of approximately $650.8 million. The notes were sold to several initial purchasers for whom J.P. Morgan Securities Inc. and Banc of America Securities LLC acted as representatives. The sale of the notes to the initial purchasers was exempt from the registration requirements of the Securities Act as sales by an issuer not involving any public offering, and resold by the initial purchasers to qualified institutional buyers in reliance upon Rule 144A under the Securities Act and to persons outside the United States in reliance upon Regulation S of the Securities Act. The proceeds of the note issuance were used to repay $100.0 million of borrowings under our secured revolving credit facility and to repay $550.8 million of the outstanding principal and accrued interest on intercompany loans to us from a subsidiary of JBS S.A.
On July 11, 2007, JBS S.A. (through J&F Acquisition Co., which thereafter merged Swift Foods Company with and into itself and subsequently changed its name to JBS USA Holdings, Inc.) acquired 100% of the outstanding share capital of Swift Foods Company, the Registrant’s predecessor company, for a purchase price of $1,470.6 million. The sale of the shares to such holder was made in reliance on Section 4(2) of the Securities Act. J&F Acquisition Co. was the only purchaser of all of the shares of Swift Foods Company, and it had sufficient knowledge and experience to evaluate the risks of the investment and had access to material business and financial information made available to it by Swift Foods Company. To the Registrant’s knowledge, the owners of Swift Foods Company did not use any form of public solicitation or general advertising in connection with their offer of the securities of Swift Foods Company.
On December 21, 2009, we and JBS S.A. entered into a purchase and sale agreement pursuant to which we agreed to issue and sell 20-25% of our common stock to JBS S.A. for an aggregate purchase price of $2.0 billion. The percentage of shares of our common stock to be issued and sold will be equal to $2.0 billion divided by our equity valuation in U.S. dollars based on the number of shares outstanding immediately prior to this offering, but calculated on the basis of the price per share in this offering, multiplied by 100. As a result of this purchase and sale agreement, JBS S.A. will hold a 20-25% interest in us, and the remaining interest in us will be held by JBS S.A. indirectly through the selling stockholder.
II-2
Table of Contents
Item 16. Exhibits and financial statement schedules.
The following Exhibits are filed as part of this Registration Statement.
| (a) | Exhibits: |
The attached exhibit index is incorporated herein by reference.
| (b) | Financial statement schedules. |
None.
Item 17. Undertakings.
The undersigned Registrant hereby undertakes to provide to the underwriters at the closing specified in the international underwriting agreement certificates in such denominations and registered in such names as required by the underwriters to permit prompt delivery to each purchaser.
Insofar as indemnification for liabilities arising under the Securities Act of 1933 may be permitted to directors, officers and controlling persons of the Registrant pursuant to the provisions described in Item 14 above, or otherwise, the Registrant has been advised that in the opinion of the Securities and Exchange Commission such indemnification is against public policy as expressed in the Securities Act and is, therefore, unenforceable. In the event that a claim for indemnification against such liabilities (other than the payment by the Registrant of expenses incurred or paid by a director, officer or controlling person of the Registrant in the successful defense of any action, suit or proceeding) is asserted by such director, officer or controlling person in connection with the securities being registered, the Registrant will, unless in the opinion of its counsel the matter has been settled by controlling precedent, submit to a court of appropriate jurisdiction the question whether such indemnification by it is against public policy as expressed in the Securities Act and will be governed by the final adjudication of such issue.
The undersigned Registrant hereby undertakes that:
| (1) | For purposes of determining any liability under the Securities Act of 1933, the information omitted from the form of prospectus filed as part of this registration statement in reliance upon Rule 430A and contained in a form of prospectus filed by the Registrant pursuant to Rule 424(b)(1) or (4) or 497(h) under the Securities Act shall be deemed to be part of this registration statement as of the time it was declared effective. |
| (2) | For purposes of determining any liability under the Securities Act of 1933, each post-effective amendment that contains a form of prospectus shall be deemed to be a new registration statement relating to the securities offered therein, and the offering of such securities at that time shall be deemed to be the initial bona fide offering thereof. |
II-3
Table of Contents
Signatures
Pursuant to the requirements of the Securities Act of 1933, the registrant has duly caused this amended Registration Statement to be signed on its behalf by the undersigned, thereunto duly authorized, in the City of Greeley, State of Colorado, on December 23, 2009.
JBS USA HOLDINGS, INC. | ||
By: | /s/ WESLEY MENDONÇA BATISTA | |
| Name: | Wesley Mendonça Batista | |
| Title: | Chief Executive Officer | |
Pursuant to the requirements of the Securities Act of 1933, as amended, this amended Registration Statement has been signed by the following persons in the capacities and on the dates indicated:
| Signature | Title | Date | ||
/s/ WESLEY MENDONÇA BATISTA Wesley Mendonça Batista | President, Chief Executive Officer and Director (Principal Executive Officer) | December 23, 2009 | ||
/s/ * André Nogueira de Souza | Chief Financial Officer (Principal Financial Officer) | December 23, 2009 | ||
/s/ * Joesley Mendonça Batista | Director | December 23, 2009 | ||
/s/ * José Batista Júnior | Director | December 23, 2009 | ||
/s/ WILLIAM GEORGE TRUPKIEWICZ William George Trupkiewicz | Chief Accounting Officer | December 23, 2009 | ||
*By /s/ WESLEY MENDONÇA BATISTA Wesley Mendonça Batista Attorney-in-Fact | ||||
Table of Contents
Exhibit index
| Exhibit number | Exhibit title | |
| 1.1* | Form of Underwriting Agreement | |
| 2.1** | Stock Purchase Agreement between Pilgrim’s Pride Corporation and JBS USA Holdings, Inc. dated as of September 16, 2009 | |
| 2.2** | Form of Stockholders Agreement between JBS USA Holdings, Inc. and Pilgrim’s Pride Corporation | |
| 2.3** | Plan Support Agreement between JBS USA Holdings, Inc. and Mr. Lonnie A. Pilgrim dated as of September 16, 2009 | |
| 3.1* | Certificate of Incorporation of the Registrant, as currently in effect | |
| 3.2* | Form of Amended and Restated Certificate of Incorporation of the Registrant, to be effective upon closing of the offering | |
| 3.3* | Bylaws of the Registrant, as currently in effect | |
| 3.4* | Form of Amended and Restated Bylaws of the Registrant, to be effective upon closing of the offering | |
| 4.1* | Specimen Common Stock Certificate of the Registrant | |
| 5.1* | Opinion of White & Case LLP | |
| 10.1.1** | Indenture by and among JBS USA, LLC, JBS USA Finance, Inc., JBS USA Holdings, Inc., each of the other guarantors named therein, and The Bank of New York Mellon, dated April 27, 2009 | |
| 10.1.2** | Indenture by and between JBS S.A., JPMorgan Chase Bank, N.A., The Bank of Tokyo-Mitsubishi UFJ, Ltd. and J.P. Morgan Bank Luxembourg S.A., dated August 4, 2006 | |
| 10.1.3** | First Supplemental Indenture by and between JBS S.A., JBS Finance Ltd., Flora Produtos de Higiene e Limpeza Ltda., and The Bank of New York Mellon, dated January 31, 2007 | |
| 10.1.4** | Second Supplemental Indenture by and between JBS S.A., JBS Finance Ltd., the Registrant, and The Bank of New York Mellon, dated September 6, 2007 | |
| 10.1.5** | Third Supplemental Indenture by and between JBS S.A., JBS Finance Ltd., and The Bank of New York Mellon, dated August 14, 2008 | |
| 10.1.6* | Revolving Loan Credit Agreement by and among JBS USA, LLC (formerly JBS USA, Inc.), the other credit parties signatories thereto, General Electric Capital Corporation, GE Capital Markets, Inc., Credit Suisse Securities (USA) LLC, Rabobank Nederland, JPMorgan Securities Inc. and JPMorgan Chase Bank, N.A., dated November 5, 2008 | |
| 10.1.7* | Amendment No. 1 to Revolving Loan Credit Agreement, dated December 29, 2008 | |
| 10.1.8* | Amendment No. 2 to Revolving Loan Credit Agreement, dated April 22, 2009 | |
| 10.1.9* | Guaranty and Security Agreement by and among JBS USA, LLC (formerly JBS USA, Inc.), each other grantor party thereto and General Electric Capital Corporation, dated November 5, 2008 | |
| 10.1.10* | Amended and Restated Credit Agreement by and among J&F Oklahoma Holdings Inc., Five Rivers Ranch Cattle Feeding, LLC, Coöperatieve Centrale Raiffeisen-Boerenleenbank B.A. “Rabobank Nederland”, New York Branch, each of the banks or other lending institutions which is a signatory thereto, ING Capital LLC, Bank of America, N.A., US Bank National Association, and Wells Fargo Bank, National Association, dated October 7, 2008 | |
Table of Contents
| Exhibit number | Exhibit title | |
| 10.1.11* | Second Amendment to Amended and Restated Credit Agreement by and among J&F Oklahoma Holdings Inc., Five Rivers Ranch Cattle Feeding LLC, each of the banks or other lending institutions which is a signatory thereto, and Coöperatieve Centrale Raiffeisen-Boerenleenbank B.A. “Rabobank Nederland”, New York Branch, dated October 31, 2008 | |
| 10.1.12* | Amended and Restated Security Agreement by and among J&F Oklahoma Holdings Inc., Five Rivers Ranch Cattle Feeding LLC, any subsidiary of J&F Oklahoma Holdings Inc. and/or Five Rivers Ranch Cattle Feeding LLC that may execute and deliver the Subsidiary Joinder Agreement, and Coöperatieve Centrale Raiffeisen-Boerenleenbank B.A. “Rabobank Nederland”, New York Branch, dated October 7, 2008 | |
| 10.1.13* | Consolidated, Amended and Restated Intercompany Loan Agreement dated April 27, 2009 by and between JBS HU Liquidity Management LLC and its Swiss branch, JBS HU Liquidity Management LLC Szombathely (HU) Zug Branch, and JBS USA Holdings, Inc. | |
| 10.1.14* | Corporate Offer Letter, by and among Swift Australia (Southern) Pty Limited (formerly Tasman Group Services Pty Ltd A.C.N., Baybrick Pty Ltd, JBS Southern Australia Pty Ltd, JBS Southern Holdco Pty Ltd and NAB, dated May 2, 2008 | |
| 10.1.15* | AUD120,000,000 Facilities Agreement, by and among Swift Australia Pty Ltd, the guarantors specified therein and Australia and New Zealand Banking Group Limited, dated February 26, 2008 | |
| 10.1.16*† | Raw Material Supply Agreement, by and between JBS USA Holdings, Inc. and Beef Products Inc., dated February 27, 2008 | |
| 10.1.17*† | First Amendment to Raw Material Supply Agreement entered into between JBS USA Holdings, Inc. and Beef Products Inc. on February 27, 2008, dated October 20, 2008 | |
| 10.1.18* | Amended and Restated Promissory Note issued by JBS USA Holdings, Inc. in favor of NBPCO Holdings, LLC, in the amount of US$173,191,457.37, dated December 18, 2008 | |
| 10.1.19* | Cattle Purchase and Sale Agreement by and between JBS USA, LLC and J&F Oklahoma Holdings Inc., dated October 23, 2008 | |
| 10.1.20* | Cattle Supply and Feeding Agreement by and between Five Rivers Ranch Cattle Feeding LLC and J&F Oklahoma Holdings Inc., dated October 23, 2008 | |
| 10.1.21* | JBS USA Holdings, Inc. 2010 Stock Incentive Plan | |
| 10.1.22* | English translation of Shareholders’ Agreement by and among BNDES Participações S.A.—BNDESPAR, J&F Participações S.A., ZMF Fundo de Investimento em Participações, and JBS S.A., dated December 22, 2009 | |
| 10.1.23* | English translation of Investment Agreement among BNDES Participações S.A.—BNDESPAR, JBS S.A., J&F Participações S.A., ZMF Fundo de Investimento em Participações, and JBS USA Holdings, Inc., dated December 22, 2009 | |
| 10.1.24* | Registration Rights Agreement between JBS USA Holdings, Inc. and BNDES Participações S.A.—BNDESPAR | |
| 10.1.25* | Purchase and Sale Agreement between JBS S.A. and JBS USA Holdings, Inc. dated as of December 21, 2009 | |
| 15 | Letter of BDO Seidman, LLP regarding unaudited interim financial information | |
| 21 | List of subsidiaries of the Registrant | |
Table of Contents
| Exhibit number | Exhibit title | |
| 23.1 | Consent of BDO Seidman, LLP | |
| 23.2 | Consent of Grant Thornton LLP | |
| 23.3 | Consent of Ernst & Young LLP | |
| 23.4 | Consent of Deloitte & Touche LLP | |
| 23.5 | Consent of Ernst & Young LLP | |
| 23.6* | Consent of White & Case LLP (included in Exhibit 5.1) | |
| 24** | Power(s) of attorney | |
| * | To be filed by amendment. |
| ** | Previously filed. |
| † | Portions of these documents are expected to be omitted pursuant to a request by the Registrant for confidential treatment. |
Certain debt instruments of the Registrant and its subsidiaries have been omitted as exhibits because the amounts involved in such debt instruments are less than 10% of the Registrant’s total assets. Copies of debt instruments for which the related debt is less than 10% of the Registrant’s total assets will be furnished to the Commission upon request.