UNITED STATES
SECURITIES AND EXCHANGE COMMISSION
WASHINGTON, D.C. 20549
FORM N-CSR
CERTIFIED SHAREHOLDER REPORT OF REGISTERED
MANAGEMENT INVESTMENT COMPANIES
Investment Company Act file number 811-22314
Oppenheimer Corporate Bond Fund
(Exact name of registrant as specified in charter)
6803 South Tucson Way, Centennial, Colorado 80112-3924
(Address of principal executive offices) (Zip code)
Cynthia Lo Bessette
OFI Global Asset Management, Inc.
225 Liberty Street, New York, New York 10281-1008
(Name and address of agent for service)
Registrant’s telephone number, including area code: (303) 768-3200
Date of fiscal year end: July 31
Date of reporting period: 7/31/2018
Item 1. Reports to Stockholders.
Table of Contents
Class A Shares
AVERAGE ANNUAL TOTAL RETURNS AT 7/31/18
| | | | | | |
| | |
| | | Class A Shares of the Fund | | |
| | | Without Sales Charge | | With Sales Charge | | Bloomberg Barclays
U.S. Aggregate Bond
Index |
1-Year | | -1.67% | | -6.35% | | -0.80% |
5-Year | | 2.94 | | 1.94 | | 2.25 |
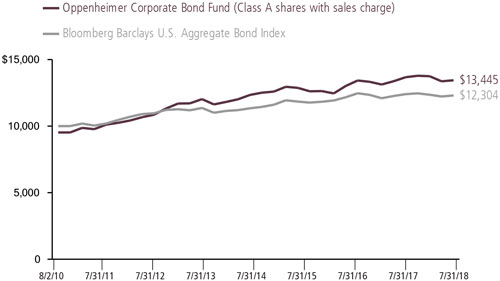
Since Inception (8/2/10) | | 4.40 | | 3.77 | | 2.63 |
Performance data quoted represents past performance, which does not guarantee future results. The investment return and principal value of an investment in the Fund will fluctuate so that an investor’s shares, when redeemed, may be worth more or less than their original cost. Fund returns include changes in share price, reinvested distributions, and a 4.75% maximum applicable sales charge except where “without sales charge” is indicated. Current performance may be lower or higher than the performance quoted. Returns do not consider capital gains or income taxes on an individual’s investment. Returns for periods of less than one year are cumulative and not annualized. For performance data current to the most recent month-end, visit oppenheimerfunds.com or call 1.800.CALL OPP (225.5677). See Fund prospectuses and summary prospectuses for more information on share classes and sales charges.
2 OPPENHEIMER CORPORATE BOND FUND
Fund Performance Discussion
MARKET OVERVIEW
The U.S. economy continued to perform well during the reporting period. U.S. 2018 gross domestic product (GDP) increased at an estimated 4.2% annualized rate over the second quarter of 2018, significantly exceeding its 2% trend growth of this expansion. Private consumption, the driving force of the economy in recent years, is growing at a stable rate. Additionally, business fixed investment has gained momentum in recent months and is broadening across sectors. With increasingly less slack in the economy, strong profits, and the corporate tax cuts, we believe investment should support growth and productivity improvements.
The Federal Reserve (Fed) hiked the Fed Funds target rate by 25 basis points twice – in March and June – ending the period in a range of 1.75% - 2.00%. The Fed is on track to deliver 1-2 more hikes this year, as the economy is near the Fed’s dual mandate of full employment and price stability. On the inflation front, underlying inflation is around the Fed’s 2% target. The unemployment rate is at historical lows; however, the rising labor participation rate and stable wage growth suggest that there may still be some slack in the labor market. The Federal Open Market Committee (FOMC) under new chair Jerome Powell’s leadership signaled that the Fed will remain cautious and tighten policy gradually,
COMPARISON OF CHANGE IN VALUE OF $10,000 HYPOTHETICAL INVESTMENTS IN:
3 OPPENHEIMER CORPORATE BOND FUND
giving comfort to the markets. Thus far, the Fed’s hiking cycle has been orderly.
Despite the strength of the U.S. economy and the Fed’s orderly hiking cycle, international economic and geopolitical concerns were noticeable during the reporting period and caused some market turbulence. Trade tensions were on the rise and there were pockets of political issues. Such tensions, especially regarding trade, made an impact on some investment decisions, as noted in the Fed’s minutes. So far, the measures implemented are not of major economic significance, in our view. At this point, we believe there is more rhetoric than actual impactful decisions. The risk remains, however, that trade issues hit confidence or that retaliations could lead to more significant measures. While these are still not the baseline, risks are elevated and worth carefully monitoring.
In this environment, markets were volatile this reporting period. Equity markets in the U.S. produced positive results and outperformed international equities, with the S&P 500 Index returning 16.24% and the MSCI All Country
World Index returning 10.97%. In fixed income markets, the Bloomberg Barclays U.S. Aggregate Bond Index produced a -0.80% return. Credit slightly outperformed for the
reporting period, with the Bloomberg Barclays Credit Index returning -0.66%.
FUND REVIEW
Against this backdrop, the Fund’s Class A shares (without sales charge) produced a return of -1.67% this reporting period, underperforming the Bloomberg Barclays U.S. Aggregate Bond Index’s (the “Index”) return of -0.80%.
The primary detractors from performance included security selection within the banking and technology sectors. Top contributors to the Fund’s performance included security selection within consumer cyclical and energy. Also contributing was the Fund’s allocation to high yield credit.
STRATEGY & OUTLOOK
We believe macroeconomic fundamentals should remain solid with a potential increase in U.S. growth due to the stimulus package and tax reform. We believe the Fed may raise interest rates two more times this year depending on economic data after the most recent increase in June.
We remain cautiously engaged in investment-grade corporate credit with modest exposure to typically high Sharpe Ratio BB-rated corporates. As a result, we continue to be less likely to meaningfully increase credit risk,
4 OPPENHEIMER CORPORATE BOND FUND
absent specific relative value opportunities. We typically avoid B-rated and below high yield corporate bonds.
| | |
 | |  Krishna Memani Portfolio Manager |
5 OPPENHEIMER CORPORATE BOND FUND
Top Holdings and Allocations
CORPORATE BONDS & NOTES - TOP TEN INDUSTRIES
| | | | |
| Commercial Banks | | | 13.7 | % |
| Capital Markets | | | 6.3 | |
| Oil, Gas & Consumable Fuels | | | 5.2 | |
| Diversified Telecommunication Services | | | 5.0 | |
| Electric Utilities | | | 4.4 | |
| Beverages | | | 3.6 | |
| Media | | | 3.5 | |
| Insurance | | | 3.5 | |
| Food Products | | | 2.9 | |
| Software | | | 2.8 | |
Portfolio holdings and allocations are subject to change. Percentages are as of July 31, 2018, and are based on net assets.
PORTFOLIO ALLOCATION
| | | | |
| Non-Convertible Corporate Bonds and Notes | | | 91.0 | % |
| Investment Companies | | | | |
Oppenheimer Institutional Government Money Market Fund | | | 2.0 | |
Oppenheimer Limited-Term Bond Fund | | | 4.3 | |
| Short-Term Notes | | | 2.6 | |
Mortgage-Backed Obligations Non-Agency | | | 0.1 | |
Portfolio holdings and allocations are subject to change. Percentages are as of July 31, 2018, and are based on the total market value of investments.
For more current Fund holdings, please visit oppenheimerfunds.com.
6 OPPENHEIMER CORPORATE BOND FUND
Share Class Performance
AVERAGE ANNUAL TOTAL RETURNS WITHOUT SALES CHARGE AS OF 7/31/18
| | | | | | | | | | | | | | | | |
| | | Inception
Date | | | 1-Year | | | 5-Year | | | Since
Inception | |
Class A (OFIAX) | | | 8/2/10 | | | | -1.67 | % | | | 2.94 | % | | | 4.40 | % |
Class C (OFICX) | | | 8/2/10 | | | | -2.32 | | | | 2.19 | | | | 3.59 | |
Class I (OFIIX) | | | 11/28/12 | | | | -1.18 | | | | 3.43 | | | | 2.99 | |
Class R (OFINX) | | | 8/2/10 | | | | -1.91 | | | | 2.71 | | | | 4.12 | |
Class Y (OFIYX) | | | 8/2/10 | | | | -1.35 | | | | 3.24 | | | | 4.63 | |
AVERAGE ANNUAL TOTAL RETURNS WITH SALES CHARGE AS OF 7/31/18
| | | | | | | | | | | | | | | | |
| | | Inception
Date | | | 1-Year | | | 5-Year | | | Since
Inception | |
Class A (OFIAX) | | | 8/2/10 | | | | -6.35 | % | | | 1.94 | % | | | 3.77 | % |
Class C (OFICX) | | | 8/2/10 | | | | -3.28 | | | | 2.19 | | | | 3.59 | |
Class I (OFIIX) | | | 11/28/12 | | | | -1.18 | | | | 3.43 | | | | 2.99 | |
Class R (OFINX) | | | 8/2/10 | | | | -1.91 | | | | 2.71 | | | | 4.12 | |
Class Y (OFIYX) | | | 8/2/10 | | | | -1.35 | | | | 3.24 | | | | 4.63 | |
STANDARDIZED YIELDS
For the 30 Days Ended 7/31/18
| | | | | | | | |
Class A | | | 3.13 | % | | | | |
Class C | | | 2.53 | | | | | |
Class I | | | 3.67 | | | | | |
Class R | | | 3.03 | | | | | |
Class Y | | | 3.51 | | | | | |
UNSUBSIDIZED STANDARDIZED YIELDS
For the 30 Days Ended 7/31/18
| | | | | | | | | | | | |
Class A | | | 3.11 | % | | | | | | | | |
Class C | | | 2.51 | | | | | | | | | |
Class I | | | 3.65 | | | | | | | | | |
Class R | | | 3.00 | | | | | | | | | |
Class Y | | | 3.49 | | | | | | | | | |
Performance data quoted represents past performance, which does not guarantee future results. The investment return and principal value of an investment in the Fund will fluctuate so that an investor’s shares, when redeemed, may be worth more or less than their original cost. Current performance may be lower or higher than the performance quoted. Returns do not consider capital gains or income taxes on an individual’s investment. For performance data current to the most recent month-end, visit oppenheimerfunds.com or call 1.800. CALL OPP (225.5677). Fund returns include changes in share price, reinvested distributions, and the applicable sales charge: for Class A shares, the current maximum initial sales charge of 4.75%; for Class C shares, the contingent deferred sales charge of 1% for the 1-year period. There is no sales charge for Class I, Class R and Class Y shares. Returns for periods of less than one year are cumulative and not annualized. See Fund prospectuses and summary prospectuses for more information on share classes and sales charges.
Standardized yield is based on an SEC-standardized formula designed to approximate the Fund’s annualized hypothetical current income from securities less expenses for the 30-day period ended July 31, 2018 and that date’s maximum offering price (for Class A shares) or net asset value (for all other share classes). Each result is compounded semiannually and then annualized. Falling share prices will tend to artificially raise yields. The unsubsidized
7 OPPENHEIMER CORPORATE BOND FUND
standardized yield is computed under an SEC-standardized formula based on net income earned for the 30-day period ended July 31, 2018. The calculation excludes any expense reimbursements and thus may result in a lower yield.
The Bloomberg Barclays U.S. Aggregate Bond Index is an index of U.S dollar-denominated, investment-grade U.S. corporate government and mortgage-backed securities. The Index is unmanaged and cannot be purchased directly by investors. While index comparisons may be useful to provide a benchmark for the Fund’s performance, it must be noted that the Fund’s investments are not limited to the investments comprising the Index. Index performance includes reinvestment of income, but does not reflect transaction costs, fees, expenses or taxes. Index performance is shown for illustrative purposes only as a benchmark for the Fund’s performance, and does not predict or depict performance of the Fund. The Fund’s performance reflects the effects of the Fund’s business and operating expenses.
The views in the Fund Performance Discussion represent the opinions of this Fund’s portfolio manager(s) and are not intended as investment advice or to predict or depict the performance of any investment. These views are as of the close of business on July 31, 2018, and are subject to change based on subsequent developments. The Fund’s portfolio and strategies are subject to change.
Before investing in any of the Oppenheimer funds, investors should carefully consider a fund’s investment objectives, risks, charges and expenses. Fund prospectuses and summary prospectuses contain this and other information about the funds, and may be obtained by asking your financial advisor, visiting oppenheimerfunds.com, or calling 1.800.CALL OPP (225.5677). Read prospectuses and summary prospectuses carefully before investing.
Shares of Oppenheimer funds are not deposits or obligations of any bank, are not guaranteed by any bank, are not insured by the FDIC or any other agency, and involve investment risks, including the possible loss of the principal amount invested.
8 OPPENHEIMER CORPORATE BOND FUND
Fund Expenses
Fund Expenses. As a shareholder of the Fund, you incur two types of costs: (1) transaction costs, which may include sales charges (loads) on purchase payments and/or contingent deferred sales charges on redemptions; and (2) ongoing costs, including management fees; distribution and service fees; and other Fund expenses. These examples are intended to help you understand your ongoing costs (in dollars) of investing in the Fund and to compare these costs with the ongoing costs of investing in other mutual funds.
The examples are based on an investment of $1,000.00 invested at the beginning of the period and held for the entire 6-month period ended July 31, 2018.
Actual Expenses. The first section of the table provides information about actual account values and actual expenses. You may use the information in this section for the class of shares you hold, together with the amount you invested, to estimate the expense that you paid over the period. Simply divide your account value by $1,000.00 (for example, an $8,600.00 account value divided by $1,000.00 = 8.60), then multiply the result by the number in the first section under the heading entitled “Expenses Paid During 6 Months Ended July 31, 2018” to estimate the expenses you paid on your account during this period.
Hypothetical Example for Comparison Purposes. The second section of the table provides information about hypothetical account values and hypothetical expenses based on the Fund’s actual expense ratio for each class of shares, and an assumed rate of return of 5% per year for each class before expenses, which is not the Fund’s actual return. The hypothetical account values and expenses may not be used to estimate the actual ending account balance or expenses you paid for the period. You may use this information to compare the ongoing costs of investing in the Fund and other funds. To do so, compare this 5% hypothetical example for the class of shares you hold with the 5% hypothetical examples that appear in the shareholder reports of the other funds.
Please note that the expenses shown in the table are meant to highlight your ongoing costs only and do not reflect any transactional costs, such as front-end or contingent deferred sales charges (loads). Therefore, the “hypothetical” section of the table is useful in comparing ongoing costs only, and will not help you determine the relative total costs of owning different funds. In addition, if these transactional costs were included, your costs would have been higher.
9 OPPENHEIMER CORPORATE BOND FUND
| | | | | | | | | | |
| Actual | | Beginning
Account
Value
February 1, 2018 | | Ending
Account
Value
July 31, 2018 | | Expenses
Paid During
6 Months Ended
July 31, 2018 | | | |
Class A | | $ 1,000.00 | | $ 977.50 | | $ 4.57 | | | | |
Class C | | 1,000.00 | | 973.80 | | 8.31 | | | | |
Class I | | 1,000.00 | | 980.30 | | 2.70 | | | | |
Class R | | 1,000.00 | | 976.30 | | 5.85 | | | | |
Class Y | | 1,000.00 | | 978.60 | | 3.39 | | | | |
| | | | |
Hypothetical | | | | | | | | | | |
(5% return before expenses) | | | | | | | | | | |
Class A | | 1,000.00 | | 1,020.18 | | 4.67 | | | | |
Class C | | 1,000.00 | | 1,016.41 | | 8.48 | | | | |
Class I | | 1,000.00 | | 1,022.07 | | 2.76 | | | | |
Class R | | 1,000.00 | | 1,018.89 | | 5.97 | | | | |
Class Y | | 1,000.00 | | 1,021.37 | | 3.46 | | | | |
Expenses are equal to the Fund’s annualized expense ratio for that class, multiplied by the average account value over the period, multiplied by 181/365 (to reflect the one-half year period). Those annualized expense ratios, excluding indirect expenses from affiliated funds, based on the 6-month period ended July 31, 2018 are as follows:
| | | | |
| Class | | Expense Ratios | |
Class A | | | 0.93% | |
Class C | | | 1.69 | |
Class I | | | 0.55 | |
Class R | | | 1.19 | |
Class Y | | | 0.69 | |
The expense ratios reflect voluntary and/or contractual waivers and/or reimbursements of expenses by the Fund’s Manager and Transfer Agent. Some of these undertakings may be modified or terminated at any time, as indicated in the Fund’s prospectus. The “Financial Highlights” tables in the Fund’s financial statements, included in this report, also show the gross expense ratios, without such waivers or reimbursements and reduction to custodian expenses, if applicable.
10 OPPENHEIMER CORPORATE BOND FUND
STATEMENT OF INVESTMENTS July 31, 2018
| | | | | | | | |
| | | Principal Amount | | | Value | |
Mortgage-Backed Obligations—0.1% | | | | | | | | |
| Banc of America Mortgage Trust, Series 2007-1, Cl. 1A24, 6.00%, 3/25/37 | | $ | 31,832 | | | $ | 30,181 | |
| WaMu Mortgage Pass-Through Certificates Trust, Series 2005-AR14, Cl. 1A4, 3.431%, 12/25/351 | | | 58,798 | | | | 59,440 | |
| Wells Fargo Mortgage-Backed Securities Trust, Series 2006- AR2, Cl. 2A3, 3.863%, 3/25/361 | | | 42,862 | | | | 43,451 | |
| | | | | | | | |
| Total Mortgage-Backed Obligations (Cost $123,163) | | | | | | | 133,072 | |
| | | | | | | | | |
| Corporate Bonds and Notes—90.3% | | | | | | | | |
| Consumer Discretionary—12.5% | | | | | | | | |
| Auto Components—0.5% | | | | | | | | |
| Magna International, Inc., 4.15% Sr. Unsec. Nts., 10/1/25 | | | 1,000,000 | | | | 1,011,391 | |
| | | | | | | | | |
| Automobiles—1.9% | | | | | | | | |
| Daimler Finance North America LLC, 3.75% Sr. Unsec. Nts., 2/22/282 | | | 1,020,000 | | | | 999,185 | |
| Ford Motor Credit Co. LLC, 3.664% Sr. Unsec. Nts., 9/8/24 | | | 1,020,000 | | | | 973,379 | |
| General Motors Co., 6.25% Sr. Unsec. Nts., 10/2/43 | | | 403,000 | | | | 422,285 | |
| General Motors Financial Co., Inc., 3.15% Sr. Unsec. Nts., 6/30/22 | | | 428,000 | | | | 416,070 | |
| Hyundai Capital America, 1.75% Sr. Unsec. Nts., 9/27/192 | | | 475,000 | | | | 465,760 | |
| Volkswagen Group of America Finance LLC, 2.45% Sr. Unsec. Nts., 11/20/192 | | | 510,000 | | | | 504,766 | |
| | | | | | | | |
| | | | | | | 3,781,445 | |
| | | | | | | | | |
| Diversified Consumer Services—0.5% | | | | | | | | |
| Service Corp. International, 4.625% Sr. Unsec. Nts., 12/15/27 | | | 1,084,000 | | | | 1,032,510 | |
| | | | | | | | | |
| Hotels, Restaurants & Leisure—0.5% | | | | | | | | |
| Aramark Services, Inc., 5.00% Sr. Unsec. Nts., 4/1/252 | | | 1,054,000 | | | | 1,056,635 | |
| | | | | | | | | |
| Household Durables—1.1% | | | | | | | | |
| Lennar Corp., 4.75% Sr. Unsec. Nts., 5/30/25 | | | 413,000 | | | | 403,191 | |
| Newell Brands, Inc., 5.00% Sr. Unsec. Nts., 11/15/23 | | | 410,000 | | | | 416,976 | |
| PulteGroup, Inc., 5.00% Sr. Unsec. Nts., 1/15/27 | | | 753,000 | | | | 710,644 | |
| Toll Brothers Finance Corp.: | | | | | | | | |
| 4.375% Sr. Unsec. Nts., 4/15/23 | | | 619,000 | | | | 608,167 | |
| 4.875% Sr. Unsec. Nts., 3/15/27 | | | 175,000 | | | | 165,813 | |
| | | | | | | | |
| | | | | | | 2,304,791 | |
| | | | | | | | | |
| Internet & Catalog Retail—1.2% | | | | | | | | |
| Amazon.com, Inc., 4.95% Sr. Unsec. Nts., 12/5/44 | | | 540,000 | | | | 614,028 | |
| QVC, Inc., 4.45% Sr. Sec. Nts., 2/15/25 | | | 1,940,000 | | | | 1,862,066 | |
| | | | | | | | |
| | | | | | | 2,476,094 | |
| | | | | | | | | |
| Media—3.5% | | | | | | | | |
| 21st Century Fox America, Inc., 4.75% Sr. Unsec. Nts., 11/15/46 | | | 741,000 | | | | 791,724 | |
11 OPPENHEIMER CORPORATE BOND FUND
STATEMENT OF INVESTMENTS Continued
| | | | | | | | |
| | | Principal Amount | | | Value | |
| Media (Continued) | | | | | | | | |
| Charter Communications Operating LLC/Charter Communications Operating Capital, 5.375% Sr. Sec. Nts., 5/1/47 | | $ | 745,000 | | | $ | 719,572 | |
Comcast Corp.: | | | | | | | | |
2.35% Sr. Unsec. Nts., 1/15/27 | | | 849,000 | | | | 752,786 | |
4.00% Sr. Unsec. Nts., 3/1/48 | | | 1,150,000 | | | | 1,050,504 | |
| Interpublic Group of Cos., Inc. (The), 4.20% Sr. Unsec. Nts., 4/15/24 | | | 534,000 | | | | 532,646 | |
| Time Warner Cable LLC, 4.50% Sr. Unsec. Unsub. Nts., 9/15/42 | | | 420,000 | | | | 360,534 | |
| Viacom, Inc., 4.375% Sr. Unsec. Nts., 3/15/43 | | | 500,000 | | | | 440,011 | |
| Virgin Media Secured Finance plc, 5.25% Sr. Sec. Nts., 1/15/262 | | | 1,148,000 | | | | 1,083,425 | |
| WPP Finance 2010, 3.75% Sr. Unsec. Nts., 9/19/24 | | | 1,590,000 | | | | 1,529,655 | |
| | | | | | | | |
| | | | | | | 7,260,857 | |
| | | | | | | | | |
| Multiline Retail—0.4% | | | | | | | | |
| Dollar Tree, Inc., 4.20% Sr. Unsec. Nts., 5/15/28 | | | 850,000 | | | | 838,390 | |
| | | | | | | | | |
| Specialty Retail—2.0% | | | | | | | | |
| AutoZone, Inc., 1.625% Sr. Unsec. Nts., 4/21/19 | | | 78,000 | | | | 77,427 | |
| Best Buy Co., Inc., 5.50% Sr. Unsec. Nts., 3/15/21 | | | 799,000 | | | | 835,147 | |
| Home Depot, Inc. (The), 3.50% Sr. Unsec. Nts., 9/15/56 | | | 390,000 | | | | 345,457 | |
| L Brands, Inc., 5.625% Sr. Unsec. Nts., 2/15/22 | | | 1,071,000 | | | | 1,093,759 | |
| Ross Stores, Inc., 3.375% Sr. Unsec. Nts., 9/15/24 | | | 697,000 | | | | 683,721 | |
| Signet UK Finance plc, 4.70% Sr. Unsec. Nts., 6/15/24 | | | 1,022,000 | | | | 964,364 | |
| | | | | | | | |
| | | | | | | 3,999,875 | |
| | | | | | | | | |
| Textiles, Apparel & Luxury Goods—0.9% | | | | | | | | |
| Hanesbrands, Inc., 4.875% Sr. Unsec. Nts., 5/15/262 | | | 1,055,000 | | | | 1,024,669 | |
| Levi Strauss & Co., 5.00% Sr. Unsec. Nts., 5/1/25 | | | 882,000 | | | | 888,615 | |
| | | | | | | | |
| | | | | | | 1,913,284 | |
| | | | | | | | | |
| Consumer Staples—7.8% | | | | | | | | |
| Beverages—3.6% | | | | | | | | |
Anheuser-Busch InBev Finance, Inc.: | | | | | | | | |
3.65% Sr. Unsec. Nts., 2/1/26 | | | 1,206,000 | | | | 1,186,226 | |
| 4.90% Sr. Unsec. Nts., 2/1/46 | | | 663,000 | | | | 692,944 | |
| Anheuser-Busch InBev Worldwide, Inc., 8.20% Sr. Unsec. Unsub. Nts., 1/15/39 | | | 650,000 | | | | 937,196 | |
| Bacardi Ltd., 4.70% Sr. Unsec. Nts., 5/15/282 | | | 811,000 | | | | 806,827 | |
| Diageo Capital plc, 3.875% Sr. Unsec. Unsub. Nts., 4/29/43 | | | 410,000 | | | | 392,971 | |
| Keurig Dr Pepper, Inc., 4.597% Sr. Unsec. Nts., 5/25/282 | | | 805,000 | | | | 821,362 | |
Molson Coors Brewing Co.: | | | | | | | | |
1.45% Sr. Unsec. Nts., 7/15/19 | | | 169,000 | | | | 166,848 | |
2.10% Sr. Unsec. Nts., 7/15/21 | | | 1,200,000 | | | | 1,153,430 | |
| 4.20% Sr. Unsec. Nts., 7/15/46 | | | 140,000 | | | | 128,125 | |
12 OPPENHEIMER CORPORATE BOND FUND
| | | | | | | | |
| | | Principal Amount | | | Value | |
Beverages (Continued) | | | | | | | | |
Pernod Ricard SA, 4.25% Sr. Unsec. Nts., 7/15/222 | | $ | 1,100,000 | | | $ | 1,119,844 | |
| | | | | | | | |
| | | | | | | 7,405,773 | |
| | | | | | | | | |
Food & Staples Retailing—0.8% | | | | | | | | |
Kroger Co. (The), 4.45% Sr. Unsec. Nts., 2/1/47 | | | 700,000 | | | | 652,364 | |
Walmart, Inc., 4.05% Sr. Unsec. Nts., 6/29/48 | | | 900,000 | | | | 918,016 | |
| | | | | | | | |
| | | | | | | 1,570,380 | |
| | | | | | | | | |
Food Products—2.9% | | | | | | | | |
Archer-Daniels-Midland Co., 4.016% Sr. Unsec. Nts., 4/16/43 | | | 625,000 | | | | 606,020 | |
Bunge Ltd. Finance Corp.: | | | | | | | | |
3.25% Sr. Unsec. Nts., 8/15/26 | | | 810,000 | | | | 740,577 | |
3.50% Sr. Unsec. Nts., 11/24/20 | | | 950,000 | | | | 946,659 | |
General Mills, Inc., 4.70% Sr. Unsec. Nts., 4/17/48 | | | 339,000 | | | | 335,324 | |
Kraft Heinz Foods Co., 3.95% Sr. Unsec. Nts., 7/15/25 | | | 870,000 | | | | 855,071 | |
Lamb Weston Holdings, Inc., 4.875% Sr. Unsec. Nts., 11/1/262 | | | 1,104,000 | | | | 1,088,820 | |
Smithfield Foods, Inc.: | | | | | | | | |
2.70% Sr. Unsec. Nts., 1/31/202 | | | 237,000 | | | | 233,333 | |
3.35% Sr. Unsec. Nts., 2/1/222 | | | 287,000 | | | | 277,121 | |
Tyson Foods, Inc., 3.55% Sr. Unsec. Nts., 6/2/27 | | | 773,000 | | | | 737,022 | |
| | | | | | | | |
| | | | | | | 5,819,947 | |
| | | | | | | | | |
Tobacco—0.5% | | | | | | | | |
Altria Group, Inc., 3.875% Sr. Unsec. Nts., 9/16/46 | | | 695,000 | | | | 625,404 | |
BAT Capital Corp., 3.557% Sr. Unsec. Nts., 8/15/272 | | | 485,000 | | | | 457,219 | |
| | | | | | | | |
| | | | | | | 1,082,623 | |
| | | | | | | | | |
Energy—5.7% | | | | | | | | |
Energy Equipment & Services—0.5% | | | | | | | | |
Halliburton Co., 5.00% Sr. Unsec. Nts., 11/15/45 | | | 423,000 | | | | 458,310 | |
Helmerich & Payne International Drilling Co., 4.65% Sr. Unsec. Nts., 3/15/25 | | | 640,000 | | | | 659,292 | |
| | | | | | | | |
| | | | | | | 1,117,602 | |
| | | | | | | | | |
Oil, Gas & Consumable Fuels—5.2% | | | | | | | | |
Anadarko Petroleum Corp.: | | | | | | | | |
4.50% Sr. Unsec. Nts., 7/15/44 | | | 226,000 | | | | 215,737 | |
6.20% Sr. Unsec. Nts., 3/15/40 | | | 379,000 | | | | 440,355 | |
Andeavor, 3.80% Sr. Unsec. Nts., 4/1/28 | | | 860,000 | | | | 824,211 | |
Andeavor Logistics LP/Tesoro Logistics Finance Corp.: | | | | | | | | |
4.25% Sr. Unsec. Nts., 12/1/27 | | | 789,000 | | | | 778,590 | |
5.25% Sr. Unsec. Nts., 1/15/25 | | | 664,000 | | | | 687,194 | |
Apache Corp., 4.75% Sr. Unsec. Nts., 4/15/43 | | | 725,000 | | | | 698,401 | |
Buckeye Partners LP, 3.95% Sr. Unsec. Nts., 12/1/26 | | | 364,000 | | | | 332,762 | |
ConocoPhillips Co.: | | | | | | | | |
4.95% Sr. Unsec. Nts., 3/15/26 | | | 90,000 | | | | 97,111 | |
5.95% Sr. Unsec. Nts., 3/15/46 | | | 330,000 | | | | 420,913 | |
Devon Energy Corp., 4.75% Sr. Unsec. Nts., 5/15/42 | | | 450,000 | | | | 446,986 | |
Energy Transfer Partners LP, 5.30% Sr. Unsec. Nts., 4/15/47 | | | 389,000 | | | | 371,453 | |
13 OPPENHEIMER CORPORATE BOND FUND
STATEMENT OF INVESTMENTS Continued
| | | | | | | | |
| | | Principal Amount | | | Value | |
| Oil, Gas & Consumable Fuels (Continued) | | | | | | | | |
| Enterprise Products Operating LLC: | | | | | | | | |
| 4.85% Sr. Unsec. Nts., 8/15/42 | | $ | 368,000 | | | $ | 379,274 | |
| 4.90% Sr. Unsec. Nts., 5/15/46 | | | 325,000 | | | | 336,274 | |
| Kinder Morgan, Inc.: | | | | | | | | |
| 5.20% Sr. Unsec. Nts., 3/1/48 | | | 136,000 | | | | 138,092 | |
| 5.55% Sr. Unsec. Nts., 6/1/45 | | | 840,000 | | | | 884,783 | |
| Noble Energy, Inc., 5.05% Sr. Unsec. Nts., 11/15/44 | | | 310,000 | | | | 314,493 | |
| Sabine Pass Liquefaction LLC, 4.20% Sr. Sec. Nts., 3/15/28 | | | 705,000 | | | | 690,786 | |
| Shell International Finance BV, 4.00% Sr. Unsec. Nts., 5/10/46 | | | 505,000 | | | | 501,173 | |
| Sunoco Logistics Partners Operations LP, 4.00% Sr. Unsec. Nts., 10/1/27 | | | 850,000 | | | | 812,909 | |
| TransCanada PipeLines Ltd., 7.625% Sr. Unsec. Nts., 1/15/39 | | | 464,000 | | | | 628,924 | |
| Williams Partners LP, 3.75% Sr. Unsec. Nts., 6/15/27 | | | 596,000 | | | | 575,769 | |
| | | | | | | | |
| | | | | | | 10,576,190 | |
| | | | | | | | | |
| Financials—27.6% | | | | | | | | |
| Capital Markets—6.3% | | | | | | | | |
| Apollo Management Holdings LP, 4.00% Sr. Unsec. Nts., 5/30/242 | | | 330,000 | | | | 326,143 | |
| Bank of New York Mellon Corp. (The), 3.00% Sub. Nts., 10/30/28 | | | 423,000 | | | | 389,986 | |
| Blackstone Holdings Finance Co. LLC, 3.15% Sr. Unsec. Nts., 10/2/272 | | | 425,000 | | | | 394,566 | |
| Brookfield Asset Management, Inc., 4.00% Sr. Unsec. Nts., 1/15/25 | | | 331,000 | | | | 324,822 | |
| Credit Suisse Group AG, 3.869% [US0003M+141] Sr. Unsec. Nts., 1/12/292,3 | | | 624,000 | | | | 597,213 | |
| Credit Suisse Group Funding Guernsey Ltd.: | | | | | | | | |
| 3.80% Sr. Unsec. Nts., 9/15/22 | | | 420,000 | | | | 419,195 | |
| 3.80% Sr. Unsec. Nts., 6/9/23 | | | 600,000 | | | | 595,408 | |
| E*TRADE Financial Corp., 5.875% [US0003M+443.5] Jr. Sub. Perpetual Bonds3,4 | | | 1,062,000 | | | | 1,091,205 | |
| Goldman Sachs Group, Inc. (The): | | | | | | | | |
| 3.50% Sr. Unsec. Nts., 11/16/26 | | | 591,000 | | | | 561,695 | |
| 3.75% Sr. Unsec. Nts., 2/25/26 | | | 440,000 | | | | 428,185 | |
| 5.15% Sub. Nts., 5/22/45 | | | 650,000 | | | | 675,658 | |
| Macquarie Group Ltd., 3.763% [US0003M+137.2] Sr. Unsec. Nts., 11/28/282,3 | | | 841,000 | | | | 777,399 | |
| Morgan Stanley: | | | | | | | | |
| 3.875% Sr. Unsec. Nts., 1/27/26 | | | 1,370,000 | | | | 1,351,584 | |
| 5.00% Sub. Nts., 11/24/25 | | | 1,414,000 | | | | 1,471,994 | |
| MSCI, Inc., 4.75% Sr. Unsec. Nts., 8/1/262 | | | 1,078,000 | | | | 1,067,220 | |
| Northern Trust Corp., 3.375% [US0003M+113.1] Sub. Nts., 5/8/323 | | | 452,000 | | | | 421,888 | |
| Raymond James Financial, Inc., 3.625% Sr. Unsec. Nts., 9/15/26 | | | 650,000 | | | | 624,422 | |
| TD Ameritrade Holding Corp., 3.30% Sr. Unsec. Nts., 4/1/27 | | | 578,000 | | | | 555,095 | |
14 OPPENHEIMER CORPORATE BOND FUND
| | | | | | | | |
| | | Principal Amount | | | Value | |
| Capital Markets (Continued) | | | | | | | | |
| UBS Group Funding Switzerland AG, 4.125% Sr. Unsec. Nts., 9/24/252 | | $ | 850,000 | | | $ | 851,139 | |
| | | | | | | | |
| | | | | | | 12,924,817 | |
| | | | | | | | | |
| Commercial Banks—13.7% | | | | | | | | |
| ABN AMRO Bank NV, 4.40% [USSW5+219.7] Sub. Nts., 3/27/283 | | | 1,150,000 | | | | 1,133,660 | |
| Bank of America Corp.: | | | | | | | | |
| 3.248% Sr. Unsec. Nts., 10/21/27 | | | 846,000 | | | | 790,635 | |
| 4.271% [US0003M+131] Sr. Unsec. Nts., 7/23/293 | | | 628,000 | | | | 631,036 | |
| 7.75% Jr. Sub. Nts., 5/14/38 | | | 901,000 | | | | 1,241,280 | |
| BB&T Corp., 2.85% Sr. Unsec. Nts., 10/26/24 | | | 855,000 | | | | 816,121 | |
| BNP Paribas SA, 4.625% Sub. Nts., 3/13/272 | | | 730,000 | | | | 726,924 | |
| BPCE SA, 4.50% Sub. Nts., 3/15/252 | | | 645,000 | | | | 636,426 | |
| Citigroup, Inc.: | | | | | | | | |
| 3.50% Sub. Nts., 5/15/23 | | | 370,000 | | | | 365,987 | |
| 3.668% [US0003M+139] Sr. Unsec. Nts., 7/24/283 | | | 1,000,000 | | | | 953,817 | |
| 4.281% [US0003M+183.9] Sr. Unsec. Nts., 4/24/483 | | | 484,000 | | | | 469,801 | |
| 4.30% Sub. Nts., 11/20/26 | | | 445,000 | | | | 436,880 | |
| 4.45% Sub. Nts., 9/29/27 | | | 419,000 | | | | 414,446 | |
| Citizens Bank NA (Providence RI): | | | | | | | | |
| 2.55% Sr. Unsec. Nts., 5/13/21 | | | 547,000 | | | | 533,041 | |
| 2.65% Sr. Unsec. Nts., 5/26/22 | | | 232,000 | | | | 223,918 | |
| Compass Bank, 2.875% Sr. Unsec. Nts., 6/29/22 | | | 982,000 | | | | 947,896 | |
| Cooperatieve Rabobank UA, 2.75% Sr. Unsec. Nts., 1/10/23 | | | 1,100,000 | | | | 1,062,199 | |
| Credit Agricole SA, 4.375% Sub. Nts., 3/17/252 | | | 1,180,000 | | | | 1,160,552 | |
| Fifth Third Bank (Cincinnati OH), 3.85% Sub. Nts., 3/15/26 | | | 505,000 | | | | 495,762 | |
| First Republic Bank, 4.375% Sub. Nts., 8/1/46 | | | 437,000 | | | | 414,056 | |
| HSBC Holdings plc: | | | | | | | | |
| 3.95% [US0003M+98.72] Sr. Unsec. Nts., 5/18/243 | | | 340,000 | | | | 339,629 | |
| 4.583% [US0003M+153.46] Sr. Unsec. Nts., 6/19/293 | | | 565,000 | | | | 573,663 | |
| Intesa Sanpaolo SpA, 3.875% Sr. Unsec. Nts., 7/14/272 | | | 862,000 | | | | 754,297 | |
| JPMorgan Chase & Co.: | | | | | | | | |
| 3.54% [US0003M+138] Sr. Unsec. Nts., 5/1/283 | | | 873,000 | | | | 834,404 | |
| 3.782% [US0003M+133.7] Sr. Unsec. Nts., 2/1/283 | | | 1,749,000 | | | | 1,703,653 | |
| 3.797% [US0003M+89] Sr. Unsec. Nts., 7/23/243 | | | 833,000 | | | | 832,897 | |
| 3.897% [US0003M+122] Sr. Unsec. Nts., 1/23/493 | | | 500,000 | | | | 458,210 | |
| 4.26% [US0003M+158] Sr. Unsec. Nts., 2/22/483 | | | 379,000 | | | | 368,682 | |
| KeyBank NA (Cleveland OH), 3.40% Sub. Nts., 5/20/26 | | | 760,000 | | | | 721,227 | |
| Lloyds Banking Group plc: | | | | | | | | |
| 6.413% [US0003M+149.5] Jr. Sub. Perpetual Bonds2,3,4 | | | 105,000 | | | | 110,250 | |
| 6.657% [US0003M+127] Jr. Sub. Perpetual Bonds3,4,5 | | | 565,000 | | | | 598,900 | |
| PNC Bank NA, 4.05% Sub. Nts., 7/26/28 | | | 743,000 | | | | 746,012 | |
| PNC Financial Services Group, Inc. (The), 3.15% Sr. Unsec. Nts., 5/19/27 | | | 855,000 | | | | 813,578 | |
| Regions Financial Corp., 2.75% Sr. Unsec. Nts., 8/14/22 | | | 492,000 | | | | 474,312 | |
| SunTrust Bank (Atlanta GA), 3.30% Sub. Nts., 5/15/26 | | | 380,000 | | | | 358,396 | |
| Synovus Financial Corp., 3.125% Sr. Unsec. Nts., 11/1/22 | | | 625,000 | | | | 598,556 | |
| Toronto-Dominion Bank (The), 3.50% Sr. Unsec. Nts., 7/19/23 | | | 833,000 | | | | 831,767 | |
15 OPPENHEIMER CORPORATE BOND FUND
STATEMENT OF INVESTMENTS Continued
| | | | | | | | |
| | | Principal Amount | | | Value | |
| Commercial Banks (Continued) | | | | | | | | |
| US Bancorp: | | | | | | | | |
| 3.10% Sub. Nts., 4/27/26 | | $ | 530,000 | | | $ | 501,236 | |
| 3.15% Sr. Unsec. Nts., 4/27/27 | | | 231,000 | | | | 221,247 | |
| US Bank NA (Cincinnati OH), 3.40% Sr. Unsec. Nts., 7/24/23 | | | 1,327,000 | | | | 1,321,483 | |
| Wells Fargo & Co.: | | | | | | | | |
| 3.584% [US0003M+131] Sr. Unsec. Nts., 5/22/283 | | | 773,000 | | | | 742,029 | |
| 4.75% Sub. Nts., 12/7/46 | | | 608,000 | | | | 614,861 | |
| | | | | | | | |
| | | | | | | 27,973,726 | |
| | | | | | | | | |
| Consumer Finance—0.8% | | | | | | | | |
| American Express Credit Corp., 3.30% Sr. Unsec. Nts., 5/3/27 | | | 579,000 | | | | 562,897 | |
| Capital One Financial Corp., 3.20% Sr. Unsec. Nts., 2/5/25 | | | 400,000 | | | | 376,677 | |
| Discover Financial Services, 3.75% Sr. Unsec. Nts., 3/4/25 | | | 462,000 | | | | 443,128 | |
| Electricite de France SA, 6.50% Sr. Unsec. Nts., 1/26/192 | | | 340,000 | | | | 345,958 | |
| | | | | | | | |
| | | | | | | 1,728,660 | |
| | | | | | | | | |
| Diversified Financial Services—1.4% | | | | | | | | |
| Berkshire Hathaway Energy Co.: | | | | | | | | |
| 2.00% Sr. Unsec. Nts., 11/15/18 | | | 127,000 | | | | 126,817 | |
| 3.80% Sr. Unsec. Nts., 7/15/48 | | | 368,000 | | | | 336,969 | |
| Burlington Northern Santa Fe LLC, 4.15% Sr. Unsec. Nts., 12/15/486 | | | 515,000 | | | | 521,856 | |
| PacifiCorp, 4.125% Sec. Nts., 1/15/49 | | | 360,000 | | | | 360,547 | |
| Peachtree Corners Funding Trust, 3.976% Sr. Unsec. Nts., 2/15/252 | | | 381,000 | | | | 369,286 | |
| Voya Financial, Inc.: | | | | | | | | |
| 4.70% [US0003M+208.4] Jr. Sub. Nts., 1/23/482,3 | | | 231,000 | | | | 204,146 | |
| 5.65% [US0003M+358] Jr. Sub. Nts., 5/15/533 | | | 873,000 | | | | 882,568 | |
| | | | | | | | |
| | | | | | | 2,802,189 | |
| | | | | | | | | |
| Insurance—3.5% | | | | | | | | |
| AXA Equitable Holdings, Inc., 4.35% Sr. Unsec. Nts., 4/20/282 | | | 581,000 | | | | 568,668 | |
| AXIS Specialty Finance plc, 5.15% Sr. Unsec. Nts., 4/1/45 | | | 666,000 | | | | 654,817 | |
| Boardwalk Pipelines LP, 4.95% Sr. Unsec. Nts., 12/15/24 | | | 785,000 | | | | 802,327 | |
| Brighthouse Financial, Inc., 3.70% Sr. Unsec. Nts., 6/22/27 | | | 246,000 | | | | 223,108 | |
| CNA Financial Corp., 3.45% Sr. Unsec. Nts., 8/15/27 | | | 837,000 | | | | 773,245 | |
| Hartford Financial Services Group, Inc. (The), 4.40% Sr. Unsec. Nts., 3/15/48 | | | 657,000 | | | | 648,139 | |
| Lincoln National Corp., 3.80% Sr. Unsec. Nts., 3/1/28 | | | 653,000 | | | | 634,846 | |
| Manulife Financial Corp., 4.061% [USISDA05+164.7] Sub. Nts., 2/24/323 | | | 567,000 | | | | 539,062 | |
| Marsh & McLennan Cos., Inc., 4.35% Sr. Unsec. Nts., 1/30/47 | | | 406,000 | | | | 408,415 | |
| Nuveen Finance LLC, 4.125% Sr. Unsec. Nts., 11/1/242 | | | 756,000 | | | | 749,426 | |
| Prudential Financial, Inc.: | | | | | | | | |
| 5.20% [US0003M+304] Jr. Sub. Nts., 3/15/443 | | | 725,000 | | | | 720,469 | |
| 5.375% [US0003M+303.1] Jr. Sub. Nts., 5/15/453 | | | 435,000 | | | | 437,719 | |
| | | | | | | | |
| | | | | | | 7,160,241 | |
16 OPPENHEIMER CORPORATE BOND FUND
| | | | | | | | |
| | | Principal Amount | | | Value | |
| Real Estate Investment Trusts (REITs)—1.9% | | | | | | | | |
| American Tower Corp.: | | | | | | | | |
| 2.80% Sr. Unsec. Nts., 6/1/20 | | $ | 200,000 | | | $ | 198,131 | |
| 3.60% Sr. Unsec. Nts., 1/15/28 | | | 830,000 | | | | 778,001 | |
| 5.05% Sr. Unsec. Unsub. Nts., 9/1/20 | | | 330,000 | | | | 340,809 | |
| Crown Castle International Corp.: | | | | | | | | |
| 3.40% Sr. Unsec. Nts., 2/15/21 | | | 700,000 | | | | 699,044 | |
| 3.65% Sr. Unsec. Nts., 9/1/27 | | | 720,000 | | | | 677,734 | |
| Lamar Media Corp., 5.75% Sr. Unsec. Nts., 2/1/26 | | | 1,040,000 | | | | 1,069,900 | |
| VEREIT Operating Partnership LP, 3.00% Sr. Unsec. Nts., 2/6/19 | | | 180,000 | | | | 179,954 | |
| | | | | | | | |
| | | | | | | 3,943,573 | |
| | | | | | | | | |
| Health Care—6.5% | | | | | | | | |
| Biotechnology—1.8% | | | | | | | | |
| AbbVie, Inc.: | | | | | | | | |
| 3.60% Sr. Unsec. Nts., 5/14/25 | | | 993,000 | | | | 968,938 | |
| 4.70% Sr. Unsec. Nts., 5/14/45 | | | 301,000 | | | | 296,758 | |
| Amgen, Inc., 4.563% Sr. Unsec. Nts., 6/15/48 | | | 515,000 | | | | 517,554 | |
| Biogen, Inc., 5.20% Sr. Unsec. Nts., 9/15/45 | | | 335,000 | | | | 362,846 | |
| Celgene Corp.: | | | | | | | | |
| 3.875% Sr. Unsec. Nts., 8/15/25 | | | 872,000 | | | | 860,636 | |
| 5.00% Sr. Unsec. Nts., 8/15/45 | | | 226,000 | | | | 227,891 | |
| Gilead Sciences, Inc., 4.75% Sr. Unsec. Nts., 3/1/46 | | | 453,000 | | | | 479,172 | |
| | | | | | | | |
| | | | | | | 3,713,795 | |
| | | | | | | | | |
| Health Care Equipment & Supplies—2.1% | | | | | | | | |
| Abbott Laboratories, 3.75% Sr. Unsec. Nts., 11/30/26 | | | 1,215,000 | | | | 1,208,439 | |
| Becton Dickinson & Co.: | | | | | | | | |
| 2.404% Sr. Unsec. Nts., 6/5/20 | | | 302,000 | | | | 297,043 | |
| 3.70% Sr. Unsec. Nts., 6/6/27 | | | 1,073,000 | | | | 1,031,981 | |
| Edwards Lifesciences Corp., 4.30% Sr. Unsec. Nts., 6/15/28 | | | 804,000 | | | | 809,029 | |
| Hologic, Inc., 4.375% Sr. Unsec. Nts., 10/15/252 | | | 39,000 | | | | 37,819 | |
| Medtronic, Inc., 4.625% Sr. Unsec. Nts., 3/15/45 | | | 810,000 | | | | 880,710 | |
| | | | | | | | |
| | | | | | | 4,265,021 | |
| | | | | | | | | |
| Health Care Providers & Services—1.2% | | | | | | | | |
| CVS Health Corp., 5.05% Sr. Unsec. Nts., 3/25/48 | | | 1,232,000 | | | | 1,281,521 | |
| Fresenius Medical Care US Finance II, Inc., 5.875% Sr. Unsec. Nts., 1/31/222 | | | 1,215,000 | | | | 1,286,849 | |
| | | | | | | | |
| | | | | | | 2,568,370 | |
| | | | | | | | | |
| Life Sciences Tools & Services—0.8% | | | | | | | | |
| IQVIA, Inc., 5.00% Sr. Unsec. Nts., 10/15/262 | | | 940,000 | | | | 940,423 | |
| Thermo Fisher Scientific, Inc., 3.20% Sr. Unsec. Nts., 8/15/27 | | | 723,000 | | | | 677,803 | |
| | | | | | | | |
| | | | | | | 1,618,226 | |
| | | | | | | | | |
| Pharmaceuticals—0.6% | | | | | | | | |
| Bayer US Finance II LLC, 4.375% Sr. Unsec. Nts., 12/15/282 | | | 1,128,000 | | | | 1,144,918 | |
17 OPPENHEIMER CORPORATE BOND FUND
STATEMENT OF INVESTMENTS Continued
| | | | | | | | |
| | | Principal Amount | | | Value | |
Industrials—6.4% | | | | | | | | |
Aerospace & Defense—1.5% | | | | | | | | |
BAE Systems Holdings, Inc., 3.85% Sr. Unsec. Nts., 12/15/252 | | $ | 1,180,000 | | | $ | 1,169,052 | |
Huntington Ingalls Industries, Inc., 3.483% Sr. Unsec. Nts., 12/1/27 | | | 1,005,000 | | | | 955,403 | |
Northrop Grumman Corp., 4.75% Sr. Unsec. Nts., 6/1/43 | | | 450,000 | | | | 475,482 | |
United Technologies Corp., 4.50% Sr. Unsec. Nts., 6/1/42 | | | 450,000 | | | | 454,765 | |
| | | | | | | | |
| | | | | | | 3,054,702 | |
| | | | | | | | | |
Air Freight & Couriers—0.5% | | | | | | | | |
CH Robinson Worldwide, Inc., 4.20% Sr. Unsec. Nts., 4/15/28 | | | 825,000 | | | | 815,106 | |
United Parcel Service, Inc., 6.20% Sr. Unsec. Nts., 1/15/38 | | | 225,000 | | | | 282,345 | |
| | | | | | | | |
| | | | | | | 1,097,451 | |
| | | | | | | | | |
Building Products—0.5% | | | | | | | | |
Allegion US Holding Co., Inc., 3.55% Sec. Nts., 10/1/27 | | | 1,113,000 | | | | 1,026,409 | |
| | | | | | | | | |
Electrical Equipment—0.4% | | | | | | | | |
Sensata Technologies BV, 4.875% Sr. Unsec. Nts., 10/15/232 | | | 927,000 | | | | 937,429 | |
| | | | | | | | | |
Industrial Conglomerates—0.5% | | | | | | | | |
3M Co., 3.625% Sr. Unsec. Nts., 10/15/47 | | | 500,000 | | | | 475,543 | |
GE Capital International Funding Co. Unlimited Co., 3.373% Sr. Unsec. Nts., 11/15/25 | | | 507,000 | | | | 487,237 | |
| | | | | | | | |
| | | | | | | 962,780 | |
| | | | | | | | | |
Machinery—0.9% | | | | | | | | |
Caterpillar, Inc., 4.30% Sr. Unsec. Nts., 5/15/44 | | | 450,000 | | | | 469,221 | |
Nvent Finance Sarl, 4.55% Sr. Unsec. Nts., 4/15/282 | | | 832,000 | | | | 817,140 | |
Stanley Black & Decker, Inc., 2.451% Sub. Nts., 11/17/18 | | | 101,000 | | | | 100,969 | |
Wabtec Corp., 3.45% Sr. Unsec. Nts., 11/15/26 | | | 605,000 | | | | 557,778 | |
| | | | | | | | |
| | | | | | | 1,945,108 | |
| | | | | | | | | |
Professional Services—0.2% | | | | | | | | |
IHS Markit Ltd., 4.125% Sr. Unsec. Nts., 8/1/23 | | | 326,000 | | | | 326,182 | |
| | | | | | | | | |
Road & Rail—0.9% | | | | | | | | |
Penske Truck Leasing Co. LP/PTL Finance Corp., 3.40% Sr. Unsec. Nts., 11/15/262 | | | 1,129,000 | | | | 1,057,669 | |
Ryder System, Inc., 3.50% Sr. Unsec. Nts., 6/1/216 | | | 122,000 | | | | 122,193 | |
Union Pacific Corp., 4.05% Sr. Unsec. Nts., 11/15/45 | | | 600,000 | | | | 580,657 | |
| | | | | | | | |
| | | | | | | 1,760,519 | |
| | | | | | | | | |
Trading Companies & Distributors—1.0% | | | | | | | | |
Air Lease Corp.: | | | | | | | | |
3.25% Sr. Unsec. Nts., 3/1/25 | | | 365,000 | | | | 342,430 | |
3.625% Sr. Unsec. Nts., 4/1/27 | | | 409,000 | | | | 379,574 | |
GATX Corp., 3.50% Sr. Unsec. Nts., 3/15/28 | | | 839,000 | | | | 775,721 | |
18 OPPENHEIMER CORPORATE BOND FUND
| | | | | | | | |
| | | Principal Amount | | | Value | |
| |
Trading Companies & Distributors (Continued) | | | | | | | | |
| |
United Rentals North America, Inc., 4.625% Sr. Unsec. Nts., 10/15/25 | | $ | 515,000 | | | $ | 498,262 | |
| | | | | | | | |
| | | | | | | 1,995,987 | |
| |
Information Technology—6.9% | | | | | | | | |
| |
Communications Equipment—0.6% | | | | | | | | |
| |
Motorola Solutions, Inc., 4.60% Sr. Unsec. Nts., 2/23/28 | | | 1,249,000 | | | | 1,235,413 | |
| |
Electronic Equipment, Instruments, & Components—0.5% | | | | | | | | |
| |
Arrow Electronics, Inc., 3.875% Sr. Unsec. Nts., 1/12/28 | | | 1,075,000 | | | | 1,006,837 | |
| |
CDW LLC/CDW Finance Corp., 5.50% Sr. Unsec. Nts., 12/1/24 | | | 148,000 | | | | 154,246 | |
| | | | | | | | |
| | | | | | | 1,161,083 | |
| |
Internet Software & Services—0.4% | | | | | | | | |
| |
VeriSign, Inc.: | | | | | | | | |
4.75% Sr. Unsec. Nts., 7/15/27 | | | 495,000 | | | | 473,344 | |
5.25% Sr. Unsec. Nts., 4/1/25 | | | 271,000 | | | | 278,114 | |
| | | | | | | | |
| | | | | | | 751,458 | |
| |
IT Services—1.6% | | | | | | | | |
| |
DXC Technology Co.: | | | | | | | | |
2.875% Sr. Unsec. Nts., 3/27/20 | | | 343,000 | | | | 339,838 | |
4.75% Sr. Unsec. Nts., 4/15/27 | | | 1,099,000 | | | | 1,107,784 | |
| |
Fidelity National Information Services, Inc., 4.25% Sr. Unsec. Nts., 5/15/28 | | | 806,000 | | | | 809,593 | |
| |
International Business Machines Corp., 3.625% Sr. Unsec. Nts., 2/12/24 | | | 950,000 | | | | 957,619 | |
| | | | | | | | |
| | | | | | | 3,214,834 | |
| |
Semiconductors & Semiconductor Equipment—0.3% | | | | | | | | |
| |
Intel Corp., 3.734% Sr. Unsec. Nts., 12/8/47 | | | 631,000 | | | | 608,181 | |
| |
Software—2.8% | | | | | | | | |
| |
Autodesk, Inc., 4.375% Sr. Unsec. Nts., 6/15/25 | | | 430,000 | | | | 434,809 | |
| |
Dell International LLC/EMC Corp.: | | | | | | | | |
4.42% Sr. Sec. Nts., 6/15/212 | | | 450,000 | | | | 457,169 | |
6.02% Sr. Sec. Nts., 6/15/262 | | | 901,000 | | | | 952,819 | |
| |
Microsoft Corp., 3.70% Sr. Unsec. Nts., 8/8/46 | | | 500,000 | | | | 488,168 | |
| |
Open Text Corp., 5.625% Sr. Unsec. Nts., 1/15/232 | | | 552,000 | | | | 567,870 | |
| |
Oracle Corp., 5.375% Sr. Unsec. Unsub. Nts., 7/15/40 | | | 570,000 | | | | 662,303 | |
| |
salesforce.com, Inc., 3.70% Sr. Unsec. Nts., 4/11/28 | | | 1,100,000 | | | | 1,105,017 | |
| |
VMware, Inc.: | | | | | | | | |
2.30% Sr. Unsec. Nts., 8/21/20 | | | 500,000 | | | | 489,410 | |
3.90% Sr. Unsec. Nts., 8/21/27 | | | 741,000 | | | | 699,277 | |
| | | | | | | | |
| | | | | | | 5,856,842 | |
| |
Technology Hardware, Storage & Peripherals—0.7% | | | | | | | | |
| |
Apple, Inc., 4.375% Sr. Unsec. Nts., 5/13/45 | | | 775,000 | | | | 814,292 | |
19 OPPENHEIMER CORPORATE BOND FUND
STATEMENT OF INVESTMENTS Continued
| | | | | | | | |
| | | Principal Amount | | | Value | |
| |
Technology Hardware, Storage & Peripherals (Continued) | | | | | | | | |
| |
Hewlett Packard Enterprise Co., 3.60% Sr. Unsec. Nts., 10/15/20 | | $ | 550,000 | | | $ | 553,364 | |
| | | | | | | | |
| | | | | | | 1,367,656 | |
| |
Materials—5.9% | | | | | | | | |
| |
Chemicals—2.0% | | | | | | | | |
| |
Nutrien Ltd.: | | | | | | | | |
3.375% Sr. Unsec. Nts., 3/15/25 | | | 517,000 | | | | 486,623 | |
4.125% Sr. Unsec. Nts., 3/15/35 | | | 296,000 | | | | 276,192 | |
| |
PolyOne Corp., 5.25% Sr. Unsec. Nts., 3/15/23 | | | 915,000 | | | | 939,019 | |
| |
RPM International, Inc.: | | | | | | | | |
3.45% Sr. Unsec. Unsub. Nts., 11/15/22 | | | 875,000 | | | | 861,832 | |
3.75% Sr. Unsec. Nts., 3/15/27 | | | 335,000 | | | | 318,317 | |
| |
Yara International ASA, 4.75% Sr. Unsec. Nts., 6/1/282 | | | 1,189,000 | | | | 1,208,523 | |
| | | | | | | | |
| | | | | | | 4,090,506 | |
| |
Construction Materials—0.8% | | | | | | | | |
| |
James Hardie International Finance DAC, 4.75% Sr. Unsec. Nts., 1/15/252 | | | 900,000 | | | | 885,636 | |
| |
Martin Marietta Materials, Inc., 3.50% Sr. Unsec. Nts., 12/15/27 | | | 771,000 | | | | 713,704 | |
| | | | | | | | |
| | | | | | | 1,599,340 | |
| |
Containers & Packaging—1.6% | | | | | | | | |
| |
International Paper Co.: | | | | | | | | |
3.00% Sr. Unsec. Nts., 2/15/27 | | | 694,000 | | | | 635,730 | |
4.80% Sr. Unsec. Nts., 6/15/44 | | | 280,000 | | | | 273,707 | |
| |
Packaging Corp. of America: | | | | | | | | |
3.65% Sr. Unsec. Nts., 9/15/24 | | | 223,000 | | | | 218,166 | |
4.50% Sr. Unsec. Nts., 11/1/23 | | | 650,000 | | | | 670,092 | |
| |
Silgan Holdings, Inc., 4.75% Sr. Unsec. Nts., 3/15/25 | | | 660,000 | | | | 632,775 | |
| |
WestRock Co., 4.00% Sr. Unsec. Nts., 3/15/282 | | | 816,000 | | | | 806,062 | |
| | | | | | | | |
| | | | | | | 3,236,532 | |
| |
Metals & Mining—1.1% | | | | | | | | |
| |
Anglo American Capital plc: | | | | | | | | |
3.625% Sr. Unsec. Nts., 9/11/242 | | | 356,000 | | | | 336,295 | |
4.00% Sr. Unsec. Nts., 9/11/272 | | | 595,000 | | | | 549,485 | |
| |
ArcelorMittal, 6.125% Sr. Unsec. Nts., 6/1/25 | | | 950,000 | | | | 1,033,790 | |
| |
Goldcorp, Inc., 5.45% Sr. Unsec. Nts., 6/9/44 | | | 440,000 | | | | 469,915 | |
| | | | | | | | |
| | | | | | | 2,389,485 | |
| |
Paper & Forest Products—0.4% | | | | | | | | |
| |
Louisiana-Pacific Corp., 4.875% Sr. Unsec. Nts., 9/15/24 | | | 811,000 | | | | 804,918 | |
| | | | | | | | |
| |
Telecommunication Services—5.6% | | | | | | | | |
| |
Diversified Telecommunication Services—5.0% | | | | | | | | |
| |
AT&T, Inc.: | | | | | | | | |
4.30% Sr. Unsec. Nts., 2/15/302 | | | 1,039,000 | | | | 992,950 | |
20 OPPENHEIMER CORPORATE BOND FUND
| | | | | | | | |
| | | Principal Amount | | | Value | |
| |
Diversified Telecommunication Services (Continued) | | | | | | | | |
| |
AT&T, Inc.: (Continued) 4.35% Sr. Unsec. Nts., 6/15/45 | | $ | 855,000 | | | $ | 741,926 | |
4.50% Sr. Unsec. Nts., 3/9/48 | | | 1,375,000 | | | | 1,214,311 | |
| |
British Telecommunications plc, 9.625% Sr. Unsec. Nts., 12/15/30 | | | 686,000 | | | | 987,880 | |
| |
Deutsche Telekom International Finance BV, 4.375% Sr. Unsec. Nts., 6/21/282 | | | 747,000 | | | | 752,818 | |
| |
Telecom Italia SpA, 5.303% Sr. Unsec. Nts., 5/30/242 | | | 1,040,000 | | | | 1,046,500 | |
| |
Telefonica Emisiones SAU: | | | | | | | | |
4.103% Sr. Unsec. Nts., 3/8/27 | | | 128,000 | | | | 125,432 | |
5.213% Sr. Unsec. Nts., 3/8/47 | | | 203,000 | | | | 206,600 | |
7.045% Sr. Unsec. Unsub. Nts., 6/20/36 | | | 595,000 | | | | 730,365 | |
| |
T-Mobile USA, Inc., 6.50% Sr. Unsec. Nts., 1/15/26 | | | 975,000 | | | | 1,024,969 | |
| |
Verizon Communications, Inc.: | | | | | | | | |
4.522% Sr. Unsec. Nts., 9/15/48 | | | 1,567,000 | | | | 1,490,338 | |
5.15% Sr. Unsec. Nts., 9/15/23 | | | 800,000 | | | | 857,010 | |
| | | | | | | | |
| | | | | | | 10,171,099 | |
| |
Wireless Telecommunication Services—0.6% | | | | | | | | |
| |
Vodafone Group plc: | | | | | | | | |
4.375% Sr. Unsec. Nts., 5/30/28 | | | 788,000 | | | | 790,848 | |
6.15% Sr. Unsec. Nts., 2/27/37 | | | 490,000 | | | | 559,923 | |
| | | | | | | | |
| | | | | | | 1,350,771 | |
| |
Utilities—5.4% | | | | | | | | |
| |
Electric Utilities—4.4% | | | | | | | | |
| |
AEP Texas, Inc., 3.95% Sr. Unsec. Nts., 6/1/282 | | | 806,000 | | | | 807,250 | |
| |
Alabama Power Co., 4.30% Sr. Unsec. Nts., 1/2/46 | | | 350,000 | | | | 351,957 | |
| |
Duke Energy Corp., 3.15% Sr. Unsec. Nts., 8/15/27 | | | 712,000 | | | | 667,643 | |
| |
Duke Energy Florida LLC, 3.85% Sec. Nts., 11/15/42 | | | 620,000 | | | | 592,166 | |
| |
Edison International, 2.95% Sr. Unsec. Nts., 3/15/23 | | | 772,000 | | | | 743,585 | |
| |
EDP Finance BV, 3.625% Sr. Unsec. Nts., 7/15/242 | | | 989,000 | | | | 948,652 | |
| |
Emera US Finance LP, 2.15% Sr. Unsec. Nts., 6/15/19 | | | 389,000 | | | | 386,205 | |
| |
Exelon Corp., 4.45% Sr. Unsec. Nts., 4/15/46 | | | 386,000 | | | | 382,535 | |
| |
FirstEnergy Corp., 3.90% Sr. Unsec. Nts., 7/15/27 | | | 880,000 | | | | 859,531 | |
| |
Florida Power & Light Co., 5.40% Sr. Sec. Nts., 9/1/35 | | | 280,000 | | | | 318,399 | |
| |
ITC Holdings Corp., 5.30% Sr. Unsec. Nts., 7/1/43 | | | 323,000 | | | | 360,614 | |
| |
Mid-Atlantic Interstate Transmission LLC, 4.10% Sr. Unsec. Nts., 5/15/282 | | | 807,000 | | | | 807,633 | |
| |
NextEra Energy Operating Partners LP, 4.25% Sr. Unsec. Nts., 9/15/242 | | | 84,000 | | | | 81,270 | |
| |
Oncor Electric Delivery Co. LLC, 5.30% Sr. Sec. Nts., 6/1/42 | | | 350,000 | | | | 404,996 | |
| |
Pennsylvania Electric Co., 5.20% Sr. Unsec. Nts., 4/1/20 | | | 125,000 | | | | 127,797 | |
| |
PPL WEM Ltd./Western Power Distribution Ltd., 5.375% Sr. Unsec. Unsub. Nts., 5/1/212 | | | 500,000 | | | | 519,480 | |
| |
Trans-Allegheny Interstate Line Co., 3.85% Sr. Unsec. Nts., 6/1/252 | | | 743,000 | | | | 741,588 | |
| | | | | | | | |
| | | | | | | 9,101,301 | |
21 OPPENHEIMER CORPORATE BOND FUND
STATEMENT OF INVESTMENTS Continued
| | | | | | | | |
| | | Principal Amount | | | Value | |
| |
Gas Utilities—0.3% | | | | | | | | |
| |
Atmos Energy Corp., 4.125% Sr. Unsec. Nts., 10/15/44 | | $ | 555,000 | | | $ | 549,725 | |
| | | | | | | | |
| |
Multi-Utilities—0.7% | | | | | | | | |
| |
Boston Gas Co., 4.487% Sr. Unsec. Nts., 2/15/422 | | | 275,000 | | | | 283,607 | |
| |
Dominion Energy, Inc.: | | | | | | | | |
2.579% Jr. Sub. Nts., 7/1/20 | | | 210,000 | | | | 207,051 | |
4.90% Sr. Unsec. Nts., 8/1/41 | | | 250,000 | | | | 259,558 | |
| |
Niagara Mohawk Power Corp., 2.721% Sr. Unsec. Nts., 11/28/222 | | | 370,000 | | | | 358,836 | |
| |
Virginia Electric & Power Co., 4.45% Sr. Unsec. Nts., 2/15/44 | | | 325,000 | | | | 335,663 | |
| | | | | | | | |
| | | | | | | 1,444,715 | |
| | | | | | | | |
Total Corporate Bonds and Notes (Cost $188,528,935) | | | | | | | 185,131,749 | |
| | | | | | | | |
| |
Short-Term Notes—2.5% | | | | | | | | |
| |
Amphenol Corp., 2.15%, 8/1/187 | | | 1,000,000 | | | | 999,940 | |
| |
Avery Dennison, 2.201%, 8/6/187,8 | | | 1,000,000 | | | | 999,638 | |
| |
Cabot Corp., 2.242%, 8/9/182,7,8 | | | 1,000,000 | | | | 999,451 | |
| |
Johnson Controls International plc, 2.15%, 8/1/182,7,8 | | | 250,000 | | | | 249,986 | |
| |
Magna International, Inc., 2.221%, 8/7/182,7,8 | | | 1,000,000 | | | | 999,575 | |
| |
Walgreens Boots Alliance, Inc., 2.211%, 8/1/187 | | | 1,000,000 | | | | 999,940 | |
| | | | | | | | |
Total Short-Term Notes (Cost $5,248,827) | | | | | | | 5,248,530 | |
| | | | | | | | |
| | | Shares | | | | |
| |
Investment Companies—6.3% | | | | | | | | |
| |
Oppenheimer Institutional Government Money Market Fund, Cl. E, 1.87%9,10 | | | 4,015,800 | | | | 4,015,800 | |
| |
Oppenheimer Limited-Term Bond Fund, Cl. I9 | | | 1,973,482 | | | | 8,821,466 | |
| | | | | | | | |
Total Investment Companies (Cost $13,048,134) | | | | | | | 12,837,266 | |
| |
Total Investments, at Value (Cost $206,949,059) | | | 99.2% | | | | 203,350,617 | |
| |
Net Other Assets (Liabilities) | | | 0.8 | | | | 1,647,874 | |
| | | | |
Net Assets | | | 100.0% | | | $ | 204,998,491 | |
| | | | |
Footnotes to Statement of Investments
1. This interest rate resets periodically. Interest rate shown reflects the rate in effect at period end. The rate on this variable rate security is not based on a published reference rate and spread but is determined by the issuer or agent based on current market conditions.
2. Represents securities sold under Rule 144A, which are exempt from registration under the Securities Act of 1933, as amended. These securities have been determined to be liquid under guidelines established by the Board of Trustees. These securities amount to $42,323,333 or 20.65% of the Fund’s net assets at period end.
3. Represents the current interest rate for a variable or increasing rate security, determined as [Referenced Rate + Basis-point spread].
4. This bond has no contractual maturity date, is not redeemable and contractually pays an indefinite stream of interest.
5. Restricted security. The aggregate value of restricted securities at period end was $598,900, which represents 0.29% of the Fund’s net assets. See Note 4 of the accompanying Notes. Information concerning restricted securities is as follows:
22 OPPENHEIMER CORPORATE BOND FUND
Footnotes to Statement of Investments (Continued)
| | | | | | | | | | | | | | | | |
| Security | | Acquisition Dates | | | Cost | | | Value | | | Unrealized
Appreciation/
(Depreciation) | |
Lloyds Banking Group plc, 6.657% | | | | | | | | | | | | | | | | |
[US0003M+127] Jr. Sub. Perpetual | | | 2/20/14 | | | | | | | | | | | | | |
Bonds | | | – 10/24/14 | | | $ | 569,143 | | | $ | 598,900 | | | $ | 29,757 | |
6. All or a portion of the security position is when-issued or delayed delivery to be delivered and settled after period end. See Note 4 of the accompanying Notes.
7. Current yield as of period end.
8. Security issued in an exempt transaction without registration under the Securities Act of 1933. Such securities amount to $3,248,650 or 1.58% of the Fund’s net assets, and have been determined to be liquid pursuant to guidelines adopted by the Board of Trustees.
9. Is or was an affiliate, as defined in the Investment Company Act of 1940, as amended, at or during the reporting period, by virtue of the Fund owning at least 5% of the voting securities of the issuer or as a result of the Fund and the issuer having the same investment adviser. Transactions during the reporting period in which the issuer was an affiliate are as follows:
| | | | | | | | | | | | | | | | |
| | | Shares July 31, 2017 | | | Gross
Additions | | | Gross
Reductions | | | Shares July 31, 2018 | |
Investment Companies | | | | | | | | | | | | | |
Oppenheimer Institutional Government Money Market Fund, Cl. E | | | 4,171,368 | | | | 85,027,087 | | | | 85,182,655 | | | | 4,015,800 | |
Oppenheimer Limited-Term Bond Fund, Cl. I | | | 1,917,456 | | | | 56,026 | | | | — | | | | 1,973,482 | |
| | | | |
| | | Value | | | Income | | | Realized Gain (Loss) | | | Change in
Unrealized Gain (Loss) | |
Investment Companies | | | | | | | | | | | | | |
Oppenheimer Institutional Government Money Market Fund, Cl. E | | $ | 4,015,800 | | | $ | 53,953 | | | $ | — | | | $ | — | |
Oppenheimer Limited-Term Bond Fund, Cl. I | | | 8,821,466 | | | | 252,610 | | | | — | | | | (193,916) | |
| | | | |
Total | | $ | 12,837,266 | | | $ | 306,563 | | | $ | — | | | $ | (193,916) | |
| | | | |
10. Rate shown is the 7-day yield at period end.
| | | | | | | | | | | | | | | | | | | | | | | | |
Futures Contracts as of July 31, 2018 | |
| | | | | | Expiration | | | Number Notional Amount | | | | | | Unrealized
Appreciation/
(Depreciation) | |
| Description | | Buy/Sell | | | Date | | | of Contracts | | | (000’s) | | | Value | |
United States Treasury Long Bonds | | | Buy | | | | 9/19/18 | | | | 52 | | | | USD 7,490 | | | $ | 7,434,375 | | | $ | (55,609 | ) |
United States | | | | | | | | | | | | | | | | | | | | | | | | |
Treasury Nts., 10 yr. | | | Sell | | | | 9/19/18 | | | | 328 | | | | USD 39,300 | | | | 39,170,375 | | | | 129,977 | |
United States Treasury Nts., 2 yr. | | | Sell | | | | 9/28/18 | | | | 228 | | | | USD 48,263 | | | | 48,193,500 | | | | 69,002 | |
23 OPPENHEIMER CORPORATE BOND FUND
STATEMENT OF INVESTMENTS Continued
| | | | | | | | | | | | | | | | | | | | | | | | |
Futures Contracts (Continued) | |
| | | | | | Expiration Date | | | Number Notional Amount | | | | | | Unrealized Appreciation/
(Depreciation) | |
| Description | | Buy/Sell | | | of Contracts | | | (000’s) | | | Value | |
United States Treasury Nts., 5 yr. | | | Sell | | | | 9/28/18 | | | | 52 | | | | USD 5,907 | | | $ | 5,882,500 | | | $ | 24,362 | |
| | | | | | | | | | | | | | | | | | | | | | | | |
| | | | | | | | | | | | | | | | | | | | | | $ | 167,732 | |
| | | | | | | | | | | | | | | | | | | | | | | | |
Glossary:
Definitions
| | | | |
ICE LIBOR | | Intercontinental Exchange London Interbank Offered Rate | | |
US0003M | | ICE LIBOR USD 3 Month | | |
USISDA05 | | USD ICE Swap Rate 11:00am NY 5 Year | | |
USSW5 | | USD Swap Semi 30/360 5 Year | | |
See accompanying Notes to Financial Statements.
24 OPPENHEIMER CORPORATE BOND FUND
STATEMENT OF ASSETS AND LIABILITIES July 31, 2018
| | | | |
Assets | | | | |
Investments, at value—see accompanying statement of investments: | | | | |
Unaffiliated companies (cost $193,900,925) | | $ | 190,513,351 | |
Affiliated companies (cost $13,048,134) | | | 12,837,266 | |
| | | | |
| | | 203,350,617 | |
Cash | | | 500,000 | |
Cash used for collateral on futures | | | 507,500 | |
Receivables and other assets: | | | | |
Interest and dividends | | | 2,036,349 | |
Shares of beneficial interest sold | | | 111,020 | |
Variation margin receivable | | | 17,856 | |
Other | | | 26,290 | |
| | | | |
Total assets | | | 206,549,632 | |
| | | | |
Liabilities | | | | |
Payables and other liabilities: | | | | |
Shares of beneficial interest redeemed | | | 713,164 | |
Investments purchased (including $633,100 purchased on a when-issued or delayed delivery basis) | | | 656,529 | |
Distribution and service plan fees | | | 36,281 | |
Variation margin payable | | | 20,131 | |
Trustees’ compensation | | | 19,033 | |
Shareholder communications | | | 5,352 | |
Dividends | | | 4,278 | |
Other | | | 96,373 | |
| | | | |
Total liabilities | | | 1,551,141 | |
| | | | |
Net Assets | | $ | 204,998,491 | |
| | | | |
| | | | |
Composition of Net Assets | | | | |
Par value of shares of beneficial interest | | $ | 19,648 | |
Additional paid-in capital | | | 211,354,229 | |
Accumulated net investment income | | | 91,580 | |
Accumulated net realized loss on investments | | | (3,036,256) | |
Net unrealized depreciation on investments | | | (3,430,710 | ) |
| | | | |
Net Assets | | $ | 204,998,491 | |
| | | | |
25 OPPENHEIMER CORPORATE BOND FUND
STATEMENT OF ASSETS AND LIABILITIES Continued
| | | | |
Net Asset Value Per Share | | | | |
Class A Shares: | | | | |
| |
| Net asset value and redemption price per share (based on net assets of $119,119,548 and 11,415,812 shares of beneficial interest outstanding) | | $ | 10.43 | |
Maximum offering price per share (net asset value plus sales charge of 4.75% of offering price) | | $ | 10.95 | |
| |
Class C Shares: | | | | |
| |
| Net asset value, redemption price (excludes applicable contingent deferred sales charge) and offering price per share (based on net assets of $31,250,021 and 2,996,447 shares of beneficial interest outstanding) | | $ | 10.43 | |
| |
Class I Shares: | | | | |
| |
| Net asset value, redemption price and offering price per share (based on net assets of $7,783,371 and 745,824 shares of beneficial interest outstanding) | | $ | 10.44 | |
| |
Class R Shares: | | | | |
| |
| Net asset value, redemption price (excludes applicable contingent deferred sales charge) and offering price per share (based on net assets of $19,415,928 and 1,859,726 shares of beneficial interest outstanding) | | $ | 10.44 | |
| |
Class Y Shares: | | | | |
| |
| Net asset value, redemption price and offering price per share (based on net assets of $27,429,623 and 2,630,365 shares of beneficial interest outstanding) | | $ | 10.43 | |
See accompanying Notes to Financial Statements.
26 OPPENHEIMER CORPORATE BOND FUND
STATEMENT
OF OPERATIONS For the Year Ended July 31, 2018
| | | | |
Investment Income | | | | |
Interest (net of foreign withholding taxes of $488) | | $ | 7,770,807 | |
Dividends — affiliated companies | | | 306,563 | |
| | | | |
Total investment income | | | 8,077,370 | |
Expenses | | | | |
Management fees | | | 946,153 | |
Distribution and service plan fees: | | | | |
Class A | | | 316,555 | |
Class C | | | 330,481 | |
Class R | | | 88,553 | |
Transfer and shareholder servicing agent fees: | | | | |
Class A | | | 248,641 | |
Class C | | | 63,407 | |
Class I | | | 1,678 | |
Class R | | | 34,160 | |
Class Y | | | 44,249 | |
Shareholder communications: | | | | |
Class A | | | 16,505 | |
Class C | | | 4,188 | |
Class I | | | 346 | |
Class R | | | 2,227 | |
Class Y | | | 2,931 | |
Custodian fees and expenses | | | 23,338 | |
Trustees’ compensation | | | 16,881 | |
Borrowing fees | | | 7,409 | |
Other | | | 104,655 | |
| | | | |
Total expenses | | | 2,252,357 | |
Less reduction to custodian expenses | | | (602) | |
Less waivers and reimbursements of expenses | | | (47,381) | |
| | | | |
Net expenses | | | 2,204,374 | |
Net Investment Income | | | 5,872,996 | |
27 OPPENHEIMER CORPORATE BOND FUND
STATEMENT
OF OPERATIONS Continued
| | | | |
Realized and Unrealized Gain (Loss) | | | | |
Net realized gain (loss) on: | | | | |
Investment transactions in unaffiliated companies | | $ | (895,030) | |
Futures contracts | | | 470,054 | |
Swap contracts | | | 67,361 | |
Swaption contracts written | | | 14,608 | |
| | | | |
Net realized loss | | | (343,007) | |
Net change in unrealized appreciation/depreciation on: | | | | |
Investment transactions in: | | | | |
Unaffiliated companies | | | (9,304,711) | |
Affiliated companies | | | (193,916) | |
Futures contracts | | | 156,157 | |
Swap contracts | | | (149,670) | |
| | | | |
Net change in unrealized appreciation/depreciation | | | (9,492,140) | |
Net Decrease in Net Assets Resulting from Operations | | $ | (3,962,151) | |
| | | | |
See accompanying Notes to Financial Statements.
28 OPPENHEIMER CORPORATE BOND FUND
STATEMENTS OF CHANGES IN NET ASSETS
| | | | | | | | |
| | | Year Ended
July 31, 2018 | | | Year Ended
July 31, 2017 | |
Operations | | | | | | | | |
Net investment income | | $ | 5,872,996 | | | $ | 4,945,680 | |
Net realized gain (loss) | | | (343,007) | | | | 2,151,387 | |
Net change in unrealized appreciation/depreciation | | | (9,492,140) | | | | (4,252,008) | |
| | | | |
Net increase (decrease) in net assets resulting from operations | | | (3,962,151) | | | | 2,845,059 | |
Dividends and/or Distributions to Shareholders | | | | | | | | |
Dividends from net investment income: | | | | | | | | |
Class A | | | (3,761,706) | | | | (3,708,902) | |
Class C | | | (711,506) | | | | (734,685) | |
Class I | | | (186,507) | | | | (18,808) | |
Class R | | | (480,402) | | | | (348,759) | |
Class Y | | | (749,702) | | | | (390,596) | |
| | | | |
| | | (5,889,823) | | | | (5,201,750) | |
Beneficial Interest Transactions | | | | | | | | |
Net increase (decrease) in net assets resulting from beneficial interest transactions: | | | | | | | | |
Class A | | | (4,812,097) | | | | (7,394,506) | |
Class C | | | (637,324) | | | | (4,261,994) | |
Class I | | | 5,873,003 | | | | 2,088,817 | |
Class R | | | 4,944,820 | | | | 3,686,814 | |
Class Y | | | 10,822,468 | | | | 6,789,107 | |
| | | | |
| | | 16,190,870 | | | | 908,238 | |
Net Assets | | | | | | | | |
Total increase (decrease) | | | 6,338,896 | | | | (1,448,453) | |
Beginning of period | | | 198,659,595 | | | | 200,108,048 | |
| | | | |
End of period (including accumulated net investment income (loss) of $91,580 and $(60,704), respectively) | | $ | 204,998,491 | | | $ | 198,659,595 | |
| | | | |
See accompanying Notes to Financial Statements.
29 OPPENHEIMER CORPORATE BOND FUND
FINANCIAL HIGHLIGHTS
| | | | | | | | | | | | | | | | | | | | |
| Class A | | Year Ended
July 31, 2018 | | | Year Ended
July 31, 2017 | | | Year Ended
July 31, 2016 | | | Year Ended
July 31, 2015 | | | Year Ended
July 31, 2014 | |
Per Share Operating Data | | | | | | | | | | | | | | | | | | | | |
Net asset value, beginning of period | | | $10.92 | | | | $11.03 | | | | $10.66 | | | | $10.90 | | | | $10.74 | |
Income (loss) from investment operations: | | | | | | | | | | | | | | | | | | | | |
Net investment income1 | | | 0.31 | | | | 0.29 | | | | 0.30 | | | | 0.33 | | | | 0.34 | |
Net realized and unrealized gain (loss) | | | (0.49) | | | | (0.10) | | | | 0.37 | | | | (0.24) | | | | 0.44 | |
| | | | |
Total from investment operations | | | (0.18) | | | | 0.19 | | | | 0.67 | | | | 0.09 | | | | 0.78 | |
Dividends and/or distributions to shareholders: | | | | | | | | | | | | | | | | | | | | |
Dividends from net investment income | | | (0.31) | | | | (0.30) | | | | (0.30) | | | | (0.33) | | | | (0.34) | |
Distributions from net realized gain | | | 0.00 | | | | 0.00 | | | | 0.00 | | | | 0.00 | | | | (0.28) | |
| | | | |
Total dividends and/or distributions to shareholders | | | (0.31) | | | | (0.30) | | | | (0.30) | | | | (0.33) | | | | (0.62) | |
Net asset value, end of period | | | $10.43 | | | | $10.92 | | | | $11.03 | | | | $10.66 | | | | $10.90 | |
| | | | |
| | | | | | | | | | | | | | | | | | | | |
Total Return, at Net Asset Value2 | | | (1.67)% | | | | 1.82% | | | | 6.45% | | | | 0.84% | | | | 7.56% | |
| | | | | | | | | | | | | | | | | | | | |
Ratios/Supplemental Data | | | | | | | | | | | | | | | | | | | | |
Net assets, end of period (in thousands) | | | $119,119 | | | | $129,985 | | | | $139,018 | | | | $103,315 | | | | $86,231 | |
Average net assets (in thousands) | | | $129,767 | | | | $132,043 | | | | $125,116 | | | | $101,748 | | | | $70,792 | |
Ratios to average net assets:3 | | | | | | | | | | | | | | | | | | | | |
Net investment income | | | 2.89% | | | | 2.68% | | | | 2.83% | | | | 3.07% | | | | 3.19% | |
Expenses excluding specific expenses listed below | | | 0.97% | | | | 1.00% | | | | 1.02% | | | | 1.01% | | | | 1.03% | |
Interest and fees from borrowings | | | 0.00%4 | | | | 0.00%4 | | | | 0.00%4 | | | | 0.00%4 | | | | 0.00% | |
| | | | |
Total expenses5 | | | 0.97% | | | | 1.00% | | | | 1.02% | | | | 1.01% | | | | 1.03% | |
| Expenses after payments, waivers and/or reimbursements and reduction to custodian expenses | | | 0.95% | | | | 0.97% | | | | 1.00% | | | | 1.00% | | | | 0.99% | |
Portfolio turnover rate | | | 57% | | | | 80% | | | | 73% | | | | 100% | | | | 119% | |
1. Per share amounts calculated based on the average shares outstanding during the period.
2. Assumes an initial investment on the business day before the first day of the fiscal period, with all dividends and distributions reinvested in additional shares on the reinvestment date, and redemption at the net asset value calculated on the last business day of the fiscal period. Sales charges are not reflected in the total returns. Total returns are not annualized for periods less than one full year. Returns do not reflect the deduction of taxes that a shareholder would pay on fund distributions or the redemption of fund shares.
3. Annualized for periods less than one full year.
4. Less than 0.005%.
5. Total expenses including indirect expenses from affiliated fund fees and expenses were as follows:
| | | | | | |
| | | | | | |
| | Year Ended July 31, 2018 | | | 0.99 | % |
| | Year Ended July 31, 2017 | | | 1.02 | % |
| | Year Ended July 31, 2016 | | | 1.03 | % |
| | Year Ended July 31, 2015 | | | 1.02 | % |
| | Year Ended July 31, 2014 | | | 1.04 | % |
See accompanying Notes to Financial Statements.
30 OPPENHEIMER CORPORATE BOND FUND
| | | | | | | | | | | | | | | | | | | | |
| Class C | | Year Ended
July 31, 2018 | | | Year Ended
July 31, 2017 | | | Year Ended
July 31, 2016 | | | Year Ended
July 31, 2015 | | | Year Ended
July 31, 2014 | |
Per Share Operating Data | | | | | | | | | | | | | | | | | | | | |
Net asset value, beginning of period | | | $10.91 | | | | $11.03 | | | | $10.65 | | | | $10.89 | | | | $10.73 | |
Income (loss) from investment operations: | | | | | | | | | | | | | | | | | | | | |
Net investment income1 | | | 0.23 | | | | 0.21 | | | | 0.22 | | | | 0.25 | | | | 0.26 | |
Net realized and unrealized gain (loss) | | | (0.48) | | | | (0.11) | | | | 0.38 | | | | (0.24) | | | | 0.44 | |
| | | | |
Total from investment operations | | | (0.25) | | | | 0.10 | | | | 0.60 | | | | 0.01 | | | | 0.70 | |
Dividends and/or distributions to shareholders: | | | | | | | | | | | | | | | | | | | | |
Dividends from net investment income | | | (0.23) | | | | (0.22) | | | | (0.22) | | | | (0.25) | | | | (0.26) | |
Distributions from net realized gain | | | 0.00 | | | | 0.00 | | | | 0.00 | | | | 0.00 | | | | (0.28) | |
| | | | |
Total dividends and/or distributions to shareholders | | | (0.23) | | | | (0.22) | | | | (0.22) | | | | (0.25) | | | | (0.54) | |
Net asset value, end of period | | | $10.43 | | | | $10.91 | | | | $11.03 | | | | $10.65 | | | | $10.89 | |
| | | | |
| | | | | | | | | | | | | | | | | | | | |
Total Return, at Net Asset Value2 | | | (2.32)% | | | | 0.97% | | | | 5.76% | | | | 0.08% | | | | 6.77% | |
| | | | | | | | | | | | | | | | | | | | |
Ratios/Supplemental Data | | | | | | | | | | | | | | | | | | | | |
Net assets, end of period (in thousands) | | | $31,250 | | | | $33,420 | | | | $38,261 | | | | $27,706 | | | | $19,280 | |
Average net assets (in thousands) | | | $33,138 | | | | $35,836 | | | | $31,800 | | | | $24,595 | | | | $17,588 | |
Ratios to average net assets:3 | | | | | | | | | | | | | | | | | | | | |
Net investment income | | | 2.14% | | | | 1.92% | | | | 2.07% | | | | 2.32% | | | | 2.45% | |
Expenses excluding specific expenses listed below | | | 1.72% | | | | 1.75% | | | | 1.77% | | | | 1.78% | | | | 1.81% | |
Interest and fees from borrowings | | | 0.00%4 | | | | 0.00%4 | | | | 0.00%4 | | | | 0.00%4 | | | | 0.00% | |
| | | | |
Total expenses5 | | | 1.72% | | | | 1.75% | | | | 1.77% | | | | 1.78% | | | | 1.81% | |
| Expenses after payments, waivers and/or reimbursements and reduction to custodian expenses | | | 1.70% | | | | 1.72% | | | | 1.75% | | | | 1.75% | | | | 1.74% | |
Portfolio turnover rate | | | 57% | | | | 80% | | | | 73% | | | | 100% | | | | 119% | |
1. Per share amounts calculated based on the average shares outstanding during the period.
2. Assumes an initial investment on the business day before the first day of the fiscal period, with all dividends and distributions reinvested in additional shares on the reinvestment date, and redemption at the net asset value calculated on the last business day of the fiscal period. Sales charges are not reflected in the total returns. Total returns are not annualized for periods less than one full year. Returns do not reflect the deduction of taxes that a shareholder would pay on fund distributions or the redemption of fund shares.
3. Annualized for periods less than one full year.
4. Less than 0.005%.
5. Total expenses including indirect expenses from affiliated fund fees and expenses were as follows:
| | | | | | |
| | | | | | |
| | Year Ended July 31, 2018 | | | 1.74 | % |
| | Year Ended July 31, 2017 | | | 1.77 | % |
| | Year Ended July 31, 2016 | | | 1.78 | % |
| | Year Ended July 31, 2015 | | | 1.79 | % |
| | Year Ended July 31, 2014 | | | 1.82 | % |
See accompanying Notes to Financial Statements.
31 OPPENHEIMER CORPORATE BOND FUND
FINANCIAL HIGHLIGHTS Continued
| | | | | | | | | | | | | | | | | | | | |
| Class I | | Year Ended
July 31, 2018 | | | Year Ended
July 31, 2017 | | | Year Ended
July 31, 2016 | | | Year Ended
July 31, 2015 | | | Year Ended
July 31, 2014 | |
Per Share Operating Data | | | | | | | | | | | | | | | | | | | | |
Net asset value, beginning of period | | | $10.92 | | | | $11.03 | | | | $10.65 | | | | $10.89 | | | | $10.73 | |
Income (loss) from investment operations: | | | | | | | | | | | | | | | | | | | | |
Net investment income1 | | | 0.35 | | | | 0.35 | | | | 0.35 | | | | 0.38 | | | | 0.39 | |
Net realized and unrealized gain (loss) | | | (0.48) | | | | (0.11) | | | | 0.38 | | | | (0.24) | | | | 0.44 | |
| | | | |
Total from investment operations | | | (0.13) | | | | 0.24 | | | | 0.73 | | | | 0.14 | | | | 0.83 | |
Dividends and/or distributions to shareholders: | | | | | | | | | | | | | | | | | | | | |
Dividends from net investment income | | | (0.35) | | | | (0.35) | | | | (0.35) | | | | (0.38) | | | | (0.39) | |
Distributions from net realized gain | | | 0.00 | | | | 0.00 | | | | 0.00 | | | | 0.00 | | | | (0.28) | |
| | | | |
Total dividends and/or distributions to shareholders | | | (0.35) | | | | (0.35) | | | | (0.35) | | | | (0.38) | | | | (0.67) | |
Net asset value, end of period | | | $10.44 | | | | $10.92 | | | | $11.03 | | | | $10.65 | | | | $10.89 | |
| | | | |
| | | | | | | | | | | | | | | | | | | | |
Total Return, at Net Asset Value2 | | | (1.18)% | | | | 2.27% | | | | 7.03% | | | | 1.29% | | | | 8.04% | |
| | | | | | | | | | | | | | | | | | | | |
Ratios/Supplemental Data | | | | | | | | | | | | | | | | | | | | |
Net assets, end of period (in thousands) | | | $7,783 | | | | $2,189 | | | | $80 | | | | $110 | | | | $12 | |
Average net assets (in thousands) | | | $5,612 | | | | $563 | | | | $110 | | | | $105 | | | | $11 | |
Ratios to average net assets:3 | | | | | | | | | | | | | | | | | | | | |
Net investment income | | | 3.30% | | | | 3.23% | | | | 3.28% | | | | 3.52% | | | | 3.65% | |
Expenses excluding specific expenses listed below | | | 0.56% | | | | 0.56% | | | | 0.57% | | | | 0.56% | | | | 0.56% | |
Interest and fees from borrowings | | | 0.00%4 | | | | 0.00%4 | | | | 0.00%4 | | �� | | 0.00%4 | | | | 0.00% | |
| | | | |
Total expenses5 | | | 0.56% | | | | 0.56% | | | | 0.57% | | | | 0.56% | | | | 0.56% | |
| Expenses after payments, waivers and/or reimbursements and reduction to custodian expenses | | | 0.54% | | | | 0.54% | | | | 0.55% | | | | 0.55% | | | | 0.54% | |
Portfolio turnover rate | | | 57% | | | | 80% | | | | 73% | | | | 100% | | | | 119% | |
1. Per share amounts calculated based on the average shares outstanding during the period.
2. Assumes an initial investment on the business day before the first day of the fiscal period, with all dividends and distributions reinvested in additional shares on the reinvestment date, and redemption at the net asset value calculated on the last business day of the fiscal period. Sales charges are not reflected in the total returns. Total returns are not annualized for periods less than one full year. Returns do not reflect the deduction of taxes that a shareholder would pay on fund distributions or the redemption of fund shares.
3. Annualized for periods less than one full year.
4. Less than 0.005%.
5. Total expenses including indirect expenses from affiliated fund fees and expenses were as follows:
| | | | | | |
| | | | | | |
| | Year Ended July 31, 2018 | | | 0.58 | % |
| | Year Ended July 31, 2017 | | | 0.58 | % |
| | Year Ended July 31, 2016 | | | 0.58 | % |
| | Year Ended July 31, 2015 | | | 0.57 | % |
| | Year Ended July 31, 2014 | | | 0.57 | % |
See accompanying Notes to Financial Statements.
32 OPPENHEIMER CORPORATE BOND FUND
| | | | | | | | | | | | | | | | | | | | |
| Class R | | Year Ended
July 31, 2018 | | | Year Ended
July 31, 2017 | | | Year Ended
July 31, 2016 | | | Year Ended
July 31, 2015 | | | Year Ended
July 31, 2014 | |
Per Share Operating Data | | | | | | | | | | | | | | | | | | | | |
Net asset value, beginning of period | | | $10.93 | | | | $11.04 | | | | $10.66 | | | | $10.90 | | | | $10.74 | |
Income (loss) from investment operations: | | | | | | | | | | | | | | | | | | | | |
Net investment income1 | | | 0.28 | | | | 0.26 | | | | 0.27 | | | | 0.31 | | | | 0.32 | |
Net realized and unrealized gain (loss) | | | (0.49) | | | | (0.09) | | | | 0.39 | | | | (0.24) | | | | 0.44 | |
| | | | |
Total from investment operations | | | (0.21) | | | | 0.17 | | | | 0.66 | | | | 0.07 | | | | 0.76 | |
Dividends and/or distributions to shareholders: | | | | | | | | | | | | | | | | | | | | |
Dividends from net investment income | | | (0.28) | | | | (0.28) | | | | (0.28) | | | | (0.31) | | | | (0.32) | |
Distributions from net realized gain | | | 0.00 | | | | 0.00 | | | | 0.00 | | | | 0.00 | | | | (0.28) | |
| | | | |
Total dividends and/or distributions to shareholders | | | (0.28) | | | | (0.28) | | | | (0.28) | | | | (0.31) | | | | (0.60) | |
Net asset value, end of period | | | $10.44 | | | | $10.93 | | | | $11.04 | | | | $10.66 | | | | $10.90 | |
| | | | |
| | | | | | | | | | | | | | | | | | | | |
Total Return, at Net Asset Value2 | | | (1.91)% | | | | 1.58% | | | | 6.29% | | | | 0.59% | | | | 7.29% | |
| | | | | | | | | | | | | | | | | | | | |
Ratios/Supplemental Data | | | | | | | | | | | | | | | | | | | | |
Net assets, end of period (in thousands) | | | $19,416 | | | | $15,318 | | | | $11,736 | | | | $6,189 | | | | $4,782 | |
Average net assets (in thousands) | | | $18,041 | | | | $13,530 | | | | $8,432 | | | | $5,572 | | | | $4,129 | |
Ratios to average net assets:3 | | | | | | | | | | | | | | | | | | | | |
Net investment income | | | 2.65% | | | | 2.45% | | | | 2.55% | | | | 2.82% | | | | 2.94% | |
Expenses excluding specific expenses listed below | | | 1.21% | | | | 1.25% | | | | 1.27% | | | | 1.27% | | | | 1.30% | |
Interest and fees from borrowings | | | 0.00%4 | | | | 0.00%4 | | | | 0.00%4 | | |
| 0.00%4
|
| | | 0.00% | |
| | | | |
Total expenses5 | | | 1.21% | | | | 1.25% | | | | 1.27% | | | | 1.27% | | | | 1.30% | |
| Expenses after payments, waivers and/or reimbursements and reduction to custodian expenses | | | 1.19% | | | | 1.22% | | | | 1.25% | | | | 1.25% | | | | 1.24% | |
Portfolio turnover rate | | | 57% | | | | 80% | | | | 73% | | | | 100% | | | | 119% | |
1. Per share amounts calculated based on the average shares outstanding during the period.
2. Assumes an initial investment on the business day before the first day of the fiscal period, with all dividends and distributions reinvested in additional shares on the reinvestment date, and redemption at the net asset value calculated on the last business day of the fiscal period. Sales charges are not reflected in the total returns. Total returns are not annualized for periods less than one full year. Returns do not reflect the deduction of taxes that a shareholder would pay on fund distributions or the redemption of fund shares.
3. Annualized for periods less than one full year.
4. Less than 0.005%.
5. Total expenses including indirect expenses from affiliated fund fees and expenses were as follows:
| | | | | | |
| | | | | | |
| | Year Ended July 31, 2018 | | | 1.23 | % |
| | Year Ended July 31, 2017 | | | 1.27 | % |
| | Year Ended July 31, 2016 | | | 1.28 | % |
| | Year Ended July 31, 2015 | | | 1.28 | % |
| | Year Ended July 31, 2014 | | | 1.31 | % |
See accompanying Notes to Financial Statements.
33 OPPENHEIMER CORPORATE BOND FUND
FINANCIAL HIGHLIGHTS Continued
| | | | | | | | | | | | | | | | | | | | |
| Class Y | | Year Ended
July 31, 2018 | | | Year Ended
July 31, 2017 | | | Year Ended
July 31, 2016 | | | Year Ended
July 31, 2015 | | | Year Ended
July 31, 2014 | |
Per Share Operating Data | | | | | | | | | | | | | | | | | | | | |
Net asset value, beginning of period | | | $10.91 | | | | $11.03 | | | | $10.65 | | | | $10.89 | | | | $10.72 | |
Income (loss) from investment operations: | | | | | | | | | | | | | | | | | | | | |
Net investment income1 | | | 0.33 | | | | 0.32 | | | | 0.32 | | | | 0.36 | | | | 0.36 | |
Net realized and unrealized gain (loss) | | | (0.47) | | | | (0.11) | | | | 0.39 | | | | (0.24) | | | | 0.46 | |
| | | | |
Total from investment operations | | | (0.14) | | | | 0.21 | | | | 0.71 | | | | 0.12 | | | | 0.82 | |
Dividends and/or distributions to shareholders: | | | | | | | | | | | | | | | | | | | | |
Dividends from net investment income | | | (0.34) | | | | (0.33) | | | | (0.33) | | | | (0.36) | | | | (0.37) | |
Distributions from net realized gain | | | 0.00 | | | | 0.00 | | | | 0.00 | | | | 0.00 | | | | (0.28) | |
| | | | |
Total dividends and/or distributions to shareholders | | | (0.34) | | | | (0.33) | | | | (0.33) | | | | (0.36) | | | | (0.65) | |
Net asset value, end of period | | | $10.43 | | | | $10.91 | | | | $11.03 | | | | $10.65 | | | | $10.89 | |
| | | | |
| | | | | | | | | | | | | | | | | | | | |
Total Return, at Net Asset Value2 | | | (1.35)% | | | | 1.98% | | | | 6.82% | | | | 1.09% | | | | 7.93% | |
| | | | | | | | | | | | | | | | | | | | |
Ratios/Supplemental Data | | | | | | | | | | | | | | | | | | | | |
Net assets, end of period (in thousands) | | | $27,430 | | | | $17,748 | | | | $11,013 | | | | $5,413 | | | | $2,747 | |
Average net assets (in thousands) | | | $23,728 | | | | $12,709 | | | | $6,857 | | | | $4,275 | | | | $1,285 | |
Ratios to average net assets:3 | | | | | | | | | | | | | | | | | | | | |
Net investment income | | | 3.14% | | | | 2.95% | | | | 3.04% | | | | 3.35% | | | | 3.38% | |
Expenses excluding specific expenses listed below | | | 0.72% | | | | 0.75% | | | | 0.77% | | | | 0.77% | | | | 1.87% | |
Interest and fees from borrowings | | | 0.00%4 | | | | 0.00%4 | | | | 0.00%4 | | | | 0.00%4 | | | | 0.00% | |
| | | | |
Total expenses5 | | | 0.72% | | | | 0.75% | | | | 0.77% | | | | 0.77% | | | | 1.87% | |
| Expenses after payments, waivers and/or reimbursements and reduction to custodian expenses | | | 0.70% | | | | 0.72% | | | | 0.75% | | | | 0.75% | | | | 0.75% | |
Portfolio turnover rate | | | 57% | | | | 80% | | | | 73% | | | | 100% | | | | 119% | |
1. Per share amounts calculated based on the average shares outstanding during the period.
2. Assumes an initial investment on the business day before the first day of the fiscal period, with all dividends and distributions reinvested in additional shares on the reinvestment date, and redemption at the net asset value calculated on the last business day of the fiscal period. Sales charges are not reflected in the total returns. Total returns are not annualized for periods less than one full year. Returns do not reflect the deduction of taxes that a shareholder would pay on fund distributions or the redemption of fund shares.
3. Annualized for periods less than one full year.
4. Less than 0.005%.
5. Total expenses including indirect expenses from affiliated fund fees and expenses were as follows:
| | | | | | |
| | | | | | |
| | Year Ended July 31, 2018 | | | 0.74 | % |
| | Year Ended July 31, 2017 | | | 0.77 | % |
| | Year Ended July 31, 2016 | | | 0.78 | % |
| | Year Ended July 31, 2015 | | | 0.78 | % |
| | Year Ended July 31, 2014 | | | 1.88 | % |
See accompanying Notes to Financial Statements.
34 OPPENHEIMER CORPORATE BOND FUND
NOTES TO FINANCIAL STATEMENTS July 31, 2018
1. Organization
Oppenheimer Corporate Bond Fund (the “Fund”) is registered under the Investment Company Act of 1940 (“1940 Act”), as amended, as an open-end diversified management investment company. The Fund’s investment objective is to seek total return. The Fund’s investment adviser is OFI Global Asset Management, Inc. (“OFI Global” or the “Manager”), a wholly-owned subsidiary of OppenheimerFunds, Inc. (“OFI” or the “Sub-Adviser”). The Manager has entered into a sub-advisory agreement with OFI.
The Fund offers Class A, Class C, Class I, Class R and Class Y shares. Class A shares are sold at their offering price, which is normally net asset value plus a front-end sales charge. Class C and Class R shares are sold without a front-end sales charge but may be subject to a contingent deferred sales charge (“CDSC”). Class R shares are sold only through retirement plans. Retirement plans that offer Class R shares may impose charges on those accounts. Class I and Class Y shares are sold to certain institutional investors or intermediaries without either a front-end sales charge or a CDSC, however, the intermediaries may impose charges on their accountholders who beneficially own Class I and Class Y shares. All classes of shares have identical rights and voting privileges with respect to the Fund in general and exclusive voting rights on matters that affect that class alone. Earnings, net assets and net asset value per share may differ due to each class having its own expenses, such as transfer and shareholder servicing agent fees and shareholder communications, directly attributable to that class. Class A, C and R shares have separate distribution and/or service plans under which they pay fees. Class I and Class Y shares do not pay such fees.
The following is a summary of significant accounting policies followed in the Fund’s preparation of financial statements in accordance with accounting principles generally accepted in the United States (“U.S. GAAP”).
2. Significant Accounting Policies
Security Valuation. All investments in securities are recorded at their estimated fair value, as described in Note 3.
Allocation of Income, Expenses, Gains and Losses. Income, expenses (other than those attributable to a specific class), gains and losses are allocated on a daily basis to each class of shares based upon the relative proportion of net assets represented by such class. Operating expenses directly attributable to a specific class are charged against the operations of that class.
Dividends and Distributions to Shareholders. Dividends and distributions to shareholders, which are determined in accordance with income tax regulations and may differ from U.S. GAAP, are recorded on the ex-dividend date. Income distributions, if any, are declared daily and paid monthly. Capital gain distributions, if any, are declared and paid annually or at other times as determined necessary by the Manager.
Investment Income. Dividend income is recorded on the ex-dividend date or upon
35 OPPENHEIMER CORPORATE BOND FUND
NOTES TO FINANCIAL STATEMENTS Continued
2. Significant Accounting Policies (Continued)
ex-dividend notification in the case of certain foreign dividends where the ex-dividend date may have passed. Non-cash dividends included in dividend income, if any, are recorded at the fair value of the securities received. Withholding taxes on foreign dividends, if any, and capital gains taxes on foreign investments, if any, have been provided for in accordance with the Fund’s understanding of the applicable tax rules and regulations. Interest income, if any, is recognized on an accrual basis. Discount and premium, which are included in interest income on the Statement of Operations, are amortized or accreted daily.
Custodian Fees. “Custodian fees and expenses” in the Statement of Operations may include interest expense incurred by the Fund on any cash overdrafts of its custodian account during the period. Such cash overdrafts may result from the effects of failed trades in portfolio securities and from cash outflows resulting from unanticipated shareholder redemption activity. The Fund pays interest to its custodian on such cash overdrafts, to the extent they are not offset by positive cash balances maintained by the Fund, at a rate equal to the Federal Funds Rate plus 2.00%. The “Reduction to custodian expenses” line item, if applicable, represents earnings on cash balances maintained by the Fund during the period. Such interest expense and other custodian fees may be paid with these earnings.
Security Transactions. Security transactions are recorded on the trade date. Realized gains and losses on securities sold are determined on the basis of identified cost.
Indemnifications. The Fund’s organizational documents provide current and former Trustees and officers with a limited indemnification against liabilities arising in connection with the performance of their duties to the Fund. In the normal course of business, the Fund may also enter into contracts that provide general indemnifications. The Fund’s maximum exposure under these arrangements is unknown as this would be dependent on future claims that may be made against the Fund. The risk of material loss from such claims is considered remote.
Federal Taxes. The Fund intends to comply with provisions of the Internal Revenue Code applicable to regulated investment companies and to distribute substantially all of its investment company taxable income, including any net realized gain on investments not offset by capital loss carryforwards, if any, to shareholders. Therefore, no federal income or excise tax provision is required. The Fund files income tax returns in U.S. federal and applicable state jurisdictions. The statute of limitations on the Fund’s tax return filings generally remains open for the three preceding fiscal reporting period ends. The Fund has analyzed its tax positions for the fiscal year ended July 31, 2018, including open tax years, and does not believe there are any uncertain tax positions requiring recognition in the Fund’s financial statements.
The tax components of capital shown in the following table represent distribution requirements the Fund must satisfy under the income tax regulations, losses the Fund may be able to offset against income and gains realized in future years and unrealized appreciation or depreciation of securities and other investments for federal income tax purposes.
36 OPPENHEIMER CORPORATE BOND FUND
2. Significant Accounting Policies (Continued)
| | | | | | | | | | | | |
Undistributed
Net
Investment
Income | | Undistributed
Long-Term
Gain | | | Accumulated
Loss
Carryforward1,2,3 | | | Net Unrealized
Depreciation
Based on cost of
Securities and
Other Investments
for Federal Income
Tax Purposes | |
| $110,613 | | | $— | | | | $2,810,210 | | | | $3,656,756 | |
1. At period end, the Fund had $2,810,210 of net capital loss carryforward available to offset future realized capital gains, if any, and thereby reduce future taxable gain distributions.
2. During the reporting period, the Fund did not utilize any capital loss carryforward.
3. During the previous reporting period, the Fund utilized $2,161,432 of capital loss carryforward to offset capital gains realized in that fiscal year.
Net investment income (loss) and net realized gain (loss) may differ for financial statement and tax purposes. The character of dividends and distributions made during the fiscal year from net investment income or net realized gains are determined in accordance with federal income tax requirements, which may differ from the character of net investment income or net realized gains presented in those financial statements in accordance with U.S. GAAP. Also, due to timing of dividends and distributions, the fiscal year in which amounts are distributed may differ from the fiscal year in which the income or net realized gain was recorded by the Fund.
Accordingly, the following amounts have been reclassified for the reporting period. Net assets of the Fund were unaffected by the reclassifications.
| | | | |
Reduction to Accumulated
Net Investment
Loss | | Increase to Accumulated Net
Realized Loss
on Investments | |
| $169,111 | | | $169,111 | |
The tax character of distributions paid during the reporting periods:
| | | | | | | | |
| | | Year Ended
July 31, 2018 | | | Year Ended
July 31, 2017 | |
Distributions paid from: | | | | | | | | |
Ordinary income | | $ | 5,889,823 | | | $ | 5,201,750 | |
The aggregate cost of securities and other investments and the composition of unrealized appreciation and depreciation of securities and other investments for federal income tax purposes at period end are noted in the following table. The primary difference between book and tax appreciation or depreciation of securities and other investments, if applicable, is attributable to the tax deferral of losses or tax realization of financial statement unrealized gain or loss.
37 OPPENHEIMER CORPORATE BOND FUND
NOTES TO FINANCIAL STATEMENTS Continued
2. Significant Accounting Policies (Continued)
| | | | |
Federal tax cost of securities | | $ | 207,007,374 | |
Federal tax cost of other investments | | | (85,812,001) | |
| | | | |
Total federal tax cost | | $ | 121,195,373 | |
| | | | |
Gross unrealized appreciation | | $ | 1,535,942 | |
Gross unrealized depreciation | | | (5,192,698) | |
| | | | |
Net unrealized depreciation | | $ | (3,656,756) | |
| | | | |
Use of Estimates. The preparation of financial statements in conformity with U.S. GAAP requires management to make estimates and assumptions that affect the reported amounts of assets and liabilities and disclosure of contingent assets and liabilities at the date of the financial statements and the reported amounts of increases and decreases in net assets from operations during the reporting period. Actual results could differ from those estimates.
New Accounting Pronouncement. In March 2017, Financial Accounting Standards Board (“FASB”) issued Accounting Standards Update (“ASU”), ASU 2017-08. This provides guidance related to the amortization period for certain purchased callable debt securities held at a premium. The ASU is effective for annual periods beginning after December 15, 2018, and interim periods within those annual periods. The Manager is evaluating the impacts of these changes on the financial statements.
3. Securities Valuation
The Fund calculates the net asset value of its shares as of 4:00 P.M. Eastern Time, on each day the New York Stock Exchange (the “Exchange”) is open for trading, except in the case of a scheduled early closing of the Exchange, in which case the Fund will calculate net asset value of the shares as of the scheduled early closing time of the Exchange.
The Fund’s Board has adopted procedures for the valuation of the Fund’s securities and has delegated the day-to-day responsibility for valuation determinations under those procedures to the Manager. The Manager has established a Valuation Committee which is responsible for determining a fair valuation for any security for which market quotations are not readily available. The Valuation Committee’s fair valuation determinations are subject to review, approval and ratification by the Fund’s Board at least quarterly or more frequently, if necessary.
Valuation Methods and Inputs
Securities are valued primarily using unadjusted quoted market prices, when available, as supplied by third party pricing services or broker-dealers.
The following methodologies are used to determine the market value or the fair value of the types of securities described below:
Shares of a registered investment company that are not traded on an exchange are valued at that investment company’s net asset value per share.
Corporate and government debt securities (of U.S. or foreign issuers) and municipal debt
38 OPPENHEIMER CORPORATE BOND FUND
3. Securities Valuation (Continued)
securities, short-term notes, mortgage-backed securities, collateralized mortgage obligations, and asset-backed securities are valued at the mean between the bid and asked prices utilizing evaluated prices obtained from third party pricing services or broker-dealers who may use matrix pricing methods to determine the evaluated prices. Pricing services generally price debt securities assuming orderly transactions of an institutional “round lot” size, but some trades may occur in smaller, “odd lot” sizes, sometimes at lower prices than institutional round lot trades. Standard inputs generally considered by third-party pricing vendors include reported trade data, broker-dealer price quotations, benchmark yields, issuer spreads on comparable securities, the credit quality, yield, maturity, as well as other appropriate factors.
Futures contracts and futures options traded on a commodities or futures exchange will be valued at the final settlement price or official closing price on the principal exchange as reported by such principal exchange at its trading session ending at, or most recently prior to, the time when the Fund’s assets are valued.
Securities for which market quotations are not readily available, or when a significant event has occurred that would materially affect the value of the security, are fair valued either (i) by a standardized fair valuation methodology applicable to the security type or the significant event as previously approved by the Valuation Committee and the Fund’s Board or (ii) as determined in good faith by the Manager’s Valuation Committee. The Valuation Committee considers all relevant facts that are reasonably available, through either public information or information available to the Manager, when determining the fair value of a security. Those standardized fair valuation methodologies include, but are not limited to, valuing securities at the last sale price or initially at cost and subsequently adjusting the value based on: changes in company specific fundamentals, changes in an appropriate securities index, or changes in the value of similar securities which may be further adjusted for any discounts related to security-specific resale restrictions. When possible, such methodologies use observable market inputs such as unadjusted quoted prices of similar securities, observable interest rates, currency rates and yield curves. The methodologies used for valuing securities are not necessarily an indication of the risks associated with investing in those securities nor can it be assured that the Fund can obtain the fair value assigned to a security if it were to sell the security.
Classifications
Each investment asset or liability of the Fund is assigned a level at measurement date based on the significance and source of the inputs to its valuation. Various data inputs may be used in determining the value of each of the Fund’s investments as of the reporting period end.
These data inputs are categorized in the following hierarchy under applicable financial accounting standards:
1) Level 1-unadjusted quoted prices in active markets for identical assets or liabilities (including securities actively traded on a securities exchange)
2) Level 2-inputs other than unadjusted quoted prices that are observable for the asset or liability (such as unadjusted quoted prices for similar assets and market corroborated inputs such as interest rates, prepayment speeds, credit risks, etc.)
39 OPPENHEIMER CORPORATE BOND FUND
NOTES TO FINANCIAL STATEMENTS Continued
3. Securities Valuation (Continued)
3) Level 3-significant unobservable inputs (including the Manager’s own judgments about assumptions that market participants would use in pricing the asset or liability).
The inputs used for valuing securities are not necessarily an indication of the risks associated with investing in those securities.
The Fund classifies each of its investments in investment companies which are publicly offered as Level 1. Investment companies that are not publicly offered, if any, are classified as Level 2 in the fair value hierarchy.
The table below categorizes amounts that are included in the Fund’s Statement of Assets and Liabilities at period end based on valuation input level:
| | | | | | | | | | | | | | | | |
| | | Level 1—
Unadjusted
Quoted Prices | | | Level 2—
Other Significant
Observable Inputs | | | Level 3—
Significant
Unobservable
Inputs | | | Value | |
| |
Assets Table | | | | | | | | | | | | | | | | |
Investments, at Value: | | | | | | | | | | | | | | | | |
Mortgage-Backed Obligations | | $ | — | | | $ | 133,072 | | | $ | — | | | $ | 133,072 | |
Corporate Bonds and Notes | | | — | | | | 185,131,749 | | | | — | | | | 185,131,749 | |
Short-Term Notes | | | — | | | | 5,248,530 | | | | — | | | | 5,248,530 | |
Investment Companies | | | 12,837,266 | | | | — | | | | — | | | | 12,837,266 | |
| | | | |
Total Investments, at Value | | | 12,837,266 | | | | 190,513,351 | | | | — | | | | 203,350,617 | |
Other Financial Instruments: | | | | | | | | | | | | | | | | |
Futures contracts | | | 223,341 | | | | — | | | | — | | | | 223,341 | |
| | | | |
Total Assets | | $ | 13,060,607 | | | $ | 190,513,351 | | | $ | — | | | $ | 203,573,958 | |
| | | | |
| | | | |
Liabilities Table | | | | | | | | | | | | | | | | |
Other Financial Instruments: | | | | | | | | | | | | | | | | |
Futures contracts | | $ | (55,609 | ) | | $ | — | | | $ | — | | | $ | (55,609) | |
| | | | |
Total Liabilities | | $ | (55,609 | ) | | $ | — | | | $ | — | | | $ | (55,609) | |
| | | | |
Forward currency exchange contracts and futures contracts, if any, are reported at their unrealized appreciation/depreciation at measurement date, which represents the change in the contract’s value from trade date. All additional assets and liabilities included in the above table are reported at their market value at measurement date.
For the reporting period, there were no transfers between levels.
4. Investments and Risks
Investments in Affiliated Funds. The Fund is permitted to invest in other mutual funds advised by the Manager (“Affiliated Funds”). Affiliated Funds are open-end management investment companies registered under the 1940 Act, as amended. The Manager is the investment adviser of, and the Sub-Adviser provides investment and related advisory services to, the Affiliated Funds. When applicable, the Fund’s investments in Affiliated Funds are included in the Statement of Investments. Shares of Affiliated Funds are valued at their net asset value per share. As a shareholder, the Fund is subject to its proportional share of the
40 OPPENHEIMER CORPORATE BOND FUND
4. Investments and Risks (Continued)
Affiliated Funds’ expenses, including their management fee. The Manager will waive fees and/or reimburse Fund expenses in an amount equal to the indirect management fees incurred through the Fund’s investment in the Affiliated Funds.
Each of the Affiliated Funds in which the Fund invests has its own investment risks, and those risks can affect the value of the Fund’s investments and therefore the value of the Fund’s shares. To the extent that the Fund invests more of its assets in one Affiliated Fund than in another, the Fund will have greater exposure to the risks of that Affiliated Fund.
Investments in Money Market Instruments. The Fund is permitted to invest its free cash balances in money market instruments to provide liquidity or for defensive purposes. The Fund may invest in money market instruments by investing in Class E shares of Oppenheimer Institutional Government Money Market Fund (“IGMMF”), which is an Affiliated Fund. IGMMF is regulated as a money market fund under the 1940 Act, as amended. The Fund may also invest in money market instruments directly or in other affiliated or unaffiliated money market funds.
Securities on a When-Issued or Delayed Delivery Basis. The Fund may purchase securities on a “when-issued” basis, and may purchase or sell securities on a “delayed delivery” basis. “When-issued” or “delayed delivery” refers to securities whose terms and indenture are available and for which a market exists, but which are not available for immediate delivery. Delivery and payment for securities that have been purchased by the Fund on a when-issued basis normally takes place within six months and possibly as long as two years or more after the trade date. During this period, such securities do not earn interest, are subject to market fluctuation and may increase or decrease in value prior to their delivery. The purchase of securities on a when-issued basis may increase the volatility of the Fund’s net asset value to the extent the Fund executes such transactions while remaining substantially fully invested. When the Fund engages in when-issued or delayed delivery transactions, it relies on the buyer or seller, as the case may be, to complete the transaction. Their failure to do so may cause the Fund to lose the opportunity to obtain or dispose of the security at a price and yield it considers advantageous. The Fund may also sell securities that it purchased on a when-issued basis or forward commitment prior to settlement of the original purchase.
At period end, the Fund had purchased securities issued on a when-issued or delayed delivery basis as follows:
| | | | |
| | | When-Issued or
Delayed Delivery
Basis Transactions | |
Purchased securities | | | $ 633,100 | |
Restricted Securities. At period end, investments in securities included issues that are restricted. A restricted security may have a contractual restriction on its resale and is valued under methods approved by the Board of Trustees as reflecting fair value. Securities that are restricted are marked with an applicable footnote on the Statement of Investments. Restricted
41 OPPENHEIMER CORPORATE BOND FUND
NOTES TO FINANCIAL STATEMENTS Continued
4. Investments and Risks (Continued)
securities are reported on a schedule following the Statement of Investments.
5. Market Risk Factors
The Fund’s investments in securities and/or financial derivatives may expose the Fund to various market risk factors:
Commodity Risk. Commodity risk relates to the change in value of commodities or commodity indexes as they relate to increases or decreases in the commodities market. Commodities are physical assets that have tangible properties. Examples of these types of assets are crude oil, heating oil, metals, livestock, and agricultural products.
Credit Risk. Credit risk relates to the ability of the issuer of debt to meet interest and principal payments, or both, as they come due. In general, lower-grade, higher-yield debt securities are subject to credit risk to a greater extent than lower-yield, higher-quality securities.
Equity Risk. Equity risk relates to the change in value of equity securities as they relate to increases or decreases in the general market.
Foreign Exchange Rate Risk. Foreign exchange rate risk relates to the change in the U.S. dollar value of a security held that is denominated in a foreign currency. The U.S. dollar value of a foreign currency denominated security will decrease as the dollar appreciates against the currency, while the U.S. dollar value will increase as the dollar depreciates against the currency.
Interest Rate Risk. Interest rate risk refers to the fluctuations in value of fixed-income securities resulting from the inverse relationship between price and yield. For example, an increase in general interest rates will tend to reduce the market value of already issued fixed-income investments, and a decline in general interest rates will tend to increase their value. In addition, debt securities with longer maturities, which tend to have higher yields, are subject to potentially greater fluctuations in value from changes in interest rates than obligations with shorter maturities.
Volatility Risk. Volatility risk refers to the magnitude of the movement, but not the direction of the movement, in a financial instrument’s price over a defined time period. Large increases or decreases in a financial instrument’s price over a relative time period typically indicate greater volatility risk, while small increases or decreases in its price typically indicate lower volatility risk.
6. Use of Derivatives
The Fund’s investment objective not only permits the Fund to purchase investment securities, it also allows the Fund to enter into various types of derivatives contracts, including, but not limited to, futures contracts, forward currency exchange contracts, credit default swaps, interest rate swaps, total return swaps, variance swaps and purchased and written options. In doing so, the Fund will employ strategies in differing combinations to permit it to increase, decrease, or change the level or types of exposure to market risk factors. These instruments may allow the Fund to pursue its objectives more quickly and efficiently than if it were to
42 OPPENHEIMER CORPORATE BOND FUND
6. Use of Derivatives (Continued)
make direct purchases or sales of securities capable of effecting a similar response to market factors. Such contracts may be entered into through a bilateral over-the-counter (“OTC”) transaction, or through a securities or futures exchange and cleared through a clearinghouse.
Derivatives may have little or no initial cash investment relative to their market value exposure and therefore can produce significant gains or losses in excess of their cost due to changes in the market risk factors and the overall market. This use of embedded leverage allows the Fund to increase its market value exposure relative to its net assets and can substantially increase the volatility of the Fund’s performance. In instances where the Fund is using derivatives to decrease, or hedge, exposures to market risk factors for securities held by the Fund, there are also risks that those derivatives may not perform as expected resulting in losses for the combined or hedged positions. Some derivatives have the potential for unlimited loss, regardless of the size of the Fund’s initial investment.
Additional associated risks from investing in derivatives also exist and potentially could have significant effects on the valuation of the derivative and the Fund. Typically, the associated risks are not the risks that the Fund is attempting to increase or decrease exposure to, per its investment objectives, but are the additional risks from investing in derivatives. Examples of these associated risks are liquidity risk, which is the risk that the Fund will not be able to sell the derivative in the open market in a timely manner, and counterparty credit risk, which is the risk that the counterparty will not fulfill its obligation to the Fund.
The Fund’s actual exposures to these market risk factors and associated risks during the period are discussed in further detail, by derivative type, below.
Futures Contracts
A futures contract is a commitment to buy or sell a specific amount of a commodity, financial instrument or currency at a negotiated price on a stipulated future date. The Fund may buy and sell futures contracts and may also buy or write put or call options on these futures contracts. Futures contracts and options thereon are generally entered into on a regulated futures exchange and cleared through a clearinghouse associated with the exchange.
Upon entering into a futures contract, the Fund is required to deposit either cash or securities (initial margin) in an amount equal to a certain percentage of the contract value in an account registered in the futures commission merchant’s name. Subsequent payments (variation margin) are paid to or from the futures commission merchant each day equal to the daily changes in the contract value. Such payments are recorded as unrealized gains and losses. Should the Fund fail to make requested variation margin payments, the futures commission merchant can gain access to the initial margin to satisfy the Fund’s payment obligations.
Futures contracts are reported on a schedule following the Statement of Investments. Securities held by a futures commission merchant to cover initial margin requirements on open futures contracts are noted in the Statement of Investments. Cash held by a futures commission merchant to cover initial margin requirements on open futures contracts and the receivable and/or payable for the daily mark to market for the variation margin are noted in the Statement of Assets and Liabilities. The net change in unrealized appreciation and
43 OPPENHEIMER CORPORATE BOND FUND
NOTES TO FINANCIAL STATEMENTS Continued
6. Use of Derivatives (Continued)
depreciation is reported in the Statement of Operations. Realized gains (losses) are reported in the Statement of Operations at the closing or expiration of futures contracts.
The Fund may purchase and/or sell financial futures contracts and options on futures contracts to gain exposure to, or decrease exposure to interest rate risk, equity risk, foreign exchange rate risk, volatility risk, or commodity risk.
During the reporting period, the Fund had an ending monthly average market value of $47,897,404 and $57,161,872 on futures contracts purchased and sold, respectively.
Additional associated risks of entering into futures contracts (and related options) include the possibility that there may be an illiquid market where the Fund is unable to liquidate the contract or enter into an offsetting position and, if used for hedging purposes, the risk that the price of the contract will correlate imperfectly with the prices of the Fund’s securities.
Swap Contracts
The Fund may enter into swap contract agreements with a counterparty to exchange a series of cash flows based on either specified reference rates, the price or volatility of asset or non-asset references, or the occurrence of a credit event, over a specified period. Swaps can be executed in a bi-lateral privately negotiated arrangement with a dealer in an OTC transaction (“OTC swaps”) or executed on a regulated market. Certain swaps, regardless of the venue of their execution, are required to be cleared through a clearinghouse (“centrally cleared swaps”). Swap contracts may include interest rate, equity, debt, index, total return, credit default, currency, and volatility swaps.
Swap contracts are reported on a schedule following the Statement of Investments. The values of centrally cleared swap and OTC swap contracts are aggregated by positive and negative values and disclosed separately on the Statement of Assets and Liabilities. The unrealized appreciation (depreciation) related to the change in the valuation of the notional amount of the swap is combined with the accrued interest due to (owed by) the Fund, if any, at termination or settlement. The net change in this amount during the period is included on the Statement of Operations. The Fund also records any periodic payments received from (paid to) the counterparty, including at termination, under such contracts as realized gain (loss) on the Statement of Operations.
Swap contract agreements are exposed to the market risk factor of the specific underlying reference rate or asset. Swap contracts are typically more attractively priced compared to similar investments in related cash securities because they isolate the risk to one market risk factor and eliminate the other market risk factors. Investments in cash securities (for instance bonds) have exposure to multiple risk factors (credit and interest rate risk). Because swaps have embedded leverage, they can expose the Fund to substantial risk in the isolated market risk factor.
Credit Default Swap Contracts. A credit default swap is a contract that enables an investor to buy or sell protection against a defined-issuer credit event, such as the issuer’s failure to make timely payments of interest or principal on a debt security, bankruptcy or restructuring. The Fund may enter into credit default swaps either by buying or selling protection on a corporate issuer, sovereign issuer, or a basket or index of issuers (the
44 OPPENHEIMER CORPORATE BOND FUND
6. Use of Derivatives (Continued)
“reference asset”).
The buyer of protection pays a periodic fee to the seller of protection based on the notional amount of the swap contract. The seller of protection agrees to compensate the buyer of protection for future potential losses as a result of a credit event on the reference asset. The contract effectively transfers the credit event risk of the reference asset from the buyer of protection to the seller of protection.
The ongoing value of the contract will fluctuate throughout the term of the contract based primarily on the credit risk of the reference asset. If the credit quality of the reference asset improves relative to the credit quality at contract initiation, the buyer of protection may have an unrealized loss greater than the anticipated periodic fee owed. This unrealized loss would be the result of current credit protection being cheaper than the cost of credit protection at contract initiation. If the buyer elects to terminate the contract prior to its maturity, and there has been no credit event, this unrealized loss will become realized. If the contract is held to maturity, and there has been no credit event, the realized loss will be equal to the periodic fee paid over the life of the contract.
If there is a credit event, the buyer of protection can exercise its rights under the contract and receive a payment from the seller of protection equal to the notional amount of the swap less the market value of specified debt securities issued by the reference asset. Upon exercise of the contract the difference between such value and the notional amount is recorded as realized gain (loss) and is included on the Statement of Operations.
The Fund may purchase or sell credit protection through credit default swaps to increase or decrease exposure to the credit risk of individual issuers and/or indexes of issuers that are either unavailable or considered to be less attractive in the bond market.
For the reporting period, the Fund had ending monthly average notional amounts of $694,231 on credit default swaps to sell protection.
Additional associated risks to the Fund include counterparty credit risk and liquidity risk.
At period end, the Fund had no credit default swap agreements outstanding.
Swaption Transactions
The Fund may enter into a swaption contract which grants the purchaser the right, but not the obligation, to enter into a swap transaction at preset terms detailed in the underlying agreement within a specified period of time. The purchaser pays a premium to the swaption writer who bears the risk of unfavorable changes in the preset terms on the underlying swap.
Purchased swaptions are reported as a component of investments in the Statement of Investments and the Statement of Assets and Liabilities. Written swaptions are reported on a schedule following the Statement of Investments and their value is reported as a separate asset or liability line item in the Statement of Assets and Liabilities. The net change in unrealized appreciation or depreciation on written swaptions is separately reported in the Statement of Operations. When a swaption is exercised, the cost of the swap is adjusted by the amount of premium paid or received. Upon the expiration or closing of an unexercised swaption contract, a gain or loss is reported in the Statement of Operations for the amount of the premium paid or received.
45 OPPENHEIMER CORPORATE BOND FUND
NOTES TO FINANCIAL STATEMENTS Continued
6. Use of Derivatives (Continued)
The Fund generally will incur a greater risk when it writes a swaption than when it purchases a swaption. When the Fund writes a swaption it will become obligated, upon exercise of the swaption, according to the terms of the underlying agreement. Swaption contracts written by the Fund do not give rise to counterparty credit risk prior to exercise as they obligate the Fund, not its counterparty, to perform. When the Fund purchases a swaption it only risks losing the amount of the premium it paid if the swaption expires unexercised. However, when the Fund exercises a purchased swaption there is a risk that the counterparty will fail to perform or otherwise default on its obligations under the swaption contract.
The Fund may purchase swaptions which give it the option to buy or sell credit protection through credit default swaps in order to decrease or increase exposure to the credit risk of individual issuers and/ or indexes of issuers. A swaption selling protection becomes more valuable as the likelihood of a credit event on the reference asset decreases. A swaption buying protection becomes more valuable as the likelihood of a credit event on the reference asset increases.
At period end, the Fund had no purchased swaption contracts outstanding.
The Fund may write swaptions which give it the obligation, if exercised by the purchaser, to sell or buy credit protection through credit default swaps in order to increase or decrease exposure to the credit risk of individual issuers and/or indexes of issuers. A written swaption selling protection becomes more valuable as the likelihood of a credit event on the reference asset decreases. A written swaption buying protection becomes more valuable as the likelihood of a credit event on the reference asset increases.
During the reporting period, the Fund had an ending monthly average market value of $1,919 and $862 on purchased and written swaptions, respectively.
At period end, the Fund had no written swaption contracts outstanding.
Counterparty Credit Risk. Derivative positions are subject to the risk that the counterparty will not fulfill its obligation to the Fund. The Fund intends to enter into derivative transactions with counterparties that the Manager believes to be creditworthy at the time of the transaction.
For financial reporting purposes, the Fund does not offset derivative assets and derivative liabilities that are subject to netting arrangements in the Statement of Assets and Liabilities. Bankruptcy or insolvency laws of a particular jurisdiction may impose restrictions on or prohibitions against the right of offset in bankruptcy, insolvency or other events.
The Fund’s risk of loss from counterparty credit risk on exchange-traded derivatives cleared through a clearinghouse and for centrally cleared swaps is generally considered lower than as compared to OTC derivatives. However, counterparty credit risk exists with respect to initial and variation margin deposited/paid by the Fund that is held in futures commission merchant, broker and/or clearinghouse accounts for such exchange-traded derivatives and for centrally cleared swaps.
With respect to centrally cleared swaps, such transactions will be submitted for clearing, and if cleared, will be held in accounts at futures commission merchants or brokers that are members of clearinghouses. While brokers, futures commission merchants and clearinghouses
46 OPPENHEIMER CORPORATE BOND FUND
6. Use of Derivatives (Continued)
are required to segregate customer margin from their own assets, in the event that a broker, futures commission merchant or clearinghouse becomes insolvent or goes into bankruptcy and at that time there is a shortfall in the aggregate amount of margin held by the broker, futures commission merchant or clearinghouse for all its customers, U.S. bankruptcy laws will typically allocate that shortfall on a pro-rata basis across all the broker’s, futures commission merchant’s or clearinghouse’s customers, potentially resulting in losses to the Fund.
There is the risk that a broker, futures commission merchant or clearinghouse will decline to clear a transaction on the Fund’s behalf, and the Fund may be required to pay a termination fee to the executing broker with whom the Fund initially enters into the transaction.
Clearinghouses may also be permitted to terminate centrally cleared swaps at any time. The Fund is also subject to the risk that the broker or futures commission merchant will improperly use the Fund’s assets deposited/paid as initial or variation margin to satisfy payment obligations of another customer. In the event of a default by another customer of the broker or futures commission merchant, the Fund might not receive its variation margin payments from the clearinghouse, due to the manner in which variation margin payments are aggregated for all customers of the broker/futures commission merchant.
Collateral terms are contract specific for OTC derivatives. For derivatives traded under an ISDA master agreement, the collateral requirements are typically calculated by netting the mark to market amount for each transaction under such agreement and comparing that amount to the value of any collateral currently pledged by the Fund or the counterparty.
For financial reporting purposes, cash collateral that has been pledged to cover obligations of the Fund, if any, is reported separately on the Statement of Assets and Liabilities as cash pledged as collateral. Non-cash collateral pledged by the Fund, if any, is noted in the Statement of Investments. Generally, the amount of collateral due from or to a party must exceed a minimum transfer amount threshold (e.g. $250,000) before a transfer has to be made. To the extent amounts due to the Fund from its counterparties are not fully collateralized, contractually or otherwise, the Fund bears the risk of loss from counterparty nonperformance.
The following table presents the valuations of derivative instruments by risk exposure as reported within the Statement of Assets and Liabilities at period end:
| | | | | | | | | | | | | | | | |
| | | Asset Derivatives | | | | | | | | Liability Derivatives | | | |
Derivatives
Not Accounted
for as Hedging
Instruments | | Statement of Assets
and Liabilities Location | | Value | | | | | | Statement of Assets
and Liabilities Location | | Value | |
Interest rate contracts Variation margin receivable | | $ | 17,856* | | | | | | | Variation margin payable | | $ | 20,131* | |
*Includes only the current day’s variation margin. Prior variation margin movements have been reflected in cash on the Statement of Assets and Liabilities upon receipt or payment.
The effect of derivative instruments on the Statement of Operations is as follows:
47 OPPENHEIMER CORPORATE BOND FUND
NOTES TO FINANCIAL STATEMENTS Continued
6. Use of Derivatives (Continued)
| | | | | | | | | | | | | | | | | | | | |
| Amount of Realized Gain or (Loss) Recognized on Derivatives | |
Derivatives
Not Accounted
for as Hedging
Instruments | | Investment
transactions
in unaffiliated
companies* | | | Swaption
contracts
written | | | Futures
contracts | | | Swap contracts | | | Total | |
Credit contracts | | $ | (30,800) | | | $ | 14,608 | | | $ | — | | | $ | 67,361 | | | $ | 51,169 | |
Interest rate contracts | | | — | | | | — | | | | 470,054 | | | | — | | | | 470,054 | |
| | | | |
Total | | $ | (30,800) | | | $ | 14,608 | | | $ | 470,054 | | | $ | 67,361 | | | $ | 521,223 | |
| | | | |
*Includes purchased option contracts and purchased swaption contracts, if any.
| | | | | | | | | | | | |
| Amount of Change in Unrealized Gain or (Loss) Recognized on Derivatives | |
Derivatives
Not Accounted
for as Hedging
Instruments | | Futures
contracts | | | Swap contracts | | | Total | |
Credit contracts | | $ | — | | | $ | (149,670) | | | $ | (149,670) | |
Interest rate contracts | | | 156,157 | | | | — | | | | 156,157 | |
| | | | |
Total | | $ | 156,157 | | | $ | (149,670) | | | $ | 6,487 | |
| | | | |
7. Shares of Beneficial Interest
The Fund has authorized an unlimited number of $0.001 par value shares of beneficial interest of each class. Transactions in shares of beneficial interest were as follows:
| | | | | | | | | | | | | | | | |
| | | Year Ended July 31, 2018 | | | Year Ended July 31, 2017 | |
| | | Shares | | | Amount | | | Shares | | | Amount | |
Class A | | | | | | | | | | | | | | | | |
Sold | | | 3,081,751 | | | $ | 33,249,682 | | | | 3,899,900 | | | $ | 42,132,459 | |
Dividends and/or distributions reinvested | | | 347,885 | | | | 3,718,015 | | | | 332,862 | | | | 3,591,997 | |
Redeemed | | | (3,916,504 | ) | | | (41,779,794 | ) | | | (4,928,222 | ) | | | (53,118,962) | |
| | | | |
Net decrease | | | (486,868 | ) | | $ | (4,812,097 | ) | | | (695,460 | ) | | $ | (7,394,506) | |
| | | | |
| | |
Class C | | | | | | | | | | | | | | | | |
Sold | | | 761,628 | | | $ | 8,205,750 | | | | 889,600 | | | $ | 9,612,956 | |
Dividends and/or distributions reinvested | | | 65,858 | | | | 703,140 | | | | 66,488 | | | | 717,008 | |
Redeemed | | | (893,084 | ) | | | (9,546,214 | ) | | | (1,363,212 | ) | | | (14,591,958) | |
| | | | |
Net decrease | | | (65,598 | ) | | $ | (637,324) | | | | (407,124 | ) | | $ | (4,261,994) | |
| | | | |
| | |
Class I | | | | | | | | | | | | | | | | |
Sold | | | 682,796 | | | $ | 7,331,314 | | | | 201,133 | | | $ | 2,174,827 | |
Dividends and/or distributions reinvested | | | 17,497 | | | | 185,853 | | | | 1,708 | | | | 18,487 | |
Redeemed | | | (154,954 | ) | | | (1,644,164 | ) | | | (9,648 | ) | | | (104,497) | |
| | | | |
Net increase | | | 545,339 | | | $ | 5,873,003 | | | | 193,193 | | | $ | 2,088,817 | |
| | | | |
48 OPPENHEIMER CORPORATE BOND FUND
7. Shares of Beneficial Interest (Continued)
| | | | | | | | | | | | | | | | |
| | | Year Ended July 31, 2018 | | | Year Ended July 31, 2017 | |
| | | Shares | | | Amount | | | Shares | | | Amount | |
Class R | | | | | | | | | | | | | | | | |
Sold | | | 805,312 | | | $ | 8,642,719 | | | | 679,123 | | | $ | 7,327,631 | |
Dividends and/or distributions reinvested | | | 44,376 | | | | 473,617 | | | | 31,632 | | | | 341,444 | |
Redeemed | | | (391,867 | ) | | | (4,171,516 | ) | | | (371,868 | ) | | | (3,982,261) | |
| | | | |
Net increase | | | 457,821 | | | $ | 4,944,820 | | | | 338,887 | | | $ | 3,686,814 | |
| | | | |
| | | | | | | | | | | | | | | | | |
Class Y | | | | | | | | | | | | | | | | |
Sold | | | 2,173,981 | | | $ | 23,259,291 | | | | 1,592,243 | | | $ | 17,147,663 | |
Dividends and/or distributions reinvested | | | 70,154 | | | | 746,080 | | | | 36,025 | | | | 388,663 | |
Redeemed | | | (1,240,110 | ) | | | (13,182,903 | ) | | | (1,000,708 | ) | | | (10,747,219) | |
| | | | |
Net increase | | | 1,004,025 | | | $ | 10,822,468 | | | | 627,560 | | | $ | 6,789,107 | |
| | | | |
8. Purchases and Sales of Securities
The aggregate cost of purchases and proceeds from sales of securities, other than short-term obligations and investments in IGMMF, for the reporting period were as follows:
| | | | | | | | |
| | | Purchases | | | Sales | |
Investment securities | | $ | 127,542,071 | | | $ | 114,798,284 | |
9. Fees and Other Transactions with Affiliates
Management Fees. Under the investment advisory agreement, the Fund pays the Manager a management fee based on the daily net assets of the Fund at an annual rate as shown in the following table:
| | | | |
| Fee Schedule | | | |
Up to $500 million | | | 0.45 | % |
Next $500 million | | | 0.40 | |
Next $4 billion | | | 0.35 | |
Over $5 billion | | | 0.30 | |
The Fund’s effective management fee for the reporting period was 0.45% of average annual net assets before any applicable waivers.
Sub-Adviser Fees. The Manager has retained the Sub-Adviser to provide the day-to-day portfolio management of the Fund. Under the Sub-Advisory Agreement, the Manager pays the Sub-Adviser an annual fee in monthly installments, equal to a percentage of the investment management fee collected by the Manager from the Fund, which shall be calculated after any investment management fee waivers. The fee paid to the Sub-Adviser is paid by the Manager, not by the Fund.
Transfer Agent Fees. OFI Global (the “Transfer Agent”) serves as the transfer and shareholder servicing agent for the Fund. The Fund pays the Transfer Agent a fee based on annual net assets, which shall be calculated after any applicable fee waivers. Fees incurred and
49 OPPENHEIMER CORPORATE BOND FUND
NOTES TO FINANCIAL STATEMENTS Continued
9. Fees and Other Transactions with Affiliates (Continued)
average net assets for each class with respect to these services are detailed in the Statement of Operations and Financial Highlights, respectively.
Sub-Transfer Agent Fees. The Transfer Agent has retained Shareholder Services, Inc., a wholly-owned subsidiary of OFI (the “Sub-Transfer Agent”), to provide the day-to-day transfer agent and shareholder servicing of the Fund. Under the Sub-Transfer Agency Agreement, the Transfer Agent pays the Sub-Transfer Agent an annual fee in monthly installments, equal to a percentage of the transfer agent fee collected by the Transfer Agent from the Fund, which shall be calculated after any applicable fee waivers. The fee paid to the Sub-Transfer Agent is paid by the Transfer Agent, not by the Fund.
Trustees’ Compensation. The Fund’s Board of Trustees (“Board”) has adopted a compensation deferral plan for Independent Trustees that enables Trustees to elect to defer receipt of all or a portion of the annual compensation they are entitled to receive from the Fund. For purposes of determining the amount owed to the Trustees under the plan, deferred amounts are treated as though equal dollar amounts had been invested in shares of the Fund or in other Oppenheimer funds selected by the Trustees. The Fund purchases shares of the funds selected for deferral by the Trustees in amounts equal to his or her deemed investment, resulting in a Fund asset equal to the deferred compensation liability. Such assets are included as a component of “Other” within the asset section of the Statement of Assets and Liabilities. Deferral of Trustees’ fees under the plan will not affect the net assets of the Fund and will not materially affect the Fund’s assets, liabilities or net investment income per share. Amounts will be deferred until distributed in accordance with the compensation deferral plan.
Distribution and Service Plan (12b-1) Fees. Under its General Distributor’s Agreement with the Fund, OppenheimerFunds Distributor, Inc. (the “Distributor”) acts as the Fund’s principal underwriter in the continuous public offering of the Fund’s classes of shares.
Service Plan for Class A Shares. The Fund has adopted a Service Plan (the “Plan”) for Class A shares pursuant to Rule 12b-1 under the 1940 Act. Under the Plan, the Fund reimburses the Distributor for a portion of its costs incurred for services provided to accounts that hold Class A shares. Reimbursement is made periodically at an annual rate of up to 0.25% of the daily net assets of Class A shares of the Fund. The Distributor currently uses all of those fees to pay dealers, brokers, banks and other financial institutions periodically for providing personal service and maintenance of accounts of their customers that hold Class A shares. Any unreimbursed expenses the Distributor incurs with respect to Class A shares in any fiscal year cannot be recovered in subsequent periods. Fees incurred by the Fund under the Plan are detailed in the Statement of Operations.
Distribution and Service Plans for Class C and Class R Shares. The Fund has adopted Distribution and Service Plans (the “Plans”) for Class C and Class R shares pursuant to Rule 12b-1 under the 1940 Act to compensate the Distributor for distributing those share classes,
50 OPPENHEIMER CORPORATE BOND FUND
9. Fees and Other Transactions with Affiliates (Continued)
maintaining accounts and providing shareholder services. Under the Plans, the Fund pays the Distributor an annual asset-based sales charge of 0.75% on Class C shares’ daily net assets and 0.25% on Class R shares’ daily net assets. The Fund also pays a service fee under the Plans at an annual rate of 0.25% of daily net assets. The Plans continue in effect from year to year only if the Fund’s Board of Trustees votes annually to approve their continuance at an in person meeting called for that purpose. Fees incurred by the Fund under the Plans are detailed in the Statement of Operations.
Sales Charges. Front-end sales charges and CDSC do not represent expenses of the Fund. They are deducted from the proceeds of sales of Fund shares prior to investment or from redemption proceeds prior to remittance, as applicable. The sales charges retained by the Distributor from the sale of shares and the CDSC retained by the Distributor on the redemption of shares is shown in the following table for the period indicated.
| | | | | | | | | | | | | | | | |
| Year Ended | | Class A
Front-End
Sales Charges
Retained by
Distributor | | | Class A
Contingent
Deferred
Sales Charges
Retained by
Distributor | | | Class C
Contingent
Deferred
Sales Charges
Retained by
Distributor | | | Class R
Contingent
Deferred
Sales Charges
Retained by
Distributor | |
| |
| July 31, 2018 | | | $59,597 | | | | $441 | | | | $6,231 | | | | $— | |
Waivers and Reimbursements of Expenses. Effective for the period January 1, 2017 through December 31, 2017, the Transfer Agent voluntarily waived and/or reimbursed Fund expenses in an amount equal to 0.015% of average annual net assets for Classes A, C, R and Y.
During the reporting period, the Transfer Agent waived fees and/or reimbursed the Fund for transfer agent and shareholder servicing agent fees as follows:
| | | | |
Class A | | $ | 8,375 | |
Class C | | | 2,118 | |
Class R | | | 1,054 | |
Class Y | | | 1,212 | |
The Manager will waive fees and/or reimburse Fund expenses in an amount equal to the indirect management fees incurred through the Fund’s investments in Affiliated Funds. During the reporting period, the Manager waived fees and/or reimbursed the Fund $34,622 for these management fees. This fee waiver and/or expense reimbursement may not be amended or withdrawn for one year from the date of the Fund’s prospectus, unless approved by the Board.
10. Borrowings and Other Financing
Joint Credit Facility. A number of mutual funds managed by the Manager participate in a $1.95 billion revolving credit facility (the “Facility”) intended to provide short-term financing, if necessary, subject to certain restrictions in connection with atypical redemption activity.
51 OPPENHEIMER CORPORATE BOND FUND
NOTES TO FINANCIAL STATEMENTS Continued
10. Borrowings and Other Financing (Continued)
Expenses and fees related to the Facility are paid by the participating funds and are disclosed separately or as other expenses on the Statement of Operations. The Fund did not utilize the Facility during the reporting period.
52 OPPENHEIMER CORPORATE BOND FUND
REPORT OF INDEPENDENT REGISTERED PUBLIC ACCOUNTING FIRM
To the Shareholders and Board of Trustees
Oppenheimer Corporate Bond Fund:
Opinion on the Financial Statements
We have audited the accompanying statement of assets and liabilities of Oppenheimer Corporate Bond Fund (the “Fund”), including the statement of investments, as of July 31, 2018, the related statement of operations for the year then ended, the statements of changes in net assets for each of the years in the two year period then ended, and the related notes (collectively, the “financial statements”) and the financial highlights for each of the years in the five year period then ended. In our opinion, the financial statements and financial highlights present fairly, in all material respects, the financial position of the Fund as of July 31, 2018, the results of its operations for the year then ended, the changes in its net assets for each of the years in the two year period then ended, and the financial highlights for each of the years in the five year period then ended, in conformity with U.S. generally accepted accounting principles.
Basis for Opinion
These financial statements and financial highlights are the responsibility of the Fund’s management. Our responsibility is to express an opinion on these financial statements and financial highlights based on our audits. We are a public accounting firm registered with the Public Company Accounting Oversight Board (United States) (“PCAOB”) and are required to be independent with respect to the Fund in accordance with the U.S. federal securities laws and the applicable rules and regulations of the Securities and Exchange Commission and the PCAOB.
We conducted our audits in accordance with the standards of the PCAOB. Those standards require that we plan and perform the audit to obtain reasonable assurance about whether the financial statements and financial highlights are free of material misstatement, whether due to error or fraud. Our audits included performing procedures to assess the risks of material misstatement of the financial statements and financial highlights, whether due to error or fraud, and performing procedures that respond to those risks. Such procedures included examining, on a test basis, evidence regarding the amounts and disclosures in the financial statements and financial highlights. Such procedures also included confirmation of securities owned as of July 31, 2018, by correspondence with the custodian, brokers and the transfer agent, or by other appropriate auditing procedures. Our audits also included evaluating the accounting principles used and significant estimates made by management, as well as evaluating the overall presentation of the financial statements and financial highlights. We believe that our audits provide a reasonable basis for our opinion.
KPMGLLP
We have not been able to determine the specific year that we began serving as the auditor of one or more Oppenheimer Funds investment companies, however we are aware that we have served as the auditor of one or more Oppenheimer Funds investment companies since at least 1969.
Denver, Colorado
September 26, 2018
53 OPPENHEIMER CORPORATE BOND FUND
FEDERAL INCOME TAX INFORMATION Unaudited
In early 2018, if applicable, shareholders of record received information regarding all dividends and distributions paid to them by the Fund during calendar year 2017.
None of the dividends paid by the Fund during the reporting period are eligible for the corporate dividend-received deduction.
Dividends, if any, paid by the Fund during the reporting period which are not designated as capital gain distributions, may be eligible for lower individual income tax rates to the extent that the Fund has received qualified dividend income as stipulated by recent tax legislation. In early 2018, shareholders of record received information regarding the percentage of distributions that are eligible for lower individual income tax rates. The amount will be the maximum amount allowed.
Recent tax legislation allows a regulated investment company to designate distributions not designated as capital gain distributions, as either interest related dividends or short-term capital gain dividends, both of which are exempt from the U.S. withholding tax applicable to non U.S. taxpayers. For the reporting period, the maximum amount allowable but not less than $4,774,786 of the ordinary distributions to be paid by the Fund qualifies as an interest related dividend.
The foregoing information is presented to assist shareholders in reporting distributions received from the Fund to the Internal Revenue Service. Because of the complexity of the federal regulations which may affect your individual tax return and the many variations in state and local tax regulations, we recommend that you consult your tax advisor for specific guidance.
54 OPPENHEIMER CORPORATE BOND FUND
PORTFOLIO PROXY VOTING POLICIES AND GUIDELINES;
UPDATES TO STATEMENT OF INVESTMENTS Unaudited
The Fund has adopted Portfolio Proxy Voting Policies and Guidelines under which the Fund votes proxies relating to securities (“portfolio proxies”) held by the Fund. A description of the Fund’s Portfolio Proxy Voting Policies and Guidelines is available (i) without charge, upon request, by calling the Fund toll-free at 1.800.CALL OPP (225.5677), (ii) on the Fund’s website at www.oppenheimerfunds.com, and (iii) on the SEC’s website at www.sec.gov. In addition, the Fund is required to file Form N-PX, with its complete proxy voting record for the 12 months ended June 30th, no later than August 31st of each year. The Fund’s voting record is available (i) without charge, upon request, by calling the Fund toll-free at 1.800.CALL OPP (225.5677), and (ii) in the Form N-PX filing on the SEC’s website at www.sec.gov.
The Fund files its complete schedule of portfolio holdings with the SEC for the first quarter and the third quarter of each fiscal year on Form N-Q. The Fund’s Form N-Q filings are available on the SEC’s website at www.sec.gov. Those forms may be reviewed and copied at the SEC’s Public Reference Room in Washington, D.C. Information on the operation of the Public Reference Room may be obtained by calling 1-800-SEC-0330.
Householding—Delivery of Shareholder Documents
This is to inform you about OppenheimerFunds’ “householding” policy. If more than one member of your household maintains an account in a particular fund, OppenheimerFunds will mail only one copy of the fund’s prospectus (or, if available, the fund’s summary prospectus), annual and semiannual report and privacy policy. The consolidation of these mailings, called householding, benefits your fund through reduced mailing expense, and benefits you by reducing the volume of mail you receive from OppenheimerFunds. Householding does not affect the delivery of your account statements.
Please note that we will continue to household these mailings for as long as you remain an OppenheimerFunds shareholder, unless you request otherwise. If you prefer to receive multiple copies of these materials, please call us at 1.800.CALL-OPP (225-5677). You may also notify us in writing or via email. We will begin sending you individual copies of the prospectus (or, if available, the summary prospectus), reports and privacy policy within 30 days of receiving your request to stop householding.
55 OPPENHEIMER CORPORATE BOND FUND
TRUSTEES AND OFFICERS Unaudited
| | |
| Name, Position(s) Held with the Fund, Length of Service, Year of Birth | | Principal Occupation(s) During the Past 5 Years; Other Trusteeships/ Directorships Held. |
| |
| INDEPENDENT TRUSTEES | | The address of each Trustee in the chart below is 6803 S. Tucson Way, Centennial, Colorado 80112-3924. Each Trustee serves for an indefinite term, or until his or her resignation, retirement, death or removal. Each of the Trustees in the chart below oversees 56 portfolios in the OppenheimerFunds complex |
| |
Robert J. Malone, Chairman of the Board of Trustees (since 2016) and Trustee (since 2010) Year of Birth: 1944 | | Chairman - Colorado Market of MidFirst Bank (since January 2015); Chairman of the Board (2012-2016) and Director (August 2005-January 2016) of Jones International University (educational organization); Trustee of the Gallagher Family Foundation (non-profit organization) (2000-2016); Chairman, Chief Executive Officer and Director of Steele Street Bank Trust (commercial banking) (August 2003-January 2015); Director of Opera Colorado Foundation (non-profit organization) (2008-2012); Director of Colorado UpLIFT (charitable organization) (1986-2010); Director of Jones Knowledge, Inc. (2006-2010); Former Chairman of U.S. Bank-Colorado (subsidiary of U.S. Bancorp and formerly Colorado National Bank) (July 1996-April 1999); Director of Commercial Assets, Inc. (real estate investment trust) (1993-2000); Director of U.S. Exploration, Inc. (oil and gas exploration) (1997-February 2004); Chairman of the Board (1991-1994) and Trustee (1985-1994) of Regis University; and Chairman of the Board (1990-1991) and Member (1984-1999) of Young Presidents Organization. Mr. Malone has served on the Boards of certain Oppenheimer funds since 2002, during which time he has become familiar with the Fund’s (and other Oppenheimer funds’) financial, accounting, regulatory and investment matters and has contributed to the Board’s deliberations. |
| |
Andrew J. Donohue, Trustee (since 2017) Year of Birth: 1950 | | Director, Mutual Fund Directors Forum (since February 2018); Of Counsel, Shearman & Sterling LLP (since September 2017); Chief of Staff of the U.S. Securities and Exchange Commission (regulator) (June 2015-February 2017); Managing Director and Investment Company General Counsel of Goldman Sachs (investment bank) (November 2012-May 2015); Partner at Morgan Lewis & Bockius, LLP (law firm) (March 2011-October 2012); Director of the Division of Investment Management of U.S. Securities and Exchange Commission (regulator) (May 2006-November 2010); Global General Counsel of Merrill Lynch Investment Managers (investment firm) (May 2003-May 2006); General Counsel (October 1991-November 2001) and Executive Vice President (January 1993-November 2001) of OppenheimerFunds, Inc. (investment firm) (June 1991-November 2001). Mr. Donohue has served on the Boards of certain Oppenheimer funds since 2017, during which time he has become familiar with the Fund’s (and other Oppenheimer funds’) financial, accounting, regulatory and investment matters and has contributed to the Board’s deliberations. |
| |
Richard F. Grabish, Trustee (since 2010) Year of Birth: 1948 | | Formerly Senior Vice President and Assistant Director of Sales and Marketing (March 1997-December 2007), Director (March 1987-December 2007) and Manager of Private Client Services (June 1985-June 2005) of A.G. Edwards & Sons, Inc. (broker/dealer and investment firm); Chairman and Chief Executive Officer of A.G. Edwards Trust Company, FSB (March 2001-December 2007); President and Vice Chairman of A.G. Edwards Trust Company, FSB (investment adviser) (April 1987-March 2001); President of A.G. Edwards Trust Company, FSB (investment adviser) (June 2005-December 2007). Mr. Grabish has served on the Boards of certain Oppenheimer funds since 2001, during which time he has become familiar with the Fund’s (and other Oppenheimer funds’) financial, accounting, regulatory and investment matters and has contributed to the Boards’ deliberations. |
56 OPPENHEIMER CORPORATE BOND FUND
| | |
| |
Beverly L. Hamilton, Trustee (since 2010) Year of Birth: 1946 | | Trustee of Monterey Institute for International Studies (educational organization) (2000-2014); Board Member of Middlebury College (educational organization) (December 2005-June 2011); Director of the Board (1991-2016), Vice Chairman of the Board (2006-2009) and Chairman of the Board (2010-2013) of American Funds’ Emerging Markets Growth Fund, Inc. (mutual fund); Director of The California Endowment (philanthropic organization) (April 2002-April 2008); Director (February 2002-2005) and Chairman of Trustees (2006-2007) of the Community Hospital of Monterey Peninsula; President of ARCO Investment Management Company (February 1991-April 2000); Member of the investment committees of The Rockefeller Foundation (2001-2006) and The University of Michigan (since 2000); Advisor at Credit Suisse First Boston’s Sprout venture capital unit (venture capital fund) (1994-January 2005); Trustee of MassMutual Institutional Funds (investment company) (1996-June 2004); Trustee of MML Series Investment Fund (investment company) (April 1989-June 2004); Member of the investment committee of Hartford Hospital (2000-2003); and Advisor to Unilever (Holland) pension fund (2000-2003). Ms. Hamilton has served on the Boards of certain Oppenheimer funds since 2002, during which time she has become familiar with the Fund’s (and other Oppenheimer funds’) financial, accounting, regulatory and investment matters and has contributed to the Boards’ deliberations. |
| |
Victoria J. Herget, Trustee (since 2012) Year of Birth:1951 | | Board Chair (2008-2015) and Director (2004-Present) of United Educators (insurance company); Trustee (since 2000) and Chair (2010-2017) of Newberry Library (independent research library); Trustee, Mather LifeWays (senior living organization) (since 2001); Independent Director of the First American Funds (mutual fund family) (2003-2011); former Managing Director (1993-2001), Principal (1985-1993), Vice President (1978-1985) and Assistant Vice President (1973-1978) of Zurich Scudder Investments (investment adviser) (and its predecessor firms); Trustee (1992-2007), Chair of the Board of Trustees (1999- 2007), Investment Committee Chair (1994-1999) and Investment Committee member (2007-2010) of Wellesley College; Trustee, BoardSource (non-profit organization) (2006-2009) and Chicago City Day School (K-8 School) (1994- 2005). Ms. Herget has served on the Boards of certain Oppenheimer funds since 2012, during which time she has become familiar with the Fund’s (and other Oppenheimer funds’) financial, accounting, regulatory and investment matters and has contributed to the Boards’ deliberations- |
| |
Karen L. Stuckey, Trustee (since 2012) Year of Birth: 1953 | | Member (since May 2015) of Desert Mountain Community Foundation Advisory Board (non-profit organization); Partner (1990-2012) of PricewaterhouseCoopers LLP (professional services firm) (held various positions 1975-1990); Trustee (1992-2006); member of Executive, Nominating and Audit Committees and Chair of Finance Committee (1992-2006), and Emeritus Trustee (since 2006) of Lehigh University; member, Women’s Investment Management Forum (professional organization) (since inception) and Trustee of Jennies School for Little Children (non-profit) (2011-2014). Ms. Stuckey has served on the Boards of certain Oppenheimer funds since 2012, during which time she has become familiar with the Fund’s (and other Oppenheimer funds’) financial, accounting, regulatory and investment matters and has contributed to the Boards’ deliberations. |
57 OPPENHEIMER CORPORATE BOND FUND
TRUSTEES AND OFFICERS Unaudited / Continued
| | |
| |
James D. Vaughn, Trustee (since 2012) Year of Birth:1945 | | Retired; former managing partner (1994-2001) of Denver office of Deloitte & Touche LLP, (held various positions in Denver and New York offices from 1969- 1993); Trustee and Chairman of the Audit Committee of Schroder Funds (2003- 2012); Board member and Chairman of Audit Committee of AMG National Trust Bank (since 2005); Trustee and Investment Committee member, University of South Dakota Foundation (since 1996); Board member, Audit Committee Member and past Board Chair, Junior Achievement (since 1993); former Board member, Mile High United Way, Boys and Girls Clubs, Boy Scouts, Colorado Business Committee for the Arts, Economic Club of Colorado and Metro Denver Network. Mr. Vaughn has served on the Boards of certain Oppenheimer funds since 2012, during which time he has become familiar with the Fund’s (and other Oppenheimer funds’) financial, accounting, regulatory and investment matters and has contributed to the Boards’ deliberations. |
| | |
| |
| INTERESTED TRUSTEE AND OFFICER | | Mr. Steinmetz is an “Interested Trustee” because he is affiliated with the Manager and the Sub-Adviser by virtue of his positions as Chairman of the Sub-Adviser and officer and director of the Manager. Both as a Trustee and as an officer, Mr. Steinmetz serves for an indefinite term, or until his resignation, retirement, death or removal. Mr. Steinmetz’s address is 225 Liberty Street, New York, New York 10281-1008. Mr. Steinmetz is an officer of 104 portfolios in the OppenheimerFunds complex. |
| |
Arthur P. Steinmetz, Trustee (since 2015), President and Principal Executive Officer (since 2014) Year of Birth: 1958 | | Chairman of OppenheimerFunds, Inc. (since January 2015); CEO and Chairman of OFI Global Asset Management, Inc. (since July 2014), President of OFI Global Asset Management, Inc. (since May 2013), a Director of OFI Global Asset Management, Inc. (since January 2013), Director of OppenheimerFunds, Inc. (since July 2014), President, Management Director and CEO of Oppenheimer Acquisition Corp. (OppenheimerFunds, Inc.‘s parent holding company) (since July 2014), and President and Director of OFI SteelPath, Inc. (since January 2013). Chief Investment Officer of the OppenheimerFunds advisory entities from (January 2013-December 2013); Executive Vice President of OFI Global Asset Management, Inc. (January 2013-May 2013); Chief Investment Officer of OppenheimerFunds, Inc. (October 2010-December 2012); Chief Investment Officer, Fixed-Income, of OppenheimerFunds, Inc. (April 2009-October 2010); Executive Vice President of OppenheimerFunds, Inc. (October 2009-December 2012); Director of Fixed Income of OppenheimerFunds, Inc. (January 2009-April 2009); and a Senior Vice President of OppenheimerFunds, Inc. (March 1993-September 2009). |
| | |
| OTHER OFFICERS OF THE FUND | | The addresses of the Officers in the chart below are as follows: for Mr. Memani, Mss. Lo Bessette, Foxson and Picciotto, 225 Liberty Street, New York, New York 10281-1008, for Mr. Petersen 6803 S. Tucson Way, Centennial, Colorado 80112-3924. Each Officer serves for an indefinite term or until his or her resignation, retirement, death or removal. |
| |
Krishna Memani, Vice President (since 2010) Year of Birth: 1960 | | President of the Sub-Adviser (since January 2013); Executive Vice President of the Manager (since January 2014) and Chief Investment Officer of the OppenheimerFunds advisory entities (since January 2014). Chief Investment Officer, Fixed Income of the Sub-Adviser (January 2013-December 2013); Head of the Investment Grade Fixed Income Team of the Sub-Adviser (March 2009-January 2014); Director of Fixed Income of the Sub-Adviser (October 2010-December 2012); Senior Vice President of the Sub-Adviser (March 2009-December 2012) and Senior Vice President of OFI Global Institutional, Inc. (April 2009-December 2012). Managing Director and Head of the U.S. and European Credit Analyst Team at Deutsche Bank Securities (June 2006-January 2009). Chief Credit Strategist at Credit Suisse Securities (August 2002-March 2006). Managing Director and Senior Portfolio Manager at Putnam Investments (September 1998-June 2002). |
58 OPPENHEIMER CORPORATE BOND FUND
| | |
Cynthia Lo Bessette, Secretary and Chief Legal Officer (since 2016) Year of Birth: 1969 | | Executive Vice President, General Counsel and Secretary of OFI Global Asset Management, Inc. (since February 2016); Senior Vice President and Deputy General Counsel of OFI Global Asset Management, Inc. (March 2015-February 2016); Chief Legal Officer of OppenheimerFunds, Inc. and OppenheimerFunds Distributor, Inc. (since February 2016); Vice President, General Counsel and Secretary of Oppenheimer Acquisition Corp. (since February 2016); General Counsel of OFI SteelPath, Inc., OFI Advisors, LLC and Index Management Solutions, LLC (since February 2016); Chief Legal Officer of OFI Global Institutional, Inc., HarbourView Asset Management Corporation, OFI Global Trust Company, Oppenheimer Real Asset Management, Inc., OFI Private Investments Inc., Shareholder Services, Inc. and Trinity Investment Management Corporation (since February 2016); Corporate Counsel (February 2012-March 2015) and Deputy Chief Legal Officer (April 2013-March 2015) of Jennison Associates LLC; Assistant General Counsel (April 2008-September 2009) and Deputy General Counsel (October 2009-February 2012) of Lord Abbett & Co. LLC. |
| |
Jennifer Foxson, Vice President and Chief Business Officer (since 2014) Year of Birth: 1969 | | Senior Vice President of OppenheimerFunds Distributor, Inc. (since June 2014); Vice President of OppenheimerFunds Distributor, Inc. (April 2006-June 2014); Vice President of OppenheimerFunds, Inc. (January 1998-March 2006); Assistant Vice President of OppenheimerFunds, Inc. (October 1991-December 1998). |
| |
Mary Ann Picciotto, Chief Compliance Officer and Chief Anti-Money Laundering Officer (since 2014) Year of Birth: 1973 | | Senior Vice President and Chief Compliance Officer of OFI Global Asset Management, Inc. (since March 2014); Chief Compliance Officer of OppenheimerFunds, Inc., OFI SteelPath, Inc., OFI Global Institutional, Inc., Oppenheimer Real Asset Management, Inc., OFI Private Investments Inc., Harborview Asset Management Corporation, Trinity Investment Management Corporation, and Shareholder Services, Inc. (since March 2014); Managing Director of Morgan Stanley Investment Management Inc. and certain of its various affiliated entities; Chief Compliance Officer of various Morgan Stanley Funds (May 2010-January 2014); Chief Compliance Officer of Morgan Stanley Investment Management Inc. (April 2007-January 2014). |
| |
Brian S. Petersen, Treasurer and Principal Financial & Accounting Officer (since 2016) Year of Birth: 1970 | | Senior Vice President of OFI Global Asset Management, Inc. (since January 2017); Vice President of OFI Global Asset Management, Inc. (January 2013-January 2017); Vice President of OppenheimerFunds, Inc. (February 2007-December 2012); Assistant Vice President of OppenheimerFunds, Inc. (August 2002-2007). |
The Fund’s Statement of Additional Information contains additional information about the Fund’s Trustees and Officers and is available without charge upon request by calling 1.800.CALL OPP (225.5677).
59 OPPENHEIMER CORPORATE BOND FUND
OPPENHEIMER CORPORATE BOND FUND
| | |
| Manager | | OFI Global Asset Management, Inc. |
| |
| Sub-Adviser | | OppenheimerFunds, Inc. |
| |
| Distributor | | OppenheimerFunds Distributor, Inc. |
| |
| Transfer and Shareholder Servicing Agent | | OFI Global Asset Management, Inc. |
| |
| Sub-Transfer Agent | | Shareholder Services, Inc. DBA OppenheimerFunds Services |
| |
| Independent Registered Public Accounting Firm | | KPMG LLP |
| |
| Legal Counsel | | Ropes & Gray LLP |
© 2018 OppenheimerFunds, Inc. All rights reserved.
60 OPPENHEIMER CORPORATE BOND FUND
PRIVACY NOTICE
As an Oppenheimer fund shareholder, you are entitled to know how we protect your personal information and how we limit its disclosure.
Information Sources
We obtain non-public personal information about our shareholders from the following sources:
| ● | | Applications or other forms. |
| ● | | When you create a user ID and password for online account access. |
| ● | | When you enroll in eDocs Direct,SM our electronic document delivery service. |
| ● | | Your transactions with us, our affiliates or others. |
| ● | | Technologies on our website, including: “cookies” and web beacons, which are used to collect data on the pages you visit and the features you use. |
If you visit oppenheimerfunds.com and do not log on to the secure account information areas, we do not obtain any personal information about you. When you do log on to a secure area, we do obtain your user ID and password to identify you. We also use this information to provide you with products and services you have requested, to inform you about products and services that you may be interested in and assist you in other ways.
We do not collect personal information through our website unless you willingly provide it to us, either directly by email or in those areas of the website that request information. In order to update your personal information (including your mailing address, email address and phone number) you must first log on and visit your user profile.
If you have set your browser to warn you before accepting cookies, you will receive the warning message with each cookie. You can refuse cookies by turning them off in your browser. However, doing so may limit your access to certain sections of our website.
We use cookies to help us improve and manage our website. For example, cookies help us recognize new versus repeat visitors to the site, track the pages visited, and enable some special features on the website. This data helps us provide better service for our website visitors.
Protection of Information
We do not disclose any non-public personal information (such as names on a customer list) about current or former customers to anyone, except as permitted by law.
Disclosure of Information
Copies of confirmations, account statements and other documents reporting activity in your fund accounts are made available to your financial advisor (as designated by you). We may also use details about you and your investments to help us, our financial service affiliates, or firms that jointly market their financial products and services with ours, to better serve your investment needs or suggest educational material that may be of interest to you. If this requires us to provide you with an opportunity to “opt in” or “opt out” of such information sharing with a firm not affiliated with us, you will receive notification on how to do so, before any such sharing takes place.
Right of Refusal
We will not disclose your personal information to unaffiliated third parties (except as permitted by law), unless we first offer you a reasonable opportunity to refuse or “opt out” of such disclosure.
61 OPPENHEIMER CORPORATE BOND FUND
PRIVACY NOTICE Continued
Internet Security and Encryption
In general, the email services provided by our website are encrypted and provide a secure and private means of communication with us. To protect your own privacy, confidential and/ or personal information should only be communicated via email when you are advised that you are using a secure website.
As a security measure, we do not include personal or account information in non-secure emails, and we advise you not to send such information to us in non-secure emails. Instead, you may take advantage of the secure features of our website to encrypt your email correspondence. To do this, you will need to use a browser that supports Secure Sockets Layer (SSL) protocol.
| ● | | All transactions conducted via our websites, including redemptions, exchanges and purchases, are secured by the highest encryption standards available. SSL is used to establish a secure connection between your PC and OppenheimerFunds’ server. It transmits information in an encrypted and scrambled format. |
| ● | | Encryption is achieved through an electronic scrambling technology that uses a “key” to code and then decode the data. Encryption acts like the cable converter box you may have on your television set. It scrambles data with a secret code so that no one can make sense of it while it is being transmitted. When the data reaches its destination, the same software unscrambles the data. |
| ● | | You can exit the secure area by closing your browser or, for added security, you can use the Log Out button before you close your browser. |
Other Security Measures
We maintain physical, electronic and procedural safeguards to protect your personal account information. Our employees and agents have access to that information only so that they may offer you products or provide services, for example, when responding to your account questions.
How You Can Help
You can also do your part to keep your account information private and to prevent unauthorized transactions. If you obtain a user ID and password for your account, safeguard that information. Strengthening your online credentials–your online security profile–typically your user name, password, and security questions and answers, can be one of your most important lines of defense on the Internet. For additional information on how you can help prevent identity theft, visit https://www. oppenheimerfunds.com/security.
Who We Are
This joint notice describes the privacy policies of the Oppenheimer funds, OppenheimerFunds, Inc., each of its investment adviser subsidiaries, OppenheimerFunds Distributor, Inc. and OFI Global Trust Co. It applies to all Oppenheimer fund accounts you presently have, or may open in the future, using your Social Security number—whether or not you remain a shareholder of our funds. This notice was last updated as of November 2017. In the event it is updated or changed, we will post an updated notice on our website at oppenheimerfunds.com. If you have any questions about this privacy policy, email us by clicking on the Contact Us section of our website at oppenheimerfunds.com, write to us at P.O. Box 5270, Denver, CO 80217-5270, or call us at 800 CALL OPP (225 5677).
62 OPPENHEIMER CORPORATE BOND FUND
THIS PAGE INTENTIONALLY LEFT BLANK.
63 OPPENHEIMER CORPORATE BOND FUND
| | | | |
| | 
Oppenheimer funds® The Right Way to Invest | | |
| | Visit us at oppenheimerfunds.com for 24-hr access to account information and transactions or call us at 800.CALL OPP (800.225.5677) for 24-hr automated information and automated transactions. Representatives also available Mon–Fri 8am-8pm ET. | | |
Visit Us oppenheimerfunds.com Call Us 800 225 5677 Follow Us | | | | |
 | | Oppenheimer funds are distributed by OppenheimerFunds Distributor, Inc. 225 Liberty Street, New York, NY 10281-1008 © 2018 OppenheimerFunds Distributor, Inc. All rights reserved. RA1225.001.0718 September 26, 2018 | | |
Item 2. Code of Ethics.
The registrant has adopted a code of ethics that applies to the registrant’s principal executive officer, principal financial officer, principal accounting officer or controller or persons performing similar functions.
Item 3. Audit Committee Financial Expert.
The Board of Trustees of the registrant has determined that Karen L. Stuckey, the Chairwoman of the Board’s Audit Committee, is the audit committee financial expert and that Ms. Stuckey is “independent” for purposes of this Item 3.
Item 4. Principal Accountant Fees and Services.
The principal accountant for the audit of the registrant’s annual financial statements billed $52,200 in fiscal 2018 and $51,200 in fiscal 2017.
The principal accountant for the audit of the registrant’s annual financial statements billed $3,500 in fiscal 2018 and $7,000 in fiscal 2017.
The principal accountant for the audit of the registrant’s annual financial statements billed $343,361 in fiscal 2018 and $320,775 in fiscal 2017 to the registrant’s investment adviser or any entity controlling, controlled by, or under common control with the adviser that provides ongoing services to the registrant.
Such services include: Internal control reviews, GIPS attestation procedures, custody audits, CP Conduit fees, incremental, and additional, audit services.
The principal accountant for the audit of the registrant’s annual financial statements billed no such fees in fiscal 2018 and no such fees in fiscal 2017.
The principal accountant for the audit of the registrant’s annual financial statements billed $533,392 in fiscal 2018 and $710,577 in fiscal 2017 to the registrant’s investment adviser or any entity controlling, controlled by, or under common control with the adviser that provides ongoing services to the registrant.
Such services include: tax compliance, tax planning and tax advice. Tax compliance generally involves preparation of original and amended tax returns, claims for a refund and tax payment-planning services. Tax planning and tax advice includes assistance with tax audits and appeals, tax advice related to mergers and acquisitions and requests for rulings or technical advice from taxing authorities.
The principal accountant for the audit of the registrant’s annual financial statements billed no such fees in fiscal 2018 and no such fees in fiscal 2017.
The principal accountant for the audit of the registrant’s annual financial statements billed no such fees in fiscal 2018 and no such fees in fiscal 2017 to the registrant’s investment adviser or any entity controlling, controlled by, or under common control with the adviser that provides ongoing services to the registrant.
Such fees would include the cost to the principal accountant of attending audit committee meetings and consultations regarding the registrant’s retirement plan with respect to its Trustees.
| (e) | (1) During its regularly scheduled periodic meetings, the registrant’s audit committee will pre-approve all audit, audit-related, tax and other services to be provided by the principal accountants of the registrant. |
The audit committee has delegated pre-approval authority to its Chairman for any subsequent new engagements that arise between regularly scheduled meeting dates provided that any fees such pre-approved are presented to the audit committee at its next regularly scheduled meeting.
Under applicable laws, pre-approval of non-audit services may be waived provided that: 1) the aggregate amount of all such services provided constitutes no more than five percent of the total amount of fees paid by the registrant to its principal accountant during the fiscal year in which services are provided 2) such services were not recognized by the registrant at the time of engagement as non-audit services and 3) such services are promptly brought to the attention of the audit committee of the registrant and approved prior to the completion of the audit.
(2) 0%
| (f) | Not applicable as less than 50%. |
| (g) | The principal accountant for the audit of the registrant’s annual financial statements billed $880,253 in fiscal 2018 and $1,038,352 in fiscal 2017 to the registrant and the registrant’s investment adviser or any entity controlling, controlled by, or under common control with the adviser that provides ongoing services to the registrant related to non-audit fees. Those billings did not include any prohibited non-audit services as defined by the Securities Exchange Act of 1934. |
| (h) | The registrant’s audit committee of the board of Trustees has considered whether the provision of non-audit services that were rendered to the registrant’s investment adviser, and any entity controlling, controlled by, or under common control with the investment adviser that provides ongoing services to the registrant that were not pre-approved pursuant to paragraph (c)(7)(ii) of Rule 2-01 of Regulation S-X is compatible with maintaining the principal accountant’s independence. No such services were rendered. |
Item 5. Audit Committee of Listed Registrants
Not applicable.
Item 6. Schedule of Investments.
a) Not applicable. The complete schedule of investments is included in Item 1 of this Form N-CSR.
b) Not applicable.
Item 7. Disclosure of Proxy Voting Policies and Procedures for Closed-End Management Investment Companies.
Not applicable.
Item 8. Portfolio Managers of Closed-End Management Investment Companies.
Not applicable.
Item 9. Purchases of Equity Securities by Closed-End Management Investment Company and Affiliated Purchasers.
Not applicable.
Item 10. Submission of Matters to a Vote of Security Holders.
The Fund’s Governance Committee Provisions with Respect to Nominations of Directors/Trustees to the Respective Boards
None
Item 11. Controls and Procedures.
Based on their evaluation of the registrant’s disclosure controls and procedures (as defined in rule 30a-3(c) under the Investment Company Act of 1940 (17 CFR 270.30a-3(c)) as of 7/31/2018, the registrant’s principal executive officer and principal financial officer found the registrant’s disclosure controls and procedures to provide reasonable assurances that information required to be disclosed by the registrant in the reports that it files under the Securities Exchange Act of 1934 (a) is accumulated and communicated to registrant’s management, including its principal executive officer and principal financial officer, to allow timely decisions regarding required disclosure, and (b) is recorded, processed, summarized and reported, within the time periods specified in the rules and forms adopted by the U.S. Securities and Exchange Commission.
There have been no changes in the registrant’s internal controls over financial reporting that occurred during the registrant’s second fiscal quarter of the period covered by this report that have materially affected, or are reasonably likely to materially affect, the registrant’s internal control over financial reporting.
Item 12. Disclosure of Securities Lending Activities for Closed-End Management Investment Companies.
Not applicable.
Item 13. Exhibits.
| (a) | (1) Exhibit attached hereto. |
| | (2) Exhibits attached hereto. |
SIGNATURES
Pursuant to the requirements of the Securities Exchange Act of 1934 and the Investment Company Act of 1940, the registrant has duly caused this report to be signed on its behalf by the undersigned, thereunto duly authorized.
| | |
| Oppenheimer Corporate Bond Fund |
| |
| By: | | /s/ Arthur P. Steinmetz |
| | Arthur P. Steinmetz |
| | Principal Executive Officer |
| |
| Date: | | 9/21/2018 |
Pursuant to the requirements of the Securities Exchange Act of 1934 and the Investment Company Act of 1940, this report has been signed below by the following persons on behalf of the registrant and in the capacities and on the dates indicated.
| | |
| By: | | /s/ Arthur P. Steinmetz |
| | Arthur P. Steinmetz |
| | Principal Executive Officer |
| |
| Date: | | 9/21/2018 |
| | |
| By: | | /s/ Brian S. Petersen |
| | Brian S. Petersen |
| | Principal Financial Officer |
| |
| Date: | | 9/21/2018 |