Exhibit 99.3
REGULATION S-X RULE 3-09
CONSOLIDATED FINANCIAL STATEMENTS OF
VIP-CKH Luxembourg S.à r.l
FOR THE YEARS ENDED
DECEMBER 31, 2017 AND 2016
FINANCIAL STATEMENTS AND NOTES THERETO

1, Route d’Esch
L-1470 Luxembourg
R.C.S. Luxembourg: B 77 457
Share Capital: EUR 50,000
CONTENTS
REPORT OF INDEPENDENT AUDITORS | | 4 |
CONSOLIDATED STATEMENT OF FINANCIAL POSITION | | 6 |
CONSOLIDATED INCOME STATEMENT | | 7 |
CONSOLIDATED STATEMENT OF COMPREHENSIVE INCOME | | 8 |
CONSOLIDATED STATEMENT OF CASH FLOW | | 9 |
CONSOLIDATED STATEMENT OF CHANGES IN EQUITY | | 10 |
NOTES TO THE CONSOLIDATED FINANCIAL STATEMENTS OF THE VIP-CKH LUXEMBOURG S.À R.L AS OF AND FOR THE YEAR ENDED DECEMBER 31, 2017 AND 2016 | | 11 |
1 | INTRODUCTION | | 11 |
2 | GENERAL ACCOUNTING POLICIES | | 13 |
3 | ACQUISITIONS AND DISPOSALS | | 39 |
4 | TANGIBLE ASSETS | | 39 |
5 | INTANGIBLE ASSETS | | 41 |
6 | FINANCIAL ASSETS | | 45 |
7 | INVESTMENTS ACCOUNTED FOR USING THE EQUITY METHOD | | 45 |
8 | DEFERRED TAX ASSETS AND LIABILITIES | | 45 |
9 | INVENTORIES | | 47 |
10 | TRADE RECEIVABLES | | 48 |
11 | CURRENT INCOME TAX ASSETS | | 49 |
12 | OTHER RECEIVABLES | | 49 |
13 | CASH AND CASH EQUIVALENTS | | 50 |
14 | ASSETS HELD FOR SALE - LIABILITIES ASSOCIATES TO ASSETS HELD FOR SALE | | 51 |
15 | SHAREHOLDERS’ EQUITY | | 51 |
16 | FINANCIAL LIABILITIES | | 53 |
17 | DERIVATIVE FINANCIAL INSTRUMENTS | | 56 |
18 | EMPLOYEE BENEFITS | | 58 |
19 | PROVISIONS | | 59 |
20 | OTHER LIABILITIES | | 61 |
21 | TRADE PAYABLES | | 61 |
22 | OTHER PAYABLES | | 62 |
23 | INCOME TAX PAYABLES | | 63 |
24 | REVENUE AND SEGMENT REPORTING | | 63 |
25 | OTHER REVENUE | | 64 |
26 | PURCHASES AND SERVICES | | 65 |
2
27 | OTHER OPERATING COSTS | | 65 |
28 | PERSONNEL EXPENSES | | 66 |
29 | RESTRUCTURING COSTS | | 67 |
30 | DEPRECIATION AND AMORTIZATION | | 67 |
31 | REVERSAL OF IMPAIRMENT LOSSES / (IMPAIRMENT LOSSES) ON NON-CURRENT ASSETS | | 67 |
32 | FINANCE INCOME | | 68 |
33 | FINANCE EXPENSE | | 68 |
34 | FOREIGN EXCHANGE GAINS / (LOSSES), NET | | 69 |
35 | INCOME TAXES | | 69 |
36 | RELATED PARTIES TRANSACTIONS | | 70 |
37 | NET DEBT | | 73 |
38 | OTHER INFORMATION | | 74 |
39 | SUBSEQUENT EVENTS | | 78 |
3
Report of Independent Auditors
To the Management of VIP-CKH Luxembourg S.à.r.l:
We have audited the accompanying consolidated financial statements of VIP-CKH Luxembourg S.à.r.l. and its subsidiaries, which comprise the consolidated statement of financial position as of December 31, 2017 and the related consolidated statement of income, comprehensive income, changes in equity and cash flows for the year then ended.
Management’s Responsibility for the consolidated financial statements
Management is responsible for the preparation and fair presentation of the consolidated financial statements in accordance with International Financial Reporting Standards as issued by the International Accounting Standards Board; this includes the design, implementation, and maintenance of internal control relevant to the preparation and fair presentation of consolidated financial statements that are free from material misstatement, whether due to fraud or error.
Auditors’ Responsibility
Our responsibility is to express an opinion on the consolidated financial statements based on our audit. We conducted our audit in accordance with auditing standards generally accepted in the United States of America. Those standards require that we plan and perform the audit to obtain reasonable assurance about whether the consolidated financial statements are free from material misstatement.
An audit involves performing procedures to obtain audit evidence about the amounts and disclosures in the consolidated financial statements. The procedures selected depend on our judgment, including the assessment of the risks of material misstatement of the consolidated financial statements, whether due to fraud or error. In making those
4
risk assessments, we consider internal control relevant to the Company’s preparation and fair presentation of the consolidated financial statements in order to design audit procedures that are appropriate in the circumstances, but not for the purpose of expressing an opinion on the effectiveness of the Company’s internal control. Accordingly, we express no such opinion. An audit also includes evaluating the appropriateness of accounting policies used and the reasonableness of significant accounting estimates made by management, as well as evaluating the overall presentation of the consolidated financial statements. We believe that the audit evidence we have obtained is sufficient and appropriate to provide a basis for our audit opinion.
Opinion
In our opinion, the consolidated financial statements referred to above present fairly, in all material respects, the financial position of VIP-CKH Luxembourg S.à.r.l. and its subsidiaries as of December 31, 2017 and the results of their operations and their cash flows for the year then ended in accordance with International Financial Reporting Standards as issued by the International Accounting Standards Board.
/s/ PricewaterhouseCoopers SpA
Milan, Italy
March 13, 2018
5
CONSOLIDATED STATEMENT OF FINANCIAL POSITION
| | | | At December 31, | | At December 31, | |
(millions of euro) | | Note | | 2017 | | 2016 (unaudited) | |
| | | | | | | |
Assets | | | | | | | |
Tangible assets | | 4 | | 3,529 | | 5,618 | |
Intangible assets | | 5 | | 9,742 | | 10,001 | |
Financial assets | | 6 | | 9 | | 1,467 | |
Investments accounted for using the equity method | | 7 | | — | | 77 | |
Deferred tax assets | | 8 | | — | | 125 | |
Trade receivables | | 10 | | 247 | | 244 | |
Other receivables | | 12 | | 406 | | 36 | |
Total non-current assets | | | | 13,933 | | 17,568 | |
| | | | | | | |
Assets held for sale | | 14 | | 241 | | 50 | |
Financial assets | | 6 | | 4 | | 3 | |
Inventories | | 9 | | 127 | | 72 | |
Trade receivables | | 10 | | 1,251 | | 1,284 | |
Of which from related parties | | 36 | | 4 | | 3 | |
Current income tax assets | | 11 | | 30 | | 27 | |
Other receivables | | 12 | | 300 | | 236 | |
Of which from related parties | | 36 | | — | | 7 | |
Cash and cash equivalents | | 13 | | 619 | | 633 | |
Total current assets | | | | 2,572 | | 2,305 | |
TOTAL ASSETS | | | | 16,505 | | 19,873 | |
| | | | | | | |
Equity and Liabilities | | | | | | | |
Equity | | | | | | | |
Issued capital | | | | — | | — | |
Share premium reserve | | | | 15,413 | | 15,413 | |
Other reserves | | | | (2,580 | ) | (2,286 | ) |
Retained earnings | | | | (12,993 | ) | (11,562 | ) |
Loss for the year | | | | (2,678 | ) | (1,785 | ) |
Deficit attributable to the Group | | | | (2,838 | ) | (220 | ) |
Non-controlling interests | | | | — | | — | |
Total deficit | | 15 | | (2,838 | ) | (220 | ) |
| | | | | | | |
Liabilities | | | | | | | |
Deferred tax liabilities | | 8 | | 174 | | 368 | |
Financial liabilities | | 16 | | 10,264 | | 10,993 | |
Employee benefits | | 18 | | 67 | | 79 | |
Provisions | | 19 | | 195 | | 140 | |
Other liabilities | | 20 | | 418 | | 238 | |
Other payables | | 22 | | — | | 1 | |
Total non-current liabilities | | | | 11,118 | | 11,819 | |
| | | | | | | |
Financial liabilities | | 16 | | 5,163 | | 5,290 | |
Of which from related parties | | 36 | | 5,114 | | 5,114 | |
Trade payables | | 21 | | 2,341 | | 2,271 | |
Of which from related parties | | 36 | | 24 | | 43 | |
Other payables | | 22 | | 687 | | 656 | |
Income tax payables | | 23 | | 21 | | 57 | |
Liabilities associated to assets held for sale | | 14 | | 13 | | — | |
Total current liabilities | | | | 8,225 | | 8,274 | |
Total liabilities | | | | 19,343 | | 20,093 | |
TOTAL DEFICIT AND LIABILITIES | | | | 16,505 | | 19,873 | |
The accompanying notes are an integral part of these consolidated financial statements.
6
CONSOLIDATED INCOME STATEMENT
| | | | | | 2016 | |
| | | | 2017 | | 12 months | |
(millions of euro) | | Note | | 12 months | | (unaudited) (*) | |
| | | | | | | |
Revenue from services | | 24 | | 5,263 | | 2,256 | |
Of which from related parties | | 36 | | 12 | | 3 | |
Revenue from sales | | 24 | | 760 | | 549 | |
Other revenue | | 25 | | 159 | | 88 | |
Total revenue | | | | 6,182 | | 2,893 | |
| | | | | | | |
Services | | 26 | | (2,596 | ) | (1,245 | ) |
Of which from related parties | | 36 | | (122 | ) | (44 | ) |
Purchases | | 26 | | (699 | ) | (506 | ) |
Other operating costs | | 27 | | (303 | ) | (149 | ) |
Personnel expenses | | 28 | | (376 | ) | (217 | ) |
Restructuring costs | | 29 | | (271 | ) | (60 | ) |
Depreciation and amortization | | 30 | | (3,333 | ) | (653 | ) |
Impairment losses on non-current assets | | 31 | | (24 | ) | (1,685 | ) |
Losses on disposal of non-current assets | | | | (2 | ) | (1 | ) |
Operating Loss | | | | (1,422 | ) | (1,623 | ) |
| | | | | | | |
Finance income | | 32 | | 18 | | 19 | |
Finance expense | | 33 | | (1,366 | ) | (227 | ) |
Of which from related parties | | 36 | | — | | (134 | ) |
Foreign exchange gains/(losses), net | | 34 | | 7 | | (1 | ) |
Loss before tax | | | | (2,763 | ) | (1,832 | ) |
| | | | | | | |
Income taxes | | 35 | | 85 | | 47 | |
| | | | | | | |
Loss for the year | | | | (2,678 | ) | (1,785 | ) |
| | | | | | | |
Non-controlling interests | | | | — | | — | |
| | | | | | | |
Loss for the year attributable to the Group | | | | (2,678 | ) | (1,785 | ) |
(*) The consolidated income statements for the year ended December 31, 2017 are not immediately comparable with those of the same period of the previous year. The consolidated income statements for the year ended December 31, 2016 only reflect the full year’s consolidated results of predecessor 3 Italia Group and approximately two months consolidated results of predecessor WIND Group.
The accompanying notes are an integral part of these consolidated financial statements.
7
CONSOLIDATED STATEMENT OF COMPREHENSIVE INCOME
| | | | 2016 | |
| | 2017 | | 12 months | |
(millions of euro) | | 12 months | | (unaudited) (*) | |
| | | | | |
Loss for the year | | (2,678 | ) | (1,785 | ) |
Other comprehensive income/(loss) that will be subsequently recycled to profit or loss | | | | | |
Gains/(losses) net of tax on cash flow hedging instruments | | 60 | | (41 | ) |
Total Other comprehensive income/(loss) that will be subsequently recycled to profit or loss | | 60 | | (41 | ) |
| | | | | |
Total comprehensive loss for the year | | (2,618 | ) | (1,826 | ) |
| | | | | |
Total comprehensive loss attributable to: | | | | | |
Owners of the Parent | | (2,618 | ) | (1,826 | ) |
Non-controlling interests | | — | | — | |
(*) The consolidated income statements for the year ended December 31, 2017 are not immediately comparable with those of the same period of the previous year. The consolidated income statements for the year ended December 31, 2016 only reflect the full year’s consolidated results of predecessor 3 Italia Group and approximately two months consolidated results of predecessor WIND Group.
The accompanying notes are an integral part of these consolidated financial statements.
8
CONSOLIDATED STATEMENT OF CASH FLOW
| | | | | | 2016 | |
| | | | 2017 | | 12 months | |
(millions of euro) | | Note | | 12 months | | (unaudited)(*) | |
| | | | | | | |
Cash flows from / (used in) operating activities | | | | | | | |
Loss for the year | | | | (2,678 | ) | (1,785 | ) |
Income taxes | | 35 | | (85 | ) | (47 | ) |
Finance costs — net | | 32, 33 | | 1,357 | | 208 | |
Losses on disposals of non-current assets | | | | — | | 1 | |
Gains on subsidiary disposal | | | | (11 | ) | — | |
Loss before taxes, interest, gains/losses on disposal of assets | | | | (1,417 | ) | (1,623 | ) |
| | | | | | | |
Adjustments to reconcile the loss for the year with the cash flows from/(used in) operating activities | | | | | | | |
Depreciation, amortization and (reversal of impairment losses)/impairment losses on non-current assets | | 30, 31 | | 3,357 | | 2,338 | |
Net changes in provisions and employee benefits | | | | 19 | | 11 | |
Impairment of trade receivables | | | | 196 | | 91 | |
Impairment of inventory | | | | 3 | | 3 | |
Change in inventories | | | | (58 | ) | 23 | |
Net change in current assets/liabilities | | | | (814 | ) | 67 | |
Taxes paid | | | | (52 | ) | (46 | ) |
Interest received | | | | 575 | | — | |
Interest paid | | | | (959 | ) | (9 | ) |
Net cash flows from operating activities | | | | 850 | | 855 | |
| | | | | | | |
Cash flows from/(used in) investing activities | | | | | | | |
Acquisition of tangible assets | | 4 | | (750 | ) | (322 | ) |
Acquisition of intangible assets | | 5 | | (507 | ) | (292 | ) |
Disposal of tangible and intangible assets | | 4, 5 | | 82 | | — | |
Disposal of financial assets | | 6 | | 88 | | — | |
Purchase of non-controlling interest | | | | — | | (45 | ) |
Net cash flows used in investing activities | | | | (1,087 | ) | (659 | ) |
| | | | | | | |
Cash flows from / (used in) financing activities | | | | | | | |
Bank loans: | | | | | | | |
Receipts | | 16 | | 2,970 | | — | |
Repayments | | 16 | | (712 | ) | (49 | ) |
Loans from shareholders: | | | | | | | |
Receipts | | | | — | | 287 | |
Repayments | | | | — | | (186 | ) |
Bonds issued | | 16 | | 7,291 | | — | |
Bonds repaid (included related costs) | | 16 | | (9,326 | ) | — | |
Net cash flows from financing activities | | | | 223 | | 52 | |
| | | | | | | |
Net cash flows for the year | | | | (14 | ) | 248 | |
| | | | | | | |
Cash and cash equivalents at the beginning of the year | | 13 | | 633 | | 89 | |
Cash and cash equivalents from incorporation of WIND | | 13 | | — | | 296 | |
Cash and cash equivalents at the end of the year | | 13 | | 619 | | 633 | |
(*) The consolidated income statements for the year ended December 31, 2017 are not immediately comparable with those of the same period of the previous year. The consolidated income statements for the year ended December 31, 2016 only reflect the full year’s consolidated results of predecessor 3 Italia Group and approximately two months consolidated results of predecessor WIND Group.
The accompanying notes are an integral part of these consolidated financial statements.
9
CONSOLIDATED STATEMENT OF CHANGES IN EQUITY
| | | | Equity attributable to the Group | | | | | | | |
(millions of euro) | | | | Issued
capital | | Share
premium
account | | Other
reserves | | Fair value
reserve | | Retained
earnings/
(losses carried
forward | | Equity
attributable
to the Group | | Non-
controlling
interests | | Total
Equity | |
| | | | | | | | | | | | | | | | | | | |
Balances at January 1, 2016 (unaudited) | | | | 2,759 | | — | | 395 | | 4,121 | | (11,481 | ) | (4,206 | ) | 31 | | (4,175 | ) |
Total comprehensive loss for the year | | | | — | | — | | (41 | ) | — | | (1,785 | ) | (1,826 | ) | — | | (1,826 | ) |
- Loss for the year | | Note 15 | | — | | — | | — | | — | | (1,785 | ) | (1,785 | ) | — | | (1,785 | ) |
- Cash flow hedges | | Note 15 | | — | | — | | (41 | ) | — | | — | | (41 | ) | — | | (41 | ) |
Purchase of Non-Controlling Interest | | | | — | | — | | (9 | ) | — | | — | | (9 | ) | (31 | ) | (40 | ) |
Recycling of the fair value reserve | | | | — | | — | | — | | (16 | ) | — | | (16 | ) | — | | (16 | ) |
Settlement of shareholder loan | | Note 15 | | — | | — | | — | | (4,105 | ) | — | | (4,105 | ) | — | | (4,105 | ) |
Incorporation of WIND | | | | — | | — | | (2,631 | ) | — | | (81 | ) | (2,712 | ) | — | | (2,712 | ) |
| | | | | | | | | | | | | | | | | | | |
Extraordinary General Meeting: | | | | | | | | | | | | | | | | | | | |
- Contribution in kind of a receivable | | Note 15 | | — | | 10,057 | | — | | — | | — | | 10.057 | | — | | 10,057 | |
- Reduction in share capital | | Note 15 | | (2,759 | ) | 2,759 | | — | | — | | — | | — | | — | | — | |
- Contribution in cash | | Note 15 | | — | | 40 | | — | | — | | — | | 40 | | — | | 40 | |
- Contribution in kind of a receivable | | Note 15 | | — | | 2,557 | | — | | — | | — | | 2,557 | | — | | 2,557 | |
Balances at December 31, 2016 (unaudited) | | | | — | | 15,413 | | (2,286 | ) | — | | (13,347 | ) | (220 | ) | — | | (220 | ) |
| | | | | | | | | | | | | | | | | | | |
Total comprehensive loss for the year | | | | | | | | | | | | | | | | | | | |
- Loss for the year | | Note 15 | | — | | — | | — | | — | | (2,678 | ) | (2,678 | ) | — | | (2,678 | ) |
- Cash flow hedges | | Note 15 | | — | | — | | 60 | | — | | — | | 60 | | — | | 60 | |
Other movements | | Note 15 | | — | | — | | (354 | ) | — | | 354 | | — | | — | | — | |
Balances at December 31, 2017 | | | | — | | 15,413 | | (2,580 | ) | — | | (15,671 | ) | (2,838 | ) | — | | (2,838 | ) |
The accompanying notes are an integral part of these consolidated financial statements.
10
NOTES TO THE CONSOLIDATED FINANCIAL STATEMENTS OF THE VIP-CKH LUXEMBOURG S.à r.l AS OF AND FOR THE YEAR ENDED DECEMBER 31, 2017 AND 2016
1 INTRODUCTION
VIP-CKH Luxembourg Group (hereafter “the Group”) operates in Italy mainly in fixed and mobile telecommunication sector under the brands 3, Wind, Wind Tre Business and Infostrada. The Group is strongly oriented to mobile data transmission offer as well as to broadband and wireless internet access services. The Group also accompany its offer with a wide range of content, applications and media.
VIP-CKH Luxembourg Sàrl (hereafter VIP-CKH or the Company or the Joint Venture) is a limited liability company having its registered office in 1, Route d’Esch, Luxembourg.
VIP-CKH is a 50/50 joint venture owned indirectly by CK Hutchison Holdings Limited (hereafter referred to as CK Hutchison) and VEON Ltd (hereafter referred to as VEON) to jointly own and operate the telecommunications businesses in Italy. CK Hutchison is a company incorporated in the Cayman Islands with limited liability and registered on the Register of Companies of the Cayman Islands (No. MC-294571), the shares of which are listed on the Main Board of the Stock Exchange of Hong Kong Limited and its principal place of business is located at 12th Floor, Cheung Kong Center, 2 Queen’s Road Central, Hong Kong. VEON is incorporated under Bermuda law, domiciled in Claude Debussylaan 88, 1082 MD Amsterdam, Netherlands and listed on NASDAQ and Euronext Amsterdam.
During 2016, CK Hutchison and VEON completed the transactions which led to the unification of the operating activities of WIND and H3G telecommunication operator in the Italian Market.
The transaction, started by the two shareholders VIP Group and CK Hutchison Group in August 2015, obtained the European Commission and the Italian Ministry for Economic Development (MISE) approvals on September 1, 2016 and on October 25, 2016 respectively. The completion of the transaction to establish the Joint Venture took place on November 5, 2016.
Overall, the transaction led to the creation of a new group jointly controlled by the VIP Group and the CK Hutchison Group and was concluded through the transfer (i.e., contribution) of the WIND Group under the control of VIP-CKH.
Upon the formation of the Joint Venture, the holding and operating companies of the telecommunications businesses in Italy of CK Hutchison and VEON, namely Wind Tre Italia and Wind Acquisition Holdings Finance SpA, and Wind Tre SpA (formerly known as H3G SpA, hereafter referred to as Wind Tre) and WIND Telecomunicazioni SpA, respectively and all their other subsidiaries became the subsidiaries of the Joint Venture, and the Joint Venture became the new parent company of the Group holding the telecommunications businesses in Italy of CK Hutchison and VEON. WIND Acquisition Holdings Finance SpA and WIND Telecomunicazioni SpA were merged with, and incorporated into, Wind Tre Italia and Wind Tre, respectively via legal mergers by incorporation that were completed on December 1, 2016 and December 31, 2016, respectively.
This Joint Venture created the biggest telecom operator in Italy. The Group is now working to deliver significant efficiencies and providing significant additional investment to drive development of Italy’s digital infrastructure. The new financial and industrial capabilities will enable the Group to provide innovative, high quality and greater network speed in line with the growing demand for connectivity and with the expectations of households and businesses consumption. The Group aims to become a key player in the integration and development of fixed-mobile in the next-generation fiber networks thanks to the agreement with Enel Open Fiber to create a network of ultra-broadband in Italy.
11
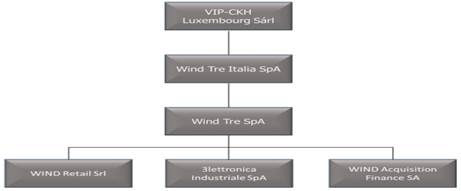
The following diagram illustrates the structure of the VIP-CKH Group at December 31, 2017.
As required by the European Commission as a mandatory condition for approving the aforementioned merger between WIND Telecomunicazioni SpA and H3G SpA, were implemented a number of remedies which included the signing of certain agreements with Iliad, a French telecom operator, aiming to allow Iliad to enter the Italian market.
The agreements have resulted in the commitment of the Wind Tre Group to sell to Iliad frequencies and sites in the period 2017 — 2019 as well as to sign certain temporary agreements which enable Iliad to operate telecommunications services in the Italian market while Iliad is creating its own network. By an accounting perspective the frequencies and sites that are expected to be transferred to Iliad by 12 months at each closing date are presented and measured as required by IFRS 5 and explained under the General Accounting Policies paragraph. Conversely, the sites that are expected to be transferred beyond the 12 months’ timeframe and that will still be utilized by the Group up to that moment have been subject to an accelerated depreciation mirroring the new expected limited useful life.
Iliad, the fourth infrastructure mobile operator, is expected to enter the market during 2018.
· Refinancing transaction
In order to optimize the capital structure, reduce annual interest costs and extend maturities of the existing debt, on November 3, 2017 the Group completed the refinancing of all the Wind Tre Group’s debt exposure to third parties by issuing €5.6 billion of senior secured notes, $2.0 billion of senior secured notes and by entering into an agreement for a new bank loan of €3.4 billion (including a €400 million revolving credit facility not used at December 31, 2017). The Group used the funds obtained from the transaction: (i) to repay the existing bank loan, (ii) to redeem the senior and senior secured notes issued by the subsidiary Wind Acquisition Finance and (iii) to pay the costs, fees and expenses, including premiums for call options and pre-cancellation costs relating to the above.
· Operation updates
In 2017 the subsidiary Wind Tre invested over €1.2 billion to strengthen its fixed and mobile networks, thereby accelerating the process of network integration. Trieste and Agrigento are the first two Italian cities to benefit from the new consolidated Wind Tre network which guarantees high performance for coverage, quality of service and
12
connection speed and ensures a better user experience. The consolidation of the mobile network is expected to be completed by the end of 2019.
The Group closed 2017 with a loss before tax from continuing operations of €2,763 million (loss of €1,832 million in 2016 unaudited) and a net loss for the year from continuing operations of €2,678 million (loss of €1,785 million in 2016 unaudited).
2 GENERAL ACCOUNTING POLICIES
2.1 Basis of preparation
These financial statements (the “Rule 3-09 Financial Statements”) have been prepared for inclusion in the filing on Form 20-F of VEON Ltd for the purpose of Rule 3-09 of United States Securities and Exchange Commission (“SEC”) Regulation S-X. The Regulation S-X Rule 3-09 Financial Statements have been prepared on a consistent basis as included in the consolidated financial statements of VIP CK Group for the two years ended December 31, 2017 and 2016. The Rule 3-09 Financial Statements have been prepared in accordance with the International Financial Reporting Standards (IFRS) issued by the International Accounting Standard Board (IASB) and with all the SIC/IFRIC interpretations and item 17 of Rule 3-09 of SEC Regulation S-X.
The consolidated financial statements for the year ended December 31, 2017 have been prepared on a going concern basis despite the fact that the current assets cannot cover the current liabilities. The Board of Managers has reviewed the liquidity available for the period of 12 months as from the date of approval of the 2017 consolidated financial statements and has calculated that sufficient resources will be available to cover the short-term liabilities. In addition the loan from the related company (see note 16) is due to the Shareholders of the Company which confirmed via a letter that this amount will be managed in a way able to not generate financial difficulties for the Group for at least one year from the date of approval of the 2017 consolidated financial statements.
Commencing 2016, the consolidated financial statements have been prepared in accordance with the International Financial Reporting Standards (IFRS) issued by the International Accounting Standard Board (IASB) and with all the SIC/IFRIC interpretations. In the past, before the completion of the transaction described under note 1, no consolidated financial statements were prepared by the company as VIP-CKH applied the exemption on the basis of the criteria set out by Luxembourg Commercial Law of August 10, 1915 and consolidated financial statements were prepared at a higher level. Despite this, the only entity which was 100% controlled by the Company in the past, 3 Italia SpA, also prepared IFRS consolidated financial statements for the year ended December 31, 2015.
The statement of financial position is prepared using an analysis of assets and liabilities into current and non-current. The income statement is prepared in accordance with IAS 1 “Presentation of Financial Statements” with a classification of expenses by nature that is believed to provide more relevant information than a classification by function.
In preparing these consolidated financial statements the Group adopted historical cost as the basis of measurement except for certain financial instruments for which, in accordance with IAS 39, measurement at fair value has been used.
The accounting standards adopted by the Group are the same as those used for the preparation of the consolidated financial statements as of and for the year ended December 31, 2016.
13
These consolidated financial statements are expressed in euros, the currency of the economy in which the Group operates. Unless otherwise stated, all amounts shown in the tables and in these notes are expressed in millions of euros.
The preparation of these notes required management to apply accounting policies and methodologies that are occasionally based on complex, subjective judgments, estimates based on past experience and assumptions determined to be reasonable and realistic based on the related circumstances and on the available information. The application of these estimates and assumptions affects the reported amounts in the income statement, the statement of comprehensive income, the statement of financial position, the cash flow statement and the accompanying notes. Management’s significant judgments on the application of Group accounting policies and the main causes of uncertainty of these estimates are the same as those applied in the preparation of the consolidated financial statements as of and for the year ended December 31, 2016.
For the purposes of comparison, balances in the statement of financial position have been reclassified where necessary. These reclassifications do not affect the Group’s profit for the year or equity (see note 20 for further details).
· Comparative information
The consolidated income statements for the year ended December 31, 2017 are not immediately comparable with those of the same period of the previous year because the latter only reflect the full year’s consolidated results of predecessor 3 Italia Group and approximately two months’ consolidated results of predecessor WIND Acquisition Holdings Finance Group.
2.2 Basis of consolidation
The companies controlled by the Group (“subsidiaries”) are consolidated on a line-by-line basis. Control exists when the Company has simultaneously:
· decisional power, that is the power to govern the financial and operating policies of the entity, meaning those activities that have a significant influence on the results of the company;
· the right to the variable results (positive or negative) arising from its investments in the entity;
· the ability to use its decision-making power to determine the amount of the results arising from its investments in the entity.
The existence of control is verified whenever facts and circumstances indicate a change in one or more of the three qualifying elements of control.
Subsidiaries are consolidated from the date of acquisition and deconsolidated when such control ceases.
Where there is an acquisition or loss of control of a company included in the consolidation perimeter, the consolidated financial statements include the net income of the company for the period in which the Group has control.
The financial statements used in the consolidation process are those prepared by the individual Group entities as of and for the year ended December 31, 2017.
The consolidation procedures used are as follows:
· the assets and liabilities and income and expenses of consolidated subsidiaries are included at 100% in the Group Financial Statements, allocating to non-controlling interests, where applicable, the share of equity
14
and profit or loss for the year that is attributable to them. The resulting balances are presented separately in consolidated equity and the consolidated income statement;
· except for business combinations under common control as noted below the purchase method of accounting is used to account for business combination in which control of an entity is acquired. The cost of an acquisition is measured as the fair value of the assets acquired, liabilities incurred or assumed and equity instruments issued at the acquisition date. Any excess of the cost of acquisition over the fair value of the assets and liabilities acquired is recorded as goodwill. If the cost of acquisition is less than the fair value of the net assets of the subsidiary acquired, the difference is recognized directly in profit or loss after first verifying that the fair values attributed to the acquired assets and liabilities and the cost of the acquisition have been measured correctly;
· business combinations in which all of the combining entities or businesses are ultimately controlled by the same party or parties both before and after the business combination are considered business combinations involving entities under common control. In the absence of an accounting standard guiding the accounting treatment of these operations the Group applies IAS 8, consolidating the carrying amounts of the transferred entity and reporting any gains/losses arising from the transfer directly in equity;
· the purchase of investments from minority holders in entities where control is already exercised is not considered a purchase but an equity transaction. Therefore, the difference between the cost incurred for the acquisition and the respective share of the accounting equity acquired is recognized directly in equity;
· unrealized gains and losses arising from transactions carried out between companies consolidated on a line-by-line basis and the respective tax effects are eliminated, as are corresponding balances of receivables and payables, income and expense, and finance income and expense;
· gains and losses arising from the sale of investments in consolidated subsidiaries are recognized in income as the difference between the selling price and the corresponding portion of the consolidated equity sold.
The following table provides a summary of the Group’s investments showing the criteria used for consolidation and measurement.
| | % holding
12.31.2016
(unaudited) | | % holding
12.31.2017 | | Basis of consolidation /
measurement
12.31.2017 | |
Subsidiaries | | | | | | | |
Wind Tre Italia SpA | | 100 | | 100 | | Line-by-line | |
Wind Tre SpA | | 100 | | 100 | | Line-by-line | |
WIND Retail Srl | | 100 | | 100 | | Line-by-line | |
WIND Acquisition Finance SA | | 100 | | 100 | | Line-by-line | |
3lettronica Industriale SpA | | 100 | | 100 | | Line-by-line | |
Associates | | | | | | | |
Galata SpA (*) | | 10 | | — | | — | |
Others | | | | | | | |
MIX Srl | | 9.75 | | 9.75 | | Cost | |
Consel — Consorzio Elis per la formazione professionale superiore a r.l. | | 1 | | 1 | | Cost | |
Janna Scarl | | 17 | | 17 | | Cost | |
QXN Società consortile per azioni | | 10 | | 10 | | Cost | |
Dono per…Scarl in liquidazione | | 33.33 | | 33.33 | | Cost | |
(*) On July 4, 2017, the whole 10% of the shares of the entity was sold.
15
The following table sets out investments in subsidiaries at December 31, 2017.
(thousands of euro)
Name | | Registered office | | Share/quota
capital as of
12/31/2017 | | Share/quota
holders’ equity as of
12/31/2017(*) | | Profit (loss) for
the year ended
12/31/2017(*) | | Holding % as
of December
31, 2017 | | Carrying
amount as of
12/31/2017 | |
Wind Tre Italia SpA | | Trezzano sul Naviglio – Via L. da Vinci, 1 | | 2,346,637 | | 3,258,368 | | (128,213 | ) | 100 | % | 9,062,723 | |
Wind Tre SpA | | Trezzano sul Naviglio – Via L. da Vinci, 1 | | 474,304 | | 1,612,038 | | (2,876,802 | ) | 100 | % | 8,113,755 | |
WIND Retail Srl | | Rome - Via Cesare Giulio Viola, 48 | | 1,027 | | 36,315 | | (1,070 | ) | 100 | % | 31,103 | |
WIND Acquisition Finance SA | | 1, Route d’Esch L-1470 Luxembourg | | 60,031 | | (110,073 | ) | (145,159 | ) | 100 | % | 61,797 | |
3lettronica Industriale SpA. | | Trezzano sul Naviglio, Via Leonardo da Vinci, 1 | | 16,000 | | 33,652 | | (8,800 | ) | 100 | % | 48,859 | |
(*) As per the financial statements prepared by the companies’ directors for the approval of the share/quota holders’ meetings, adjusted where necessary to comply with the measurement criteria used for the preparation of these separate financial statements.
The following table sets out non-controlling interests in companies and consortia at December 31, 2016 (unaudited).
(thousands of euro)
Name | | Registered office | | Share/quota
capital as of
12/31/2016
(unaudited) | | Share/quota
holders’
equity as of
12/31/2016
(unaudited) | | Profit (loss)
for the year
ended
12/31/2016
(unaudited) | | Holding % as
of December
31, 2016
(unaudited) | | Carrying
amount as of
12/31/2016
(unaudited) | |
Galata Spa | | Rome - Via Carlo Veneziani,58 | | 1,000 | | 280,807 | | 13,326 | | 10 | % | 77,000 | |
Consel - Consorzio Elis per la formazione professionale superiore a r.l.(**) | | Rome - Via Sandro Sandri, 45 | | 51 | | 52 | | — | | 1 | % | 1 | |
QXN Società consortile per azioni | | Rome - Via Bissolati n.76 | | 500 | | 751 | | 15 | | 10 | % | 50 | |
Janna Scarl (*) | | Cagliari - Loc. Sa Illetta, Strada Statale 195 Km 2.3 | | 13,717 | | 9,382 | | (1,459 | ) | 17 | % | 2,072 | |
MIX srl | | Milan - Via Caldera, 21 | | 99 | | 1,356 | | 271 | | 9.75 | % | 10 | |
Dono per … Scarl in liquidazione | | Rome - Via di Santa Maria in Via, 12 | | 30 | | (69 | ) | (267 | ) | 33.33 | % | 10 | |
(*) The company is also owned by the Sardinia region, owner of the submarine cables that connect it with the rest of Italy.
(**) Data of the company are related to September 30, 2016
· Business combinations under common control and formation of Joint Venture
These transactions are not contemplated by IFRS 3, which outlines the accounting method for business combinations, or by any other IFRS. In the absence of an accounting standard of reference, it is believed that the selection of the accounting principle most suitable is the general objective set out in IAS 8 in order to provide relevant and reliable information about a transaction. Taking into account this the Group has decided to select the predecessor accounting method (based on continuity of values and not on IFRS 3 principles) as an accounting policy for this kind of transactions. Use of the predecessor accounting method is also in line with certain other generally accepted accounting principles that permit, or require, this accounting to be used for other common control transactions or similar circumstances.
The concept of continuing values requires the recognition in the financial statements of the acquirer of the same values as those recorded in the books of the companies / business segments acquired before the transaction or, if available, the values in the consolidated financial statements of the common parent (the “predecessor accounting” principle). Where the values transferred are higher than these historical values, both the acquirer and the seller must eliminate the excess by reducing equity.
16
· Segment reporting
Operating segments are reported in a manner consistent with the internal reporting provided to the chief operating decision maker.
The Board of Directors of Wind Tre SpA assess the financial performance and position of the group, and makes strategic decisions. The Board of Directors of Wind Tre SpA has been identified as being the chief operating decision maker, consists of the chief executive officer and the chief financial officer.
2.3 Summary of main accounting policies
The principal accounting policies adopted in preparing these consolidated financial statements are set out below.
· Tangible assets
Property, plant and equipment are stated at purchase cost or production cost, net of accumulated depreciation and any impairment losses. Cost includes expenditures directly attributable to bringing the asset to the location and condition necessary for use and any dismantling and removal costs which may be incurred as a result of contractual obligations which require the asset to be returned to its original state and condition. The present value of an estimate of dismantling, removal and restoration costs is recognized with the corresponding liability stated as a liability under “Provisions”.
Costs incurred for ordinary and cyclical repairs and maintenance are taken directly to profit or loss in the period in which they are incurred. Costs incurred for the expansion, modernization or improvement of the structural elements of owned or leased assets are capitalized to the extent that they have the requisites to be separately identified as an asset or part of an asset, in accordance with the “component approach”. Under this approach each asset is treated separately if it has an autonomously determinable useful life and carrying amount.
Tangible assets are depreciated on a straight-line basis from the date on which the asset is available for use as intended by management, over their estimated useful life. The useful lives of property, plant and equipment and their residual values are reviewed and updated, where necessary, at least at each year end. Land is not depreciated. When a depreciable asset is composed of identifiable separate components whose useful lives vary significantly from those of other components of the asset, depreciation is calculated for each component separately, applying the “component approach”.
The useful lives estimated by the Group for the various categories of property, plant and equipment are as follows.
Property, plant and machinery | | 5-40 years |
Planning and development costs of the fixed line and mobile telephone network | | Residual term of license |
Equipment | | 4-8 years |
Other assets | | 5-10 years |
Gains or losses arising from the sale or retirement of assets are determined as the difference between the selling price and the carrying amount of the asset sold or retired and are recognized in profit or loss under “Gains/(losses) on disposal of non-current assets”.
Finance leases are leases that substantially transfer all the risks and rewards incidental to the ownership of assets to the Group. Property, plant and equipment acquired under finance leases are recognized as assets at their fair value or, if lower, at the present value of the minimum lease payments, including any amounts to be paid for exercising a
17
purchase option. The corresponding liability due to the lessor is recognized as part of financial liabilities. An asset acquired under a finance lease is depreciated over the shorter of the lease term and its useful life.
Lease arrangements in which the lessor substantially retains the risks and rewards incidental to ownership of the assets are classified as operating leases. Lease payments under operating leases are recognized as an expense in profit or loss on a straight-line basis over the lease term.
· Intangible assets
Intangible assets are identifiable non-monetary assets without physical substance which can be controlled and which are capable of generating future economic benefits. Intangible assets are stated at purchase and/or production cost including any expenses that are directly attributable to preparing the asset for its intended use, net of accumulated amortization in the case of assets being amortized and any impairment losses. Amortization of intangible assets with finite useful life begins when the assets are available for use as intended by the management and it is charged on a straight-line basis over the estimated life of the particular asset. Rates and amortization methods are reviewed at least annually in order to verify if they are still applicable.
Intangible assets with indefinite life or not available for use as intended by management are not subject to systematic amortization, but are assessed annually to verify if there are indications that the carrying value may not be recoverable.
Gains and losses from disposals or retirement of intangible assets are determined as the difference between sales proceeds and the net book value of assets retired or disposed of and are recognized in the income statement of the relevant financial year.
· TLC license and frequencies
These are considered to have an indefinite useful life given that the Italian Ministry of Economic Development, together with the Italian Ministry of Economy, has confirmed that the license and frequencies can be extended for the same amount of time as they had previously been extended, thus making the license and frequencies a perpetual license and considering the expected renewal cost in relation to the expected benefits. The indefinite useful life is reviewed at least annually to consider any legislative, regulatory and economic changes.
· Industrial patents and intellectual property rights, concessions, licenses, trademarks and similar rights
Concessions, licenses and similar rights consist of rights of transmission on digital frequencies, right of use for optic fiber and infrastructures, the fair value of the rights of use related to site sharing agreements between the Group and other operators, the distribution of multimedia content and similar rights.
The Group holds a license as a national network operator for digital television broadcasting. The license was renewed and extended to 20 years in 2008 under Law no. 101/2008 and it qualifies as a “general authorization to supply electronic communication services” ex article 25.6 of the “Electronic Communications Code”, equivalent to the license for the supply of UMTS mobile services held by the Group, with the right to apply for both the extension of the term under article 1-bis of Law no. 40/07 and the renewed article 25.6 of the Electronic Communications Code. Based on this and considering the beginning of the conversion of the license to digital television broadcasting (DVB-T), the Group considered it appropriate to treat the license as having an indefinite useful life.
18
Following a series of new analyses of the expected cash inflows and taking into account the likelihood of the renewal of certain contracts relating specifically to this television license, the estimate of the useful life was reviewed downwards in 2016 to a shorter temporal horizon equal to 10 years, which now reflects the latest and most prudent expectation of the utilization of the rights related to the license in the current competitive scenario.
The indefeasible right of use of optic fiber and infrastructure owned by other operators is stated at cost and amortized on the basis of the duration of the underlying contract.
The benefit deriving from the Group’s right of housing its network equipment on sites made available by other operators is stated at fair value as of the date of the acquisition of the benefit and amortized on the basis of the equivalent useful life of the Group’s housed infrastructures.
Trademarks are not amortized as they are considered to have an indefinite useful life.
· Software
Costs relating to the development and maintenance of software programs are expensed as incurred. Unique and identifiable costs directly related to the production of software products which are controlled by the Group and which are expected to generate future economic benefits for a period exceeding one year are accounted for as intangible assets. Direct costs — where identifiable and measurable — include the cost of employees who develop the software, together with a share of overheads as appropriate.
Software is amortized on a straight-line basis over its useful life estimated depending on the different business functionalities to be supported by the investment, in a range of from 3 to 8 years, starting on the date on which the software becomes available for use as intended by the management.
Purchased software that is integral to the functionality of the related equipment is capitalized as part of that equipment and amortized on a straight-line basis over the useful life of the relevant tangible asset.
· Goodwill
Goodwill represents the excess of the cost of an acquisition over the interest acquired in the fair value at the acquisition date of the assets and liabilities of the entity or business acquired. Goodwill relating to investments accounted for using the equity method is included in the carrying amount of the investment. Goodwill is subject to periodic tests to ensure that the carrying amount in the statement of financial position is recoverable (“impairment tests”). Impairment tests are carried out annually or more frequently when events or changes in circumstances occur that could lead to an impairment loss on the cash generating units (“CGUs”) to which the goodwill has been allocated. An impairment loss is recognized whenever the recoverable amount of goodwill is lower than its carrying amount. The recoverable amount is the higher of the fair value of the CGU less costs to sell and its value in use, which is represented by the present value of the cash flows expected to be derived from the CGU during operations and from disposal at the end of its useful life. The method for calculating value in use is described in the paragraph below “Impairment losses”. Once an impairment loss has been recognized on goodwill it cannot be reversed.
Whenever an impairment loss resulting from the above tests exceeds the carrying amount of the goodwill allocated to a specific CGU, the residual amount is allocated to the assets of that particular CGU in proportion to their carrying
19
amounts. The carrying amount of an asset under this allocation is not reduced below the higher of its fair value less costs to sell and its value in use as described above.
· Customer list
The customer list as an intangible asset consists of the list of customers identified on allocating the goodwill arising on acquisitions carried out by the Group. Amortization is charged on the basis of the respective estimated useful lives, which range from 5 to 15 years.
· Customers acquisition costs
These consist mainly of the cost of commissions paid to the sales network, capitalized as intangible assets, in accordance with the principles of reference and amortized over the minimum contract term.
· Impairment losses on non-financial assets
At each reporting date, property, plant and equipment and intangible assets with finite lives are assessed to determine whether there is any indication that an asset may be impaired. If any such indication exists, the recoverable amount of the asset concerned is estimated and any impairment loss is recognized in profit or loss. Intangible assets with indefinite useful lives are tested for impairment annually or more frequently when events or changes in circumstances occur that could lead to an impairment loss. The recoverable amount of an asset is the higher of its fair value less costs to sell and its value in use, which is represented by the present value of its estimated future cash flows. In determining an asset’s value in use the estimated future cash flows are discounted using a pre-tax rate that reflects the market’s current assessment of the cost of money for the investment period and the specific risk profile of the asset. If an asset does not generate independent cash flows, its recoverable amount is determined in relation to the cash-generating unit (CGU) to which it belongs. An impairment loss is recognized in profit or loss when the carrying amount of an asset or the CGU to which it is allocated exceeds its recoverable amount. If the reasons for previously recognizing an impairment loss cease to exist, the carrying amount of an asset other than goodwill is increased to the carrying amount of the asset that would have been determined (net of amortization or depreciation) if no impairment loss had been recognized on the asset, with the reversal being recognized in profit or loss.
· Investments
Investments in non-consolidated subsidiaries are stated at cost. Investments in companies where the Group exercises a significant influence (“associates”), which is presumed to exist when the Group holds between 20% and 50%, are accounted for using the equity method.
The equity method is as follows:
· the Group’s share of the profit or loss of an investee is recognized in profit or loss from the date when significant influence or control begins up to the date when that significant influence or control ceases. Where the investee accounted for using the equity method has a deficit as the result of losses, its carrying amount is reduced to zero and any excess attributable to the Group, in the event that it has legal or constructive obligations on behalf of the investee or in any case to cover the losses, is recognized in a
20
specific provision. Equity changes in investees accounted for using the equity method that do not result from profit or loss are recognized directly in consolidated equity reserves;
· unrealized gains and losses generated from transactions between the Company or its subsidiaries and its investees accounted for using the equity method are eliminated on consolidation for the portion pertaining to the Group; unrealized losses are eliminated unless they represent an impairment loss.
The financial statements of the associate are prepared for the same reporting period as the Group. When necessary, adjustments are made to bring the accounting policies in line with those of the Group.
Investments in other companies are measured at fair value with any changes in fair value being recognized in profit or loss. If the fair value cannot be reliably determined an investment is measured at cost. Cost is adjusted for impairment losses if necessary, as described in the paragraph “Impairment losses”. If the reasons for an impairment loss no longer exist, the carrying amount of the investment is reversed up to the extent of the loss with the related effect recognized in profit or loss. Any risk arising from losses exceeding the carrying amounts of investments is accrued in a specific provision under liabilities to the extent of the Group’s legal or constructive obligations on behalf of the investee or in any case to the extent that it is required to cover the losses. Investments held for sale or to be wound up in the short term are classified as current assets and stated at the lower of their carrying amount and fair value less costs to sell.
· Financial instruments
Financial instruments consist of financial assets and liabilities whose classification is determined on initial recognition and on the basis of the purpose for which they were purchased.
· Financial assets
Financial assets are initially recognized at fair value and classified in one of the following four categories and subsequently measured as described below:
i) Financial assets at fair value through profit or loss: this category includes financial assets purchased primarily for sale in the short term, those designated as such upon initial recognition, provided that the assumptions exist for such classification or the fair value option may be exercised, and financial derivatives except for the effective portion of those designated as cash flow hedges. These assets are measured at fair value; any change in the period is recognized in profit or loss as financial income or expense. Financial instruments included in this category are classified as current assets if they are held for trading or expected to be disposed of within twelve months from the reporting date. Derivatives are treated as assets or liabilities depending on whether their fair value is positive or negative; positive and negative fair values arising from transactions with the same counterparty are offset if this is contractually provided for.
ii) Loans and receivables: these are non-derivative financial instruments, mostly relating to trade receivables, which are not quoted on an active market and which are expected to generate fixed or determinable repayments. They are included as current assets unless they are contractually due over more than twelve months after the reporting date in which case they are classified as non-current assets. These assets are measured at amortized cost using the effective interest method. If there is objective evidence of factors which indicate an impairment loss, the asset is reduced to the discounted value of future cash flows. The impairment loss is recognized in profit or loss.
21
iii) Held-to-maturity investments: these are fixed maturity non-derivative financial instruments having fixed or determinable payments which the Group has the intention and ability to hold until maturity. These assets are measured at amortized cost using the effective interest method, adjusted as necessary for impairment losses. In the case of impairment the policies used for financial receivables are applied.
iv) Available-for-sale financial assets: these are non-derivative financial instruments which are either specifically included in this category or included there because they cannot be classified in other categories. These assets are measured at fair value and any related gain or loss is recognized directly in an equity reserve and subsequently recognized in profit or loss only when the asset is actually sold or, if there are cumulative negative changes, when it is expected that the losses recognized in equity cannot be recovered in the future. For debt securities, if in a future period the fair value increases due to the objective consequence of events occurring after the impairment loss has been recognized in profit or loss, the original value of the instrument is reinstated with the corresponding gain recognized in profit or loss. Additionally, the yields from debt securities arising from the use of the amortized cost method are recognized in profit or loss in the same manner as foreign exchange differences, whereas foreign exchange differences relating to available-for-sale equity instruments are recognized in the specific equity reserve. The classification as current or non-current assets is the consequence of strategic decisions regarding the estimated period of ownership of the asset and its effective marketability, with those which are expected to be realized within twelve months from the reporting date being classified as current assets.
Financial assets are derecognized when the right to receive cash flows from them ceases and the Group has effectively transferred all risks and rewards related to the instrument and its control.
· Financial liabilities
Financial liabilities consisting of loans, trade payables and other obligations are initially recognized at fair value, net of transaction costs incurred, and subsequently measured at amortized cost using the effective interest method. When there is a change in expected cash flows which can be reliably estimated, the value of the loans is recalculated to reflect such change based on the present value of expected cash flows and the originally determined internal rate of return. Financial liabilities are classified as current liabilities except where the Group has an unconditional right to defer payment until at least twelve months after the reporting date.
Financial liabilities are derecognized when settled and the Group has transferred all the related costs and risks relating to the instrument.
Hybrid instruments, partly financial liability and partly equity, are broken down into their component parts of financial liability or equity on the base of the value that an equivalent financial liability, without the equity component, would have on the market. The equity part is recycled into profit and loss during the life of the instrument.
· Derivative financial instruments
At the date of signing of the contract the instrument is initially recognized at fair value, with subsequent changes in fair value being recognized as a financial component of income. Where instead it has been decided to use hedge accounting, meaning in those situations in which the hedging relationship is identified, subsequent changes in fair value are accounted for in accordance with the following specific criteria. The relationship between each derivative qualifying as a hedging instrument and the hedged item is documented to include the risk management objective,
22
the hedging strategy and the means by which the hedging instrument’s effectiveness will be assessed. An assessment of the effectiveness of each hedge is made when each derivative financial instrument becomes active and throughout the hedge term.
In the case of a fair value hedge, i.e. the hedge refers to changes in the fair value of a recognized asset or liability, the changes in the fair value of the hedging instrument and those of the hedged item are both recognized in profit or loss. If the hedge is not fully effective, meaning that these changes are different, the non-effective portion is treated as finance income or expense for the year in profit or loss.
For a cash flow hedge, the fair value changes of the derivative are subsequently recognized, limited to the effective portion, in a specific equity reserve (the “cash flow hedge reserve”). A hedge is normally considered highly effective if from the beginning and throughout its life the changes in the expected cash flows for the hedged item are substantially offset by the changes in the fair value of the hedging instrument. When the economic effects deriving from the hedged item are realized, the reserve is reclassified to profit or loss together with the economic effects of the hedged item. Whenever the hedge is not highly effective, the non-effective portion of the change in fair value of the hedging instrument is immediately recognized as a financial component of profit or loss for the year. Cash flow hedges also include hedges of the currency risk for transactions carried out in US dollars. These obligations are translated at the year-end exchange rate and any resulting exchange gains and losses are offset in profit or loss against the change in the fair value of the hedging instrument.
When hedged forecast cash flows are no longer considered highly probable during the term of a derivative, the portion of the “cash flow hedge reserve” relating to that instrument is reclassified as a financial component of the profit or loss for the year. If instead the derivative is sold or no longer qualifies as an effective hedging instrument, the “cash flow hedge reserve” recognized to date remains as a component of equity and is reclassified to profit or loss for the year in accordance with the criteria of classification described above when the originally hedged transaction takes place.
Derivatives embedded in hybrid instruments are separated from the host contract and accounted separately if the whole hybrid instrument is not measured at fair value with gains reported in profit or loss and if the characteristics and risks of the derivative are not “closely related” to those in the main contract. Testing takes place at the inception of the contracts and afterwards if significant changes occur in the expected cash flows. In determining the fulfillment of the closely related criterion for puttable and callable options the Group has determined the accounting policy to compare the amortized cost of the host instrument, after having neutralized the embedded feature, with the exercise price of the options.
· Determination of fair value
Quotations at the reporting date are used to determine the fair value of financial assets and financial liabilities listed on active markets. In the absence of an active market, fair value is determined by referring to prices supplied by third-party operators and by using valuation models based primarily on objective financial variables and, where possible, prices in recent transactions and market prices for similar financial instruments. The Group uses unobservable inputs to determine the fair value of embedded derivatives.
· Sales of receivables
The Group carries out sales of receivables under factoring arrangements in accordance with Law no. 52/1991. These sales are characterized by the transfer of substantially all the risks and rewards of ownership of the receivables to
23
third parties, meeting IAS 39 requirements for derecognition. Specific servicing contracts through which the buyer confers a mandate to the Company for the collection and management of the receivables leave the current Company/customer relationship unaffected.
· Taxation
Income taxes are recognized on the basis of taxable profit for the year and the applicable laws and regulations, using tax rates prevailing at the reporting date.
Deferred taxes are calculated on temporary differences arising between the tax bases of assets and liabilities and their carrying amounts in the consolidated financial statements at the tax rates that are expected to apply for the years when the temporary differences will be realized or settled and tax losses carried forward will be reversed, based on tax laws that have been enacted or substantively enacted by the reporting date.
Current and deferred taxes are recognized in profit or loss, except for taxes arising from items taken directly to equity; in such cases the tax effect is recognized directly in the specific equity item.
Deferred income tax assets and liabilities are offset when (1) there is a legally enforceable right to set-off current tax assets against current tax liabilities and (2) when the deferred income taxes relate to the same fiscal authority on either the same taxable entity or different taxable entities where there is an intention to settle the balances on a net basis.
Deferred income tax assets, including those related to previous tax losses, to the extent they are not offset by deferred tax liabilities, are recognized if it is probable that future taxable profit will be available against which these can be used.
For the regulations on electing the tax consolidation procedure to apply, Wind Tre Italia SpA elected for consolidation, so it is required to determine a single overall tax base for corporate income tax (IRES) purposes consisting of the sum of the taxable profit or tax loss of the Company and those of its subsidiaries taking part in the procedure, and to settle a liability by making a single tax payment or to recognize a single tax credit for refund or to be carried forward.
· Inventories
Inventories are stated at the lower of purchase cost or production cost and net estimated realizable value. Cost is determined using the weighted average cost method for fungible goods or goods held for resale. When necessary, provisions are made for slow-moving and obsolete inventories.
· Cash and cash equivalents
Cash and cash equivalents mainly consist of cash-in-hand, bank and postal accounts balances, deposits held at call with banks and short-term highly liquid investments with original maturities of three months or less and which are subject to an insignificant risk of changes in value.
· Provisions
Provisions are recognized for a loss or expense of a specific nature that is certain or probable to arise but for which the timing or amount cannot be precisely determined.
Provisions are recognized when:
· the Group has a present legal or constructive obligation as a result of past events;
24
· it is probable that an outflow of resources will be required to settle the obligation; and
· the amount can be reliably estimated.
Provisions represent the best estimate of liabilities at the end of the reporting period in respect of the timing and required disbursement to settle the obligation.
Risks, for which the likelihood of a liability arising is only possible, are disclosed in the notes under “Contingent assets and liabilities” and no provision is made.
· Employee benefits
· Short-term employee benefits
Short-term employee benefits are recognized in profit or loss in the period when an employee renders the related service.
· Post-employment benefits
Post-employment benefits can be divided into two categories: 1) defined contribution plans and 2) defined benefit plans. Contributions to defined contribution plans are charged to profit or loss when incurred, based on their nominal value. For defined benefit plans, since benefits are determinable only after the termination of employment, costs are recognized in profit or loss based on actuarial calculations.
In the Italian legislative system the employee severance indemnity (TFR), due in accordance with the provisions of article 2120 of the Italian Civil Code, accruing in companies with more than 50 employees is considered to be a defined benefit plan until December 31, 2006 and a defined contribution plan after that date.
Defined benefit pension plans are based on the average expected residual working life of employees and on the remuneration received by them during an estimated period of service. The liability recognized in the statement of financial position is the current value of the defined benefit obligation at the end of the reporting period. The defined benefit obligation is calculated annually by independent actuaries using the projected unit credit method. The current value of the defined benefit obligation is determined by discounting estimated future cash outflows using the interest rates of high-quality corporate bonds that are denominated in the same currency in which the benefits will be paid (Euro), and that have terms to maturity approximating to the terms of the related liability.
Actuarial gains and losses arising from experience adjustments and changes in actuarial assumptions are charged or credited to other comprehensive income. Past-service costs are recognized immediately in profit or loss.
· Termination benefits and redundancy incentive schemes
Benefits due to employees on the termination of employment contracts are treated as a liability when the Group is demonstrably committed to terminating these contracts for a single employee or group of employees before the normal retirement date or to granting termination benefits in order to facilitate voluntary resignations of surplus employees following a formal proposal. These benefits do not create future economic advantages to the Group and the related costs are therefore immediately recognized in profit or loss.
· Assets held for sale and discontinued operations
Non-current assets and current and non-current assets of disposal groups whose carrying amount will mainly be recovered through sale, rather than through ongoing use, are classified as held for sale.
25
This condition is met when the sale is highly probable and the asset or disposal group is available for immediate sale in its present condition. Non-current assets held for sale, current and non-current assets referring to disposal groups and liabilities directly associated with such assets are recognized in the statement of financial position separately from the other assets and liabilities of the entity.
Non-current assets held for sale are not depreciated and are measured at the lower of carrying amount and related fair value, less costs to sell.
The held-for-sale classification for investments accounted for using the equity method implies the suspension of the application of such method; therefore in this case the carrying amount is equal to the amount deriving from the application of the equity method at the date of reclassification.
Any difference between the carrying amount and the fair value less costs to sell is recognized in profit or loss as an impairment loss; any subsequent increase in value is recognized to the extent that it is not in excess of the cumulative impairment loss that has been recognized previously on the asset as held for sale.
When there is a plan to dispose of a subsidiary which results in the loss of control, the assets and liabilities of the subsidiary are all classified as held for sale regardless of whether a non-controlling interest will still be held in the former subsidiary after the sale.
When specific conditions are met the non-current assets or group of (i) non-current assets (ii) current assets and (iii) associated liabilities constituting a disposal group as described in the preceding paragraphs satisfy the definition of discontinued operations. The results of discontinued operations are presented separately in the income statement including the results of the discontinued operations and the gain or loss, if any, realized on abandonment or disposal net of the related tax effect. Further details on the composition of this item are provided in the notes.
· Translation of items in non-euro currencies
The financial statements are presented in Euro, which is the functional and presentational currency. Foreign currency transactions are initially recorded at the exchange rate prevailing at the dates of the transactions. Foreign exchange gains and losses resulting from the settlement of such transactions and from the translation at year-end exchange rates of monetary assets and liabilities denominated in foreign currencies are recognized in profit or loss, except when deferred in equity as qualifying cash flow hedges.
With reference to foreign transactions whose currency risk is covered with derivatives, further details are provided in the note Financial instruments.
· Leases
Leases in which the Group is the lessee are classified as operating leases when a significant portion of the risks and rewards of ownership is retained by the lessor. Payments made under operating leases (net of any incentives received from the lessor) are charged in profit or loss on a straight-line basis over the period of the lease.
Assets acquired pursuant to finance leases and hire purchase contracts that transfer to the Group substantially all the rewards and risks of ownership are accounted for as if purchased.
Finance leases are capitalized at the inception of the lease at the lower of the fair value of the leased assets or the present value of the minimum lease payments. Lease payments are treated as consisting of capital and interest elements. The capital element of the leasing commitment is included as a liability and the interest element is charged to profit or loss.
26
· Revenue recognition
Revenue is recognized at the fair value of the consideration received, net of rebates and discounts. The Group recognizes revenue when the amount of revenue can be reliably measured and it is probable that future economic benefits will flow to the entity.
Revenue from the sale of goods is recognized when the Group transfers the risks and rewards of ownership of the goods. Revenue from services is recognized in profit or loss by reference to the stage of completion and only when the outcome can be reliably estimated.
More specifically, the criteria followed by the Group in recognizing core-business revenue are as follows:
· revenue arising from post-paid traffic, interconnection and roaming is recognized on the basis of the actual usage of each subscriber and telephone operator. Such revenue includes amounts paid for access to and usage of the Group network by customers and other domestic and international telephone operators;
· revenue from the sale of prepaid cards and recharging is recognized on the basis of the prepaid traffic actually used by subscribers during the year. The unused portion of traffic at period end is recognized as “Other payables - Prepaid traffic to be used”;
· revenue from the sale of mobile phones and fixed-line phones and related accessories is recognized at the time of sale and one-off fees received for the granting of rights to use owned fiber optic cables are recognized at the time of the transfer of the underlying right and, therefore, of the related risks and rewards.
· one-off revenue from fixed and mobile (prepaid or subscription) activation and/or substitution and the activation of new services and tariff plans is recognized for the full amount at the moment of activation to the extent of the related costs, or deferred over the minimum contractual term. In the case of promotions with a cumulative plan still open at year end, the activation fee is recognized on an accrual basis so as to match the revenue with the period in which the service may be used;
· Grants
Grants are recognized when a formal decision of the disbursing government institution, in case of government grants, has been taken, with recognition being matched to the costs to which they relate. Revenue grants are taken to “Other revenue” in the Consolidated Income Statement, while grants related to Property, plant and equipment are recognized as deferred income in the Statement of Financial Position and taken to profit or loss on a straight-line basis over the useful life of the asset to which the grant directly relates.
· Finance income and expense
Finance income and expense is recognized on an accruals basis using the effective interest method, meaning at the interest rate that renders all cash inflows and outflows linked to a specific transaction financially equivalent.
Finance expenses that are directly attributable to the acquisition, construction or production of qualifying assets, which are assets that necessarily take a substantial period of time to get ready for their intended use or sale, are capitalized and amortized over the useful life of the class of assets to which they refer.
· Research and development costs and advertising expenses
Research and development costs, as well as advertising expenses are charged directly to profit or loss in the year in which they are incurred.
Costs incurred on development projects are recognized as intangible assets when the following criteria are fulfilled:
27
· it is technically feasible to complete the intangible asset so that it will be available for use;
· management intends to complete the intangible asset and use it;
· there is an ability to use the intangible asset;
· it can be demonstrated how the intangible asset will generate probable future economic benefits;
· adequate technical, financial and other resources to complete the development and to use the intangible asset are available; and
· the expenditure attributable to the intangible asset during its development can be reliably measured.
Other development expenditures that do not meet these criteria are recognized as an expense as incurred. Development costs previously recognized as an expense are not recognized as an asset in the subsequent period.
Capitalized development costs are recorded as intangible asset and amortized on a straight-line basis over its useful life from the date when the asset is ready for use as intended by management.
· New accounting standards and interpretations
The Group has adopted all the newly issued and amended standards of the IASB and interpretations of the IFRIC, applicable to its transactions and effective for financial statements for years beginning January 1, 2017 and thereafter.
Standard effective in 2017
With reference to the application of accounting standards that became effective from January 1, 2017 are reported in particular the following standards and amendments which, despite not having a significant impact on the financial statements at December 31, 2017, have been applied by the Group’s core business and may have relevance with respect to future transactions.
Amendment to IAS 7 “Statement of Cash flows” under the disclosure initiative - The amendment introduces an additional disclosure that will enable users of financial statements to evaluate changes in liabilities arising from financing activities. The amendment is part of the IASB’s Disclosure Initiative, aimed at understanding how financial statements disclosures can be improved.
Changes in annual improvements 2014—2016 - affecting the IFRS 12 “Disclosure of Interests in Other Entities”. The main parts of these changes applicable to the Group are as follows:
· IFRS 12 “Disclosure of Interests in Other Entities” - clarify the scope of the standard by specifying that the disclosure requirements apply to an entity’s interests in accordance with IFRS 5.
Amendment to IAS 12 “Income Taxes” — This amendment regarding the “Recognition of Deferred Tax Assets for Unrealised Losses” clarifies the requirements for recognising deferred tax assets on unrealised losses. The amendments clarify the accounting for deferred tax where an asset is measured at fair value and that fair value is below the asset’s tax base. They also clarify certain other aspects of accounting for deferred tax assets.
Accounting standards and interpretations issued by IASB/IFRIC — not yet effective
Set out below is the information required to assess the possible impact arising from the application of new accounting standards and interpretations that have already been issued but have not yet become effective or have not been adopted by the EU and thus cannot be applied to the financial statements as of December 31, 2017.
28
Unless otherwise indicated, the Group does not believe that the application of these standards will have any significant impact on its economic results, except for the need for further possible disclosures.
Standard, amendment or interpretation | | Status |
IFRS 15 “Revenue from Contracts with Customers” (issued on May 28, 2014) including amendments to IFRS 15 (issued on September 11, 2015) | | IASB Effective date: January 1, 2018
Endorsed by EU: September 22, 2016
Effective (EU): January 1, 2018 |
Clarifications to IFRS 15 Revenue from Contracts with Customers (issued on April 12, 2016) | | IASB Effective date: January 1, 2018
Endorsed by EU: October 31, 2017
Effective (EU): January 1, 2018 |
IFRS 9 “Financial Instruments” (issued on July 24, 2014) | | IASB Effective date: January 1, 2018
Endorsed by EU: November 22, 2016
Effective (EU): January 1, 2018 |
IFRIC 22 “Foreign Currency Transactions and Advance Consideration” | | IASB Effective date: January 1, 2018
Expected EU endorsement in Q1 2018 |
Table 1 - IFRSs whose effective date is expected for accounting periods beginning on or after January 1, 2018 (EU effective date or expected endorsement date included for reference only)
IFRS 15 “Revenue from Contracts with Customers” — This replaces IAS 18 “Revenues” and IAS 11 “Construction Contracts” and the interpretations IFRIC 13 “Customer Loyalty Programs”, IFRIC 15 “Agreements for the Construction of Real Estate”, IFRIC 18 “Transfer of Assets from Customers” and SIC 31 “Barter Transactions Involving Advertising Services”. It applies to all contracts with customers except from those included in the scope of IAS 17 “Leases”, IFRS 4 “Insurance Contracts” or IAS 39/IFRS 9 “Financial Instruments”.
IFRS 15 introduces a model based on the following steps: (i) Identify the contract with a customer; (ii) Identify the performance obligations in the contract, the separable elements that are part of the contract but which, for accounting purposes, must be separated; (iii) Determine the transaction price; (iv) Allocate the transaction price to the performance obligations in the contract; (v) Recognize revenue when (or as) the entity satisfies a performance obligation.
In 2017, the Group started the necessary activities for the assessment of the expected impacts from the application of IFRS 15. The Group has now finalized the analysis of the impacts. In particular, the impacts from IFRS 15 are mainly driven by both the business model applied by an entity and by the complexity of the contracts offered to the end-customers. The main considerations around the application of IFRS 15 to the Group can be summarized as follow:
· The Group has utilized as transition method the so-called “simplified approach” which means that IFRS 15 will be applied to all contracts that are not completed by January 1, 2018. Those contracts will be accounted for as if IFRS 15 had been applied by the inception of those contracts. The cumulative post-tax effect of the transition will be then treated as an adjustment to the opening equity at January 1, 2018. Prior year comparative will not be adjusted but sufficient disclosure will be included in the 2018 financial statements to evaluate the impact of IFRS 15 on 2018 income statements and balance sheet;
· The Group sells “bundle” / multiple arrangements offers to the end-customers. However, considering the business model applied by the Group (mainly through indirect channel, thus generating a separation for the promise to sell handsets), and the pricing strategy of the Group in relation to the embedded discounts in bundles, IFRS 15 did not generate significant impacts on revenues as of January 1, 2018;
29
· The above conclusions are mainly linked to the actual business model applied by the Group. Changes in the business model, including for example (i) changes in the distribution strategy; (ii) inclusion in the offers of significant options to activate future services at discounted price (material rights); (iii) the inclusion in the offers of services provided by third parties at discount; (iv) significant increase of the discount offered for “bundle” arrangements; and (iv) changes to the average length of the contracts may lead to impacts in the future;
· One-off contributions deriving from post-paid and pre-paid mobile activation with restrictions, as these revenues are not considered “separate performance obligations”, will now always be part of the transaction price allocated to other performance obligations. This adjustment did not generate significant impacts.
· Customer acquisition costs (mainly commissions for the Group) are now always capitalized for all types of commercial offers and amortized on the basis of the average customer life. The pre-tax impact on Equity of this adjustment at January 1, 2018 is equal to an increase in Equity of about €100 million.
Clarifications to IFRS 15 “Revenue from Contracts with Customers” — integrate the principles by providing clarifications on how to identify a “performance obligation” to the considerations related to the “principal/agent” and to the “licensing”.
IFRS 9 “Financial Instruments” — This replaces IAS 39 “Financial Instruments” and contains a model to evaluate financial instruments (based on a business model assessment of different portfolios of financial assets and the cash flow characteristics of each single financial asset) in three categories: amortized cost (“hold to collect” business model), fair value through profit or loss (“hold to collect and sale” business model) and fair value through other comprehensive income (“hold to sell” business model). The standard also envisages a new impairment model that is different from the model currently included in IAS 39 and is more focused on expected credit losses. Finally, the standard also simplifies the requirements for hedge accounting generally aligning management strategy with hedge accounting requirements. The Group started in 2017 the activities deemed necessary to assess the effect of the application of IFRS 9 and has now finalized the process. The main considerations around the application of IFRS 9 to the Group can be summarized as follow:
· From the analysis carried out by the Group, no significant impacts are expected on recognition and measurement of hedging derivatives;
· By a classification and measurement perspective no impacts have been identified in relation to the vast majority of financial assets which are generally managed through a “hold to collect” business model. The only main exception is related to handset receivables, which are mainly managed through and “hold to sell” business model. The fair value measurement of these assets generates a pre-tax impact on Equity of about €50 million of decrease at January 1, 2018.
· By an impairment perspective the modification of the credit impairment model, now based on the expected losses methodology, has led to an increase at January 1, 2018 of about €20 million in the allowance for doubtful accounts and, therefore, to a corresponding decrease of pre-tax equity.
· Future changes in business model or in the expected credit loss may lead to additional impacts in the future.
IFRIC 22 “Foreign Currency Transactions and Advance Consideration” - this IFRIC addresses foreign currency transactions or parts of transactions where there is consideration that is denominated or priced in a foreign currency.
30
Standard, amendment or interpretation | | Status |
IFRS 16 “Leases” (issued on January 13, 2016) | | IASB Effective date: January 1, 2019
Endorsed by EU: October 31, 2017
Effective (EU): January 1, 2019 |
Amendment to IFRS 9 “Financial Instruments” relating to the valuation of certain financial instruments denominated “negative compensation” | | IASB Effective date: January 1, 2019
Expected EU endorsement in 2018 |
Amendment to IAS 28 “Investments in Associates and Joint ventures” (issued on October 12, 2017) | | IASB Effective date: January 1, 2019
Expected EU endorsement in 2018 |
Annual improvements 2015-2017 (issued on December 12, 2017) | | IASB Effective date: January 1, 2019
Expected EU endorsement in 2018 |
Amendment to IAS 19 “Amendments, curtailments or settlements of the Defined Benefit Plan for Employee” (issued on February 7, 2018) | | IASB Effective date: January 1, 2019
Expected endorsement in 2018 |
IFRIC 23 “Uncertainty over income tax treatments” | | IASB Effective date: January 1, 2019
Expected EU endorsement in Q3 2018 |
Table 2 - IFRSs whose effective date is expected for accounting periods beginning on or after January 1, 2019 (EU effective date or expected endorsement date included for reference only)
IFRS 16 “Leases” — This replaces IAS 17 “Leases” and interpretations IFRIC 4 “Determining Whether an Arrangement Contains a Lease”, SIC 15 “Operating Leases - Incentives” and SIC 27 “Evaluating the Substance of Transactions Involving the Legal Form of a Lease”. IFRS 16 eliminates the classification of leases as either operating leases or finance leases for a lessee; instead all leases are treated in a similar way to finance leases applying IAS 17. Leases are to be recognized as right-of-use assets with the corresponding recognition of a financial liability. Partial exemptions to this rule are allowed for short-term leases (i.e. leases of 12 months or less) and leases of low-value assets (for example, the lease of a personal computer). By some preliminary considerations several types of assets at present held under operating leases by the Group might be affected by the implementation of this standard (physical sites in particular but potentially additional assets). This may lead to the recognition in the statement of financial position of significant right of use assets, and corresponding significant financial liabilities, from January 1, 2019. Ultimately, this may lead to an increase in both future EBITDA (due to the change in the nature of from lease operating expense to depreciation and interest of the income statement impact) and future net financial positions of the Group. The Group has started up and will complete within 2018 the activities deemed necessary to assess the effect of the application of IFRS 16.
Amendment to the IFRS 9 “Financial Instruments” — This amendment confirms that when a financial liability measured at amortised cost is modified without this resulting in de-recognition, a gain or loss should be recognised immediately in profit or loss.
Amendment to IAS 28 “Investments in Associates and Joint ventures” — clarifies that an entity must apply IFRS 9 “Financial Instruments”, including impairment considerations, to long term interests in an associate or joint ventures for which the equity method is not applied.
Annual improvements 2015-2017 - affecting IFRS 3 “Business Combinations”, IFRS 11 “Joint Arrangements”, IAS 12 “Income taxes” and IAS 23 “Borrowing Costs”. The main parts of these changes applicable to the Group are as follows:
31
· IFRS 3 “Business Combinations” and IFRS 11 “Joint Arrangements” — the amendments propose changes to the definition of business and the accounting of investments already held in a business in which control or joint control is subsequently acquired.
· IAS 12 “Income taxes” — the amendment clarifies that all income tax consequences of dividends should be recognised in profit or loss, regardless of how the tax arises.
· IAS 23 “Borrowing Costs” - the amendment clarifies that if any specific borrowing remains outstanding after the related asset is ready for its intended use or sale, that borrowing becomes part of the funds that an entity borrows generally when calculating the capitalization rate on general borrowings.
Amendment to IAS 19 “Amendments, curtailments or settlements of the Defined Benefit Plan for Employee” — the amendments require an entity to use updated assumptions to determine current service cost and net interest for the remainder of the period after a plan amendment, curtailment or settlement.
IFRIC 23 “Uncertainty over income tax treatments” — explains how to recognise and measure deferred and current income tax assets and liabilities where there is uncertainty over a tax treatment (or where there is uncertainty over whether that treatment will be accepted by the tax authority).
2.4 Accounting estimates and use of judgment
The preparation of these consolidated financial statements required management to apply accounting policies and methodologies based on complex, subjective judgments, estimates based on past experience and assumptions determined from time to time to be reasonable and realistic based on the related circumstances. The use of these estimates and assumptions affects the amounts reported in the statement of financial position, the income statement and the cash flow statement as well as the notes. The final amounts for items for which estimates and assumptions were made in the consolidated financial statements may differ from those reported in these financial statements due to the uncertainties that characterize the assumptions and conditions on which the estimates were based.
In this respect, the situation caused by the persisting difficulties of the economic and financial environment in the Eurozone led to the need to make assumptions regarding future performance which are characterized by significant levels of uncertainty; as a consequence, it cannot be excluded that results may arise in the future which differ from estimates, and which therefore might require adjustments, even significant, to be made to the carrying amount of assets and liabilities, which at the present moment can clearly neither be estimated nor predicted. The main items affected by these situations of uncertainty are non-current assets (tangible and intangible assets), deferred tax assets, provisions, contingent liabilities and impairment provisions.
The estimates and underlying assumptions are reviewed periodically and continuously by the Group. If the items considered in this process perform differently, then the actual results could differ from the estimates, which would accordingly require adjustment. The effects of any changes in estimate are recognized in profit or loss in the period in which the adjustment is made if it only affects that period, or in the period of the adjustment and future periods if it affects both current and future periods.
The accounting principles requiring a higher degree of subjective judgment in making estimates and for which changes in the underlying conditions could significantly affect the consolidated financial statements are briefly described below.
· Goodwill: goodwill is tested for impairment at least on an annual basis to determine whether any
32
impairment losses have arisen that should be recognized in profit or loss. More specifically, the test is performed by allocating the goodwill to a cash generating unit (CGU) and subsequently estimating the unit’s fair value. Should the fair value of the net capital employed be lower than the carrying amount of the CGU, an impairment loss is recognized on the allocated goodwill. The allocation of goodwill to cash generating units and the determination of the fair value of a CGU require estimates to be made that are based on factors that may vary over time and that could as a result have an impact on the measurements made by management which might be significant.
· Estimation of finite and indefinite useful life of non-current assets: the useful life of intangible and tangible fixed assets is reviewed on a periodic basis to verify that is representative of the related assets. Some intangible assets other than goodwill, such as TLC licenses and trademarks, are considered to have an indefinite life. In particular, TLC licenses are expected to generate benefits which are significantly higher than cost of renewal for the same licenses. These assessments are periodically updated to reflect the best and most up to date market developments in order to confirm the conditions which led to a non-finite useful life identification for such assets. Future market developments or changes in regulation could change the conditions of these estimates and require amortization, or impairment of such assets. The amortization period and the amortization method for an intangible asset with a finite useful life are reviewed at least at the end of each reporting period.
· Impairment losses on non-current assets: non-current assets are reviewed to determine whether there are any indications that the carrying amount of these assets may not be recoverable and that they have suffered an impairment loss that needs to be recognized. In order to determine whether any such elements exist it is necessary to make subjective measurements, based on information obtained within the Group and in the market and also on past experience. When a potential impairment loss emerges it is estimated by the Group using appropriate valuation techniques. The identification of the elements that may determine a potential impairment loss and the estimates used to measure such loss depend on factors which may vary over time, thereby affecting estimates and measurements.
· Depreciation of non-current assets: the cost of property, plant and equipment is depreciated on a straight-line basis over the useful lives of the assets. The useful life of property, plant and equipment is determined when the assets are purchased and is based on the past experience of similar assets, market conditions and forecasts concerning future events which may affect them, amongst which are changes in technology. The actual useful lives may therefore differ from the estimates of these. The Group regularly reviews technological and business sector changes, dismantling costs and recoverable amounts in order to update residual useful lives. Such regular updating may entail a change of the depreciation period and consequently a change in the depreciation charged in future years.
· Deferred tax assets: the recognition of deferred tax assets is based on forecasts of future taxable profit. The measurement of future taxable profit for the purposes of determining whether or not to recognize deferred tax assets depends on factors which may vary over time and which may lead to significant effects on the measurement of this item.
· Contingent liabilities and provisions: the accruals related to legal, arbitration and fiscal disputes are the result of a complex estimation process based upon the probability of an unfavorable outcome. The definition of such provisions entails making estimates based on currently known factors which may vary over time and which could actually turn out to be significantly different from those referred to in preparing the notes to
33
these financial statements.
· Fair value of financial instruments: the fair value of certain financial instruments (derivatives) is determined using valuation models that incorporate subjective measures such as estimated cash flows, price volatility, interest rate curves etc.
· Embedded derivatives: bifurcation of embedded derivatives from host contracts is based on judgments in the determination of the “closely related” criterion and on the amortized cost to be used (i.e., amortized cost of the host debt pre or after bifurcating the embedded feature).
2.5 Risk management
Credit Risk Management
The Group’s credit risk is principally associated with trade receivables which at December 31, 2017 amounted to €1,498 million (€1,528 million at December 31, 2016 unaudited). The Group minimizes credit risk through a preventive credit check process which ensures that all customers requesting new products and services or additions to existing services are reliable and solvent, also by using a preference for contracts which provide for the use of automatic payment methods with the aim of reducing the underlying credit risk. This check is carried out in the customer acceptance phase through the use of internal and external information.
The Group additionally exercises timely post-customer acquisition measures for the purpose of credit collection such as the following:
· sending reminders to customers;
· employing measures for the collection of overdue receivables, separated by strategy, portfolio and customer profiles;
· measuring and monitoring the debt status through reporting tools.
As a general rule, the Group has a limited level of credit concentration as the consequence of diversifying the product and services portfolio it offers to its customers.
The Group is also assisted by sureties issued by primary banks as collateral for the obligations resulting from supplies and receivables from dealers.
In relation to the exposure of financial counterparties’ credit risk, the Group reviews and amends the credit limits set for each national and international banking group.
These credit limits take into consideration the sum of the following components (NFA or, Net Financial Assets): i) availability of balances in bank or postal current accounts; ii) deposits or short term financial investments; iii) positive mark to market arising on derivatives used for hedging; iv) bank guarantees issued in favor of the company.
The Group had a positive cash net balance in its current accounts of €619 million at December 31, 2017 (€633 million at December 31, 2016 unaudited). The Group’s credit risk exposure from derivative contracts is represented by their realizable value or fair value, if positive.
34
Liquidity Risk Management
Liquidity risk arises mostly from the cash flows generated by debt servicing, in terms of both interest and principal, and from all of the Group’s payment obligations that result from business activities.
In 2017 the Group proceeded to settle the pre-existing debt and negotiate new loan contracts to optimize the capital structure and reduce the annual interest costs. In particular, the following debts were repaid:
· a floating rate long-term loan agreement (the Senior Facility Agreement) entered on November 24, 2010 by the Group and renegotiated on March 12, 2015, denominated in euros, with full repayment at maturity in 2019 and with total nominal value of €700 million to which should be added €400 million of unused revolving credit facility at December 31, 2016;
· the bonds issued by the subsidiary WIND Acquisition Finance SA, which were listed in the Luxembourg Stock Exchange market and held by institutional investors, set out in the table below:
(millions of euro) | | Issue date | | Currency | | Notional
amount | | Maturity | | Interest rate | |
Senior Notes 2021 € | | 04/23/2014 | | EUR | | 1,750 | | 04/23/2021 | | 7.00 | % |
Senior Notes 2021 $ | | 04/23/2014 | | USD | | 2,800 | | 04/23/2021 | | 7.375 | % |
Senior Secured Notes 2020 € | | 07/10/2014 | | EUR | | 2,475 | | 07/15/2020 | | 4.00 | % |
Senior Secured Notes 2020 $ | | 07/10/2014 | | USD | | 1,900 | | 07/15/2020 | | 4.75 | % |
Senior Secured Floating Rate Notes 2020 € | | 07/10/2014 | | EUR | | 575 | | 07/15/2020 | | Eur3M+4.00 | % |
Senior Secured Floating Rate Notes 2020 € | | 03/30/2015 | | EUR | | 400 | | 07/15/2020 | | Eur3M+4.125 | % |
Senior Secured Floating Rate Notes 2019 € | | 04/29/2013 | | EUR | | 150 | | 04/30/2019 | | Eur3M+5.25 | % |
Senior Secured Fixed Rate Notes 2020 $ | | 04/29/2013 | | USD | | 550 | | 04/30/2020 | | 6.50 | % |
The debt managed by the Group is composed of:
· a floating rate medium-long term loan agreement (the Senior Facility Agreement) entered on October 24, 2017 denominated in euros, with full repayment at maturity in 2022 and with total nominal value of €3.000 million to which should be added €400 million of unused revolving credit facility at December 31, 2017;
· the bonds issued by Wind Tre, which are listed in the Luxembourg Stock Exchange and Wien Stock Exchange markets and are held by institutional investors, and reported below:
(millions of euro) | | Issue date | | Currency | | Notional
amount | | Maturity | | Interest rate | |
Senior Secured Fixed Rate Notes 2023 € | | 11/03/2017 | | EUR | | 1,625 | | 01/20/2023 | | 2,625 | % |
Senior Secured Floating Rate Notes 2024 € | | 11/03/2017 | | EUR | | 2,250 | | 01/20/2024 | | Euribor 3M + 2,750 | % |
Senior Secured Fixed Rate Notes 2025 € | | 11/03/2017 | | EUR | | 1,750 | | 01/20/2025 | | 3,125 | % |
Senior Secured Fixed Rate Notes 2026 $ | | 11/03/2017 | | USD | | 2,000 | | 01/20/2026 | | 5,000 | % |
The bonds issued are subject to mandatory repayment in the following scenario: i) in case of a change of control, all bondholders will be entitled to request the total or partial repurchase of the bonds they hold at a price equal to 101% of the notional amount plus the interest accrued at the repurchase date, and ii) in case of asset sales, any proceeds not reinvested in the form envisaged by the offering memorandum and which exceed the amount of €250 million must be used to make a pari-passu repurchase offer to bondholders and debtholders at a price of 100% of the notional amount plus the interest accrued at the repurchase date;
· loans granted by the related company VIP-CKH Ireland Ltd of €5,114 million.
The above bonds are secured by pledge as indicated in note 38.
35
The maturity dates in accordance with the described above agreements, with exclusive reference to the amounts used, translating US dollar tranches at the hedge agreement exchange rate where applicable, are as follows.
(millions of euro) | | 2018 | | 2019 | | 2020 | | 2021 | | 2022 | | 2023 | | 2024 | | 2025 | | 2026 | | Total | |
Senior Facility Agreement | | — | | — | | 450 | | 600 | | 1,950 | | — | | — | | — | | — | | 3.000 | |
Senior Secured Fixed Rate Notes 2023 Euro | | — | | — | | — | | — | | — | | 1,625 | | — | | — | | — | | 1.625 | |
Senior Secured Floating Rate Notes 2024 Euro | | — | | — | | — | | — | | — | | — | | 2,250 | | — | | — | | 2.250 | |
Senior Secured Fixed Rate Notes 2025 Euro | | — | | — | | — | | — | | — | | — | | — | | 1,750 | | — | | 1.750 | |
Senior Secured Fixed Rate Notes 2026 Dollar | | — | | — | | — | | — | | — | | — | | — | | — | | 1,666 | | 1.666 | |
Loan from VIP-CKH Ireland Ltd | | 5,114 | | | | | | | | | | | | | | | | | | 5,114 | |
Total | | 5,114 | | — | | 450 | | 600 | | 1,950 | | 1,625 | | 2,250 | | 1,750 | | 1,666 | | 15,405 | |
The Senior Facility Agreement contains financial covenants (“Financial Covenants”) effective starting from January 1, 2018.
USD denominated bond tranches are hedged by cross currency swaps. As concerns liquidity risk, these cross currency swaps will lead to an exchange of principal at maturity.
The following tables set forth the contractual due dates for financial liabilities, including those for interest payments, which are representative of the respective effects on cash flows calculated as of December 31, 2017 and December 31, 2016.
(millions of euro) | | Carrying
amount
at
December
31, 2017 | | Total
contractual
cash flows | | 2018 | | 2019 | | 2020 | | 2021 | | 2022 | | 2023 | | 2024 | | 2025 | | 2026 | | 2027/
2035 | |
Non-derivative financial liabilities | | | | | | | | | | | | | | | | | | | | | | | | | |
Bank loans | | 2,970 | | (3,275 | ) | (61 | ) | (61 | ) | (511 | ) | (652 | ) | (1,990 | ) | — | | — | | — | | — | | — | |
Financing from related company | | 5,114 | | (5,114 | ) | (5,114 | ) | — | | — | | — | | — | | — | | — | | — | | — | | — | |
Bonds | | 7,286 | | (8,982 | ) | (190 | ) | (243 | ) | (243 | ) | (243 | ) | (243 | ) | (1,847 | ) | (2,404 | ) | (1,861 | ) | (1,708 | ) | — | |
Trade payables | | 2,341 | | (2,341 | ) | (2,341 | ) | — | | — | | — | | — | | — | | — | | — | | — | | — | |
Other financial liabilities included in Other payable and Other liabilities | | 559 | | (559 | ) | (198 | ) | (220 | ) | (10 | ) | (11 | ) | (3 | ) | (3 | ) | (4 | ) | (5 | ) | (5 | ) | (100 | ) |
| | | | | | | | | | | | | | | | | | | | | | | | | |
Net derivative financial liabilities | | 57 | | | | | | | | | | | | | | | | | | | | | | | |
Outflows | | | | (1,992 | ) | (46 | ) | (60 | ) | (59 | ) | (58 | ) | (1,769 | ) | — | | — | | — | | — | | — | |
Inflows | | | | 2,081 | | 59 | | 83 | | 83 | | 83 | | 1,773 | | — | | — | | — | | — | | — | |
Total | | 18,327 | | (20,182 | ) | (7,891 | ) | (501 | ) | (740 | ) | (881 | ) | (2,232 | ) | (1,850 | ) | (2,408 | ) | (1,866 | ) | (1,713 | ) | (100 | ) |
36
(millions of euro) | | Carrying amount
at December 31,
2016
(unaudited) | | Total
Contractual cash
flows | | 2017 | | 2018 | | 2019 | | 2020 | | 2021 | | 2022/
2035 | |
Non-derivative financial liabilities | | | | | | | | | | | | | | | | | |
Bank loans | | 686 | | (795 | ) | (30 | ) | (30 | ) | (735 | ) | — | | — | | — | |
Financing from related company | | 5,114 | | (5,114 | ) | (5,114 | ) | — | | — | | — | | — | | — | |
Bonds | | 10,453 | | (12,795 | ) | (583 | ) | (583 | ) | (730 | ) | (6,328 | ) | (4,571 | ) | — | |
Trade payables | | 2,271 | | (2,271 | ) | (2,271 | ) | — | | — | | — | | — | | — | |
Other financial liabilities included in Other payable and Other liabilities | | 128 | | (128 | ) | (1 | ) | (1 | ) | (2 | ) | (2 | ) | (2 | ) | (120 | ) |
| | | | | | | | | | | | | | | | | |
Net derivative financial liabilities | | (1,031 | ) | | | | | | | | | | | | | | |
Outflows | | | | (4,751 | ) | (215 | ) | (208 | ) | (208 | ) | (2,029 | ) | (2,091 | ) | — | |
Inflows | | | | 6,333 | | 315 | | 315 | | 315 | | 2,628 | | 2,760 | | — | |
Total | | 17,621 | | (19,521 | ) | (7,899 | ) | (507 | ) | (1,360 | ) | (5,731 | ) | (3,904 | ) | (120 | ) |
The Group assessed the concentration of risk with respect to its debt and concluded it to be low based on liquidity in the markets the Group has access to and recent refinancing history. The Group believes that access to sources of funding and to credit lines for working capital management is sufficiently available and the Group’s policy is to diversify the funding sources where possible.
Market Risk Management
The Group’s strategy for managing interest rate and currency risks is aimed at both managing and controlling such financial risks. More specifically, this strategy is aimed at eliminating currency risk and optimizing debt cost wherever possible, taking into account the interests of the Group’s stakeholders.
Managing market risk for the Group refers to financial liabilities from the time they actually arise or from when there is a high probability that they will arise.
More specifically, the following market risks are monitored and managed:
· Cash flow risk - this is the risk that movements in the yield curve could have an impact on the income statement in terms of greater finance expense.
· Fair value risk - this is the risk that movements in the yield curve could have an impact on the fair value of debt.
· Currency risk - this is the risk that the fair value of financial instruments in currencies other than the Euro or their cash flows, or the amounts payable or receivable generated in the ordinary course of operations other than in Euros, could be negatively affected by fluctuations in exchange rates.
The main objectives that the Group intends to reach are: i) to defend the strategic plan scenario from the effects of exposure to currency, interest rate and inflation risks, identifying an optimum combination of the fixed rate, floating rate and inflation components for financial liabilities; ii) to reduce the cost of debt; and iii) to manage derivatives in compliance with the Group’s approved strategies, taking into consideration the different effects that derivative transactions could have on the income statement and the statement of financial position.
Cash Flow Risk and Currency Risk
Following the renegotiation of the financial debt, all the existing derivatives have been repaid and new derivatives linked to the new loans have been renegotiated. Therefore at December 31, 2017 the interest rate risk was hedged
37
to a level of approximately 57%, with a maximum hedge term of less than five years. At December 31, 2017, outstanding derivative contracts for hedging interest rate risk amounted to €3,000 million.
The outstanding balance of the long-term loans (excluding intercompany loans) at December 31, 2017 amounted to €10,325 million (liabilities in foreign currencies are translated at the rates provided in the relevant CCS) with the following fixed to floating ratio at that date.
(millions of euro) | | Outstanding
at 12.31.2017 | | % at
12.31.2017 | |
| | | | | |
At fixed rate | | 8,075 | | 78 | % |
At floating rate | | 2,250 | | 22 | % |
The currency risk resulting from the bonds issued has been fully hedged by cross currency swap transactions having a total notional of USD 2,000 million. These amounts represent only significant assets and liabilities in currency other than euro and thus that suffer a potential foreign exchange risk.
All derivative agreements were entered into at market rates, without any up-front payments or receipts (a zero cost basis) and with a credit margin being applied.
It is estimated that an increase of 100 basis points in the Euro interest rate yield curve (all other variables remaining constant) would lead to an increase in borrowing costs, with regard to the unhedged portion of floating rate debt and the ineffective portion of hedging instruments, of approximately €23 million and in the fair value derivatives of approximately €189 million. Accordingly, the profit/loss for the year, and the net equity could be impacted by a further charge of €211 million.
Fair value hierarchy
IFRS 13 requires financial instruments recognised in the statement of financial position at fair value to be classified on the basis of a hierarchy that reflects the significance of the inputs used in determining fair value. The following levels are used in this hierarchy:
· Level 1 — quoted prices in active markets for the assets or liabilities being measured;
· Level 2 — inputs other than quoted prices included within Level 1 that are observable for the asset or liability, either directly (as prices) or indirectly (derived from prices) in the market;
· Level 3 — inputs that are not based on observable market data.
The following tables provides an analysis of financial assets and liabilities measured at fair value by hierarchy at December 31, 2017 and 2016.
At December 31, 2017
(millions of euro) | | Note | | Level 1 | | Level 2 | | Level 3 | | Total | |
Assets at fair value | | | | | | | | | | | |
Derivative financial instruments | | 17 | | — | | — | | 7 | | 7 | |
Total assets | | | | — | | — | | 7 | | 7 | |
Liabilities at fair value | | | | | | | | | | | |
Derivative financial instruments | | 17 | | — | | 57 | | — | | 57 | |
Total liabilities | | | | — | | 57 | | — | | 57 | |
38
At December 31, 2016 (unaudited)
(millions of euro) | | Note | | Level 1 | | Level 2 | | Level 3 | | Total | |
Assets at fair value | | | | | | | | | | | |
Derivative financial instruments | | 17 | | — | | 1,061 | | 399 | | 1,460 | |
Total assets | | | | — | | 1,061 | | 399 | | 1,460 | |
Liabilities at fair value | | | | | | | | | | | |
Derivative financial instruments | | 17 | | — | | 30 | | — | | 30 | |
Total liabilities | | | | — | | 30 | | — | | 30 | |
In 2017 and 2016 there were no transfers either from Level 1 to Level 2 or vice versa or from Level 3 to other levels or vice versa. For further details regarding the fair value calculation and the level classification reference should be made to note 17.
3 ACQUISITIONS AND DISPOSALS
On July 4, 2017, the whole 10% of the shares of Galata SpA was sold to Cellnex for a total of approximately €88 million.
On July 6, 2017 in order to harmonize and optimize the handling of the activities relating to the administrative-commercial and first level technical assistance supplied to its customer the “Call Center 133” was sold to Comdata company. Following the sold of the business unit, €2 million of Employee benefits, €1 million of Other payables and €1 million of fixed assets were transferred to Comdata.
4 TANGIBLE ASSETS
The following tables set out the changes in Tangible assets at December 31, 2017 and 2016.
(millions of euro) | | Net book
value as at
December 31,
2016
(unaudited) | | Addition | | Depreciation | | (Impairment
losses)/Gains | | Disposals | | Others | | Net book
value as at
December 31, 2017 | |
Land and buildings | | 1 | | — | | — | | — | | — | | — | | 1 | |
Plant and machinery | | 5,503 | | 712 | | (2,738 | ) | — | | (14 | ) | (45 | ) | 3,418 | |
Equipment | | 43 | | 29 | | (20 | ) | — | | — | | 2 | | 54 | |
Other | | 71 | | 10 | | (18 | ) | — | | — | | (7 | ) | 56 | |
Total | | 5,618 | | 751 | | (2,776 | ) | — | | (14 | ) | (50 | ) | 3,529 | |
(millions of euro) | | Net book
value as at
December 31,
2015
(unaudited) | | Incorporation
of WIND | | Addition | | Depreciation | | (Impairment
losses)/Gains | | Disposals | | Net book
value as at
December 31,
2016
(unaudited) | |
Land and buildings | | — | | 1 | | — | | — | | — | | — | | 1 | |
Plant and machinery | | 2,997 | | 2,557 | | 311 | | (361 | ) | 1 | | (2 | ) | 5,503 | |
Equipment | | 40 | | 17 | | 8 | | (22 | ) | — | | — | | 43 | |
Other | | 4 | | 67 | | 3 | | (3 | ) | — | | — | | 71 | |
Total | | 3,041 | | 2,642 | | 322 | | (386 | ) | 1 | | (2 | ) | 5,618 | |
39
In 2016 the main part of the changes are related to the contribution of the former WIND Group following the aforementioned merger by incorporation.
Cost, accumulated impairment losses and accumulated depreciation at December 31, 2017 can be summarized as follows.
| | At December 31, 2017 | |
(millions of euro) | | Cost | | Accumulated
impairment losses | | Accumulated
depreciation | | Net balance | |
Land and buildings | | 1 | | — | | — | | 1 | |
Plant and machinery | | 16,771 | | — | | (13,353 | ) | 3,418 | |
Equipment | | 583 | | — | | (529 | ) | 54 | |
Other | | 525 | | — | | (469 | ) | 56 | |
Total | | 17,880 | | — | | (14,351 | ) | 3,529 | |
Cost, accumulated impairment losses and accumulated depreciation at January 1, 2017 can be summarized as follows.
| | At January 1, 2017 | |
(millions of euro) | | Cost | | Accumulated
impairment losses | | Accumulated
depreciation | | Net balance | |
Land and buildings | | 1 | | — | | — | | 1 | |
Plant and machinery | | 16,315 | | (2 | ) | (10,810 | ) | 5,503 | |
Equipment | | 556 | | — | | (513 | ) | 43 | |
Other | | 522 | | — | | (451 | ) | 71 | |
Total | | 17,394 | | (2 | ) | (11,774 | ) | 5,618 | |
The change in Plant and machinery is mainly related to the effect of the acceleration of the depreciation on part of the network infrastructure (the Group is replacing the old network with a new generation one. The old network will only be used up end of 2019 or early 2020, see note 30 for details) only partially offset by the purchases mainly related to radio links and high frequency equipment for the expansion and consolidation of the mobile access network, exchanges and electronic installations (IT infrastructures and 3G and LTE technologies). At December 31, 2017, transmission equipment, telephone systems and commutation switchboards owned by the Group and having a carrying amount of €97 million (€98 million at December 31, 2016, unaudited) were held by customers for use. Transmission equipment for direct access through “unbundling of the local loop” having a carrying amount of €2 million at December 31, 2017 (€2 million at December 31, 2016, unaudited) was held on deposit by Telecom Italia SpA.
Plant and machinery additionally includes the expenditure incurred to acquire the exclusive rights for the use under IAS 17 of cable and optic fiber for a total of €70 million at December 31, 2017 (€78 million at December 31, 2016, unaudited).
In 2017, “Others” includes a negative amount of €50 million mainly related to the reclassification of the assets that will be transferred to Iliad in the twelve months ending December 31, 2018, under “Assets held for sale”.
40
5 INTANGIBLE ASSETS
The following tables set out the changes in Intangible assets at December 31, 2017 and 2016.
(millions of euro) | | Net book value
as at December
31, 2016
(unaudited) | | Addition | | Amortizations | | (Impairment
losses)/Gains | | Disposals | | Others | | Net book value
as at December
31, 2017 | |
Industrial patents and intellectual property rights | | 316 | | 89 | | (133 | ) | — | | — | | (2 | ) | 270 | |
Concessions, licenses, trademarks and similar rights | | 5,364 | | 81 | | (60 | ) | — | | — | | (190 | ) | 5,195 | |
Other intangible assets | | 718 | | 337 | | (364 | ) | — | | (17 | ) | — | | 674 | |
Goodwill | | 3,603 | | — | | — | | — | | — | | — | | 3,603 | |
Total | | 10,001 | | 507 | | (557 | ) | — | | (17 | ) | (192 | ) | 9,742 | |
(millions of euro) | | Net book value
as at December
31, 2015
(unaudited) | | Incorporation
of WIND | | Addition | | Amortizations | | (Impairment
losses)/Gains | | Others | | Net book value
as at December
31, 2016
(unaudited) | |
Industrial patents and intellectual property rights | | — | | 307 | | 30 | | (21 | ) | — | | — | | 316 | |
Concessions, licenses, trademarks and similar rights | | 3,434 | | 3,620 | | 12 | | (41 | ) | (1,611 | ) | (50 | ) | 5,364 | |
Other intangible assets | | 381 | | 332 | | 251 | | (205 | ) | — | | (41 | ) | 718 | |
Goodwill | | 75 | | 3,603 | | — | | — | | (75 | ) | — | | 3,603 | |
Total | | 3,890 | | 7,862 | | 293 | | (267 | ) | (1,686 | ) | (91 | ) | 10,001 | |
In 2016 the main part of the changes are related to the contribution of the former WIND Group following the aforementioned merger by incorporation.
Cost, accumulated impairment losses and accumulated amortization at December 31, 2017 can be summarized as follows.
| | At December 31, 2017 | |
(millions of euro) | | Cost | | Accumulated
impairment losses | | Accumulated
depreciation | | Net balance | |
Industrial patents and intellectual property rights | | 2,080 | | — | | (1,810 | ) | 270 | |
Concessions, licenses, trademarks and similar rights | | 10,438 | | (1,593 | ) | (3,650 | ) | 5,195 | |
Other intangible assets | | 3,806 | | — | | (3,132 | ) | 674 | |
Goodwill | | 3,684 | | (81 | ) | — | | 3,603 | |
Total | | 20,008 | | (1,674 | ) | (8,592 | ) | 9,742 | |
Cost, accumulated impairment losses and accumulated amortization at January 1, 2017 can be summarized as follows.
41
| | At January 1, 2017 | |
(millions of euro) | | Cost | | Accumulated
impairment losses | | Accumulated
depreciation | | Net balance | |
Industrial patents and intellectual property rights | | 2,004 | | — | | (1,688 | ) | 316 | |
Concessions, licenses, trademarks and similar rights | | 10,766 | | (1,611 | ) | (3,791 | ) | 5,364 | |
Other intangible assets | | 3,568 | | — | | (2,850 | ) | 718 | |
Goodwill | | 3,684 | | (81 | ) | — | | 3,603 | |
Total | | 20,022 | | (1,692 | ) | (8,329 | ) | 10,001 | |
Industrial patents and intellectual property rights consist of the cost for the outright purchase of application software licenses or the right to use such licenses for an unlimited period and the capitalized costs relating to the time spent by Group personnel in designing, developing and implementing information systems, which at December 31, 2017 amounted to €27 million.
Concessions, licenses, trademarks and similar rights include individual licenses for the installation of networks and concessions to operate in the regulated activities of the telecommunications sector granted to the Group’s companies by the relevant authorities, as detailed below.
Individual Licenses or General Authorizations or Use of Frequencies | | Date of issue | | Date of expiry (1) | |
Wind Tre Group | | | | | |
| | | | | |
Installation of network and provision of voice telephony services on the Italian national territory (2) | | February 1998 | | February 2018 | |
| | | | | |
Installation and provision of public telecommunications networks on the Italian national territory (2) | | April 1998 | | April 2018 | |
| | | | | |
Provision of public digital mobile communications services using DCS 1800 technology, including the possibility of operating in frequencies in the 900 MHz band using GSM technology on the Italian national territory | | June 1998 | | December 2029 | (3) |
| | | | | |
Provision of third generation mobile communications services adopting the UMTS standard (IMT-2000 family) and the installation of the related network on the Italian national territory (4) | | January 2001 | | December 2029 | (5) |
| | | | | |
Use of frequencies for broadband point-multipoint radio networks in the 24.5-26.5 GHz band for the geographical area corresponding to the specified Italian region/autonomous province (6) | | July 2002 | | July 2022 | |
| | | | | |
Use of frequencies for providing terrestrial publicly available broadband mobile services in the 800, 1800 and 2600 MHz bands (LTE technology) (7) | | January 2012 | | December 2029 | |
(1) Under the current rules, individual licenses are subject to renewal upon request be submitted at least sixty days before the deadline (art.25 paragraph 6, of Legislative Decree no. 259/03) or application for extension.
(2) The Group is the assignee of additional licenses valid for the installation of the network and provision of fixed telephony services also following the previous merger of Infostrada SpA in WIND Telecomunicazioni SpA and the merger of WIND Telecomunicazioni SpA in H3G SpA. In December 2017, Wind Tre filed with MISE an application to renew for a further 20 years the individual Fixed Licenses previously granted to Infostrada and WIND Telecomunicazioni, expiring in 2018. On January 12, 2018 Wind Tre obtained from MISE the renewal of the licenses.
(3) In accordance with art. 1, paragraphs 568 to 575, of Law no. 232 of December 11, 2016 and art. 25, paragraph 6, of Legislative Decree no. 259/03 and subsequent amendments a refarming application was submitted on February 15, 2017 to the MISE with effect from July 1, 2017 and the relative extension until 2029 of the right to use the 900 and 1800 MHz frequencies having an original expiry date of June 30, 2018. Moreover, Wind Tre has already paid the contribution due according to Ministry Decree of 26 July 2017. Wind Tre is currently awaiting the relevant interministerial decree which concludes the proceedings referred to in the aforementioned Law.
(4) The Group is the assignee of two valid individual licenses and the related rights of use of frequencies in the 2100 MHz band, already issued to WIND Telecomunicazioni SpA and H3G SpA respectively with effect from 1 January 2002.
(5) The extension to 2029 is subject to compliance with the provisions of Ministry of Economic Development with order issued in October 2016, and to the payment of the contributions due for the years 2022 to 2029 pursuant to art. 35 of the Electronic Communications Code pursuant to Legislative Decree no. 259/03 and subsequent amendments.
(6) Overall 21 multiple point individual licenses have been allocated.
(7) Following the participation respectively by WIND Telecomunicazioni SpA and H3G SpA to tender for the allocation of rights to use frequencies in the bands 800, 1800, 2000 and 2600 MHz for terrestrial services to the public at large electronic communication band, published in the OJ of the Italian Republic no. 75 of 27 June 2011, the Group holds the rights to use frequencies in the bands 800, 1800 and 2600 (FDD and TDD) MHz, respectively, issued in January and February 2012. It also holds the rights of use on a national basis of a coupled block of 2x5 MHz in the 1800 MHz band following the exercise of subscription rights on the preferential allocation of these frequencies, by order of allocation of 12 April 2012 having effect from 1 June 2012 and expiring on 31 December 2029.
42
On September 22, 2017, the Italian Ministry of the Economic Development (MISE) formalized the award to Wind Tre and Open Fiber S.p.A. of a provisional authorization, for a four year duration, to carry out the 5G pre-commercial trials in the spectrum portion 3.6 — 3.8 GHz in area 2 — Prato and L’Aquila.
In addition, Concessions, licenses, trademarks and similar rights includes €1,300 million related to trademarks, which have an indefinite useful life.
In 2016, Concessions, licenses, trademarks and similar rights includes the impairment, amounting to €1,611 million (unaudited), of the licenses as a result of the “DVB” license, whose value was written down during 2016 by €93 million (unaudited) and the agreements signed with Iliad amounting to €1,518 (unaudited). As the agreements with Iliad define a specific price for these licenses the impairment test was based on specific considerations connected to these instead of at the UMTS / LTE cash-generating unit level as described for the other licenses in the following paragraphs.
Similar rights consist of rights of way and the right to use assets owned by third parties for a predetermined period of time and are initially recognized at their one-off purchase price, including any accessory costs. This item relates for the most part to the right of way on the Italian railway network and the purchase of the right to use the existing optic fiber on the network with a net value of €124 million at December 31, 2017 and to the backbone rights of way of TERNA/TELAT with a net value of €106 million at December 31, 2017.
Other intangible assets mainly relate to the residual value of the capitalized customer acquisition cost amounting to €222 million and to the customer list amounting to €158 million.
Goodwill pertains to the legal entity WIND Retail Srl for €23 million and to the subsidiary Wind Tre for €3,580 million, both of which are, however, part of a single Cash Generating Unit for the purposes of IAS 36.
In 2017, “Others” includes a negative amount of €191 million related to the reclassification of the assets that will be transferred to Iliad in the twelve months ending December 31, 2018, under “Assets held for sale”.
The carrying amount of goodwill, equal to €3,603 million, and of intangible assets with indefinite useful lives (licenses and trademarks), equal to €4,734 million, at December 31, 2017 were tested for impairment.
In particular, the test was performed by comparing the carrying amount with the recoverable amount, which is calculated by estimating the value-in-use using discounted cash flow methods. The test was carried out at the cash-generating unit level. The Group identified one cash-generating unit which comprises the entire fixed and mobile telephone business and to which the whole goodwill was allocated.
Judgment is required in assessing impairment, particularly in determining appropriate values or ranges for the key assumptions to be applied in preparing cash flow projections, including an appropriate discount rate. Changing the assumptions used, including the discount rates or the growth rate, could materially affect the net present value used in the impairment test.
The key assumptions reflected in the cash flow projections, are prepared based on the Group’s Business Plan (from 2018 to 2022) and reflect past-experience then adjusted with market expectations as determined also with the support of external consultants:
· market share and the associated growth in customer numbers;
· the uptake by customers of innovative services, including digital platform take-up;
· the cost of acquiring and / or retaining customers on appropriate tariffs;
43
· technological developments and the capital investment associated with these;
· the impact of competitor and regulatory activity on the sector and the Company; and
· the discount rate.
The future cash flow projections reflect stability or decreasing recurring revenue, also considering the impact of the Iliad entrance in the Italian market and the effect of the improvement in EBITDA due to the significant synergies expected and partially achieved from the target organization of the Wind Tre Group. The projections cover a 5 year period followed by an assumption of steady growth of 1%, slightly below the expected inflation rate in the long term for Italy.
The main assumptions underlying expected cash flows in the period of five years are:
· Mobile consumer market share is penalized by fourth player entrance;
· Mobile consumer ARPU is negatively affected by the aggressive pricing policy of the new entrant;
· Fixed consumer market share grows thanks to better fiber availability;
· Fixed consumer ARPU benefits from a new technology mix, more favorable to premium fiber’s product development;
· Business segment revenues grow thanks to a higher penetration in the SME segment, which has been historically under-exploited by both brands;
· Network and IT consolidation and modernization to reduce total OpEx and CapEx;
· Deep digital transformation to simplify product portfolio and to reduce the customer acquisition costs and the cost-to-serve.
The Group used a post-tax risk adjusted discount rate of 6.5% (equivalent to an 8.2% pre-tax rate) for the impairment test undertaken at December 31, 2017. CAPEX / Revenue ratio in the terminal value is equal to 15%. The impairment exercise shows an headroom equal to about 45% of the carrying amount.
The discount rate applied to future cash flows and the main variables of the plan have been subjected to sensitivity analyses in order to examine potential impacts on impairment tests. In particular, breakeven sensitivity analyses were conducted on the following variables impacting different business drivers:
· Mobile ARPU B2C and B2B;
· Gross Activations for Mobile B2C and B2B;
· Churn rate for Mobile and Fixed.
For each of these parameters the change needed for the cash flows to reach breakeven was calculated and the sensitivity analysis did not identify any significant risks of impairment.
A sensitivity analysis was also carried out by simulating adjusted cash flows to calculate the breakeven scenarios for changes in the discount rate, long-term growth rate or capex/revenue ratio in perpetuity. A reasonably possible change in a key assumption would not cause the carrying value to exceed its recoverable amount.
44
6 FINANCIAL ASSETS
The following table sets out Financial assets at December 31, 2017 and 2016.
| | At December 31, 2017 | | At December 31, 2016 (unaudited) | |
(millions of euro) | | Non-current | | Current | | Total | | Non-current | | Current | | Total | |
Financial assets measured at cost | | 2 | | — | | 2 | | 2 | | — | | 2 | |
Derivative financial instruments | | 7 | | — | | 7 | | 1,460 | | — | | 1,460 | |
Financial receivables | | — | | 4 | | 4 | | 5 | | 3 | | 8 | |
Total | | 9 | | 4 | | 13 | | 1,467 | | 3 | | 1,470 | |
Financial assets measured at cost consist of non-controlling interests in companies and consortia for €2 million and mainly refer to an investment of 17% in Janna Scarl, in which the Sardinia region participates, owner of the submarine cables that connect it with the rest of Italy.
Derivative financial instruments include the positive fair value of embedded derivatives on bond issued amounting to €7 million. Change is related to the extinguishment of the old financial structure finalized on November 3, 2017. Additional details on the composition of the balance and respective changes can be found in note 17.
Financial receivables, amounting to €4 million at December 31, 2017, are composed by guarantee deposits.
The following table sets out the due dates for financial receivables:
(millions of euro) | | At December 31, 2017 | | At December 31, 2016 (unaudited) | |
Financial receivables | | <1 year | | 1<x<5 years | | >5 years | | Total | | <1 year | | 1<x<5 years | | >5 years | | Total | |
Receivables due from Group companies | | — | | — | | — | | — | | — | | — | | — | | — | |
Others | | 4 | | — | | — | | 4 | | 3 | | 5 | | — | | 8 | |
Total | | 4 | | — | | — | | 4 | | 3 | | 5 | | — | | 8 | |
The fair value is approximately the same as the carrying amount for Financial assets at December 31, 2017 and 2016.
7 INVESTMENTS ACCOUNTED FOR USING THE EQUITY METHOD
The item at December 31, 2017 shows a balance equal to zero compared to €77 million in the previous year (unaudited). Change is related to the sale by the subsidiary Wind Tre of the 10% holding in Galata SpA finalized on July 4, 2017, for which details see note 3.
8 DEFERRED TAX ASSETS AND LIABILITIES
The following tables provide changes in Deferred tax assets and Deferred tax liabilities by nature for the year ended December 31, 2017.
45
(millions of euro) | | At December
31, 2016
(unaudited) | | Decrease | | Increase | | At December
31, 2017 | |
Measurement of financial assets/liabilities | | 125 | | (125 | ) | 11 | | 11 | |
Allowance for doubtful accounts (taxed) | | 114 | | — | | 1 | | 115 | |
Provisions for risks and charges (taxed) | | 58 | | (31 | ) | — | | 27 | |
Amortization and depreciation of non-current assets | | 53 | | — | | 155 | | 208 | |
Losses carryforward considered for offsetting purposes | | 60 | | (60 | ) | 186 | | 186 | |
Deferred tax assets | | 410 | | (216 | ) | 353 | | 547 | |
(millions of euro) | | At December
31, 2016
(unaudited) | | Decrease | | Increase | | At December
31, 2017 | |
Others | | 6 | | (2 | ) | — | | 4 | |
Difference between tax and carrying values of tangible assets and intangible assets | | 141 | | — | | 128 | | 269 | |
Depreciation of assets measured at fair value in past PPA | | 506 | | (58 | ) | — | | 448 | |
Deferred tax liabilities | | 653 | | (60 | ) | 128 | | 721 | |
(millions of euro) | | At December
31,
2015
(unaudited) | | Incorporation of
WIND | | Decrease | | Increase | | At December
31,
2016
(unaudited) | |
Measurement of financial assets/liabilities | | — | | 115 | | — | | 10 | | 125 | |
Allowance for doubtful accounts (taxed) | | — | | 53 | | — | | 61 | | 114 | * |
Provisions for risks and charges (taxed) | | — | | 21 | | — | | 37 | | 58 | * |
Amortization and depreciation of non-current assets | | — | | 44 | | — | | 9 | | 53 | * |
Losses carryforward for offset | | — | | — | | — | | 60 | | 60 | * |
Deferred tax assets | | — | | 233 | | — | | 177 | | 410 | |
(millions of euro) | | At December
31,
2015
(unaudited) | | Incorporation
of WIND | | Decrease | | Increase | | At December
31,
2016
(unaudited) | |
Others | | — | | 2 | | — | | 4 | | 6 | |
Difference between tax and carrying values of Property, plant, and equipment and intangible assets | | — | | 27 | | — | | 114 | | 141 | |
Depreciation of assets measured at fair value in past PPA | | — | | 491 | | — | | 15 | | 506 | |
Amortization DVBH Licenses | | 26 | | — | | (26 | ) | — | | — | |
Deferred tax liabilities | | 26 | | 520 | | (26 | ) | 133 | | 653 | |
The net decrease during 2017 of €156 million in deferred taxes is essentially due to the utilization/elimination of the temporary differences of the subsidiary Wind Acquisition Finance SA following the refinancing operation. Deferred tax liabilities at December 31, 2017 are mainly due to temporary differences on balances of fixed assets.
The following amounts, determined after appropriate set-off, are shown in the Consolidated Statement of Financial Position:
(millions of euro) | | At December 31,
2017 | | At December 31,
2016 (unaudited) | |
| | | | | |
Deferred tax assets | | — | | 125 | |
Deferred tax liabilities | | 174 | | 368 | |
46
The following table provides an analysis of Deferred tax assets and Deferred tax liabilities at December 31, 2017 and 2016 between those expected to reverse within 12 months and those expected to reverse after 12 months.
Deferred tax assets
(millions of euro) | | At December 31,
2017 | | At December 31,
2016 (unaudited) | |
| | | | | |
-within 12 months | | — | | 5 | |
-after 12 months | | — | | 120 | |
Total | | — | | 125 | |
Deferred tax liabilities
(millions of euro) | | At December 31,
2017 | | At December 31,
2016 (unaudited) | |
| | | | | |
-within 12 months | | — | | — | |
-after 12 months | | 174 | | 368 | |
Total | | 174 | | 368 | |
Not recognized
Deferred tax assets of €1,703 million (€1,173 million at December 31, 2016, unaudited), of which €691 million (€326 million at December 31, 2016, unaudited) attributable to finance expenses not deductible for the limits established by current legislation, and €1,012 million (€847 million at December 31, 2016, unaudited) attributable to previous years tax losses carried forward, were not recognized on temporary differences that can be carried forward indefinitely due to the lack of reasonable certainty as to their recoverability. These arise from finance expenses of €2,878 million and from previous years tax losses carried forward of €4,220 million. These may be analysed as follows:
(millions of euro) | | December 31,
2017 | | December 31,
2016 (unaudited) | |
Total losses – Italy | | 4,995 | | 4,780 | |
Total losses – Luxembourg | | 1,944 | | 1,911 | |
9 INVENTORIES
The following table provides an analysis of Inventories at December 31, 2017 and 2016.
(millions of euro) | | At December 31,
2017 | | At December 31,
2016 (unaudited) | |
| | | | | |
Finished goods | | 133 | | 76 | |
Write-downs | | (6 | ) | (4 | ) |
Total | | 127 | | 72 | |
“Finished goods” consist principally of mobile phone handsets, kits and the related accessories.
Inventories, which increased by €55 million compared to the previous year, represent a level of inventory adequate to the requests of the distribution network and the satisfaction of the expected requests in the following year.
47
10 TRADE RECEIVABLES
The following table provides an analysis of Trade receivables at December 31, 2017 and 2016:
(millions of euro) | | At December 31,
2017 | | At December 31,
2016 (unaudited) | |
| | | | | |
Due from end customers | | 1,820 | | 1,651 | |
Due from telephone operators | | 150 | | 244 | |
Due from authorized dealers | | 188 | | 187 | |
Due from associates | | — | | 3 | |
Other trade receivables | | 46 | | 66 | |
(Allowance for doubtful accounts) | | (706 | ) | (623 | ) |
Total | | 1,498 | | 1,528 | |
The decrease in Trade receivables as at December 31, 2017, equal to €30 million, is essentially due to a negative change in receivables from telephone operators, in other receivables and in the provision for doubtful accounts, only partially offset by the increase in receivables due from end customers.
Receivables due from end customers arise principally from the supply of fixed and mobile telephony services to customers with subscription contracts and increase mainly for the rise in sales relating to the offer Telefono incluso with brand WIND.
Receivables due from telephone operators mainly relate to interconnection and roaming services.
Receivables due from authorized dealers, essentially in line with 2016, relate to sales of radio mobile and fixed-line handsets and related accessories, as well as rechargeable telephone cards and top-ups.
The following table provides an analysis of trade receivables at December 31, 2017 and 2016, net of the allowance for doubtful accounts, between those falling due within 12 months and those falling due after 12 months.
(millions of euro) | | At December 31,
2017 | | At December 31,
2016 (unaudited) | |
| | | | | |
-within 12 months | | 1,251 | | 1,284 | |
-after 12 months | | 247 | | 244 | |
Total | | 1,498 | | 1,528 | |
The following table sets out the ageing of trade receivables as at December 31, 2017 and 2016.
| | At December 31, 2017 | | At December 31, 2016 (unaudited) | |
(millions of euro) | | Gross balance | | Allowance for
doubtful
accounts | | Gross balance | | Allowance for
doubtful accounts | |
Unexpired | | 1,330 | | (68 | ) | 1,295 | | (125 | ) |
Expired: | | | | | | | | | |
- from 0 – 30 days | | 29 | | — | | 45 | | — | |
- from 31 – 120 days | | 34 | | (1 | ) | 17 | | (1 | ) |
- from 121 – 150 days | | 22 | | (1 | ) | 16 | | (1 | ) |
- beyond 150 days | | 789 | | (636 | ) | 778 | | (496 | ) |
Total | | 2,204 | | (706 | ) | 2,151 | | (623 | ) |
48
The following table sets out changes in the allowance for doubtful accounts during the year ended December 31, 2017 and 2016.
(millions of euro) | | At December 31,
2016
(unaudited) | | Accrual | | (Utilizations) | | Others | | At December 31,
2017 | |
Allowance for doubtful accounts | | 623 | | 197 | | (131 | ) | 17 | | 706 | |
(millions of euro) | | At January 1,
2016
(unaudited) | | Incorporation
of WIND | | Accrual | | (Utilizations) | | At December 31,
2016
(unaudited) | |
Allowance for doubtful accounts | | 255 | | 379 | | 100 | | (111 | ) | 623 | |
The fair value is approximately equal to the carrying amount for Trade receivables at December 31, 2017 and 2016.
11 CURRENT INCOME TAX ASSETS
The item Current tax assets of €30 million at December 31, 2017 (€27 million at December 31, 2016 unaudited) includes €28 million of IRES (corporate tax) and shows no significant change between 2016 and 2017.
12 OTHER RECEIVABLES
The following table sets out details of Other receivables at December 31, 2017 and 2016.
(millions of euro) | | At December 31,
2017 | | At December 31,
2016 (unaudited) | |
Trade prepayments | | 545 | | 148 | |
Other receivables due from third parties | | 55 | | 70 | |
Advances to suppliers | | 35 | | 50 | |
Tax receivables | | 74 | | 8 | |
(Allowance for doubtful accounts) | | (3 | ) | (4 | ) |
Total | | 706 | | 272 | |
The following table provides an analysis of other receivables at December 31, 2017 and 2016, net of the allowance for doubtful accounts, between those falling due within 12 months and those falling due after 12 months.
(millions of euro) | | At December 31,
2017 | | At December 31,
2016 (unaudited) | |
-within 12 months | | 300 | | 236 | |
-after 12 months | | 406 | | 36 | |
Total | | 706 | | 272 | |
Trade prepayments amount to €545 million at December 31, 2017 (€148 million at December 31, 2016) and mainly relate for €394 million to the non-current portion of the charges incurred with the Italian Ministry of the Economic
49
Development, paid in September 2017, for the extension, until 2029, of the frequency right of use with due date in 2018.
Other receivables due from third parties total €55 million at December 31, 2017 (€70 million at December 31, 2016, unaudited) and mostly relate to receivables from non-commercial third parties. The change is mainly due to the decrease in non-trade receivables from TIM.
Tax receivables amounting to €74 million at December 31, 2017 (€8 million at December 31, 2016, unaudited) mainly consist of receivables from the tax authorities for VAT to which the change in the balance is due.
The following table provides an analysis of Tax receivables at December 31, 2017 and 2016.
(millions of euro) | | At December 31,
2017 | | At December 31,
2016 (unaudited) | |
VAT | | 66 | | 6 | |
Other tax receivables | | 8 | | 2 | |
Total | | 74 | | 8 | |
The following table sets out changes in the allowance for doubtful accounts for other receivables for the year ended December 31, 2017.
(millions of euro) | | At December 31,
2016 (unaudited) | | Accrual | | (Utilizations) | | Others | | At December 31,
2017 | |
Allowance for doubtful accounts | | 4 | | — | | — | | (1 | ) | 3 | |
The fair value is approximately the same as the carrying amount for Other receivables at December 31, 2017 and 2016.
The following table sets out changes in the allowance for doubtful accounts for other receivables for the year ended December 31, 2016.
(millions of euro) | | At December 31,
2015 (unaudited) | | Incorporation
of WIND | | Accrual | | (Utilizations) | | At December 31,
2016 (unaudited) | |
Allowance for doubtful accounts | | — | | 3 | | 1 | | — | | 4 | |
13 CASH AND CASH EQUIVALENTS
Cash and cash equivalents at December 31, 2017 amount to €619 million (€633 million at December 31, 2016, unaudited, of which €296 million (unaudited) related to the cash contribution of the former WIND Group following the aforementioned merger by incorporation).
This amount totally related to bank deposits and checks represent the surplus of cash generated by operations, which has mainly risen due to ordinary cash inflows and outflows during the year. For details of the movements please refer to the statement of cash flow.
50
14 ASSETS HELD FOR SALE - LIABILITIES ASSOCIATES TO ASSETS HELD FOR SALE
Assets held for sale at December 31, 2017 amount to €241 million (€50 million at December 31, 2016 unaudited). In July 2017 €50 million related to the previous year were sold.
The item includes €191 million related to the reclassification, from Intangible assets, of the frequencies which are to be transferred to Iliad in the next twelve months and €50 million reclassified from tangible assets, in line with the release plan of the sites connected to the agreements signed with Iliad to allow the entry of the new operator into the Italian telecommunication market.
15 SHAREHOLDERS’ EQUITY
The following table sets out an analysis of Shareholders’ Equity at December 31, 2017 and 2016. The evolution during the year for all reserves is provided in the Statement of changes in consolidated equity.
(millions of euro) | | At December 31,
2017 | | At December 31,
2016 (unaudited) | |
Issued capital | | — | | — | |
Share premium reserve | | 15,413 | | 15,413 | |
Other reserves and retained earnings (accumulated losses) | | (15,573 | ) | (13,848 | ) |
- Cash flow hedge reserve | | (22 | ) | (82 | ) |
- Remeasurement of defined benefit plan | | (11 | ) | (11 | ) |
- Other reserves and retained earnings (accumulated losses) | | (15,540 | ) | (13,755 | ) |
Loss for the year | | (2,678 | ) | (1,785 | ) |
Group’s Equity | | (2,838 | ) | (220 | ) |
Third parties’ Equity | | — | | — | |
Total Equity | | (2,838 | ) | (220 | ) |
Issued capital
As at December 31, 2015 the issued and fully paid share capital amounted to €2,758,939,525 and it was represented by 110,357,581 shares with a nominal value of €25 each.
During 2016 the following transactions occurred:
· Issues of 2 new shares with a nominal value of €25 each;
· Cancellation of 110,308,878 shares and reduction of share capital to €24,352.50 by reducing the nominal value from €25 to €0.50 of the remaining 48,705 shares with a decrease of share capital amounted to €2,758,915,222.50;
· Increase of share capital by €646.50 by issuing 1,293 shares with a nominal value of €0.50 each. The share capital amounted to €24,999;
· Increase of share capital for €1 by issuing 2 shares with a nominal value of €0.50 each;
· Increase of share capital of €25,000 by issuing 50,000 shares with a nominal value of €0.50 each.
51
The shareholders resolve to accept Vimpelcom Luxembourg Holdings S.à r.l. as new shareholder of the Company. The 50,000 new shares were subscribed by the latter company for the price of €25,000 and the shares so subscribed were fully paid-up by a contribution in cash.
At 31 December 2016, the issued and fully paid share capital amounted to € 50,000, being represented by 100,000 shares with a nominal value of € 0.50 each.
No changes occurred in share capital during 2017.
Share premium account
At December 31, 2017, the share premium account of the Company amounted to €15,413 million and did not change compared to the previous year.
At 31 December 2016, the share premium account of the Company was composed as below:
· On 25 October 2016, the Company issued 2 new shares with a nominal value of EUR 25 each, in return for a contribution in kind of a receivable for an amount of EUR 10,057,027,033.99. The difference between the nominal value of the new shares and the contribution, amounted to EUR 10,057,026,983.99, has been booked as share premium.
· On 25 October 2016 the Company decreased the share capital of EUR 2,758,915,222.50; this decrease has been booked as share premium.
· On 26 October 2016, the Company increased its share capital by EUR 646.50 by issuing 1,293 shares with a nominal value of EUR 0.50 each in return for a contribution in cash for an amount of EUR 40,000,000. The difference between the nominal value of the new shares and the contribution, amounted to EUR 39,999,353.50 has been booked as share premium.
· On 5 November 2016, the Company increased its share capital for EUR 1 by issuing 2 shares with a nominal value of EUR 0.50 each in return for a contribution in kind of a receivable in an amount of EUR 2,557,170,834.22. The difference between the nominal value of the new shares and the contribution, amounted to EUR 2,557,170,833.22 has been booked as share premium.
Cash flow hedge reserve
The reserve is negative and amounts to €22 million. It refers to the fair value changes of the derivative financial instruments limited to the effective portion of the hedging relationship.
Legal reserve
In accordance with the Luxembourg company law, the Company is required to transfer a minimum of 5% of its net profit for each financial year to a legal reserve except for the amount which is firstly allocated to losses brought forward. This requirement ceases to be necessary once the legal reserve reaches 10% of the issued share capital. The legal reserve is not available for distribution to shareholders.
52
The following table provides a reconciliation of consolidated net income and shareholders’ equity with those in the Company’s financial statements.
| | Profit (loss) for the year | | Equity as at 31.12 | |
(millions of euro) | | 2017 | | 2016 (unaudited) | | 2017 | | 2016 (unaudited) | |
Equity and Profit (loss) for the year VIP-CKH Luxembourg Sàrl (unaudited) | | 51 | | (81 | ) | 13,520 | | 13,469 | |
Equity and Profit (loss) for the year from consolidated companies net of the share attributable to non-controlling interests | | (2,870 | ) | (1,580 | ) | 5,050 | | 7,860 | |
Consolidation adjustments: | | | | | | | | | |
- elimination of carryng amount of investments | | 141 | | (124 | ) | (21,408 | ) | (21,551 | ) |
- other consolidation adjustments | | | | — | | — | | 2 | |
Equity and Profit (loss) for the year attributable to the Group | | (2,678 | ) | (1,785 | ) | (2,838 | ) | (220 | ) |
Equity and Profit (loss) for the year attributable to non-controlling interests | | — | | — | | — | | — | |
Equity and Profit (loss) for the year as per consolidated financial statements | | (2,678 | ) | (1,785 | ) | (2,838 | ) | (220 | ) |
16 FINANCIAL LIABILITIES
The following table sets out an analysis of Financial liabilities at December 31, 2017 and 2016.
| | At December 31, 2017 | | At December 31,2016
(unaudited) | |
(millions of euro) | | Non-current | | Current | | Non-current | | Current | |
Bond issues | | 7,247 | | 39 | | 10,293 | | 160 | |
Loan from related company | | — | | 5,114 | | — | | 5,114 | |
Bank loans | | 2,960 | | 10 | | 677 | | 9 | |
Derivative financial instruments | | 57 | | — | | 23 | | 7 | |
Total financial liabilities | | 10,264 | | 5,163 | | 10,993 | | 5,290 | |
The following table sets out changes in Financial liabilities for the year ended December 31, 2017 and 2016.
(millions of euro) | | At December 31,
2016 (unaudited) | | New Issue | | (Repaiment) | | Net Interest &
Other Costs | | At December 31,
2017 | |
Bond | | 10,453 | | 7,291 | | (9,326 | ) | (1,132 | ) | 7,286 | |
Loans from related company | | 5,114 | | — | | — | | — | | 5,114 | |
Bank loans | | 686 | | 2,970 | | (712 | ) | 26 | | 2,970 | |
Derivative financial instruments | | 30 | | 57 | | — | | (30 | ) | 57 | |
Total financial liabilities | | 16,283 | | 10,318 | | (10,038 | ) | (1,136 | ) | 15,427 | |
53
The following table sets out an analysis of Financial liabilities at December 31, 2017 and 2016 by due date.
| | At December 31, 2017 | | At December 31, 2016 (unaudited) | |
(millions of euro) | | <1 year | | 1<x<5
years | | >5 years | | Total | | <1 year | | 1<x<5
years | | >5 years | | Total | |
Bond issues | | 39 | | — | | 7,247 | | 7,286 | | 160 | | 10,273 | | 20 | | 10,453 | |
Loan from related company | | 5,114 | | — | | — | | 5,114 | | 5,114 | | — | | — | | 5,114 | |
Bank loans | | 10 | | 2,960 | | — | | 2,970 | | 9 | | 677 | | — | | 686 | |
Derivative financial instruments | | — | | 57 | | — | | 57 | | 7 | | 23 | | — | | 30 | |
Total financial liabilities | | 5,163 | | 3,017 | | 7,247 | | 15,427 | | 5,290 | | 10,973 | | 20 | | 16,283 | |
The following table provides an analysis by effective interest rate and lending currency, excluding derivative financial instruments, intercompany debt and loans at December 31, 2017.
| | At December 31, 2017 | |
(millions of euro) | | <5% | | 5%<x<7.5% | | >7.5% | | Total | |
Euro liabilities | | 8,591 | | — | | — | | 8,591 | |
US dollars denominated liabilities | | — | | 1,665 | | — | | 1,665 | |
Total | | 8,591 | | 1,665 | | — | | 10,256 | |
The following table provides a comparison between the carrying amount and fair value of non-current Financial liabilities at December 31, 2017 and 2016.
| | At December 31, 2017 | | At December 31, 2016 (unaudited) | |
(millions of euro) | | Carrying amount | | Fair value | | Carrying amount | | Fair value | |
Bond issues | | 7,247 | | 7,053 | | 10,293 | | 10,473 | |
Bank loans | | 2,960 | | 2,990 | | 677 | | 692 | |
Derivative financial instruments | | 57 | | 57 | | 23 | | 23 | |
Total | | 10,264 | | 10,100 | | 10,993 | | 11,188 | |
Changes in balances of bonds and bank loans is due to the refinancing transaction.
In order to optimize the capital structure, reduce annual interest costs and extend maturities of the existing debt, on November 3, 2017 the Group completed the refinancing of all the Wind Tre Group’s debt exposure to third parties by issuing €5.6 billion of senior secured notes, $2.0 billion of senior secured notes and by entering into an agreement for a new bank loan of €3.4 billion (including a €400 million revolving credit facility not used at December 31, 2017). The Group used the funds obtained from the transaction: (i) to repay the existing bank loan, (ii) to redeem the senior and senior secured notes issued by the subsidiary Wind Acquisition Finance and (iii) to pay the costs, fees and expenses, including premiums for call options and pre-cancellation costs relating to the above.
More details about terms and conditions of the new issued instruments can be found in the tables in the following paragraphs.
As a guarantee for loans agreements and bond issues the Wind Tre shares and WIND Acquisition Finance SA shares have been pledged.
54
Moreover, as a guarantee in favor of the lenders under the Senior Facility Agreement and in favor of the holders of the notes two bank accounts of Wind Tre have been pledged under Italian law.
An analysis of the derivative financial instruments balance and the respective changes is included in note 17.
Bonds
The following table sets out the main information at December 31, 2017 relating to outstanding Bonds issued by the subsidiary Wind Tre SpA. For further details refer to note 2.5.
(millions of euro) | | Carrying
amount at
December
31, 2017 | | Nominal
amount at
December
31, 2017 | | Issue price | | Currency | | Due date | | Interest
rate | | Price | |
Senior Secured Fixed Rate Notes 2023 € | | 1,619 | | 1,625 | | 100.00 | | EUR | | 01/20/2023 | | 2.625 | % | 97.75 | |
Senior Secured Floating Rate Notes 2024 € | | 2,242 | | 2,250 | | 100.00 | | EUR | | 01/20/2024 | | Euribor 3M + 2.750 | % | 98.25 | |
Senior Secured Fixed Rate Notes 2025 € | | 1,760 | | 1,750 | | 100.00 | | EUR | | 01/20/2025 | | 3.125 | % | 97.25 | |
Senior Secured Fixed Rate Notes 2026 $ | | 1,665 | | 2,000 | | 100.00 | | USD | | 01/20/2026 | | 5.000 | % | 95.50 | |
Total | | 7,286 | | | | | | | | | | | | | |
As required by the Group’s risk management policies, for which details may be found in note 2.5, in order to fully eliminate any currency risks arising from issues denominated in US dollars, the Group has entered hedging arrangements until 2022 based on cross currency swaps for a notional amount of $2,000 million, which at December 31, 2017 had a negative fair value of €53 million.
Loans from related company
The item is related to the loans granted by the related company VIP-CKH Ireland Ltd with an amount of €5,114 million at December 31, 2017. During 2016 the Company has repaid a part of the loan and the remaining amount due to Hutchison Europe Telecommunications S.à r.l. amounted to €15,171 million. On October 25, 2016, the Company received a contribution in kind from the shareholder amounting to €10,057 million. The remaining loans to Hutchison Europe Telecommunications S.à r.l. amounting to €5,114 million, was subsequently novated to VIP-CKH Ireland Limited on November 5, 2016. For more details see note 36.
Bank loans
The following table sets out the main information relating to outstanding Bank loans at December 31, 2017.
(millions of euro) | | Carrying
amount at
December 31,
2017 | | Nominal
amount at
December 31,
2017 | | Residual
commitment | | Currency | | Due date | | Interest rate | |
Senior Facility Agreement | | | | | | | | | | | | | |
Term loan A | | 2,970 | | 3,000 | | 3,000 | | EUR | | 11/03/2022 | | Euribor+2.00 | |
Revolving | | — | | — | | 400 | | EUR | | 11/03/2022 | | Euribor+1.75 | |
Total | | 2,970 | | 3,000 | | 3,400 | | | | | | | |
Bank loans refer to a floating rate long-term loan agreement (the Senior Facility Agreement) entered on October 24, 2017 by Wind Tre, denominated in Euros, with maturity in 2022 and with a total nominal value of €3,000 million to which should be added €400 million of unused revolving credit facilities at December 31, 2017.
With the aim of reducing its bank loan exposure to fluctuations in interest rates the Group has entered transactions which qualify as hedges for a notional amount of €3,000 million (not qualifying for hedge accounting), whose fair value at December 31, 2017, is negative for €4 million. The hedges extend to November 2022 and consist of interest
55
rate swaps.
The Senior Facility Agreement contains financial covenants (“Financial Covenants”) effective starting from January 1, 2018.
17 DERIVATIVE FINANCIAL INSTRUMENTS
The following table provides details of the outstanding Derivative financial instruments at December 31, 2017 and 2016 analyzed by the type of risk hedged.
| | At December 31, 2017 | | At December 31, 2016 (unaudited) | |
(millions of euro) | | Fair Value (+) | | Fair Value (-) | | Fair Value (+) | | Fair Value (-) | |
- Exchange rate risk | | — | | 53 | | 744 | | — | |
- Interest rate risk | | — | | 4 | | — | | 27 | |
Total cash flow hedges | | — | | 57 | | 744 | | 27 | |
| | | | | | | | | |
- Exchange rate risk | | — | | — | | 317 | | — | |
Total fair value hedges | | — | | — | | 317 | | — | |
| | | | | | | | | |
-Embedded derivatives in bonds | | 7 | | — | | 399 | | 3 | |
Total Derivatives Non Hedge Accounting | | 7 | | — | | 399 | | 3 | |
Total | | 7 | | 57 | | 1,460 | | 30 | |
The following table shows the detail of current and non-current derivative instruments.
| | At December 31, 2017 | | At December 31, 2016 (unaudited) | |
(millions of euro) | | Fair Value (+) | | Fair Value (-) | | Fair Value (+) | | Fair Value (-) | |
Current | | — | | — | | — | | 7 | |
Non current | | 7 | | 57 | | 1,460 | | 23 | |
Total | | 7 | | 57 | | 1,460 | | 30 | |
At December 31, 2017 the Group used cash flow hedge accounting to hedge the risk on future foreign currency cash flows and floating interest rate cash flows.
The fair value of financial instruments listed on active markets is determined as the market quotation at the reporting date. In the absence of an active market, which is the case for the above instruments, fair value was determined by referring to prices and data provided by external operators and using valuation models based mostly on objective financial variables, as well as by taking into account, where possible, the prices used in recent transactions and the quotations of similar financial instruments.
The following were outstanding at December 31, 2017:
· cross currency swaps hedging the interest rate and currency risks relating to the tranches of bonds denominated in US dollars, for which reference should be made to note 16, having a notional amount of $2,000 and having a negative fair value of €53 million;
· interest rate swaps hedging the interest rate risk of bank loans, having a notional amount of €3,000 million and a negative fair value of €4 million;
· embedded derivatives of €7 million relating to the fair value of the early repayment options provided for on issue of the bonds, for which details may be found in note 16.
The fair value of cross currency swap and interest rate swaps is determined through directly observable inputs such as interest rates curves (Level 2 in the fair value hierarchy).
56
The fair value of embedded derivatives is determined by comparing the fair value of the total bond with the fair value of comparable bonds that do not incorporate this option.
The following tables provide an analysis of financial assets and liabilities measured at fair value by hierarchy at December 31, 2017 and at December 31, 2016.
At December 31, 2017
(millions of euro) | | Level 1 | | Level 2 | | Level 3 | | Total | |
Assets at fair value | | | | | | | | | |
Derivative financial instruments | | — | | — | | 7 | | 7 | |
Total assets | | — | | — | | 7 | | 7 | |
Liabilities at fair value | | | | | | | | | |
Derivative financial instruments | | — | | 57 | | — | | 57 | |
Total liabilities | | — | | 57 | | — | | 57 | |
At December 31, 2016 (unaudited)
(millions of euro) | | Level 1 | | Level 2 | | Level 3 | | Total | |
Assets at fair value | | | | | | | | | |
Derivative financial instruments | | — | | 1,061 | | 399 | | 1,460 | |
Total assets | | — | | 1,061 | | 399 | | 1,460 | |
Liabilities at fair value | | | | | | | | | |
Derivative financial instruments | | — | | 30 | | — | | 30 | |
Total liabilities | | — | | 30 | | — | | 30 | |
Level 3 includes the embedded derivative fair value on loans and relates to the early repayment option while Level 2 includes the fair value of other derivatives. In 2017 there were no transfers either from Level 1 to Level 2 or vice versa or from Level 3 to other levels or vice versa.
The following table summarizes the movements in level 3 fair value embedded options:
(millions of euro) | | At December
31, 2016
(unaudited) | | Change in FV
reported in
income
statement
(a) | | Settlement /
extinguishment
reported in
income
statement (b) | | Change in FV
reported in
other
comprehensive
income | | Purchase
(new)
(c) | | At December
31, 2017 | |
Fair value of embedded repayment options | | 399 | | (52 | ) | (357 | ) | — | | 17 | | 7 | |
Total | | 399 | | (52 | ) | (357 | ) | — | | 17 | | 7 | |
(a) movement in mark to market of fair value of embedded options
(b) exercise of early repayment options on November 3, 2017 and extinguishment of embedded derivatives options on old bonds
(c) measurement at inception of fair value of new early repayment options embedded in some of the new bonds issued on October24, 2017
It should also be noted that at December 31, 2017 there are no additional financial instruments measured at fair value other than those indicated in the tables above.
57
18 EMPLOYEE BENEFITS
The following table sets out the changes in Employee benefits at December 31, 2017 and 2016.
(millions of euro) | | At December 31,
2016 (unaudited) | | Accrual | | (Utilization) | | Other changes | | At December 31,
2017 | |
Post-employment benefits | | 79 | | 22 | | (10 | ) | (24 | ) | 67 | |
(millions of euro) | | At December 31,
2015 (unaudited) | | Incorporation
of WIND | | Accrual | | (Utilization) | | Other changes | | At December 31,
2016 (unaudited) | |
Post-employment benefits | | 17 | | 64 | | 20 | | (4 | ) | (18 | ) | 79 | |
At December 31, 2017, other changes consist of i) the decrease arising from the transfer of the post-employment benefits accruing during the year to supplementary pension funds or to the Treasury fund held by the Italian social security organization INPS (€22 million), ii) the decrease of €0.4 million in the post-employment benefits arising from the change in actuarial variables.
The effects recognized in profit or loss are as follows.
(millions of euro) | | At December 31,
2017 | | At December 31,
2016 (unaudited) | |
Current service costs | | 22 | | 12 | |
Finance expense | | 1 | | 1 | |
Total | | 23 | | 13 | |
Actual return on plan assets | | N/A | | N/A | |
Current service costs only include the expenses relating to defined contribution benefits.
The severance indemnities (“TFR”) due to employees pursuant to article 2120 of the Italian Civil Code is calculated on the basis of the service provided and the taxable remuneration of each employee and is paid when the employee leaves the company. The liability, which is revalued annually based on the official cost of living and the legal interest rate, is not associated with any condition or accrual period or any requirement to obtain funds, as a result of which there are no plan assets. The original Italian legislation was supplemented by Legislative Decree no. 252/2005 and the 2007 Finance Act (296/2006) under which for companies with at least 50 employees the employee can choose to allocate his TFR, starting from amounts accruing in 2007, either to a fund held by INPS or to a supplementary pension fund, and accordingly the scheme has the nature of a defined contribution plan. The portion accrued through December 31, 2006 is considered to be a defined benefit plan and as a result, under IAS 19, the relative liability must be projected into the future to calculate the expected amount to be paid on termination of employment; this is then discounted using the “projected unit credit method”.
Through its defined benefit obligation the Group is exposed to a number of risks, the most significant of which are detailed below.
· Interest rate risk. The present value of the defined benefit plan liability is calculated using a discount rate determined by reference to actuarial calculation. A decrease in those yields will increase plan liabilities.
· Life and employee service expectancy. The present value of the defined benefit plan liability is calculated by reference to the best estimate of life and employee service expectancy. An increase in life or employee service expectancy of the plan’s participants will increase the plan’s liability.
58
The main actuarial assumptions applied in the calculation of severance pay are as follows.
Demographic assumptions:
The following annual rates for resignation or redundancy were used for each employee category:
Qualification | | Resignation | | Redundancy | |
Management | | 14.5 | % | 12.2 | % |
Middle management | | 3.1 | % | 13.2 | % |
Staff | | 3.1 | % | 13.2 | % |
Economic-financial assumptions:
Average inflation rate | | Discount rate | | Increase in wages and salaries | |
1.50 | % | 1.50 | % | N/A | |
The average duration of the financial obligation is 14.90 years.
The application of the above assumptions resulted in a TFR liability at December 31, 2017 of €67 million and an actuarial loss of €0.7 million recognized in comprehensive income.
The table below provides a sensitivity analysis based on only varying the discount rate and the “basic” inflation rate (equal to 1.50%) by +/- 0.25%:
Change in discount rate | | Change in millions of euro | |
+0.25% | | (1.4 | ) |
-0.25% | | 1.4 | |
Change in inflation rate | | Change in millions of euro | |
+0.25% | | 0.9 | |
-0.25% | | (0.9 | ) |
19 PROVISIONS
The following table sets out changes in Provisions for risks and charges for the year ended December 31, 2017 and 2016.
(millions of euro) | | At December 31,
2016
(unaudited) | | Increases | | (Utilization) | | (Release) | | At December 31,
2017 | |
Litigation | | 41 | | 17 | | (12 | ) | (1 | ) | 45 | |
Universal service contribution | | 5 | | — | | — | | — | | 5 | |
Handset assistance | | 1 | | 1 | | (1 | ) | — | | 1 | |
Dismantling and removal | | 30 | | 67 | | (1 | ) | — | | 96 | |
Other provisions | | 63 | | 9 | | (11 | ) | — | | 61 | |
Total | | 140 | | 94 | | (25 | ) | (1 | ) | 208 | |
Current | | — | | | | | | | | 13 | |
Non current | | 140 | | | | | | | | 195 | |
The timing of payments in respect of non-current provisions is, with few exceptions, not contractually fixed and cannot be estimated with certainty.
59
(millions of euro) | | At December 31,
2015 (unaudited) | | Incorporation
of WIND | | Increases | | (Utilization) | | At December 31,
2016 (unaudited) | |
Litigation | | 16 | | 30 | | 14 | | (4 | ) | 56 | |
Universal service contribution | | — | | 5 | | — | | — | | 5 | |
Handset assistance | | — | | 1 | | — | | — | | 1 | |
Dismantling and removal | | 7 | | 23 | | — | | — | | 30 | |
Other provisions | | 17 | | 31 | | 5 | | (5 | ) | 48 | |
Total | | 40 | | 90 | | 19 | | (9 | ) | 140 | |
Litigation
The provision at the respective dates is based on estimates using the best information available of the total charge that the Group expects to incur upon settlement of all outstanding legal proceedings (for details on the main proceedings in progress, reference should be made to the paragraph on the contingent assets and liabilities in note 38).
Universal service contribution
Article 3, paragraph 6, of Presidential Decree no. 318 of September 19, 1997 regarding the “Implementation of European Union Directives” establishes a mechanism designed to distribute the net cost of providing the universal service throughout the country whenever the related obligations represent an unfair cost for the entity or entities assigned the responsibility for supplying the service.
Handset assistance
The provision represents an estimate of the costs that the Group may incur for assistance for handsets sold under warranty.
Dismantling and removal
The item consists of the estimate of the dismantling, restoration and removal costs which may be incurred as a result of contractual obligations which require the asset to be returned to its original state and condition. The increase, equal to €67 million, is due to the update of the estimate of the provision in 2017 following the definition of the plan for the optimization and construction of the new generation integrated network and execution of the agreements with Iliad. The current portion amounting to €13 million is reclassified to other payables.
Other provisions
This item consists of the measurement of certain liabilities arising from obligations assumed by the Group for which an estimate is made at the date of these financial statements of the amount to be settled upon due date. The balance at December 31, 2017 includes €32 million, for liabilities for termination benefits arising from agency contracts in existence at the reporting date and €2 million, relating to compensation plans for the long-term retention and incentive of management.
60
20 OTHER LIABILITIES
Other liabilities at December 31, 2017 and 2016 (unaudited), amount to €418 million and €238 million respectively. At December 31, 2017 this item mainly includes:
· an amount of €209 million for the payable over 12 months linked to the anticipation of future flows deriving from the sale of licenses to the French telephone operator Iliad, for which detail see note 14;
· an amount of €126 million relating to the debt with TERNA for the capitalization of backbone rights. For the purposes of a better representation consistent with the nature of the existing relationship, this debt recorded under “Financial liabilities” at December 31, 2016, has also been reclassified for comparative purposes;
· an amount of €49 million for the residual value of capital grants, both public and private, recognized in previous years for specific equipment replacement operations, the creation of new networks according to specific criteria and investments to support the development of certain areas. The amount will be released to the income statement over the useful life of the related assets;
· an amount of €25 million relating to software Supplier as established in the Software License and Support Services Agreement made as of April, 2017.
The fair value is approximately equal to the carrying amount for Terna and Iliad liabilities (which are financial under IAS 32 definition) at December 31, 2017 and 2016.
21 TRADE PAYABLES
The following table provides details of Trade payables at December 31, 2017 and 2016.
(millions of euro) | | At December 31,
2017 | | At December 31,
2016 (unaudited) | |
Due to telephone operators | | 445 | | 480 | |
Due to agents and authorized dealers | | 105 | | 130 | |
Due to parents | | — | | 12 | |
Due to associates | | — | | 21 | |
Due to related companies | | 24 | | 22 | |
Other trade payables | | 1,767 | | 1,606 | |
Total | | 2,341 | | 2,271 | |
The change in this item is principally due to the effect of normal settlements during the course of the year.
Trade payables due to telephone operators mainly relate to interconnection and roaming services.
Payables due to agents and due to authorized dealers relate to commissions to agents and authorized dealers.
Trade payables due to related companies refers principally to payables arising from transactions with telephone operators belonging to the VEON Group.
Amounts due to associates mainly referred, in 2016, to balances payable to Galata SpA arising from the service agreement entered into as part of the agreement with Cellnex Telecom.
Other trade payables mainly relate to payables to suppliers for the purchase of goods and services.
61
At December 31, 2017 and 2016 the item is entirely composed by current trade payables. The fair value is approximately equal to the carrying amount for Trade Payables at December 31, 2017 and 2016.
22 OTHER PAYABLES
The following table provides an analysis of Other payables at December 31, 2017 and 2016.
(millions of euro) | | At December 31,
2017 | | At December 31,
2016 (unaudited) | |
Payables to social security organizations | | 26 | | 34 | |
Tax payables | | 41 | | 91 | |
Payables to personnel | | 57 | | 61 | |
Prepaid traffic to be used | | 137 | | 134 | |
Deferred income | | 151 | | 149 | |
Other payables | | 275 | | 188 | |
Total | | 687 | | 657 | |
The following table provides an analysis by due date.
(millions of euro) | | At December 31,
2017 | | At December 31,
2016 (unaudited) | |
-within 12 months | | 687 | | 656 | |
-after 12 months | | — | | 1 | |
Total | | 687 | | 657 | |
Payables to social security organizations relate principally to the employer’s and employee’s portions of social security contributions for December and the employer’s portion accrued on deferred remuneration (mostly accrued vacation and other permitted leave that has accrued but has not yet been taken). This item also includes the amounts payable to the Italian social security organization INPS for the accrued post-employment benefits (TFR) yet to be paid which employees had elected to transfer to the Treasury fund in accordance with Law no. 296 of December 27, 2006, the “2007 Finance Act”, and subsequent decrees and regulations.
The following table sets out details of Tax payables at December 31, 2017 and 2016.
(millions of euro) | | At December 31,
2017 | | At December 31,
2016 (unaudited) | |
Government license fee | | 23 | | 31 | |
Withholding tax | | 16 | | 21 | |
VAT | | — | | 25 | |
Other | | 2 | | 14 | |
Total | | 41 | | 91 | |
Payables to personnel amounting to €57 million (€61 million at December 31, 2016, unaudited) mostly consist of liabilities for accrued vacation and other accrued leave still to be taken at the end of the year.
62
Prepaid traffic to be used amounting to €137 million (€134 million at December 31, 2016, unaudited) consists of the unused portion of prepaid traffic, sold by the Group companies via rechargeable telephone cards and top-ups, which had not yet been utilized at the end of the year.
Deferred income refers to income for billings made contractually in advance in prior years and in 2017 for lease and installation fees relating to the utilization of broadband capacity (‘initial capacity’), which will be recognized in later years.
Other payables mainly consist of the debt within 12 months linked to the anticipation of future flows deriving from the sale of licenses to the French telephone operator Iliad (€191 million), which is financial under IAS 32 definition and for which details see notes 14 and 20, supplementary pension funds (€1 million), amounts payable for bank commissions and guarantee deposits received from customers (€9 million), liabilities for amounts received in respect of receivables sold (€3 million), current portion of dismantling provision (€5 million) and other residual items (€66 million).
The fair value is approximately equal to the carrying amount for Other payables at December 31, 2017 and 2016.
23 INCOME TAX PAYABLES
The balance of €21 million at December 31, 2017 (€57 million at December 31, 2016 unaudited) represents the amount due by the consolidated companies for income taxes for the year.
24 REVENUE AND SEGMENT REPORTING
Segment Reporting
The Board of Directors of Wind Tre SpA, consisting of the chief executive officer, the chief financial and officer, examines the Group’s performance mainly from geographic perspective and has identified one reportable segment of its business.
The Board of Directors of Wind Tre SpA primarily uses a measure of “Operating income before depreciation and amortization, reversal of impairment losses/impairment losses on non-current assets and gains/losses on disposal of non-current assets” (EBITDA), of the revenue and tangible assets to assess the performance of the operating segment. Information about segment EBITDA and Revenue are disclosed in “consolidated income statement”, further information related to Revenue is disclosed in Note 24 and information about segment tangible assets are disclosed in note 4.
The information related to the revenue divided by group of services are disclosed in note 24.
All the revenues, non-current assets other than financial instruments, deferred tax assets and post-employment benefit assets are related to the single geographical segment concerning Italy country.
There are no revenue from transactions with a single external customer amount to 10 per cent or more.
63
Revenue
Revenue and all other income statement items are not immediately comparable with those of the same period of the previous year because the latter only reflect the full year’s consolidated results of predecessor 3 Italia Group and approximately two months’ consolidated results of predecessor WIND Acquisition Holdings Finance Group. The following table provides an analysis of Revenue for 2017 and 2016.
(millions of euro) | | 2017
12 months | | 2016
12 months (unaudited) | |
Revenue from sales | | 760 | | 549 | |
| | | | | |
- Telephone services | | 4,522 | | 1,863 | |
- Interconnection traffic | | 495 | | 264 | |
- International roaming | | 83 | | 46 | |
- Judicial authority services | | 6 | | 1 | |
- Other revenue from services | | 157 | | 82 | |
Revenue from services | | 5,263 | | 2,256 | |
Total | | 6,023 | | 2,805 | |
Revenue from sales mainly refers to the sale of mobile telephone handsets and accessories.
The Telephone services mainly refer to revenues from voice fixed and mobile services and internet services mobile data transmission.
Interconnection traffic includes revenue from other telecommunications operators for the termination of traffic to the Company’s customers.
Other revenue from services mainly refer to business spaces, sites and network sublease and revenue from MVNO.
25 OTHER REVENUE
Other revenue amounts in total to €159 million in the year 2017 (€88 million at December 31, 2016 unaudited) and mainly refers to several miscellaneous items including release to income statement of contributions, to penalties, recovery of costs and to the effects deriving from the definition of commercial agreements with some suppliers.
64
26 PURCHASES AND SERVICES
The following table provides an analysis of Purchases and services for 2017 and 2016.
(millions of euro) | | 2017
12 months | | 2016
12 months (unaudited) | |
Purchases of raw materials, consumables, supplies and goods | | 720 | | 503 | |
Interconnection traffic | | 553 | | 282 | |
Rental of local network and circuits | | 378 | | 78 | |
Outsourcing costs for other services | | 371 | | 106 | |
Lease of civil/technical sites and use of third party assets | | 349 | | 221 | |
Customer acquisition costs | | 270 | | 204 | |
Maintenance and repair | | 152 | | 139 | |
Power consumption and other utilities | | 138 | | 62 | |
Advertising and promotional services | | 76 | | 52 | |
National and international roaming | | 64 | | 33 | |
Consultancies and professional services | | 34 | | 18 | |
Change in inventories | | (21 | ) | 3 | |
Other services | | 211 | | 50 | |
Total purchases and services | | 3,295 | | 1,751 | |
The item consultancies and professional services includes statutory auditors’ fees of €288 thousand (€389 thousand at December 31, 2016) and fees for the external audit of the consolidated financial statements amounting to €3,212 thousand (€1,357 thousand at December 31, 2016, unaudited). The item also includes additional audit and audit-related fees connected to specific audit and for the issuance of comfort letter on the bond refinancing transaction amounting to €988 thousand. Fees for other services different from audit and audit-related recognized to the external auditor amount to €565 thousand. No fees are due to the Company’s managers.
27 OTHER OPERATING COSTS
The following table provides an analysis of Other operating costs for 2017 and 2016.
(millions of euro) | | 2017
12 months | | 2016
12 months (unaudited) | |
Impairment losses on trade receivables and current assets | | 196 | | 91 | |
Annual license and frequency fees | | 63 | | 31 | |
Accruals to provision for risks and charges | | 17 | | 9 | |
Other operating costs | | 27 | | 18 | |
Total other operating costs | | 303 | | 149 | |
65
28 PERSONNEL EXPENSES
The following table provides an analysis of Personnel expenses for 2017 and 2016.
(millions of euro) | | 2017
12 months | | 2016
12 months (unaudited) | |
Wages and salaries | | 352 | | 180 | |
Social security charges | | 90 | | 46 | |
Post-employment benefits | | 22 | | 12 | |
Other personnel expenses | | 15 | | 8 | |
(Costs capitalized for internal works) | | (103 | ) | (29 | ) |
Total personnel expenses | | 376 | | 217 | |
On February 9, 2016 an agreement was signed with the trade unions for rendering the Group’s business model more efficient by completing the plan for internationalizing activities, which is already under way (under a previous trade union agreement of July 29, 2014, which introduced solidarity contracts for a period of 18 months starting from September 2014), and carrying out the resulting reskilling measures. It was agreed to support this process by continuing solidarity contracts for a further 18 months, on a restricted basis compared to the previously, with the aim of completely absorbing excess staff, also through the use of innovative tools such as telework and other flexible forms of working. Following the incorporation with H3G SpA, solidarity contracts were concluded in advance at December 31, 2016.
On February 24, 2017, an agreement was reached to harmonize the various contractual and regulatory disciplines following the merger at the end of last year.
The number of employees is as follows.
| | At December 31,
2017 | | At December 31,
2016 (unaudited) | |
Senior managers | | 172 | | 234 | |
Middle managers | | 715 | | 867 | |
Office Staff | | 6,210 | | 8,255 | |
Total | | 7,097 | | 9,356 | |
The average number of employees during the year was as follows.
| | 2017
12 months | | 2016
12 months
(unaudited) | |
Senior managers | | 187 | | 242 | |
Middle managers | | 802 | | 906 | |
Office Staff | | 7,157 | | 8,458 | |
Total | | 8,146 | | 9,606 | |
66
29 RESTRUCTURING COSTS
This item, amounting €271 million at December 31, 2017 (€60 million at December 31, 2016, unaudited), is mainly due to the accrued costs for implementing the business’s restructuring and reorganization plan, drawn up with the objective of the incorporation.
30 DEPRECIATION AND AMORTIZATION
The following table provides an analysis of Depreciation and amortization for 2017 and 2016.
(millions of euro) | | 2017
12 months | | 2016
12 months (unaudited) | |
Depreciation of property, plant and equipment | | | | | |
- Plant and machinery | | 2,738 | | 361 | |
- Industrial and commercial equipment | | 20 | | 22 | |
- Other assets | | 18 | | 3 | |
| | | | | |
Amortization of intangible assets with finite lives | | | | | |
- Industrial patents and similar rights | | 133 | | 21 | |
- Concessions, licenses, trademarks and similar rights | | 60 | | 134 | |
- Other intangible assets | | 364 | | 112 | |
Total depreciation and amortization | | 3,333 | | 653 | |
The increase of the item is mainly related to the effect of the acceleration of the depreciation on part of the network infrastructure in order to align the remaining useful life of several items of plant and equipment following the optimization plan and the construction of an integrated network of new generation. The depreciation line also includes the accelerated depreciation of some sites to be transferred in the context of the agreements with Iliad.
31 REVERSAL OF IMPAIRMENT LOSSES / (IMPAIRMENT LOSSES) ON NON-CURRENT ASSETS
The following table provides an analysis of Reversal of impairment losses / (impairment losses) on non-current assets for 2017 and 2016.
(millions of euro) | | 2017
12 months | | 2016
12 months (unaudited) | |
Reversal of impairment losses / (Impairment losses) on property, plant and equipment | | — | | 2 | |
| | | | | |
Reversal of impairment losses / (Impairment losses) on intangible assets | | (24 | ) | (1,687 | ) |
Total | | (24 | ) | (1,685 | ) |
67
The item includes the amount of €23 million related to the cost incurred during the year for the renewal of the frequencies to be transferred to Iliad which were already reflected in the financial statements at the expected cost of disposal.
In 2016 this item, amounting to €1,685 million (unaudited), included the impairment loss of the frequencies to reflect in the balance sheet the realizable value established in the contracts signed in 2016 and the impairment of the DVB license.
32 FINANCE INCOME
The following table provides an analysis of Finance income for 2017 and 2016.
(millions of euro) | | 2017
12 months | | 2016
12 months (unaudited) | |
Income from derivative financial instruments (non-hedge accounting) | | 3 | | 18 | |
Cash flow hedges reversed from equity | | 1 | | — | |
Other | | 14 | | 1 | |
Total | | 18 | | 19 | |
The change in income from derivative financial instruments (non-hedge accounting) is mainly due to the effects arising from the fair value measurement of embedded derivatives in bonds.
Other financial income at December 31, 2017 consists mainly of €11 million arising from the gain for the sale of the 10% of the shares of Galata SpA.
33 FINANCE EXPENSE
The following table provides an analysis of Finance expense for 2017 and 2016.
(millions of euro) | | 2017
12 months | | 2016
12 months (unaudited) | |
Interest expense on: | | | | | |
Bond issues | | (837 | ) | (99 | ) |
Shareholder loans | | — | | (116 | ) |
Bank loans | | (47 | ) | (8 | ) |
Dicounted provisions | | (1 | ) | — | |
Hedge accounting effect | | 79 | | 24 | |
Other expenses from embedded derivative financial instruments | | (510 | ) | 1 | |
Other | | (50 | ) | (29 | ) |
Total | | (1,366 | ) | (227 | ) |
Finance expense consists mostly of accrued interest on financial liabilities outstanding at December 31, 2017, for which further details may be found in note 16 and of finance expenses incurred for the refinancing transaction during the year. The “Bond issues” voice also includes the residual up-front fees paid and pre-cancellation costs on the old bonds which have been entirely charged to the income statement through the extinguishment of the old financial structure.
68
The “Other expenses from embedded derivative financial instruments” line item mainly includes the negative effects related to the fair value measurement of the embedded derivatives on bonds of €410 million and the ineffectiveness recorded on hedging derivatives of €100 million, related to the early closure of the derivatives used to cover the financial debt now refinanced.
34 FOREIGN EXCHANGE GAINS / (LOSSES), NET
The following table provides an analysis of Foreign exchange gains (losses) - net for 2017 and 2016.
(millions of euro) | | 2017
12 months | | 2016
12 months (unaudited) | |
Unrealized gains | | 43 | | 350 | |
Realized gains | | 2 | | — | |
Foreign exchange gains | | 45 | | 350 | |
| | | | | |
Unrealized losses | | 37 | | 350 | |
Realized losses | | 1 | | 1 | |
Foreign exchange losses | | 38 | | 351 | |
Total | | 7 | | (1 | ) |
35 INCOME TAXES
The following table provides an analysis of Income taxes for 2017 and 2016.
(millions of euro) | | 2017
12 months | | 2016
12 months (unaudited) | |
Deferred tax | | 87 | | 53 | |
Previous years tax | | 3 | | — | |
Current tax | | (5 | ) | (6 | ) |
Total income taxes | | 85 | | 47 | |
The net charge for the year is mainly made up of the following:
· deferred tax income of €87 million, arising from accrued Wind Tre deferred tax assets as a net effect of the recognition of €186 million of deferred tax assets in the Italian jurisdiction and the utilization of approximately €100 million deferred tax assets attributable to the temporary differences emerged in the past on the financial liabilities extinguished through the refinancing process.
· current income taxes expense of €1 million for WIND Acquisition Finance SA corporate income tax and €4 million for Wind Tre IRAP tax;
69
The following table provides a reconciliation between the theoretical tax rate and the effective tax rate for 2017 and 2016.
(millions of euro) | | 2017 | | 2016 (unaudited) | |
Theoretical income tax rate (IRES) | | 24 | % | 27,5 | % |
Income (loss) before tax | | (2,763 | ) | (1,832 | ) |
Theoretical tax (charge) benefit | | 663 | | 504 | |
| | | | | |
Enacted change in IRES tax rate from 2017 (from 27.5% to 24%) | | — | | (64 | ) |
Unrecognized deferred tax assets | | (590 | ) | (440 | ) |
IRAP (regional tax) charge of the period | | (1 | ) | (6 | ) |
Deferred tax assets recognized up to the possibility to partially offset DTL | | 75 | | 34 | |
Other minor permanent differences | | (62 | ) | 19 | |
Effective tax charge (benefit) for the period | | 85 | | 47 | |
The above reconciliation between the theoretical and effective tax rates has been performed solely for IRES tax (corporate income taxes) purposes. The IRAP tax charge is included to reconcile with the overall income taxes expense in the financial statements.
36 RELATED PARTIES TRANSACTIONS
Related party transactions are part of normal operations which are conducted on an arm’s length basis from an economic standpoint and formalized in agreements, and mainly relate to transactions with telephone operators.
Transactions with the former associate (up to July 2017) Galata SpA arise from the service agreement signed with Wind Tre for the provision of a wide range of services on technological sites that host equipment of the former WIND.
During the year ended December 31, 2017, Group companies did not hold treasury shares of the VIP-CKH Luxembourg S.à r.l., either directly or through trustees.
The tables below provide a summary of the main effects on the income statement and statement of financial position following transactions during the 2017 and 2016 with related parties, all companies of the VEON and CK Hutchison groups, joint venturers at 50% in the company VIP-CKH Luxembourg S.à r.l..
70
| | At December 31, 2017 | |
(thousands of euro) | | Revenue | | Expenses | | Trade
receivables | | Other
receivables | | Trade
payables | | Financial
payables | | Other
payables | |
Armenija Telefon Kompani | | 8 | | 1 | | — | | — | | 19 | | — | | — | |
Banglalink Digital Communications Limited | | — | | 1 | | — | | — | | — | | — | | — | |
DiGi (Malaysia)* | | 7 | | 1 | | — | | — | | — | | — | | — | |
DTAC TriNet Co., Ltd.* | | 155 | | 4 | | — | | — | | — | | — | | — | |
DTAC/UCOM (Thailand)* | | — | | 5 | | — | | — | | — | | — | | — | |
Galata** | | 2,631 | | 95,117 | | — | | — | | — | | — | | — | |
GrameenPhone (Bangladesh)* | | 28 | | 26 | | — | | — | | — | | — | | — | |
KaR-Tel | | 12 | | 3 | | — | | — | | — | | — | | — | |
Kyivstar JSC | | 758 | | 16,448 | | — | | — | | 3,171 | | — | | — | |
Mobitel LLC Georgia | | 1 | | 3 | | — | | — | | 11 | | — | | — | |
Orascom Telecom Algeria SpA | | 38 | | 96 | | 1,997 | | — | | — | | — | | — | |
Pakistan Mobile Communications Ltd. | | 1 | | 6 | | 449 | | — | | — | | — | | — | |
SKY MOBILE LLC | | — | | — | | — | | — | | 1 | | — | | — | |
Telenor A/S* | | 316 | | 53 | | — | | — | | — | | — | | — | |
Telenor Bulgaria EAD* | | 209 | | 15 | | — | | — | | — | | — | | — | |
Telenor Magyarorszag KFT (Hungary)* | | 265 | | 150 | | — | | — | | — | | — | | — | |
Telenor Maritime | | — | | 704 | | — | | — | | — | | — | | — | |
Telenor Mobile Communications AS (Norway)* | | 983 | | 76 | | — | | — | | — | | — | | — | |
Telenor Montenegro* | | 13 | | 73 | | — | | — | | — | | — | | — | |
Telenor Pakistan (Pakistan) | | — | | 3 | | — | | — | | — | | — | | — | |
Telenor Serbia (Serbia)* | | 216 | | 46 | | — | | — | | — | | — | | — | |
Telenor Sverige AB | | 5 | | 1 | | — | | — | | — | | — | | — | |
Unitel | | 1 | | 5 | | — | | — | | 7 | | — | | — | |
VEON Ltd | | 3 | | — | | — | | 115 | | — | | — | | — | |
Vimpelcom International Services | | — | | — | | — | | 22 | | — | | — | | — | |
Vympel-Kommunikacii | | 1,124 | | 3,592 | | — | | — | | 1,296 | | — | | — | |
Wind Telecom SpA* | | 2 | | — | | — | | 146 | | — | | — | | 411 | |
HI3G Access AB | | 21 | | 9 | | 91 | | — | | — | | — | | — | |
HI3G Denmark ApS | | 36 | | 7 | | — | | — | | 6 | | — | | — | |
Hutchison 3G Enterprises S.à r.l. | | — | | — | | — | | — | | 1 | | — | | — | |
Hutchison 3G Ireland Limited | | 14 | | 11 | | 25 | | — | | — | | — | | — | |
Hutchison 3G UK Limited | | 3,337 | | 120 | | 181 | | — | | 109 | | — | | — | |
Hutchison Drei Austria GmbH | | 119 | | 105 | | 187 | | — | | — | | — | | — | |
Hutchison Global Communications Limited* | | 978 | | 3,739 | | — | | — | | — | | — | | — | |
Hutchison Global Enabling Services Limited | | 3 | | 61 | | 112 | | — | | — | | — | | — | |
Hutchison Telecommunications (Vietnam) S.à r.l.-BCC | | — | | 4 | | — | | — | | 2 | | — | | — | |
Hutchison Telecommunications Lanka (Private) Ltd | | — | | 1 | | — | | — | | — | | — | | — | |
Hutchison Telephone (Macau) Company Limited | | 1 | | 1 | | 18 | | — | | — | | — | | — | |
Hutchison Telephone Company Limited | | 263 | | 11 | | 559 | | — | | — | | — | | — | |
Hutchison Whampoa 3G Content S.à r.l. | | — | | — | | — | | — | | 1 | | — | | — | |
Hutchison Whampoa 3G IP S.à r.l. | | 60 | | 1,910 | | — | | 205 | | 15,468 | | — | | — | |
Hutchison Whampoa 3G Procurement S.à r.l. | | — | | 31 | | — | | — | | 203 | | — | | — | |
Hutchison Whampoa Europe Investments S.à r.l | | 8 | | — | | — | | 8 | | 3,868 | | — | | — | |
PT. Hutchison 3 Indonesia | | — | | 1 | | — | | — | | — | | — | | — | |
Telefonica Ireland Limited | | 8 | | 15 | | — | | — | | 15 | | — | | — | |
VIP-CKH Ireland Limited | | — | | — | | — | | — | | — | | 5,114,342 | | — | |
Vodafone Hutchison Australia Pty Ltd. | | 46 | | 4 | | 98 | | — | | 6 | | — | | — | |
Total | | 11,670 | | 122,459 | | 3,717 | | 496 | | 24,184 | | 5,114,342 | | 411 | |
(*) At December 31, 2017 entities indicated are not related parties.
(**) On July 4, 2017, the whole 10% of the shares of Galata was sold. Values indicated refers to June 30, 2017.
71
| | Year ended December 31, 2016 (unaudited) | |
(thousands of euro) | | Revenue | | Finance
income/
(expenses) | | Expenses | | Trade
receiv. | | Other
receiv. | | Financial
receiv. | | Trade
payables | | Financial
payables | | Other
payables | |
VIP-CKH Ireland Ltd | | — | | — | | — | | — | | — | | — | | — | | 5,114,342 | | — | |
Hutchison Europe Telecommunications S.à r.l. | | — | | (134,344 | ) | — | | — | | — | | — | | — | | — | | — | |
Galata | | 457 | | — | | 32,021 | | — | | 6,631 | | — | | 21,126 | | — | | 90 | |
Armenija Telefon Kompani | | — | | — | | 1 | | 2 | | — | | — | | 33 | | — | | — | |
DiGi (Malaysia) | | 1 | | — | | — | | 7 | | — | | — | | 1 | | — | | — | |
DTAC/UCOM (Thailand) | | — | | — | | — | | 19 | | — | | — | | 5 | | — | | — | |
GrameenPhone (Bangladesh) | | — | | — | | — | | (3 | ) | — | | — | | 59 | | — | | — | |
KaR-Tel | | 7 | | — | | 1 | | 17 | | — | | — | | — | | — | | — | |
Kievstar | | 169 | | — | | 3,378 | | — | | — | | — | | 7,969 | | — | | — | |
Telenor Maritime | | — | | — | | 81 | | — | | — | | — | | 69 | | — | | — | |
Mobitel LLC Georgia | | 2 | | — | | 1 | | — | | — | | — | | 5 | | — | | — | |
Orascom Telecom Algeria SpA | | 34 | | — | | 20 | | 865 | | — | | — | | 9 | | — | | — | |
Banglalink Digital Communications Limited | | 3 | | — | | (6 | ) | 696 | | — | | — | | — | | — | | — | |
Pakistan Mobile Communications Ltd. | | 9 | | — | | 18 | | 559 | | — | | — | | — | | — | | — | |
SKY MOBILE LLC | | — | | — | | — | | — | | — | | — | | 2 | | — | | — | |
Telenor Magyarorszag KFT (Hungary) | | 22 | | — | | 8 | | 27 | | — | | — | | 80 | | — | | — | |
Telenor Mobile Communications AS (Norway) | | 22 | | — | | 3 | | — | | — | | — | | 586 | | — | | — | |
Telenor Pakistan (Pakistan) | | — | | — | | — | | — | | — | | — | | 3 | | — | | — | |
Telenor Serbia (Serbia) | | 8 | | — | | 4 | | 12 | | — | | — | | — | | — | | — | |
Unitel | | 2 | | — | | 1 | | 5 | | — | | — | | — | | — | | — | |
VimpelCom Lao Co, Ltd | | — | | — | | 1 | | 1 | | — | | — | | 3 | | — | | — | |
Vympel-Kommunikacii | | 159 | | — | | 964 | | 2 | | — | | — | | 1,109 | | — | | — | |
Wind Telecom SpA | | 46 | | — | | 7 | | — | | 185 | | — | | 411 | | — | | — | |
Vimpelcom International services | | — | | — | | (2 | ) | — | | 22 | | — | | — | | — | | — | |
Telenor Sverige AB | | 2 | | — | | — | | — | | — | | — | | 19 | | — | | — | |
Telenor Bulgaria EAD | | 10 | | — | | 7 | | — | | — | | — | | 33 | | — | | — | |
DTAC TriNet Co., Ltd. | | 17 | | — | | 2 | | 21 | | — | | — | | — | | — | | — | |
Telenor A/S | | 3 | | — | | 1 | | — | | — | | — | | 55 | | — | | — | |
Telenor Montenegro | | — | | — | | 1 | | — | | — | | — | | 11 | | — | | — | |
Vimpelcom ltd | | — | | — | | (27 | ) | — | | 111 | | — | | 10,000 | | — | | — | |
Vodafone Hutchison Australia Pty Ltd. | | 7 | | — | | (4 | ) | 61 | | — | | — | | (1 | ) | — | | — | |
Hutchison Telecommunications Lanka (Private) Limited | | — | | — | | — | | — | | — | | — | | — | | — | | — | |
PT. Hutchison 3 Indonesia | | 1 | | — | | — | | — | | — | | — | | — | | — | | — | |
Hutchison 3G UK Limited | | 107 | | — | | 3 | | 389 | | — | | — | | 10 | | — | | — | |
Telefonica Ireland Limited | | 1 | | — | | 6 | | 1 | | — | | — | | 60 | | — | | — | |
Hutchison Drei Austria GmbH | | 6 | | — | | 15 | | 34 | | — | | — | | 222 | | — | | — | |
HI3G Access AB | | 1 | | — | | — | | 86 | | — | | — | | 2 | | — | | — | |
HI3G Denmark ApS | | 1 | | — | | — | | 29 | | — | | — | | 2 | | — | | — | |
Hutchison 3G Ireland Limited | | — | | — | | 1 | | — | | — | | — | | 2 | | — | | — | |
Hutchison Global Enabling Services Limited | | 24 | | — | | — | | 24 | | — | | — | | — | | — | | — | |
Hutchison Telephone Company Limited | | 364 | | — | | 6 | | 309 | | — | | — | | 3 | | — | | — | |
Hutchison Telephone (Macau) Company Limited | | 1 | | — | | 6 | | 6 | | — | | — | | 2 | | — | | — | |
Hutchison Global Communications Limited | | 197 | | — | | — | | 86 | | — | | — | | — | | — | | — | |
Hutchison Whampoa 3G Content S.à r.l. | | — | | — | | — | | — | | — | | — | | — | | — | | — | |
Hutchison Whampoa 3G IP S.à r.l. | | 1,648 | | — | | 5,790 | | — | | — | | — | | 444 | | — | | — | |
Hutchison Whampoa 3G Procurement S.à r.l. | | — | | — | | 163 | | — | | — | | — | | — | | — | | — | |
Hutchison Whampoa Europe Investments S.à r.l. | | — | | — | | 1,341 | | — | | — | | — | | 183 | | 286,059 | | — | |
Hutchison Whampoa (Europe) Limited S.à r.l. | | — | | — | | 127 | | — | | — | | — | | 127 | | — | | — | |
Hutchison Whampoa 3G Enterprise S.à r.l. | | — | | — | | 484 | | — | | — | | — | | — | | — | | — | |
Hutchison Telecommunications (Vietnam) S.à r.l.-BCC | | — | | — | | 1 | | — | | — | | — | | — | | — | | — | |
Total | | 3,331 | | (134,344 | ) | 44,424 | | 3,255 | | 6,949 | | — | | 42,644 | | 5,400,401 | | 90 | |
72
Financial payables are related to the outstanding balance of the loan granted by Hutchison Europe Telecommunications S.à r.l.. During 2016 the Company has repaid a part of the loan and the remaining amount of EUR 5,114,341,668 (unaudited), was novated to VIP-CKH Ireland Limited on 5 November, 2016. VIP-CKH Ireland Ltd is jointly owned by the Shareholders of the Company (see note 16) which confirmed via a letter that this amount will be managed in a way able to not generate financial difficulties for the Group for at least one year from the date of approval of the 2017 consolidated financial statements.
Directors and Key Management Personnel
The directors and members of the Audit Committee of the Group received compensation for 2017 amounting to €0.7 million. Subsidiaries employees identified as “Key Management Personnel” received compensation (included the severance extraordinary cost) of €20.4 million in 2017. No loans granted to the Directors and other “Key Management Personnel”.
37 NET DEBT
The following statement shows the Group’s net debt analyzed into its principal components, as described in notes 6, 16 and 17 relating to financial items (in the customary definition of financial position which does not correspond to IAS 32 and IAS 39 definitions of financial assets and financial liabilities) in the statement of financial position.
(millions of euro) | | At December 31,
2017 | | At December 31,
2016 (unaudited) | |
| | | | | |
Bond issues | | 7,247 | | 10,293 | |
Bank loans | | 2,960 | | 677 | |
Derivative financial instruments | | 57 | | 23 | |
Non-current financial liabilities | | 10,264 | | 10,993 | |
| | | | | |
Bond issues | | 39 | | 160 | |
Loan from related Company | | 5,114 | | 5,114 | |
Bank loans | | 10 | | 9 | |
Derivative financial instruments | | — | | 7 | |
Current financial liabilities | | 5,163 | | 5,290 | |
| | | | | |
GROSS DEBT | | 15,427 | | 16,283 | |
| | | | | |
Cash and cash equivalents | | (619 | ) | (633 | ) |
| | | | | |
Derivative financial instruments | | (7 | ) | (1,460 | ) |
Non-current financial assets | | (7 | ) | (1,460 | ) |
| | | | | |
NET DEBT | | 14,801 | | 14,190 | |
Net debt does not include trade payables, financial liabilities included in other liabilities, other payables and guarantee deposits of €4 million at December 31, 2017 and of €5 million at December 31, 2016.
73
38 OTHER INFORMATION
Operating Leases
The Group leases various cell sites, offices, outlets and motor vehicles under operating lease agreements. The leases have varying terms, escalation clauses and renewal rights. Cell site leases are negotiated for an average term of 6 years. Offices are negotiated for an average term of 6 years and motor vehicles leases are negotiated for an average term of 2.5 years. The Group is required to give six months’ notice for the termination of cell site leases and three months’ for the termination of offices leases.
The future aggregated minimum lease payments under operating leases with a due date less than one year are as follows:
| | At December 31, | | At December 31, | |
(millions of euro) | | 2017 | | 2016 (unaudited) | |
Cell sites | | 206 | | 149 | |
Offices | | 38 | | 34 | |
Outlets | | 23 | | 16 | |
Motor vehicles | | 2 | | 2 | |
Total | | 269 | | 201 | |
The data included in the above table only reflects uncancellable costs for one year. The same data will be reconsidered in light of IFRS 16 application starting from 2019. Please also refer to paragraph “New accounting standards and interpretations” for further considerations on IFRS 16.
Contingent assets and liabilities
The Group is subject to various legal proceedings arising in the ordinary course of business. Below is a description of all material pending legal proceedings as at December 31, 2017, excluding those situations in which the cost arising from a negative outcome of the proceedings cannot be estimated or for which a negative outcome is not considered probable.
Proceedings with agents and retail dealers
As at December 31, 2017, certain proceedings relating to the termination of agency agreements were pending at different stages of judgment. The agent dealers in these proceedings are seeking typically payment from Wind Tre of damages and indemnities, including a termination indemnity pursuant to article 1751 of the Italian Civil Code.
Proceedings concerning misleading advertising and unfair commercial practices
Under Legislative Decree No.146/2007, the Italian Antitrust Authority (AGCM) has the power to initiate proceedings concerning unfair commercial practices and misleading advertising and issue fines up to €5 million for each proceeding (amount redefined by Law N°. 135/12 dated August 2012). During 2015, four proceedings initiated by the AGCM against Wind Tre for unfair commercial practice were closed with the payment of fines totalling €1.55 million and the order to cease the alleged unfair practices. Wind Tre has filed an appeal with the Lazio Administrative Court (Lazio TAR) against these fines and the related administrative litigations are currently pending.
In 2016 AGCM initiated four new proceedings (respectively on February, April, July and December) against Wind Tre for alleged unfair commercial practices: the first proceeding has been closed without ascertaining any unfair practice;
74
the second, third and fourth proceeding have been closed with the payment of a fine amounting respectively to €455 thousand, €450 thousand and €2.1 million (for these last both fines Wind Tre has filed an appeal before the Lazio TAR). In 2017 AGCM initiated three new proceedings against Wind Tre for alleged unfair commercial practice; the first one has been closed with the payment of a fine of €500 thousand which Wind Tre appealed before the Lazio TAR while the second and the third ones are currently pending.
Audit by the Italian tax authorities
The Agenzia delle Entrate (“ADE”) (the Italian tax authorities) conducted a tax audit on the senior lenders under the senior facility agreement of 24 November 2010 (“SFA”), raising an objection to the non-application of substitute tax on the SFA. Each senior lender is liable for the substitute tax disputed on its own portion of the SFA, but may claim indemnification from Wind Tre. The indemnification right has already been exercised. It should be noted that appeals against the assessments have been filed by the senior lenders in coordination with Wind Tre. ADE has withdrawn the assessments raised with certain senior lenders concluding that no substitute tax is due. As a consequence the ADE has requested the courts to withdraw its claim in respect of these assessments.
On 2012, WIND Telecomunicazioni SpA (now Wind Tre) appealed against the payment injunction n. 2012/ORA00014 requesting the payment of €2,536,254.25 as additional registration tax due on transfer deed of May 3, 2011 between WIND Telecomunicazioni SpA (seller) and VEON Ltd (buyer) concerning the sale of shares in company Libero Srl. The Tax Court of first and second instance rejected the appeal. After rejection ADE notified a request of payment of €3,625,872.08 including penalties and interests. Terms to appeal against decisions, to the Supreme Court, are still pending.
Proceedings concerning electromagnetic radiation
There are certain pending proceedings regarding the installation of radio base stations. These proceedings concern the emission of electromagnetic radiation. As at December 31, 2017 five proceedings for electromagnetic emissions were pending as a consequence of BTS installations, the Group doesn’t think that these proceedings will result in additional liabilities to those already booked in the balance sheet’s item Provision.
Audit of dealers’ fees
In 2001 WIND Telecomunicazioni SpA (now Wind Tre), received a dispute notice from the tax authorities regarding the tax treatment adopted in 1999, 2000 and 2001 for certain fees paid to dealers. With respect to the tax disputes for 1999, 2000 and 2001 Wind Tre obtained a positive outcome in the Supreme Court proceedings. For 2000 the Supreme Court has remitted the dispute to the Commission of Second Instance that has given a judgement in favor of Wind Tre.
Wind Tre / Crest One SpA
On October 9, 2009, Crest One SpA (‘‘Crest One’’) initiated proceedings against Wind Tre for: (i) the refund of an amount of approximately €16 million previously paid to Wind Tre by Crest One as value added tax under a distribution agreement entered into between Crest One and Wind Tre, and (ii) the compensation of damages alleged to have been suffered by Crest One pursuant to the payment of such value added tax by Crest One to Wind Tre. The Court of Rome has rejected the claims of Crest One which has filed with the Court of Appeal. At the hearing of July 18, 2017, the Court reserved its decision and granted to parties terms to file final briefs; judgment is awaited.
75
Fastweb / Wind Tre
On January 2, 2014, Fastweb served a claim on Wind Tre based on antitrust proceedings no. A/357, which in August 2007 convicted Wind Tre and Telecom Italia for abuse of their dominant positions in the wholesale termination market in favour of their respective internal commercial divisions and to the detriment of the competitors in the fixed market (i.e. internal-external discriminatory application of economic and technical conditions for fixed-to-mobile on net and intercom calls to business clients). Amongst other issues Wind Tre has argued that the claim is time barred because it was filed outside the statute of limitations. On December 10, 2015, the presiding judge decided to defer to the panel of the tribunal to deliberate on Wind Tre’s time-bar argument, scheduling the next hearing for March 30, 2016 (then postponed to April 6, 2016). At this hearing the parties filed their conclusions and, at the end of June 2016, filed their final memoranda. A partial ruling on the time-bar argument was issued on November 23, 2016, rejecting Fastweb’s request for damages relating to 2002-2007 as it is definitely time-barred. In the same ruling, the judge ordered the continuation of the proceedings which is still pending and decided to appoint an expert asking for a technical support to verify whether damages have been suffered by Fastweb for the following claimed period notwithstanding that the Antitrust Authority itself in its A/357 decision found that the abusive conduct by WIND ceased following this period On May 16, 2017, Fastweb challenged the ruling on time barring/ limitation 2002-2007 before the Court of Appeal and Wind Tre is opposing, defending the ruling.
Proceedings concerning transition to monthly billing
With Resolution 121/17/CONS, AGCOM arranged for the fixed and converged network customers the obligation to charge monthly costs and renewals on a monthly basis. The resolution has been challenged by Wind Tre.
On December 4, 2017, Law 172/2017 came into force, which, starting from April 4, 2018, provided the transition to monthly billing and debit for all fixed and mobile services after a 120-day implementation period.
On December 21, 2017, with Resolution 497/17/CONS, AGCOM warned Wind Tre to switch to monthly invoicing, with a penalty of €1,160,000. AGCOM also provided for the repayment of the amounts corresponding to the restoration of the billing cycle on a monthly basis which, starting from June 23, 2017, were not used by the users in terms of service delivery due to the misalignment between the four-weekly billing cycle and the monthly billing cycle. This resolution was also challenged by a precautionary appeal.
On February 7, 2017, the hearing on the discussion of the appeal of Resolution 121/17/CONS was held. The appeal was rejected while the precautionary appeal against Resolution 497/17/CONS was accepted in relation to the restitution provisions envisaged therein. These provisions will be discussed at the public hearing scheduled for October 2018.
On February 15, 2018, Wind Tre was notified of the opening of a proceeding by the AGCM aimed at verifying the existence of a coordination of the activities of the operators in relation to the implementation of the provisions of Resolution 121/17/CONS.
On February 16, 2018, AGCOM notified a provision aimed at verifying the full compliance towards customers of the information requirements resulting from the aforementioned legislation.
Wind Tre, as of the date of this document and already starting a few weeks ago, is currently implementing the new timing requested, in compliance with the contents and the legislative precautions required to protect users, which will be operational by 4 April 2018, while the communications required by the legislation have been carried out.
76
Other disputes
During the second quarter of 2017 the Group continued with the credit collection actions started in December 2012 against a company specialising in selling prepaid traffic, VAS and broadband services. On December 22, 2014 the Court of Rome declared the company bankrupt. The Group took part in the bankruptcy procedure for credit collection, formally approved by the Judge on June 26, 2015, and is currently awaiting payment.
During 2017 credit recovery actions were also continued against a communications services company (wholesale), active in services for MVNO. Proceedings against this company have been directly handled by AGCom. On December 16, 2014, the Court declared the company bankrupt. The Group took part in the bankruptcy procedure for credit collection, formally approved by the Judge on June 9, 2015, and is currently awaiting payment.
The contingent liabilities arising from these proceedings will be recognized as provisions in the balance sheet if management believes that the risk of a loss is probable.
Guarantees
The collateral pledged by Group companies at December 31, 2017 as a security for liabilities may be summarized as follows:
· a pledge on the shares representing 100% of the corporate capital of the subsidiary WIND Acquisition Finance owned by the Wind Tre in favor of a pool of banks under the Senior Facility Agreement and in favor of the holders of the notes issued by Wind Tre pursuant to the related share pledge agreement;
· a pledge on the shares representing 100% of the corporate capital of the subsidiary Wind Tre SpA in favor of a pool of banks under the Senior Facility Agreement and in favor of the holders of the notes issued by Wind Tre pursuant to the related share pledge agreement;
· a pledge under Italian law on two bank accounts of Wind Tre in favor of the lenders under the Senior Facility Agreement and in favor of the holders of the notes.
The subsidiary Wind Acquistion Finance is one of the guarantors of the Senior Facilities Agreement dated October 24, 2017, between, among others, Wind Tre SpA and Banca IMI SpA. As of December 31, 2017, the total commitment amounted to €3,400,000,000.
The subsidiary Wind Acquistion Finance has granted a guarantee on the: (i) €2,250 million Senior Secured Floating Rate due 2024; (ii) €1,625 million Senior Secured Notes due 2023; (iii) €1,750 million Senior Secured Notes due 2025; and (iv) $2,000 million Senior Secured Notes due 2026, issued by Wind Tre SpA pursuant to an indenture dated November 3, 2017.
The above arrangements are subject to intercreditor arrangements between the parties and the shares of WIND Acquisition Finance have been pledged in favour of the creditors.
A description is provided below of guarantees (sureties) issued mainly by banks and insurance companies on behalf of the Group and in favor of third parties in respect of commitments of various kinds. The total of these, amounting to €133 million at December 31, 2017 includes:
· sureties totaling €16 million issued by insurance companies, mainly relating to participation in tenders;
· sureties totaling €117 million issued by banks, relating to participation in tenders, of which €43 million in favor of the Minister for Economic Development for the participation in the tender procedure it had been awarded for the
77
frequency use rights in the 800, 1800, 2000 and 2600 MHz bands, to sponsorships, property leases, operations regarding prize competitions, events and excavation licenses.
39 SUBSEQUENT EVENTS
No significant events took place after the closing of these consolidated financial statements as of and for the year ended December 31, 2017 that would require adjustments or additional disclosures in such statements.
78