
3Q20 RESULTS 29 October 2020 1
AGENDA 1. OPENING Nik Kershaw: Head of IR 2. FINANCIAL RESULTS Serkan Okandan: CFO 3. OPERATIONAL REVIEW Kaan Terzioğlu: Co-CEO Sergi Herrero: Co-CEO 4. OUTLOOK AND GUIDANCE Serkan Okandan: CFO 2
DISCLAIMER This presentation contains “forward-looking statements”, as the phrase is defined in Section 27A of the U.S. Securities Act of 1933, as amended, and Section 21E of the U.S. Securities Exchange Act of 1934, as amended. These forward-looking statements may be identified by words such as “may,” “might,” “will,” “could,” “would,” “should,” “expect,” “plan,” “anticipate,” “intend,” “seek,” “believe,” “estimate,” “predict,” “potential,” “continue,” “contemplate,” “possible” and other similar words. Forward-looking statements include statements relating to, among other things, VEON’s plans to implement its strategic priorities, including operating model and development plans, among others; anticipated performance and guidance for 2020, including VEON’s ability to sufficient cash flow; VEON’s assessment of the impact of the COVID-19 pandemic on its current and future operations and financial condition; future market developments and trends; operational and network development and network investment, including expectations regarding the roll-out and benefits of 3G/4G/LTE networks, as applicable; spectrum acquisitions and renewals; the effect of the acquisition of additional spectrum on customer experience; VEON’s ability to realize the acquisition and disposition of any of its businesses and assets and to execute its strategic transactions in the timeframes anticipated, or at all; VEON’s ability to realize financial improvements, including an expected reduction of net pro-forma leverage ratio following the successful completion of certain dispositions and acquisitions; our dividends; and VEON’s ability to realize its targets and commercial initiatives in its various countries of operation. The forward-looking statements included in this presentation are based on management’s best assessment of VEON’s strategic and financial position and of future market conditions, trends and other potential developments. These discussions involve risks and uncertainties. The actual outcome may differ materially from these statements as a result of further unanticipated developments related to the COVID-19 pandemic, such as the effect on consumer spending, that negatively affected VEON’s operations and financial condition; demand for and market acceptance of VEON’s products and services; our plans regarding our dividend payments and policies, as well as our ability to receive dividends, distributions, loans, transfers or other payments or guarantees from our subsidiaries; continued volatility in the economies in VEON’s markets; including adverse macroeconomic developments caused by recent volatility in oil prices in the wake of COVID-19; unforeseen developments from competition; governmental regulation of the telecommunications industries; general political uncertainties in VEON’s markets; government investigations or other regulatory actions; litigation or disputes with third parties or other negative developments regarding such parties; the impact of export controls and laws affecting trade and investments on our and important third-party suppliers' ability to procure goods, software or technology necessary for the services we provide to our customers; risks associated with data protection or cyber security, other risks beyond the parties’ control or a failure to meet expectations regarding various strategic priorities, the effect of foreign currency fluctuations, increased competition in the markets in which VEON operates and the effect of consumer taxes on the purchasing activities of consumers of VEON’s services. Certain other factors that could cause actual results to differ materially from those discussed in any forward-looking statements include the risk factors described in VEON’s Annual Report on Form 20-F for the year ended December 31, 2019 filed with the U.S. Securities and Exchange Commission (the “SEC”) and other public filings made by VEON with the SEC. Other unknown or unpredictable factors also could harm our future results. New risk factors and uncertainties emerge from time to time and it is not possible for our management to predict all risk factors and uncertainties, nor can we assess the impact of all factors on our business or the extent to which any factor, or combination of factors, may cause actual results to differ materially from those contained in any forward-looking statements. Under no circumstances should the inclusion of such forward-looking statements in this presentation be regarded as a representation or warranty by us or any other person with respect to the achievement of results set out in such statements or that the underlying assumptions used will in fact be the case. Therefore, you are cautioned not to place undue reliance on these forward-looking statements. The forward-looking statements speak only as of the date hereof. We cannot assure you that any projected results or events will be achieved. Except to the extent required by law, we disclaim any obligation to update or revise any of these forward-looking statements, whether as a result of new information, future events or otherwise, after the date on which the statements are made, or to reflect the occurrence of unanticipated events. All non-IFRS measures disclosed further in this presentation (including, without limitation, EBITDA, EBITDA margin, EBT, net debt, equity free cash flow after licenses (excluding capitalized leases), local currency growth, capital expenditures excluding licenses and LTM (last twelve months) capex excluding licenses/revenue) are reconciled to comparable IFRS measures in VEON Ltd.’s earnings release published on its website on the date hereof. In addition, we present certain information on a forward-looking basis. We are not able to, without unreasonable efforts, provide a full reconciliation to IFRS due to potentially high variability, complexity and low visibility as to the items that would be excluded from the comparable IFRS measure in the relevant future period, including, but not limited to, depreciation and amortization, impairment loss, loss on disposal of non-current assets, financial income and expenses, foreign currency exchange losses and gains, income tax expense and performance transformation costs, cash and cash equivalents, long term and short-term deposits, interest accrued related to financial liabilities, other unamortized adjustments to financial liabilities, derivatives, and other financial liabilities. 3
AGENDA 1. OPENING Nik Kershaw: Head of IR 2. FINANCIAL RESULTS Serkan Okandan: CFO 3. OPERATIONAL REVIEW Kaan Terzioğlu: Co-CEO Sergi Herrero: Co-CEO 4. OUTLOOK AND GUIDANCE Serkan Okandan: CFO 4
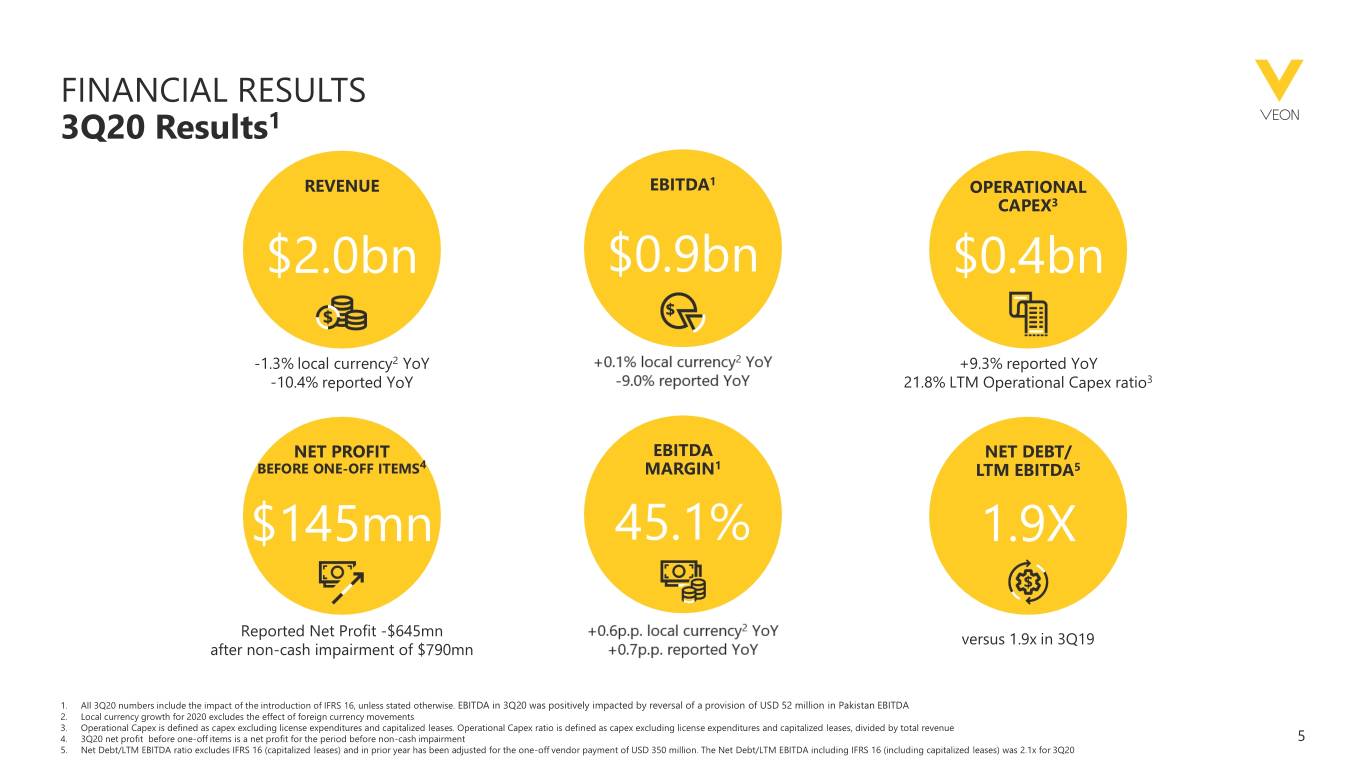
FINANCIAL RESULTS 3Q20 Results1 REVENUE EBITDA1 OPERATIONAL CAPEX3 $2.0bn $0.9bn $0.4bn -1.3% local currency2 YoY +9.3% reported YoY -10.4% reported YoY 21.8% LTM Operational Capex ratio3 NET PROFIT EBITDA NET DEBT/ BEFORE ONE-OFF ITEMS4 MARGIN1 LTM EBITDA5 $145mn 45.1% 1.9X Reported Net Profit -$645mn versus 1.9x in 3Q19 after non-cash impairment of $790mn 1. All 3Q20 numbers include the impact of the introduction of IFRS 16, unless stated otherwise. EBITDA in 3Q20 was positively impacted by reversal of a provision of USD 52 million in Pakistan EBITDA 2. Local currency growth for 2020 excludes the effect of foreign currency movements 3. Operational Capex is defined as capex excluding license expenditures and capitalized leases. Operational Capex ratio is defined as capex excluding license expenditures and capitalized leases, divided by total revenue 4. 3Q20 net profit before one-off items is a net profit for the period before non-cash impairment 5 5. Net Debt/LTM EBITDA ratio excludes IFRS 16 (capitalized leases) and in prior year has been adjusted for the one-off vendor payment of USD 350 million. The Net Debt/LTM EBITDA including IFRS 16 (including capitalized leases) was 2.1x for 3Q20
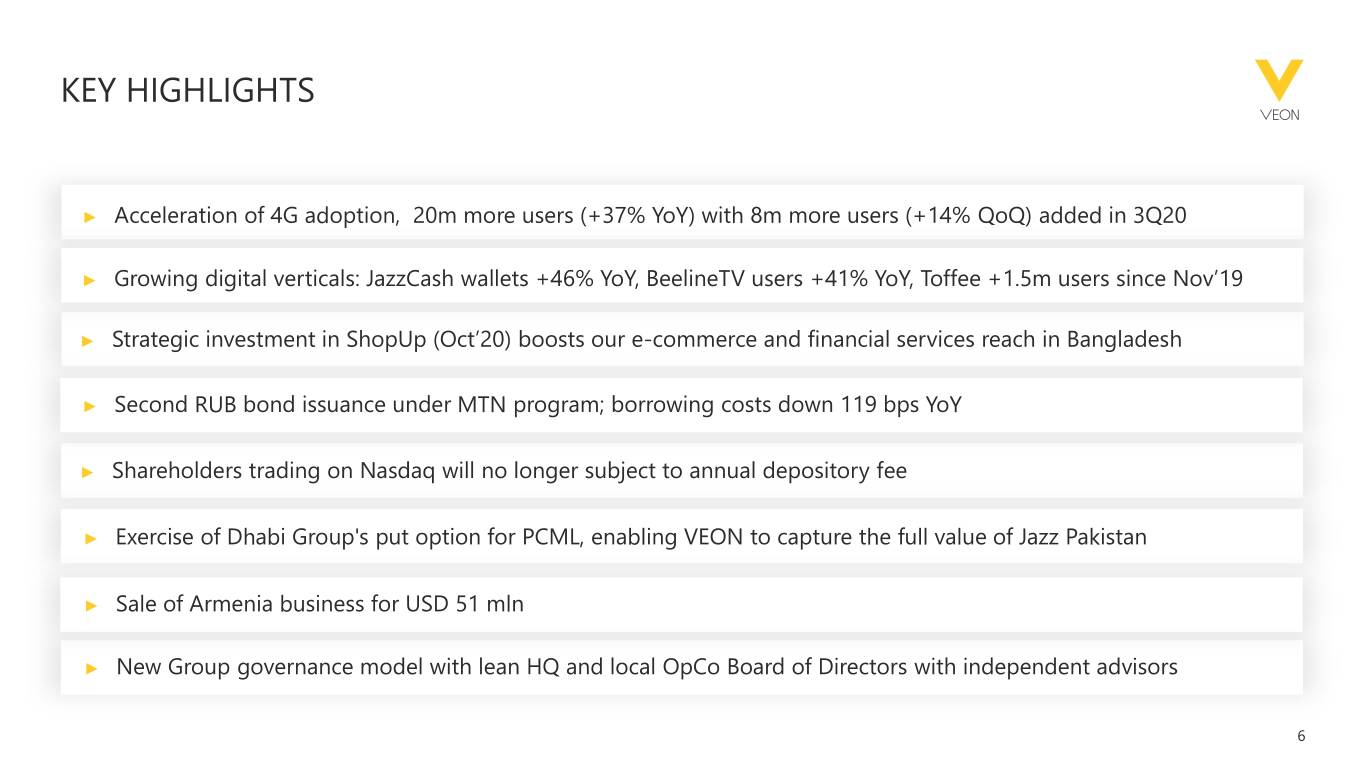
KEY HIGHLIGHTS ► Acceleration of 4G adoption, 20m more users (+37% YoY)KKJ with 8m more users (+14% QoQ) added in 3Q20 ► Growing digital verticals: JazzCash wallets +46% YoY, BeelineTVKKJ users +41% YoY, Toffee +1.5m users since Nov’19 ► Strategic investment in ShopUp (Oct’20) boosts our e-commerceKKJ and financial services reach in Bangladesh ► Second RUB bond issuance under MTN program; borrowing costs down 119 bps YoY ► Shareholders trading on Nasdaq will no longer subject to annual depository fee ► Exercise of Dhabi Group's put option for PCML, enabling VEON to capture the full value of Jazz Pakistan ► Sale of Armenia business for USD 51 mln ► New Group governance model with lean HQ and local OpCo Board of Directors with independent advisors 6
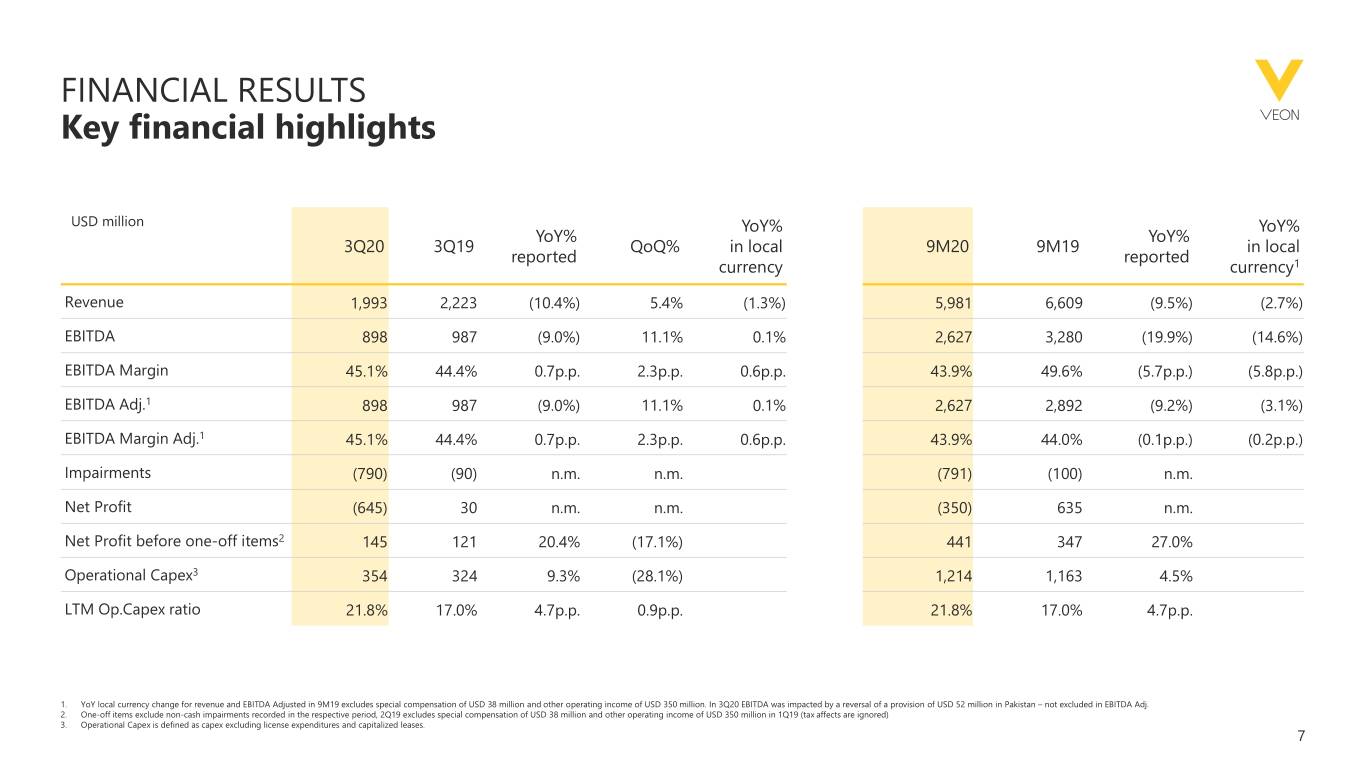
FINANCIAL RESULTS Key financial highlights USD million YoY% YoY% YoY% YoY% 3Q20 3Q19 QoQ% in local 9M20 9M19 in local reported reported currency currency1 Revenue 1,993 2,223 (10.4%) 5.4% (1.3%) 5,981 6,609 (9.5%) (2.7%) EBITDA 898 987 (9.0%) 11.1% 0.1% 2,627 3,280 (19.9%) (14.6%) EBITDA Margin 45.1% 44.4% 0.7p.p. 2.3p.p. 0.6p.p. 43.9% 49.6% (5.7p.p.) (5.8p.p.) EBITDA Adj.1 898 987 (9.0%) 11.1% 0.1% 2,627 2,892 (9.2%) (3.1%) EBITDA Margin Adj.1 45.1% 44.4% 0.7p.p. 2.3p.p. 0.6p.p. 43.9% 44.0% (0.1p.p.) (0.2p.p.) Impairments (790) (90) n.m. n.m. (791) (100) n.m. Net Profit (645) 30 n.m. n.m. (350) 635 n.m. Net Profit before one-off items2 145 121 20.4% (17.1%) 441 347 27.0% Operational Capex3 354 324 9.3% (28.1%) 1,214 1,163 4.5% LTM Op.Capex ratio 21.8% 17.0% 4.7p.p. 0.9p.p. 21.8% 17.0% 4.7p.p. 1. YoY local currency change for revenue and EBITDA Adjusted in 9M19 excludes special compensation of USD 38 million and other operating income of USD 350 million. In 3Q20 EBITDA was impacted by a reversal of a provision of USD 52 million in Pakistan – not excluded in EBITDA Adj. 2. One-off items exclude non-cash impairments recorded in the respective period, 2Q19 excludes special compensation of USD 38 million and other operating income of USD 350 million in 1Q19 (tax affects are ignored) 3. Operational Capex is defined as capex excluding license expenditures and capitalized leases. 7
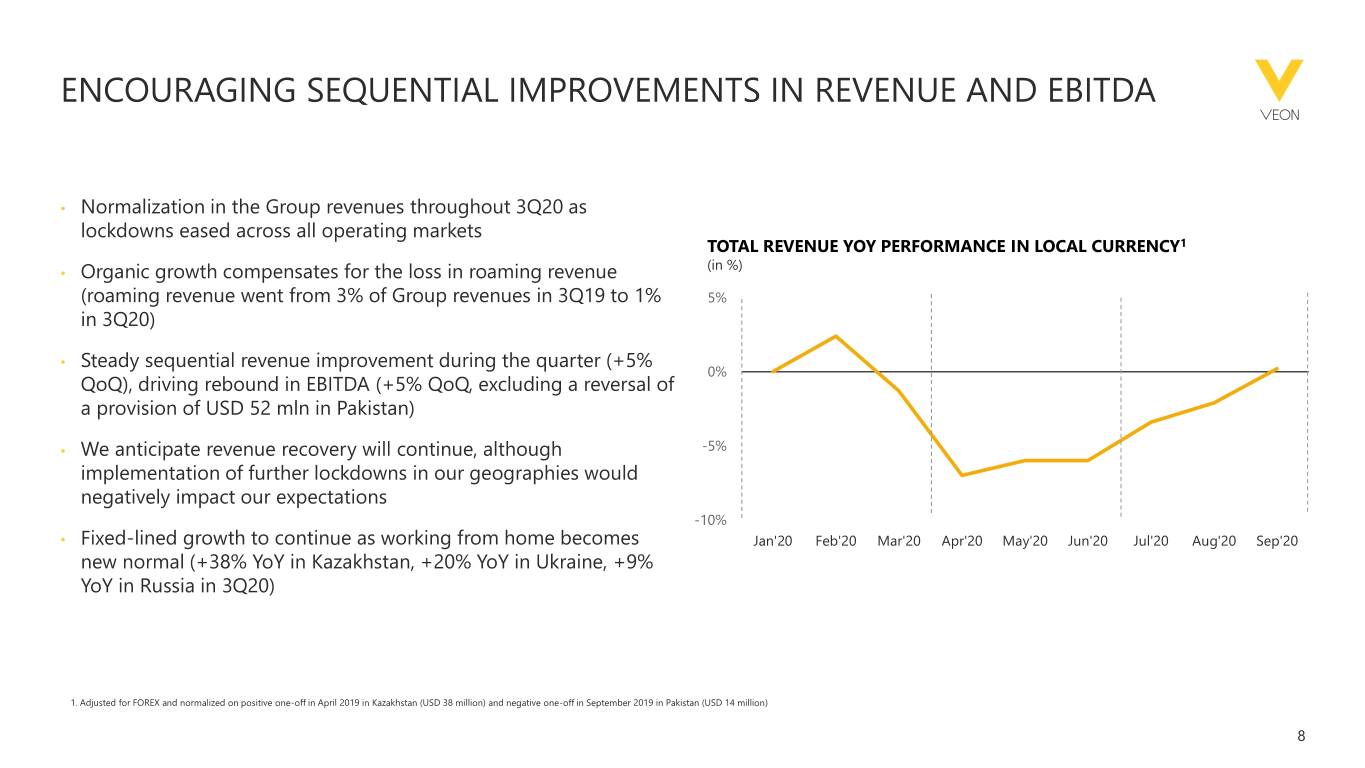
ENCOURAGING SEQUENTIAL IMPROVEMENTS IN REVENUE AND EBITDA • Normalization in the Group revenues throughout 3Q20 as lockdowns eased across all operating markets TOTAL REVENUE YOY PERFORMANCE IN LOCAL CURRENCY1 (in %) • Organic growth compensates for the loss in roaming revenue (roaming revenue went from 3% of Group revenues in 3Q19 to 1% 5% in 3Q20) • Steady sequential revenue improvement during the quarter (+5% 0% QoQ), driving rebound in EBITDA (+5% QoQ, excluding a reversal of a provision of USD 52 mln in Pakistan) • We anticipate revenue recovery will continue, although -5% implementation of further lockdowns in our geographies would negatively impact our expectations -10% • Fixed-lined growth to continue as working from home becomes Jan'20 Feb'20 Mar'20 Apr'20 May'20 Jun'20 Jul'20 Aug'20 Sep'20 new normal (+38% YoY in Kazakhstan, +20% YoY in Ukraine, +9% YoY in Russia in 3Q20) 1. Adjusted for FOREX and normalized on positive one-off in April 2019 in Kazakhstan (USD 38 million) and negative one-off in September 2019 in Pakistan (USD 14 million) 8
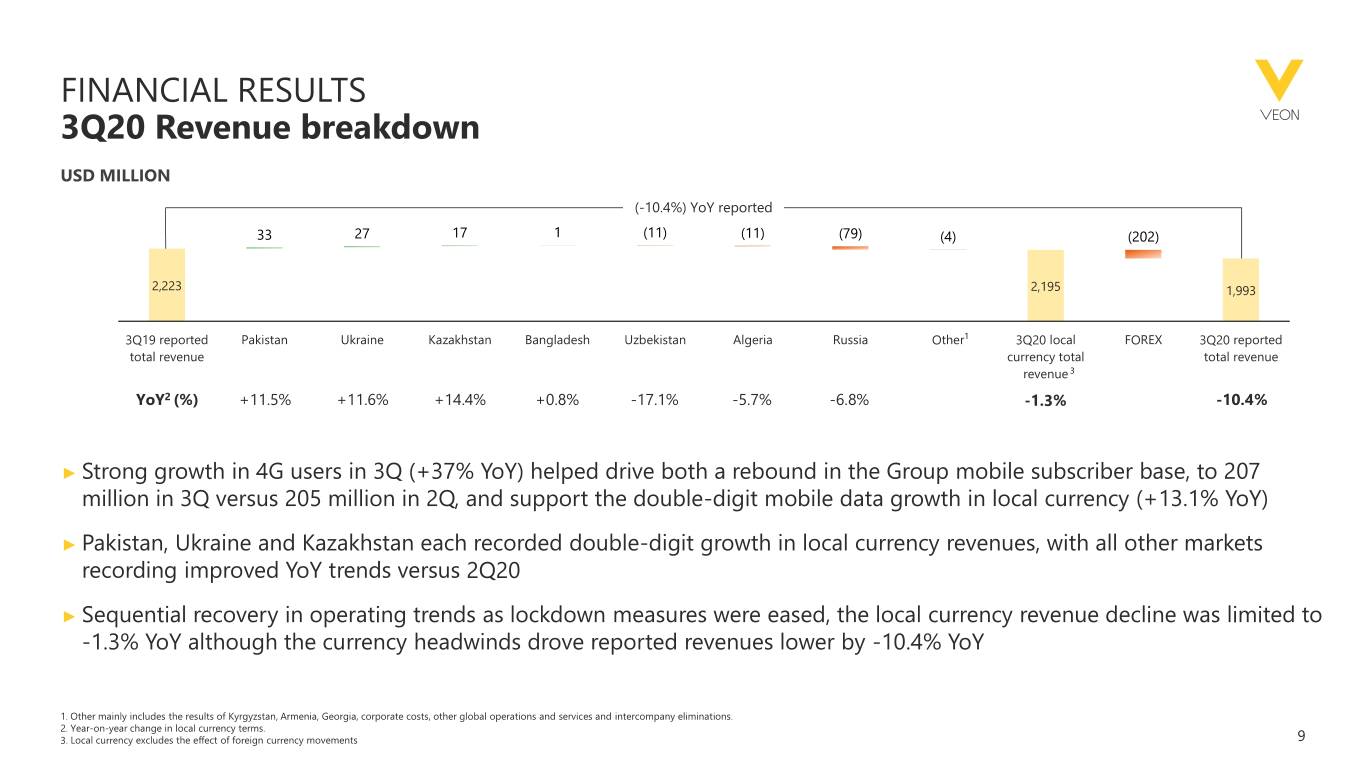
FINANCIAL RESULTS 3Q20 Revenue breakdown USD MILLION (-10.4%) YoY reported 33 27 17 1 (11) (11) (79) (4) (202) 2,223 2,195 1,993 3Q19 reported Pakistan Ukraine Kazakhstan Bangladesh Uzbekistan Algeria Russia Other1 3Q20 local FOREX 3Q20 reported total revenue currency total total revenue revenue 3 YoY2 (%) +11.5% +11.6% +14.4% +0.8% -17.1% -5.7% -6.8% -1.3% -10.4% ► Strong growth in 4G users in 3Q (+37% YoY) helped drive both a rebound in the Group mobile subscriber base, to 207 million in 3Q versus 205 million in 2Q, and support the double-digit mobile data growth in local currency (+13.1% YoY) ► Pakistan, Ukraine and Kazakhstan each recorded double-digit growth in local currency revenues, with all other markets recording improved YoY trends versus 2Q20 ► Sequential recovery in operating trends as lockdown measures were eased, the local currency revenue decline was limited to -1.3% YoY although the currency headwinds drove reported revenues lower by -10.4% YoY 1. Other mainly includes the results of Kyrgyzstan, Armenia, Georgia, corporate costs, other global operations and services and intercompany eliminations. 2. Year-on-year change in local currency terms. 3. Local currency excludes the effect of foreign currency movements 9
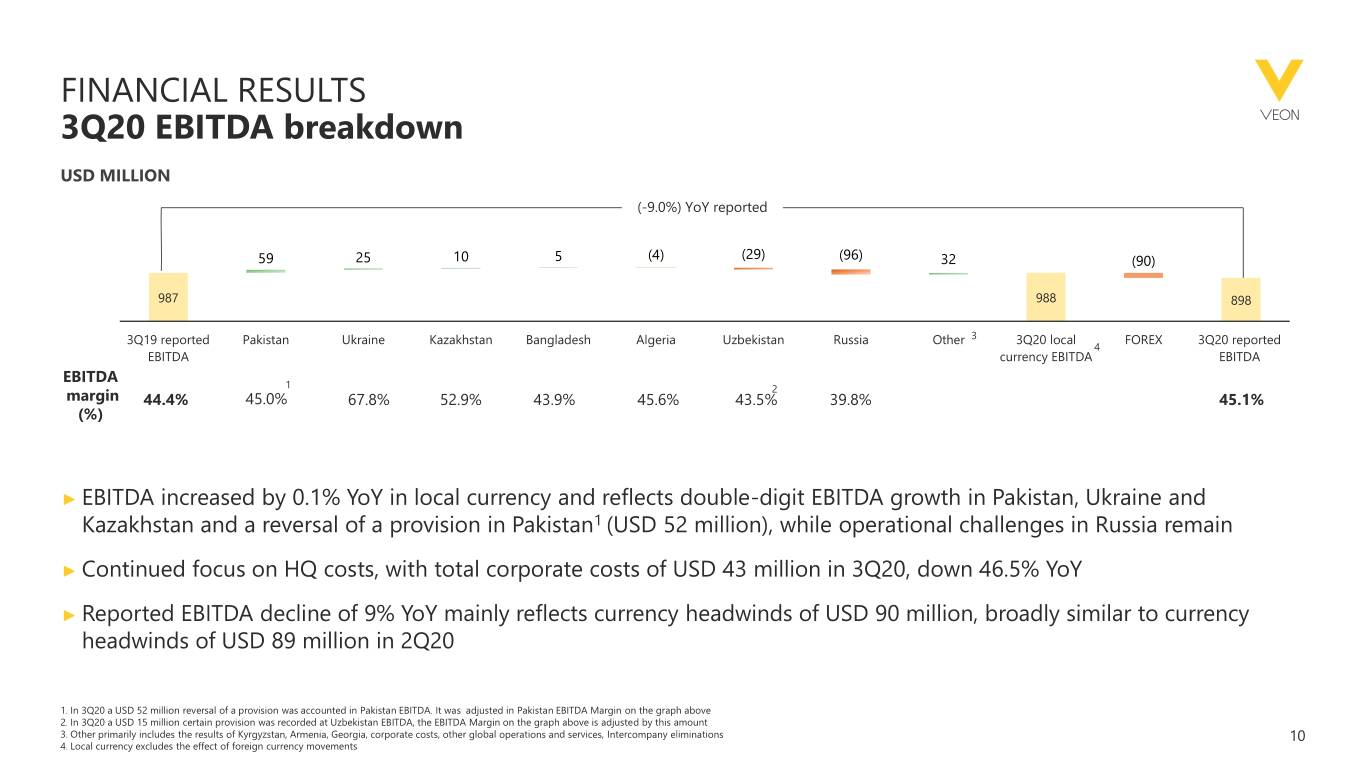
FINANCIAL RESULTS 3Q20 EBITDA breakdown USD MILLION (-9.0%) YoY reported 59 25 10 5 (4) (29) (96) 32 (90) 987 988 898 3Q19 reported Pakistan Ukraine Kazakhstan Bangladesh Algeria Uzbekistan Russia Other 3 3Q20 local FOREX 3Q20 reported 4 EBITDA currency EBITDA EBITDA EBITDA 1 2 margin 44.4% 45.0% 67.8% 52.9% 43.9% 45.6% 43.5% 39.8% 45.1% (%) ► EBITDA increased by 0.1% YoY in local currency and reflects double-digit EBITDA growth in Pakistan, Ukraine and Kazakhstan and a reversal of a provision in Pakistan1 (USD 52 million), while operational challenges in Russia remain ► Continued focus on HQ costs, with total corporate costs of USD 43 million in 3Q20, down 46.5% YoY ► Reported EBITDA decline of 9% YoY mainly reflects currency headwinds of USD 90 million, broadly similar to currency headwinds of USD 89 million in 2Q20 1. In 3Q20 a USD 52 million reversal of a provision was accounted in Pakistan EBITDA. It was adjusted in Pakistan EBITDA Margin on the graph above 2. In 3Q20 a USD 15 million certain provision was recorded at Uzbekistan EBITDA, the EBITDA Margin on the graph above is adjusted by this amount 3. Other primarily includes the results of Kyrgyzstan, Armenia, Georgia, corporate costs, other global operations and services, Intercompany eliminations 10 4. Local currency excludes the effect of foreign currency movements
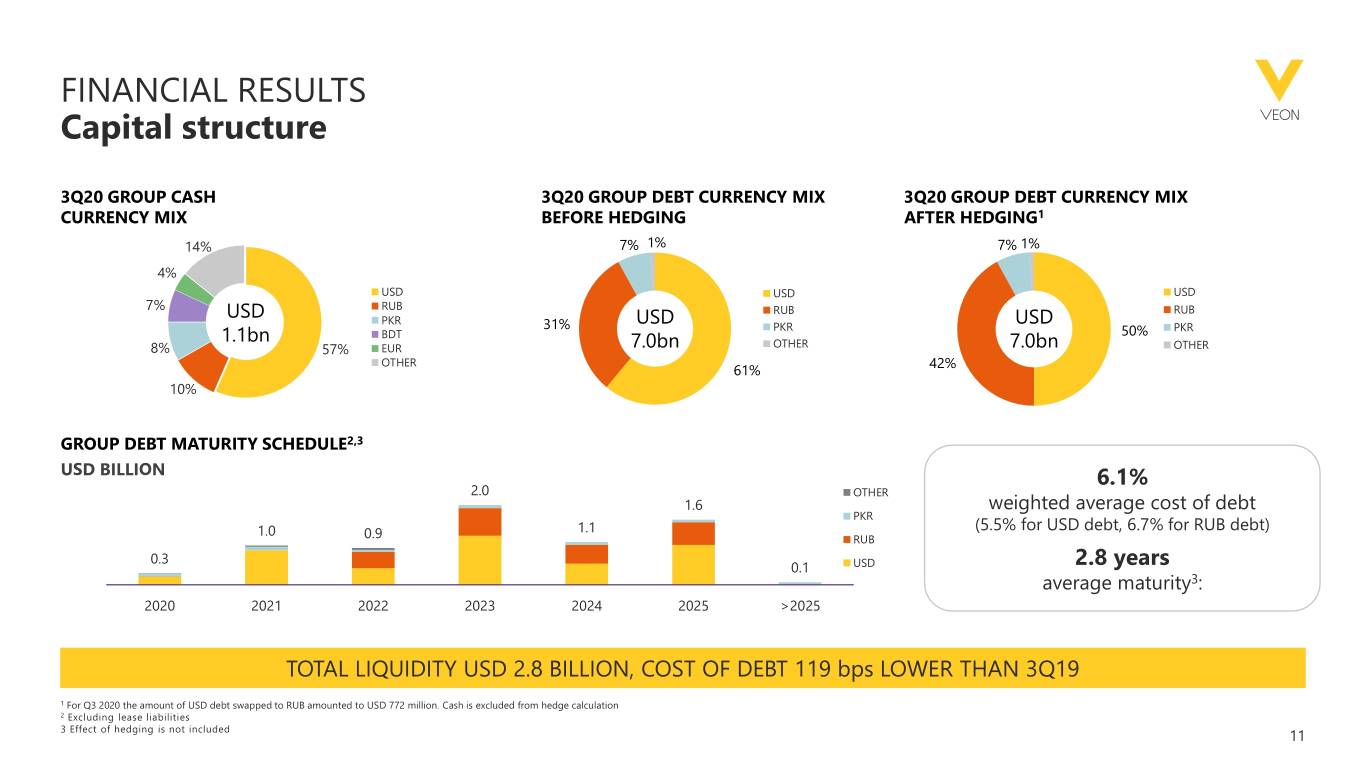
FINANCIAL RESULTS Capital structure 3Q20 GROUP CASH 3Q20 GROUP DEBT CURRENCY MIX 3Q20 GROUP DEBT CURRENCY MIX CURRENCY MIX BEFORE HEDGING AFTER HEDGING1 14% 7% 1% 7% 1% 4% USD USD USD 7% RUB RUB RUB USD PKR USD USD 31% PKR PKR 1.1bn BDT 50% 8% 57% EUR 7.0bn OTHER 7.0bn OTHER OTHER 42% 61% 10% GROUP DEBT MATURITY SCHEDULE2,3 USD BILLION 6.1% 2.0 OTHER 1.6 weighted average cost of debt PKR 1.0 1.1 (5.5% for USD debt, 6.7% for RUB debt) 0.9 RUB 0.3 0.1 USD 2.8 years average maturity3: 2020 2021 2022 2023 2024 2025 >2025 TOTAL LIQUIDITY USD 2.8 BILLION, COST OF DEBT 119 bps LOWER THAN 3Q19 1 For Q3 2020 the amount of USD debt swapped to RUB amounted to USD 772 million. Cash is excluded from hedge calculation 2 Excluding lease liabilities 3 Effect of hedging is not included 11
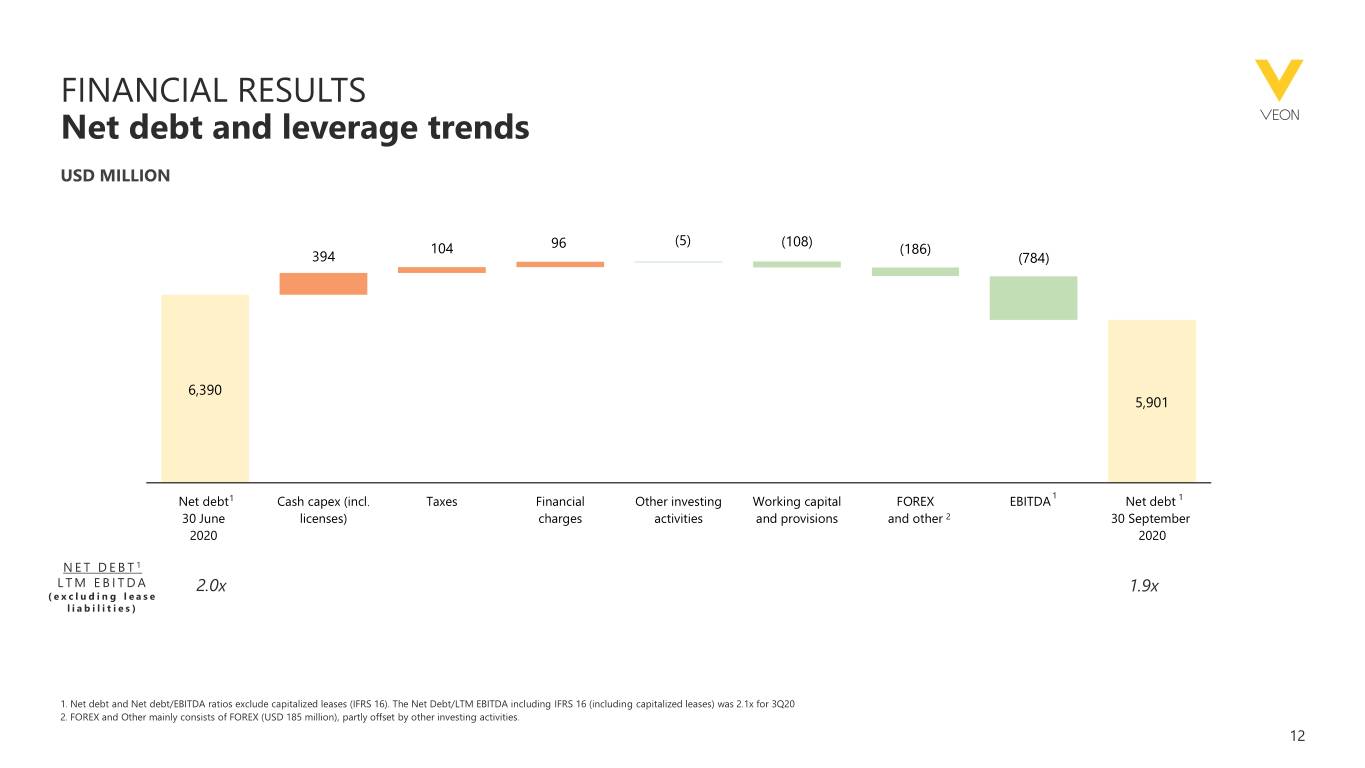
FINANCIAL RESULTS Net debt and leverage trends USD MILLION (5) (108) 104 96 (186) 394 (784) 6,390 5,901 Net debt1 Cash capex (incl. Taxes Financial Other investing Working capital FOREX EBITDA 1 Net debt 1 30 June licenses) charges activities and provisions and other 2 30 September 2020 2020 N E T D E B T 1 LTM EBITDA 2.0x 1.9x ( e x c l u d i n g l e a s e liabilities) 1. Net debt and Net debt/EBITDA ratios exclude capitalized leases (IFRS 16). The Net Debt/LTM EBITDA including IFRS 16 (including capitalized leases) was 2.1x for 3Q20 2. FOREX and Other mainly consists of FOREX (USD 185 million), partly offset by other investing activities. 12
AGENDA 1. OPENING Nik Kershaw: Head of IR 2. FINANCIAL RESULTS Serkan Okandan: CFO 3. OPERATIONAL REVIEW Kaan Terzioğlu: Co-CEO Sergi Herrero: Co-CEO 4. OUTLOOK AND GUIDANCE Serkan Okandan: CFO 13
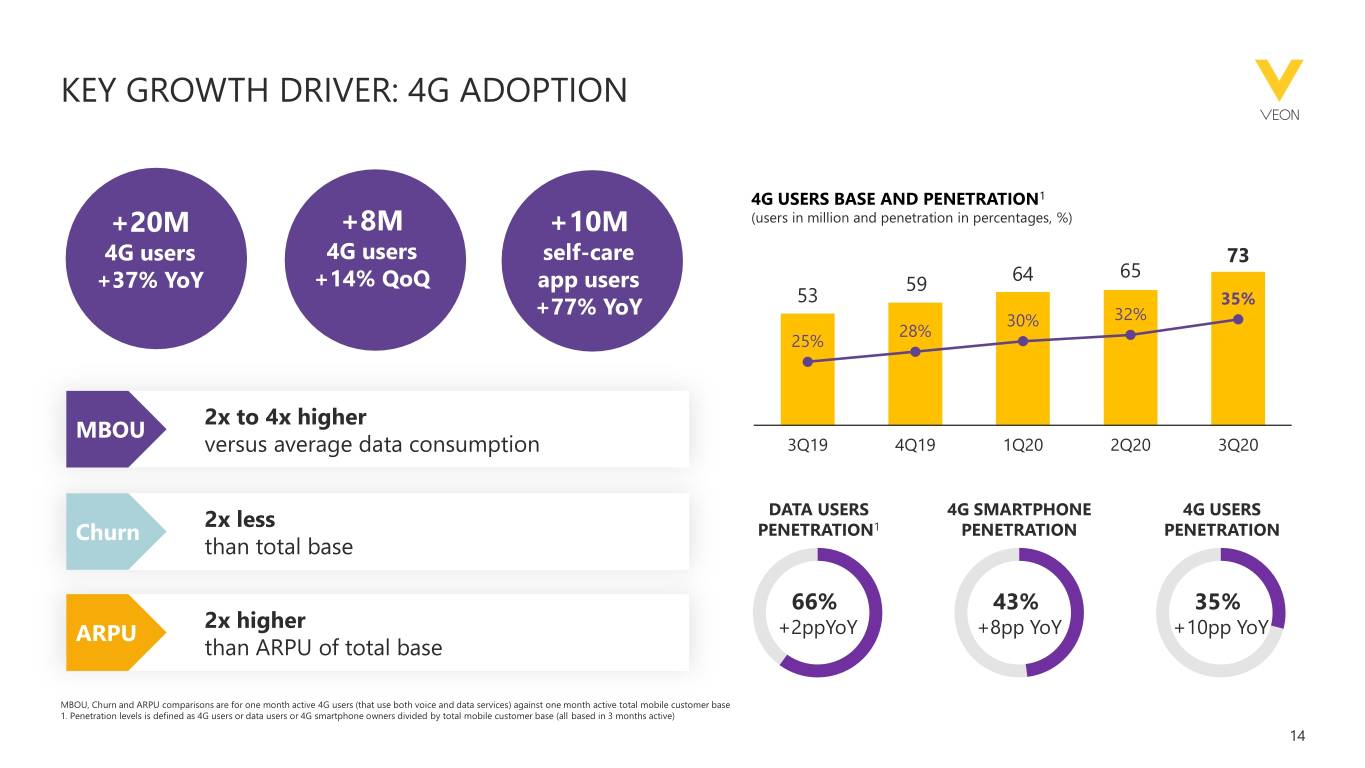
KEY GROWTH DRIVER: 4G ADOPTION 4G USERS BASE AND PENETRATION1 +20M +8M +10M (users in million and penetration in percentages, %) 4G users 4G users self-care 73 64 65 +37% YoY +14% QoQ app users 59 53 +77% YoY 35% 30% 32% 28% 25% 2x to 4x higher MBOU versus average data consumption 3Q19 4Q19 1Q20 2Q20 3Q20 2x less DATA USERS 4G SMARTPHONE 4G USERS Churn PENETRATION1 PENETRATION PENETRATION than total base 66% 43% 35% 2x higher ARPU +2ppYoY +8pp YoY +10pp YoY than ARPU of total base MBOU, Churn and ARPU comparisons are for one month active 4G users (that use both voice and data services) against one month active total mobile customer base 1. Penetration levels is defined as 4G users or data users or 4G smartphone owners divided by total mobile customer base (all based in 3 months active) 14
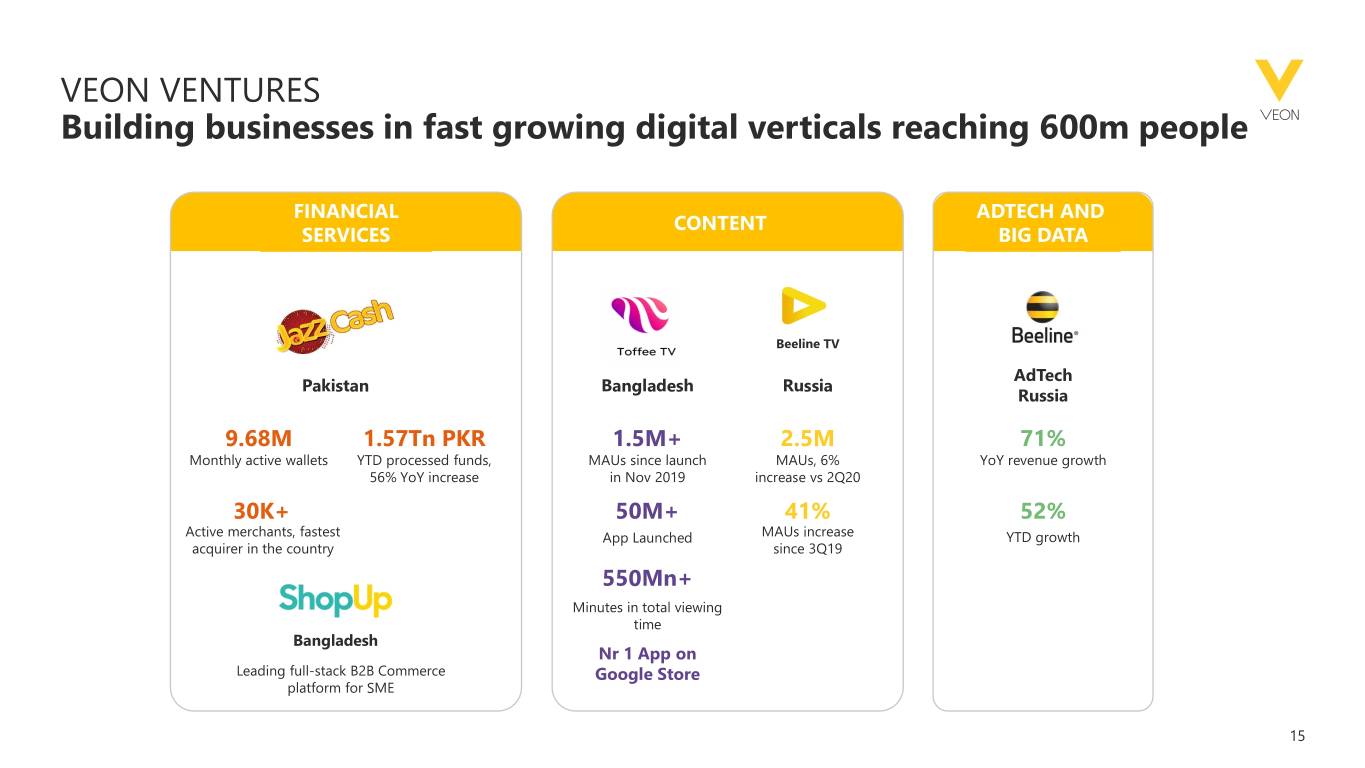
VEON VENTURES Building businesses in fast growing digital verticals reaching 600m people FINANCIAL ADTECH AND CONTENT SERVICES BIG DATA Beeline TV AdTech Pakistan Bangladesh Russia Russia 9.68M 1.57Tn PKR 1.5M+ 2.5M 71% Monthly active wallets YTD processed funds, MAUs since launch MAUs, 6% YoY revenue growth 56% YoY increase in Nov 2019 increase vs 2Q20 30K+ 50M+ 41% 52% Active merchants, fastest App Launched MAUs increase YTD growth acquirer in the country since 3Q19 550Mn+ Minutes in total viewing time Bangladesh Nr 1 App on Leading full-stack B2B Commerce Google Store platform for SME 15
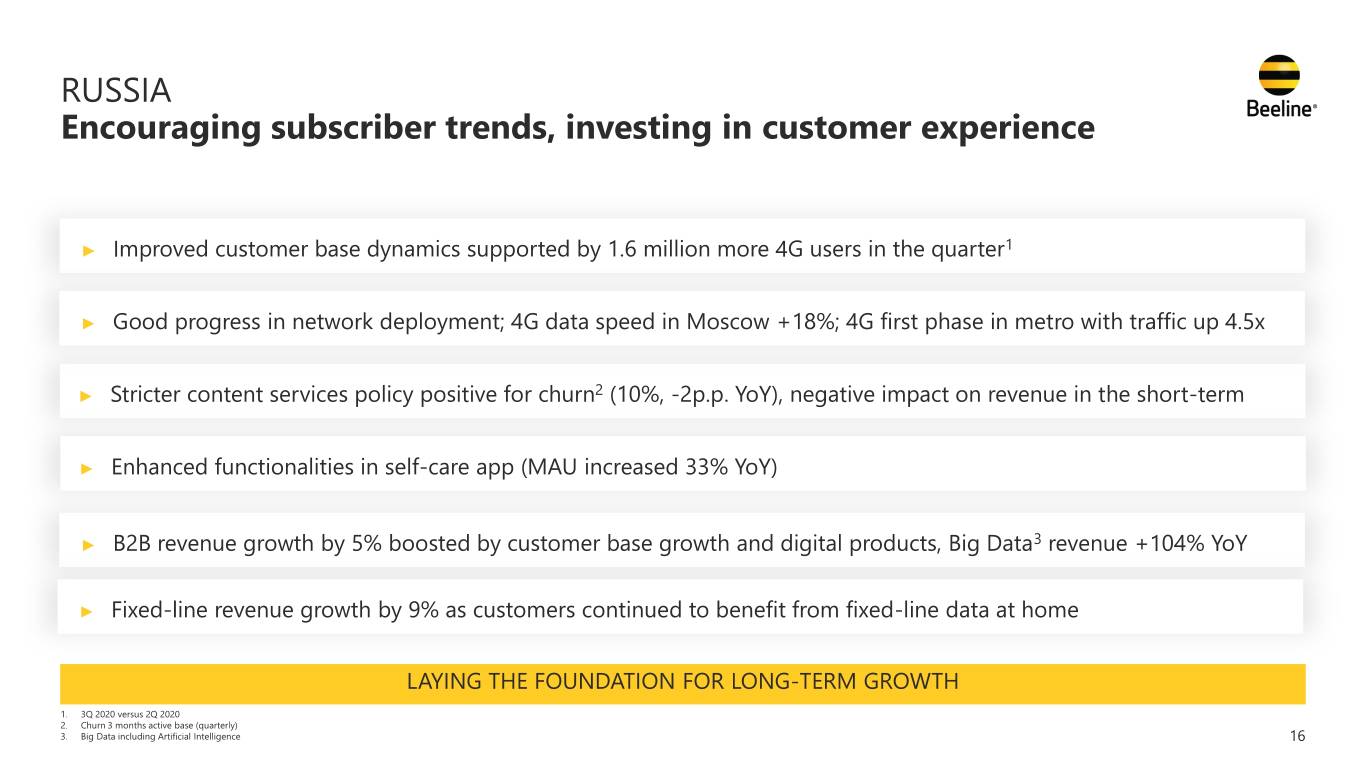
RUSSIA Encouraging subscriber trends, investing in customer experience ► Improved customer base dynamics supported by 1.6 million more 4G users in the quarter1 ► Good progress in network deployment; 4G data speed in Moscow +18%; 4G first phase in metro with traffic up 4.5x ► Stricter content services policy positive for churn2 (10%, -2p.p. YoY), negative impact on revenue in the short-term ► Enhanced functionalities in self-care app (MAU increased 33% YoY) ► B2B revenue growth by 5% boosted by customer base growth and digital products, Big Data3 revenue +104% YoY ► Fixed-line revenue growth by 9% as customers continued to benefit from fixed-line data at home LAYING THE FOUNDATION FOR LONG-TERM GROWTH 1. 3Q 2020 versus 2Q 2020 2. Churn 3 months active base (quarterly) 3. Big Data including Artificial Intelligence 16
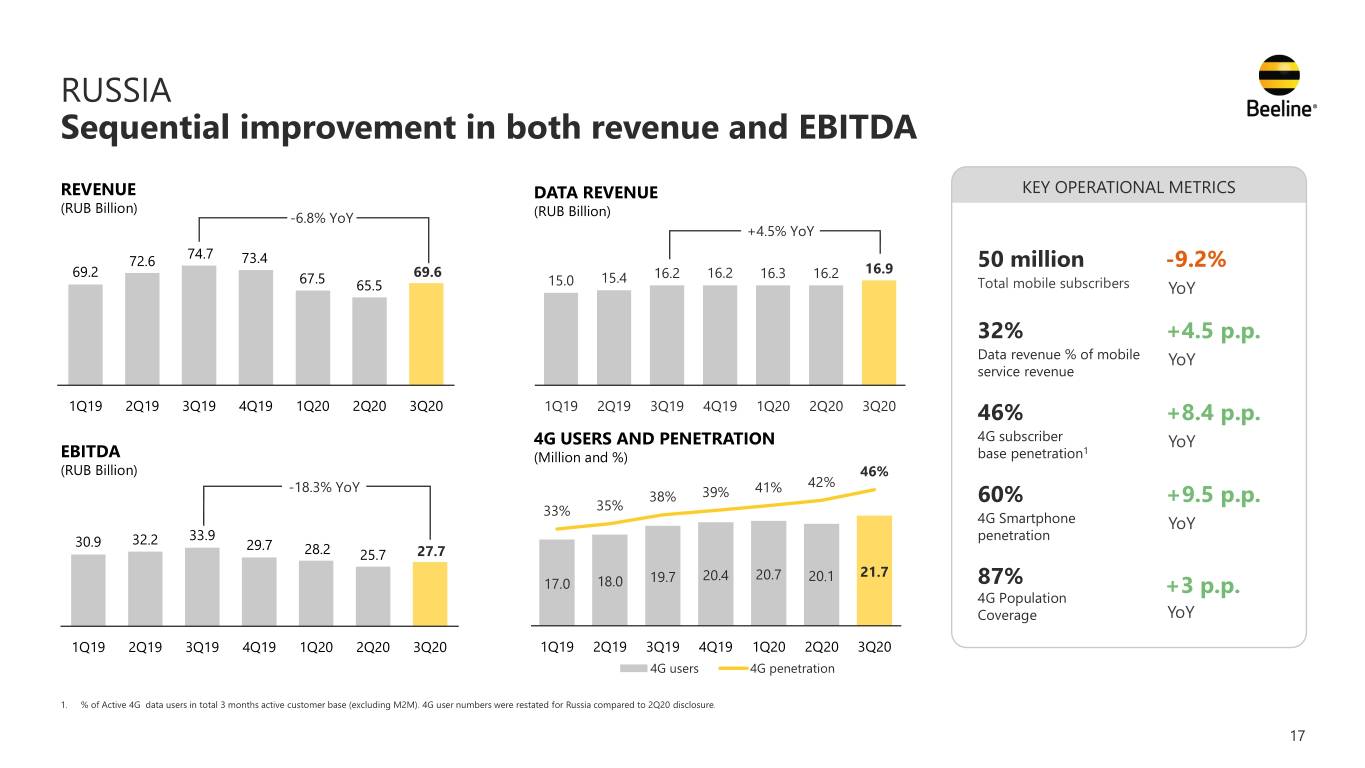
RUSSIA Sequential improvement in both revenue and EBITDA REVENUE DATA REVENUE KEY OPERATIONAL METRICS (RUB Billion) -6.8% YoY (RUB Billion) +4.5% YoY 74.7 72.6 73.4 16.9 50 million -9.2% 69.2 67.5 69.6 15.4 16.2 16.2 16.3 16.2 65.5 15.0 Total mobile subscribers YoY 32% +4.5 p.p. Data revenue % of mobile YoY service revenue 1Q19 2Q19 3Q19 4Q19 1Q20 2Q20 3Q20 1Q19 2Q19 3Q19 4Q19 1Q20 2Q20 3Q20 46% 60 +8.4 p.p. 4G USERS AND PENETRATION 4G subscriber YoY EBITDA (Million and %) base penetration1 (RUB Billion) 46% -18.3% YoY 41% 42% 38% 39% 60% +9.5 p.p. 33% 35% 4G Smartphone YoY 33.9 penetration 30.9 32.2 29.7 28.2 25.7 27.7 20.4 20.7 20.1 21.7 17.0 18.0 19.7 87% +3 p.p. 4G Population Coverage YoY 1Q19 2Q19 3Q19 4Q19 1Q20 2Q20 3Q20 1Q19 2Q19 3Q19 4Q19 1Q20 2Q20 3Q20 4G users 4G penetration 1. % of Active 4G data users in total 3 months active customer base (excluding M2M). 4G user numbers were restated for Russia compared to 2Q20 disclosure. 17
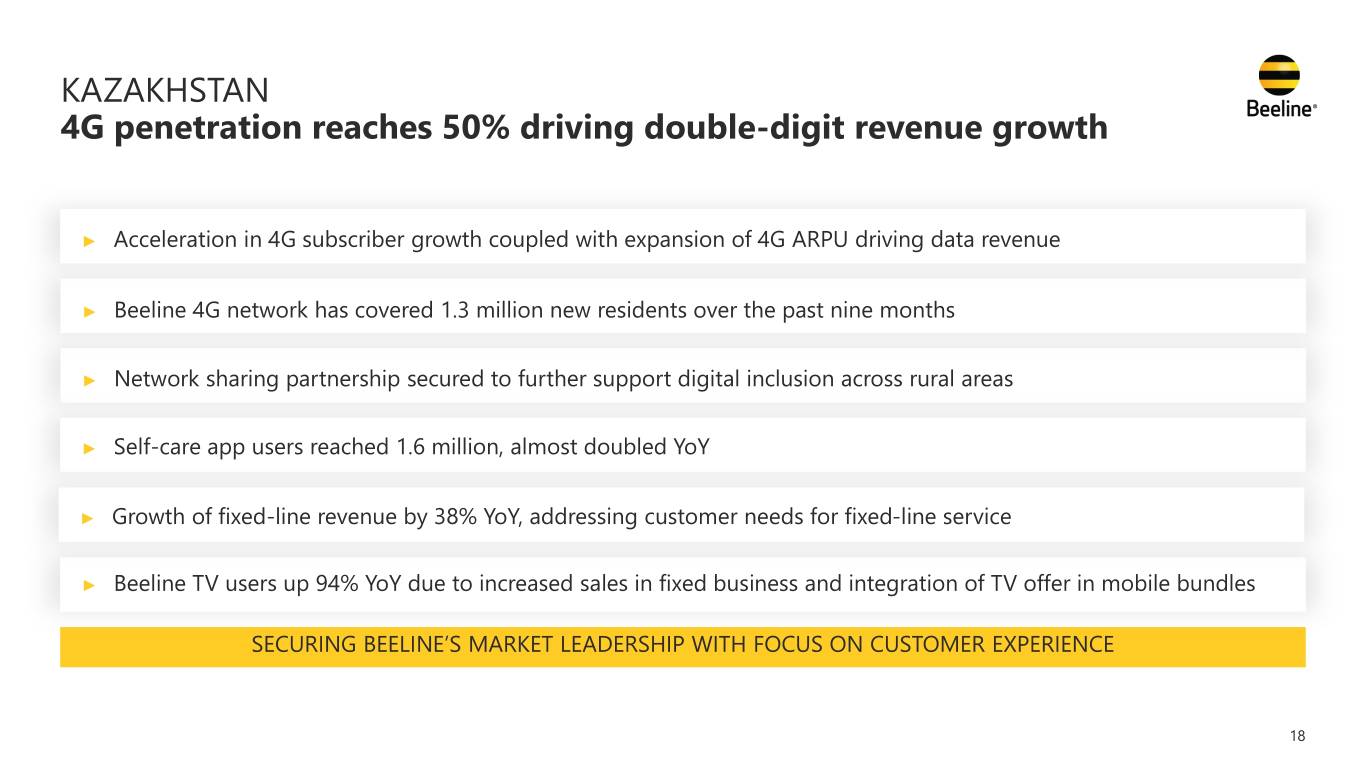
KAZAKHSTAN 4G penetration reaches 50% driving double-digit revenue growth ► Acceleration in 4G subscriber growth coupled with expansion of 4G ARPU driving data revenue ► Beeline 4G network has covered 1.3 million new residents over the past nine months ► Network sharing partnership secured to further support digital inclusion across rural areas ► Self-care app users reached 1.6 million, almost doubled YoY ► Growth of fixed-line revenue by 38% YoY, addressing customer needs for fixed-line service ► Beeline TV users up 94% YoY due to increased sales in fixed business and integration of TV offer in mobile bundles SECURING BEELINE’S MARKET LEADERSHIP WITH FOCUS ON CUSTOMER EXPERIENCE 18
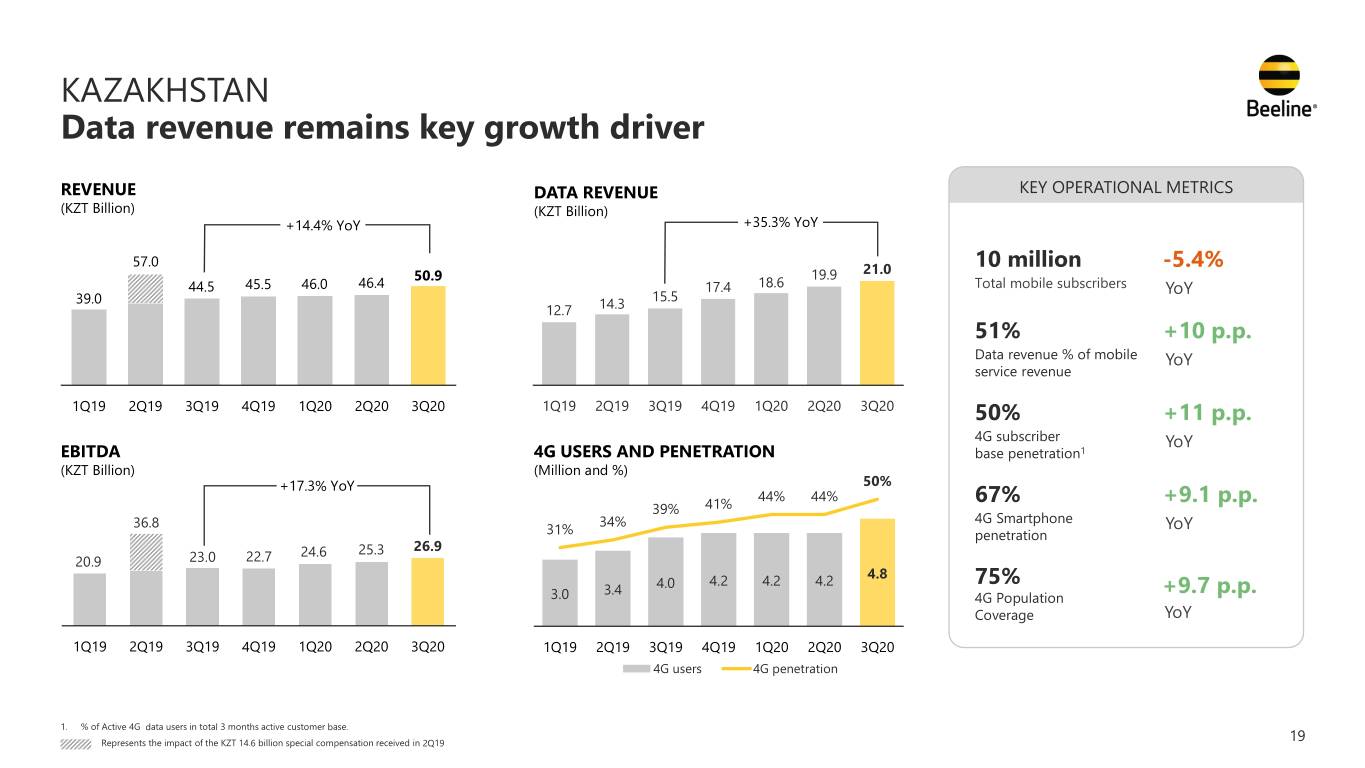
KAZAKHSTAN Data revenue remains key growth driver REVENUE DATA REVENUE KEY OPERATIONAL METRICS (KZT Billion) (KZT Billion) +14.4% YoY +35.3% YoY 70 57.0 60 10 million -5.4% 50.9 19.9 21.0 44.5 45.5 46.0 46.4 50 17.4 18.6 Total mobile subscribers YoY 39.0 15.5 40 12.7 14.3 30 51% +10 p.p. 20 Data revenue % of mobile 10 YoY service revenue 00 1Q19 2Q19 3Q19 4Q19 1Q20 2Q20 3Q20 1Q19 2Q19 3Q19 4Q19 1Q20 2Q20 3Q20 50% +11 p.p. 4G subscriber YoY EBITDA 4G USERS AND PENETRATION base penetration1 (KZT Billion) (Million and %) +17.3% YoY 50% 44% 44% 67% +9.1 p.p. 39% 41% 36.8 34% 4G Smartphone YoY 31% penetration 24.6 25.3 26.9 20.9 23.0 22.7 4.8 4.2 4.2 4.2 75% 3.4 4.0 +9.7 p.p. 3.0 4G Population Coverage YoY 1Q19 2Q19 3Q19 4Q19 1Q20 2Q20 3Q20 1Q19 2Q19 3Q19 4Q19 1Q20 2Q20 3Q20 4G users 4G penetration 1. % of Active 4G data users in total 3 months active customer base. Represents the impact of the KZT 14.6 billion special compensation received in 2Q19 19
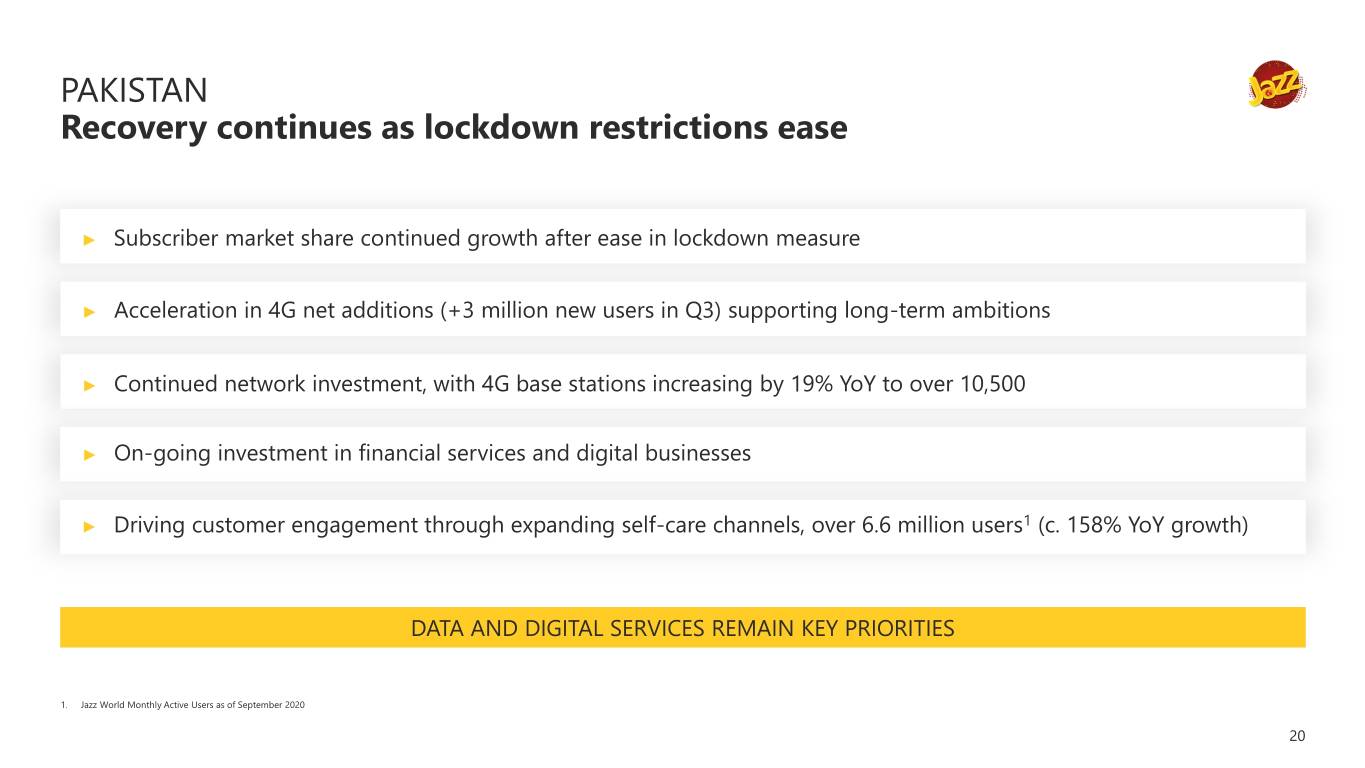
PAKISTAN Recovery continues as lockdown restrictions ease ► Subscriber market share continued growth after ease in lockdown measure ► Acceleration in 4G net additions (+3 million new users in Q3) supporting long-term ambitions ► Continued network investment, with 4G base stations increasing by 19% YoY to over 10,500 ► On-going investment in financial services and digital businesses ► Driving customer engagement through expanding self-care channels, over 6.6 million users1 (c. 158% YoY growth) DATA AND DIGITAL SERVICES REMAIN KEY PRIORITIES 1. Jazz World Monthly Active Users as of September 2020 20
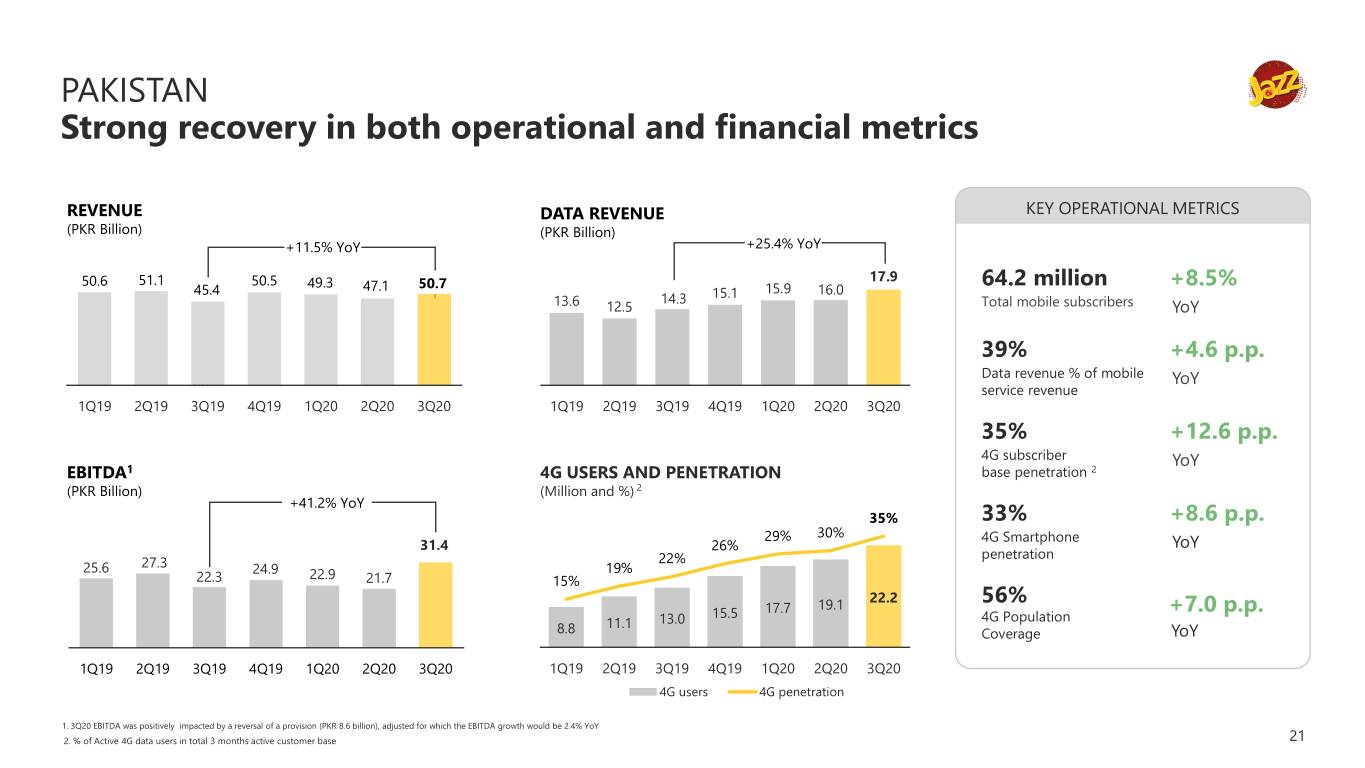
PAKISTAN Strong recovery in both operational and financial metrics REVENUE DATA REVENUE KEY OPERATIONAL METRICS (PKR Billion) (PKR Billion) +11.5% YoY +25.4% YoY 70.0 60.0 17.9 50.6 51.1 50.5 49.3 47.1 50.7 64.2 million +8.5% 45.4 50.0 15.1 15.9 16.0 13.6 14.3 Total mobile subscribers 40.0 12.5 YoY 30.0 20.0 39% +4.6 p.p. 10.0 Data revenue % of mobile 0.0 YoY service revenue 1Q19 2Q19 3Q19 4Q19 1Q20 2Q20 3Q20 1Q19 2Q19 3Q19 4Q19 1Q20 2Q20 3Q20 35% +12.6 p.p. 4G subscriber YoY EBITDA1 4G USERS AND PENETRATION base penetration 2 (PKR Billion) (Million and %) 2 +41.2% YoY 35% 33% +8.6 p.p. 29% 30% 4G Smartphone 31.4 26% YoY 22% penetration 25.6 27.3 24.9 19% 22.3 22.9 21.7 15% 19.1 22.2 56% 15.5 17.7 +7.0 p.p. 11.1 13.0 4G Population 8.8 Coverage YoY 1Q19 2Q19 3Q19 4Q19 1Q20 2Q20 3Q20 1Q19 2Q19 3Q19 4Q19 1Q20 2Q20 3Q20 4G users 4G penetration 1. 3Q20 EBITDA was positively impacted by a reversal of a provision (PKR 8.6 billion), adjusted for which the EBITDA growth would be 2.4% YoY 2. % of Active 4G data users in total 3 months active customer base 21
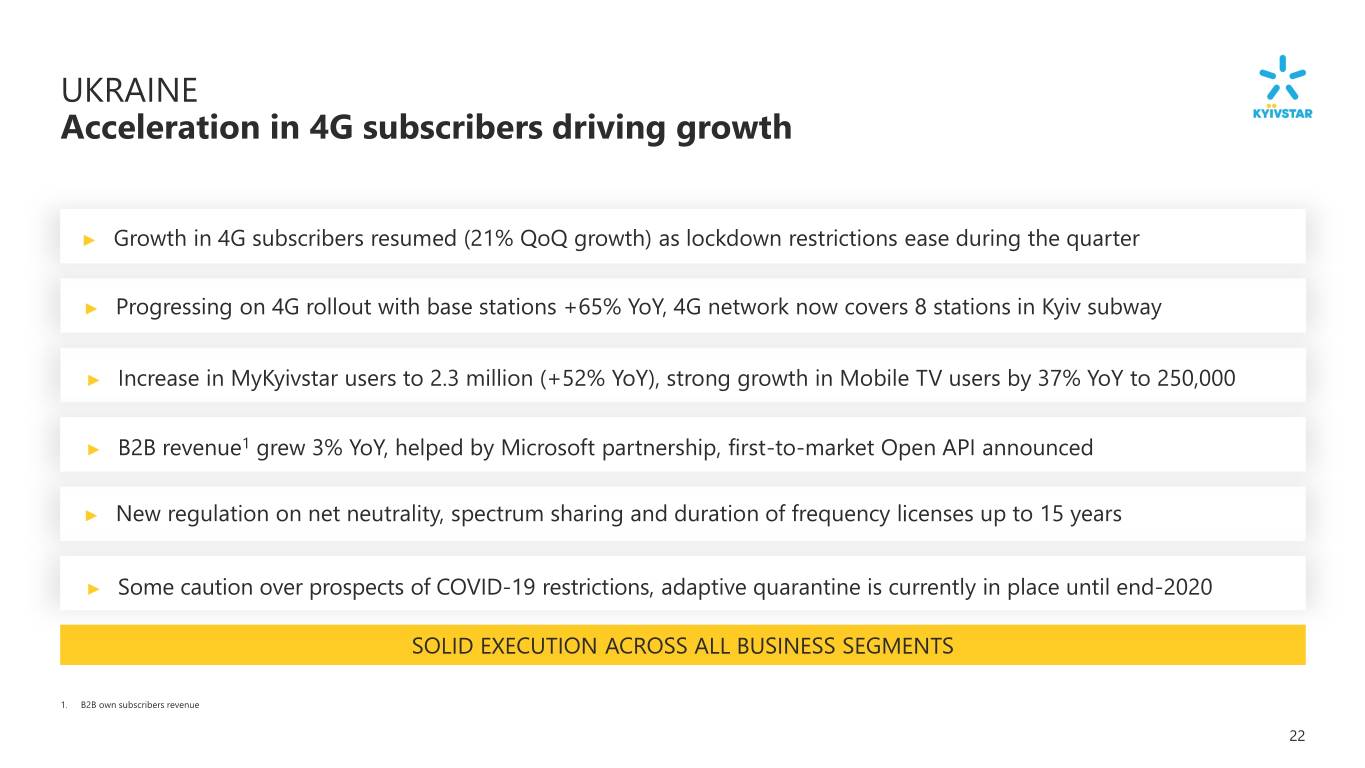
UKRAINE Acceleration in 4G subscribers driving growth ► Growth in 4G subscribers resumed (21% QoQ growth) as lockdown restrictions ease during the quarter ► Progressing on 4G rollout with base stations +65% YoY, 4G network now covers 8 stations in Kyiv subway ► Increase in MyKyivstar users to 2.3 million (+52% YoY), strong growth in Mobile TV users by 37% YoY to 250,000 ► B2B revenue1 grew 3% YoY, helped by Microsoft partnership, first-to-market Open API announced ► New regulation on net neutrality, spectrum sharing and duration of frequency licenses up to 15 years ► Some caution over prospects of COVID-19 restrictions, adaptive quarantine is currently in place until end-2020 SOLID EXECUTION ACROSS ALL BUSINESS SEGMENTS 1. B2B own subscribers revenue 22
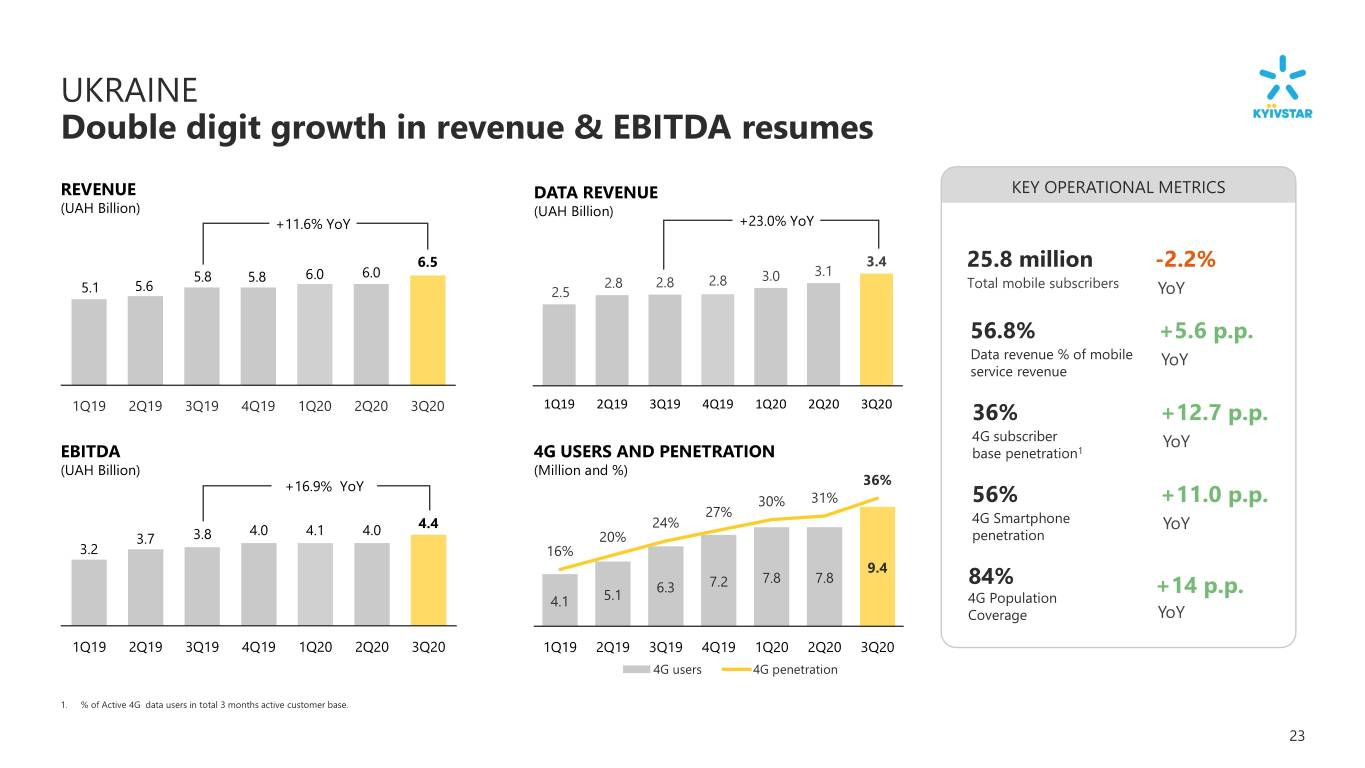
UKRAINE Double digit growth in revenue & EBITDA resumes REVENUE DATA REVENUE KEY OPERATIONAL METRICS (UAH Billion) (UAH Billion) +11.6% YoY +23.0% YoY 6.5 07 3.4 25.8 million -2.2% 5.8 5.8 6.0 6.0 3.0 3.1 06 2.8 2.8 2.8 Total mobile subscribers 5.1 5.6 2.5 YoY 05 04 03 56.8% +5.6 p.p. 02 Data revenue % of mobile YoY 01 service revenue 00 1Q19 2Q19 3Q19 4Q19 1Q20 2Q20 3Q20 1Q19 2Q19 3Q19 4Q19 1Q20 2Q20 3Q20 36% +12.7 p.p. 4G subscriber YoY EBITDA 4G USERS AND PENETRATION base penetration1 (UAH Billion) (Million and %) +16.9% YoY 36% 30% 31% 56% +11.0 p.p. 27% 24% 4G Smartphone 4.0 4.1 4.0 4.4 YoY 3.7 3.8 20% penetration 3.2 16% 9.4 7.8 7.8 84% 6.3 7.2 +14 p.p. 4.1 5.1 4G Population Coverage YoY 1Q19 2Q19 3Q19 4Q19 1Q20 2Q20 3Q20 1Q19 2Q19 3Q19 4Q19 1Q20 2Q20 3Q20 4G users 4G penetration 1. % of Active 4G data users in total 3 months active customer base. 23
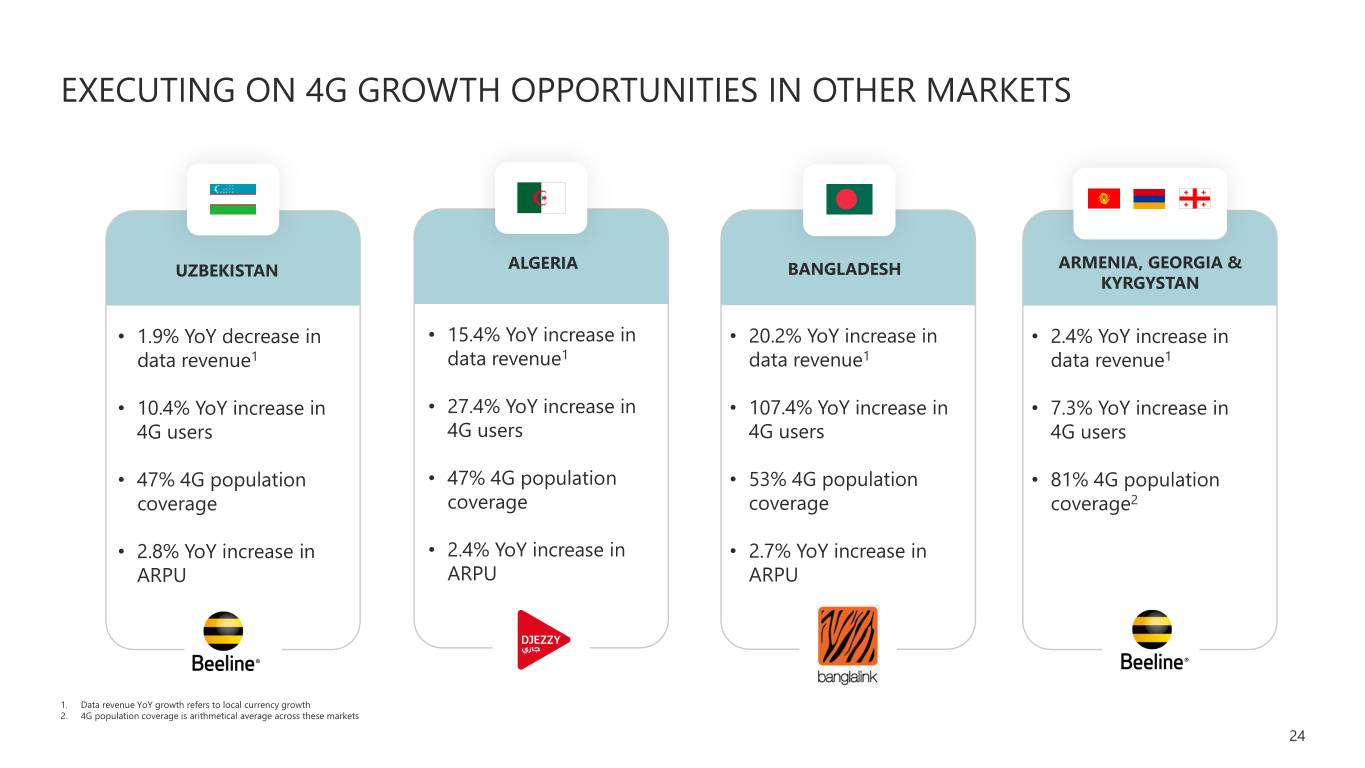
EXECUTING ON 4G GROWTH OPPORTUNITIES IN OTHER MARKETS UZBEKISTAN ALGERIA BANGLADESH ARMENIA, GEORGIA & KYRGYSTAN • 1.9% YoY decrease in • 15.4% YoY increase in • 20.2% YoY increase in • 2.4% YoY increase in data revenue1 data revenue1 data revenue1 data revenue1 • 10.4% YoY increase in • 27.4% YoY increase in • 107.4% YoY increase in • 7.3% YoY increase in 4G users 4G users 4G users 4G users • 47% 4G population • 47% 4G population • 53% 4G population • 81% 4G population coverage coverage coverage coverage2 • 2.8% YoY increase in • 2.4% YoY increase in • 2.7% YoY increase in ARPU ARPU ARPU 1. Data revenue YoY growth refers to local currency growth 2. 4G population coverage is arithmetical average across these markets 24
AGENDA 1. OPENING Nik Kershaw: Head of IR 2. FINANCIAL RESULTS Serkan Okandan: CFO 3. OPERATIONAL REVIEW Kaan Terzioğlu: Co-CEO Sergi Herrero: Co-CEO 4. OUTLOOK AND GUIDANCE Serkan Okandan: CFO 25
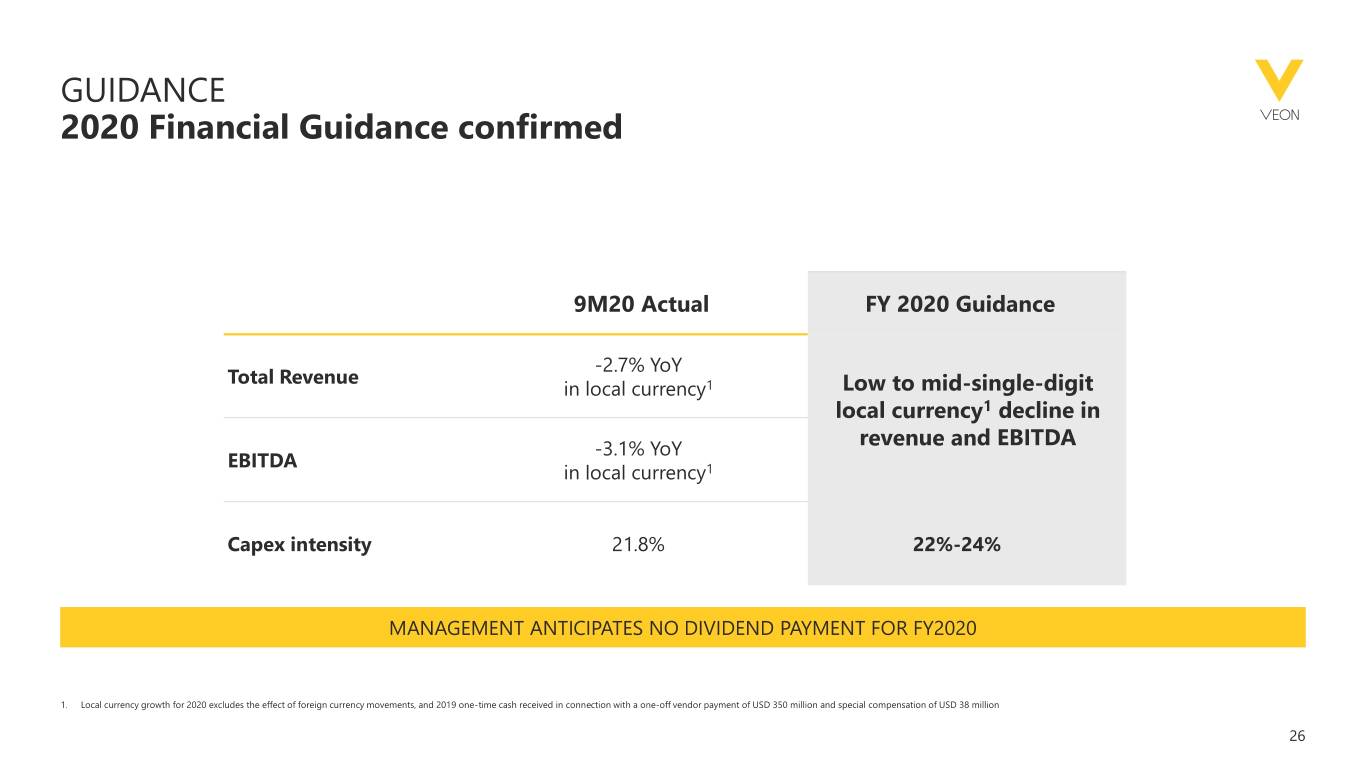
GUIDANCE 2020 Financial Guidance confirmed 9M20 Actual FY 2020 Guidance -2.7% YoY Total Revenue in local currency1 Low to mid-single-digit local currency1 decline in -3.1% YoY revenue and EBITDA EBITDA in local currency1 Capex intensity 21.8% 22%-24% MANAGEMENT ANTICIPATES NO DIVIDEND PAYMENT FOR FY2020 1. Local currency growth for 2020 excludes the effect of foreign currency movements, and 2019 one-time cash received in connection with a one-off vendor payment of USD 350 million and special compensation of USD 38 million 26
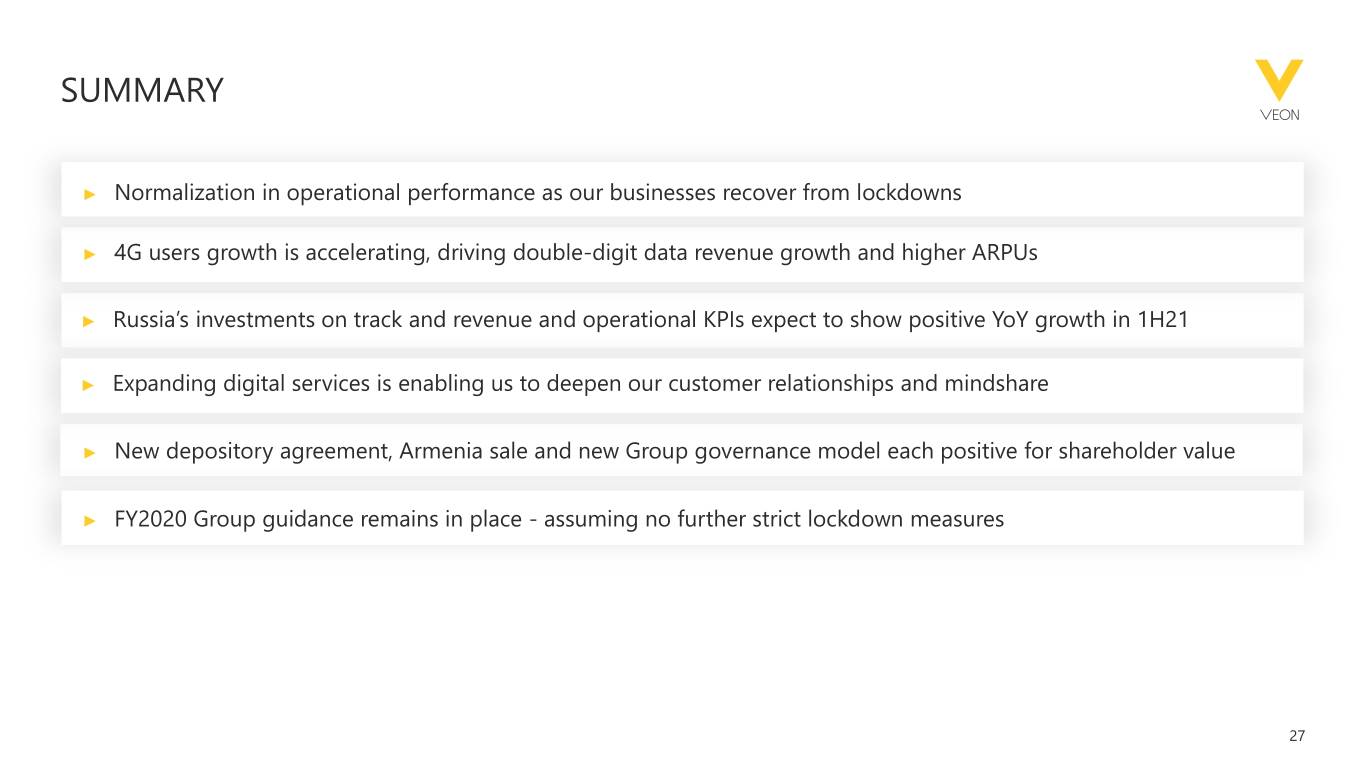
SUMMARY ► Normalization in operational performance as our businessesKKJ recover from lockdowns ► 4G users growth is accelerating, driving double-digit dataKKJ revenue growth and higher ARPUs ► Russia’s investments on track and revenue and operational KPIs expect to show positive YoY growth in 1H21 ► Expanding digital services is enabling us to deepen our customer relationships and mindshare ► New depository agreement, Armenia sale and new Group governance model each positive for shareholder value ► FY2020 Group guidance remains in place - assuming no further strict lockdown measures 27

APPENDIX ©VEON Ltd 2019
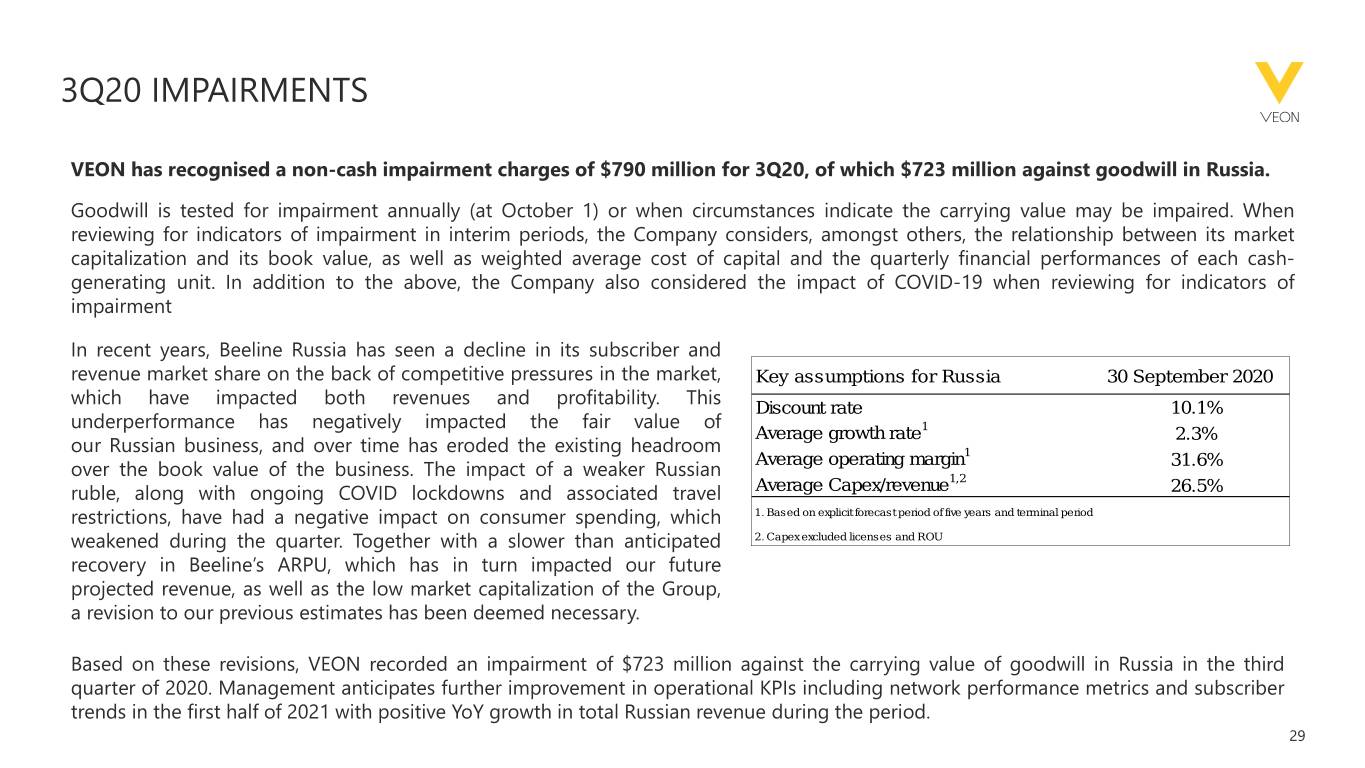
3Q20 IMPAIRMENTS VEON has recognised a non-cash impairment charges of $790 million for 3Q20, of which $723 million against goodwill in Russia. Goodwill is tested for impairment annually (at October 1) or when circumstances indicate the carrying value may be impaired. When reviewing for indicators of impairment in interim periods, the Company considers, amongst others, the relationship between its market capitalization and its book value, as well as weighted average cost of capital and the quarterly financial performances of each cash- generating unit. In addition to the above, the Company also considered the impact of COVID-19 when reviewing for indicators of impairment In recent years, Beeline Russia has seen a decline in its subscriber and revenue market share on the back of competitive pressures in the market, Key assumptions for Russia 30 September 2020 which have impacted both revenues and profitability. This Discount rate 10.1% underperformance has negatively impacted the fair value of Average growth rate1 2.3% our Russian business, and over time has eroded the existing headroom Average operating margin1 31.6% over the book value of the business. The impact of a weaker Russian 1,2 ruble, along with ongoing COVID lockdowns and associated travel Average Capex/revenue 26.5% restrictions, have had a negative impact on consumer spending, which 1. Based on explicit forecast period of five years and terminal period weakened during the quarter. Together with a slower than anticipated 2. Capex excluded licenses and ROU recovery in Beeline’s ARPU, which has in turn impacted our future projected revenue, as well as the low market capitalization of the Group, a revision to our previous estimates has been deemed necessary. Based on these revisions, VEON recorded an impairment of $723 million against the carrying value of goodwill in Russia in the third quarter of 2020. Management anticipates further improvement in operational KPIs including network performance metrics and subscriber trends in the first half of 2021 with positive YoY growth in total Russian revenue during the period. 29
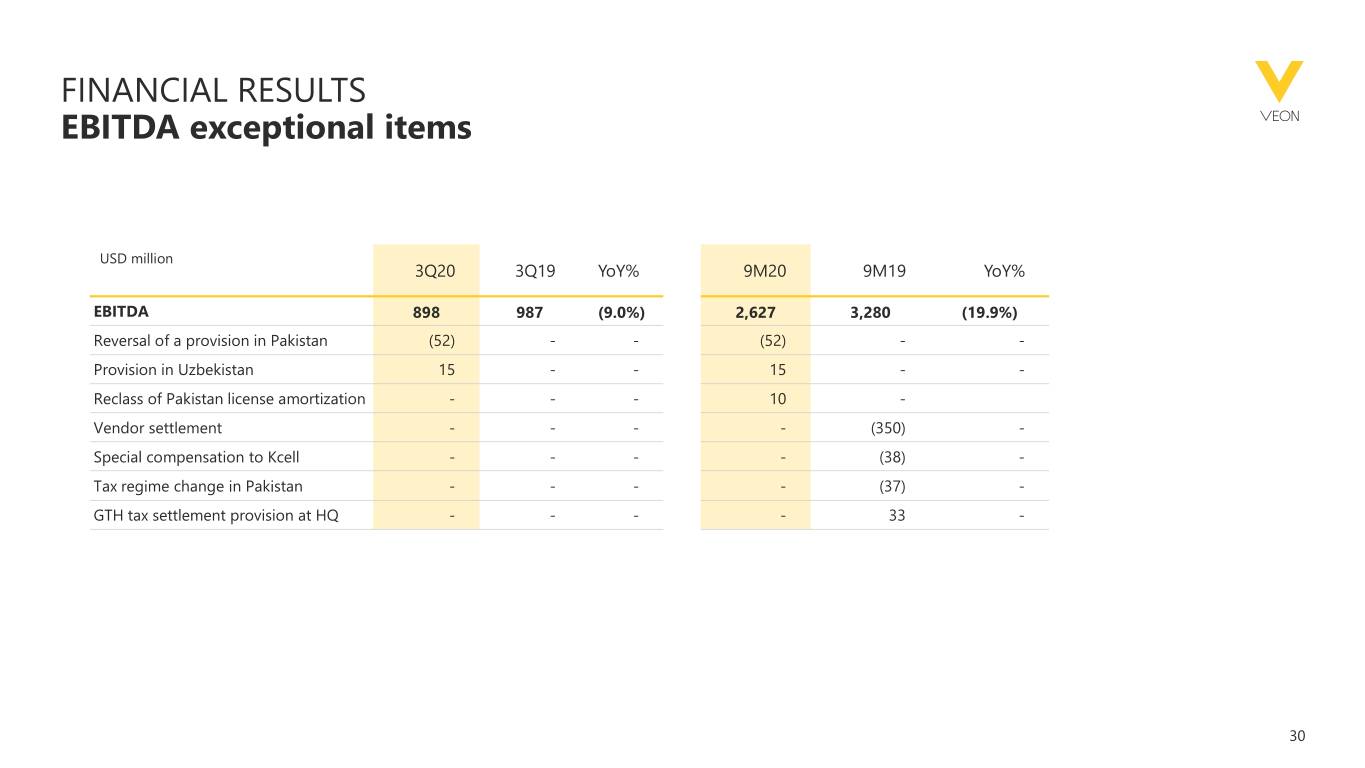
FINANCIAL RESULTS EBITDA exceptional items USD million 3Q20 3Q19 YoY% 9M20 9M19 YoY% EBITDA 898 987 (9.0%) 2,627 3,280 (19.9%) Reversal of a provision in Pakistan (52) - - (52) - - Provision in Uzbekistan 15 - - 15 - - Reclass of Pakistan license amortization - - - 10 - Vendor settlement - - - - (350) - Special compensation to Kcell - - - - (38) - Tax regime change in Pakistan - - - - (37) - GTH tax settlement provision at HQ - - - - 33 - 30
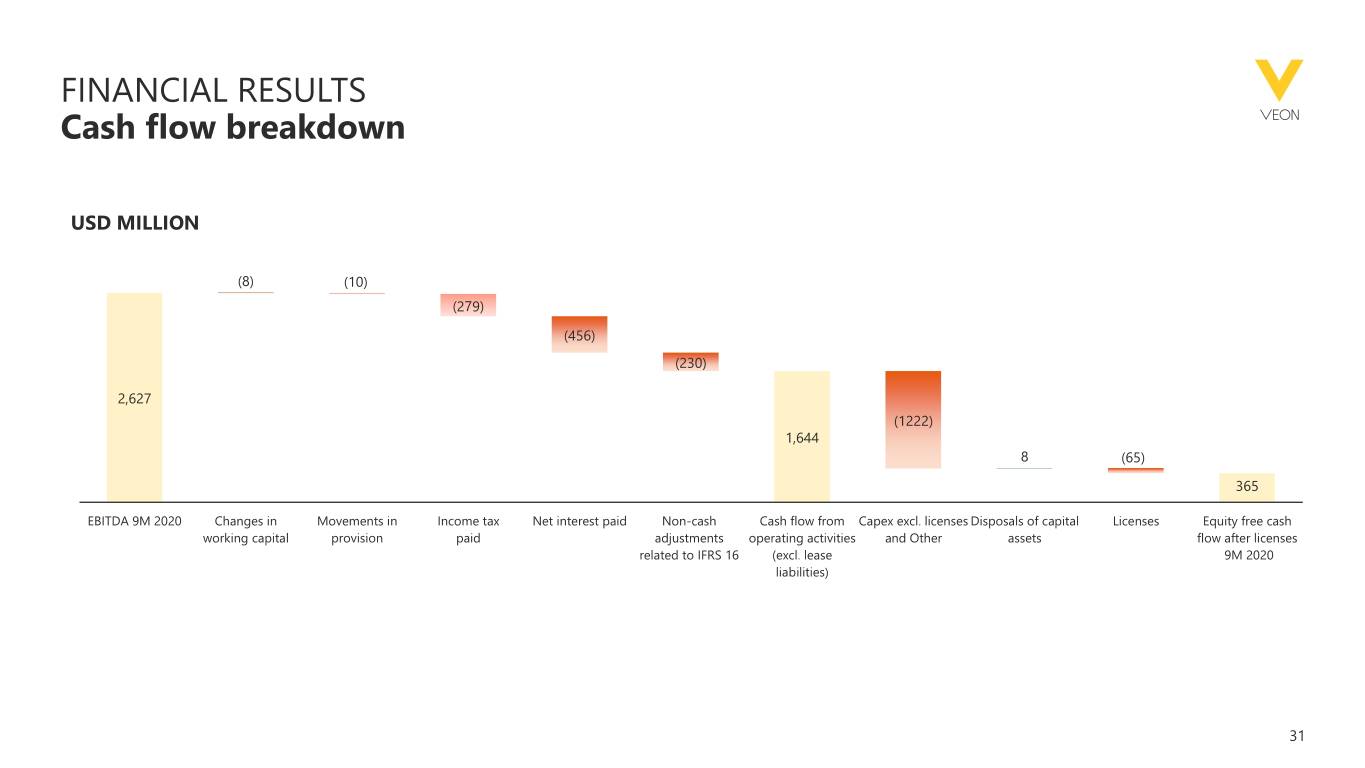
FINANCIAL RESULTS Cash flow breakdown USD MILLION (8) (10) (279) (456) (230) 2,627 (1222) 1,644 8 (65) 365 EBITDA 9M 2020 Changes in Movements in Income tax Net interest paid Non-cash Cash flow from Capex excl. licenses Disposals of capital Licenses Equity free cash working capital provision paid adjustments operating activities and Other assets flow after licenses related to IFRS 16 (excl. lease 9M 2020 liabilities) 31
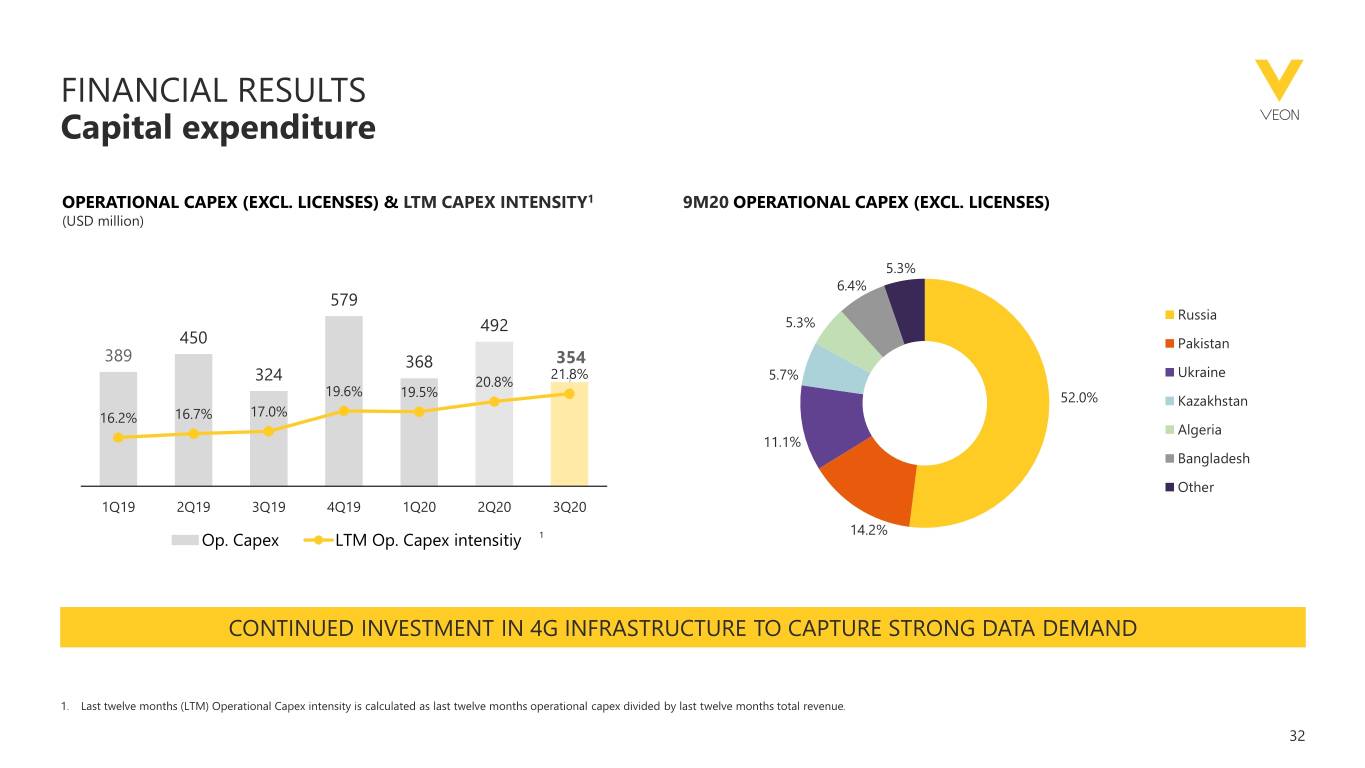
FINANCIAL RESULTS Capital expenditure OPERATIONAL CAPEX (EXCL. LICENSES) & LTM CAPEX INTENSITY1 9M20 OPERATIONAL CAPEX (EXCL. LICENSES) (USD million) 800 40.00% 5.3% 700 35.00% 6.4% 579 600 Russia 5.3% 492 30.00% 500 450 Pakistan 389 354 400 368 25.00% 21.8% 5.7% Ukraine 324 20.8% 300 19.6% 19.5% 52.0% 20.00% Kazakhstan 16.2% 16.7% 17.0% 200 Algeria 15.00% 11.1% 100 Bangladesh 0 10.00% Other 1Q19 2Q19 3Q19 4Q19 1Q20 2Q20 3Q20 14.2% Op. Capex LTM Op. Capex intensitiy 1 CONTINUED INVESTMENT IN 4G INFRASTRUCTURE TO CAPTURE STRONG DATA DEMAND 1. Last twelve months (LTM) Operational Capex intensity is calculated as last twelve months operational capex divided by last twelve months total revenue. 32
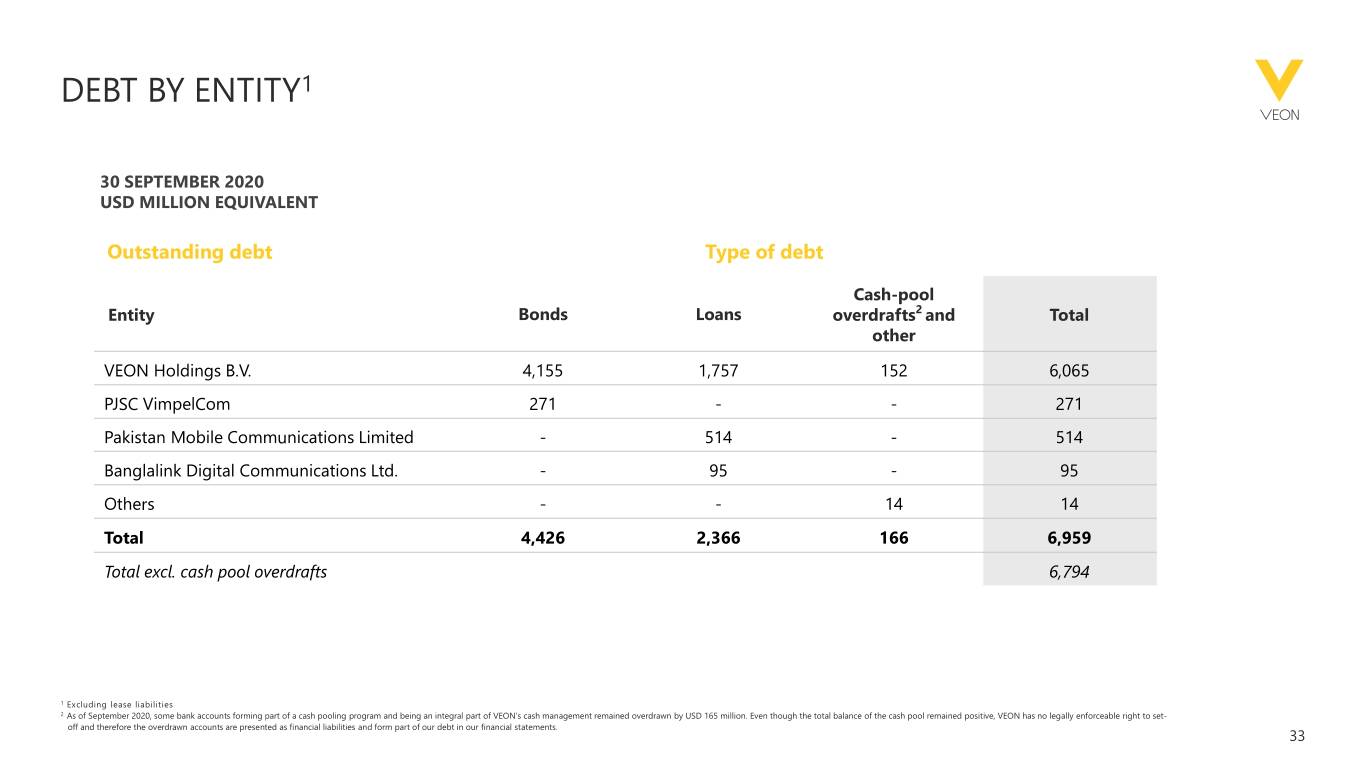
DEBT BY ENTITY1 30 SEPTEMBER 2020 USD MILLION EQUIVALENT Outstanding debt Type of debt Cash-pool Entity Bonds Loans overdrafts2 and Total other VEON Holdings B.V. 4,155 1,757 152 6,065 PJSC VimpelCom 271 - - 271 Pakistan Mobile Communications Limited - 514 - 514 Banglalink Digital Communications Ltd. - 95 - 95 Others - - 14 14 Total 4,426 2,366 166 6,959 Total excl. cash pool overdrafts 6,794 1 Excluding lease liabilities 2 As of September 2020, some bank accounts forming part of a cash pooling program and being an integral part of VEON’s cash management remained overdrawn by USD 165 million. Even though the total balance of the cash pool remained positive, VEON has no legally enforceable right to set- off and therefore the overdrawn accounts are presented as financial liabilities and form part of our debt in our financial statements. 33


