 Investor Meeting March 14, 2014 Exhibit 99.2 |
 Forward Looking Statements 2 This document is incomplete without reference to, and should be viewed solely in conjunction with, the oral presentation that accompanies this document; an audio webcast of the oral presentation will be available at www.investors.hyatt.com for 90 days from March 14, 2014. This presentation contains forward-looking statements within the meaning of the Private Securities Litigation Reform Act of 1995. These statements include statements about Hyatt Hotels Corporation’s (“Hyatt” or the “Company”) plans, strategies, financial performance, prospects or future events and involve known and unknown risks that are difficult to predict. As a result, our actual financial results, performance, achievements or prospects may differ materially from those expressed or implied by these forward-looking statements. In some cases, you can identify forward-looking statements by the use of words such as “may,” “could,” “expect,” “intend,” “plan,” “seek,” “anticipate,” “believe,” “estimate,” “predict,” “potential,” “continue,” “likely,” “will,” “would,” “illustrative” and variations of these terms and similar expressions, or the negative of these terms or similar expressions. Such forward-looking statements are necessarily based upon estimates and assumptions that, while considered reasonable by the Company and its management, are inherently uncertain. Factors that may cause actual results to differ materially from current expectations include, but are not limited to: (i) the factors discussed in the sections titled “Risk Factors” in Part I, Item 1A, and “Management’s Discussion and Analysis of Financial Condition and Results of Operations” in the Company’s 10-K filed on February 18, 2014; (ii) general economic uncertainty in key global markets and a worsening of global economic conditions or low levels of economic growth; (iii) levels of spending in the business and leisure segments as well as consumer confidence; (iv) declines in occupancy and average daily rate; (v) limited visibility with respect to short and medium-term group bookings; (vi) loss of key personnel; (vii) hostilities, including future terrorist attacks, or fear of hostilities that affect travel; (viii) travel-related accidents; (ix) natural or man-made disasters such as earthquakes, tsunamis, tornados, hurricanes, floods, oil spills and nuclear incidents; (x) the Company’s ability to successfully achieve certain levels of operating profits at hotels that have performance guarantees with our third-party owners; (xi) the impact of hotel renovations; (xii) the Company’s ability to successfully execute and implement our common stock repurchase program; (xiii) the seasonal and cyclical nature of the real estate and hospitality businesses; (xiv) changes in distribution arrangements, such as through internet travel intermediaries; (xv) changes in the tastes and preferences of our customers; (xvi) relationships with associates and labor unions and changes in labor laws; (xvii) financial condition of, and the Company’s relationships with, third-party property owners, franchisees and hospitality venture partners; (xviii) risks associated with the consummation of potential acquisitions and dispositions; (xix) timing of acquisitions and dispositions; (xx) the integration of acquired properties into the Company’s systems; (xxi) the impact of an imbalance in acquisitions and dispositions; (xxii) changes in federal, state, local or foreign tax law; (xxiii) increases in interest rates and operating costs; (xxiv) foreign exchange rate fluctuations or currency restructurings; (xxv) lack of acceptance of new brands or innovation; (xxvi) general volatility of the capital markets and the Company’s ability to access the capital markets; (xxvii) changes in the competitive environment of the Company’s industry and the markets where the Company operates; (xxviii) cyber risks and information technology failures; (xxix) outcomes of legal proceedings; (xxx) violations of regulations or laws related to our franchising business; and (xxxi) other risks discussed in the Company’s filings with the U.S. Securities and Exchange Commission, which filings are available from the SEC. These factors are not necessarily all of the important factors that could cause our actual financial results, performance, achievements or prospects to differ materially from those expressed in or implied by any of our forward-looking statements. Other unknown or unpredictable factors also could harm our results. All forward-looking statements attributable to us or persons acting on our behalf are expressly qualified in their entirety by the cautionary statements set forth above and in the cautionary statements, assumptions and qualifications set forth in the body of this presentation. Forward-looking statements speak only as of the date they are made, and we do not undertake or assume any obligation to update publicly any of these forward-looking statements to reflect actual results, new information or future events, changes in assumptions or changes in other factors affecting forward-looking statements, except to the extent required by applicable laws. If we update one or more forward-looking statements, no inference should be drawn that we will make additional updates with respect to those or other forward-looking statements. |
 Welcome Atish Shah |
 Key Themes for the Day 4 Solid track record Leveraging key strengths Superior long-term growth opportunity |
 Agenda for the Day 5 |
 Getting to Know Hyatt Tom Pritzker Executive Chairman |
 Getting to Know Hyatt 7 My Background and Role at Hyatt Hyatt History Enduring Philosophy Building a 21 st Century Hospitality Company |
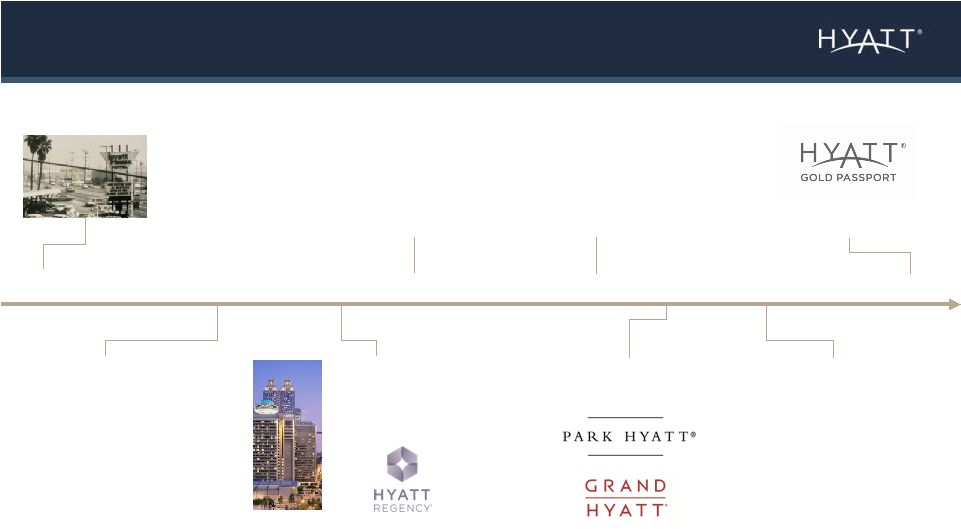 Key Historical Milestones Jay Pritzker purchases the first Hyatt House hotel, adjacent to LAX Hyatt goes public, changes its name to Hyatt Corporation Hyatt Regency brand debuts in Atlanta; first hotel to feature atrium lobby Hyatt goes international Hyatt Corporation goes private Park Hyatt & Grand Hyatt brands debut Hyatt International goes private Hyatt Gold Passport debuts 8 1957 1962 1967 1968 1979 1980 1982 1987 |
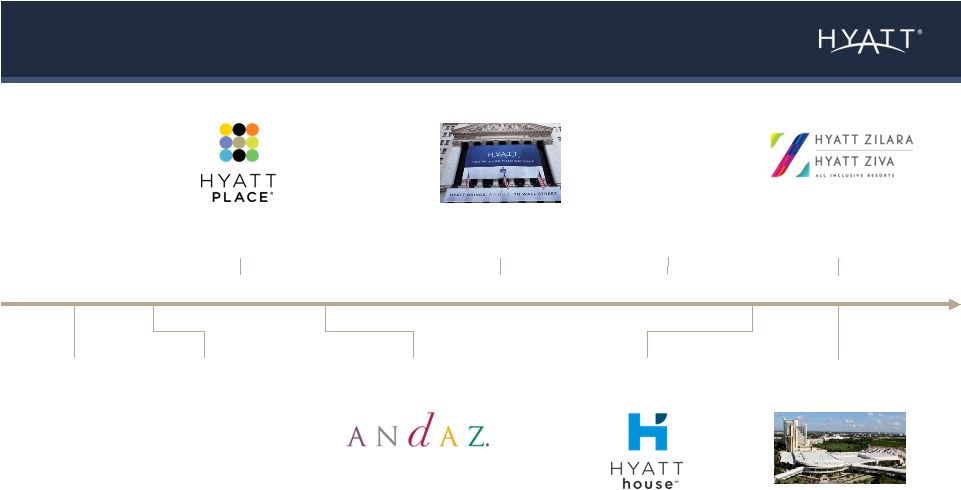 Key Historical Milestones Hyatt House rebrand debuts Andaz brand debuts Hyatt Hotels Corporation completes IPO Acquires portfolio of hotels from LodgeWorks Enters all inclusive segment with Hyatt Ziva & Hyatt Zilara Substantially all Pritzker hospitality assets consolidated under Global Hyatt Corporation Acquires and rebrands Hyatt Regency Orlando Hyatt Place brand debuts 9 Acquires AmeriSuites 2004 2005 2006 2007 2009 2011 2012 2013 |
    Past Present Value Creation Utilize capital across industries Re-invest, grow, return in hospitality Ownership Private Public Branding Niche focus Multi-brand hospitality platform Model Own & manage full-service hotels Own, manage, franchise full & select service hotels Innovation Architecture & design Service & experience Board Minority independent Majority independent Building a 21 st Century Hospitality Company 10 |
 Our Enduring Philosophy 11 Culture Relationships Value Creation |
 Mark S. Hoplamazian President and Chief Executive Officer Our Goal and Track Record |
 Our Goal and Track Record 13 Our Goal Our Track Record Since 2009 |
 Our Goal 14 To become the most preferred brand in each customer segment that we serve Colleague Preference Guest Preference Owner Preference |
 Our Goal and Track Record 15 Our Goal Our Track Record Since 2009 |
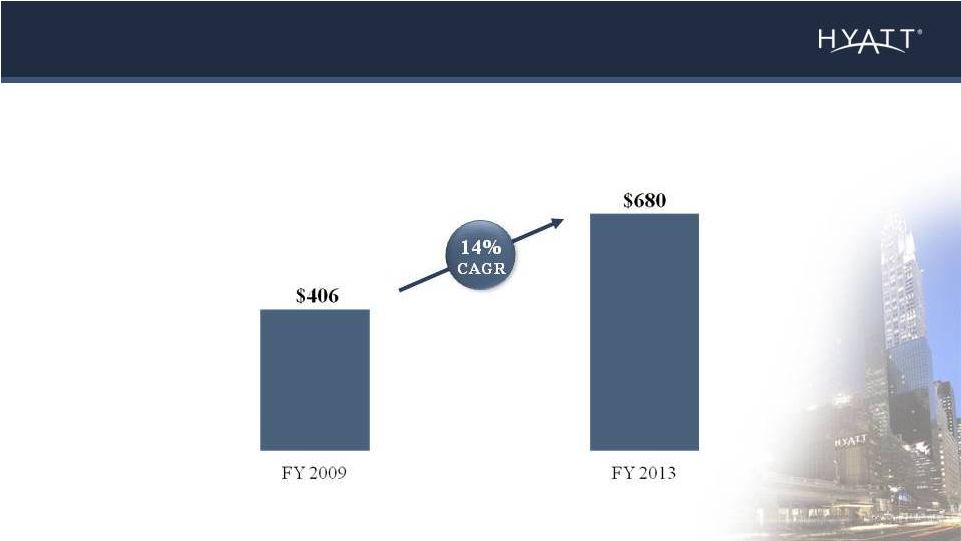 Significant Earnings Growth 16 Adjusted EBITDA (Millions) Refer to www.investors.hyatt.com for reconciliation of GAAP to non-GAAP financial measures. |
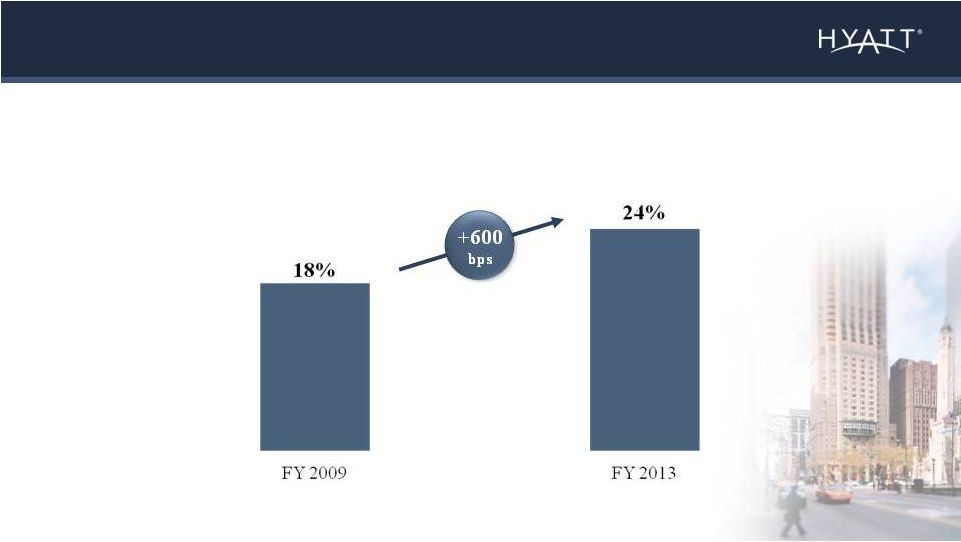 Earnings Growth: Owned Margin Improvement 17 Owned and Leased Hotel Operating Margin |
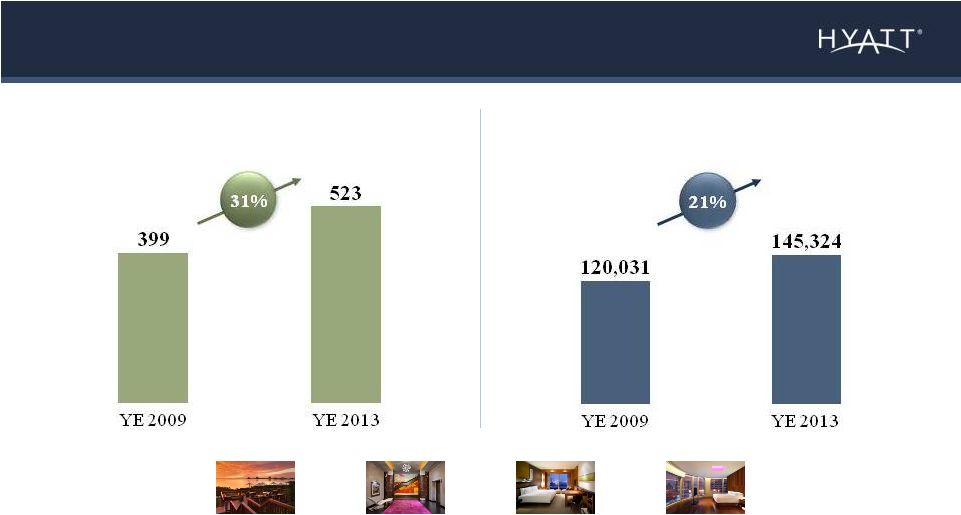 Earnings Growth: Industry Leading System Growth Hotels Rooms Excludes Hyatt Residence Club. “Industry leading” refers to percentage growth. 18 |
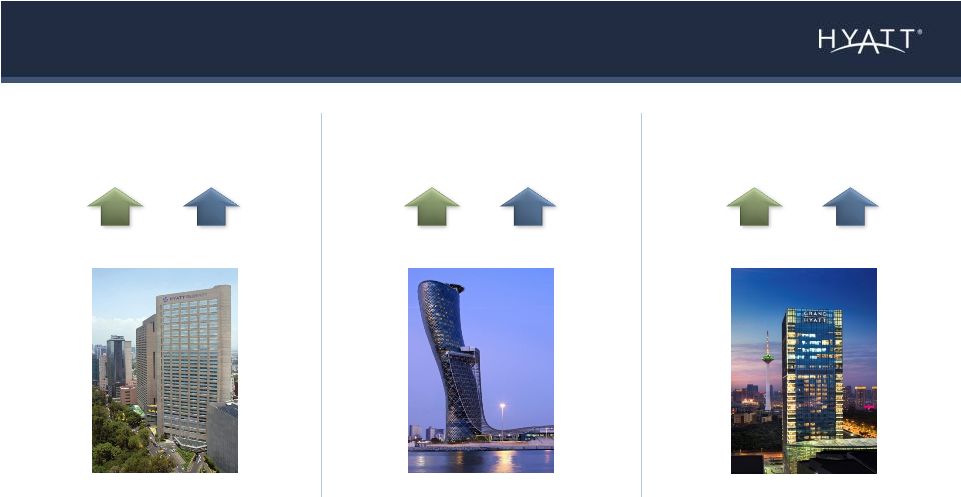 Earnings Growth: Driven by System Growth Across All Regions Growth from 2009 to 2013. Excludes Hyatt Residence Club. Americas EAME / SW Asia ASPAC 19 Hyatt Capital Gate Abu Dhabi Hyatt Regency Mexico City Grand Hyatt Shenyang 32% 22% Hotels Rooms 46% 33% Hotels Rooms 16% 11% Hotels Rooms |
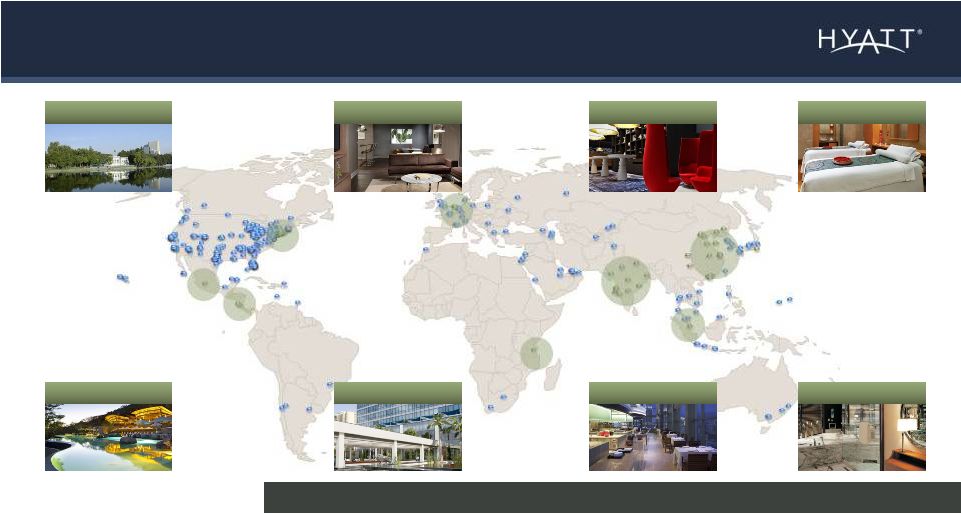  Earnings Growth: With Excellent Hotels in Key and New Markets 20 As of December 31, 2013. New markets are based on Smith Travel Research (STR) market tracts. Amsterdam New York Mexico City Costa Rica Tanzania China India Kuala Lumpur Entered 72 new markets since 2009 |
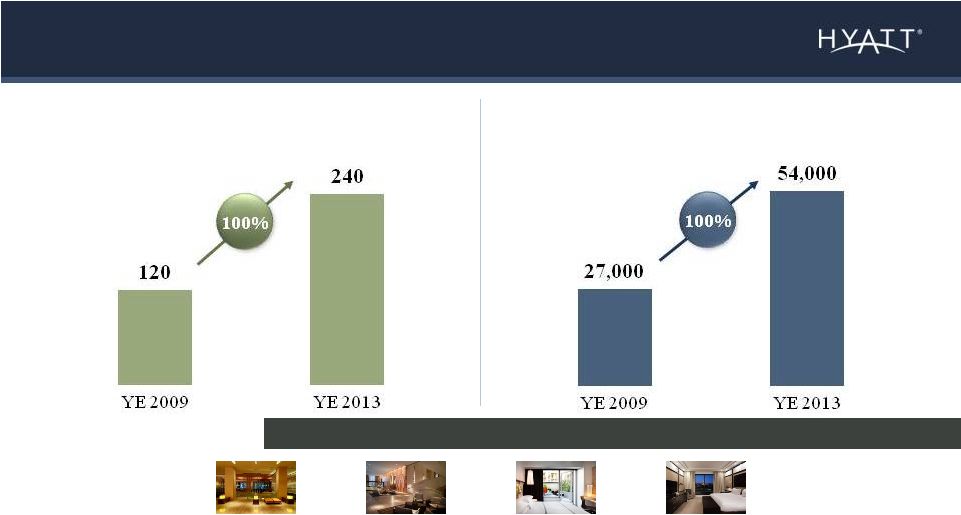 Earnings Growth: System Growth Expected to Continue to Lead Industry 21 Hotels in Executed Contract Base Rooms in Executed Contract Base Excludes Hyatt Residence Club. New markets are based on STR market tracts. Represents potential entry into more than 100 new markets |
 Hotels in Executed Contract Base Rooms in Executed Contract Base Earnings Growth: Industry Leading Expansion Potential 22 30% of existing system 46% of existing system 22% of existing system 37% of existing system Excludes Hyatt Residence Club. |
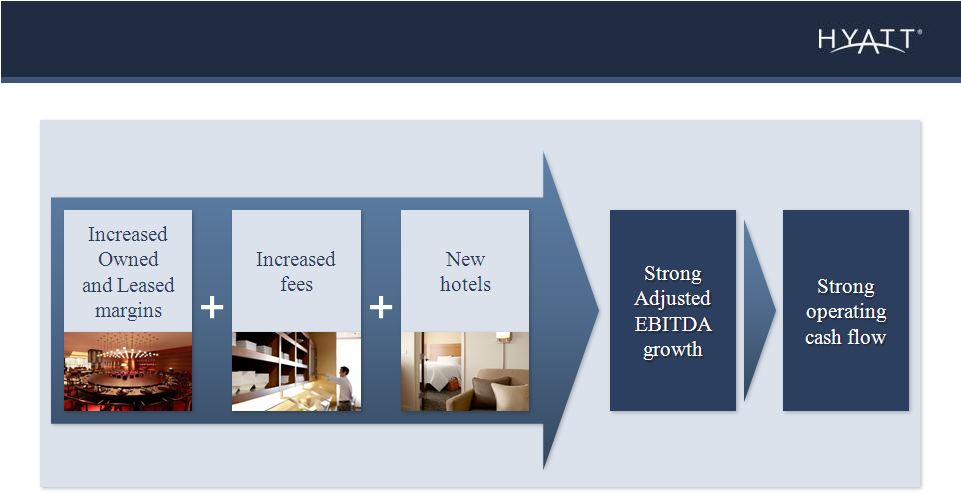
 A Very Active Four Years on the Capital Front 23 Deployed significant cash Sold assets and realized investments Increased balance sheet leverage Invested in new and existing hotels Returned significant amount of capital to shareholders |
 Case Study: Recycling Capital Hyatt Regency New Orleans • $275M convention hotel redevelopment • Hyatt invested $63M of preferred equity in 2010-2011 • Investment was redeemed in 2013 • 21% annualized return on investment, unlevered and exclusive of fees going forward • Hyatt continues to manage hotel 24 |
 IN SUMMARY A Company with a Clear Focus • Committed to our goal to be the Most Preferred Brand • Our track record since IPO demonstrates a consistency of strategy and execution 25 |
 Mark S. Hoplamazian President and Chief Executive Officer Key Strengths We Are Leveraging |
 Key Strengths We Are Leveraging 27 |
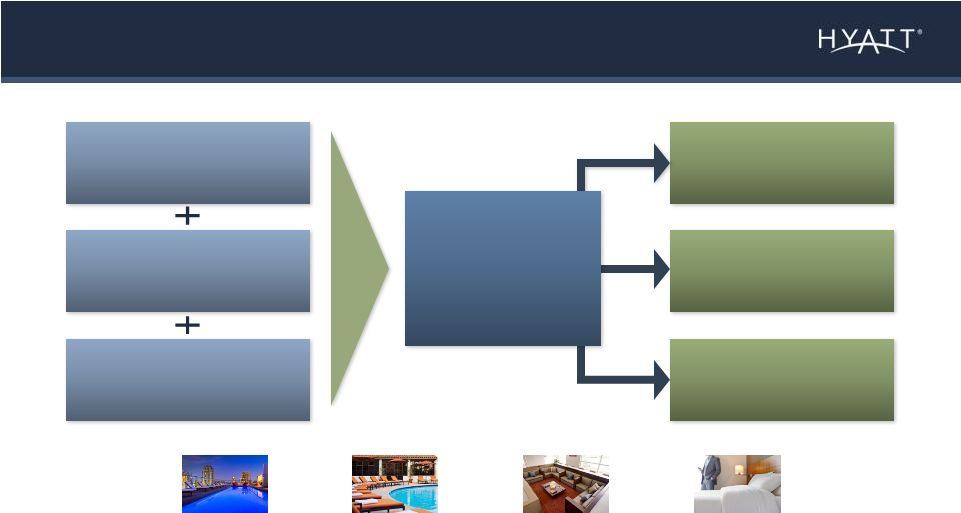
 Multiple Earnings Tools 28 Our tools for driving growth |
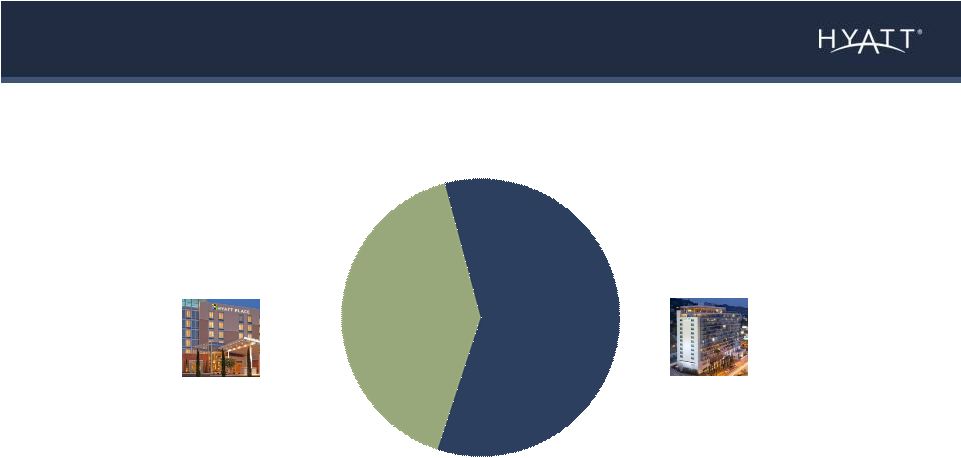 Three Tools: Ownership, Management and Franchising 29 Adjusted EBITDA Composition (2) Management and Franchising (1) Owned and Leased 41% 59% Year ended December 31, 2013. (1) Includes Americas, EAME/SWA and ASPAC management and franchising segments. (2) Excludes corporate and other. |
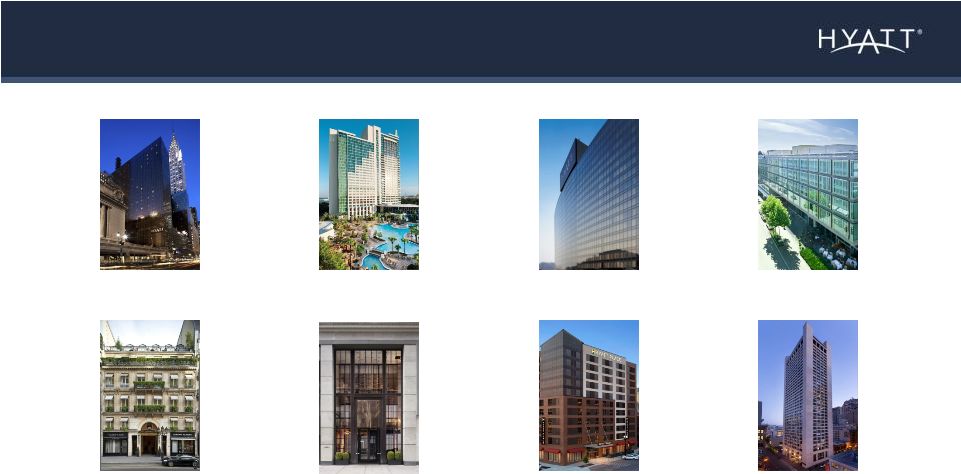 Ownership Tool: Enables Strategic Growth with High Quality Hotels Grand Hyatt New York 1,305 Rooms Park Hyatt Zurich 142 Rooms Park Hyatt Paris – Vendôme 153 Rooms Hyatt Regency Orlando 1,641 Rooms Grand Hyatt San Francisco 660 Rooms Grand Hyatt Seoul 601 Rooms Andaz 5th Avenue 184 Rooms 30 Hyatt Place Omaha Downtown / Old Market 159 Rooms |
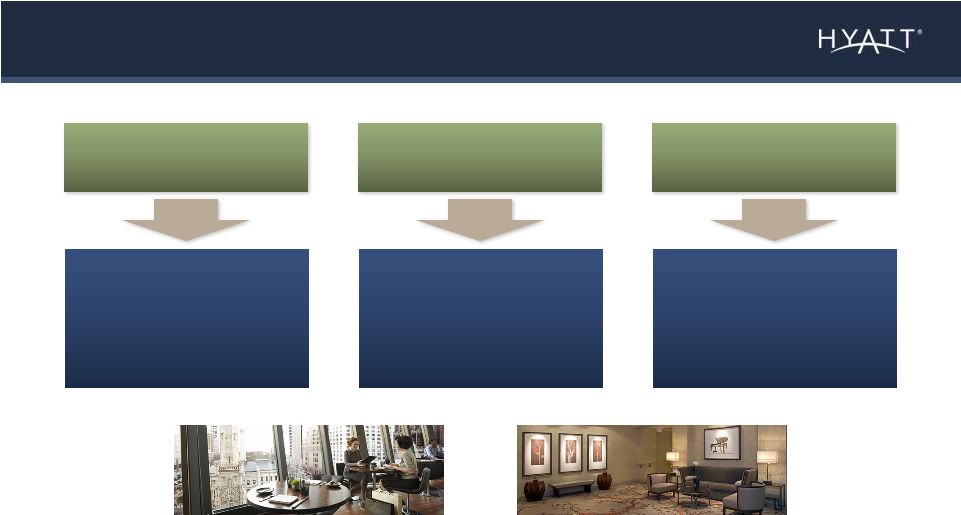 Ownership Tool: Operating Leverage, Owner Preference and Recycling Margin growth 31 Contract base expansion Increased brand presence in targeted areas and investment returns Operating Leverage Owner Preference Recycling |
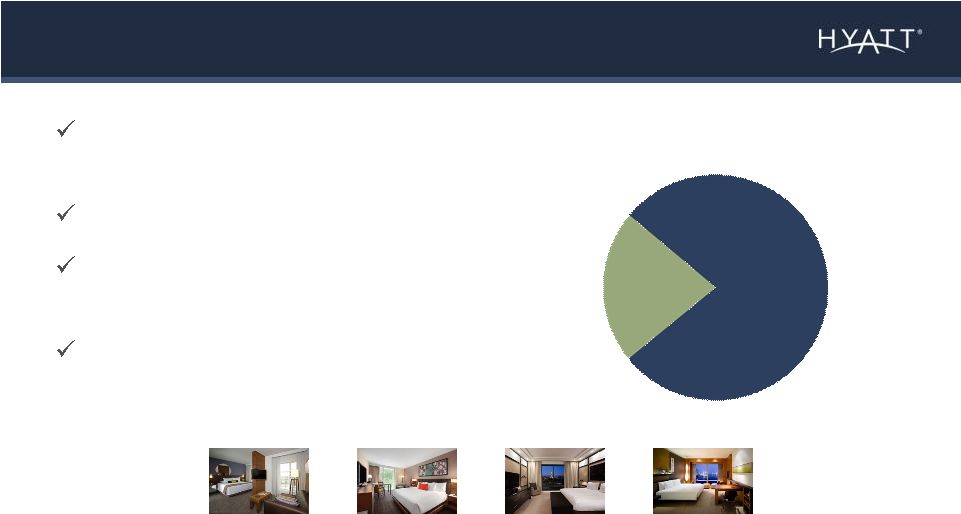 Management Tool: Hyatt’s DNA Rooms Mix As of December 31, 2013. Managed includes owned hotels and managed hotels owned by unconsolidated hospitality ventures. Maintain brand quality and guest experience Agility Leverage through incentive management fees Focus on creating long-term asset value 32 Franchised Managed 22% 78% |
  Total Incentive Management Fees 25% below prior peak % of Hotels Paying Incentive Management Fees 66% (11 points below prior peak) % of Hotels Opened Since 2009 Paying Incentive Management Fees 50% Management Tool: Upside Incentive Fee Potential 33 Year ended December 31, 2013. Full service hotels managed for third parties. Strong upside to incentive management fees from existing hotels underpinned by ramping newly opened hotels |
 Franchising Tool: Early Stage Earnings Driver • New markets, new capital base, new opportunities • Platform for accelerating fee growth • Focus on quality hotels, owners and operators 34 |
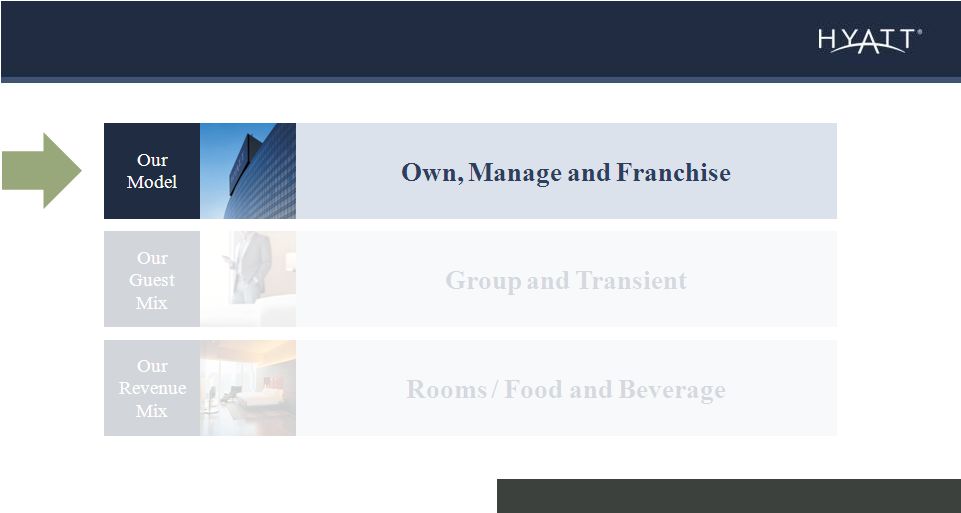
 Multiple Earnings Tools 35 Our tools for driving growth Our Guest Mix Group and Transient |
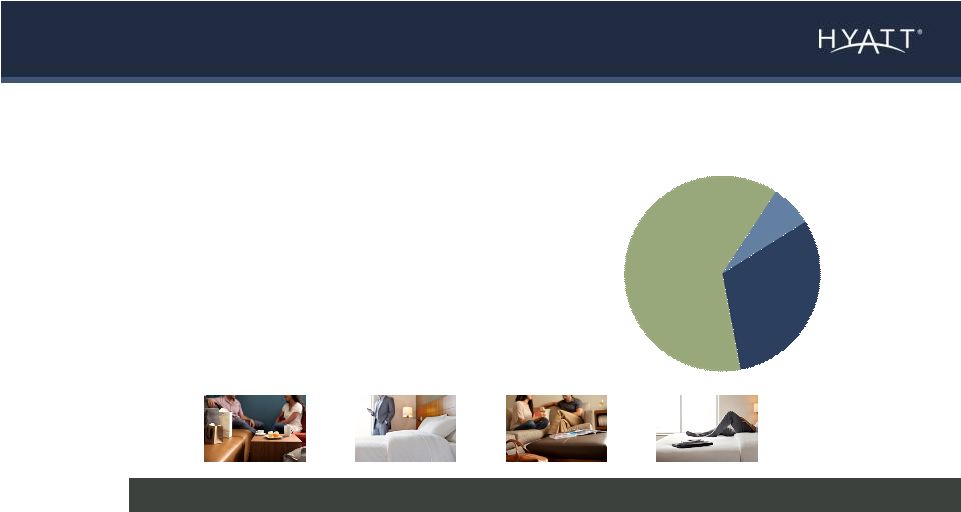 Global Room Revenue Mix Group Tool: Strong Earnings Driver Year ended December 31, 2013. Full Service managed hotels chain room revenue. • Strong group position and share • Strong base of business provides ability to better manage transient revenue 36 Delivering distinctive experiences for group customers and transient guests Group Transient Other 31% 7% 62% |
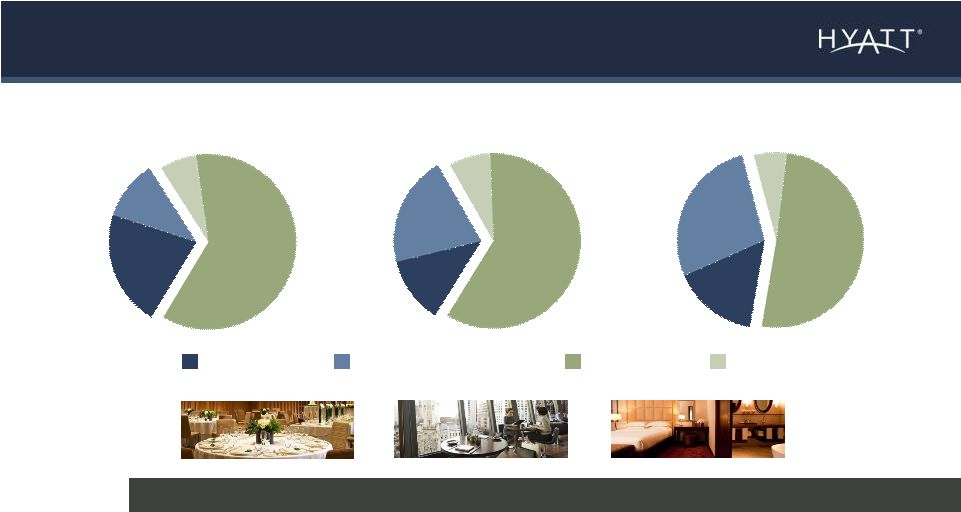
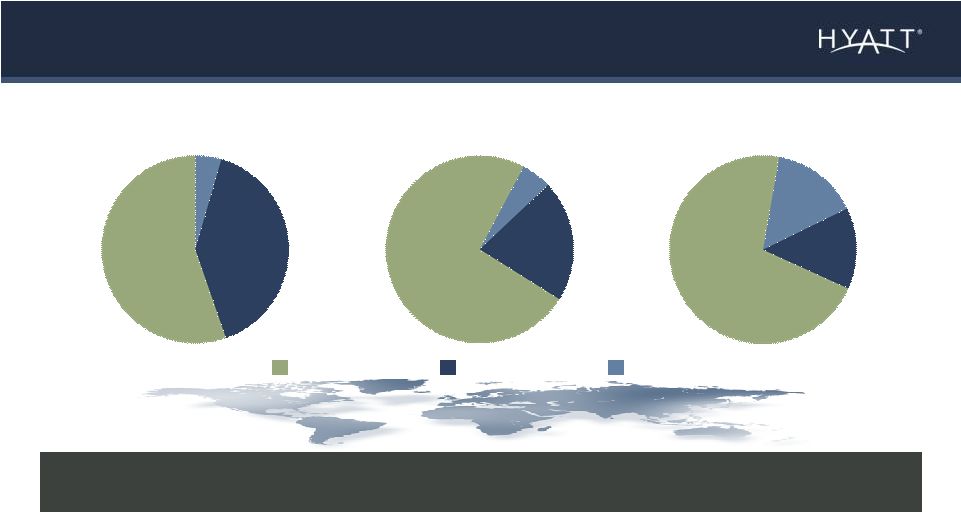 Group Tool: Well Positioned for Evolution of Global Group Business 37 Year ended December 31, 2013. Full Service managed hotels chain room revenue. Americas EAME / SWA ASPAC Group business represents 42% of U.S. revenue and provides Hyatt a strong experience base as group business expands outside the U.S. Transient Group Other 5% 40% 55% 5% 21% 74% 15% 14% 71% |
 Room Revenue CAGR Since 2009 Transient 7% Group 3% Group Tool: U.S. Group Poised to Recover 38 Hyatt 2009-2013 CAGR for comparable U.S. managed full service hotels. 2015 group revenue pace: +5% |
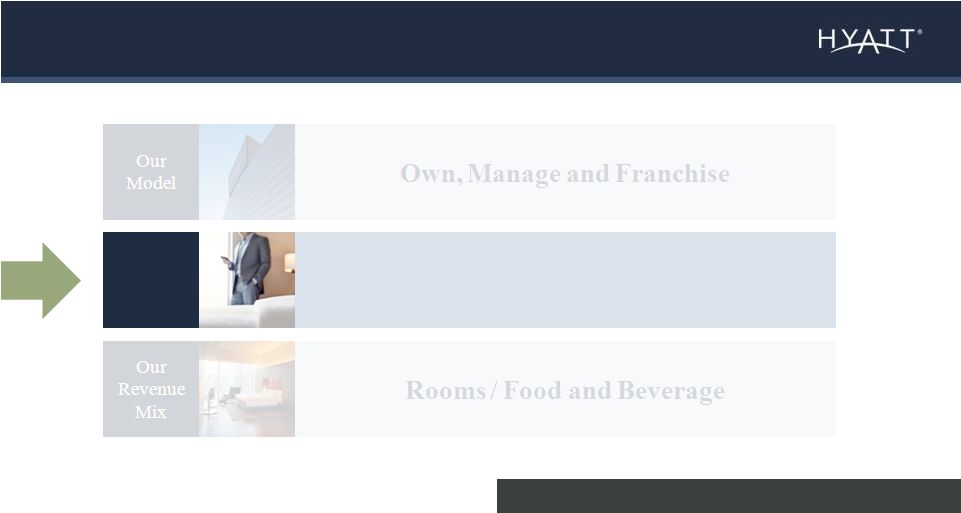
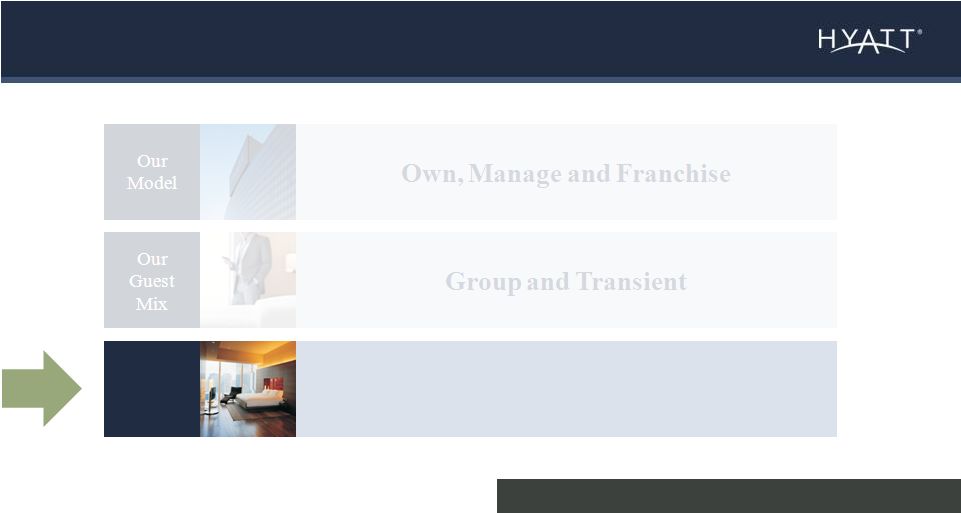 Multiple Earnings Tools 39 Our tools for driving growth Our Revenue Mix Rooms / Food and Beverage |
 Food and Beverage Tool: Provides Opportunity as Business Evolves 40 Food and beverage mix varies by region; focus on high value and high profit Banquet Room Other Restaurant / Bar Year ended December 31, 2013. Full service managed hotels chain revenue. Americas EAME / SWA ASPAC F&B Revenue 32% F&B Revenue 33% F&B Revenue 43% 61% 59% 51% |
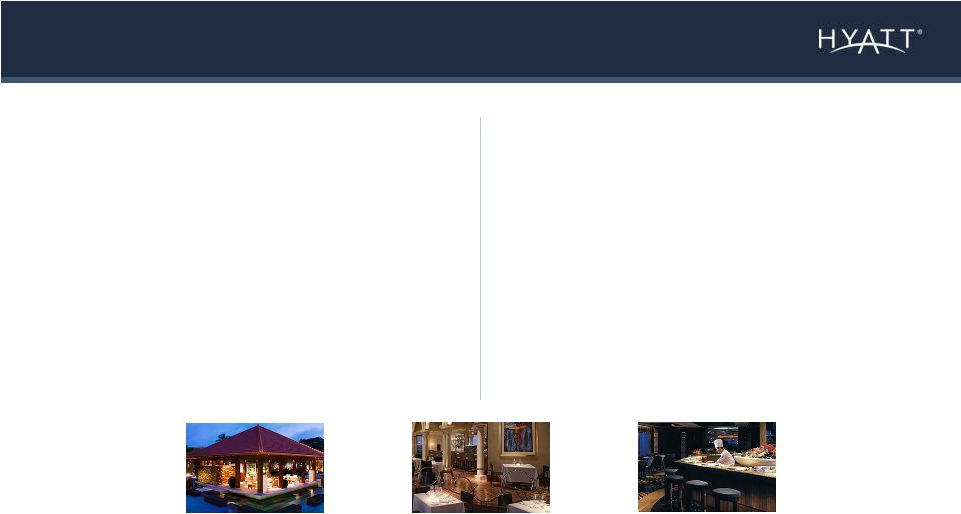 Case Study: Food and Beverage in Asia Pacific • Leadership position • Driver of guest and owner preference • Significant local guest mix • 30%+ margins 41 • 300 restaurants or bars • Average of 5 restaurants or bars per hotel • 20% of restaurants or bars earned more than $1M in profit Year ended December 31, 2013. |
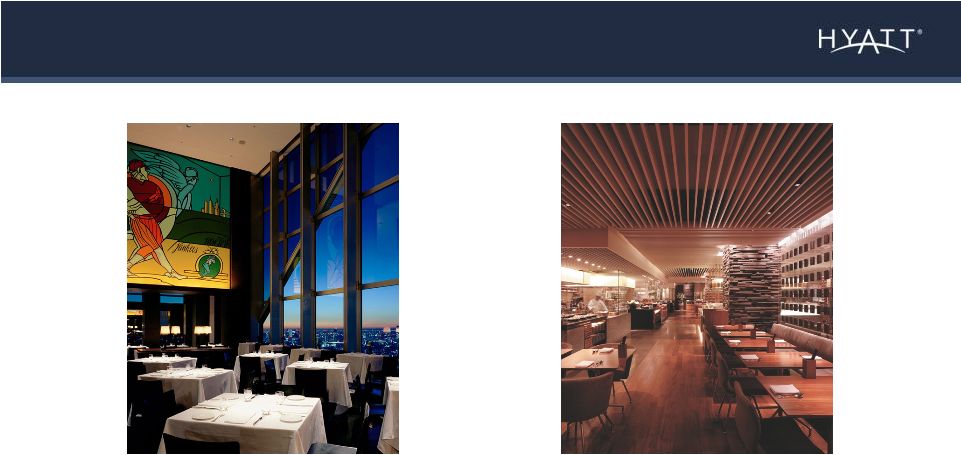 Case Study: Food and Beverage in Asia Pacific 42 Park Hyatt Tokyo New York Grill Grand Hyatt Singapore StraitsKitchen |
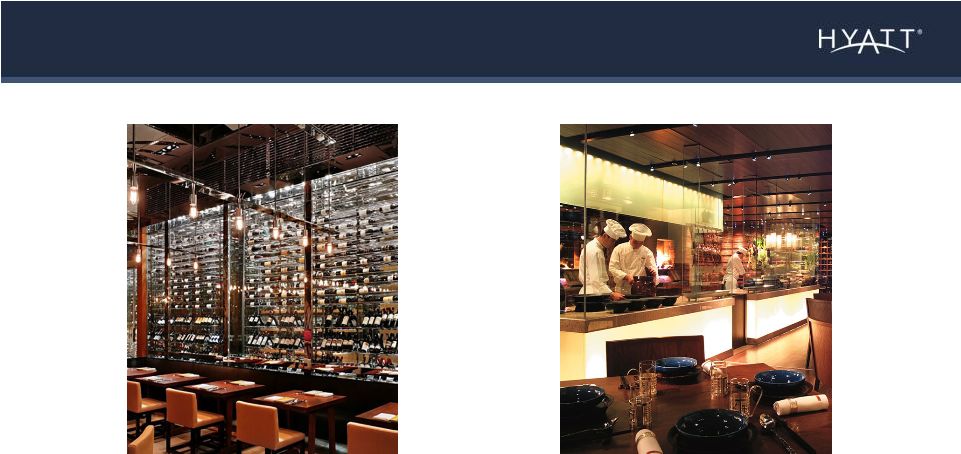 Case Study: Food and Beverage in Asia Pacific 43 Park Hyatt Shanghai 100 Century Avenue Restaurant Grand Hyatt Beijing Made in China |
 Case Study: Food and Beverage in Asia Pacific 44 Park Hyatt Sydney The Dining Room Grand Hyatt Erawan Bangkok The Campus Cafeteria |
 Key Strengths We Are Leveraging 45 Strong Relationships |
 Q&A |
 Key Strengths We Are Leveraging 47 Powerful Brands |
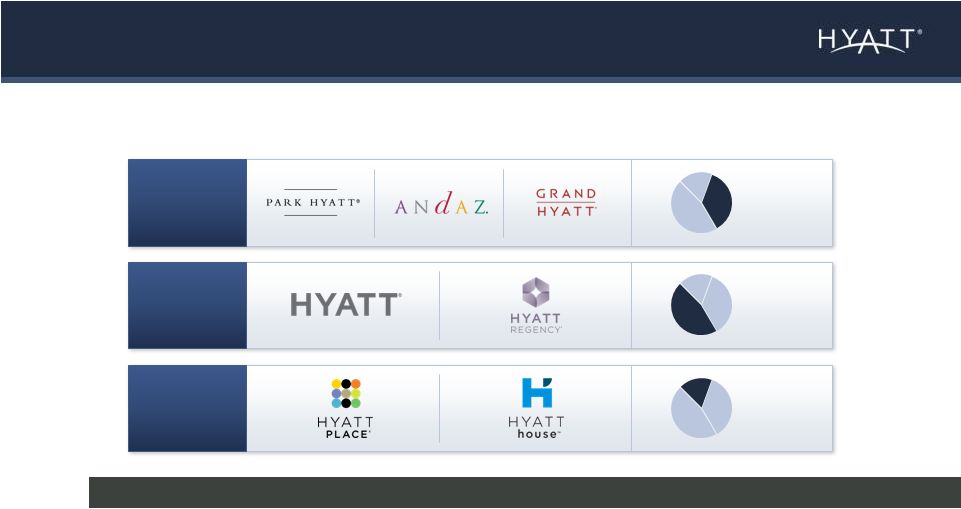
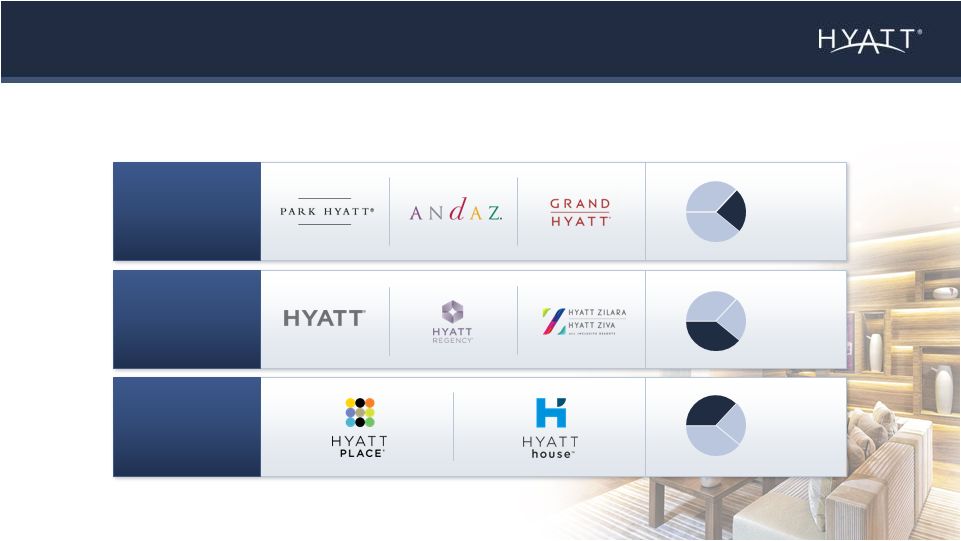
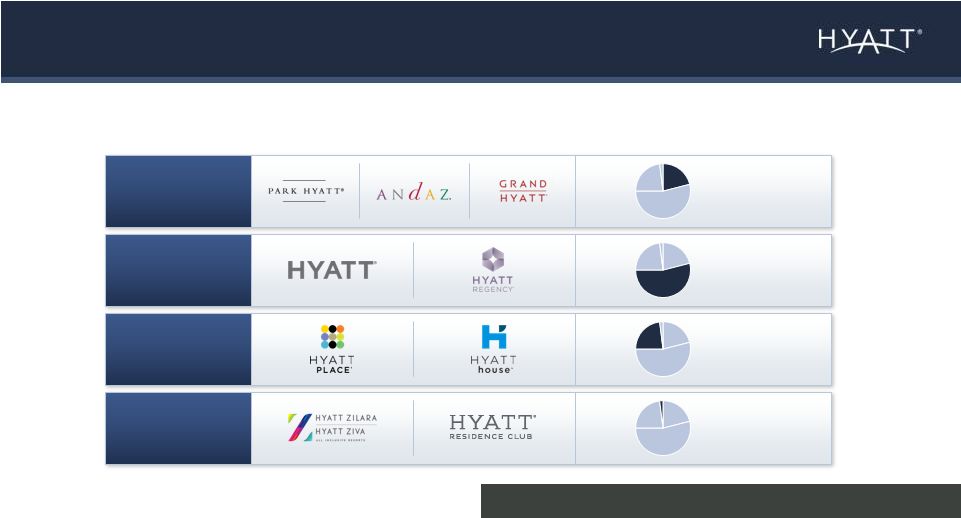 Powerful Brands: Ten Brands – All Focused on High End Travelers 48 Year ended December 31, 2013. Chain scale defined by STR. Industry leading luxury mix % of Systemwide Rooms Upper Upscale Luxury Upscale Other 21% 54% 23% 2% |
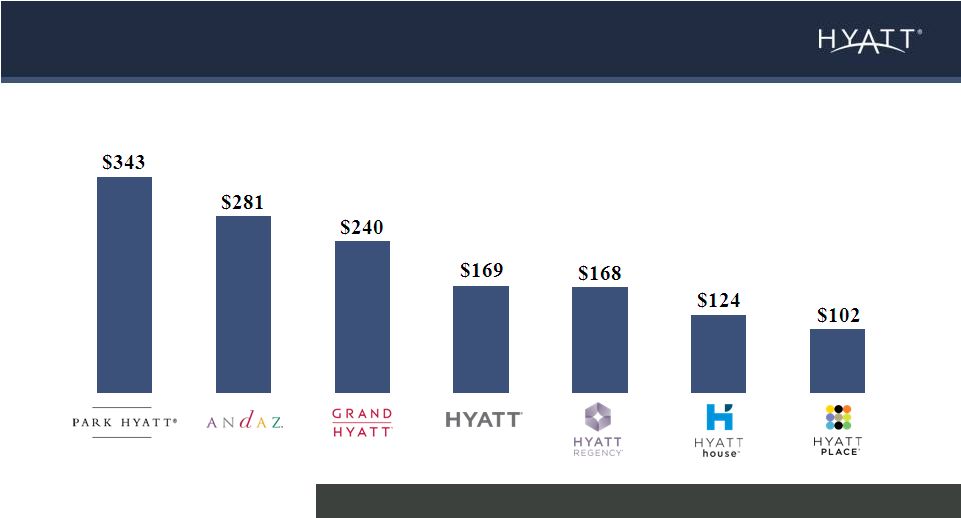 Powerful Brands: Strong Rate Profile 49 Average Daily Rate (ADR) Year ended December 31, 2013 for comparable locations. Highest systemwide ADR ($175) in the industry |
 50 Positioning • Marquee global locations • 33 hotels • 6,535 rooms • 20 countries • 33% room growth since 2009 • Park Hyatt Paris-Vendôme recognized as a Palace Hotel in 2011 Growth Outlook • Executed contracts = ~50% room growth • 2014 expected openings include: NYC and Vienna As of December 31, 2013. |
 51 Positioning • Urban and resort locations • 11 hotels • 2,269 rooms • 5 countries • Significant room growth since launch in 2007 • Recent resort openings in Maui and Costa Rica Growth Outlook • Executed contracts = ~70% room growth • 2014 expected openings include: Tokyo As of December 31, 2013. |
 52 Positioning • Dominant presence in gateway cities across Asia (from Mumbai to Tokyo) • 40 hotels • More than 250 restaurants and bars • 22,262 rooms • 20 countries Growth Outlook • Executed contracts = ~35% room growth • 2014 expected openings include: Lijiang As of December 31, 2013. Exciting Bold Dramatic |
 53 Positioning • Popular destinations • Transient greater than 70% of room revenue • Key locations in NYC, Chicago, Key West, Paris and India • 38 hotels • 8,609 rooms • 4 countries Growth Outlook • Executed contracts = ~20% room growth • 2014 expected openings include: Atlanta and Chicago As of December 31, 2013. |
 54 Positioning • Predominant meetings-oriented brand • Presence in key group markets of Orlando, San Diego, Atlanta, Chicago, Dallas, Boston, San Antonio, Dubai, Paris and Mexico City • 149 hotels – Nine 1,000+ room hotels – 4.5M sq. ft. of meeting space • 70,995 rooms • 33 countries Growth Outlook • Executed contracts = ~25% room growth • 2014 expected openings include: Istanbul and Shanghai As of December 31, 2013. |
 55 Positioning • Select service focused on today’s multi-tasking traveler • Focused on expanding in urban locations • New urban locations in 2013: NYC, Chicago, Minneapolis, Nashville, Omaha and Austin • 192 hotels • 25,575 rooms • 5 countries Growth Outlook • Executed contracts = ~65% room growth • 2014 expected openings include: Shenzhen, Gurgaon, Anaheim and Washington DC As of December 31, 2013. |
 56 Positioning • Select service extended stay rebranded in 2012 • 58 hotels • 8,154 rooms • 1 country Growth Outlook • Executed contracts = ~40% room growth • 2014 expected openings include: San Juan As of December 31, 2013. |
 57 Positioning • First multi-brand company to enter all inclusive segment • Hyatt Zilara: Adult only • Hyatt Ziva: Guests of all ages • 2 resorts • 925 rooms • 1 country Growth Outlook • Large market potential • Focused on growing in the Caribbean basin • 2014 expected openings include: Hyatt Ziva Rose Hall, Jamaica As of December 31, 2013. |
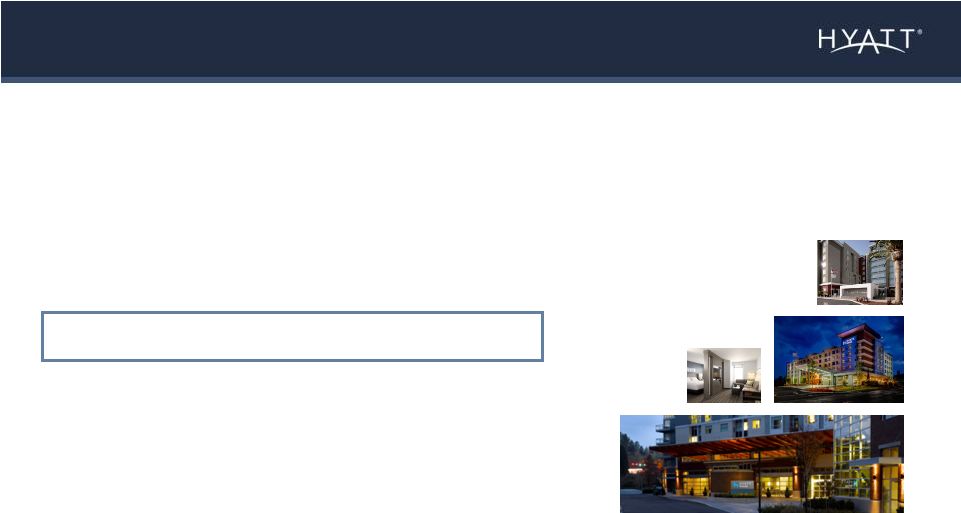
    58 Brand Launch Date # Hotels Key Locations Future Locations Long-Term Global Hotel Potential 2007 11 NYC, Maui, London, West Hollywood, Amsterdam, Shanghai, Costa Rica Riviera Maya, Delhi, Bali >75 hotels 2006 192 NYC, Chicago, Austin, Nashville, Minneapolis, Costa Rica, India, Mexico Urban and international including Washington DC, Bangkok, Beijing, Panama City >1,000 hotels 2012 (1) 58 Chicago, Washington DC, San Jose, San Diego, Boston, Charlotte, Salt Lake City Atlanta, Denver, NYC, Seattle, Mumbai >500 hotels 2013 2 Cancun, Los Cabos Dominican Republic, Jamaica >100 resorts Powerful Brands: Ability to Roll Out New Brands As of December 31, 2013. (1) Rebranded to Hyatt House in 2012. |
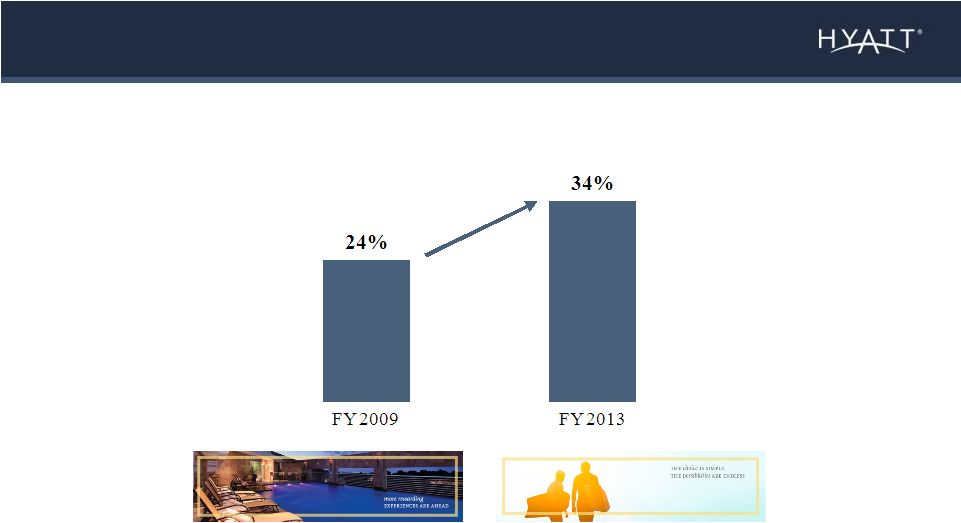 Powerful Brands: Increased Gold Passport Penetration Gold Passport Penetration (Total Room Nights) 59 |
 Hyatt House Emeryville/ San Francisco Bay Area Case Study: Powerful Brands 60 15 of the hotels acquired in 2011 were converted to Hyatt House Hyatt House San Jose/Silicon Valley Hyatt House Shelton Hyatt House Charlotte/City Center Hyatt House Branchburg |
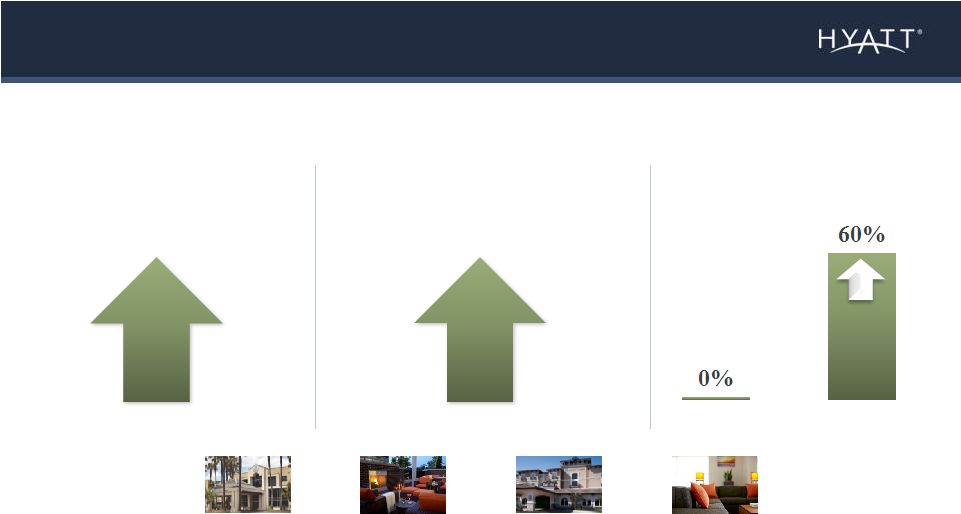 Case Study: Powerful Brands 61 Comparable RevPAR Index Gold Passport Penetration Change from 2011 to 2013. RevPAR index as reported by STR. 8 points 15 of the hotels acquired in 2011 were converted to Hyatt House Corporate Group Meetings 50% |
 IN SUMMARY Hyatt: A Differentiated Hospitality Company Colleague, guest and owner preference 62 Multiple Earnings Tools Relationships Powerful Brands |
 Q&A |
 Financial Overview Gebhard F. Rainer Executive Vice President, Chief Financial Officer |
 Agenda 65 Our Business Model Three-Year Earnings Potential Based on STR RevPAR Forecast Capital Allocation |
 Executing a Successful Business Model 66 |
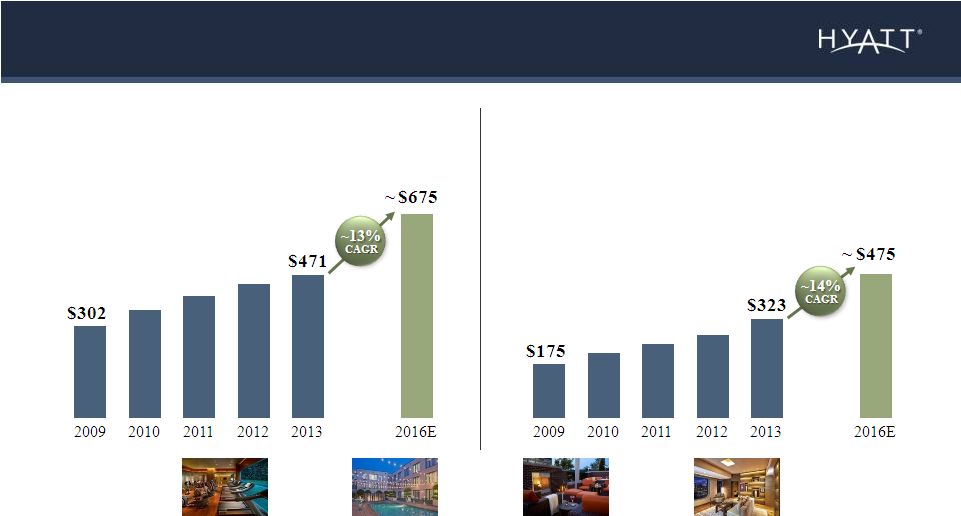
 Strong Track Record Since 2009 67 Owned and Leased Segment Adjusted EBITDA (Millions) Management and Franchising Segments Adjusted EBITDA (1) (Millions) Total Adjusted EBITDA (2) (Millions) (1) Includes Americas, EAME/SWA and ASPAC management and franchising segments. (2) Includes corporate and other. Refer to www.investors.hyatt.com for reconciliation of GAAP to non-GAAP financial measures. |
 Agenda 68 Our Business Model Three-Year Earnings Potential Based on STR RevPAR Forecast Capital Allocation |
 Earnings Potential Based on STR RevPAR Forecast • Food and Beverage revenue growth in line with global RevPAR growth • 5% annualized Adjusted SG&A growth • 25% increase in system size based on openings from executed contract base • Excludes asset recycling - Based on current Owned and Leased hotels as of year end 2013 adjusted for the sale of 10 hotels in March 2014 and identified acquisitions / openings 69 Cautionary Note The three-year earnings potential is a scenario based on RevPAR estimates from STR. The STR estimate for U.S. industry RevPAR growth in 2014 is 5.3%. This RevPAR growth estimate was applied to Hyatt’s global business over the next three years (2014-2016), and resulting Adjusted EBITDA estimates are illustrative only. The application of the RevPAR forecast and resulting sensitivities are illustrative only, as actual results may and will vary materially based on actual circumstances, differences in geography and chain scale, which variations have been material in the past. We expect our owned and leased hotel portfolio to change relative to the assumptions underlying the earnings potential scenario and this could cause material changes to the scenario. In addition, further assumptions used in illustrating the Company’s earnings potential are below. |
 Earnings Potential Based on STR RevPAR Forecast 70 Earnings potential predicated on assumptions on slide 69. Refer to www.investors.hyatt.com for reconciliation of GAAP to non-GAAP financial measures. Adjusted EBITDA (Millions) Please refer to the Cautionary Note on slide 69. |
 Earnings Potential Based on STR RevPAR Forecast 71 Owned and Leased Segment Adjusted EBITDA (Millions) Management and Franchising Segments Adjusted EBITDA (1) (Millions) (1) Includes Americas, EAME/SWA and ASPAC management and franchising segments. Earnings potential predicated on assumptions on slide 69. |
    Metric 2016 Adjusted EBITDA Based on STR RevPAR Forecast Sensitivity to 1 point of RevPAR Growth in 2016 Owned and Leased Adjusted EBITDA ~$675M +/- $15M-$18M Management and Franchising Adjusted EBITDA (1) ~$475M +/- $5M-$7M Total Adjusted EBITDA ~$1,000M +/- $20M-$25M Owned and Leased Segment Margins +~160bps +/- 40bps; $13M-$16M of EBITDA Sensitivities Based on STR RevPAR Forecast 72 (1) Includes Americas, EAME/SWA and ASPAC management and franchising segments. Earnings potential predicated on assumptions on slide 69. Refer to www.investors.hyatt.com for reconciliation of GAAP to non-GAAP financial measures. |
 Agenda 73 Our Business Model Three-Year Earnings Potential Based on STR RevPAR Forecast Capital Allocation |
 Record of Disciplined Capital Deployment (2010-2013) 74 Cash Flow $1.8B and Realized Investments $1.5B Balance Sheet $1.4B Deployed Capital $4.7B Maintenance CapEx $0.4B Investments in New and Existing Hotels $3.5B Return of Capital $0.8B Operating Cash from Asset Sales Use of Cash and |
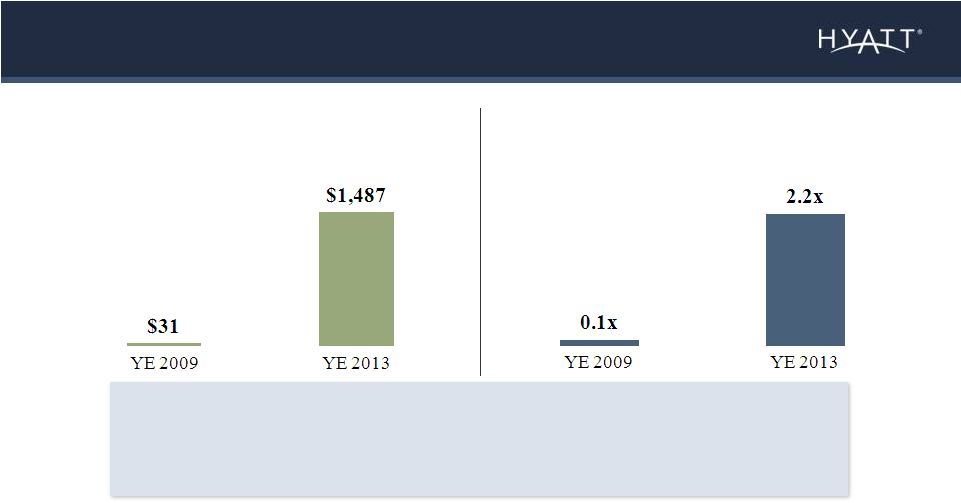 A Closer Look: Improved Use of Balance Sheet • Utilized existing cash for investments in key priorities and return of capital • Expanded balance sheet and availability • Balance sheet remains strong • Maintained investment grade credit rating 75 Debt includes pro rata share of unconsolidated hospitality venture debt. Refer to www.investors.hyatt.com for reconciliation of GAAP to non-GAAP financial measures. Total Net Debt (Millions) Total Net Debt / Adjusted EBITDA |
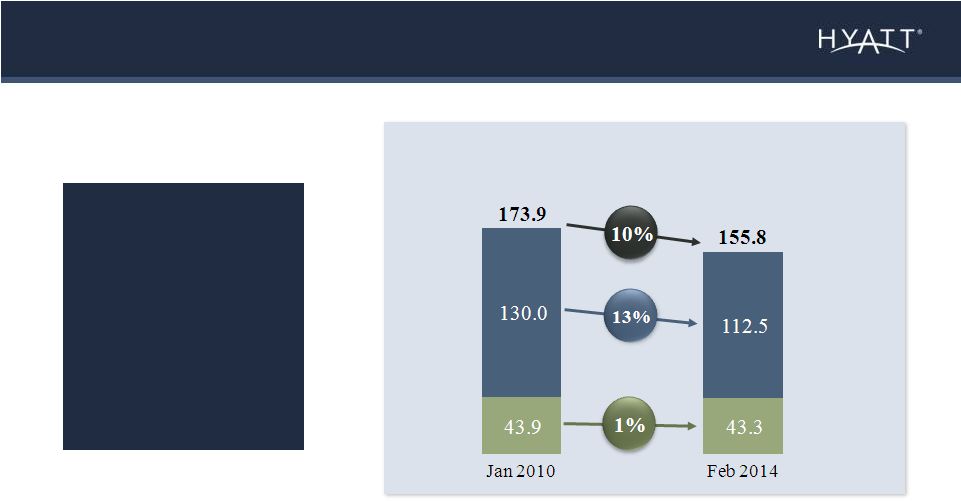  A Closer Look: Return of Capital 76 Repurchased more than $820M of shares at a weighted average price of ~ $42 / share Repurchased more than $820M of shares at a weighted average price of ~ $42 / share 10% Decline in Shares Outstanding (Millions of Shares) Share counts as of January 31, 2010 and February 11, 2014. Class A Class B |
 Operating Cash Flow Potential Based on STR RevPAR Forecast 77 ~14% Adjusted EBITDA CAGR Based on STR RevPAR Forecast ~$1.9B of Cumulative Operating Cash Flow Potential Earnings potential predicated on assumptions on slide 69. Illustration |
 Capital Allocation Framework 78 • Expand to serve guests in underrepresented locations • ROI projects to improve margins • Maintain investment grade credit rating • Maintain flexibility to invest to grow • Continued return of capital Invest to Grow Maintain Strong Balance Sheet Return of Capital |
 79 1 Invest to Grow Identified Investments and Identified ROI CapEx (excluding ~$400M of Maintenance CapEx) (Millions) Identified Investments (%) 2014-16 Earnings potential predicated on assumptions on slide 69. Identified Investments ROI CapEx Resorts 30% Key Gateway City Hotels 40% Select Service Hotels (primarily urban) 25 % Other 5% ~$900 ~$200 2014 -16 ~$1,100 |
  ($ in millions) 2013 2016 Based on STR RevPAR Forecast Adjusted EBITDA $680 ~$1,000 Gross Debt $2,155 ~$3,000 Gross Debt/Adjusted EBITDA 3.2x 3.0x Maintain Strong Balance Sheet 80 • Maintain investment grade credit rating • Significant capacity as Adjusted EBITDA grows • Potential for increase in debt while maintaining investment grade credit rating Debt includes pro rata share of unconsolidated hospitality venture debt. Earnings potential predicated on assumptions on slide 69. Refer to www.investors.hyatt.com for reconciliation of GAAP to non-GAAP financial measures. 2 |
 Return of Capital Illustration 81 2014-2016 Potential Available Cash Based on STR RevPAR Forecast = ~ $1.2B 3 Return of Capital Return of Capital New Investments New Investments Earnings potential predicated on assumptions on slide 69. |
  Based on STR RevPAR Forecast Illustrative Metrics 2014-2016 82 ~ 50% Adjusted EBITDA Growth ~ $1.9B Operating Cash Flow Potential ~ $1.2B Potential Available Cash for Return of Capital or New Investments Earnings potential predicated on assumptions on slide 69. |
 IN SUMMARY: Key Messages 83 Executing Successful Model Strong Track Record of Execution Disciplined Capital Allocation |
 Delivering Superior Long-Term Growth Mark S. Hoplamazian President and Chief Executive Officer |
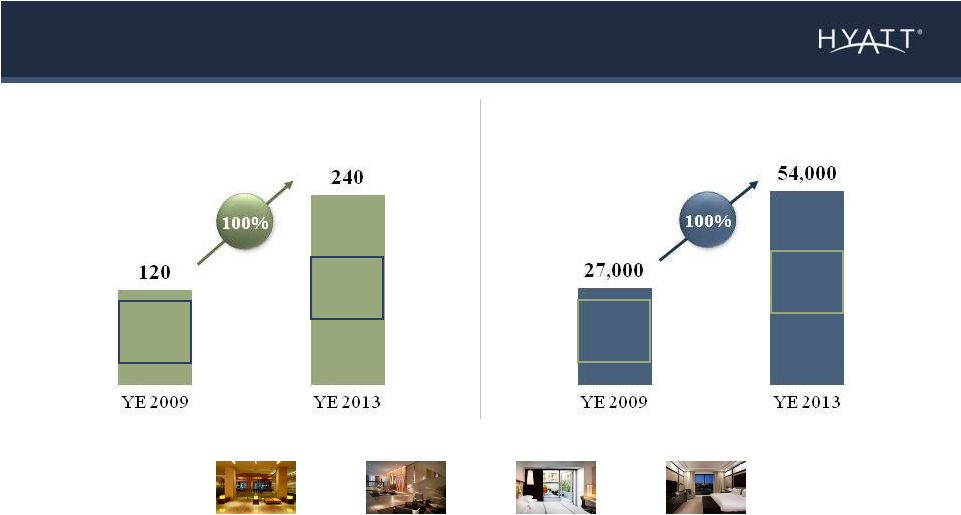
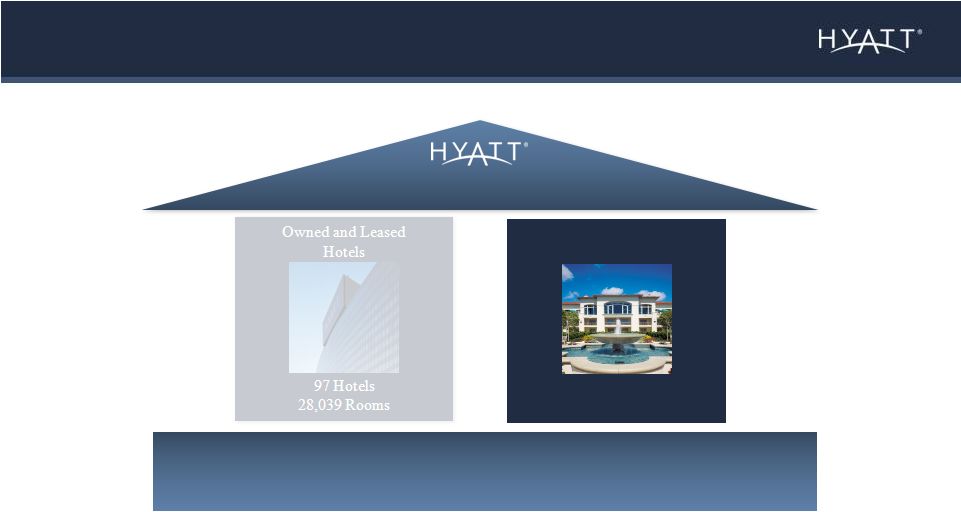
  Strong Foundation for Growth 85 Superior Long-Term Growth Owned and Leased Hotels 97 Hotels 28,039 Rooms Leveraging Key Strengths • Multiple Earnings Tools • Powerful Brands • Relationships As of December 31, 2013. |
 The Hyatt Difference: High Mix of Luxury and Upper Upscale Owned Hotels 86 Year ended December 31, 2013; Chain scale defined by STR. Excludes unconsolidated hospitality ventures. Owned and leased Adjusted EBITDA was $403M in 2013. Luxury and Upper Upscale >80% of Owned and Leased Adjusted EBITDA Owned and Leased Adjusted EBITDA Luxury 36% Upper Upscale 46% Upscale 18% |
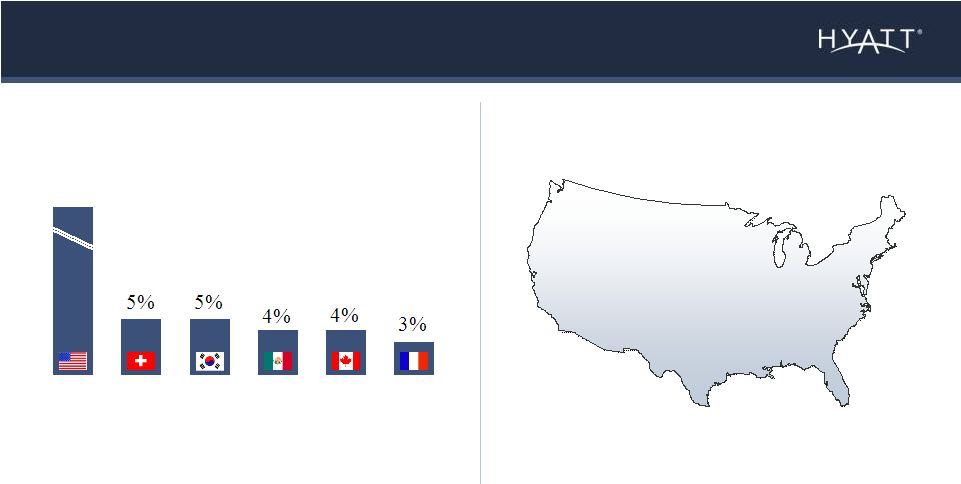  Well Positioned in High Quality Markets and Locations 87 Year ended December 31, 2013. Markets defined according to STR. Excludes unconsolidated hospitality ventures. Owned and leased Adjusted EBITDA was $403M in 2013. Owned and Leased Hotels in 11 Countries 69% • New York, NY • Atlanta, GA • San Francisco / San Mateo, CA • Orlando, FL • San Jose / Santa Cruz, CA Top 5 U.S. Markets ~40% of U.S. Owned and Leased Adjusted EBITDA Top Markets by Country % of Owned and Leased Adjusted EBITDA United States Switzerland South Korea Mexico Canada France Top United States Markets |
  Owned Hotels Have High Embedded Value 88 As of December 31, 2013. Chain scale defined by STR. Excludes leased hotels and hotels owned by unconsolidated hospitality ventures. Illustrative gross value per room based on observed market transactions for luxury hotels and sale pricing for upper upscale and upscale hotels recently sold by the Company. >$7.5B illustrative gross market value Chain Scale Owned Rooms Illustrative Gross Market Value per Room Illustrative Gross Market Value Luxury 5,234 >$675,000 >$3.5B Upper Upscale 12,511 >$250,000 >$3.1B Upscale 7,229 >$130,000 >$0.9B |
 Expect Owned Portfolio to Evolve 89 • Upscale • United States • Secondary and tertiary markets • Legacy assets • Upper upscale and luxury • Outside the United States • Key gateway cities and resorts • Institutional quality • Expect a significant level of disposition activity per year, contingent upon re-investment opportunities and tax planning • Potential sale of up to 9 full service hotels in 2014 More Less |
    When Buying When Selling Price (including CapEx) Price Recyclability Terms of Agreement Market and Location CapEx over Time Strategic Rationale Owner Profile Key Considerations When Buying and Selling Owned Hotels 90 |
 Case Study: Demonstrating our Successful Approach to Asset Recycling 91 Acquired 23 hotels in 2011 for more than $725M 11% annualized return, unlevered and exclusive of fees going forward Sold 11 of 23 hotels, with management agreements, for more than $400M 12 remaining hotels performing in line with expectations All 12 expected to be sold over time Rebranded to: Sold Kept Returns Future |
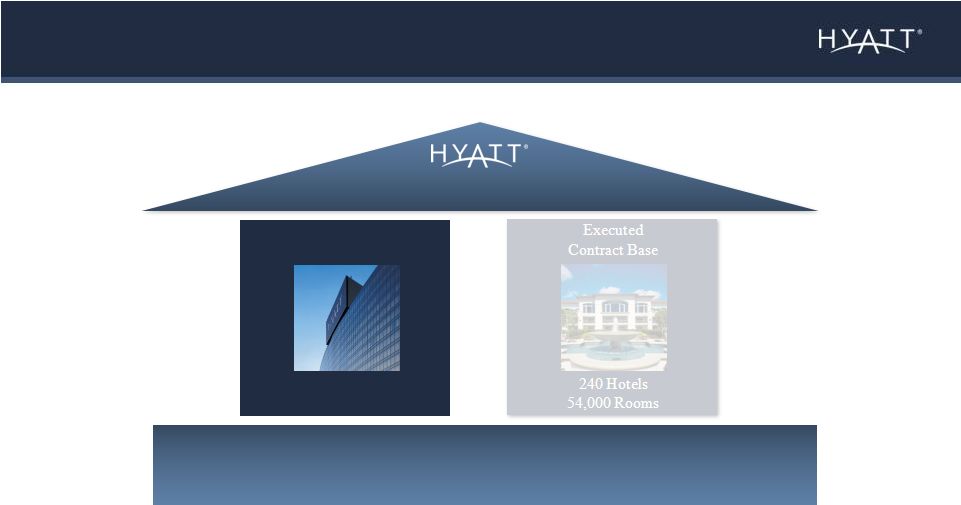
  Strong Foundation for Growth 92 Superior Long-Term Growth Executed Contract Base 240 Hotels 54,000 Rooms As of December 31, 2013 Leveraging Key Strengths • Multiple Earnings Tools • Powerful Brands • Relationships |
 Luxury 24% Upper Upscale / All Inclusive 39% Upscale 37% High Quality Executed Contract Base 93 As of December 31, 2013. Chain scale defined by STR. Statistics based on executed contract base rooms. |
 Executed Contract Base Composition: Large Growth Opportunity with Limited Hyatt Capital 94 As of December 31, 2013. Statistics based on executed contract base rooms. Under construction ~45% Outside U.S. ~80% Estimated third party capital investment ~$15B Require material Hyatt investment ~15% |
 Deliver High Quality, Durable Fees Contract Profile • Typical management and franchise contract: >20 year term • New contracts are additive as existing contract expirations minimal 95 Fees • Strong base and incentive fee structure • Stabilized fees > $150M per year |
   Strong Foundation for Growth 96 Owned and Leased Hotels 97 Hotels 28,039 Rooms Executed Contract Base 240 Hotels 54,000 Rooms As of December 31, 2013. Superior Long-Term Growth Leveraging Key Strengths • Multiple Earnings Tools • Powerful Brands • Relationships |
 Looking Ahead: Hyatt 3-5 Years Out 97 Superior Long-Term Growth • Industry leading system size growth rate • Continued executed contract base expansion • Strong operating leverage • Best locations in key markets • Evolution to higher quality owned portfolio – Expect significant level of dispositions per year, contingent upon reinvestment opportunities and tax planning • Return capital out of operating cash flow and additional balance sheet capacity Growth Quality Return of Capital |
 |
 Concluding Remarks Tom Pritzker Executive Chairman |
    Concluding Remarks Aligned in Creating Value Thesis Based on Multiple Earnings Tools Colleague, Guest and Owner Preference 100 |
 Investor Meeting |
 Glossary 102 Non-GAAP Reconciliation In this presentation, management has referred to Adjusted EBITDA, which is not presented in accordance with US GAAP. The Company defines consolidated Adjusted EBITDA as net income attributable to Hyatt Hotels Corporation plus our pro-rata share of unconsolidated hospitality ventures Adjusted EBITDA based on our ownership percentage of each venture, adjusted to exclude the following items: (i) equity earnings (losses) from unconsolidated hospitality ventures; (ii) gains (losses) on sales of real estate; (iii) asset impairments; (iv) other income (loss), net; (v) net loss attributable to noncontrolling interests; (vi) depreciation and amortization; (vii) interest expense; and (viii) (provision) benefit for income taxes. We calculate consolidated Adjusted EBITDA by adding the Adjusted EBITDA of each of our reportable segments to corporate and other Adjusted EBITDA. The Company’s board of directors and executive management team focus on Adjusted EBITDA as a key performance and compensation measure both on a segment and on a consolidated basis. Adjusted EBITDA assists us in comparing our performance over various reporting periods on a consistent basis because it removes from our operating results the impact of items that do not reflect our core operating performance both on a segment and on a consolidated basis. Our President and Chief Executive Officer, who is our chief operating decision maker, also evaluates the performance of each of our reportable segments and determines how to allocate resources to those segments, in significant part, by assessing the Adjusted EBITDA of each segment. In addition, the compensation committee of the Company’s board of directors determines the annual variable compensation for certain members of the Company’s management based in part on consolidated Adjusted EBITDA, segment Adjusted EBITDA or some combination of both. The Company believes that Adjusted EBITDA is useful to investors because it provides investors the same information that the Company uses internally for purposes of assessing the Company’s operating performance and making selected compensation decisions. Adjusted EBITDA is not a substitute for net income attributable to Hyatt Hotels Corporation, income from continuing operations, cash flows from operating activities or any other measure prescribed by GAAP. There are limitations to using non-GAAP measures such as Adjusted EBITDA. Although the Company believes that Adjusted EBITDA can make an evaluation of the Company’s operating performance more consistent because it removes items that do not reflect the Company’s core operations, other companies in our industry may define Adjusted EBITDA differently than we do. As a result, it may be difficult to use Adjusted EBITDA or similarly named non-GAAP measures that other companies may use to compare the performance of those companies to our performance. Because of these limitations, Adjusted EBITDA should not be considered as a measure of the income generated by our business or discretionary cash available to us to invest in the growth of our business. Our management compensates for these limitations by reference to our GAAP results and using Adjusted EBITDA supplementally. See the Company’s statements of income and consolidated statements of cash flows in our consolidated financial statements included in the Company’s 10-K filed on February 18, 2014. You can find a reconciliation of Adjusted EBITDA to net income attributable to Hyatt Hotels Corporation, the most directly comparable GAAP measure, on our website at Hyatt.com under the financial information section of our investor relations link. Other References to industry leading refer to Hyatt relative to all U.S. based publicly traded lodging C-corps that own, manage and franchise upscale, upper upscale and luxury hotels on a global basis. |