
Q4 2022 Supplemental Presentation 02/16/2023 SECRETS® IMPRESSION MOXCHE Exhibit 99.2
DISCLAIMERS 2 NON-GAAP FINANCIAL MEASURES This presentation includes references to certain financial measures, each identified with the symbol “†”, that are not calculated or presented in accordance with generally accepted accounting principles in the United States (“GAAP”). These non-GAAP financial measures have important limitations and should not be considered in isolation or as a substitute for measures of Hyatt Hotels Corporation’s (the “Company”) financial performance prepared in accordance with GAAP. In addition, these non-GAAP financial measures, as presented, may not be comparable to similarly titled measures of other companies due to varying methods of calculations. For how we define the non-GAAP financial measures and a reconciliation of each non-GAAP financial measure to the most directly comparable GAAP measure, please refer to the Appendix at the end of this presentation. KEY BUSINESS METRICS This presentation includes references to certain key business metrics used by the Company. For how we define these metrics, please refer to the Appendix at the end of this presentation.
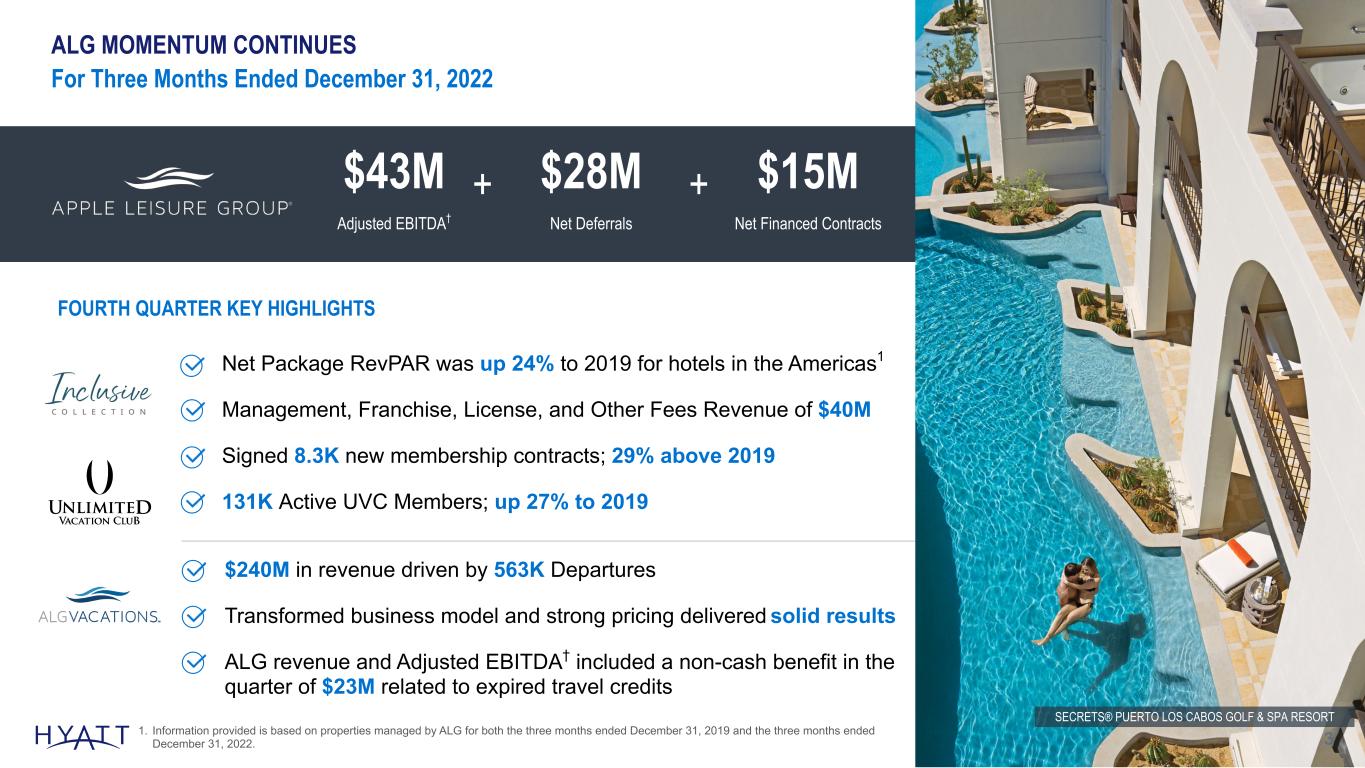
ALG MOMENTUM CONTINUES For Three Months Ended December 31, 2022 3 $43M Adjusted EBITDA† Net Package RevPAR was up 24% to 2019 for hotels in the Americas1 Management, Franchise, License, and Other Fees Revenue of $40M Signed 8.3K new membership contracts; 29% above 2019 131K Active UVC Members; up 27% to 2019 + $28M Net Deferrals $15M Net Financed Contracts + FOURTH QUARTER KEY HIGHLIGHTS $240M in revenue driven by 563K Departures Transformed business model and strong pricing delivered solid results ALG revenue and Adjusted EBITDA† included a non-cash benefit in the quarter of $23M related to expired travel credits SECRETS® PUERTO LOS CABOS GOLF & SPA RESORT 1. Information provided is based on properties managed by ALG for both the three months ended December 31, 2019 and the three months ended December 31, 2022.
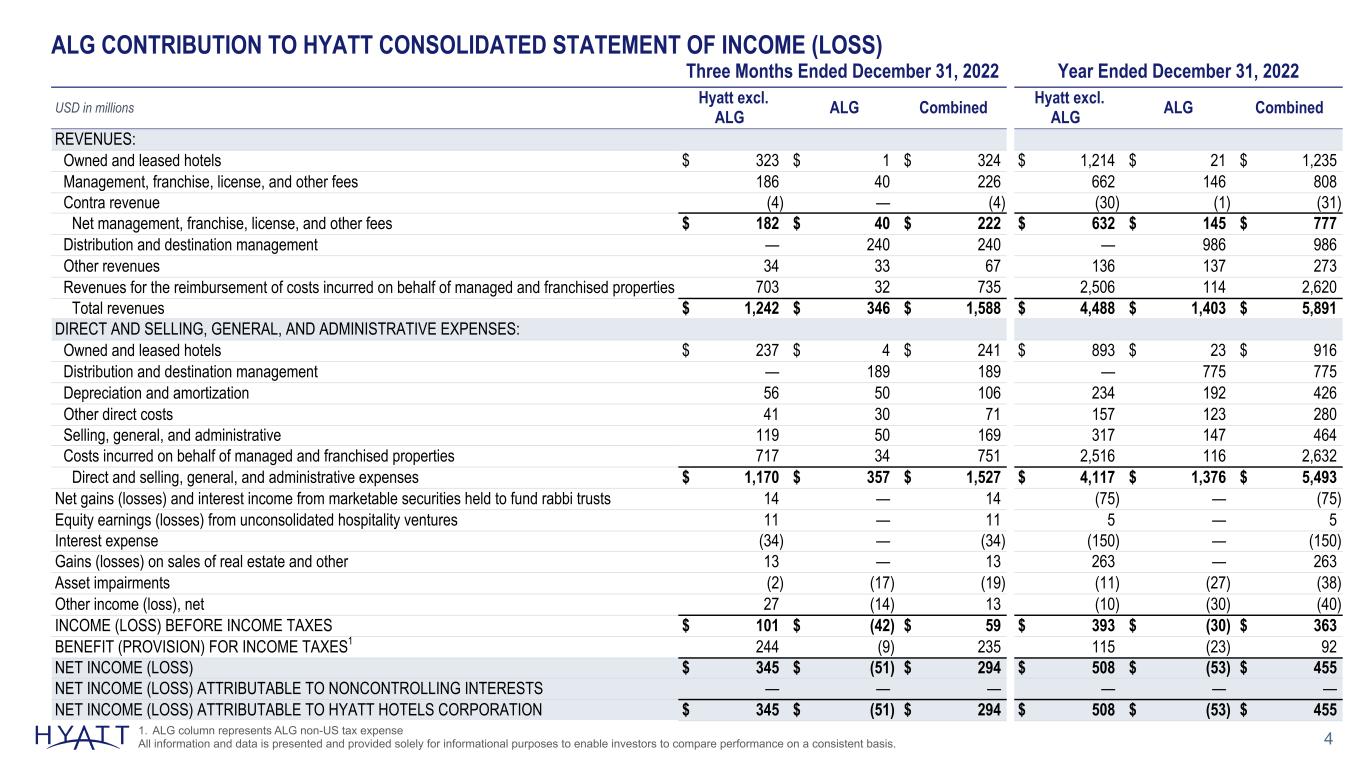
4 Three Months Ended December 31, 2022 Year Ended December 31, 2022 USD in millions Hyatt excl. ALG ALG Combined Hyatt excl. ALG ALG Combined REVENUES: Owned and leased hotels $ 323 $ 1 $ 324 $ 1,214 $ 21 $ 1,235 Management, franchise, license, and other fees 186 40 226 662 146 808 Contra revenue (4) — (4) (30) (1) (31) Net management, franchise, license, and other fees $ 182 $ 40 $ 222 $ 632 $ 145 $ 777 Distribution and destination management — 240 240 — 986 986 Other revenues 34 33 67 136 137 273 Revenues for the reimbursement of costs incurred on behalf of managed and franchised properties 703 32 735 2,506 114 2,620 Total revenues $ 1,242 $ 346 $ 1,588 $ 4,488 $ 1,403 $ 5,891 DIRECT AND SELLING, GENERAL, AND ADMINISTRATIVE EXPENSES: Owned and leased hotels $ 237 $ 4 $ 241 $ 893 $ 23 $ 916 Distribution and destination management — 189 189 — 775 775 Depreciation and amortization 56 50 106 234 192 426 Other direct costs 41 30 71 157 123 280 Selling, general, and administrative 119 50 169 317 147 464 Costs incurred on behalf of managed and franchised properties 717 34 751 2,516 116 2,632 Direct and selling, general, and administrative expenses $ 1,170 $ 357 $ 1,527 $ 4,117 $ 1,376 $ 5,493 Net gains (losses) and interest income from marketable securities held to fund rabbi trusts 14 — 14 (75) — (75) Equity earnings (losses) from unconsolidated hospitality ventures 11 — 11 5 — 5 Interest expense (34) — (34) (150) — (150) Gains (losses) on sales of real estate and other 13 — 13 263 — 263 Asset impairments (2) (17) (19) (11) (27) (38) Other income (loss), net 27 (14) 13 (10) (30) (40) INCOME (LOSS) BEFORE INCOME TAXES $ 101 $ (42) $ 59 $ 393 $ (30) $ 363 BENEFIT (PROVISION) FOR INCOME TAXES1 244 (9) 235 115 (23) 92 NET INCOME (LOSS) $ 345 $ (51) $ 294 $ 508 $ (53) $ 455 NET INCOME (LOSS) ATTRIBUTABLE TO NONCONTROLLING INTERESTS — — — — — — NET INCOME (LOSS) ATTRIBUTABLE TO HYATT HOTELS CORPORATION $ 345 $ (51) $ 294 $ 508 $ (53) $ 455 ALG CONTRIBUTION TO HYATT CONSOLIDATED STATEMENT OF INCOME (LOSS) 1. ALG column represents ALG non-US tax expense All information and data is presented and provided solely for informational purposes to enable investors to compare performance on a consistent basis.
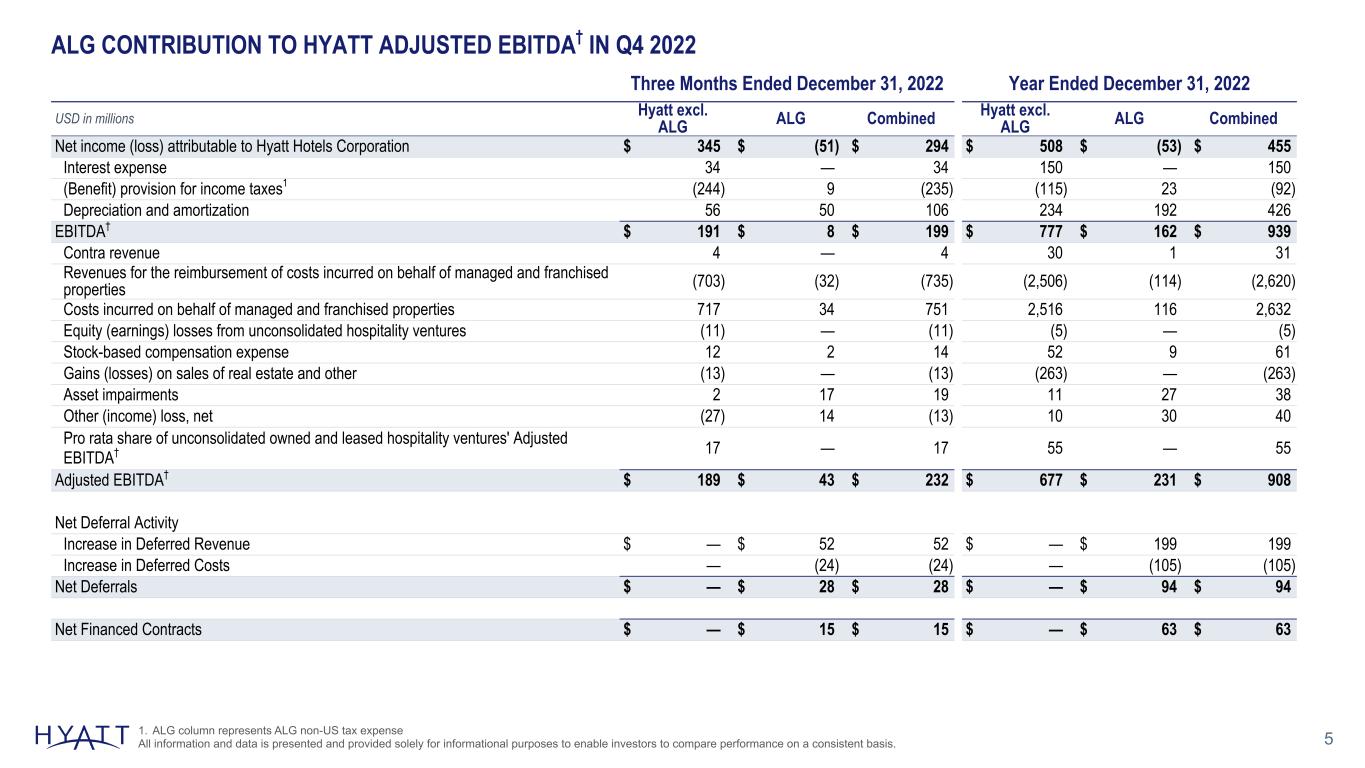
5 Three Months Ended December 31, 2022 Year Ended December 31, 2022 USD in millions Hyatt excl. ALG ALG Combined Hyatt excl. ALG ALG Combined Net income (loss) attributable to Hyatt Hotels Corporation $ 345 $ (51) $ 294 $ 508 $ (53) $ 455 Interest expense 34 — 34 150 — 150 (Benefit) provision for income taxes1 (244) 9 (235) (115) 23 (92) Depreciation and amortization 56 50 106 234 192 426 EBITDA† $ 191 $ 8 $ 199 $ 777 $ 162 $ 939 Contra revenue 4 — 4 30 1 31 Revenues for the reimbursement of costs incurred on behalf of managed and franchised properties (703) (32) (735) (2,506) (114) (2,620) Costs incurred on behalf of managed and franchised properties 717 34 751 2,516 116 2,632 Equity (earnings) losses from unconsolidated hospitality ventures (11) — (11) (5) — (5) Stock-based compensation expense 12 2 14 52 9 61 Gains (losses) on sales of real estate and other (13) — (13) (263) — (263) Asset impairments 2 17 19 11 27 38 Other (income) loss, net (27) 14 (13) 10 30 40 Pro rata share of unconsolidated owned and leased hospitality ventures' Adjusted EBITDA† 17 — 17 55 — 55 Adjusted EBITDA† $ 189 $ 43 $ 232 $ 677 $ 231 $ 908 Net Deferral Activity Increase in Deferred Revenue $ — $ 52 52 $ — $ 199 199 Increase in Deferred Costs — (24) (24) — (105) (105) Net Deferrals $ — $ 28 $ 28 $ — $ 94 $ 94 Net Financed Contracts $ — $ 15 $ 15 $ — $ 63 $ 63 ALG CONTRIBUTION TO HYATT ADJUSTED EBITDA† IN Q4 2022 1. ALG column represents ALG non-US tax expense All information and data is presented and provided solely for informational purposes to enable investors to compare performance on a consistent basis.

ALG PERFORMANCE BY QUARTER IN 2022 6 Q1 Q2 Q3 Q4 Full Year Net Package RevPAR (Americas) $ 214.32 $ 204.51 $ 179.42 $ 200.17 $ 199.28 Net Package RevPAR (Europe) $ 71.03 $ 80.13 $ 134.66 $ 87.08 $ 100.57 Net Package RevPAR (Total) $ 189.46 $ 162.72 $ 162.98 $ 174.38 $ 171.02 Unlimited Vacation Club Signed Contracts 7,805 8,466 9,241 8,267 33,779 Departures 579,110 744,431 681,552 563,067 2,568,160 USD in millions Owned and leased hotels revenues $ — $ 4 $ 16 $ 1 $ 21 Management, franchise, license, and other fees 30 36 40 40 146 Other revenues 34 33 37 33 137 Distribution and destination management revenues 246 256 244 240 986 ALG Adjusted Revenues† $ 310 $ 329 $ 337 $ 314 $ 1,290 Owned and leased hotels expenses $ 2 $ 7 $ 10 $ 4 $ 23 Other direct costs 25 34 34 30 123 Distribution and destination management expenses 194 206 186 189 775 Adjusted SG&A† 33 28 29 48 138 ALG Adjusted EBITDA† $ 56 $ 54 $ 78 $ 43 $ 231 Increase in Deferred Revenue $ 49 $ 52 $ 46 $ 52 $ 199 Increase in Deferred Costs (25) (27) (29) (24) (105) Net Deferrals $ 24 $ 25 $ 17 $ 28 $ 94 Net Financed Contracts $ 7 $ 15 $ 26 $ 15 $ 63 All information and data is presented and provided solely for informational purposes to enable investors to compare performance on a consistent basis.

Appendix 7 SECRETS® AKUMAL RIVIERA MAYA

8 DEFINITIONS Adjusted Earnings Before Interest Expense, Taxes, Depreciation, and Amortization (Adjusted EBITDA) and EBITDA We use the terms Adjusted EBITDA and EBITDA throughout this supplemental presentation. Adjusted EBITDA and EBITDA, as we define them, are non-GAAP measures. We define consolidated Adjusted EBITDA as net income (loss) attributable to Hyatt Hotels Corporation plus our pro rata share of unconsolidated owned and leased hospitality ventures' Adjusted EBITDA based on our ownership percentage of each owned and leased venture, adjusted to exclude the following items: • interest expense; • benefit (provision) for income taxes; • depreciation and amortization; • amortization of management and franchise agreement assets and performance cure payments, which constitute payments to customers (Contra revenue); • revenues for the reimbursement of costs incurred on behalf of managed and franchised properties; • costs incurred on behalf of managed and franchised properties that we intend to recover over the long term; • equity earnings (losses) from unconsolidated hospitality ventures; • stock-based compensation expense; • gains (losses) on sales of real estate and other; • asset impairments; and • other income (loss), net We calculate consolidated Adjusted EBITDA by adding the Adjusted EBITDA of each of our reportable segments and eliminations to corporate and other Adjusted EBITDA. Our board of directors and executive management team focus on Adjusted EBITDA as one of the key performance and compensation measures both on a segment and on a consolidated basis. Adjusted EBITDA assists us in comparing our performance over various reporting periods on a consistent basis because it removes from our operating results the impact of items that do not reflect our core operations both on a segment and on a consolidated basis. Our President and Chief Executive Officer, who is our chief operating decision maker ("CODM"), also evaluates the performance of each of our reportable segments and determines how to allocate resources to those segments, in part, by assessing the Adjusted EBITDA of each segment. In addition, the compensation committee of our board of directors determines the annual variable compensation for certain members of our management based in part on consolidated Adjusted EBITDA, segment Adjusted EBITDA, or some combination of both. We believe Adjusted EBITDA is useful to investors because it provides investors with the same information that we use internally for purposes of assessing our operating performance and making compensation decisions and facilitates our comparison of results with results from other companies within our industry. Adjusted EBITDA excludes certain items that can vary widely across different industries and among companies within the same industry including interest expense and benefit (provision) for income taxes, which are dependent on company specifics, including capital structure, credit ratings, tax policies, and jurisdictions in which they operate; depreciation and amortization which are dependent on company policies including how the assets are utilized as well as the lives assigned to the assets; Contra revenue which is dependent on company policies and strategic decisions regarding payments to hotel owners; and stock-based compensation expense which varies among companies as a result of different compensation plans companies have adopted. We exclude revenues for the reimbursement of costs and costs incurred on behalf of managed and franchised properties which relate to the reimbursement of payroll costs and for system-wide services and programs that we operate for the benefit of our hotel owners as contractually we do not provide services or operate the related programs to generate a profit over the terms of the respective contracts. Over the long term, these programs and services are not designed to impact our economics, either positively or negatively. Therefore, we exclude the net impact when evaluating period-over-period changes in our operating results. Adjusted EBITDA includes costs incurred on behalf of our managed and franchised properties related to system-wide services and programs that we do not intend to recover from hotel owners. Finally, we exclude other items that are not core to our operations, such as asset impairments and unrealized and realized gains and losses on marketable securities. Adjusted EBITDA and EBITDA are not substitutes for net income (loss) attributable to Hyatt Hotels Corporation, net income (loss), or any other measure prescribed by GAAP. There are limitations to using non-GAAP measures such as Adjusted EBITDA and EBITDA. Although we believe that Adjusted EBITDA can make an evaluation of our operating performance more consistent because it removes items that do not reflect our core operations, other companies in our industry may define Adjusted EBITDA differently than we do. As a result, it may be difficult to use Adjusted EBITDA or similarly named non-GAAP measures that other companies may use to compare the performance of those companies to our performance. Because of these limitations, Adjusted EBITDA should not be considered as a measure of the income (loss) generated by our business. Our management compensates for these limitations by referencing our GAAP results and using Adjusted EBITDA supplementally.
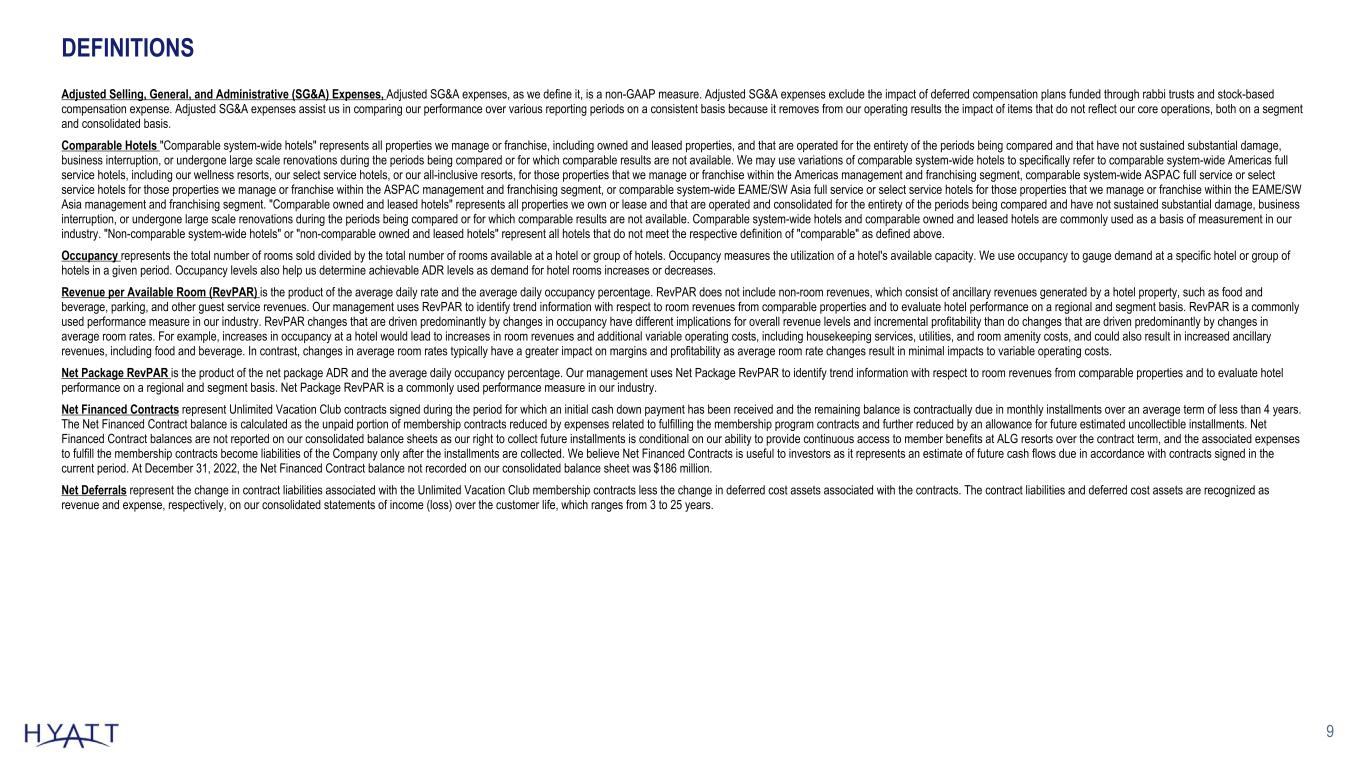
9 DEFINITIONS Adjusted Selling, General, and Administrative (SG&A) Expenses, Adjusted SG&A expenses, as we define it, is a non-GAAP measure. Adjusted SG&A expenses exclude the impact of deferred compensation plans funded through rabbi trusts and stock-based compensation expense. Adjusted SG&A expenses assist us in comparing our performance over various reporting periods on a consistent basis because it removes from our operating results the impact of items that do not reflect our core operations, both on a segment and consolidated basis. Comparable Hotels "Comparable system-wide hotels" represents all properties we manage or franchise, including owned and leased properties, and that are operated for the entirety of the periods being compared and that have not sustained substantial damage, business interruption, or undergone large scale renovations during the periods being compared or for which comparable results are not available. We may use variations of comparable system-wide hotels to specifically refer to comparable system-wide Americas full service hotels, including our wellness resorts, our select service hotels, or our all-inclusive resorts, for those properties that we manage or franchise within the Americas management and franchising segment, comparable system-wide ASPAC full service or select service hotels for those properties we manage or franchise within the ASPAC management and franchising segment, or comparable system-wide EAME/SW Asia full service or select service hotels for those properties that we manage or franchise within the EAME/SW Asia management and franchising segment. "Comparable owned and leased hotels" represents all properties we own or lease and that are operated and consolidated for the entirety of the periods being compared and have not sustained substantial damage, business interruption, or undergone large scale renovations during the periods being compared or for which comparable results are not available. Comparable system-wide hotels and comparable owned and leased hotels are commonly used as a basis of measurement in our industry. "Non-comparable system-wide hotels" or "non-comparable owned and leased hotels" represent all hotels that do not meet the respective definition of "comparable" as defined above. Occupancy represents the total number of rooms sold divided by the total number of rooms available at a hotel or group of hotels. Occupancy measures the utilization of a hotel's available capacity. We use occupancy to gauge demand at a specific hotel or group of hotels in a given period. Occupancy levels also help us determine achievable ADR levels as demand for hotel rooms increases or decreases. Revenue per Available Room (RevPAR) is the product of the average daily rate and the average daily occupancy percentage. RevPAR does not include non-room revenues, which consist of ancillary revenues generated by a hotel property, such as food and beverage, parking, and other guest service revenues. Our management uses RevPAR to identify trend information with respect to room revenues from comparable properties and to evaluate hotel performance on a regional and segment basis. RevPAR is a commonly used performance measure in our industry. RevPAR changes that are driven predominantly by changes in occupancy have different implications for overall revenue levels and incremental profitability than do changes that are driven predominantly by changes in average room rates. For example, increases in occupancy at a hotel would lead to increases in room revenues and additional variable operating costs, including housekeeping services, utilities, and room amenity costs, and could also result in increased ancillary revenues, including food and beverage. In contrast, changes in average room rates typically have a greater impact on margins and profitability as average room rate changes result in minimal impacts to variable operating costs. Net Package RevPAR is the product of the net package ADR and the average daily occupancy percentage. Our management uses Net Package RevPAR to identify trend information with respect to room revenues from comparable properties and to evaluate hotel performance on a regional and segment basis. Net Package RevPAR is a commonly used performance measure in our industry. Net Financed Contracts represent Unlimited Vacation Club contracts signed during the period for which an initial cash down payment has been received and the remaining balance is contractually due in monthly installments over an average term of less than 4 years. The Net Financed Contract balance is calculated as the unpaid portion of membership contracts reduced by expenses related to fulfilling the membership program contracts and further reduced by an allowance for future estimated uncollectible installments. Net Financed Contract balances are not reported on our consolidated balance sheets as our right to collect future installments is conditional on our ability to provide continuous access to member benefits at ALG resorts over the contract term, and the associated expenses to fulfill the membership contracts become liabilities of the Company only after the installments are collected. We believe Net Financed Contracts is useful to investors as it represents an estimate of future cash flows due in accordance with contracts signed in the current period. At December 31, 2022, the Net Financed Contract balance not recorded on our consolidated balance sheet was $186 million. Net Deferrals represent the change in contract liabilities associated with the Unlimited Vacation Club membership contracts less the change in deferred cost assets associated with the contracts. The contract liabilities and deferred cost assets are recognized as revenue and expense, respectively, on our consolidated statements of income (loss) over the customer life, which ranges from 3 to 25 years.

10 RECONCILIATION OF NON-GAAP FINANCIAL MEASURE (CONT.) Hyatt Hotels Corporation Reconciliation of Non-GAAP Financial Measure: Reconciliation of Apple Leisure Group Segment SG&A Expenses to Segment Adjusted SG&A Expenses Results of operations as presented on the consolidated statements of income (loss) include expenses recognized with respect to deferred compensation plans funded through rabbi trusts. Certain of these expenses are recognized in SG&A expenses and are completely offset by the corresponding net gains (losses) and interest income from marketable securities held to fund rabbi trusts, thus having no net impact to our earnings (losses). SG&A expenses also include expenses related to stock-based compensation. Below is a reconciliation of this measure excluding the impact of our rabbi trust investments and stock-based compensation expense. (USD in millions) Q1 2022 Q2 2022 Q3 2022 Q4 2022 FY 2022 ALG Segment SG&A expenses $ 37 $ 31 $ 29 $ 50 $ 147 Less: rabbi trust impact — — — — — Less: stock-based compensation expense (4) (3) — (2) (9) ALG Segment Adjusted SG&A† expenses $ 33 $ 28 $ 29 $ 48 $ 138

11 RECONCILIATION OF NON-GAAP FINANCIAL MEASURE (CONT.) Hyatt Hotels Corporation Reconciliation of Non-GAAP Financial Measure: Reconciliation of Net Income (Loss) Attributable to Hyatt Hotels Corporation to EBITDA and EBITDA to Adjusted EBITDA (USD in millions) Q1 2022 Q2 2022 Q3 2022 Q4 2022 FY 2022 Net income (loss) attributable to Hyatt Hotels Corporation $ (73) $ 206 $ 28 $ 294 $ 455 Interest expense 40 38 38 34 150 (Benefit) provision for income taxes 2 106 35 (235) (92) Depreciation and amortization 119 105 96 106 426 EBITDA† $ 88 $ 455 $ 197 $ 199 $ 939 Contra revenue 9 9 9 4 31 Revenues for the reimbursement of costs incurred on behalf of managed and franchised properties (540) (640) (705) (735) (2,620) Costs incurred on behalf of managed and franchised properties 556 628 697 751 2,632 Equity (earnings) losses from unconsolidated hospitality ventures 9 (1) (2) (11) (5) Stock-based compensation expense 28 12 7 14 61 (Gains) losses on sales of real estate and other — (251) 1 (13) (263) Asset impairments 3 7 9 19 38 Other (income) loss, net 10 19 24 (13) 40 Pro rata share of unconsolidated owned and leased hospitality ventures' Adjusted EBITDA 6 17 15 17 55 Adjusted EBITDA† $ 169 $ 255 $ 252 $ 232 $ 908
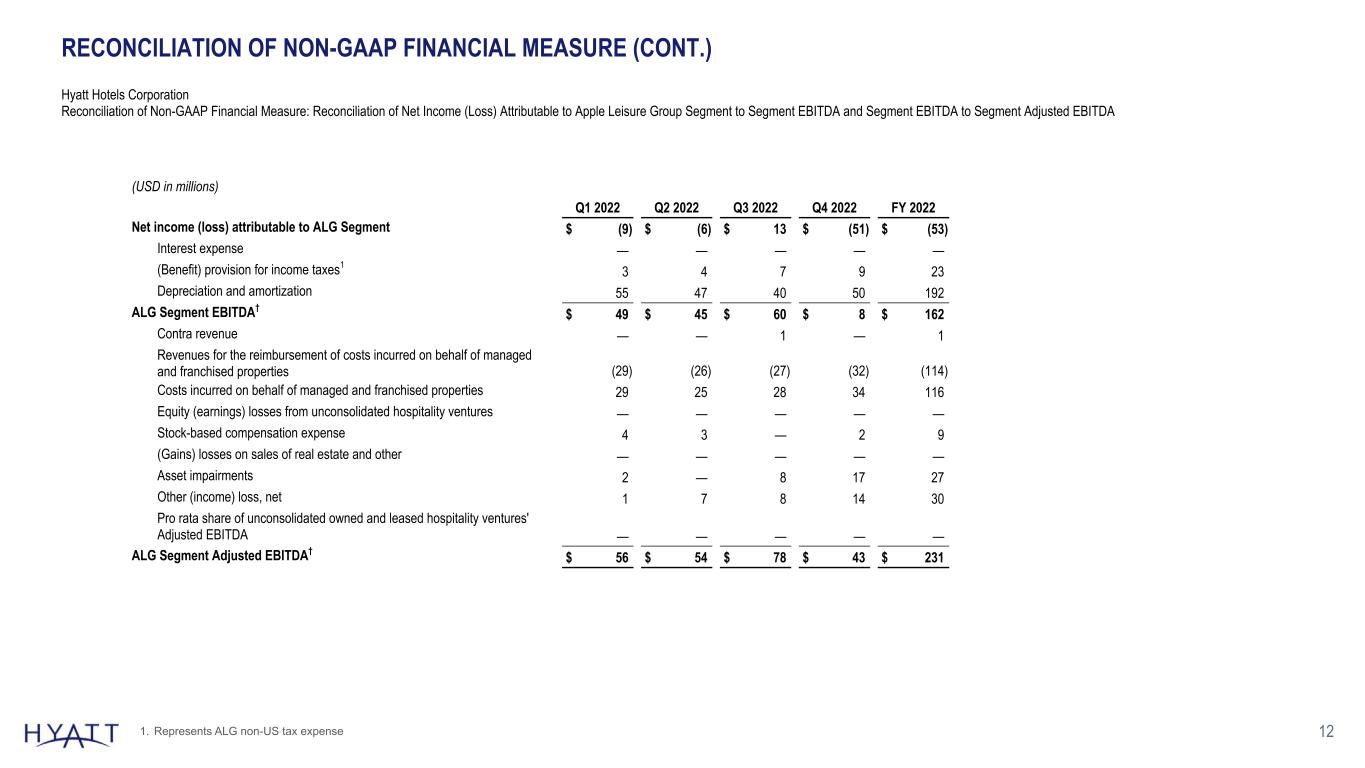
12 RECONCILIATION OF NON-GAAP FINANCIAL MEASURE (CONT.) Hyatt Hotels Corporation Reconciliation of Non-GAAP Financial Measure: Reconciliation of Net Income (Loss) Attributable to Apple Leisure Group Segment to Segment EBITDA and Segment EBITDA to Segment Adjusted EBITDA (USD in millions) Q1 2022 Q2 2022 Q3 2022 Q4 2022 FY 2022 Net income (loss) attributable to ALG Segment $ (9) $ (6) $ 13 $ (51) $ (53) Interest expense — — — — — (Benefit) provision for income taxes1 3 4 7 9 23 Depreciation and amortization 55 47 40 50 192 ALG Segment EBITDA† $ 49 $ 45 $ 60 $ 8 $ 162 Contra revenue — — 1 — 1 Revenues for the reimbursement of costs incurred on behalf of managed and franchised properties (29) (26) (27) (32) (114) Costs incurred on behalf of managed and franchised properties 29 25 28 34 116 Equity (earnings) losses from unconsolidated hospitality ventures — — — — — Stock-based compensation expense 4 3 — 2 9 (Gains) losses on sales of real estate and other — — — — — Asset impairments 2 — 8 17 27 Other (income) loss, net 1 7 8 14 30 Pro rata share of unconsolidated owned and leased hospitality ventures' Adjusted EBITDA — — — — — ALG Segment Adjusted EBITDA† $ 56 $ 54 $ 78 $ 43 $ 231 1. Represents ALG non-US tax expense
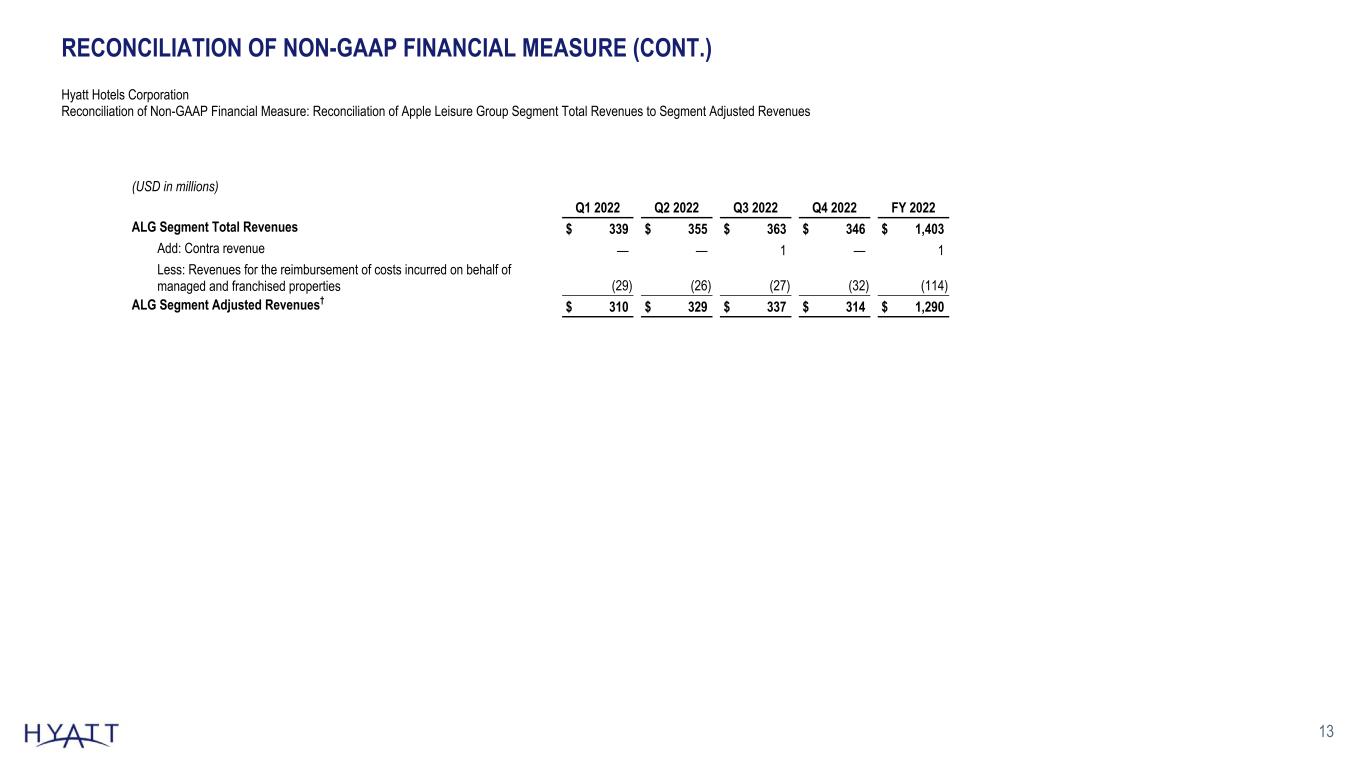
13 RECONCILIATION OF NON-GAAP FINANCIAL MEASURE (CONT.) Hyatt Hotels Corporation Reconciliation of Non-GAAP Financial Measure: Reconciliation of Apple Leisure Group Segment Total Revenues to Segment Adjusted Revenues (USD in millions) Q1 2022 Q2 2022 Q3 2022 Q4 2022 FY 2022 ALG Segment Total Revenues $ 339 $ 355 $ 363 $ 346 $ 1,403 Add: Contra revenue — — 1 — 1 Less: Revenues for the reimbursement of costs incurred on behalf of managed and franchised properties (29) (26) (27) (32) (114) ALG Segment Adjusted Revenues† $ 310 $ 329 $ 337 $ 314 $ 1,290
14


