C O N F I D E N T I A L A N D P R O P R I E T A R Y | H y a t t a n d r e l a t e d m a r k s a r e t r a d e m a r k s o f H y a t t C o r p o r a t i o n o r i t s a f f i l i a t e s . © 2 0 2 5 H y a t t C o r p o r a t i o n . A l l r i g h t s r e s e r v e d . Investor Presentation Hyatt FOURTH QUARTER 2024 G R A N D H Y A T T D E E R V A L L E Y N E W L Y O P E N E D Q 4 2 0 2 4
Disclaimers 2 Forward-Looking Statements Forward-Looking Statements in this presentation, which are not historical facts, are forward-looking statements within the meaning of the Private Securities Litigation Reform Act of 1995. These statements include statements about Hyatt Hotels Corporation's ("Hyatt," "the Company," "we," "us," or "our"") plans, strategies, outlook, the number of properties we expect to open in the future, our growth model, our credit rating expectations, our capital allocation plans, our expected capital expenditures, our expected net income and Adjusted EBITDA, our expected net rooms growth, our expected system-wide hotels RevPAR growth, our expected Adjusted Free Cash Flow, financial performance, prospective or future events and involve known and unknown risks that are difficult to predict. As a result, our actual results, performance or achievements may differ materially from those expressed or implied by these forward-looking statements. In some cases, you can identify forward-looking statements by the use of words such as "may," "could," "expect," "intend," "plan," "seek," "anticipate," "believe," "estimate," "predict," "potential," "continue," "likely," "will," "would" and variations of these terms and similar expressions, or the negative of these terms or similar expressions. Such forward-looking statements are necessarily based upon estimates and assumptions that, while considered reasonable by us and our management, are inherently uncertain. Factors that may cause actual results to differ materially from current expectations include, but are not limited to: general economic uncertainty in key global markets and a worsening of global economic conditions or low levels of economic growth; the rate and pace of economic recovery following economic downturns; global supply chain constraints and interruptions, rising costs of construction-related labor and materials, and increases in costs due to inflation or other factors that may not be fully offset by increases in revenues in our business; risks affecting the luxury, resort, and all-inclusive lodging segments; levels of spending in business, leisure, and group segments, as well as consumer confidence; declines in occupancy and average daily rate; limited visibility with respect to future bookings; loss of key personnel; domestic and international political and geopolitical conditions, including political or civil unrest or changes in trade policy; hostilities, or fear of hostilities, including future terrorist attacks, that affect travel; travel-related accidents; natural or man-made disasters, weather and climate-related events, such as hurricanes, earthquakes, tsunamis, tornadoes, droughts, floods, wildfires, oil spills, nuclear incidents, and global outbreaks of pandemics or contagious diseases, or fear of such outbreaks; our ability to successfully achieve specified levels of operating profits at hotels that have performance tests or guarantees in favor of our third-party owners; the impact of hotel renovations and redevelopments; risks associated with our capital allocation plans, share repurchase program, and dividend payments, including a reduction in, or elimination or suspension of, repurchase activity or dividend payments; the seasonal and cyclical nature of the real estate and hospitality businesses; changes in distribution arrangements, such as through internet travel intermediaries; changes in the tastes and preferences of our customers; relationships with colleagues and labor unions and changes in labor laws; the financial condition of, and our relationships with, third-party owners, franchisees, and hospitality venture partners; the possible inability of third-party owners, franchisees, or development partners to access the capital necessary to fund current operations or implement our plans for growth; risks associated with potential acquisitions and dispositions and our ability to successfully integrate completed acquisitions with existing operations; failure to successfully complete proposed transactions (including the failure to satisfy closing conditions or obtain required approvals); our ability to maintain effective internal control over financial reporting and disclosure controls and procedures; declines in the value of our real estate assets; unforeseen terminations of our management and hotel services agreements or franchise agreements; changes in federal, state, local, or foreign tax law; increases in interest rates, wages, and other operating costs; foreign exchange rate fluctuations or currency restructurings; risks associated with the introduction of new brand concepts, including lack of acceptance of new brands or innovation; general volatility of the capital markets and our ability to access such markets; changes in the competitive environment in our industry, industry consolidation, and the markets where we operate; our ability to successfully grow the World of Hyatt loyalty program and manage the Unlimited Vacation Club paid membership program; cyber incidents and information technology failures; outcomes of legal or administrative proceedings; violations of regulations or laws related to our franchising business and licensing businesses and our international operations; and other risks discussed in the Company's filings with the SEC, including our annual reports on Form 10-K and quarterly reports on Form 10-Q, which filings are available from the SEC. All forward-looking statements attributable to us or persons acting on our behalf are expressly qualified in their entirety by the cautionary statements set forth above. We caution you not to place undue reliance on any forward-looking statements, which are made only as of the date of this presentation. We do not undertake or assume any obligation to update publicly any of these forward-looking statements to reflect actual results, new information or future events, changes in assumptions or changes in other factors affecting forward-looking statements, except to the extent required by applicable law. If we update one or more forward-looking statements, no inference should be drawn that we will make additional updates with respect to those or other forward-looking statements. Non-GAAP Financial Measures This presentation includes references to certain financial measures, each identified with the symbol "†", that are not calculated or presented in accordance with generally accepted accounting principles in the United States ("GAAP"). These non-GAAP financial measures have important limitations and should not be considered in isolation or as a substitute for measures of the Company's financial performance prepared in accordance with GAAP. In addition, these non-GAAP financial measures, as presented, may not be comparable to similarly titled measures of other companies due to varying methods of calculations. During the year ended December 31, 2024, the Company revised its definition of Adjusted EBITDA† to exclude transaction and integration costs and recast prior-period results to provide comparability. Refer to schedule A-6 in the fourth quarter and full year 2024 earnings release for additional detail. Key Business Metrics This presentation includes references to certain key business metrics used by the Company, each identified with the symbol "◊". References Numerical tickmarks noted throughout this presentation correspond to the slide and tickmark numbers included in the Appendix beginning on slide 21 and the references and general disclaimers referenced therein should be read in conjunction with information presented on each slide.
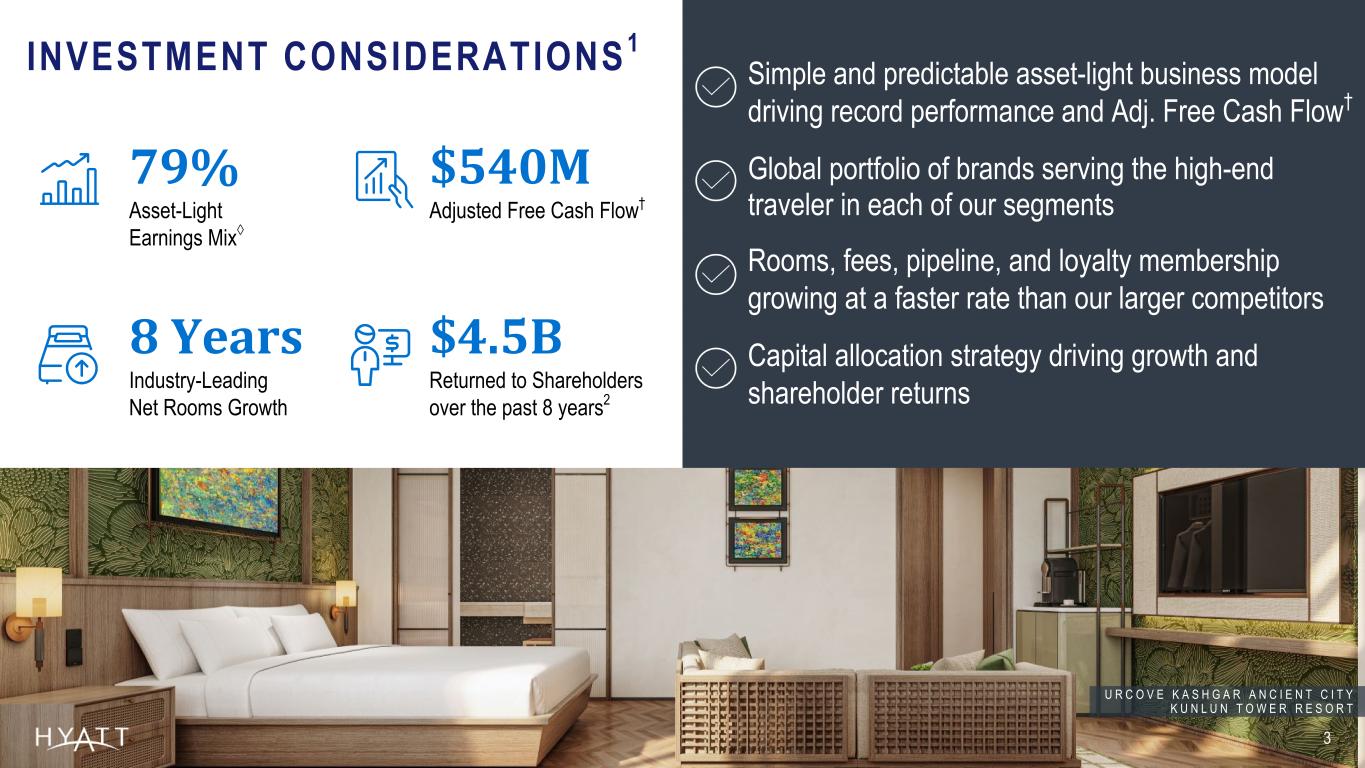
INVESTMENT CONSIDERATIONS 1 3 79% Asset-Light Earnings Mix◊ 8 Years Industry-Leading Net Rooms Growth Simple and predictable asset-light business model driving record performance and Adj. Free Cash Flow† Global portfolio of brands serving the high-end traveler in each of our segments Rooms, fees, pipeline, and loyalty membership growing at a faster rate than our larger competitors Capital allocation strategy driving growth and shareholder returns $4.5B Returned to Shareholders over the past 8 years2 $540M Adjusted Free Cash Flow† Source Notes: Shareholder Returns (div + repurchases): – 2017: 743M – 2018: 1,014M – 2019: 501M – 2020: 89M – 2021: 0 – 2022: 369M – 2023: 491M – 2024: 1,250M Share file: CHICO-Team- Corporate FPA - Documents\Fact Pack and QA Document\2024\Investor Consideration Deck Support\Annual U R C O V E K A S H G A R A N C I E N T C I T Y K U N L U N T O W E R R E S O R T Footnotes: 1 Metrics presented and growth rate comparison against larger competitors are as of December 31, 2024. 2 Returned to shareholders through share repurchases and dividends. Figures calculated from January 1, 2017 - December 31, 2024.
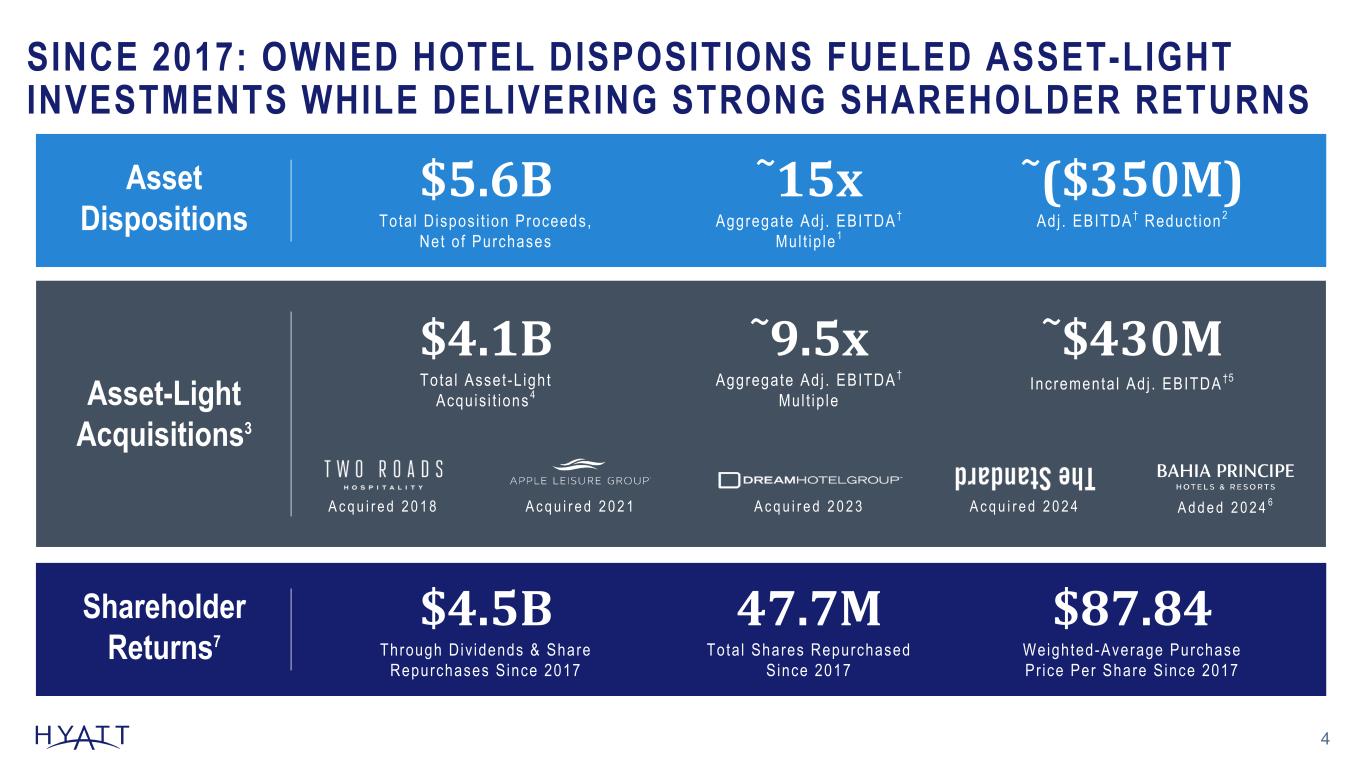
4 A c q u i r e d 2 0 1 8 A c q u i r e d 2 0 2 1 A c q u i r e d 2 0 2 3 A c q u i r e d 2 0 2 4 SINCE 2017: OWNED HOTEL DISPOSITIONS FUELED ASSET-LIGHT INVESTMENTS WHILE DELIVERING STRONG SHAREHOLDER RETURNS $5.6B Tota l D ispos i t ion Proceeds, Net o f Purchases ~15x Aggregate Ad j . EBITDA † Mul t ip le 1 Asset Dispositions ~($350M) Adj . EBITDA † Reduct ion 2 $4.1B Tota l Asset -L ight Acqu is i t ions 4 ~9.5x Aggregate Ad j . EBITDA † Mul t ip leAsset-Light Acquisitions3 ~$430M Incrementa l Ad j . EBITDA †5 $4.5B Through Div idends & Share Repurchases S ince 2017 Shareholder Returns7 47.7M Tota l Shares Repurchased S ince 2017 $87.84 Weighted-Average Purchase Pr ice Per Share S ince 2017 Footnotes: 1 Aggregate Adjusted EBITDA† multiple based on the Adjusted EBITDA† for each respective year for sales prior to 2020, based on 2019 fiscal year for sales in 2021 and 2022, and based on the trailing 12 months prior to the sale for sales in 2024. 2 Adjusted EBITDA† reduction of ~$400M from the assets sold netted against ~$50M of run-rate fees from the long-term management or franchise agreements signed as part of the asset sales. 3 Asset-Light Acquisitions includes Two Roads Hospitality, Apple Leisure Group, inclusive of the UVC Transaction, Dream Hotel Group, Mr & Mrs Smith, Me and All Hotels, Standard International, and the Bahia Principe Transaction. 4 Includes base consideration paid and assumption for variable consideration to be paid; variable consideration for Dream Hotel Group, Standard International, and Bahia Principe Transaction based on stabilized estimates. 5 Incremental Adjusted EBITDA† based on stabilized Adjusted EBITDA† estimates for Two Roads Hospitality, Apple Leisure Group, inclusive of the UVC Transaction, Dream Hotel Group, Mr & Mrs Smith, Me and All Hotels, Standard International, and the Bahia Principe Transaction. 6 Added as a result of the Bahia Principe Transaction. 7 Figures calculated from January 1, 2017 - December 31, 2024. Source Notes: Shareholder Returns $ (div + repurchases): – 2017: 743M – 2018: 1,014M – 2019: 501M – 2020: 89M – 2021: 0 – 2022: 369M – 2023: 492M – 2024: 1,250M Total # Shares Repurchased: – 2017: 12.19M – 2018: 12.72M – 2019: 5.62M – 2020: 0.83M – 2021: 0 – 2022: 4.23M – 2023: 4.12M – 2024: 7.99M CHICO-Team-Corporate FPA - Documents\Fact Pack and QA Document\2024\Investor Consideration Deck Support\Annual A d d e d 2 0 2 4 6
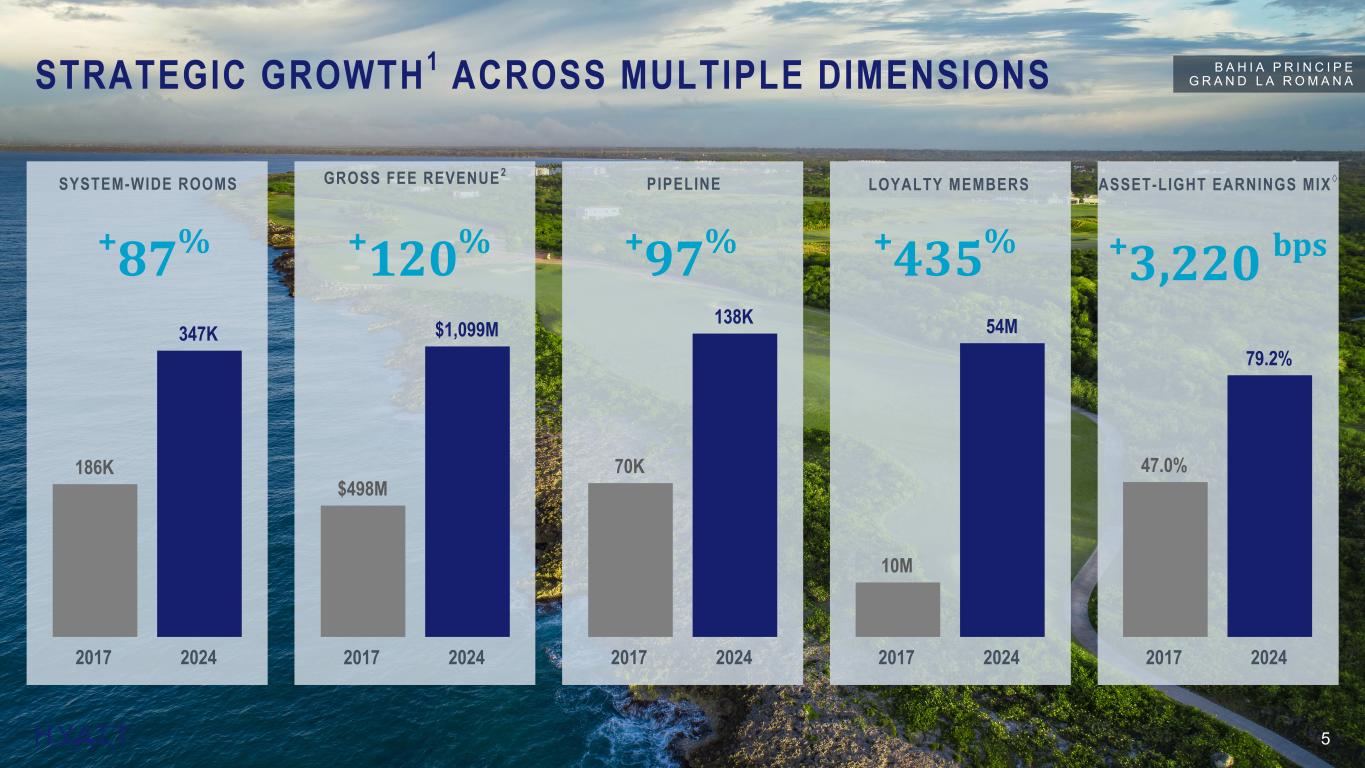
STRATEGIC GROWTH1 ACROSS MULTIPLE DIMENSIONS 5 +87% +120% +97% +435% +3,220 bps SYSTEM-WIDE ROOMS GROSS FEE REVENUE2 PIPELINE LOYALTY MEMBERS ASSET-LIGHT EARNINGS MIX◊ Source Notes: Updated Annually Support: Hyatt Hotels\CHICO-Team-Corporate FPA - Documents\Fact Pack and QA Document\2024\Investor Consideration Deck Support\Annual \ Strategic Growth support file -2009 Data can be found under 2009 folder System-wide rooms based on Inventory as of December 31, 2009 Fee Revenue, pipeline, and loyalty members based on Hyatt 2009 Annual Report -2017 Data can be found under 2017 folder System-wide rooms based on Inventory as of December 31, 2017 Fee Revenue and pipeline based on Q4 2017 Earnings Release Loyalty members based on 10-K 2017 -2023 Data System-wide rooms based on Inventory as of December 31, 2023 Fee Revenue and pipeline based on Q4 2023 Earnings Release Loyalty members based on 10-K 2023 as well as Enrollment and Program member count Q4 2023 Footnotes: 1 Calculated growth comparisons based on years ended December 31, 2017 and December 31, 2024. 2 Gross fee revenue in 2017 represents management, franchise, and other fees following the adoption of ASC 606 during the year ended December 31, 2018 as disclosed in our 2018 Form 10-K. 186K 347K 2017 2024 $498M $1,099M 2017 2024 70K 138K 2017 2024 10M 54M 2017 2024 47.0% 79.2% 2017 2024 B A H I A P R I N C I P E G R A N D L A R O M A N A
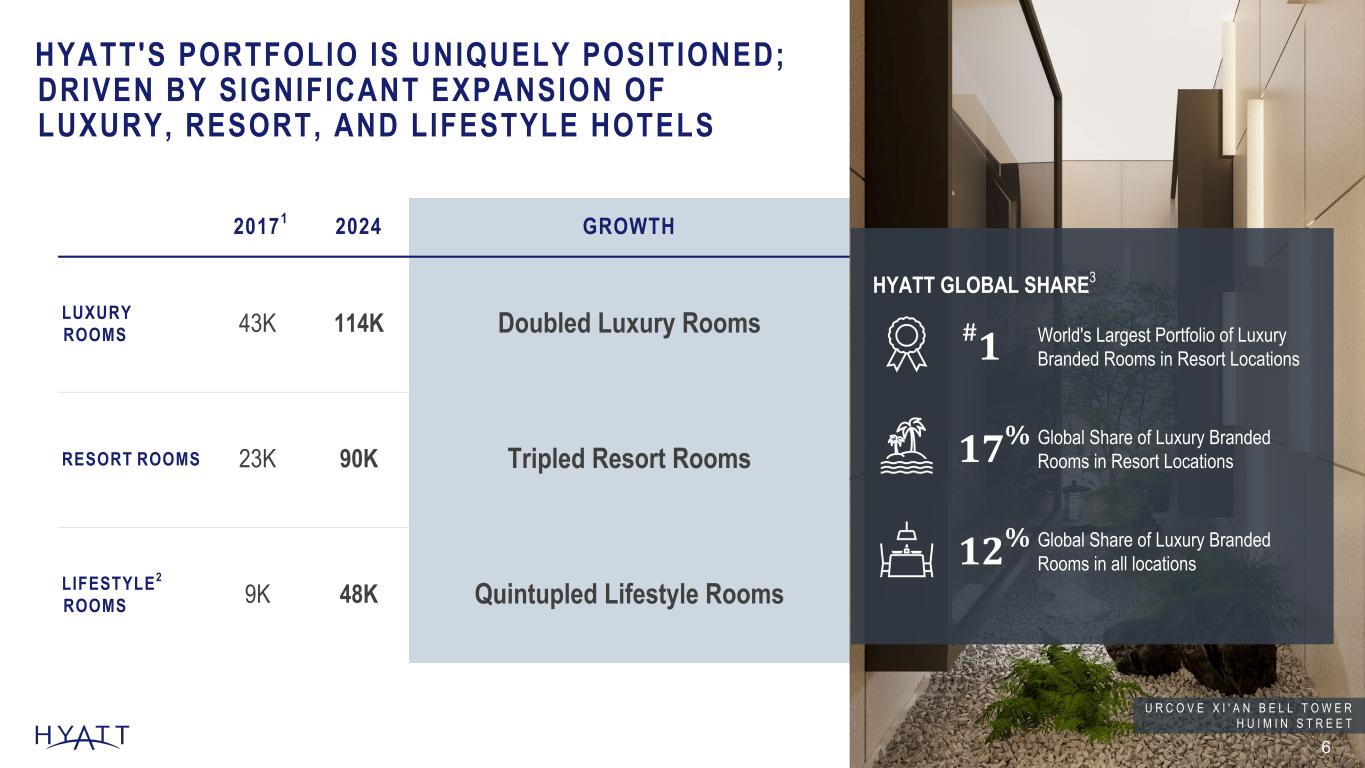
20171 2024 GROWTH LUXURY ROOMS 43K 114K Doubled Luxury Rooms RESORT ROOMS 23K 90K Tripled Resort Rooms LIFESTYLE2 ROOMS 9K 48K Quintupled Lifestyle Rooms HYATT'S PORTFOLIO IS UNIQUELY POSITIONED; DRIVEN BY SIGNIFICANT EXPANSION OF LUXURY, RESORT, AND LIFESTYLE HOTELS 6 HYATT GLOBAL SHARE3 #1 World's Largest Portfolio of Luxury Branded Rooms in Resort Locations 17% Global Share of Luxury Branded Rooms in Resort Locations 12% Global Share of Luxury Branded Rooms in all locations U R C O V E X I ' A N B E L L T O W E R H U I M I N S T R E E T Source Notes: Updated Annually Support: Hyatt Hotels\CHICO-Team-Corporate FPA - Documents\Fact Pack and QA Document\202X\Investor Consideration Deck Support\Annual -Luxury, Lifestyle, and Resort rooms calculated based on HHC Inventory as of Year end and calculated based on Luxury Lifestyle or Resort Support file -Hyatt Global Share calculated based on STR census as of Year-end. Footnotes: Figures as of December 31, 2024 (unless otherwise noted). Luxury and resort rooms as defined by Smith Travel Research chain scale classification. 1 Figures and growth metrics based on year ended December 31, 2017, reflective of when the Company announced its permanent owned asset sell down commitment. 2 Includes Alila, Andaz, Bunkhouse Hotels, Dream Hotels, Hyatt Centric, JdV by Hyatt, Me and All Hotels, The Standard, The StandardX, The Unbound Collection by Hyatt, and Thompson Hotels. 3 Source: Smith Travel Research Global Census as of December 31, 2024.
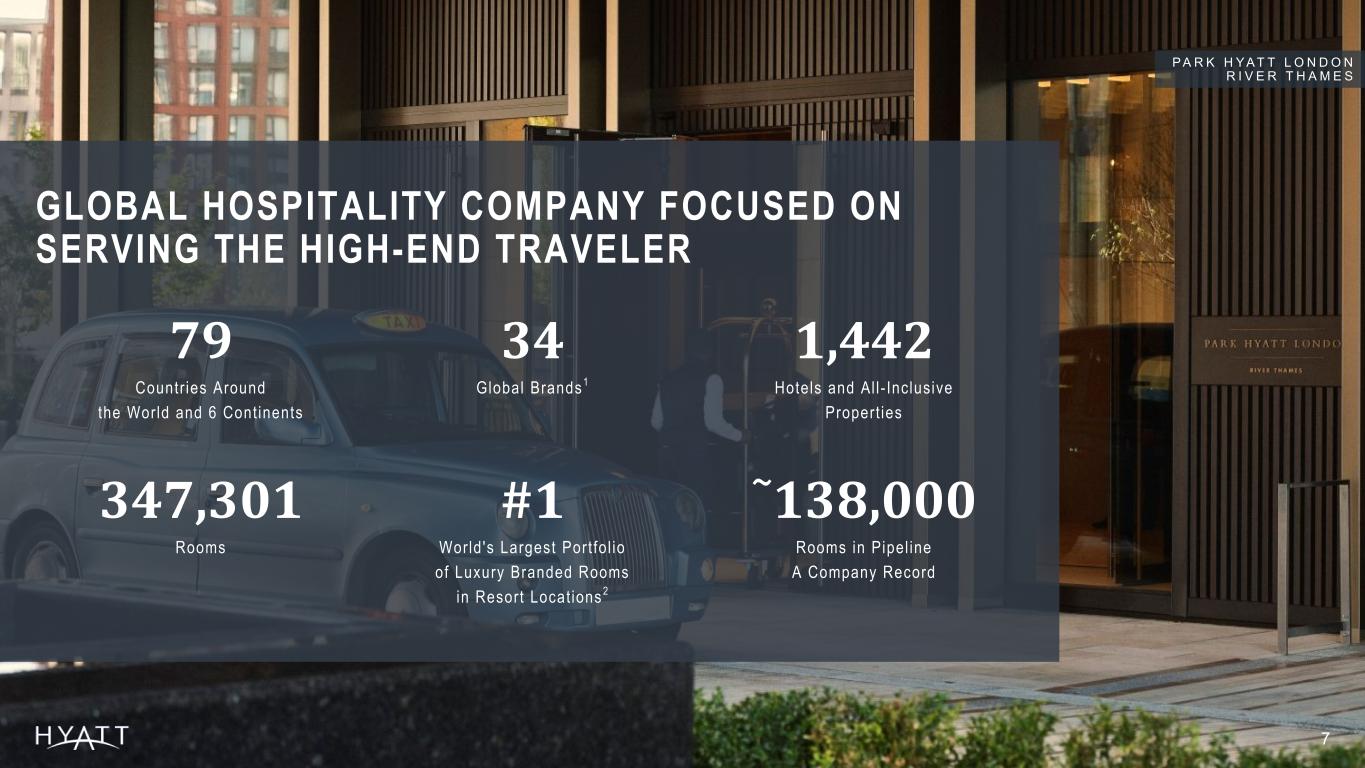
7 GLOBAL HOSPITALITY COMPANY FOCUSED ON SERVING THE HIGH-END TRAVELER 79 Countr ies Around the World and 6 Cont inents 347,301 Rooms 34 Global Brands1 1,442 Hotels and Al l - Inclusive Propert ies #1 World 's Largest Port fo l io of Luxury Branded Rooms in Resort Locat ions 2 ~138,000 Rooms in Pipel ine A Company Record Source Notes: Slide Updated Quarterly Countries, Rooms, Hotel count, and Pipeline linked to ER Body and Consolidations workbook. Manually update Global brands based on Brand Bar and Ranking of Luxury branded rooms in Resort Locations. -Luxury branded rooms in Resort Locations based on STR census as of X, 2024 Colleagues at 12/31/24: 227,000 Footnotes: Figures as of December 31, 2024. 1 Global brands inclusive of December 31, 2024 brand bar, displayed on slide 9 of this deck, and Bahia Principe Hotels & Resorts. 2 Source: Smith Travel Research Global Census as of December 31, 2024. Luxury branded rooms as defined by Smith Travel Research chain scale classification. P A R K H Y A T T L O N D O N R I V E R T H A M E S
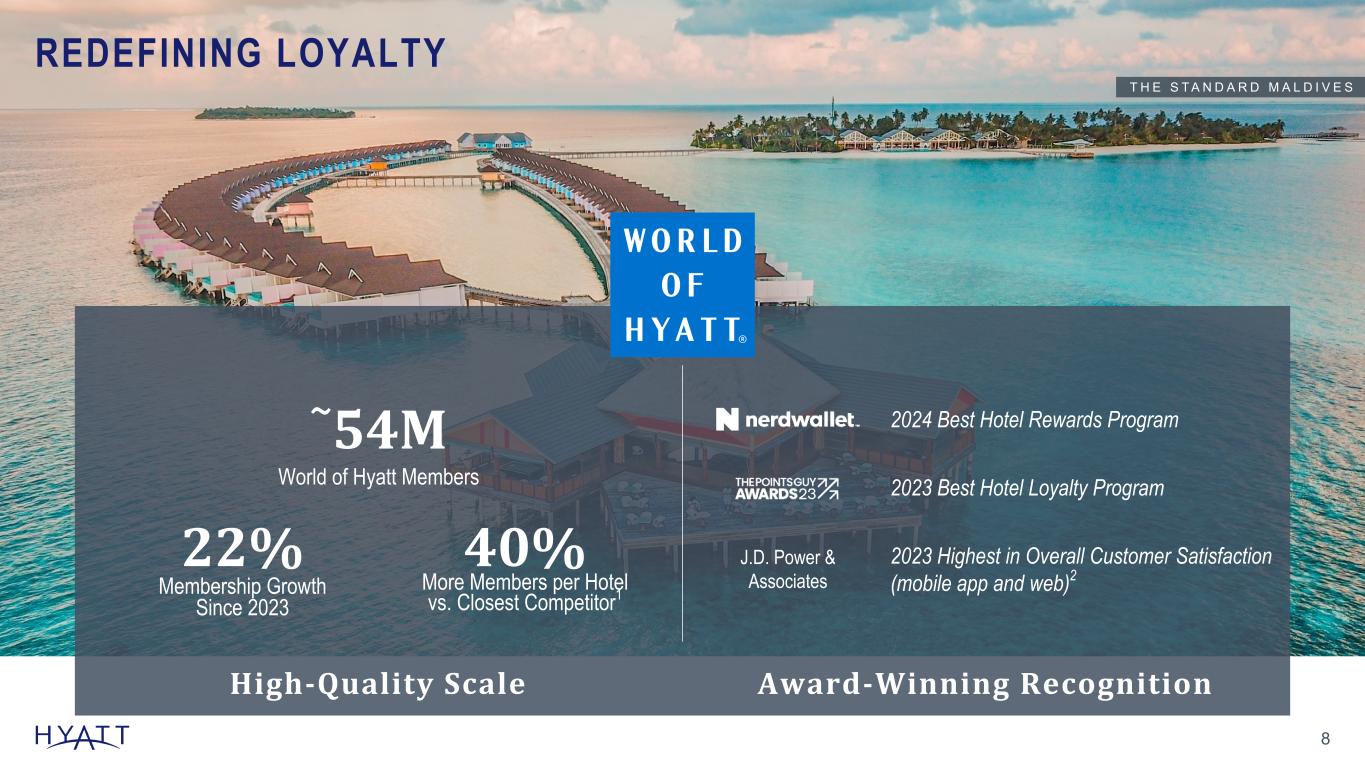
REDEFINING LOYALTY Award-Winning Recognition 8 2023 Best Hotel Loyalty Program 2023 Highest in Overall Customer Satisfaction (mobile app and web)2 2024 Best Hotel Rewards Program~54M World of Hyatt Members Hilton Marriott IHG Accor High-Quality Scale 40% More Members per Hotel vs. Closest Competitor1 22% Membership Growth Since 2023 T H E S T A N D A R D M A L D I V E S Source Notes: Updated semi-annually based on filings for IHG, MAR, and HLT At June 30: – H: ~36K members per hotel – HLT: ~25K members per hotel – MAR: ~23K members per hotel – IHG: ~20K members per hotel At Sept 30: – H: ~37.4K members per hotel (51M members/ 326,845) – HLT: ~26.0K members per hotel – MAR: ~24.4K members per hotel – IHG: ~20.7K members per hotel H 37.4K vs HLT 26.0K = 43.8% World of Hyatt Membership: – YE 2023: 43.8M – YE 2024: 53.5M (YoY Growth 22.1%) J.D. Power & Associates Footnotes: Figures as of December 31, 2024 unless otherwise noted, and growth rates represent year-over-year comparisons from years ended 2023 and 2024. 1 Members per hotel figures calculated based on public filings as of December 31, 2024. 2 2023 J.D. Power 2023 U.S. Travel App and Travel Website Satisfaction.

9 Source Notes: Footnotes: As of December 31, 2024.

D R E A M S M A D E I R A R E S O R T , S P A , & M A R I N A 10 FULL YEAR HIGHLIGHTS
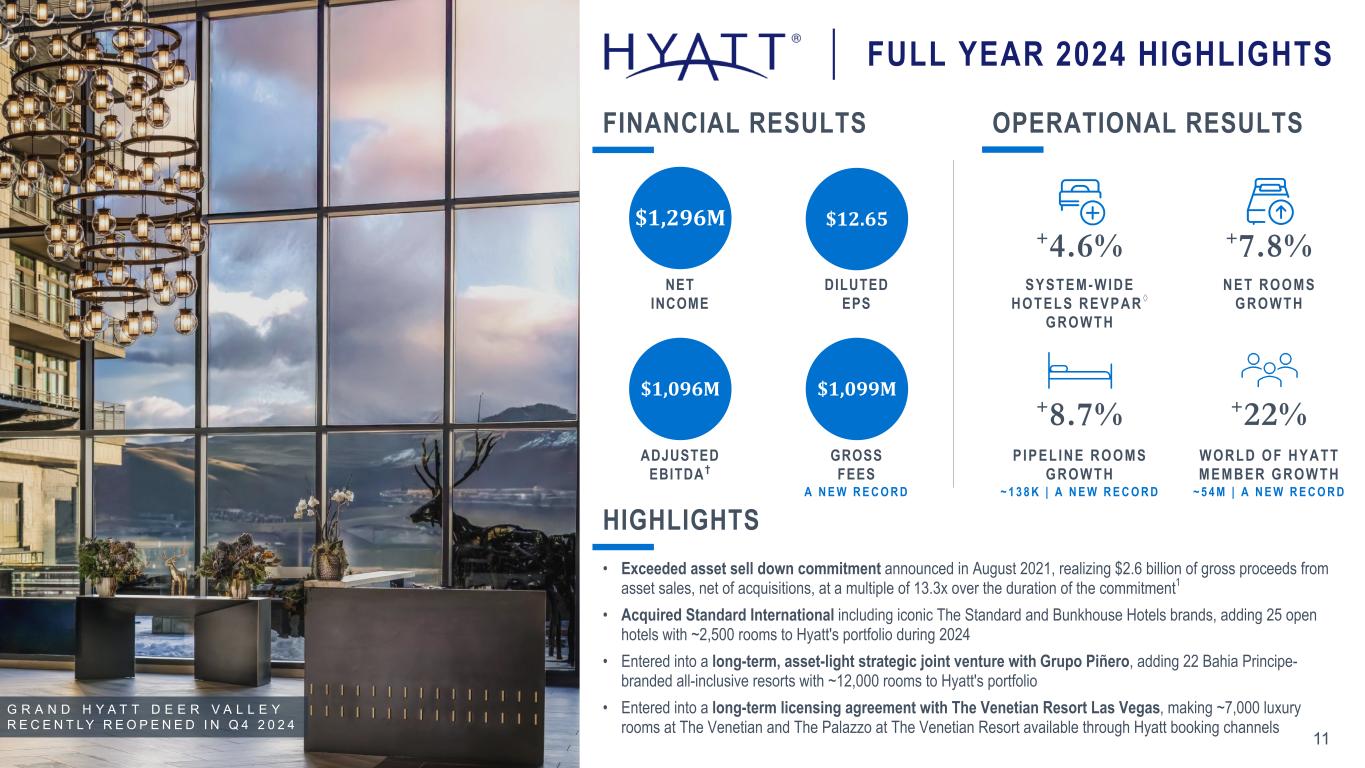
ADJUSTED EBITDA† DILUTED EPS GROSS FEES A N E W R E C O R D $1,296M NET INCOME $12.65 $1,096M $1,099M OPERATIONAL RESULTSFINANCIAL RESULTS +8.7% PIPEL INE ROOMS GROWTH ~ 1 3 8 K | A N E W R E C O R D +7.8% NET ROOMS GROWTH +4.6% SYSTEM-WIDE HOTELS REVPAR ◊ GROWTH +22% WORLD OF HYATT MEMBER GROWTH ~ 5 4 M | A N E W R E C O R D Source Notes: Operational Results: RevPAR and NRG are linked to ER. Pipeline increase should be calculated vs prior year’s ER (rounded pipeline) vs current year rounded pipeline #. World of Hyatt Member growth: Teams\Hyatt Hotels\CHICO-Team- Corporate FPA - Documents\Hotel FP&A\World of Hyatt Enrollments Reported Pipeline: – 2023 YE: 127K – 2024 YE: 138K 11 FULL YEAR 2024 HIGHLIGHTS • Exceeded asset sell down commitment announced in August 2021, realizing $2.6 billion of gross proceeds from asset sales, net of acquisitions, at a multiple of 13.3x over the duration of the commitment1 • Acquired Standard International including iconic The Standard and Bunkhouse Hotels brands, adding 25 open hotels with ~2,500 rooms to Hyatt's portfolio during 2024 • Entered into a long-term, asset-light strategic joint venture with Grupo Piñero, adding 22 Bahia Principe- branded all-inclusive resorts with ~12,000 rooms to Hyatt's portfolio • Entered into a long-term licensing agreement with The Venetian Resort Las Vegas, making ~7,000 luxury rooms at The Venetian and The Palazzo at The Venetian Resort available through Hyatt booking channels HIGHLIGHTS Footnotes: Figures as of December 31, 2024, and growth rates represent year-over-year comparisons from years ended December 31, 2023 and December 31, 2024. 1 Proceeds and multiple reflective from the announcement of the disposition commitment in August 2021 through its completion in August 2024. G R A N D H Y A T T D E E R V A L L E Y R E C E N T L Y R E O P E N E D I N Q 4 2 0 2 4
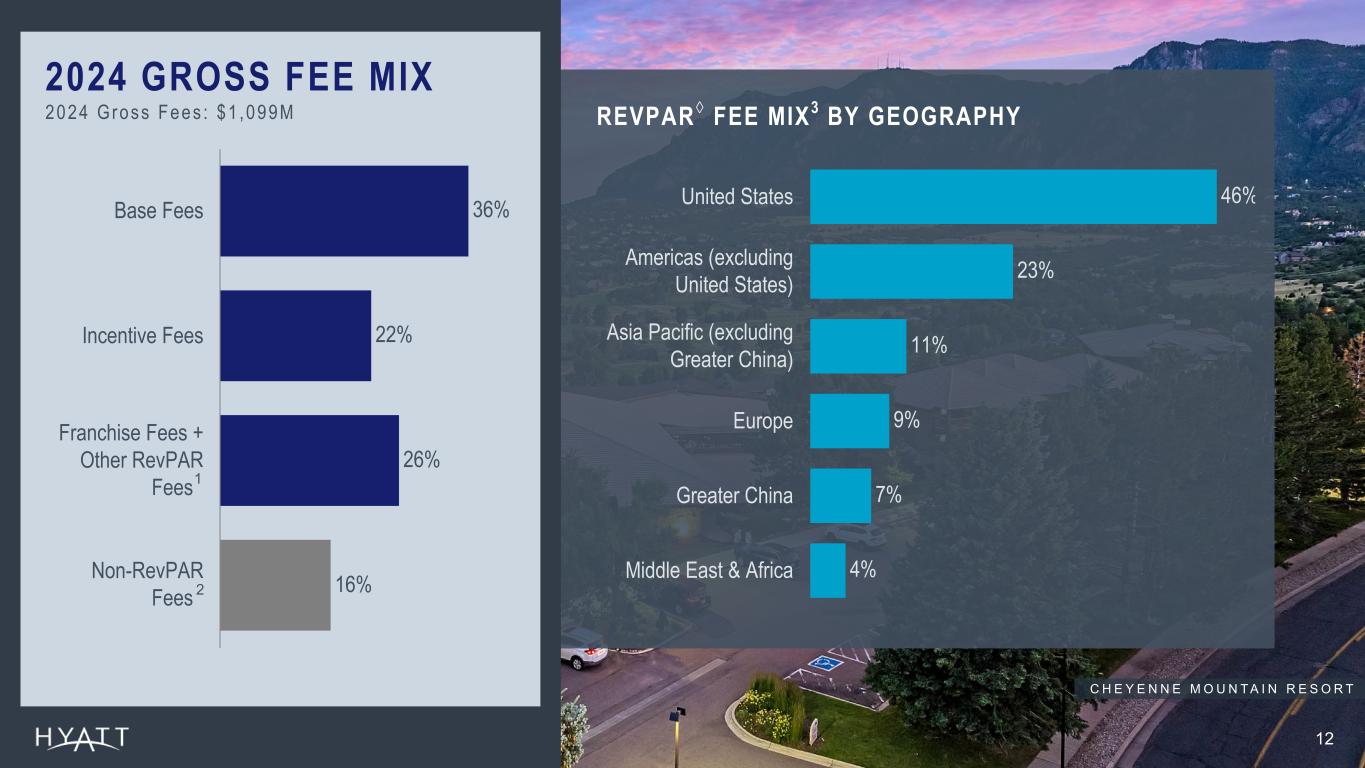
2024 GROSS FEE MIX 2024 Gross Fees : $1 ,099M 12 REVPAR◊ FEE MIX3 BY GEOGRAPHY C H E Y E N N E M O U N T A I N R E S O R T Source Notes: Footnotes: Figures as of December 31, 2024. 1 Other RevPAR fees primarily includes fees from hotel services provided to certain all-inclusive resorts. 2 Non-RevPAR fees includes license fees received in connection with the licensing of the Hyatt brand names through our co-branded credit card programs and vacation units; management and royalty fees related to the management and licensing of certain of our brands to the Unlimited Vacation Club business; termination fees; and all other fees. 3 Fee mix by geography is inclusive of base, incentive, franchise, and other RevPAR fees earned in the respective geographical regions. 46% 23% 11% 9% 7% 4% United States Americas (excluding United States) Asia Pacific (excluding Greater China) Europe Greater China Middle East & Africa 36% 22% 26% 16% Base Fees Incentive Fees Franchise Fees + Other RevPAR Fees . Non-RevPAR Fees .2 1

9% 12% Low Case High Case 13 H Y A T T C E N T R I C C I T Y C E N T R E K U A L A L U M P U R Source Notes: FULL YEAR 2025 OUTLOOK 2025 OUTLOOK GROWTH VS. FULL YEAR 2024 LOW CASE HIGH CASE System-Wide Hote ls RevPAR◊ Growth 2% 4% Net Rooms Growth 6% 7% Net Income $190M $240M Gross Fees $1,200M $1,230M Adjusted EBITDA †2 $1,100M $1,150M Adjusted Free Cash Flow † $450M $500M Footnotes: 1 Reflects a reduction of $80 million to 2024 owned and leased segment Adjusted EBITDA† to account for the impact of sold hotels. Refer to schedule A-9 in the fourth quarter and full year earnings release for additional detail on the impact of sold hotels to owned and leased segment Adjusted EBITDA†. 2 During the year ended December 31, 2024, the Company revised its definition of Adjusted EBITDA† to exclude transaction and integration costs and recast prior-period results to provide comparability. Refer to schedule A-6 of the schedules in the fourth quarter and full year 2024 earnings release for additional detail. Full details of the Company’s 2025 outlook can be found in its fourth quarter and full year 2024 earnings release. The Company’s 2025 outlook is based on a number of assumptions that are subject to change and many of which are outside the control of the Company. If actual results vary from these assumptions, the Company's expectations may change. There can be no assurance that the Company will achieve these results. No disposition or acquisition activity beyond what has been completed as of the date of this presentation has been included in the 2025 Outlook. Gross Fees Growth Adjusted EBITDA† Growth Adjusted for Asset Sales1 8% 13% Low Case High Case
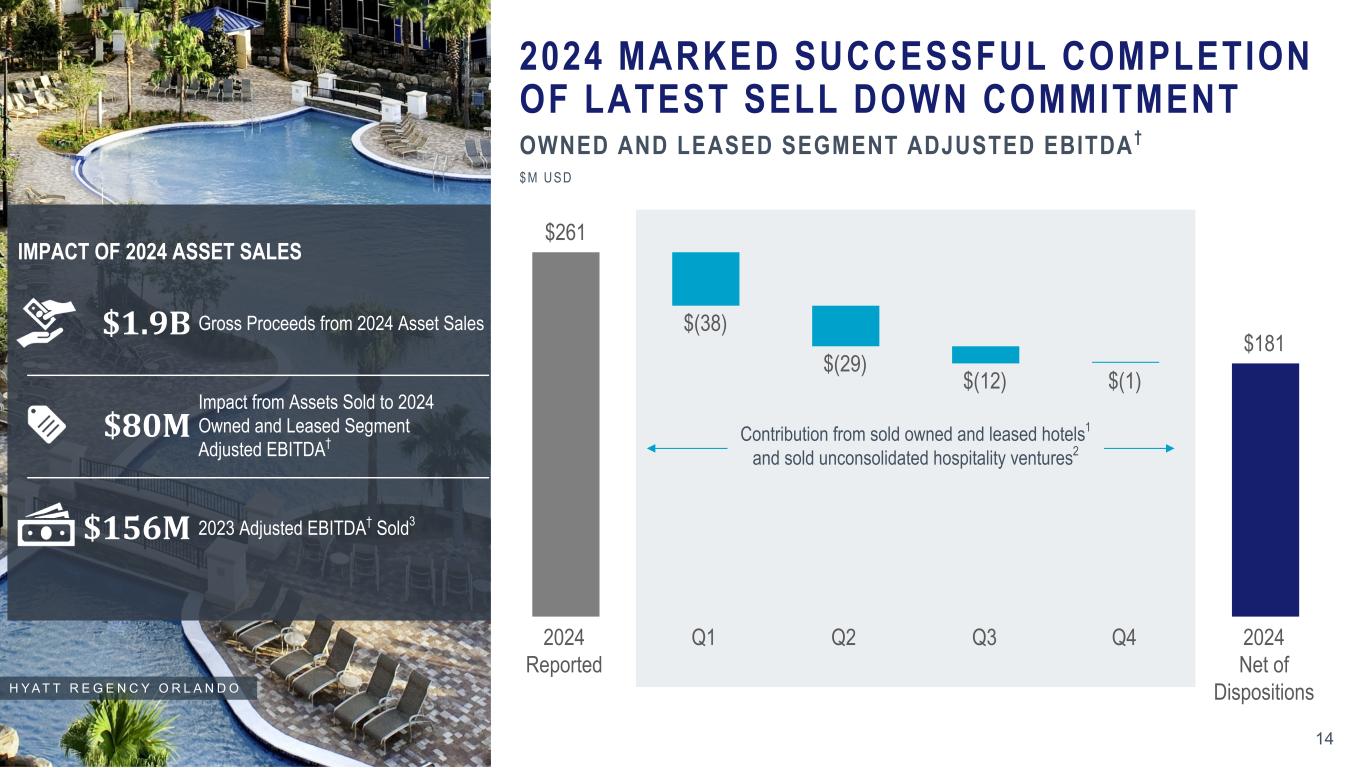
2024 MARKED SUCCESSFUL COMPLETION OF LATEST SELL DOWN COMMITMENT 14 IMPACT OF 2024 ASSET SALES $1.9B Gross Proceeds from 2024 Asset Sales $80M Impact from Assets Sold to 2024 Owned and Leased Segment Adjusted EBITDA† $156M 2023 Adjusted EBITDA† Sold3 Source Notes: Updated quarterly, based on ER schedule Contribution from sold owned and leased hotels1 and sold unconsolidated hospitality ventures2 Footnotes: Additional details relating to the impact of sold hotels on owned and leased segment adjusted EBITDA† can be found on schedule A-9 of the fourth quarter and full year 2024 earnings release. 1 Contribution from sold owned and leased hotels represents the Adjusted EBITDA† contribution in each period for hotels that have been sold as of December 31, 2024 and entered into long-term management or franchise agreements, and excludes fee income retained upon sale. Hotels that have been sold include Hyatt Regency Aruba Resort Spa and Casino (1Q24), Park Hyatt Zurich (2Q24), Hyatt Regency San Antonio Riverwalk (2Q24), Hyatt Regency Green Bay (2Q24), Hyatt Regency Orlando (3Q24), and Hyatt Regency O’Hare Chicago (4Q24). 2 Contribution from sold unconsolidated hospitality ventures represents Hyatt's pro rata share of unconsolidated hospitality ventures' Adjusted EBITDA† contribution in each period for unconsolidated hospitality ventures that have been sold (Park Hyatt Los Cabos at Cabo Del Sol hotel and residences (4Q24) and Hyatt Centric Downtown Nashville (4Q24)) or where our ownership has been diluted for our unconsolidated hospitality venture in India as of December 31, 2024. 3 Represents the 2023 Adjusted EBITDA† contribution from owned and leased hotels sold in 2023 and 2024, whereby the Company entered into long-term management or franchise agreements excluding fee income retained upon sale, and the pro rata share of unconsolidated hospitality ventures' 2023 Adjusted EBITDA† contribution from unconsolidated hospitality ventures sold in 2023 and 2024. H Y A T T R E G E N C Y O R L A N D O OWNED AND LEASED SEGMENT ADJUSTED EBITDA † $M USD 14 $261 $(38) $(29) $(12) $(1) $181 2024 Reported Q1 Q2 Q3 Q4 2024 Net of Dispositions
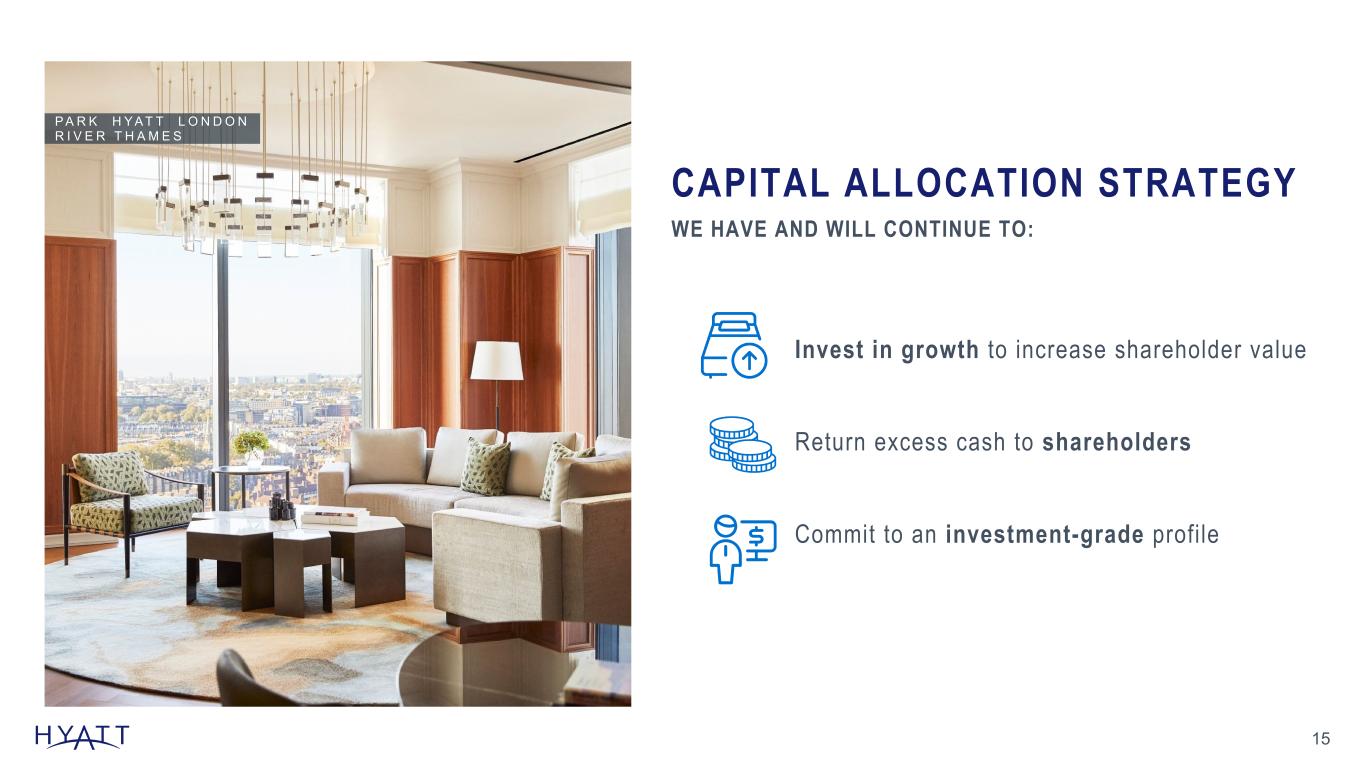
CAPITAL ALLOCATION STRATEGY 15 WE HAVE AND WILL CONTINUE TO: Invest in growth to increase shareholder value Return excess cash to shareholders Commit to an investment-grade profile P A R K H Y A T T L O N D O N R I V E R T H A M E S Footnotes:
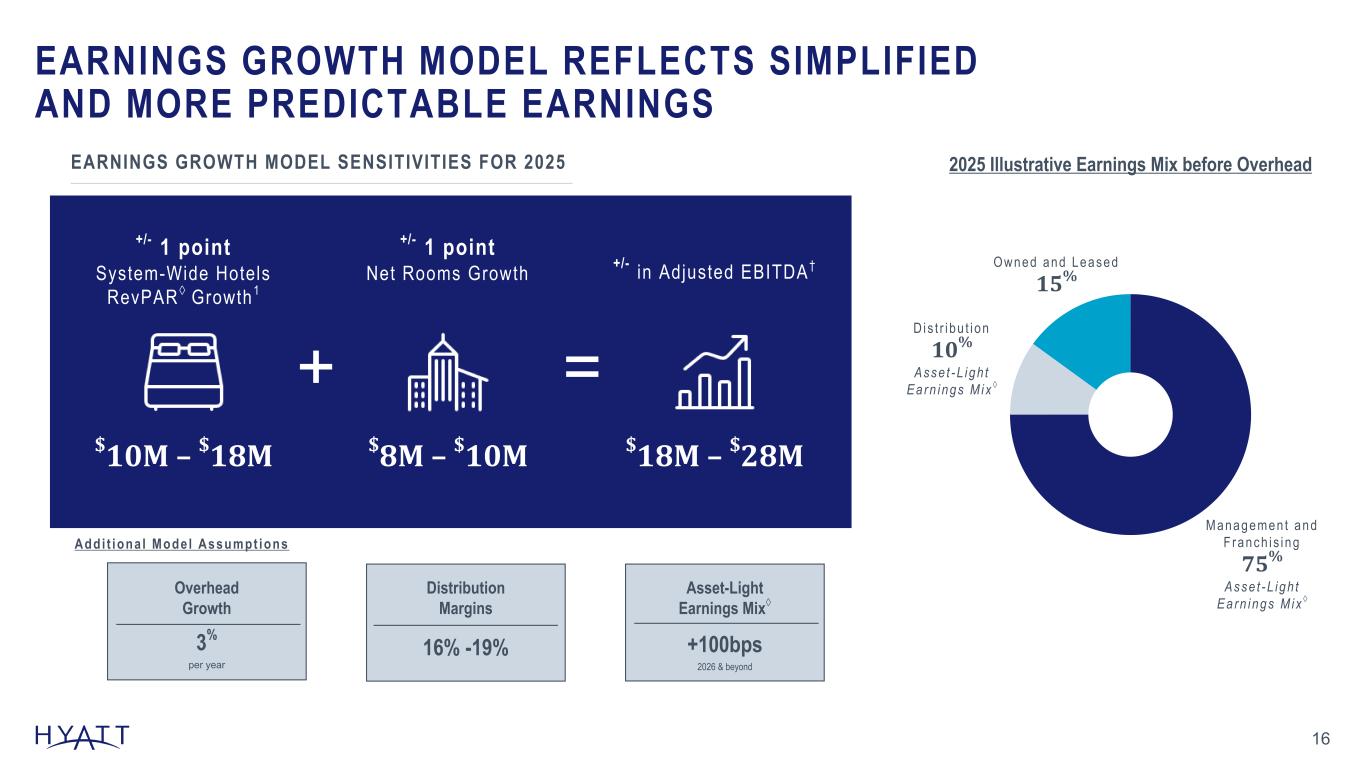
EARNINGS GROWTH MODEL REFLECTS SIMPLIFIED AND MORE PREDICTABLE EARNINGS 16 EARNINGS GROWTH MODEL SENSITIVITIES FOR 2025 +/- 1 point System-Wide Hotels RevPAR◊ Growth1 +/- in Adjusted EBITDA† $18M – $28M + = Addi t iona l Mode l Assumpt ions 2025 Illustrative Earnings Mix before Overhead Asset-Light Earnings Mix◊ +100bps 2026 & beyond Managemen t and F ranch i s i ng 75% Asse t -L igh t Ea rn ings M ix ◊ Dis t r i bu t i on 10% Asse t -L igh t Ea rn ings M ix ◊ Owned and Leased 15% +/- 1 point Net Rooms Growth $10M – $18M $8M – $10M Distribution Margins Overhead Growth 3% per year 16% -19% Source Notes: Footnotes: 1 System-wide hotels RevPAR◊ growth includes comparable hotels. The Company's illustrative long-term outlook for 2025 is based on a number of assumptions that are subject to change and many of which are outside the control of the Company. If actual results vary from these assumptions, the Company's expectations may change. There can be no assurance that the Company will achieve these results.
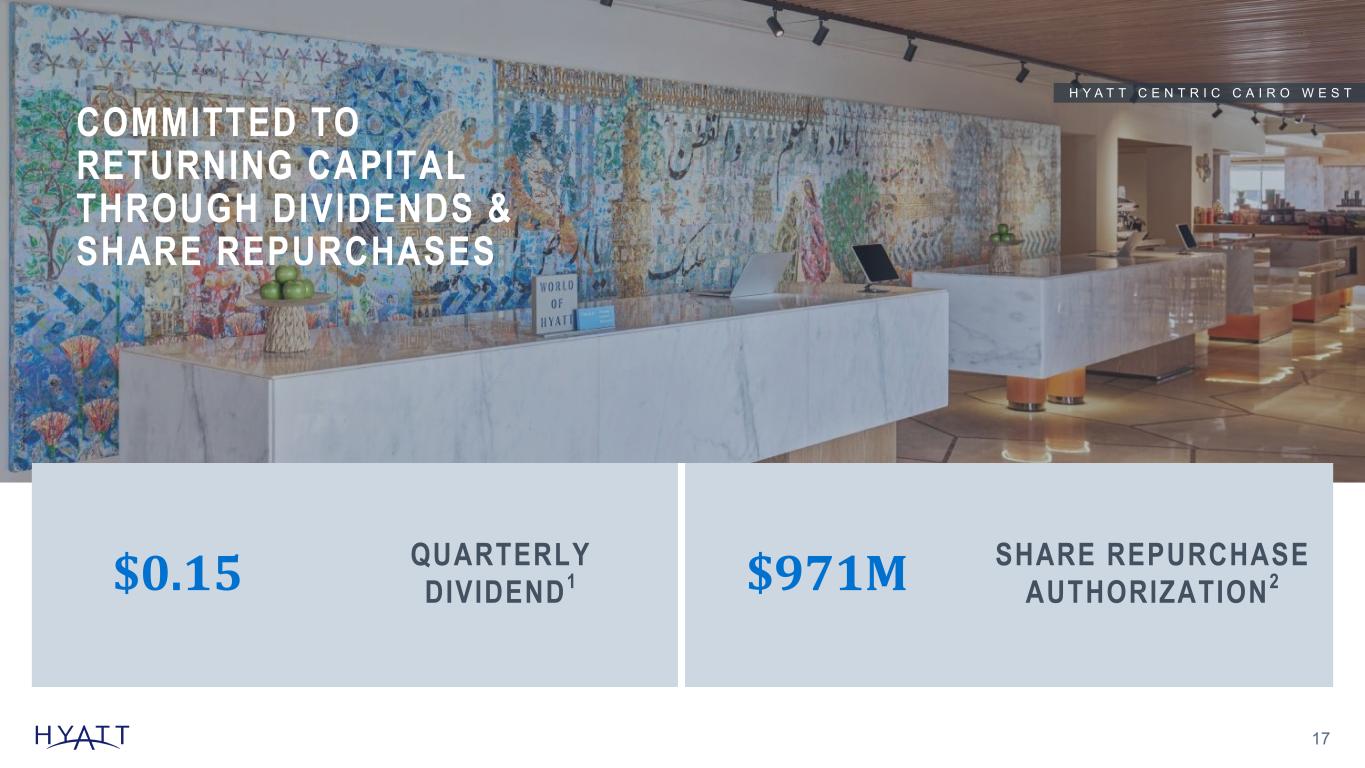
COMMITTED TO RETURNING CAPITAL THROUGH DIVIDENDS & SHARE REPURCHASES 17 H Y A T T C E N T R I C C A I R O W E S T Source Notes: Footnotes: 1 First quarter dividend payable on March 12, 2025 to shareholders of record as of February 28, 2025. 2 Share repurchase authorization as of December 31, 2024. Share repurchases may be made from time to time in the open market, in privately negotiated transactions, or otherwise, including pursuant to a Rule 10b5-1 plan or an accelerated share repurchase transaction, at prices that the Company deems appropriate and subject to market conditions, applicable law and other factors deemed relevant in the Company’s sole discretion. The common stock repurchase program applies to the Company’s Class A Common Stock and/or the Company’s Class B Common Stock. The common stock repurchase program does not obligate the Company to repurchase any dollar amount or number of shares of common stock and the program may be suspended or discontinued at any time. The Company’s 2025 outlook is based on a number of assumptions that are subject to change and many of which are outside the control of the Company. If actual results vary from these assumptions, the Company's expectations may change. There can be no assurance that the Company will achieve these results. No disposition or acquisition activity beyond what has been completed as of the date of this presentation has been included in the 2025 Outlook. $0.15 QUARTERLY DIVIDEND1 $971M SHARE REPURCHASE AUTHORIZATION2
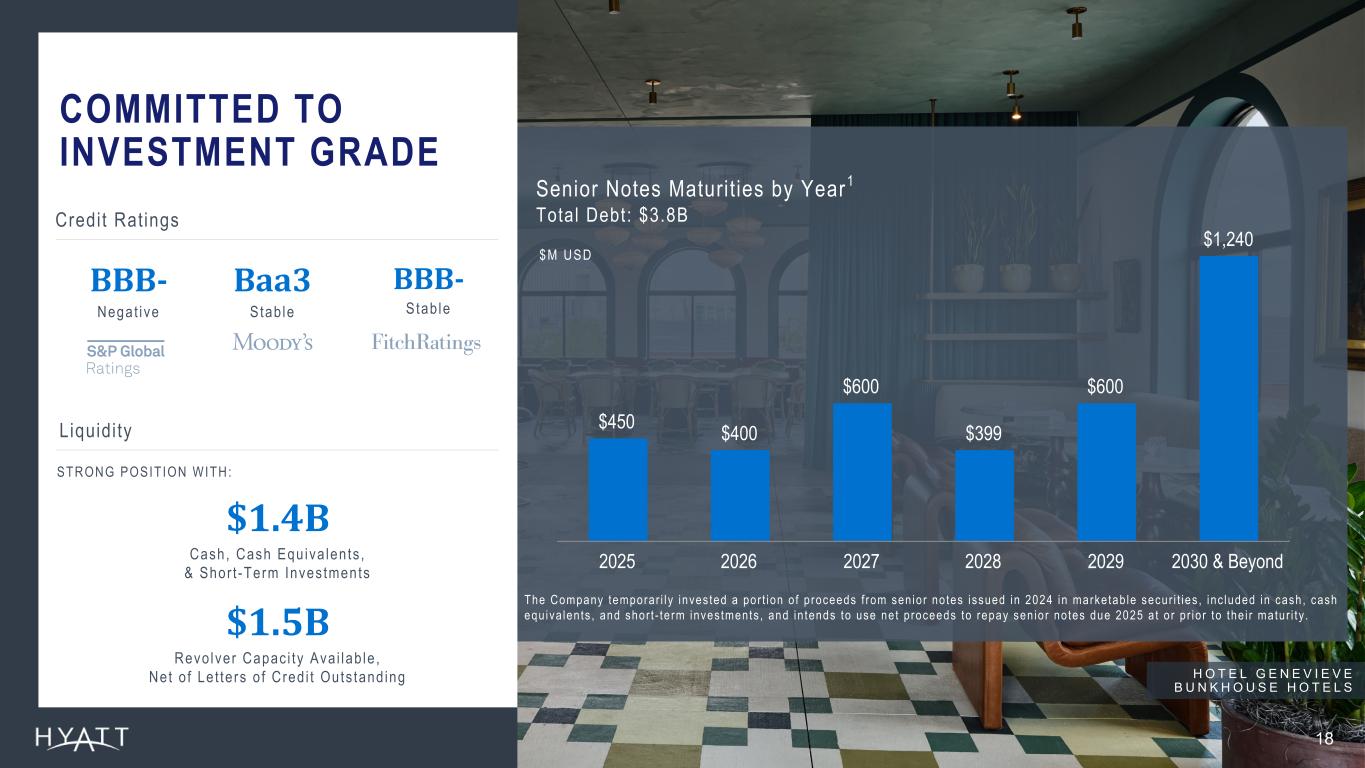
COMMITTED TO INVESTMENT GRADE 18 Credit Ratings BBB- Negat ive BBB- Stab le Baa3 Stab le Liquidi ty $1.4B Cash, Cash Equ iva len ts , & Shor t -Term Inves tments $1.5B Revo lver Capac i ty Ava i lab le , Net o f Le t te rs o f Cred i t Outs tand ing STRONG POSIT ION WITH: H O T E L G E N E V I E V E B U N K H O U S E H O T E L S $450 $400 $600 $399 $600 $1,240 2025 2026 2027 2028 2029 2030 & Beyond Source Notes: Footnotes: Total Debt and Liquidity figures as of December 31, 2024. 1 Chart excludes $52 million of variable rate mortgage loan, $45 million of variable rate term loan, $19 million of floating average rate loan, $4 million of finance lease obligations, $27 million of unamortized discounts and deferred financing fees as well as our revolving credit facility, which matures in 2027. At December 31, 2024, the Company had $1,497 million of borrowing capacity available under our revolving credit facility, net of letters of credit outstanding. Senior Notes Maturit ies by Year1 Total Debt: $3.8B $M USD The Company temporar i l y inves ted a por t ion o f p roceeds f rom sen io r no tes i ssued in 2024 in marke tab le secur i t ies , inc luded in cash , cash equ iva len ts , and shor t - te rm inves tments , and in tends to use ne t p roceeds to repay sen io r no tes due 2025 a t o r p r io r to the i r matur i t y .
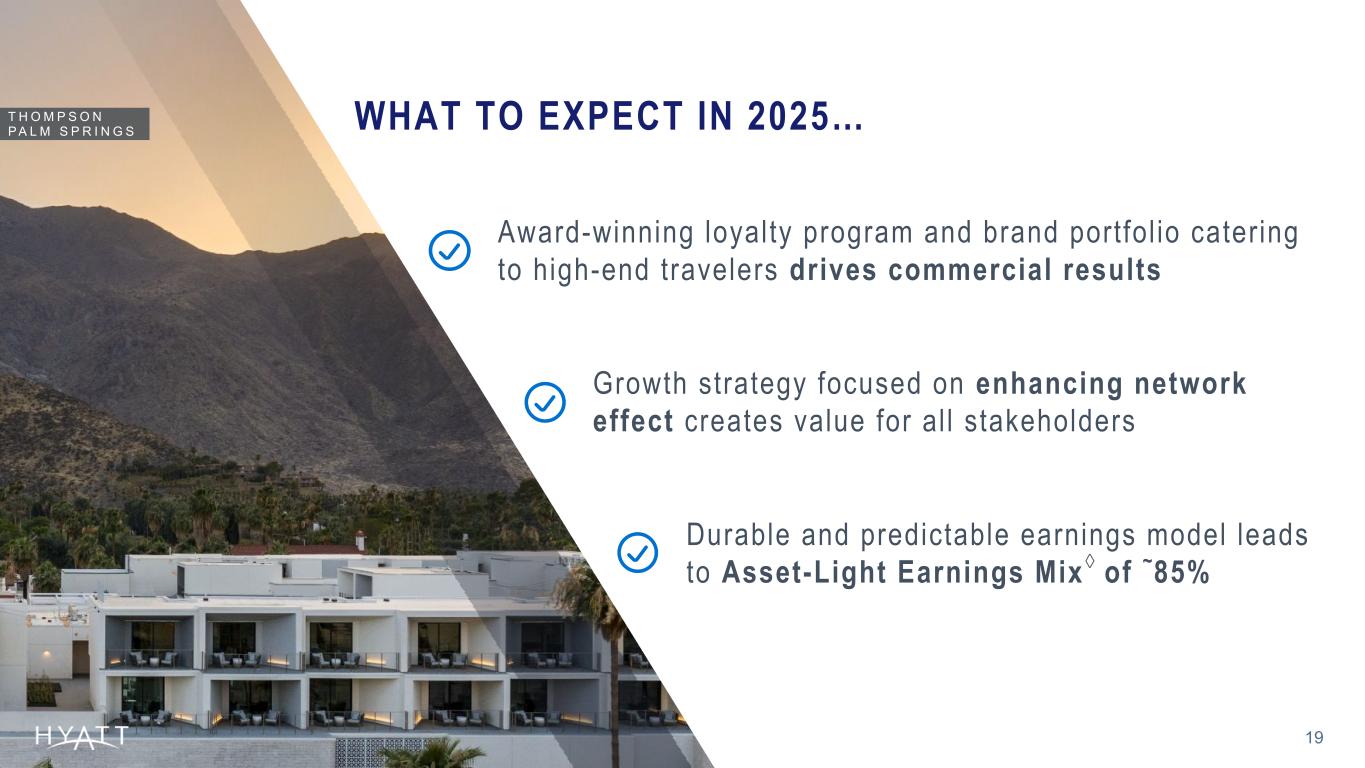
WHAT TO EXPECT IN 2025…T H O M P S O N P A L M S P R I N G S Growth strategy focused on enhancing network effect creates value for al l stakeholders Durable and predictable earnings model leads to Asset-Light Earnings Mix◊ of ~85% Award-winning loyalty program and brand portfol io catering to high-end travelers drives commercial results 19 Footnotes: The Company’s outlook is based on a number of assumptions that are subject to change and many of which are outside the control of the Company. If actual results vary from these assumptions, the Company's expectations may change. There can be no assurance that the Company will achieve these results.

20 APPENDIX
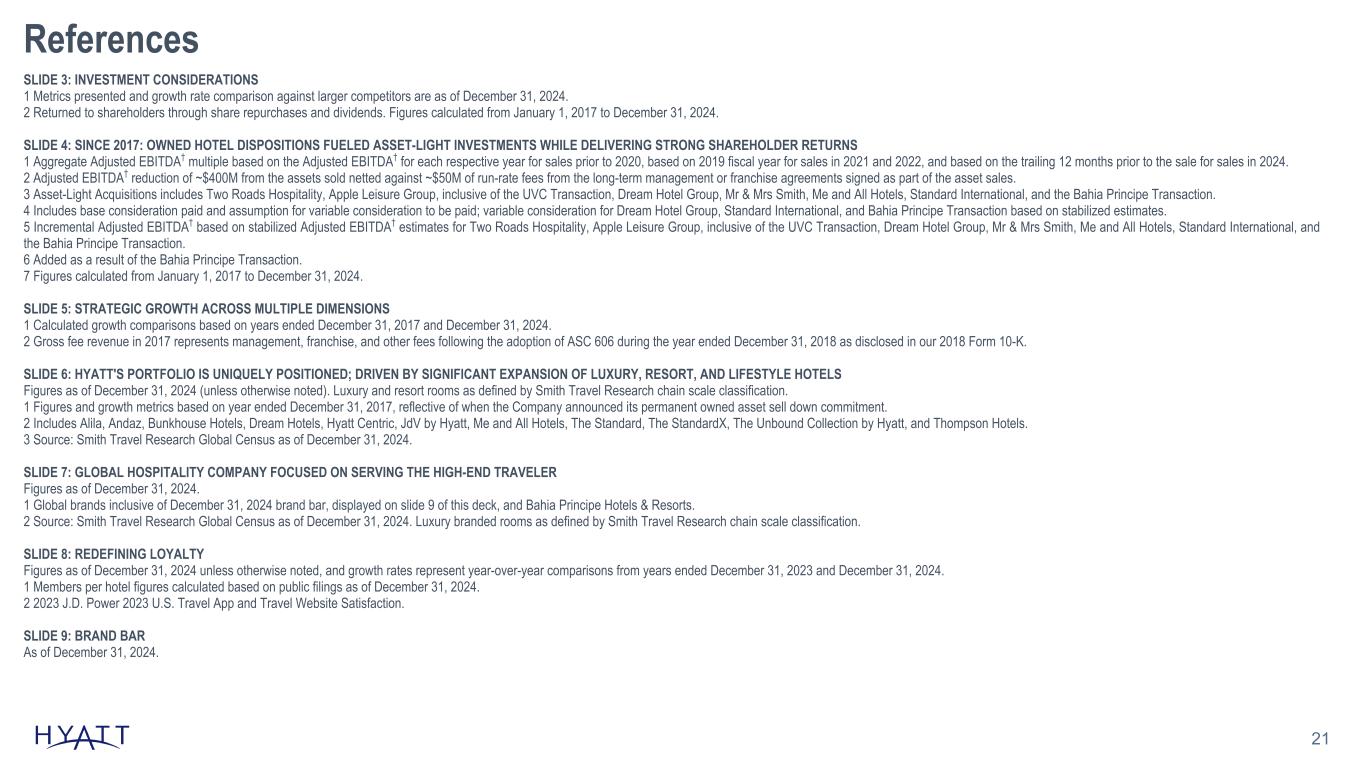
21 References SLIDE 3: INVESTMENT CONSIDERATIONS 1 Metrics presented and growth rate comparison against larger competitors are as of December 31, 2024. 2 Returned to shareholders through share repurchases and dividends. Figures calculated from January 1, 2017 to December 31, 2024. SLIDE 4: SINCE 2017: OWNED HOTEL DISPOSITIONS FUELED ASSET-LIGHT INVESTMENTS WHILE DELIVERING STRONG SHAREHOLDER RETURNS 1 Aggregate Adjusted EBITDA† multiple based on the Adjusted EBITDA† for each respective year for sales prior to 2020, based on 2019 fiscal year for sales in 2021 and 2022, and based on the trailing 12 months prior to the sale for sales in 2024. 2 Adjusted EBITDA† reduction of ~$400M from the assets sold netted against ~$50M of run-rate fees from the long-term management or franchise agreements signed as part of the asset sales. 3 Asset-Light Acquisitions includes Two Roads Hospitality, Apple Leisure Group, inclusive of the UVC Transaction, Dream Hotel Group, Mr & Mrs Smith, Me and All Hotels, Standard International, and the Bahia Principe Transaction. 4 Includes base consideration paid and assumption for variable consideration to be paid; variable consideration for Dream Hotel Group, Standard International, and Bahia Principe Transaction based on stabilized estimates. 5 Incremental Adjusted EBITDA† based on stabilized Adjusted EBITDA† estimates for Two Roads Hospitality, Apple Leisure Group, inclusive of the UVC Transaction, Dream Hotel Group, Mr & Mrs Smith, Me and All Hotels, Standard International, and the Bahia Principe Transaction. 6 Added as a result of the Bahia Principe Transaction. 7 Figures calculated from January 1, 2017 to December 31, 2024. SLIDE 5: STRATEGIC GROWTH ACROSS MULTIPLE DIMENSIONS 1 Calculated growth comparisons based on years ended December 31, 2017 and December 31, 2024. 2 Gross fee revenue in 2017 represents management, franchise, and other fees following the adoption of ASC 606 during the year ended December 31, 2018 as disclosed in our 2018 Form 10-K. SLIDE 6: HYATT'S PORTFOLIO IS UNIQUELY POSITIONED; DRIVEN BY SIGNIFICANT EXPANSION OF LUXURY, RESORT, AND LIFESTYLE HOTELS Figures as of December 31, 2024 (unless otherwise noted). Luxury and resort rooms as defined by Smith Travel Research chain scale classification. 1 Figures and growth metrics based on year ended December 31, 2017, reflective of when the Company announced its permanent owned asset sell down commitment. 2 Includes Alila, Andaz, Bunkhouse Hotels, Dream Hotels, Hyatt Centric, JdV by Hyatt, Me and All Hotels, The Standard, The StandardX, The Unbound Collection by Hyatt, and Thompson Hotels. 3 Source: Smith Travel Research Global Census as of December 31, 2024. SLIDE 7: GLOBAL HOSPITALITY COMPANY FOCUSED ON SERVING THE HIGH-END TRAVELER Figures as of December 31, 2024. 1 Global brands inclusive of December 31, 2024 brand bar, displayed on slide 9 of this deck, and Bahia Principe Hotels & Resorts. 2 Source: Smith Travel Research Global Census as of December 31, 2024. Luxury branded rooms as defined by Smith Travel Research chain scale classification. SLIDE 8: REDEFINING LOYALTY Figures as of December 31, 2024 unless otherwise noted, and growth rates represent year-over-year comparisons from years ended December 31, 2023 and December 31, 2024. 1 Members per hotel figures calculated based on public filings as of December 31, 2024. 2 2023 J.D. Power 2023 U.S. Travel App and Travel Website Satisfaction. SLIDE 9: BRAND BAR As of December 31, 2024.
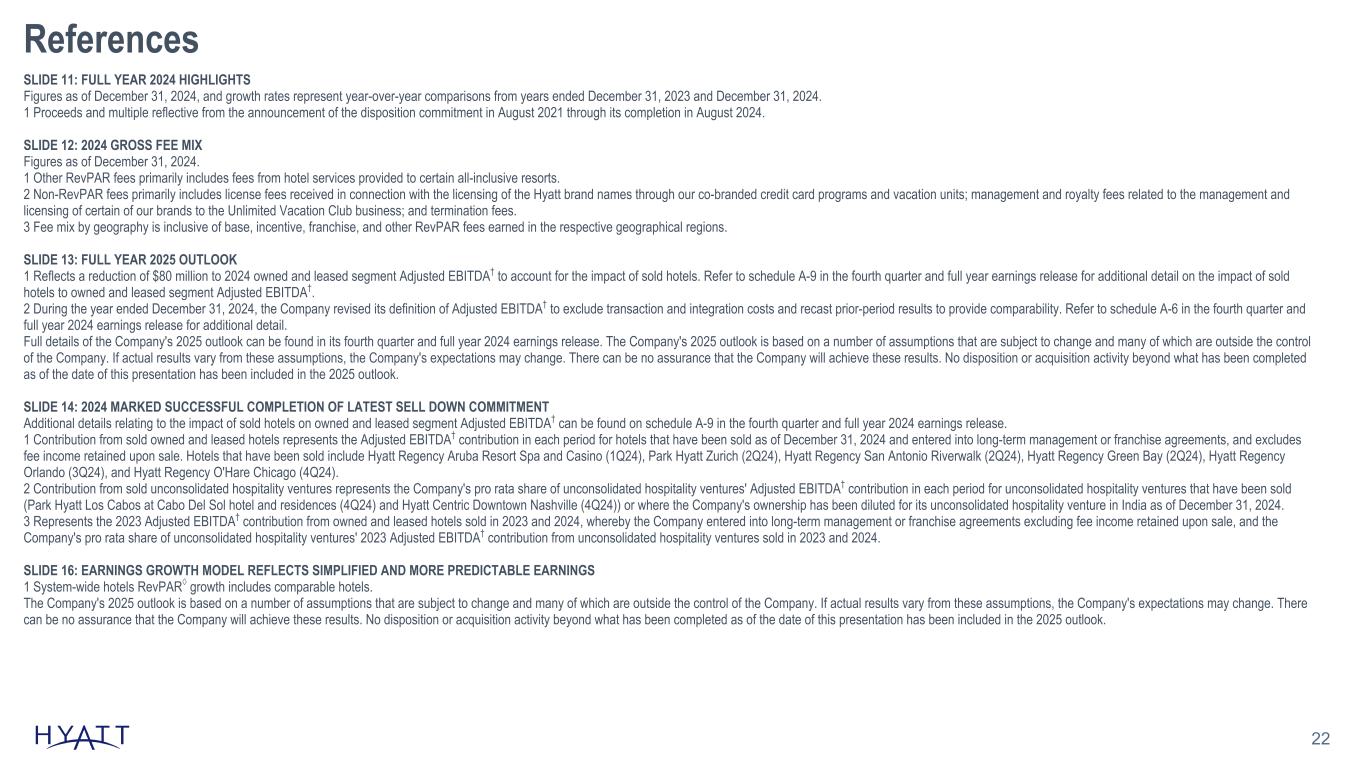
22 References SLIDE 11: FULL YEAR 2024 HIGHLIGHTS Figures as of December 31, 2024, and growth rates represent year-over-year comparisons from years ended December 31, 2023 and December 31, 2024. 1 Proceeds and multiple reflective from the announcement of the disposition commitment in August 2021 through its completion in August 2024. SLIDE 12: 2024 GROSS FEE MIX Figures as of December 31, 2024. 1 Other RevPAR fees primarily includes fees from hotel services provided to certain all-inclusive resorts. 2 Non-RevPAR fees primarily includes license fees received in connection with the licensing of the Hyatt brand names through our co-branded credit card programs and vacation units; management and royalty fees related to the management and licensing of certain of our brands to the Unlimited Vacation Club business; and termination fees. 3 Fee mix by geography is inclusive of base, incentive, franchise, and other RevPAR fees earned in the respective geographical regions. SLIDE 13: FULL YEAR 2025 OUTLOOK 1 Reflects a reduction of $80 million to 2024 owned and leased segment Adjusted EBITDA† to account for the impact of sold hotels. Refer to schedule A-9 in the fourth quarter and full year earnings release for additional detail on the impact of sold hotels to owned and leased segment Adjusted EBITDA†. 2 During the year ended December 31, 2024, the Company revised its definition of Adjusted EBITDA† to exclude transaction and integration costs and recast prior-period results to provide comparability. Refer to schedule A-6 in the fourth quarter and full year 2024 earnings release for additional detail. Full details of the Company's 2025 outlook can be found in its fourth quarter and full year 2024 earnings release. The Company's 2025 outlook is based on a number of assumptions that are subject to change and many of which are outside the control of the Company. If actual results vary from these assumptions, the Company's expectations may change. There can be no assurance that the Company will achieve these results. No disposition or acquisition activity beyond what has been completed as of the date of this presentation has been included in the 2025 outlook. SLIDE 14: 2024 MARKED SUCCESSFUL COMPLETION OF LATEST SELL DOWN COMMITMENT Additional details relating to the impact of sold hotels on owned and leased segment Adjusted EBITDA† can be found on schedule A-9 in the fourth quarter and full year 2024 earnings release. 1 Contribution from sold owned and leased hotels represents the Adjusted EBITDA† contribution in each period for hotels that have been sold as of December 31, 2024 and entered into long-term management or franchise agreements, and excludes fee income retained upon sale. Hotels that have been sold include Hyatt Regency Aruba Resort Spa and Casino (1Q24), Park Hyatt Zurich (2Q24), Hyatt Regency San Antonio Riverwalk (2Q24), Hyatt Regency Green Bay (2Q24), Hyatt Regency Orlando (3Q24), and Hyatt Regency O'Hare Chicago (4Q24). 2 Contribution from sold unconsolidated hospitality ventures represents the Company's pro rata share of unconsolidated hospitality ventures' Adjusted EBITDA† contribution in each period for unconsolidated hospitality ventures that have been sold (Park Hyatt Los Cabos at Cabo Del Sol hotel and residences (4Q24) and Hyatt Centric Downtown Nashville (4Q24)) or where the Company's ownership has been diluted for its unconsolidated hospitality venture in India as of December 31, 2024. 3 Represents the 2023 Adjusted EBITDA† contribution from owned and leased hotels sold in 2023 and 2024, whereby the Company entered into long-term management or franchise agreements excluding fee income retained upon sale, and the Company's pro rata share of unconsolidated hospitality ventures' 2023 Adjusted EBITDA† contribution from unconsolidated hospitality ventures sold in 2023 and 2024. SLIDE 16: EARNINGS GROWTH MODEL REFLECTS SIMPLIFIED AND MORE PREDICTABLE EARNINGS 1 System-wide hotels RevPAR◊ growth includes comparable hotels. The Company's 2025 outlook is based on a number of assumptions that are subject to change and many of which are outside the control of the Company. If actual results vary from these assumptions, the Company's expectations may change. There can be no assurance that the Company will achieve these results. No disposition or acquisition activity beyond what has been completed as of the date of this presentation has been included in the 2025 outlook.
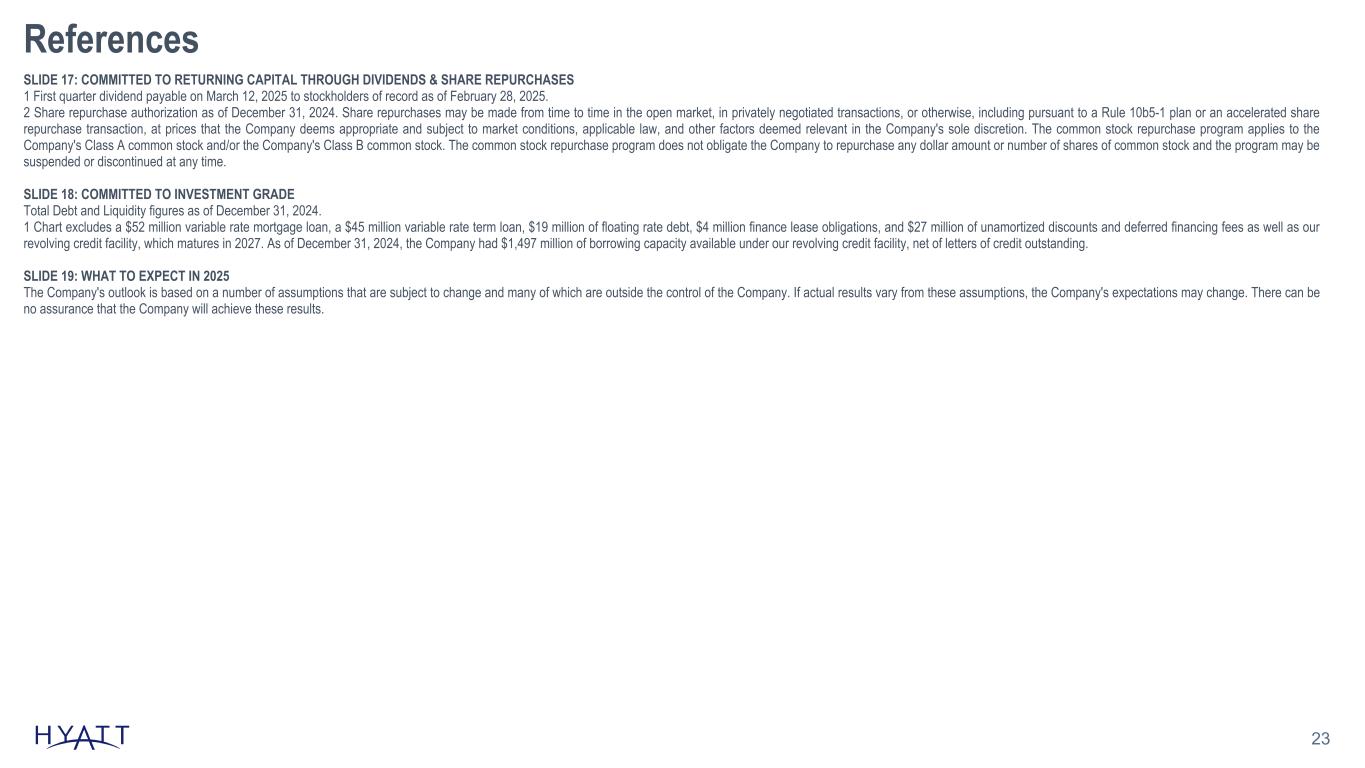
23 References SLIDE 17: COMMITTED TO RETURNING CAPITAL THROUGH DIVIDENDS & SHARE REPURCHASES 1 First quarter dividend payable on March 12, 2025 to stockholders of record as of February 28, 2025. 2 Share repurchase authorization as of December 31, 2024. Share repurchases may be made from time to time in the open market, in privately negotiated transactions, or otherwise, including pursuant to a Rule 10b5-1 plan or an accelerated share repurchase transaction, at prices that the Company deems appropriate and subject to market conditions, applicable law, and other factors deemed relevant in the Company's sole discretion. The common stock repurchase program applies to the Company's Class A common stock and/or the Company's Class B common stock. The common stock repurchase program does not obligate the Company to repurchase any dollar amount or number of shares of common stock and the program may be suspended or discontinued at any time. SLIDE 18: COMMITTED TO INVESTMENT GRADE Total Debt and Liquidity figures as of December 31, 2024. 1 Chart excludes a $52 million variable rate mortgage loan, a $45 million variable rate term loan, $19 million of floating rate debt, $4 million finance lease obligations, and $27 million of unamortized discounts and deferred financing fees as well as our revolving credit facility, which matures in 2027. As of December 31, 2024, the Company had $1,497 million of borrowing capacity available under our revolving credit facility, net of letters of credit outstanding. SLIDE 19: WHAT TO EXPECT IN 2025 The Company's outlook is based on a number of assumptions that are subject to change and many of which are outside the control of the Company. If actual results vary from these assumptions, the Company's expectations may change. There can be no assurance that the Company will achieve these results.
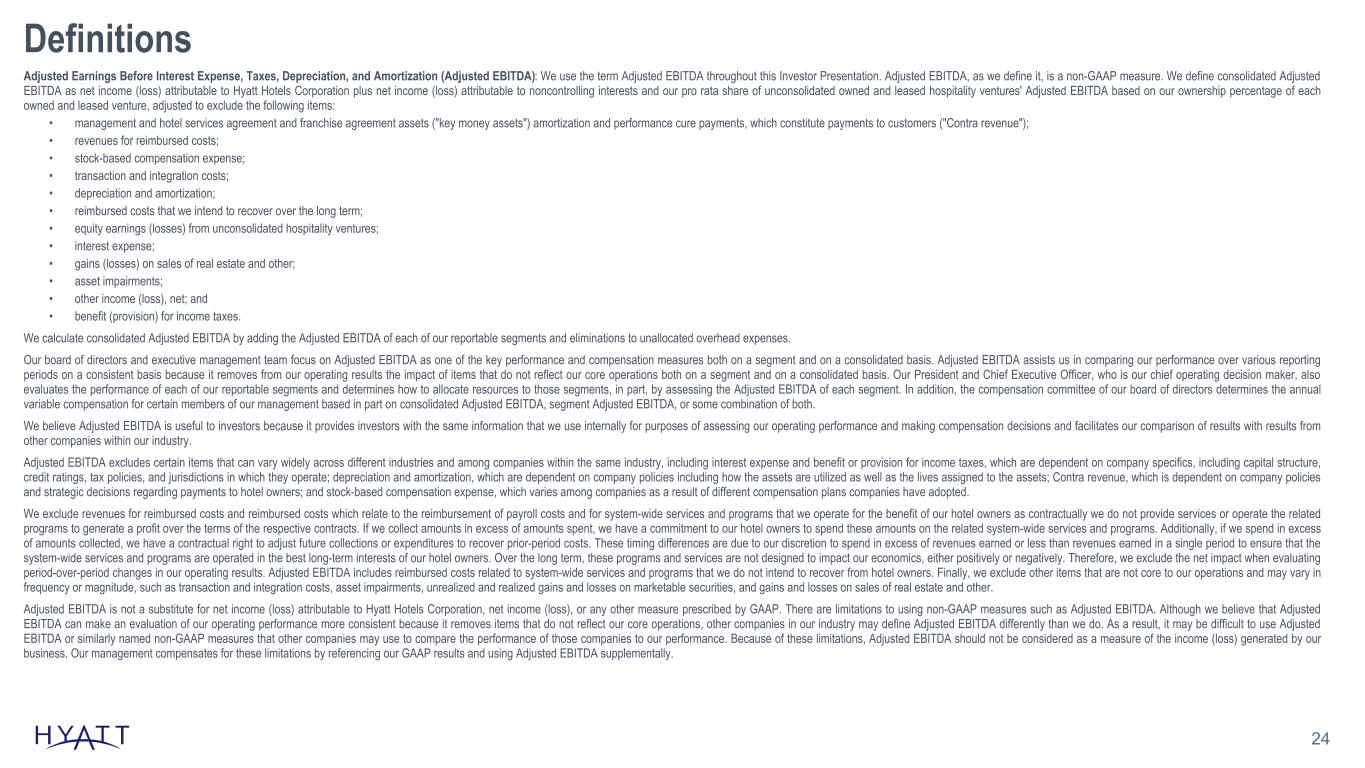
24 Definitions Adjusted Earnings Before Interest Expense, Taxes, Depreciation, and Amortization (Adjusted EBITDA): We use the term Adjusted EBITDA throughout this Investor Presentation. Adjusted EBITDA, as we define it, is a non-GAAP measure. We define consolidated Adjusted EBITDA as net income (loss) attributable to Hyatt Hotels Corporation plus net income (loss) attributable to noncontrolling interests and our pro rata share of unconsolidated owned and leased hospitality ventures' Adjusted EBITDA based on our ownership percentage of each owned and leased venture, adjusted to exclude the following items: • management and hotel services agreement and franchise agreement assets ("key money assets") amortization and performance cure payments, which constitute payments to customers ("Contra revenue"); • revenues for reimbursed costs; • stock-based compensation expense; • transaction and integration costs; • depreciation and amortization; • reimbursed costs that we intend to recover over the long term; • equity earnings (losses) from unconsolidated hospitality ventures; • interest expense; • gains (losses) on sales of real estate and other; • asset impairments; • other income (loss), net; and • benefit (provision) for income taxes. We calculate consolidated Adjusted EBITDA by adding the Adjusted EBITDA of each of our reportable segments and eliminations to unallocated overhead expenses. Our board of directors and executive management team focus on Adjusted EBITDA as one of the key performance and compensation measures both on a segment and on a consolidated basis. Adjusted EBITDA assists us in comparing our performance over various reporting periods on a consistent basis because it removes from our operating results the impact of items that do not reflect our core operations both on a segment and on a consolidated basis. Our President and Chief Executive Officer, who is our chief operating decision maker, also evaluates the performance of each of our reportable segments and determines how to allocate resources to those segments, in part, by assessing the Adjusted EBITDA of each segment. In addition, the compensation committee of our board of directors determines the annual variable compensation for certain members of our management based in part on consolidated Adjusted EBITDA, segment Adjusted EBITDA, or some combination of both. We believe Adjusted EBITDA is useful to investors because it provides investors with the same information that we use internally for purposes of assessing our operating performance and making compensation decisions and facilitates our comparison of results with results from other companies within our industry. Adjusted EBITDA excludes certain items that can vary widely across different industries and among companies within the same industry, including interest expense and benefit or provision for income taxes, which are dependent on company specifics, including capital structure, credit ratings, tax policies, and jurisdictions in which they operate; depreciation and amortization, which are dependent on company policies including how the assets are utilized as well as the lives assigned to the assets; Contra revenue, which is dependent on company policies and strategic decisions regarding payments to hotel owners; and stock-based compensation expense, which varies among companies as a result of different compensation plans companies have adopted. We exclude revenues for reimbursed costs and reimbursed costs which relate to the reimbursement of payroll costs and for system-wide services and programs that we operate for the benefit of our hotel owners as contractually we do not provide services or operate the related programs to generate a profit over the terms of the respective contracts. If we collect amounts in excess of amounts spent, we have a commitment to our hotel owners to spend these amounts on the related system-wide services and programs. Additionally, if we spend in excess of amounts collected, we have a contractual right to adjust future collections or expenditures to recover prior-period costs. These timing differences are due to our discretion to spend in excess of revenues earned or less than revenues earned in a single period to ensure that the system-wide services and programs are operated in the best long-term interests of our hotel owners. Over the long term, these programs and services are not designed to impact our economics, either positively or negatively. Therefore, we exclude the net impact when evaluating period-over-period changes in our operating results. Adjusted EBITDA includes reimbursed costs related to system-wide services and programs that we do not intend to recover from hotel owners. Finally, we exclude other items that are not core to our operations and may vary in frequency or magnitude, such as transaction and integration costs, asset impairments, unrealized and realized gains and losses on marketable securities, and gains and losses on sales of real estate and other. Adjusted EBITDA is not a substitute for net income (loss) attributable to Hyatt Hotels Corporation, net income (loss), or any other measure prescribed by GAAP. There are limitations to using non-GAAP measures such as Adjusted EBITDA. Although we believe that Adjusted EBITDA can make an evaluation of our operating performance more consistent because it removes items that do not reflect our core operations, other companies in our industry may define Adjusted EBITDA differently than we do. As a result, it may be difficult to use Adjusted EBITDA or similarly named non-GAAP measures that other companies may use to compare the performance of those companies to our performance. Because of these limitations, Adjusted EBITDA should not be considered as a measure of the income (loss) generated by our business. Our management compensates for these limitations by referencing our GAAP results and using Adjusted EBITDA supplementally.
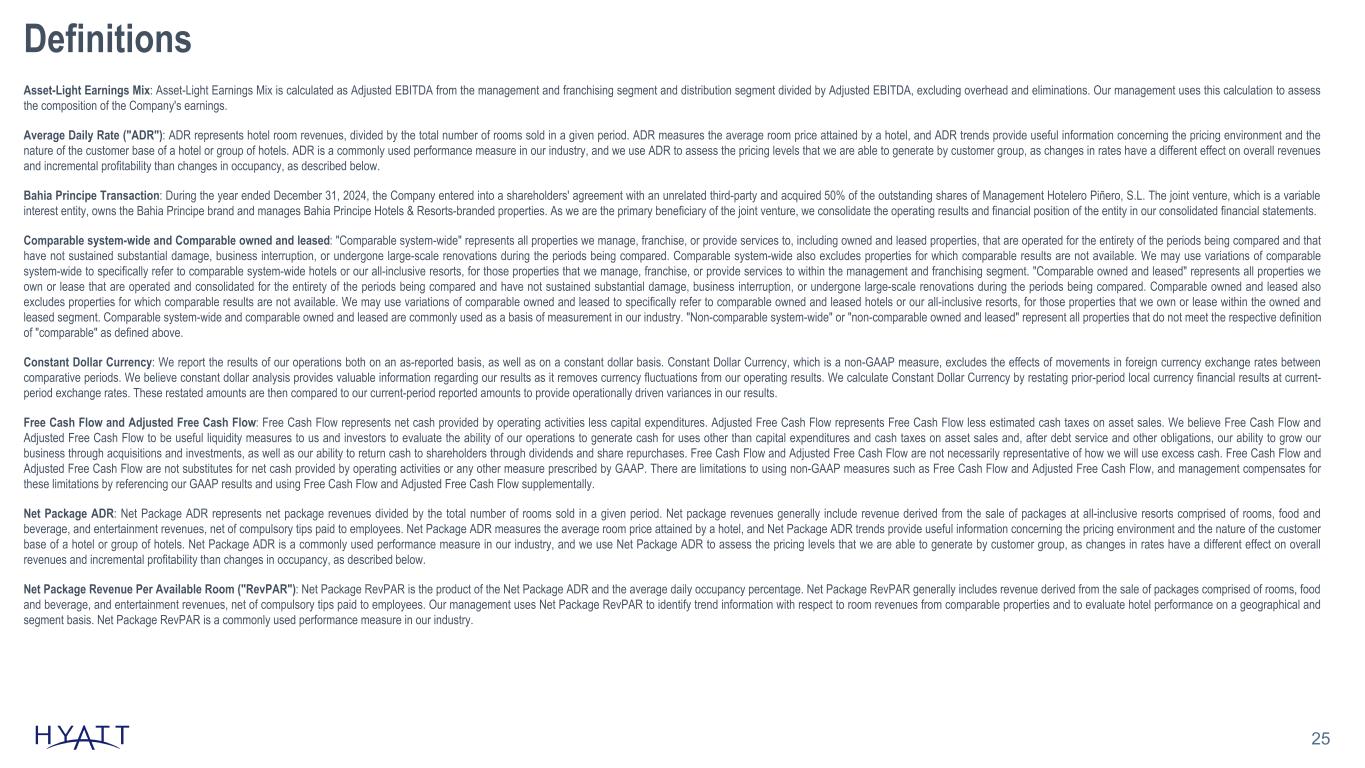
25 Definitions Asset-Light Earnings Mix: Asset-Light Earnings Mix is calculated as Adjusted EBITDA from the management and franchising segment and distribution segment divided by Adjusted EBITDA, excluding overhead and eliminations. Our management uses this calculation to assess the composition of the Company's earnings. Average Daily Rate ("ADR"): ADR represents hotel room revenues, divided by the total number of rooms sold in a given period. ADR measures the average room price attained by a hotel, and ADR trends provide useful information concerning the pricing environment and the nature of the customer base of a hotel or group of hotels. ADR is a commonly used performance measure in our industry, and we use ADR to assess the pricing levels that we are able to generate by customer group, as changes in rates have a different effect on overall revenues and incremental profitability than changes in occupancy, as described below. Bahia Principe Transaction: During the year ended December 31, 2024, the Company entered into a shareholders' agreement with an unrelated third-party and acquired 50% of the outstanding shares of Management Hotelero Piñero, S.L. The joint venture, which is a variable interest entity, owns the Bahia Principe brand and manages Bahia Principe Hotels & Resorts-branded properties. As we are the primary beneficiary of the joint venture, we consolidate the operating results and financial position of the entity in our consolidated financial statements. Comparable system-wide and Comparable owned and leased: "Comparable system-wide" represents all properties we manage, franchise, or provide services to, including owned and leased properties, that are operated for the entirety of the periods being compared and that have not sustained substantial damage, business interruption, or undergone large-scale renovations during the periods being compared. Comparable system-wide also excludes properties for which comparable results are not available. We may use variations of comparable system-wide to specifically refer to comparable system-wide hotels or our all-inclusive resorts, for those properties that we manage, franchise, or provide services to within the management and franchising segment. "Comparable owned and leased" represents all properties we own or lease that are operated and consolidated for the entirety of the periods being compared and have not sustained substantial damage, business interruption, or undergone large-scale renovations during the periods being compared. Comparable owned and leased also excludes properties for which comparable results are not available. We may use variations of comparable owned and leased to specifically refer to comparable owned and leased hotels or our all-inclusive resorts, for those properties that we own or lease within the owned and leased segment. Comparable system-wide and comparable owned and leased are commonly used as a basis of measurement in our industry. "Non-comparable system-wide" or "non-comparable owned and leased" represent all properties that do not meet the respective definition of "comparable" as defined above. Constant Dollar Currency: We report the results of our operations both on an as-reported basis, as well as on a constant dollar basis. Constant Dollar Currency, which is a non-GAAP measure, excludes the effects of movements in foreign currency exchange rates between comparative periods. We believe constant dollar analysis provides valuable information regarding our results as it removes currency fluctuations from our operating results. We calculate Constant Dollar Currency by restating prior-period local currency financial results at current- period exchange rates. These restated amounts are then compared to our current-period reported amounts to provide operationally driven variances in our results. Free Cash Flow and Adjusted Free Cash Flow: Free Cash Flow represents net cash provided by operating activities less capital expenditures. Adjusted Free Cash Flow represents Free Cash Flow less estimated cash taxes on asset sales. We believe Free Cash Flow and Adjusted Free Cash Flow to be useful liquidity measures to us and investors to evaluate the ability of our operations to generate cash for uses other than capital expenditures and cash taxes on asset sales and, after debt service and other obligations, our ability to grow our business through acquisitions and investments, as well as our ability to return cash to shareholders through dividends and share repurchases. Free Cash Flow and Adjusted Free Cash Flow are not necessarily representative of how we will use excess cash. Free Cash Flow and Adjusted Free Cash Flow are not substitutes for net cash provided by operating activities or any other measure prescribed by GAAP. There are limitations to using non-GAAP measures such as Free Cash Flow and Adjusted Free Cash Flow, and management compensates for these limitations by referencing our GAAP results and using Free Cash Flow and Adjusted Free Cash Flow supplementally. Net Package ADR: Net Package ADR represents net package revenues divided by the total number of rooms sold in a given period. Net package revenues generally include revenue derived from the sale of packages at all-inclusive resorts comprised of rooms, food and beverage, and entertainment revenues, net of compulsory tips paid to employees. Net Package ADR measures the average room price attained by a hotel, and Net Package ADR trends provide useful information concerning the pricing environment and the nature of the customer base of a hotel or group of hotels. Net Package ADR is a commonly used performance measure in our industry, and we use Net Package ADR to assess the pricing levels that we are able to generate by customer group, as changes in rates have a different effect on overall revenues and incremental profitability than changes in occupancy, as described below. Net Package Revenue Per Available Room ("RevPAR"): Net Package RevPAR is the product of the Net Package ADR and the average daily occupancy percentage. Net Package RevPAR generally includes revenue derived from the sale of packages comprised of rooms, food and beverage, and entertainment revenues, net of compulsory tips paid to employees. Our management uses Net Package RevPAR to identify trend information with respect to room revenues from comparable properties and to evaluate hotel performance on a geographical and segment basis. Net Package RevPAR is a commonly used performance measure in our industry.
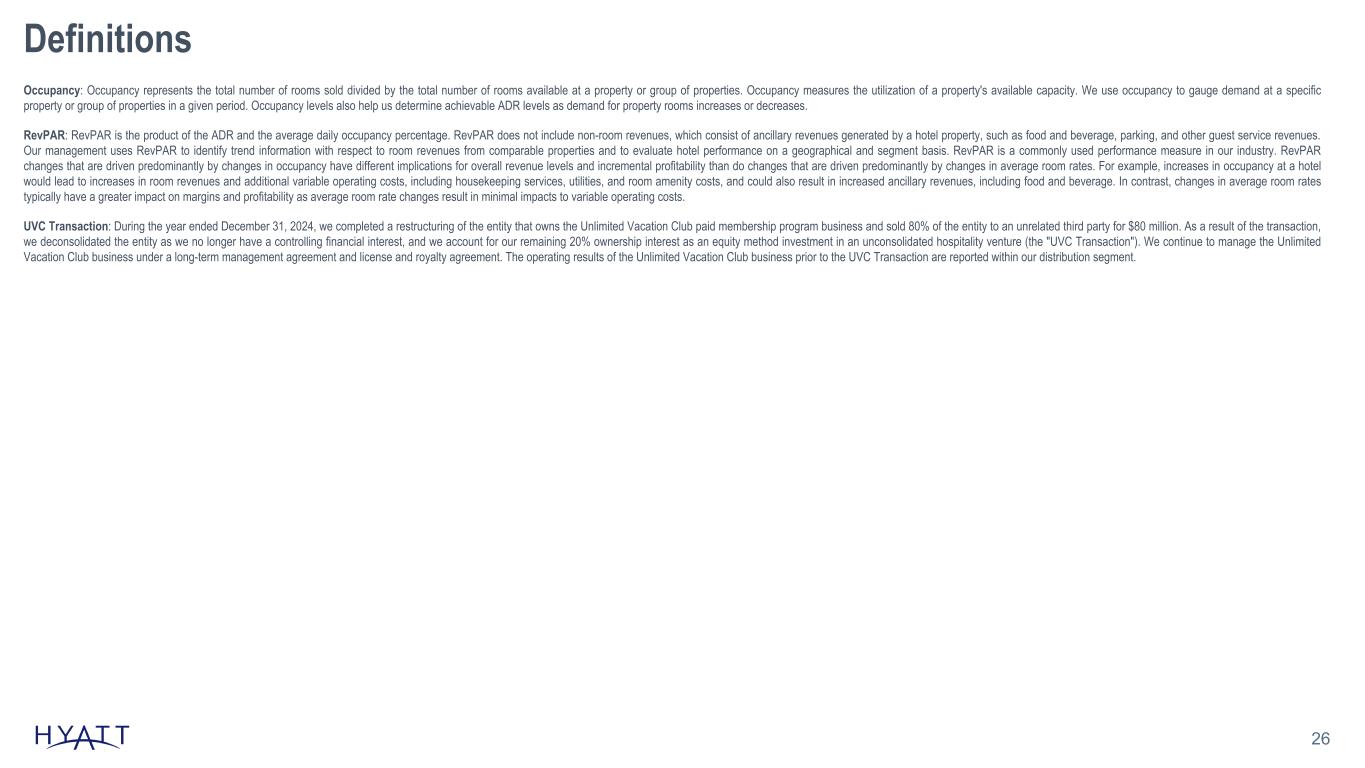
26 Definitions Occupancy: Occupancy represents the total number of rooms sold divided by the total number of rooms available at a property or group of properties. Occupancy measures the utilization of a property's available capacity. We use occupancy to gauge demand at a specific property or group of properties in a given period. Occupancy levels also help us determine achievable ADR levels as demand for property rooms increases or decreases. RevPAR: RevPAR is the product of the ADR and the average daily occupancy percentage. RevPAR does not include non-room revenues, which consist of ancillary revenues generated by a hotel property, such as food and beverage, parking, and other guest service revenues. Our management uses RevPAR to identify trend information with respect to room revenues from comparable properties and to evaluate hotel performance on a geographical and segment basis. RevPAR is a commonly used performance measure in our industry. RevPAR changes that are driven predominantly by changes in occupancy have different implications for overall revenue levels and incremental profitability than do changes that are driven predominantly by changes in average room rates. For example, increases in occupancy at a hotel would lead to increases in room revenues and additional variable operating costs, including housekeeping services, utilities, and room amenity costs, and could also result in increased ancillary revenues, including food and beverage. In contrast, changes in average room rates typically have a greater impact on margins and profitability as average room rate changes result in minimal impacts to variable operating costs. UVC Transaction: During the year ended December 31, 2024, we completed a restructuring of the entity that owns the Unlimited Vacation Club paid membership program business and sold 80% of the entity to an unrelated third party for $80 million. As a result of the transaction, we deconsolidated the entity as we no longer have a controlling financial interest, and we account for our remaining 20% ownership interest as an equity method investment in an unconsolidated hospitality venture (the "UVC Transaction"). We continue to manage the Unlimited Vacation Club business under a long-term management agreement and license and royalty agreement. The operating results of the Unlimited Vacation Club business prior to the UVC Transaction are reported within our distribution segment.
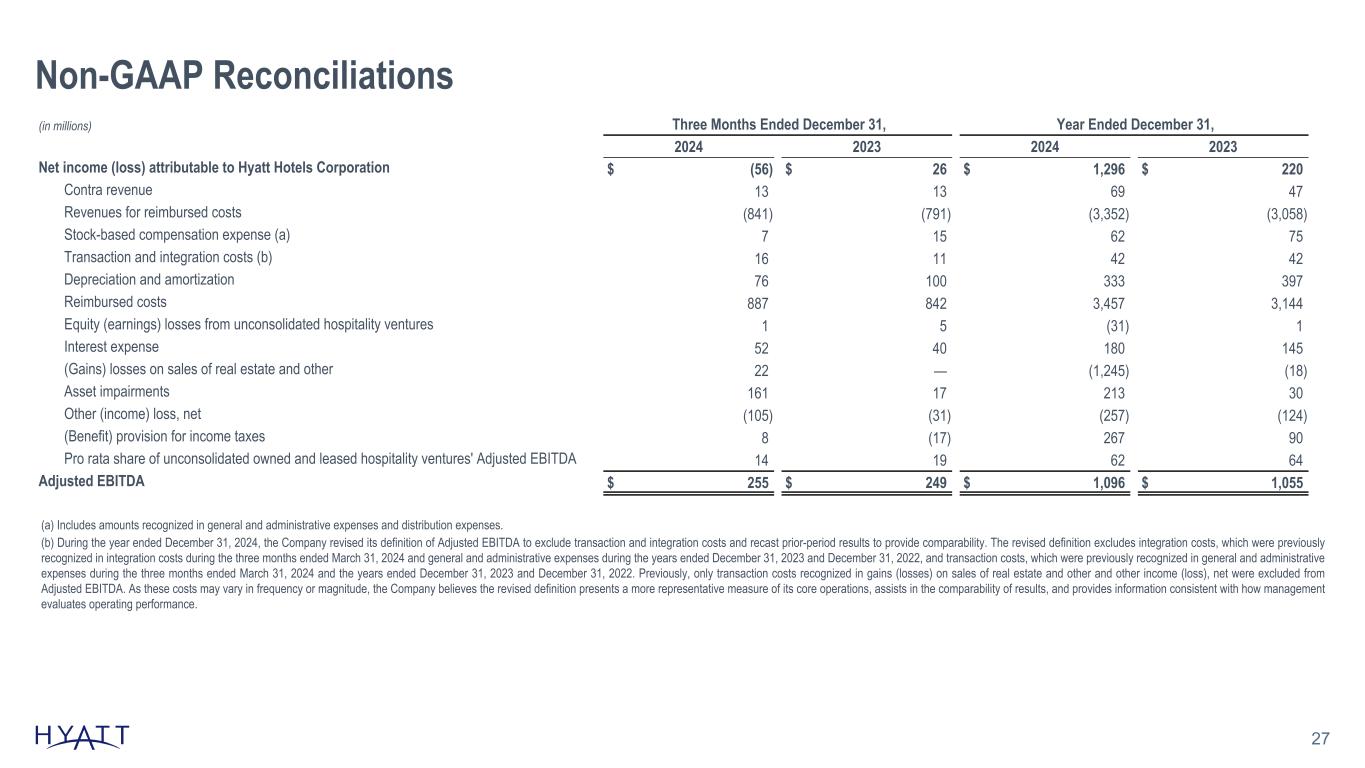
Non-GAAP Reconciliations 27 (in millions) Three Months Ended December 31, Year Ended December 31, 2024 2023 2024 2023 Net income (loss) attributable to Hyatt Hotels Corporation $ (56) $ 26 $ 1,296 $ 220 Contra revenue 13 13 69 47 Revenues for reimbursed costs (841) (791) (3,352) (3,058) Stock-based compensation expense (a) 7 15 62 75 Transaction and integration costs (b) 16 11 42 42 Depreciation and amortization 76 100 333 397 Reimbursed costs 887 842 3,457 3,144 Equity (earnings) losses from unconsolidated hospitality ventures 1 5 (31) 1 Interest expense 52 40 180 145 (Gains) losses on sales of real estate and other 22 — (1,245) (18) Asset impairments 161 17 213 30 Other (income) loss, net (105) (31) (257) (124) (Benefit) provision for income taxes 8 (17) 267 90 Pro rata share of unconsolidated owned and leased hospitality ventures' Adjusted EBITDA 14 19 62 64 Adjusted EBITDA $ 255 $ 249 $ 1,096 $ 1,055 Source Notes: linked to ER schedule (a) Includes amounts recognized in general and administrative expenses and distribution expenses. (b) During the year ended December 31, 2024, the Company revised its definition of Adjusted EBITDA to exclude transaction and integration costs and recast prior-period results to provide comparability. The revised definition excludes integration costs, which were previously recognized in integration costs during the three months ended March 31, 2024 and general and administrative expenses during the years ended December 31, 2023 and December 31, 2022, and transaction costs, which were previously recognized in general and administrative expenses during the three months ended March 31, 2024 and the years ended December 31, 2023 and December 31, 2022. Previously, only transaction costs recognized in gains (losses) on sales of real estate and other and other income (loss), net were excluded from Adjusted EBITDA. As these costs may vary in frequency or magnitude, the Company believes the revised definition presents a more representative measure of its core operations, assists in the comparability of results, and provides information consistent with how management evaluates operating performance.
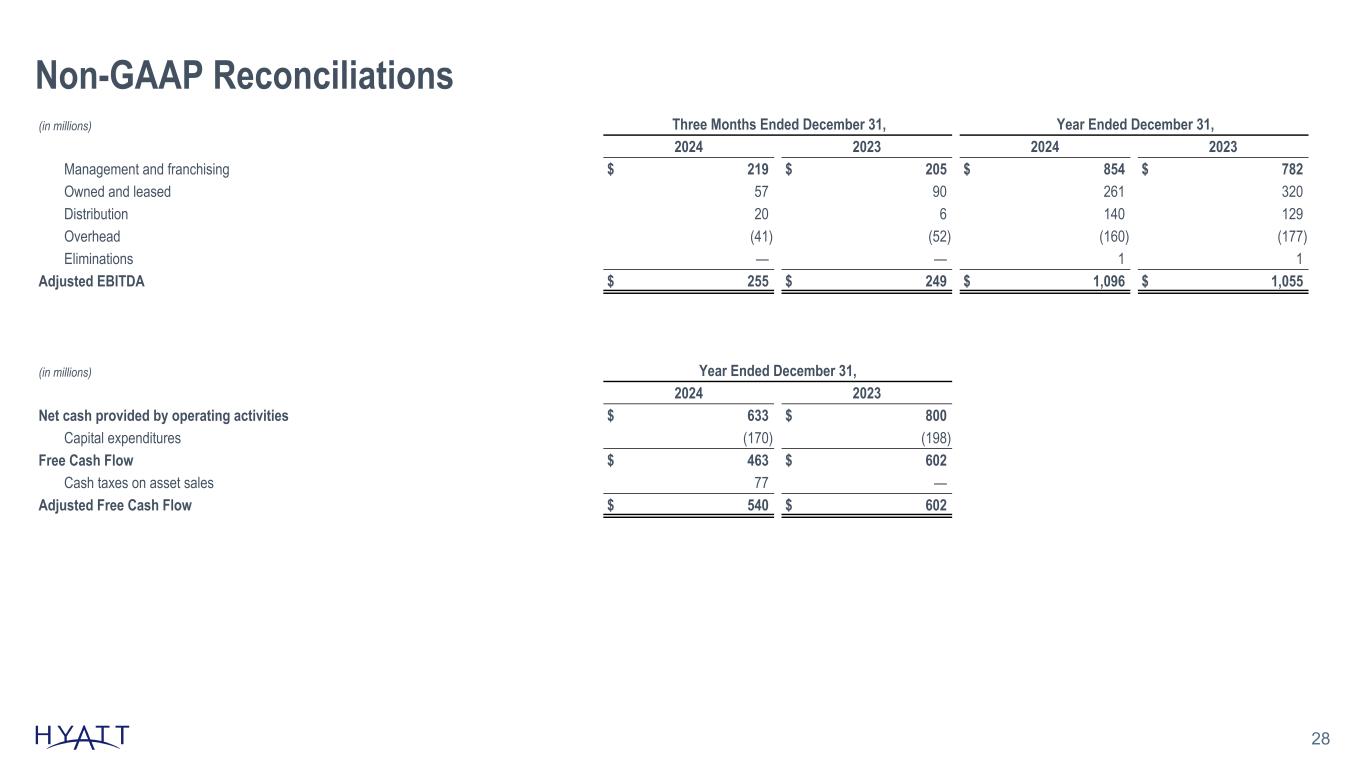
Non-GAAP Reconciliations 28 (in millions) Three Months Ended December 31, Year Ended December 31, 2024 2023 2024 2023 Management and franchising $ 219 $ 205 $ 854 $ 782 Owned and leased 57 90 261 320 Distribution 20 6 140 129 Overhead (41) (52) (160) (177) Eliminations — — 1 1 Adjusted EBITDA $ 255 $ 249 $ 1,096 $ 1,055 (in millions) Year Ended December 31, 2024 2023 Net cash provided by operating activities $ 633 $ 800 Capital expenditures (170) (198) Free Cash Flow $ 463 $ 602 Cash taxes on asset sales 77 — Adjusted Free Cash Flow $ 540 $ 602 Source Notes: linked to ER schedule
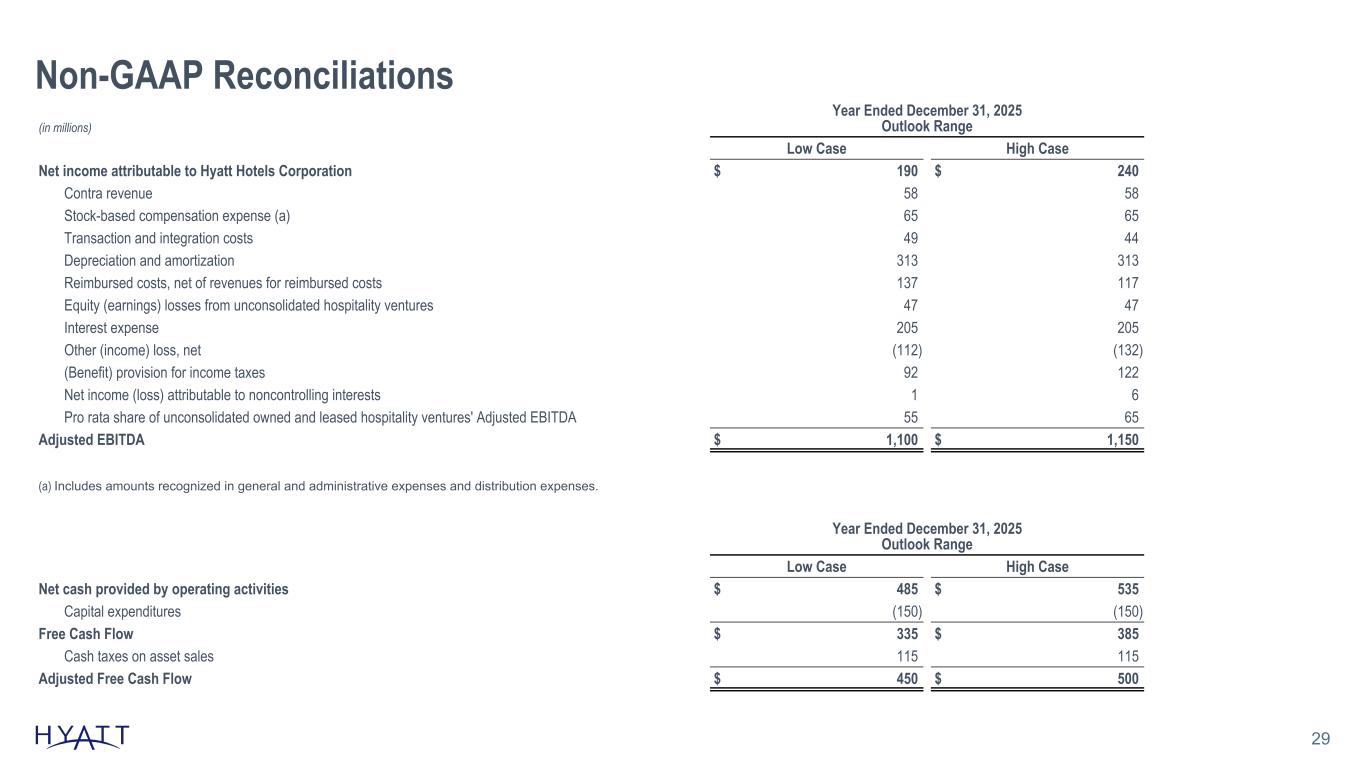
Non-GAAP Reconciliations 29 (in millions) Year Ended December 31, 2025 Outlook Range Low Case High Case Net income attributable to Hyatt Hotels Corporation $ 190 $ 240 Contra revenue 58 58 Stock-based compensation expense (a) 65 65 Transaction and integration costs 49 44 Depreciation and amortization 313 313 Reimbursed costs, net of revenues for reimbursed costs 137 117 Equity (earnings) losses from unconsolidated hospitality ventures 47 47 Interest expense 205 205 Other (income) loss, net (112) (132) (Benefit) provision for income taxes 92 122 Net income (loss) attributable to noncontrolling interests 1 6 Pro rata share of unconsolidated owned and leased hospitality ventures' Adjusted EBITDA 55 65 Adjusted EBITDA $ 1,100 $ 1,150 (a) Includes amounts recognized in general and administrative expenses and distribution expenses. Year Ended December 31, 2025 Outlook Range Low Case High Case Net cash provided by operating activities $ 485 $ 535 Capital expenditures (150) (150) Free Cash Flow $ 335 $ 385 Cash taxes on asset sales 115 115 Adjusted Free Cash Flow $ 450 $ 500 Source Notes: linked to ER schedule

30


